Southmont, NC Map & Demographics
Southmont Map
Southmont Overview
$36,397
PER CAPITA INCOME
$84,347
AVG FAMILY INCOME
$49,000
AVG HOUSEHOLD INCOME
41.0%
WAGE / INCOME GAP [ % ]
59.0¢/ $1
WAGE / INCOME GAP [ $ ]
0.46
INEQUALITY / GINI INDEX
1,392
TOTAL POPULATION
553
MALE POPULATION
839
FEMALE POPULATION
65.91
MALES / 100 FEMALES
151.72
FEMALES / 100 MALES
50.7
MEDIAN AGE
2.5
AVG FAMILY SIZE
1.8
AVG HOUSEHOLD SIZE
532
LABOR FORCE [ PEOPLE ]
45.2%
PERCENT IN LABOR FORCE
Southmont Zip Codes
Southmont Area Codes
Income in Southmont
Income Overview in Southmont
Per Capita Income in Southmont is $36,397, while median incomes of families and households are $84,347 and $49,000 respectively.
| Characteristic | Number | Measure |
| Per Capita Income | 1,392 | $36,397 |
| Median Family Income | 395 | $84,347 |
| Mean Family Income | 395 | $94,437 |
| Median Household Income | 788 | $49,000 |
| Mean Household Income | 788 | $64,806 |
| Income Deficit | 395 | $0 |
| Wage / Income Gap (%) | 1,392 | 41.00% |
| Wage / Income Gap ($) | 1,392 | 59.00¢ per $1 |
| Gini / Inequality Index | 1,392 | 0.46 |
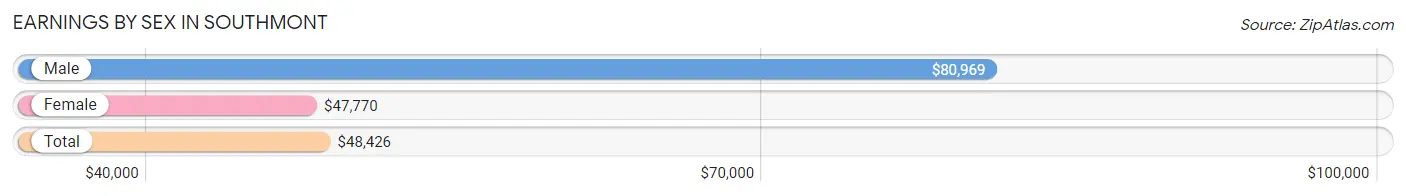
Earnings by Sex in Southmont
Average Earnings in Southmont are $48,426, $80,969 for men and $47,770 for women, a difference of 41.0%.
| Sex | Number | Average Earnings |
| Male | 269 (46.3%) | $80,969 |
| Female | 312 (53.7%) | $47,770 |
| Total | 581 (100.0%) | $48,426 |
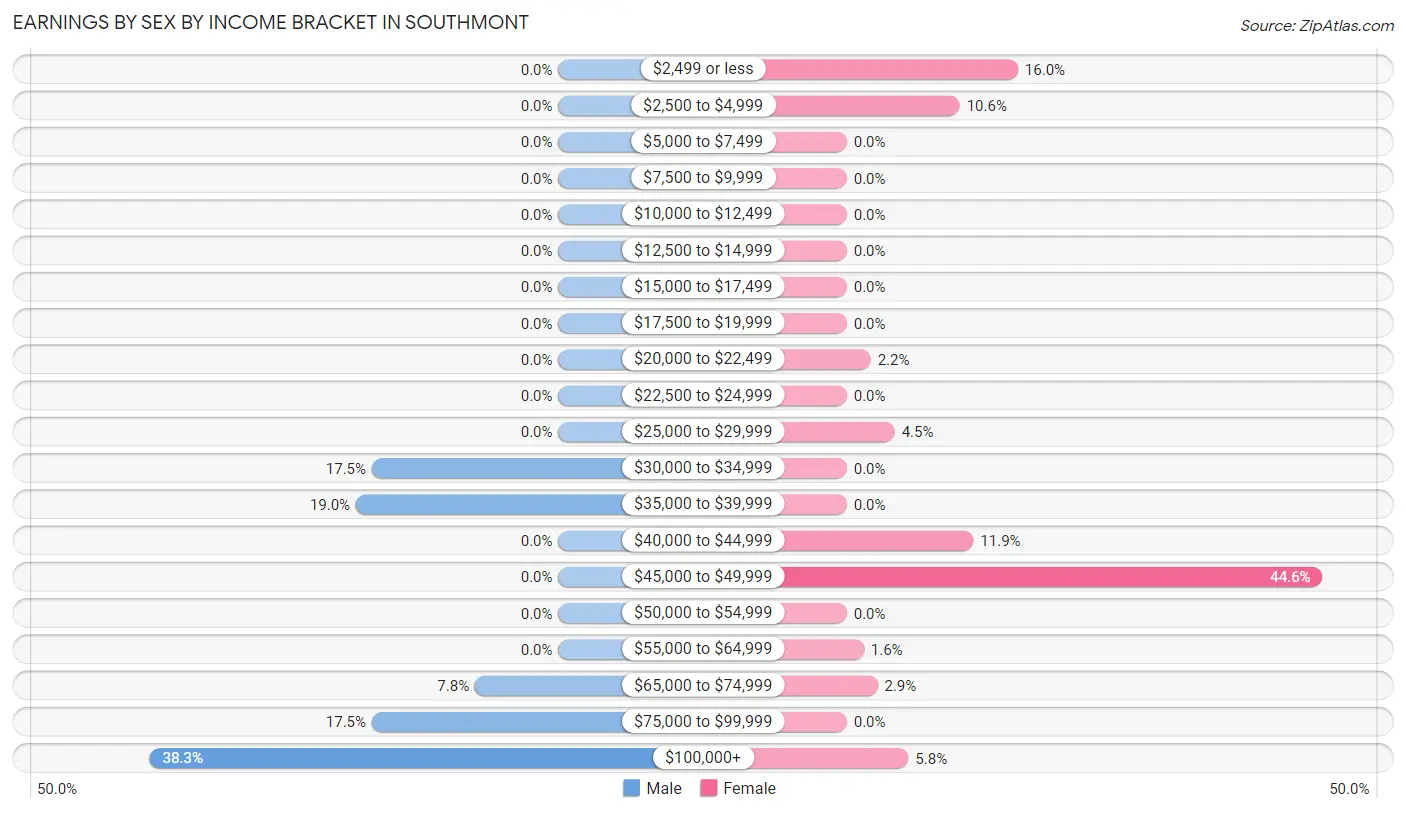
Earnings by Sex by Income Bracket in Southmont
The most common earnings brackets in Southmont are $100,000+ for men (103 | 38.3%) and $45,000 to $49,999 for women (139 | 44.6%).
| Income | Male | Female |
| $2,499 or less | 0 (0.0%) | 50 (16.0%) |
| $2,500 to $4,999 | 0 (0.0%) | 33 (10.6%) |
| $5,000 to $7,499 | 0 (0.0%) | 0 (0.0%) |
| $7,500 to $9,999 | 0 (0.0%) | 0 (0.0%) |
| $10,000 to $12,499 | 0 (0.0%) | 0 (0.0%) |
| $12,500 to $14,999 | 0 (0.0%) | 0 (0.0%) |
| $15,000 to $17,499 | 0 (0.0%) | 0 (0.0%) |
| $17,500 to $19,999 | 0 (0.0%) | 0 (0.0%) |
| $20,000 to $22,499 | 0 (0.0%) | 7 (2.2%) |
| $22,500 to $24,999 | 0 (0.0%) | 0 (0.0%) |
| $25,000 to $29,999 | 0 (0.0%) | 14 (4.5%) |
| $30,000 to $34,999 | 47 (17.5%) | 0 (0.0%) |
| $35,000 to $39,999 | 51 (19.0%) | 0 (0.0%) |
| $40,000 to $44,999 | 0 (0.0%) | 37 (11.9%) |
| $45,000 to $49,999 | 0 (0.0%) | 139 (44.6%) |
| $50,000 to $54,999 | 0 (0.0%) | 0 (0.0%) |
| $55,000 to $64,999 | 0 (0.0%) | 5 (1.6%) |
| $65,000 to $74,999 | 21 (7.8%) | 9 (2.9%) |
| $75,000 to $99,999 | 47 (17.5%) | 0 (0.0%) |
| $100,000+ | 103 (38.3%) | 18 (5.8%) |
| Total | 269 (100.0%) | 312 (100.0%) |
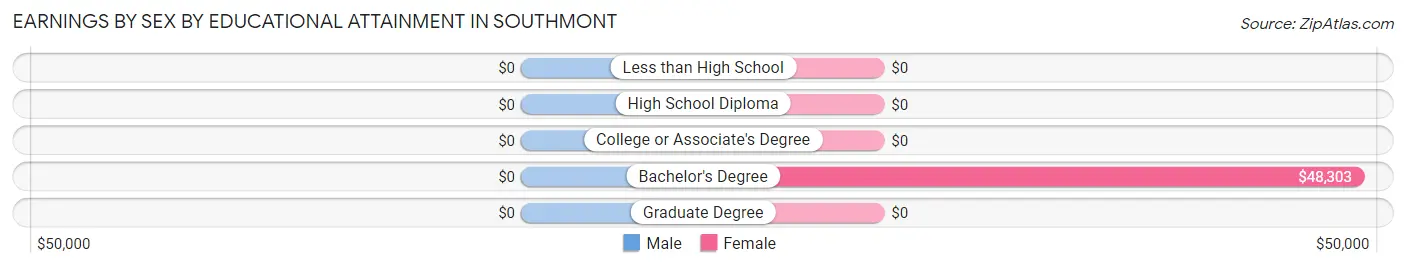
Earnings by Sex by Educational Attainment in Southmont
| Educational Attainment | Male Income | Female Income |
| Less than High School | - | - |
| High School Diploma | - | - |
| College or Associate's Degree | - | - |
| Bachelor's Degree | - | - |
| Graduate Degree | - | - |
| Total | $81,344 | $47,896 |
Family Income in Southmont
Family Income Brackets in Southmont
According to the Southmont family income data, there are 133 families falling into the $100,000 to $149,999 income range, which is the most common income bracket and makes up 33.7% of all families.
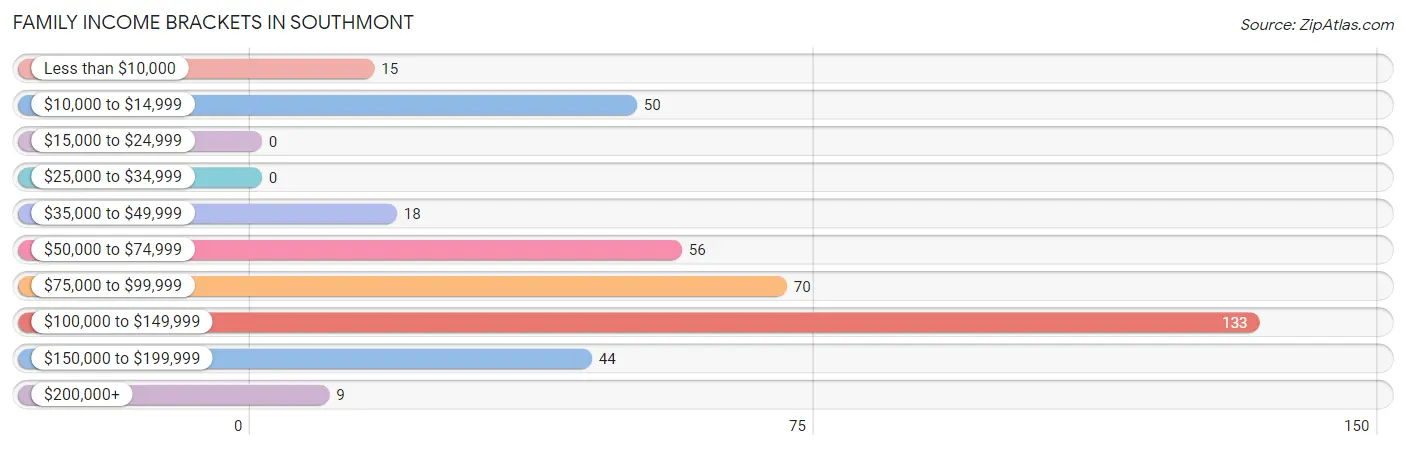
| Income Bracket | # Families | % Families |
| Less than $10,000 | 15 | 3.8% |
| $10,000 to $14,999 | 50 | 12.7% |
| $15,000 to $24,999 | 0 | 0.0% |
| $25,000 to $34,999 | 0 | 0.0% |
| $35,000 to $49,999 | 18 | 4.6% |
| $50,000 to $74,999 | 56 | 14.2% |
| $75,000 to $99,999 | 70 | 17.7% |
| $100,000 to $149,999 | 133 | 33.7% |
| $150,000 to $199,999 | 44 | 11.1% |
| $200,000+ | 9 | 2.3% |
Family Income by Famaliy Size in Southmont
3-person families (112 | 28.3%) account for the highest median family income in Southmont with $84,205 per family, while 2-person families (233 | 59.0%) have the highest median income of $29,747 per family member.
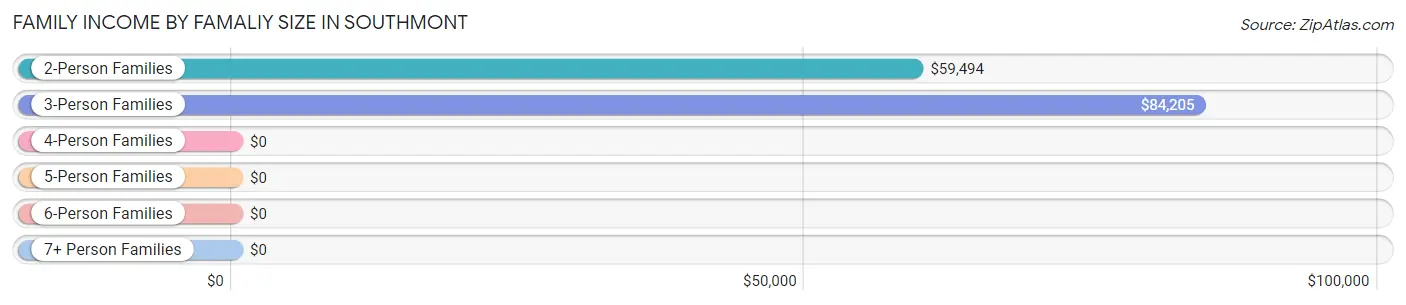
| Income Bracket | # Families | Median Income |
| 2-Person Families | 233 (59.0%) | $59,494 |
| 3-Person Families | 112 (28.3%) | $84,205 |
| 4-Person Families | 50 (12.7%) | $0 |
| 5-Person Families | 0 (0.0%) | $0 |
| 6-Person Families | 0 (0.0%) | $0 |
| 7+ Person Families | 0 (0.0%) | $0 |
| Total | 395 (100.0%) | $84,347 |
Family Income by Number of Earners in Southmont
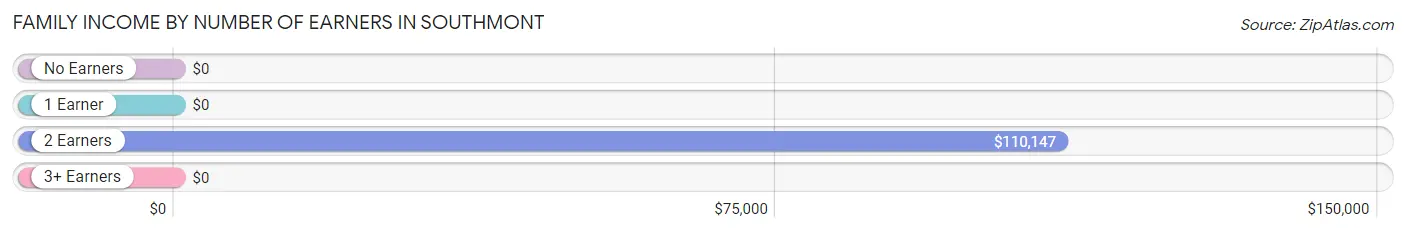
| Number of Earners | # Families | Median Income |
| No Earners | 70 (17.7%) | $0 |
| 1 Earner | 179 (45.3%) | $0 |
| 2 Earners | 146 (37.0%) | $110,147 |
| 3+ Earners | 0 (0.0%) | $0 |
| Total | 395 (100.0%) | $84,347 |
Household Income in Southmont
Household Income Brackets in Southmont
With 167 households falling in the category, the $100,000 to $149,999 income range is the most frequent in Southmont, accounting for 21.2% of all households.
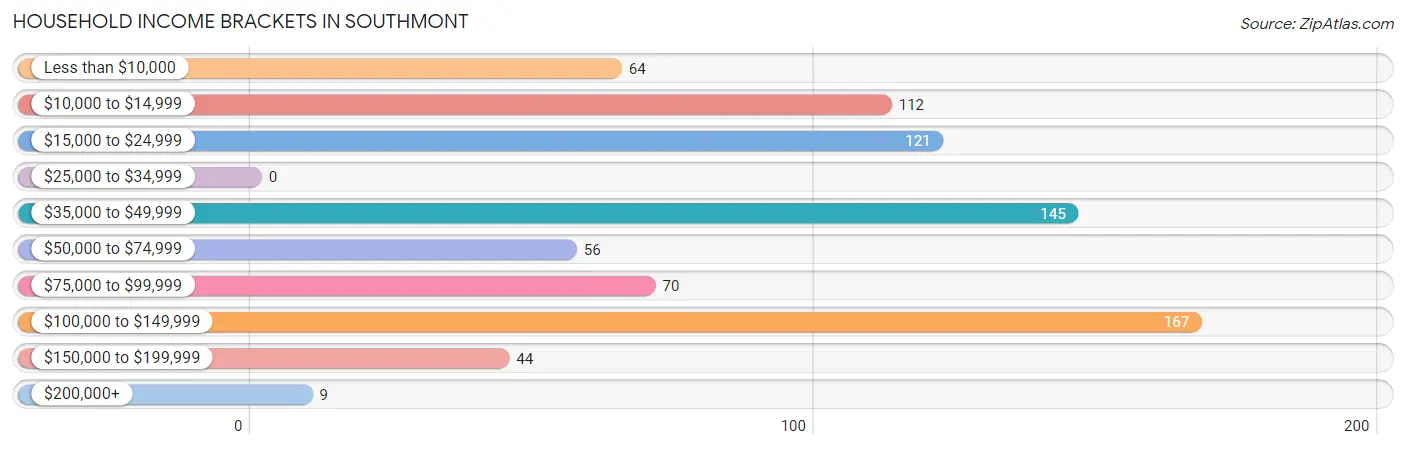
| Income Bracket | # Households | % Households |
| Less than $10,000 | 64 | 8.1% |
| $10,000 to $14,999 | 112 | 14.2% |
| $15,000 to $24,999 | 121 | 15.4% |
| $25,000 to $34,999 | 0 | 0.0% |
| $35,000 to $49,999 | 145 | 18.4% |
| $50,000 to $74,999 | 56 | 7.1% |
| $75,000 to $99,999 | 70 | 8.9% |
| $100,000 to $149,999 | 167 | 21.2% |
| $150,000 to $199,999 | 44 | 5.6% |
| $200,000+ | 9 | 1.1% |
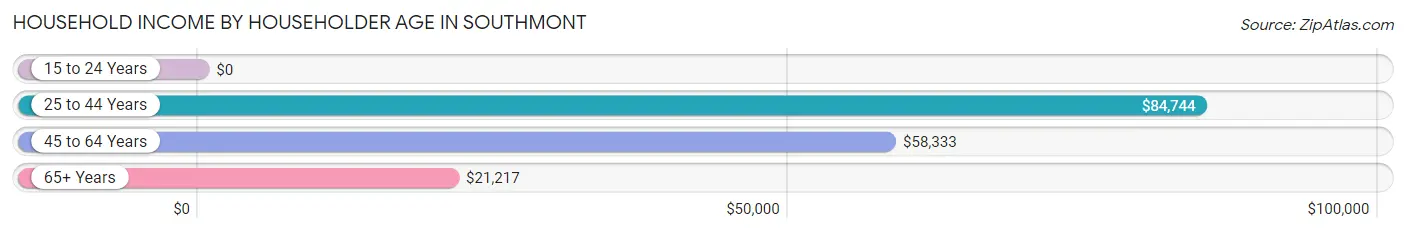
Household Income by Householder Age in Southmont
The median household income in Southmont is $49,000, with the highest median household income of $84,744 found in the 25 to 44 years age bracket for the primary householder. A total of 179 households (22.7%) fall into this category. Meanwhile, the 15 to 24 years age bracket for the primary householder has the lowest median household income of $0, with 14 households (1.8%) in this group.
| Income Bracket | # Households | Median Income |
| 15 to 24 Years | 14 (1.8%) | $0 |
| 25 to 44 Years | 179 (22.7%) | $84,744 |
| 45 to 64 Years | 262 (33.3%) | $58,333 |
| 65+ Years | 333 (42.3%) | $21,217 |
| Total | 788 (100.0%) | $49,000 |
Poverty in Southmont
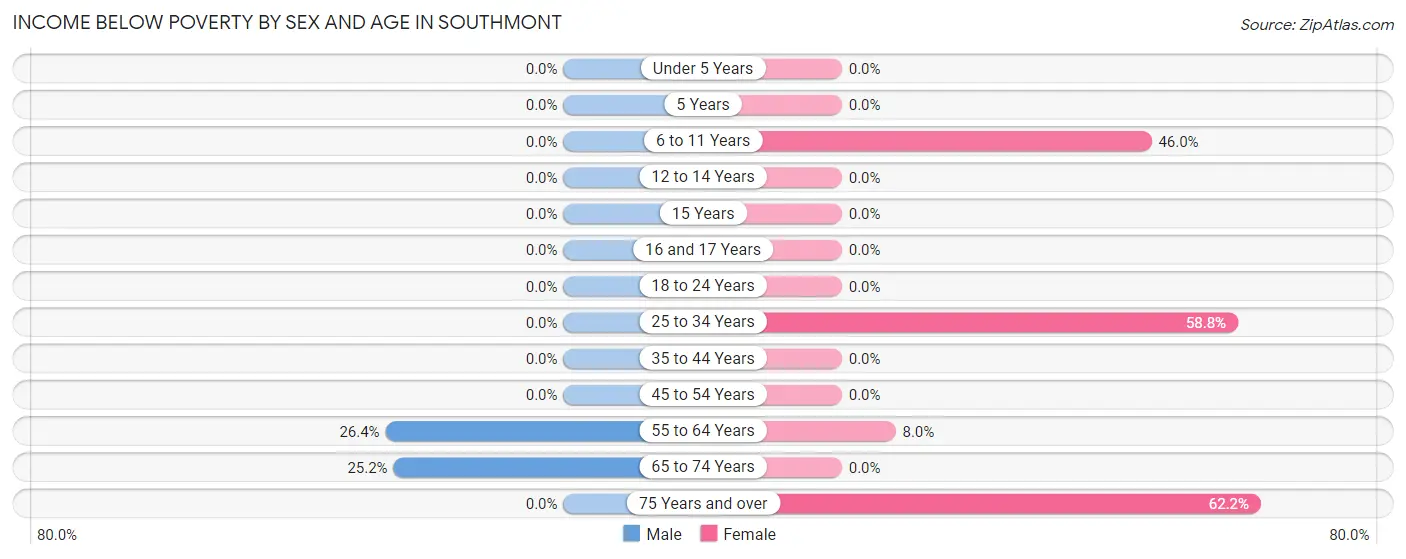
Income Below Poverty by Sex and Age in Southmont
With 7.4% poverty level for males and 22.5% for females among the residents of Southmont, 55 to 64 year old males and 75 year old and over females are the most vulnerable to poverty, with 14 males (26.4%) and 84 females (62.2%) in their respective age groups living below the poverty level.
| Age Bracket | Male | Female |
| Under 5 Years | 0 (0.0%) | 0 (0.0%) |
| 5 Years | 0 (0.0%) | 0 (0.0%) |
| 6 to 11 Years | 0 (0.0%) | 40 (46.0%) |
| 12 to 14 Years | 0 (0.0%) | 0 (0.0%) |
| 15 Years | 0 (0.0%) | 0 (0.0%) |
| 16 and 17 Years | 0 (0.0%) | 0 (0.0%) |
| 18 to 24 Years | 0 (0.0%) | 0 (0.0%) |
| 25 to 34 Years | 0 (0.0%) | 50 (58.8%) |
| 35 to 44 Years | 0 (0.0%) | 0 (0.0%) |
| 45 to 54 Years | 0 (0.0%) | 0 (0.0%) |
| 55 to 64 Years | 14 (26.4%) | 15 (8.0%) |
| 65 to 74 Years | 27 (25.2%) | 0 (0.0%) |
| 75 Years and over | 0 (0.0%) | 84 (62.2%) |
| Total | 41 (7.4%) | 189 (22.5%) |
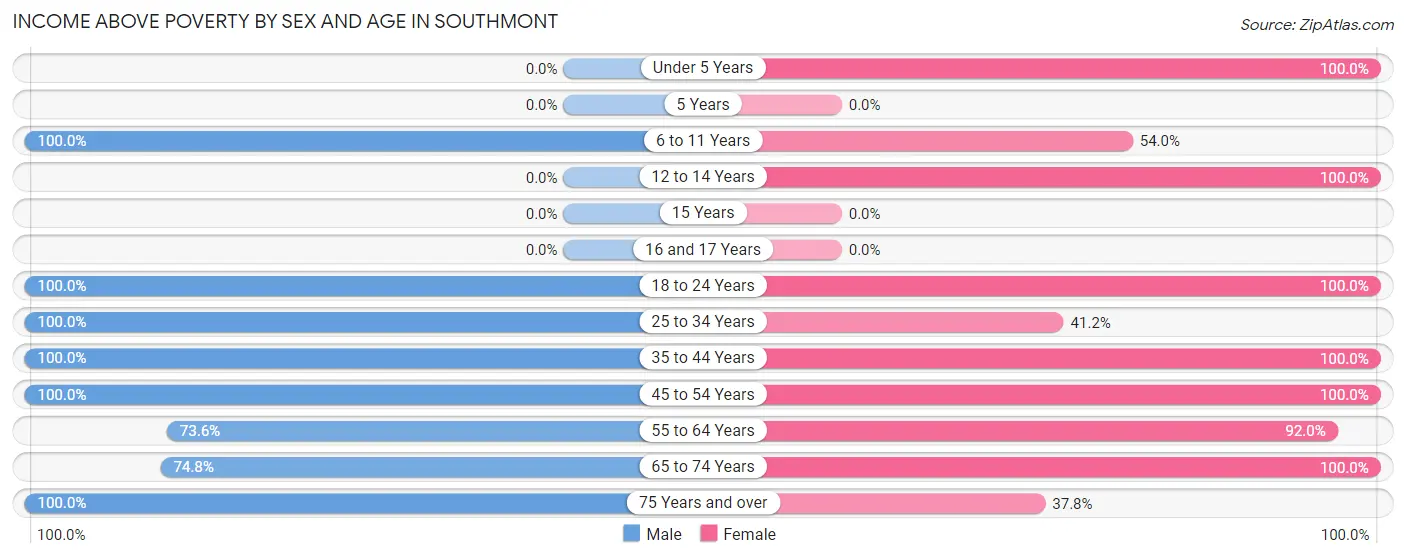
Income Above Poverty by Sex and Age in Southmont
According to the poverty statistics in Southmont, males aged 6 to 11 years and females aged under 5 years are the age groups that are most secure financially, with 100.0% of males and 100.0% of females in these age groups living above the poverty line.
| Age Bracket | Male | Female |
| Under 5 Years | 0 (0.0%) | 43 (100.0%) |
| 5 Years | 0 (0.0%) | 0 (0.0%) |
| 6 to 11 Years | 30 (100.0%) | 47 (54.0%) |
| 12 to 14 Years | 0 (0.0%) | 56 (100.0%) |
| 15 Years | 0 (0.0%) | 0 (0.0%) |
| 16 and 17 Years | 0 (0.0%) | 0 (0.0%) |
| 18 to 24 Years | 76 (100.0%) | 23 (100.0%) |
| 25 to 34 Years | 63 (100.0%) | 35 (41.2%) |
| 35 to 44 Years | 90 (100.0%) | 93 (100.0%) |
| 45 to 54 Years | 41 (100.0%) | 78 (100.0%) |
| 55 to 64 Years | 39 (73.6%) | 173 (92.0%) |
| 65 to 74 Years | 80 (74.8%) | 51 (100.0%) |
| 75 Years and over | 93 (100.0%) | 51 (37.8%) |
| Total | 512 (92.6%) | 650 (77.5%) |
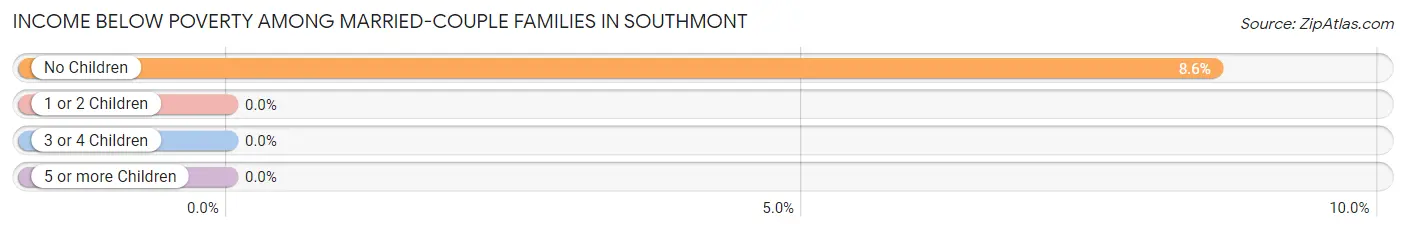
Income Below Poverty Among Married-Couple Families in Southmont
The poverty statistics for married-couple families in Southmont show that 5.3% or 15 of the total 285 families live below the poverty line. Families with no children have the highest poverty rate of 8.6%, comprising of 15 families. On the other hand, families with 1 or 2 children have the lowest poverty rate of 0.0%, which includes 0 families.
| Children | Above Poverty | Below Poverty |
| No Children | 160 (91.4%) | 15 (8.6%) |
| 1 or 2 Children | 110 (100.0%) | 0 (0.0%) |
| 3 or 4 Children | 0 (0.0%) | 0 (0.0%) |
| 5 or more Children | 0 (0.0%) | 0 (0.0%) |
| Total | 270 (94.7%) | 15 (5.3%) |
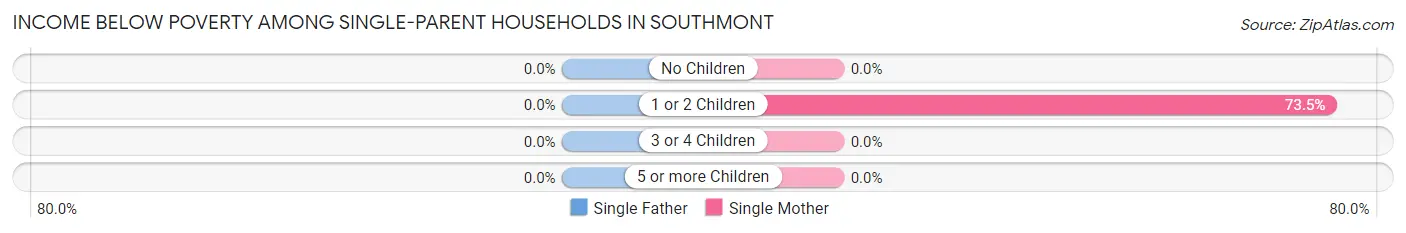
Income Below Poverty Among Single-Parent Households in Southmont
| Children | Single Father | Single Mother |
| No Children | 0 (0.0%) | 0 (0.0%) |
| 1 or 2 Children | 0 (0.0%) | 50 (73.5%) |
| 3 or 4 Children | 0 (0.0%) | 0 (0.0%) |
| 5 or more Children | 0 (0.0%) | 0 (0.0%) |
| Total | 0 (0.0%) | 50 (45.5%) |
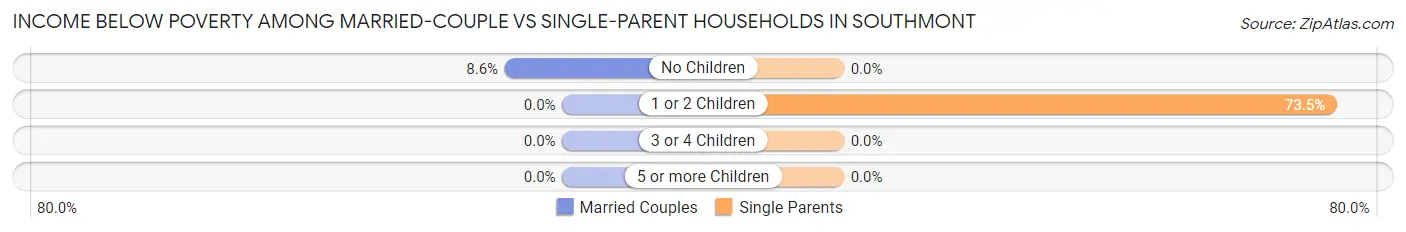
Income Below Poverty Among Married-Couple vs Single-Parent Households in Southmont
The poverty data for Southmont shows that 15 of the married-couple family households (5.3%) and 50 of the single-parent households (45.5%) are living below the poverty level. Within the married-couple family households, those with no children have the highest poverty rate, with 15 households (8.6%) falling below the poverty line. Among the single-parent households, those with 1 or 2 children have the highest poverty rate, with 50 household (73.5%) living below poverty.
| Children | Married-Couple Families | Single-Parent Households |
| No Children | 15 (8.6%) | 0 (0.0%) |
| 1 or 2 Children | 0 (0.0%) | 50 (73.5%) |
| 3 or 4 Children | 0 (0.0%) | 0 (0.0%) |
| 5 or more Children | 0 (0.0%) | 0 (0.0%) |
| Total | 15 (5.3%) | 50 (45.5%) |
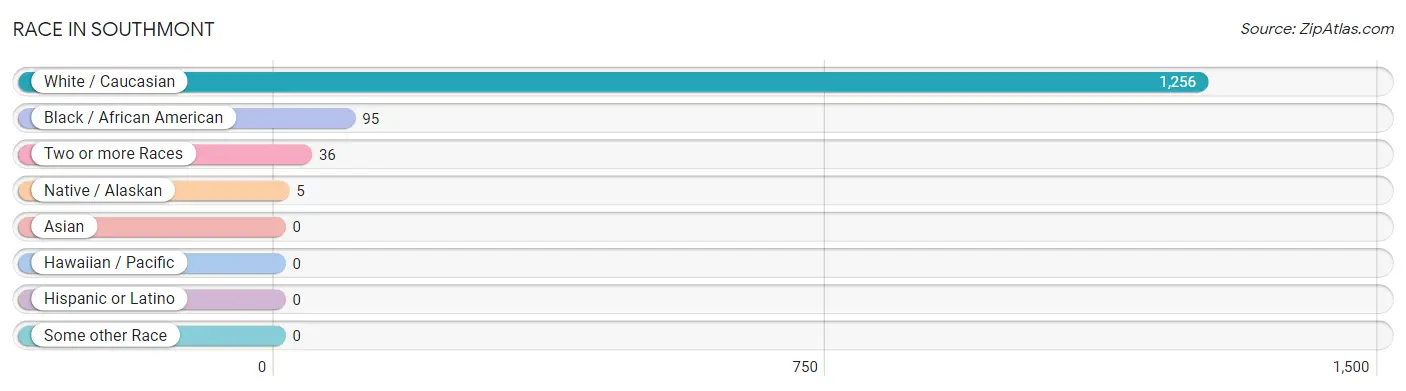
Race in Southmont
The most populous races in Southmont are White / Caucasian (1,256 | 90.2%), Black / African American (95 | 6.8%), and Two or more Races (36 | 2.6%).
| Race | # Population | % Population |
| Asian | 0 | 0.0% |
| Black / African American | 95 | 6.8% |
| Hawaiian / Pacific | 0 | 0.0% |
| Hispanic or Latino | 0 | 0.0% |
| Native / Alaskan | 5 | 0.4% |
| White / Caucasian | 1,256 | 90.2% |
| Two or more Races | 36 | 2.6% |
| Some other Race | 0 | 0.0% |
| Total | 1,392 | 100.0% |
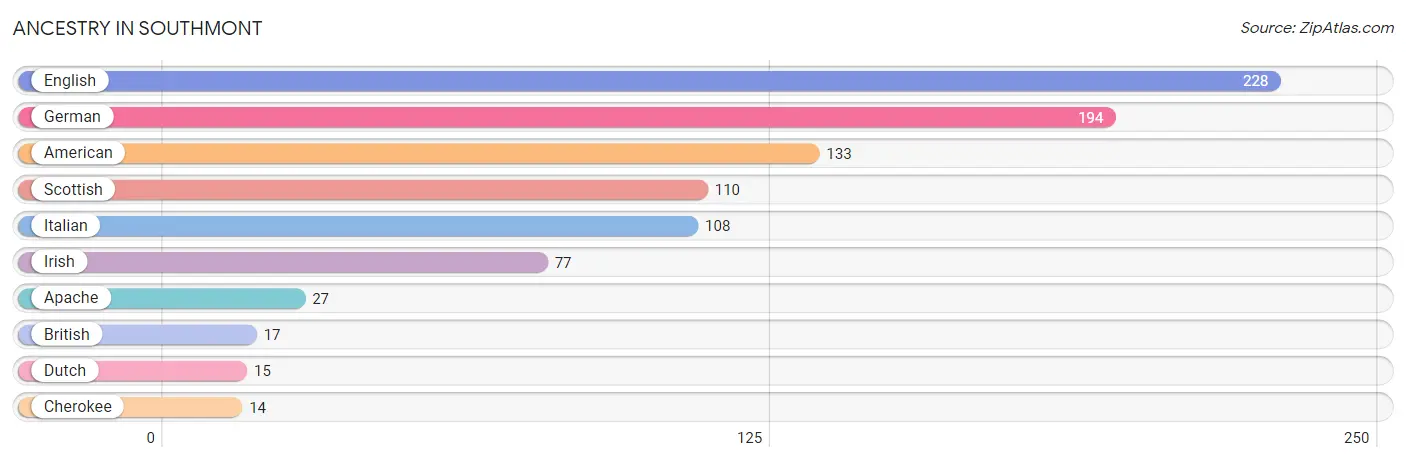
Ancestry in Southmont
The most populous ancestries reported in Southmont are English (228 | 16.4%), German (194 | 13.9%), American (133 | 9.6%), Scottish (110 | 7.9%), and Italian (108 | 7.8%), together accounting for 55.5% of all Southmont residents.
| Ancestry | # Population | % Population |
| American | 133 | 9.6% |
| Apache | 27 | 1.9% |
| British | 17 | 1.2% |
| Cherokee | 14 | 1.0% |
| Dutch | 15 | 1.1% |
| English | 228 | 16.4% |
| German | 194 | 13.9% |
| Irish | 77 | 5.5% |
| Italian | 108 | 7.8% |
| Scottish | 110 | 7.9% | View All 10 Rows |
Immigrants in Southmont
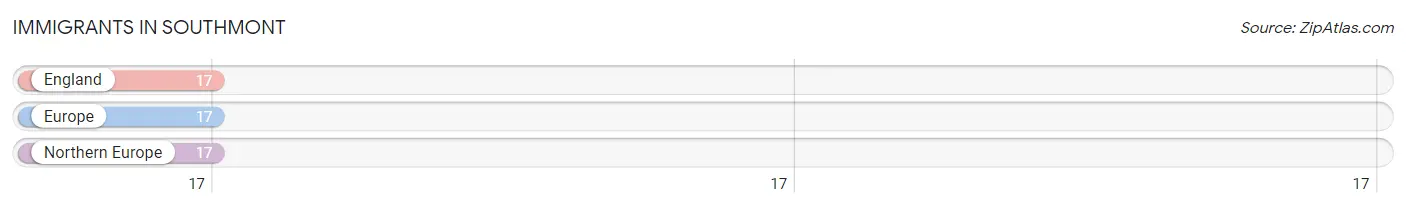
The most numerous immigrant groups reported in Southmont came from England (17 | 1.2%), Europe (17 | 1.2%), and Northern Europe (17 | 1.2%), together accounting for 3.7% of all Southmont residents.
| Immigration Origin | # Population | % Population |
| England | 17 | 1.2% |
| Europe | 17 | 1.2% |
| Northern Europe | 17 | 1.2% | View All 3 Rows |
Sex and Age in Southmont
Sex and Age in Southmont
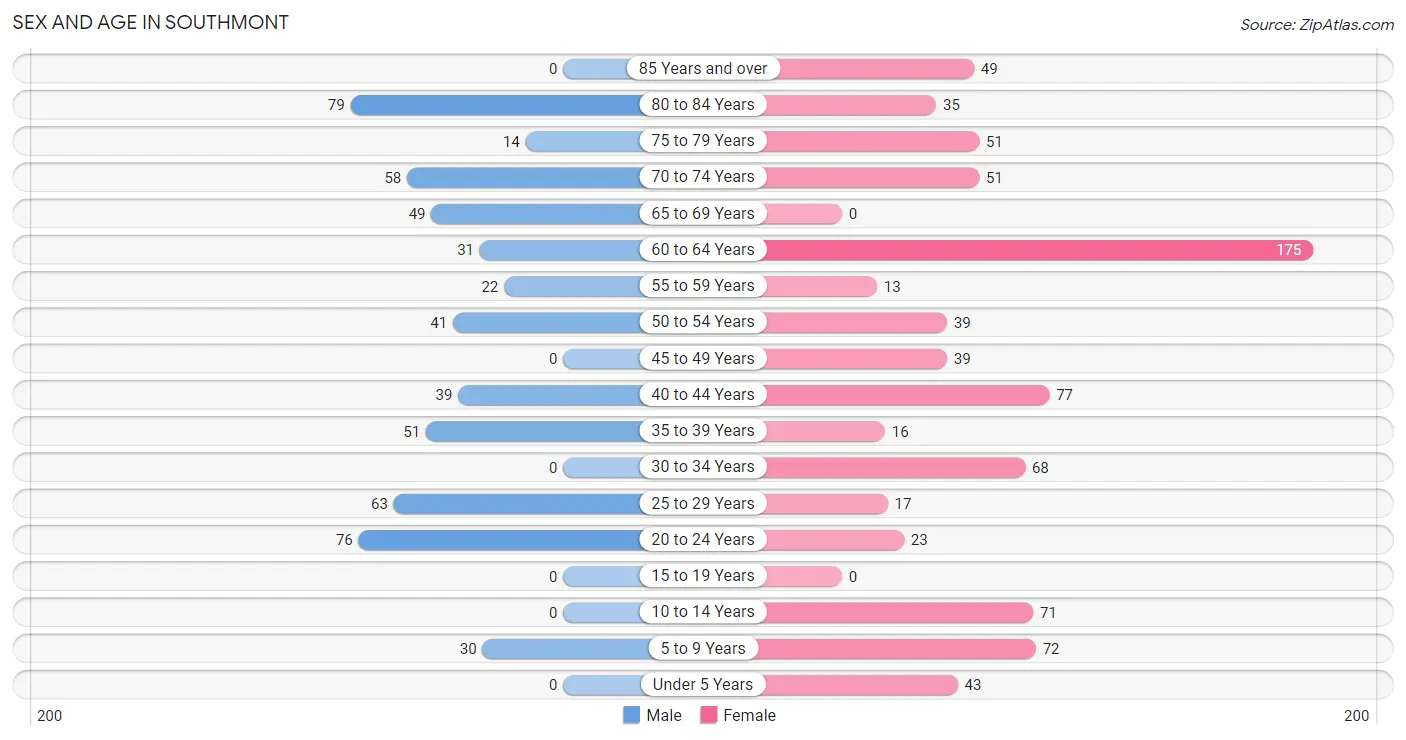
The most populous age groups in Southmont are 80 to 84 Years (79 | 14.3%) for men and 60 to 64 Years (175 | 20.9%) for women.
| Age Bracket | Male | Female |
| Under 5 Years | 0 (0.0%) | 43 (5.1%) |
| 5 to 9 Years | 30 (5.4%) | 72 (8.6%) |
| 10 to 14 Years | 0 (0.0%) | 71 (8.5%) |
| 15 to 19 Years | 0 (0.0%) | 0 (0.0%) |
| 20 to 24 Years | 76 (13.7%) | 23 (2.7%) |
| 25 to 29 Years | 63 (11.4%) | 17 (2.0%) |
| 30 to 34 Years | 0 (0.0%) | 68 (8.1%) |
| 35 to 39 Years | 51 (9.2%) | 16 (1.9%) |
| 40 to 44 Years | 39 (7.0%) | 77 (9.2%) |
| 45 to 49 Years | 0 (0.0%) | 39 (4.6%) |
| 50 to 54 Years | 41 (7.4%) | 39 (4.6%) |
| 55 to 59 Years | 22 (4.0%) | 13 (1.5%) |
| 60 to 64 Years | 31 (5.6%) | 175 (20.9%) |
| 65 to 69 Years | 49 (8.9%) | 0 (0.0%) |
| 70 to 74 Years | 58 (10.5%) | 51 (6.1%) |
| 75 to 79 Years | 14 (2.5%) | 51 (6.1%) |
| 80 to 84 Years | 79 (14.3%) | 35 (4.2%) |
| 85 Years and over | 0 (0.0%) | 49 (5.8%) |
| Total | 553 (100.0%) | 839 (100.0%) |
Families and Households in Southmont
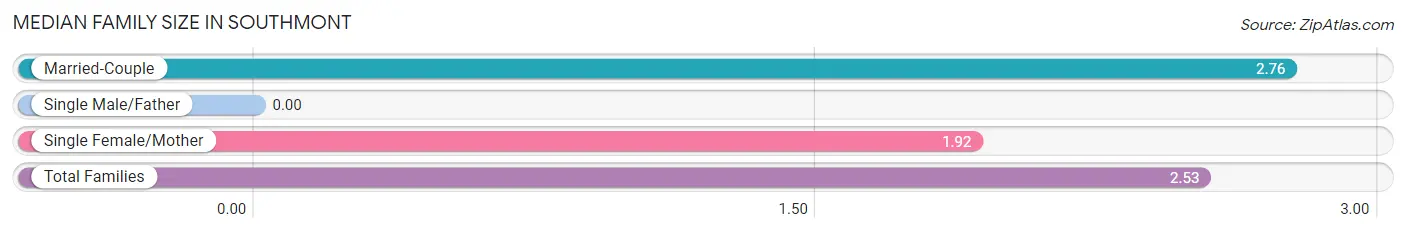
Median Family Size in Southmont
| Family Type | # Families | Family Size |
| Married-Couple | 285 (72.2%) | 2.76 |
| Single Male/Father | 0 (0.0%) | - |
| Single Female/Mother | 110 (27.9%) | 1.92 |
| Total Families | 395 (100.0%) | 2.53 |
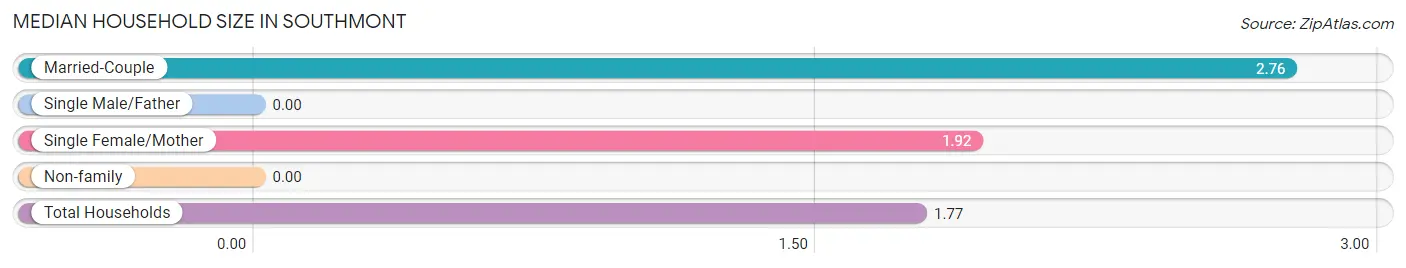
Median Household Size in Southmont
| Household Type | # Households | Household Size |
| Married-Couple | 285 (36.2%) | 2.76 |
| Single Male/Father | 0 (0.0%) | - |
| Single Female/Mother | 110 (14.0%) | 1.92 |
| Non-family | 393 (49.9%) | - |
| Total Households | 788 (100.0%) | 1.77 |
Household Size by Marriage Status in Southmont
Out of a total of 788 households in Southmont, 395 (50.1%) are family households, while 393 (49.9%) are nonfamily households. The most numerous type of family households are 2-person households, comprising 233, and the most common type of nonfamily households are 1-person households, comprising 393.
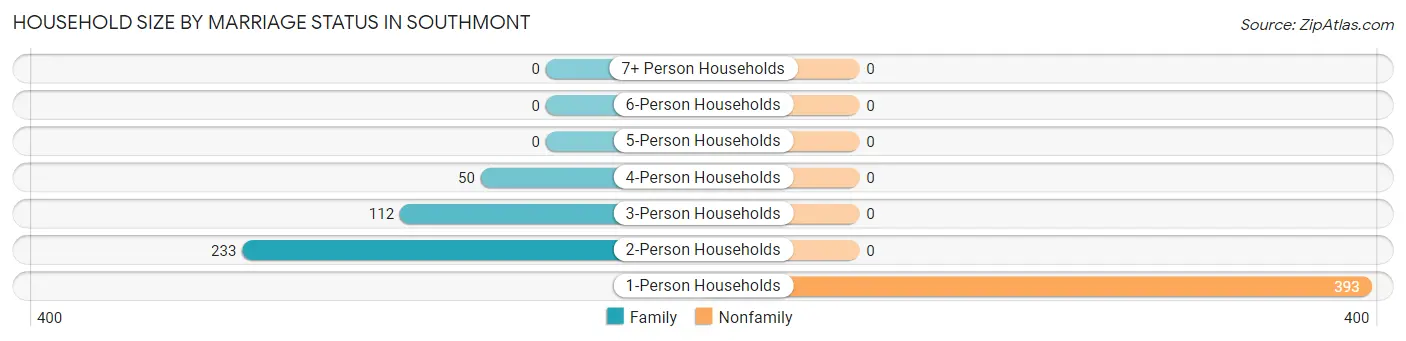
| Household Size | Family Households | Nonfamily Households |
| 1-Person Households | - | 393 (49.9%) |
| 2-Person Households | 233 (29.6%) | 0 (0.0%) |
| 3-Person Households | 112 (14.2%) | 0 (0.0%) |
| 4-Person Households | 50 (6.4%) | 0 (0.0%) |
| 5-Person Households | 0 (0.0%) | 0 (0.0%) |
| 6-Person Households | 0 (0.0%) | 0 (0.0%) |
| 7+ Person Households | 0 (0.0%) | 0 (0.0%) |
| Total | 395 (50.1%) | 393 (49.9%) |
Female Fertility in Southmont
Fertility by Age in Southmont
| Age Bracket | Women with Births | Births / 1,000 Women |
| 15 to 19 years | 0 (0.0%) | 0.0 |
| 20 to 34 years | 0 (0.0%) | 0.0 |
| 35 to 50 years | 0 (0.0%) | 0.0 |
| Total | 0 (0.0%) | 0.0 |
Fertility by Age by Marriage Status in Southmont
| Age Bracket | Married | Unmarried |
| 15 to 19 years | 0 (0.0%) | 0 (0.0%) |
| 20 to 34 years | 0 (0.0%) | 0 (0.0%) |
| 35 to 50 years | 0 (0.0%) | 0 (0.0%) |
| Total | 0 (0.0%) | 0 (0.0%) |
Fertility by Education in Southmont
| Educational Attainment | Women with Births | Births / 1,000 Women |
| Less than High School | 0 (0.0%) | 0.0 |
| High School Diploma | 0 (0.0%) | 0.0 |
| College or Associate's Degree | 0 (0.0%) | 0.0 |
| Bachelor's Degree | 0 (0.0%) | 0.0 |
| Graduate Degree | 0 (0.0%) | 0.0 |
| Total | 0 (0.0%) | 0.0 |
Fertility by Education by Marriage Status in Southmont
| Educational Attainment | Married | Unmarried |
| Less than High School | 0 (0.0%) | 0 (0.0%) |
| High School Diploma | 0 (0.0%) | 0 (0.0%) |
| College or Associate's Degree | 0 (0.0%) | 0 (0.0%) |
| Bachelor's Degree | 0 (0.0%) | 0 (0.0%) |
| Graduate Degree | 0 (0.0%) | 0 (0.0%) |
| Total | 0 (0.0%) | 0 (0.0%) |
Employment Characteristics in Southmont
Employment by Class of Employer in Southmont
Among the 531 employed individuals in Southmont, private company employees (264 | 49.7%), self-employed (incorporated) (141 | 26.6%), and state government employees (57 | 10.7%) make up the most common classes of employment.
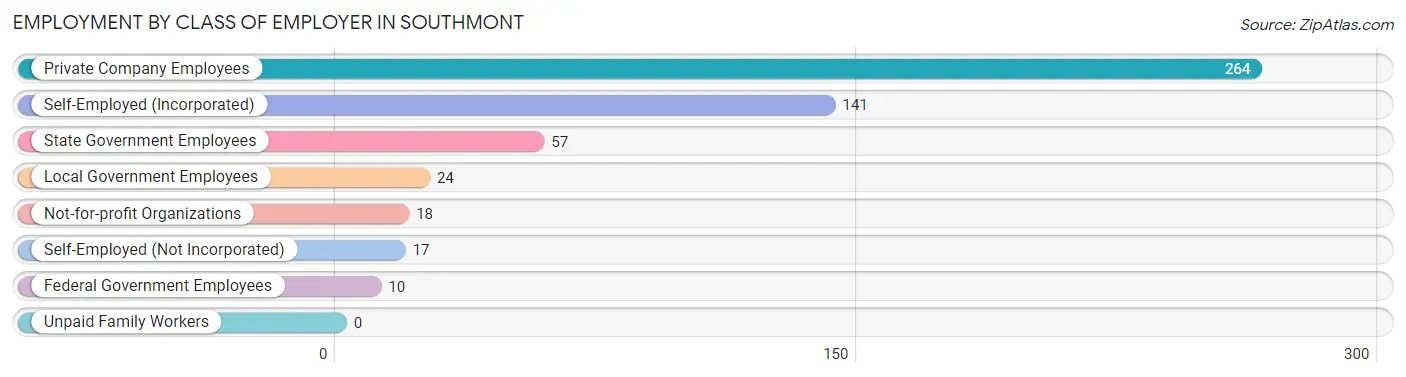
| Employer Class | # Employees | % Employees |
| Private Company Employees | 264 | 49.7% |
| Self-Employed (Incorporated) | 141 | 26.6% |
| Self-Employed (Not Incorporated) | 17 | 3.2% |
| Not-for-profit Organizations | 18 | 3.4% |
| Local Government Employees | 24 | 4.5% |
| State Government Employees | 57 | 10.7% |
| Federal Government Employees | 10 | 1.9% |
| Unpaid Family Workers | 0 | 0.0% |
| Total | 531 | 100.0% |
Employment Status by Age in Southmont
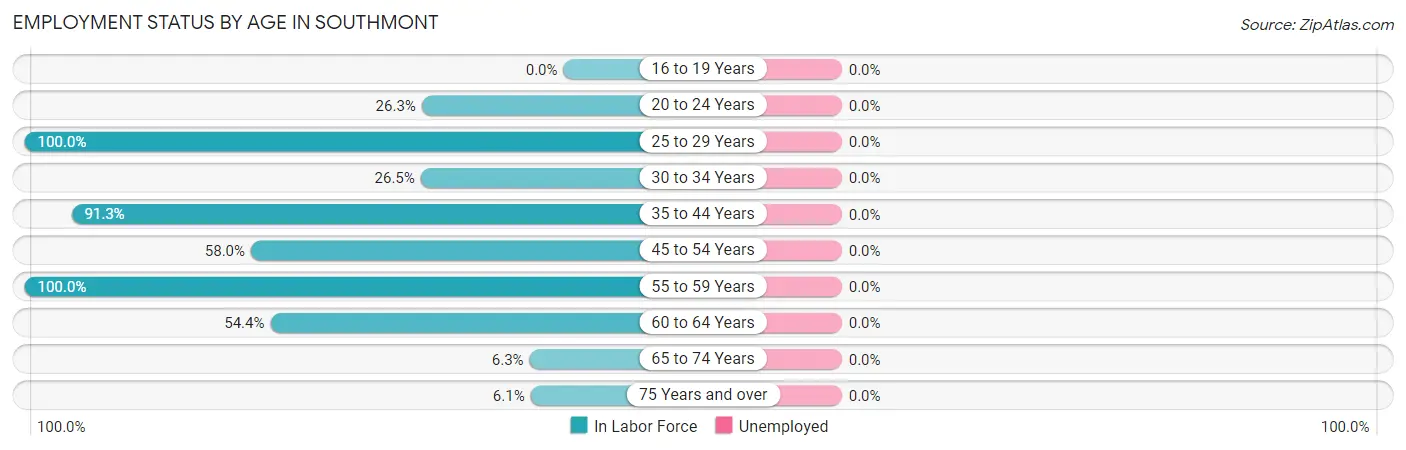
| Age Bracket | In Labor Force | Unemployed |
| 16 to 19 Years | 0 (0.0%) | 0 (0.0%) |
| 20 to 24 Years | 26 (26.3%) | 0 (0.0%) |
| 25 to 29 Years | 80 (100.0%) | 0 (0.0%) |
| 30 to 34 Years | 18 (26.5%) | 0 (0.0%) |
| 35 to 44 Years | 167 (91.3%) | 0 (0.0%) |
| 45 to 54 Years | 69 (58.0%) | 0 (0.0%) |
| 55 to 59 Years | 35 (100.0%) | 0 (0.0%) |
| 60 to 64 Years | 112 (54.4%) | 0 (0.0%) |
| 65 to 74 Years | 10 (6.3%) | 0 (0.0%) |
| 75 Years and over | 14 (6.1%) | 0 (0.0%) |
| Total | 532 (45.2%) | 0 (0.0%) |
Employment Status by Educational Attainment in Southmont
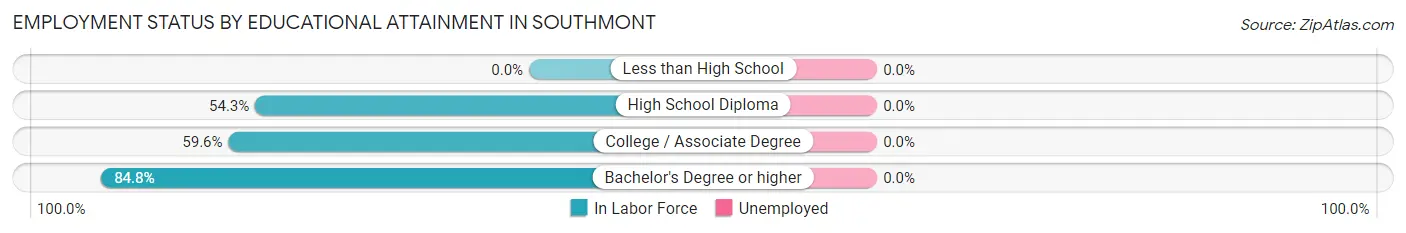
| Educational Attainment | In Labor Force | Unemployed |
| Less than High School | 0 (0.0%) | 0 (0.0%) |
| High School Diploma | 107 (54.3%) | 0 (0.0%) |
| College / Associate Degree | 106 (59.6%) | 0 (0.0%) |
| Bachelor's Degree or higher | 268 (84.8%) | 0 (0.0%) |
| Total | 481 (69.6%) | 0 (0.0%) |
Employment Occupations by Sex in Southmont
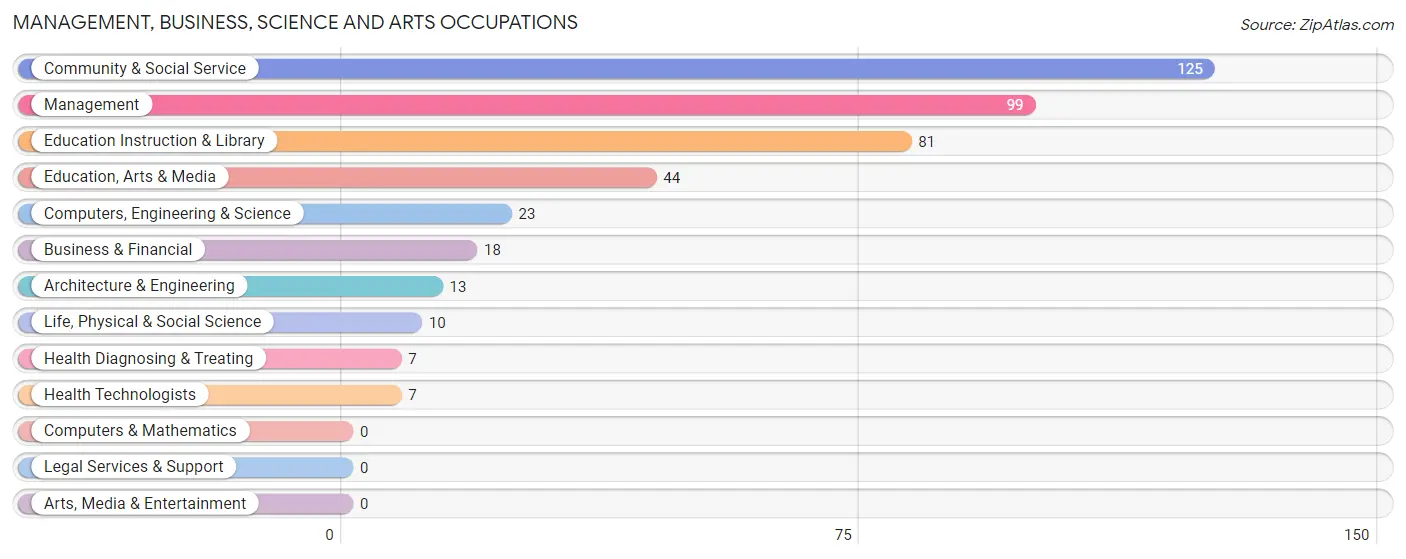
Management, Business, Science and Arts Occupations
The most common Management, Business, Science and Arts occupations in Southmont are Community & Social Service (125 | 23.5%), Management (99 | 18.6%), Education Instruction & Library (81 | 15.2%), Education, Arts & Media (44 | 8.3%), and Computers, Engineering & Science (23 | 4.3%).
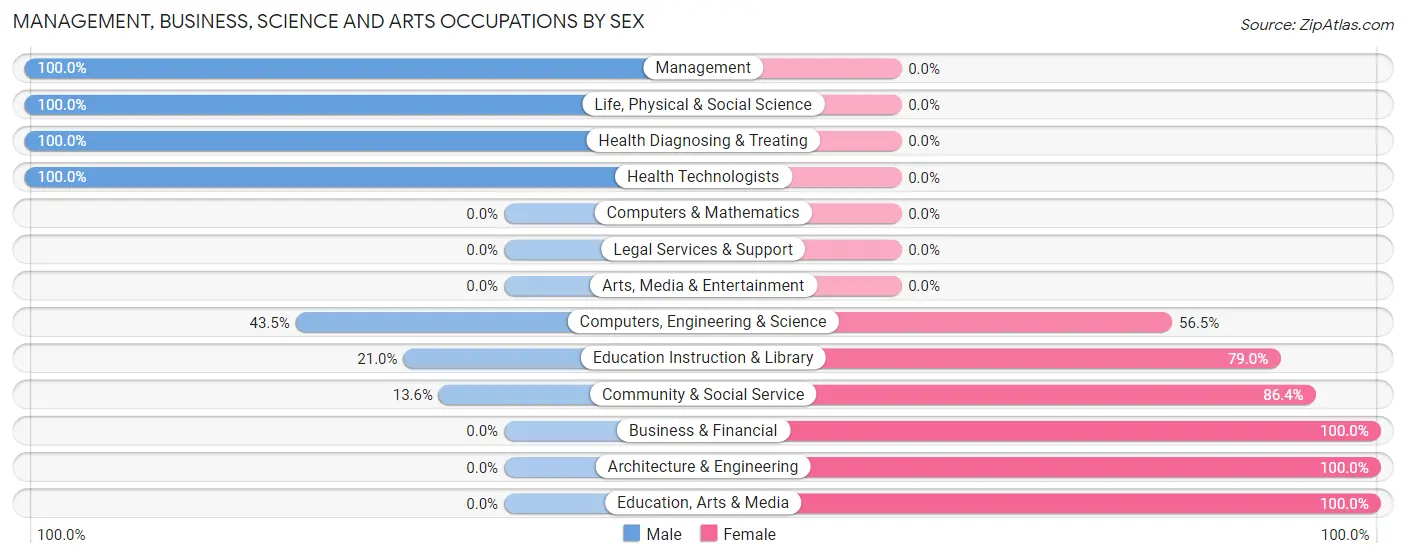
Management, Business, Science and Arts Occupations by Sex
Within the Management, Business, Science and Arts occupations in Southmont, the most male-oriented occupations are Management (100.0%), Life, Physical & Social Science (100.0%), and Health Diagnosing & Treating (100.0%), while the most female-oriented occupations are Business & Financial (100.0%), Architecture & Engineering (100.0%), and Education, Arts & Media (100.0%).
| Occupation | Male | Female |
| Management | 99 (100.0%) | 0 (0.0%) |
| Business & Financial | 0 (0.0%) | 18 (100.0%) |
| Computers, Engineering & Science | 10 (43.5%) | 13 (56.5%) |
| Computers & Mathematics | 0 (0.0%) | 0 (0.0%) |
| Architecture & Engineering | 0 (0.0%) | 13 (100.0%) |
| Life, Physical & Social Science | 10 (100.0%) | 0 (0.0%) |
| Community & Social Service | 17 (13.6%) | 108 (86.4%) |
| Education, Arts & Media | 0 (0.0%) | 44 (100.0%) |
| Legal Services & Support | 0 (0.0%) | 0 (0.0%) |
| Education Instruction & Library | 17 (21.0%) | 64 (79.0%) |
| Arts, Media & Entertainment | 0 (0.0%) | 0 (0.0%) |
| Health Diagnosing & Treating | 7 (100.0%) | 0 (0.0%) |
| Health Technologists | 7 (100.0%) | 0 (0.0%) |
| Total (Category) | 133 (48.9%) | 139 (51.1%) |
| Total (Overall) | 269 (50.7%) | 262 (49.3%) |
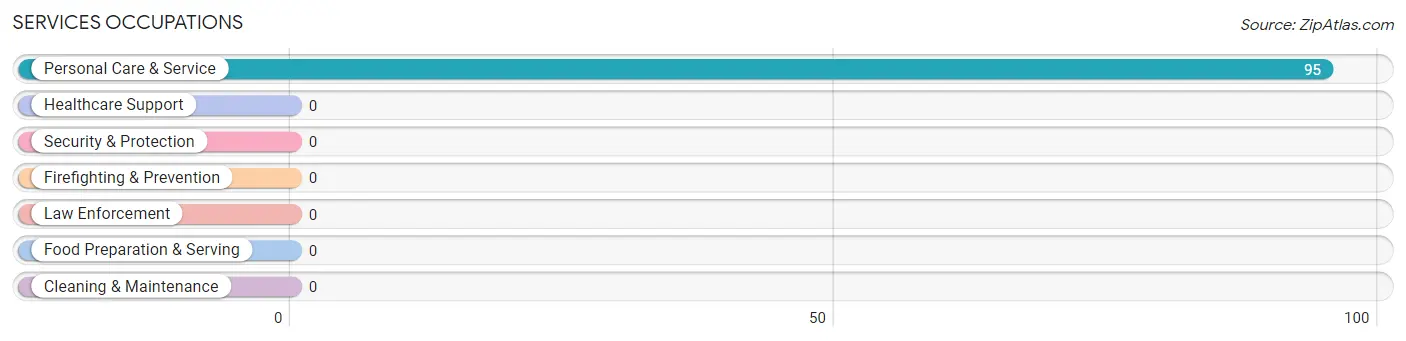
Services Occupations
The most common Services occupations in Southmont are , and Personal Care & Service (95 | 17.9%).
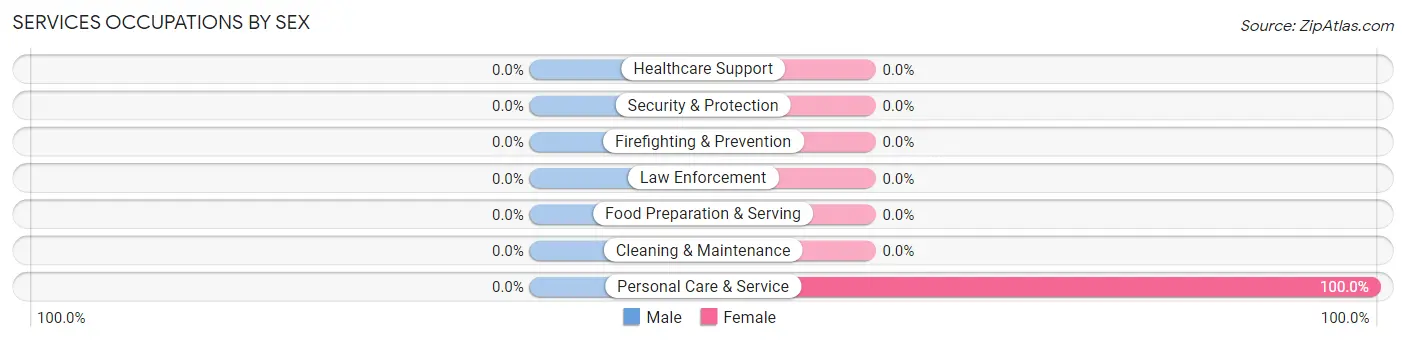
Services Occupations by Sex
| Occupation | Male | Female |
| Healthcare Support | 0 (0.0%) | 0 (0.0%) |
| Security & Protection | 0 (0.0%) | 0 (0.0%) |
| Firefighting & Prevention | 0 (0.0%) | 0 (0.0%) |
| Law Enforcement | 0 (0.0%) | 0 (0.0%) |
| Food Preparation & Serving | 0 (0.0%) | 0 (0.0%) |
| Cleaning & Maintenance | 0 (0.0%) | 0 (0.0%) |
| Personal Care & Service | 0 (0.0%) | 95 (100.0%) |
| Total (Category) | 0 (0.0%) | 95 (100.0%) |
| Total (Overall) | 269 (50.7%) | 262 (49.3%) |
Sales and Office Occupations
The most common Sales and Office occupations in Southmont are Sales & Related (14 | 2.6%), and Office & Administration (14 | 2.6%).
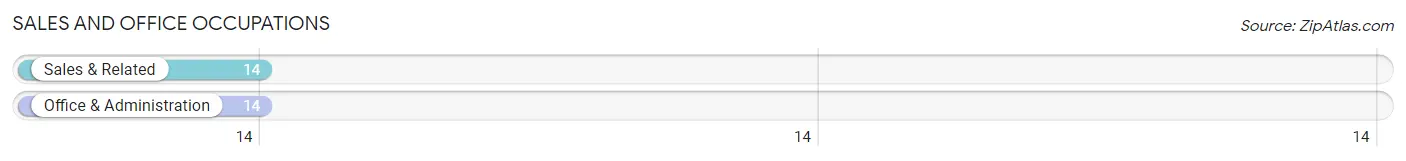
Sales and Office Occupations by Sex
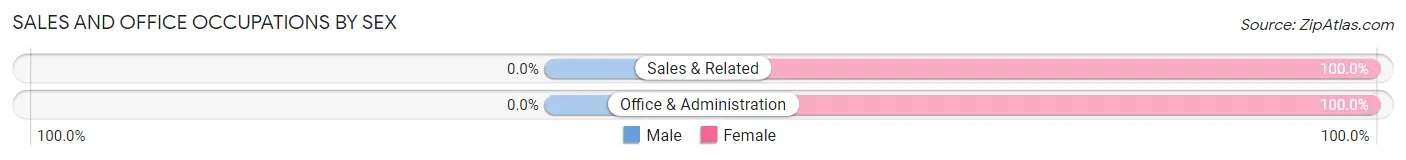
| Occupation | Male | Female |
| Sales & Related | 0 (0.0%) | 14 (100.0%) |
| Office & Administration | 0 (0.0%) | 14 (100.0%) |
| Total (Category) | 0 (0.0%) | 28 (100.0%) |
| Total (Overall) | 269 (50.7%) | 262 (49.3%) |
Natural Resources, Construction and Maintenance Occupations
The most common Natural Resources, Construction and Maintenance occupations in Southmont are Installation, Maintenance & Repair (64 | 12.0%), and Construction & Extraction (12 | 2.3%).
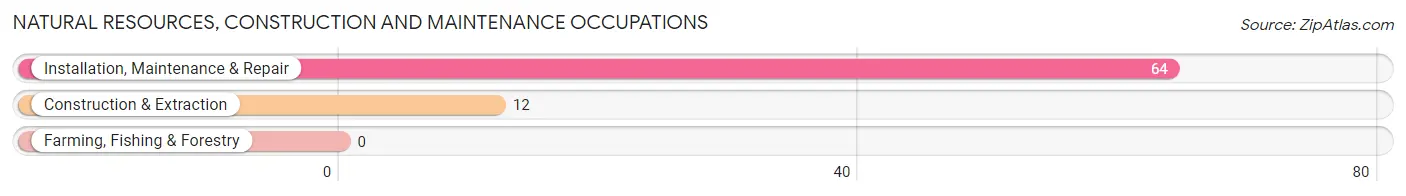
Natural Resources, Construction and Maintenance Occupations by Sex
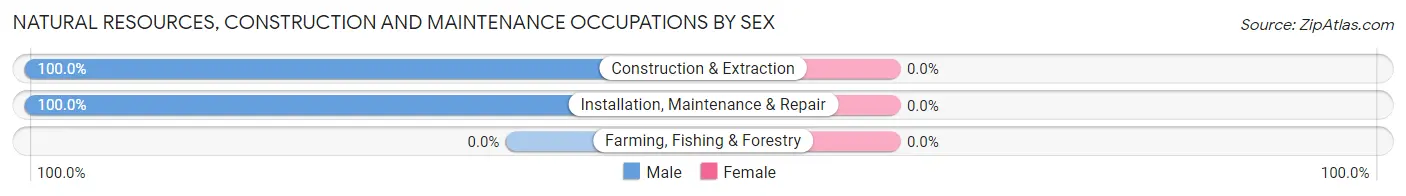
| Occupation | Male | Female |
| Farming, Fishing & Forestry | 0 (0.0%) | 0 (0.0%) |
| Construction & Extraction | 12 (100.0%) | 0 (0.0%) |
| Installation, Maintenance & Repair | 64 (100.0%) | 0 (0.0%) |
| Total (Category) | 76 (100.0%) | 0 (0.0%) |
| Total (Overall) | 269 (50.7%) | 262 (49.3%) |
Production, Transportation and Moving Occupations
The most common Production, Transportation and Moving occupations in Southmont are Transportation (34 | 6.4%), and Material Moving (26 | 4.9%).
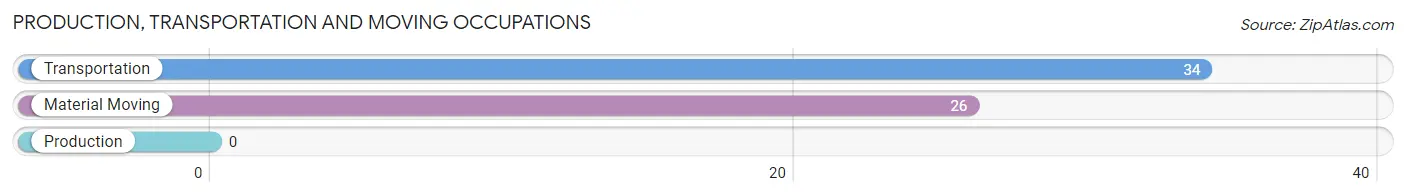
Production, Transportation and Moving Occupations by Sex
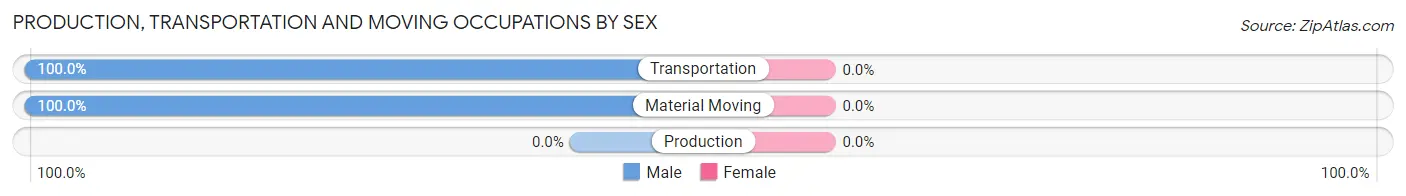
| Occupation | Male | Female |
| Production | 0 (0.0%) | 0 (0.0%) |
| Transportation | 34 (100.0%) | 0 (0.0%) |
| Material Moving | 26 (100.0%) | 0 (0.0%) |
| Total (Category) | 60 (100.0%) | 0 (0.0%) |
| Total (Overall) | 269 (50.7%) | 262 (49.3%) |
Employment Industries by Sex in Southmont
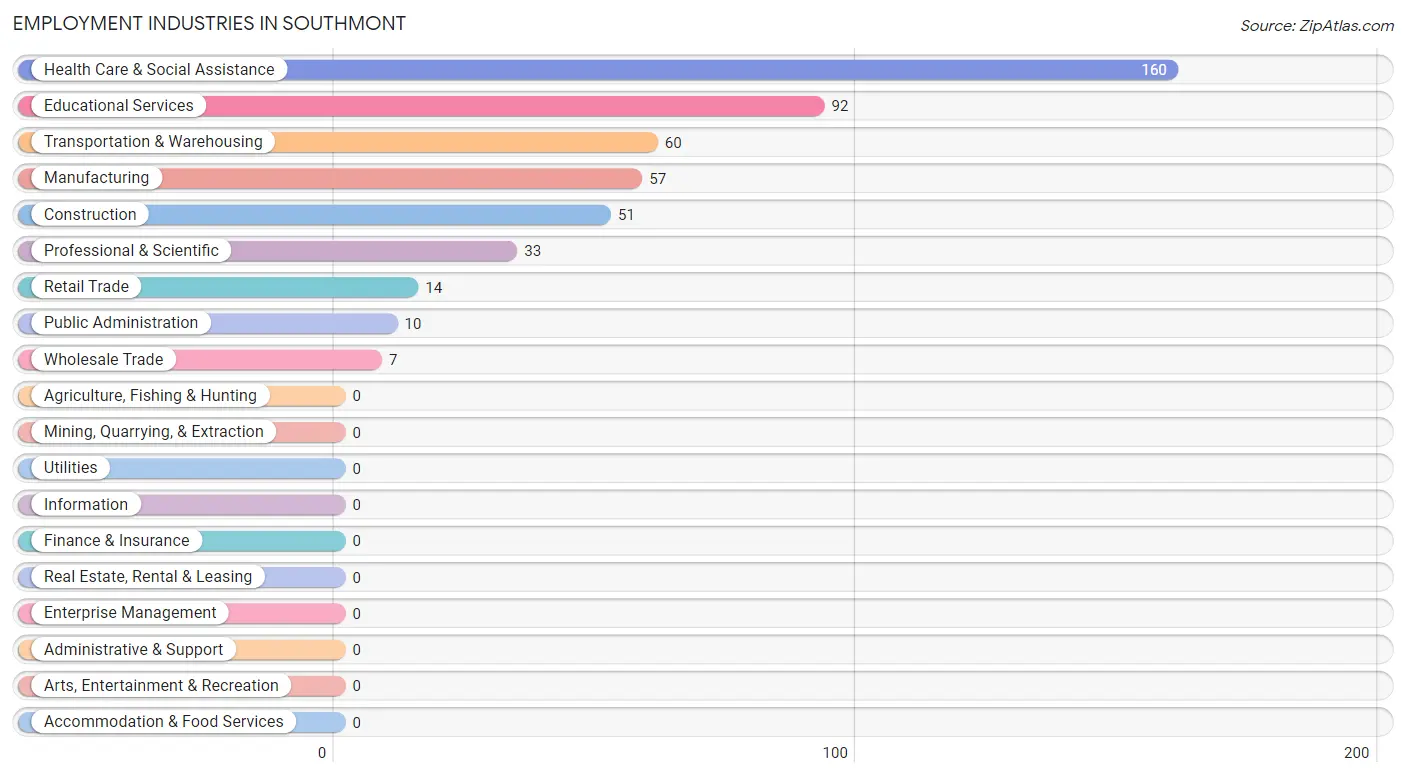
Employment Industries in Southmont
The major employment industries in Southmont include Health Care & Social Assistance (160 | 30.1%), Educational Services (92 | 17.3%), Transportation & Warehousing (60 | 11.3%), Manufacturing (57 | 10.7%), and Construction (51 | 9.6%).
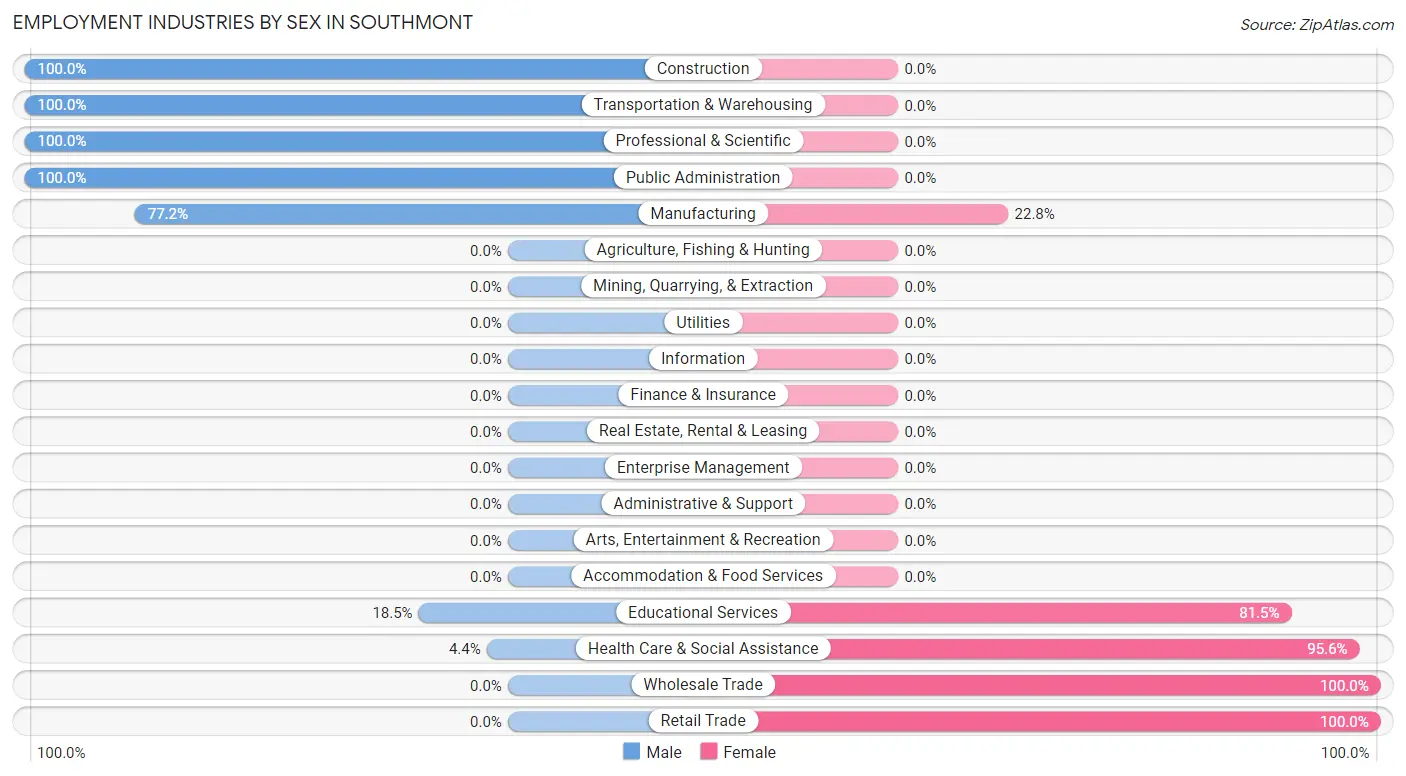
Employment Industries by Sex in Southmont
The Southmont industries that see more men than women are Construction (100.0%), Transportation & Warehousing (100.0%), and Professional & Scientific (100.0%), whereas the industries that tend to have a higher number of women are Wholesale Trade (100.0%), Retail Trade (100.0%), and Health Care & Social Assistance (95.6%).
| Industry | Male | Female |
| Agriculture, Fishing & Hunting | 0 (0.0%) | 0 (0.0%) |
| Mining, Quarrying, & Extraction | 0 (0.0%) | 0 (0.0%) |
| Construction | 51 (100.0%) | 0 (0.0%) |
| Manufacturing | 44 (77.2%) | 13 (22.8%) |
| Wholesale Trade | 0 (0.0%) | 7 (100.0%) |
| Retail Trade | 0 (0.0%) | 14 (100.0%) |
| Transportation & Warehousing | 60 (100.0%) | 0 (0.0%) |
| Utilities | 0 (0.0%) | 0 (0.0%) |
| Information | 0 (0.0%) | 0 (0.0%) |
| Finance & Insurance | 0 (0.0%) | 0 (0.0%) |
| Real Estate, Rental & Leasing | 0 (0.0%) | 0 (0.0%) |
| Professional & Scientific | 33 (100.0%) | 0 (0.0%) |
| Enterprise Management | 0 (0.0%) | 0 (0.0%) |
| Administrative & Support | 0 (0.0%) | 0 (0.0%) |
| Educational Services | 17 (18.5%) | 75 (81.5%) |
| Health Care & Social Assistance | 7 (4.4%) | 153 (95.6%) |
| Arts, Entertainment & Recreation | 0 (0.0%) | 0 (0.0%) |
| Accommodation & Food Services | 0 (0.0%) | 0 (0.0%) |
| Public Administration | 10 (100.0%) | 0 (0.0%) |
| Total | 269 (50.7%) | 262 (49.3%) |
Education in Southmont
School Enrollment in Southmont
The most common levels of schooling among the 290 students in Southmont are elementary school (102 | 35.2%), college / undergraduate (73 | 25.2%), and middle school (47 | 16.2%).
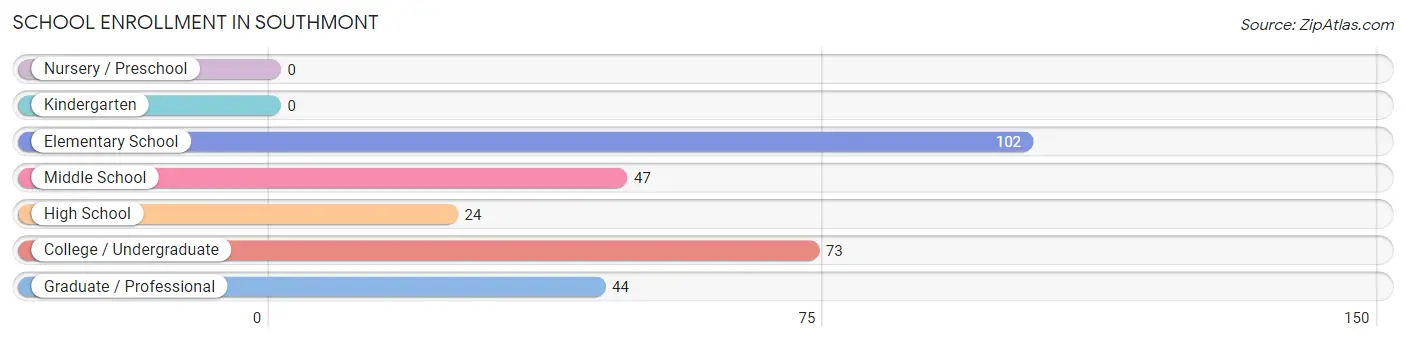
| School Level | # Students | % Students |
| Nursery / Preschool | 0 | 0.0% |
| Kindergarten | 0 | 0.0% |
| Elementary School | 102 | 35.2% |
| Middle School | 47 | 16.2% |
| High School | 24 | 8.3% |
| College / Undergraduate | 73 | 25.2% |
| Graduate / Professional | 44 | 15.2% |
| Total | 290 | 100.0% |
School Enrollment by Age by Funding Source in Southmont
Out of a total of 290 students who are enrolled in schools in Southmont, 56 (19.3%) attend a private institution, while the remaining 234 (80.7%) are enrolled in public schools. The age group of 5 to 9 year old has the highest likelihood of being enrolled in private schools, with 56 (54.9% in the age bracket) enrolled. Conversely, the age group of 10 to 14 year olds has the lowest likelihood of being enrolled in a private school, with 71 (100.0% in the age bracket) attending a public institution.
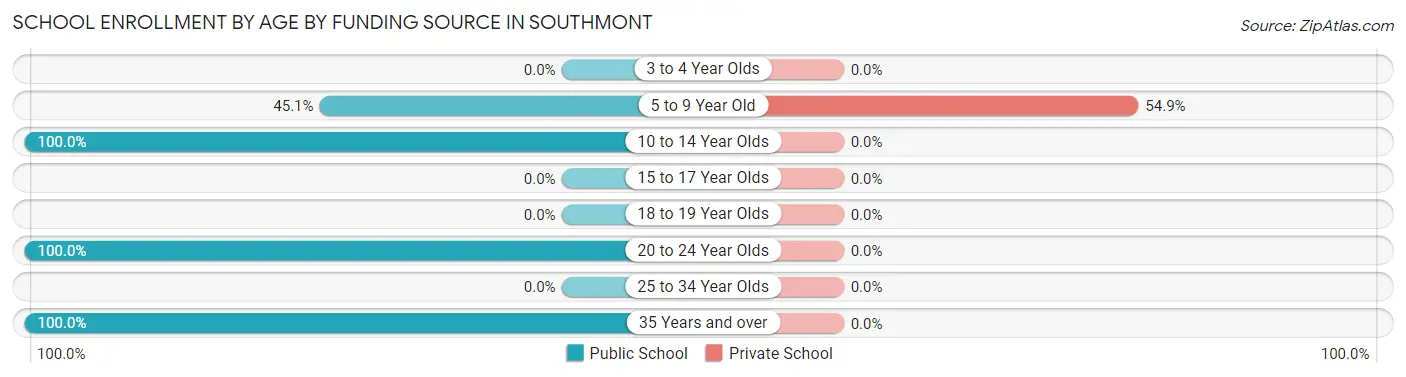
| Age Bracket | Public School | Private School |
| 3 to 4 Year Olds | 0 (0.0%) | 0 (0.0%) |
| 5 to 9 Year Old | 46 (45.1%) | 56 (54.9%) |
| 10 to 14 Year Olds | 71 (100.0%) | 0 (0.0%) |
| 15 to 17 Year Olds | 0 (0.0%) | 0 (0.0%) |
| 18 to 19 Year Olds | 0 (0.0%) | 0 (0.0%) |
| 20 to 24 Year Olds | 73 (100.0%) | 0 (0.0%) |
| 25 to 34 Year Olds | 0 (0.0%) | 0 (0.0%) |
| 35 Years and over | 44 (100.0%) | 0 (0.0%) |
| Total | 234 (80.7%) | 56 (19.3%) |
Educational Attainment by Field of Study in Southmont
Education (152 | 33.0%), business (103 | 22.4%), liberal arts & history (54 | 11.7%), bio, nature & agricultural (46 | 10.0%), and psychology (35 | 7.6%) are the most common fields of study among 460 individuals in Southmont who have obtained a bachelor's degree or higher.
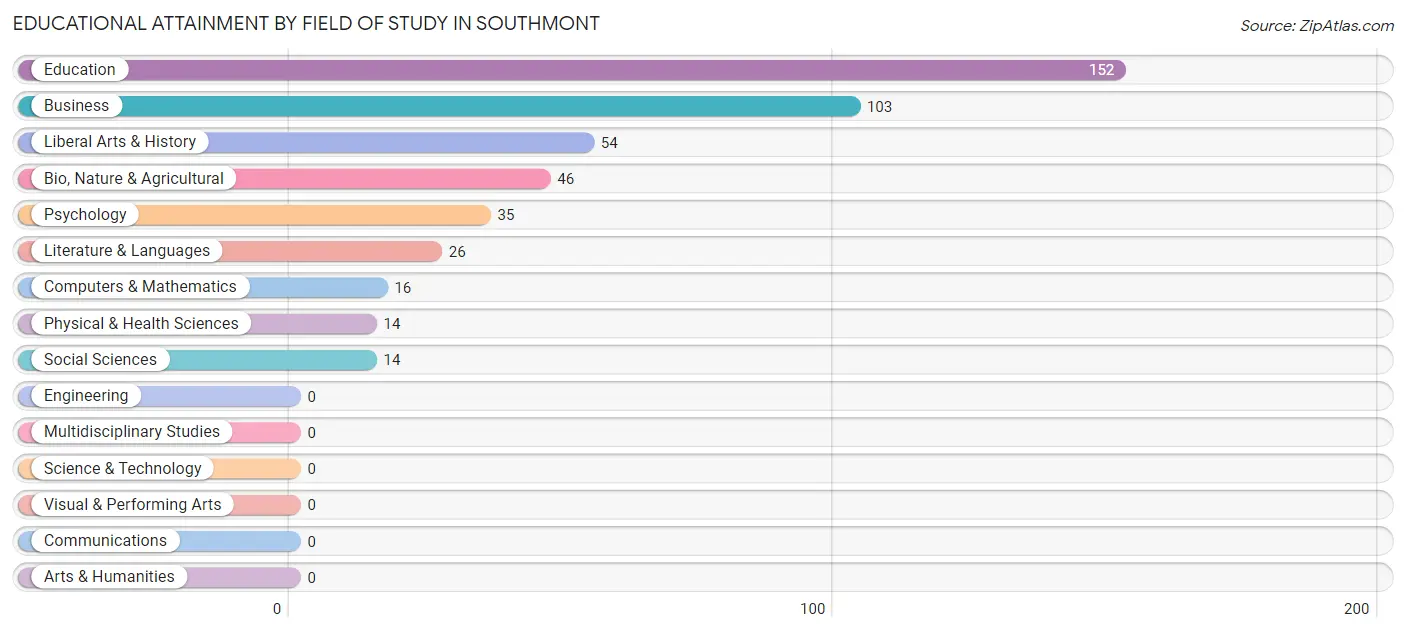
| Field of Study | # Graduates | % Graduates |
| Computers & Mathematics | 16 | 3.5% |
| Bio, Nature & Agricultural | 46 | 10.0% |
| Physical & Health Sciences | 14 | 3.0% |
| Psychology | 35 | 7.6% |
| Social Sciences | 14 | 3.0% |
| Engineering | 0 | 0.0% |
| Multidisciplinary Studies | 0 | 0.0% |
| Science & Technology | 0 | 0.0% |
| Business | 103 | 22.4% |
| Education | 152 | 33.0% |
| Literature & Languages | 26 | 5.7% |
| Liberal Arts & History | 54 | 11.7% |
| Visual & Performing Arts | 0 | 0.0% |
| Communications | 0 | 0.0% |
| Arts & Humanities | 0 | 0.0% |
| Total | 460 | 100.0% |
Transportation & Commute in Southmont
Vehicle Availability by Sex in Southmont
The most prevalent vehicle ownership categories in Southmont are males with 3 vehicles (73, accounting for 27.1%) and females with 3 vehicles (46, making up 27.9%).
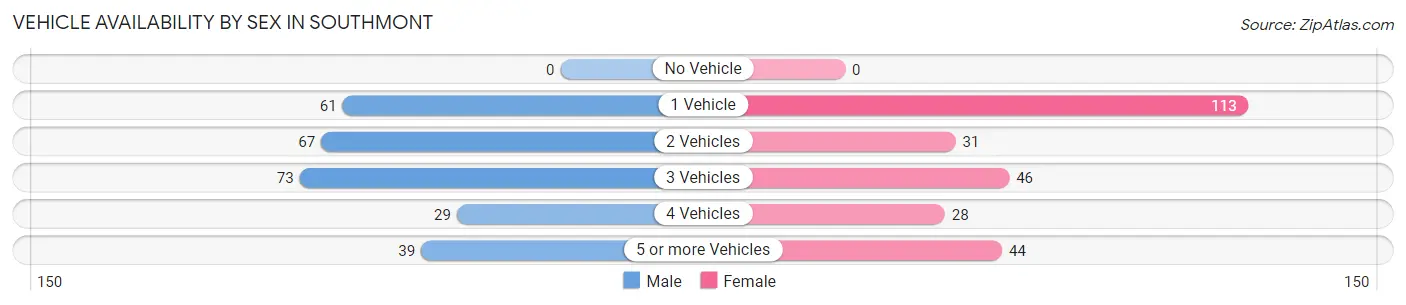
| Vehicles Available | Male | Female |
| No Vehicle | 0 (0.0%) | 0 (0.0%) |
| 1 Vehicle | 61 (22.7%) | 113 (43.1%) |
| 2 Vehicles | 67 (24.9%) | 31 (11.8%) |
| 3 Vehicles | 73 (27.1%) | 46 (17.6%) |
| 4 Vehicles | 29 (10.8%) | 28 (10.7%) |
| 5 or more Vehicles | 39 (14.5%) | 44 (16.8%) |
| Total | 269 (100.0%) | 262 (100.0%) |
Commute Time in Southmont
The most frequently occuring commute durations in Southmont are 25 to 29 minutes (141 commuters, 28.7%), 45 to 59 minutes (117 commuters, 23.8%), and 20 to 24 minutes (66 commuters, 13.4%).
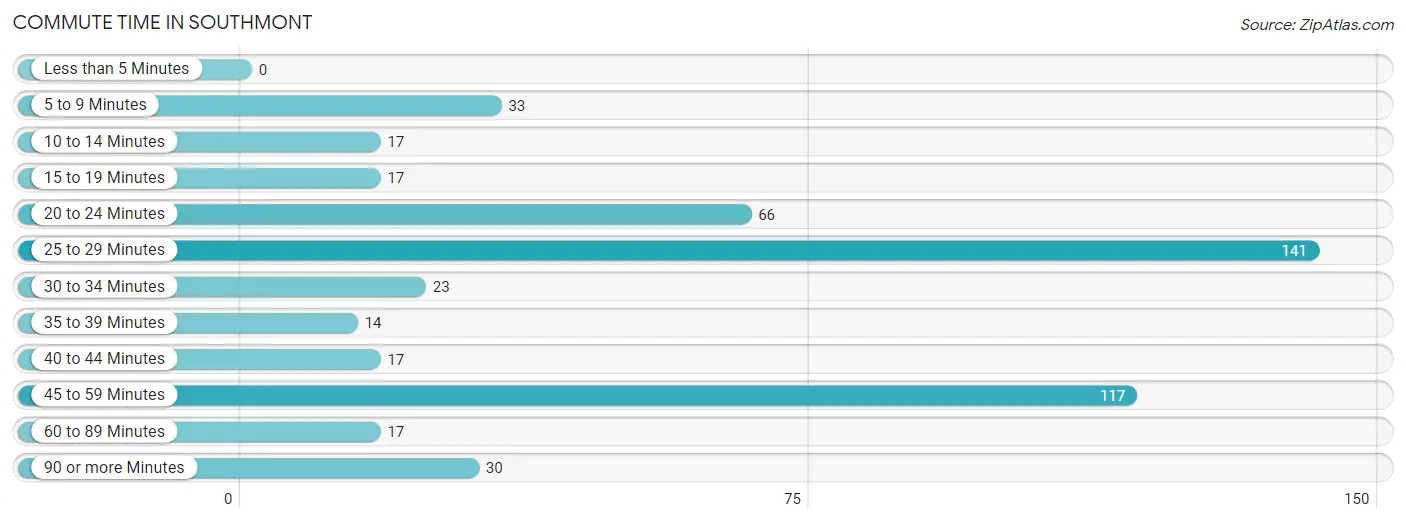
| Commute Time | # Commuters | % Commuters |
| Less than 5 Minutes | 0 | 0.0% |
| 5 to 9 Minutes | 33 | 6.7% |
| 10 to 14 Minutes | 17 | 3.5% |
| 15 to 19 Minutes | 17 | 3.5% |
| 20 to 24 Minutes | 66 | 13.4% |
| 25 to 29 Minutes | 141 | 28.7% |
| 30 to 34 Minutes | 23 | 4.7% |
| 35 to 39 Minutes | 14 | 2.9% |
| 40 to 44 Minutes | 17 | 3.5% |
| 45 to 59 Minutes | 117 | 23.8% |
| 60 to 89 Minutes | 17 | 3.5% |
| 90 or more Minutes | 30 | 6.1% |
Commute Time by Sex in Southmont
The most common commute times in Southmont are 45 to 59 minutes (73 commuters, 31.7%) for males and 25 to 29 minutes (115 commuters, 43.9%) for females.
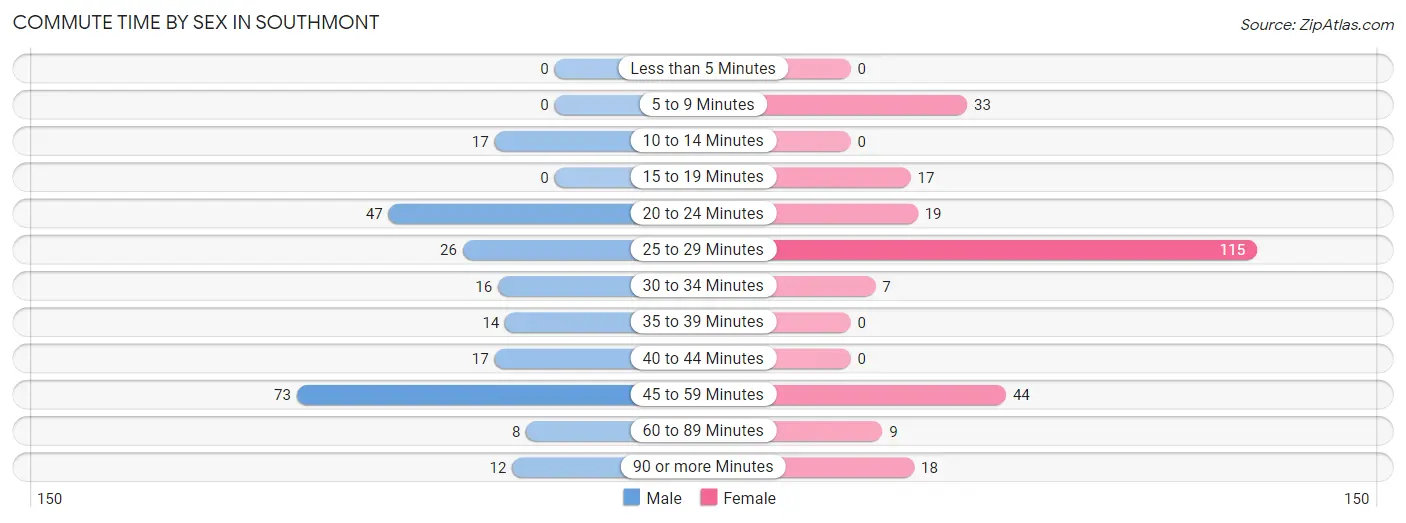
| Commute Time | Male | Female |
| Less than 5 Minutes | 0 (0.0%) | 0 (0.0%) |
| 5 to 9 Minutes | 0 (0.0%) | 33 (12.6%) |
| 10 to 14 Minutes | 17 (7.4%) | 0 (0.0%) |
| 15 to 19 Minutes | 0 (0.0%) | 17 (6.5%) |
| 20 to 24 Minutes | 47 (20.4%) | 19 (7.2%) |
| 25 to 29 Minutes | 26 (11.3%) | 115 (43.9%) |
| 30 to 34 Minutes | 16 (7.0%) | 7 (2.7%) |
| 35 to 39 Minutes | 14 (6.1%) | 0 (0.0%) |
| 40 to 44 Minutes | 17 (7.4%) | 0 (0.0%) |
| 45 to 59 Minutes | 73 (31.7%) | 44 (16.8%) |
| 60 to 89 Minutes | 8 (3.5%) | 9 (3.4%) |
| 90 or more Minutes | 12 (5.2%) | 18 (6.9%) |
Time of Departure to Work by Sex in Southmont
The most frequent times of departure to work in Southmont are 10:00 AM to 10:59 AM (47, 20.4%) for males and 7:00 AM to 7:29 AM (119, 45.4%) for females.
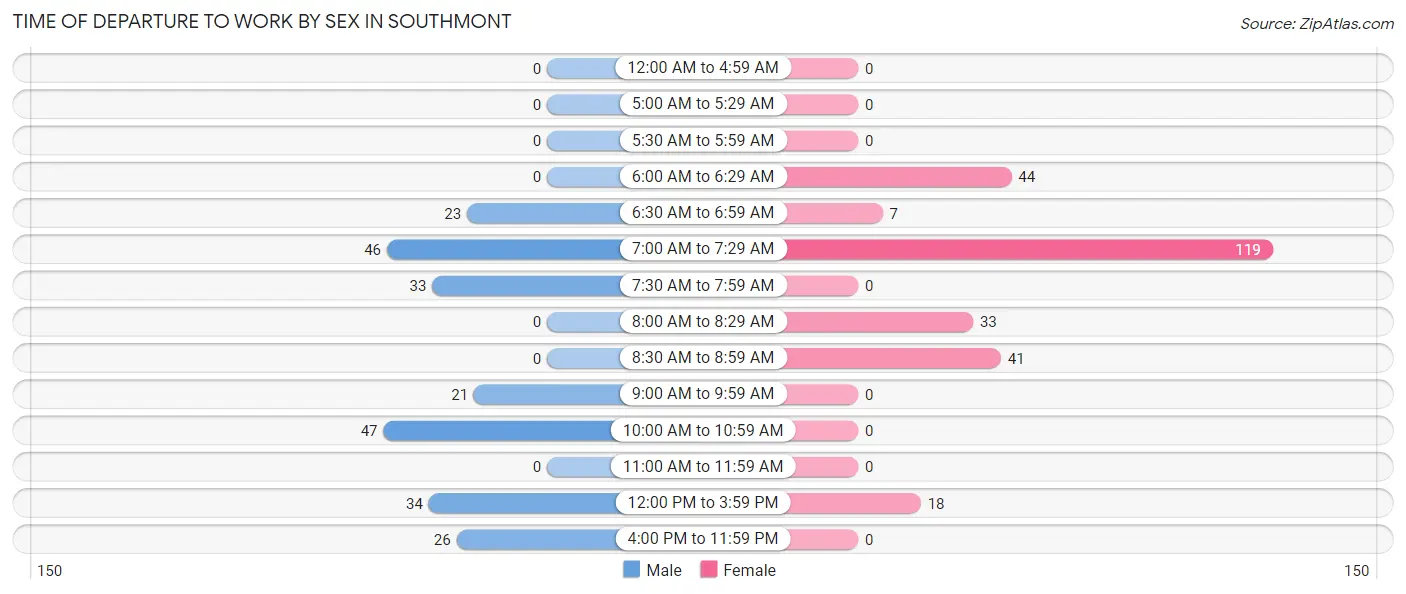
| Time of Departure | Male | Female |
| 12:00 AM to 4:59 AM | 0 (0.0%) | 0 (0.0%) |
| 5:00 AM to 5:29 AM | 0 (0.0%) | 0 (0.0%) |
| 5:30 AM to 5:59 AM | 0 (0.0%) | 0 (0.0%) |
| 6:00 AM to 6:29 AM | 0 (0.0%) | 44 (16.8%) |
| 6:30 AM to 6:59 AM | 23 (10.0%) | 7 (2.7%) |
| 7:00 AM to 7:29 AM | 46 (20.0%) | 119 (45.4%) |
| 7:30 AM to 7:59 AM | 33 (14.3%) | 0 (0.0%) |
| 8:00 AM to 8:29 AM | 0 (0.0%) | 33 (12.6%) |
| 8:30 AM to 8:59 AM | 0 (0.0%) | 41 (15.7%) |
| 9:00 AM to 9:59 AM | 21 (9.1%) | 0 (0.0%) |
| 10:00 AM to 10:59 AM | 47 (20.4%) | 0 (0.0%) |
| 11:00 AM to 11:59 AM | 0 (0.0%) | 0 (0.0%) |
| 12:00 PM to 3:59 PM | 34 (14.8%) | 18 (6.9%) |
| 4:00 PM to 11:59 PM | 26 (11.3%) | 0 (0.0%) |
| Total | 230 (100.0%) | 262 (100.0%) |
Housing Occupancy in Southmont
Occupancy by Ownership in Southmont
Of the total 788 dwellings in Southmont, owner-occupied units account for 738 (93.6%), while renter-occupied units make up 50 (6.4%).
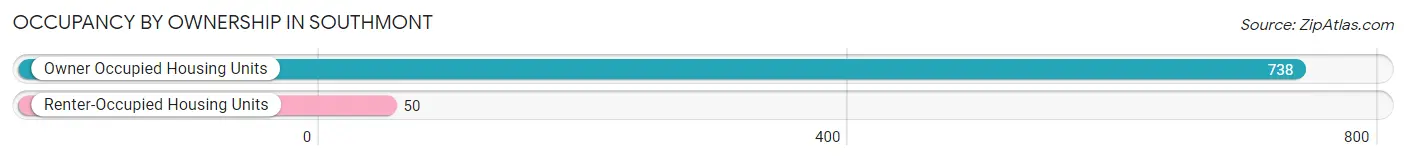
| Occupancy | # Housing Units | % Housing Units |
| Owner Occupied Housing Units | 738 | 93.6% |
| Renter-Occupied Housing Units | 50 | 6.4% |
| Total Occupied Housing Units | 788 | 100.0% |
Occupancy by Household Size in Southmont
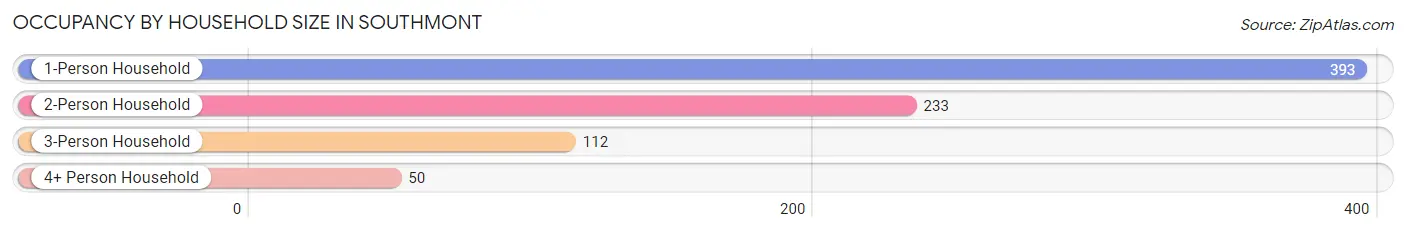
| Household Size | # Housing Units | % Housing Units |
| 1-Person Household | 393 | 49.9% |
| 2-Person Household | 233 | 29.6% |
| 3-Person Household | 112 | 14.2% |
| 4+ Person Household | 50 | 6.4% |
| Total Housing Units | 788 | 100.0% |
Occupancy by Ownership by Household Size in Southmont
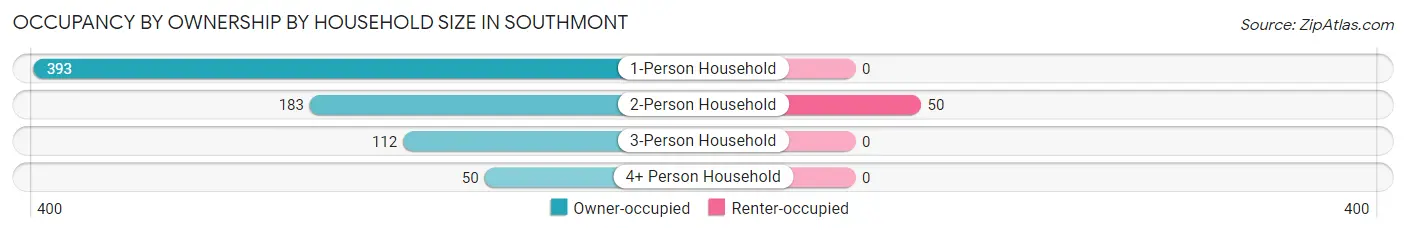
| Household Size | Owner-occupied | Renter-occupied |
| 1-Person Household | 393 (100.0%) | 0 (0.0%) |
| 2-Person Household | 183 (78.5%) | 50 (21.5%) |
| 3-Person Household | 112 (100.0%) | 0 (0.0%) |
| 4+ Person Household | 50 (100.0%) | 0 (0.0%) |
| Total Housing Units | 738 (93.6%) | 50 (6.4%) |
Occupancy by Educational Attainment in Southmont
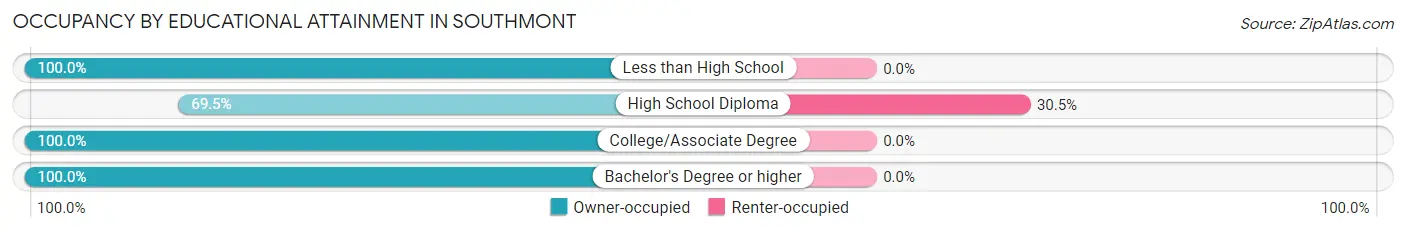
| Household Size | Owner-occupied | Renter-occupied |
| Less than High School | 72 (100.0%) | 0 (0.0%) |
| High School Diploma | 114 (69.5%) | 50 (30.5%) |
| College/Associate Degree | 187 (100.0%) | 0 (0.0%) |
| Bachelor's Degree or higher | 365 (100.0%) | 0 (0.0%) |
Occupancy by Age of Householder in Southmont
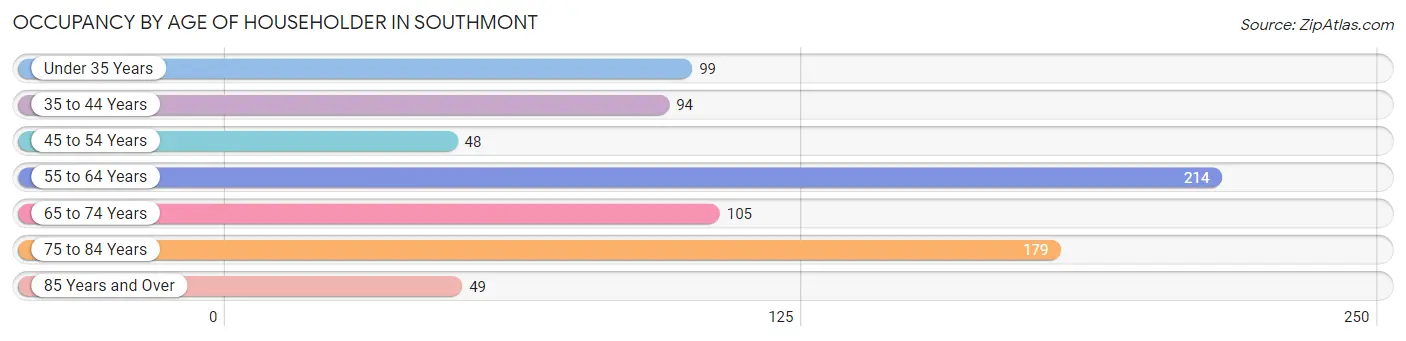
| Age Bracket | # Households | % Households |
| Under 35 Years | 99 | 12.6% |
| 35 to 44 Years | 94 | 11.9% |
| 45 to 54 Years | 48 | 6.1% |
| 55 to 64 Years | 214 | 27.2% |
| 65 to 74 Years | 105 | 13.3% |
| 75 to 84 Years | 179 | 22.7% |
| 85 Years and Over | 49 | 6.2% |
| Total | 788 | 100.0% |
Housing Finances in Southmont
Median Income by Occupancy in Southmont
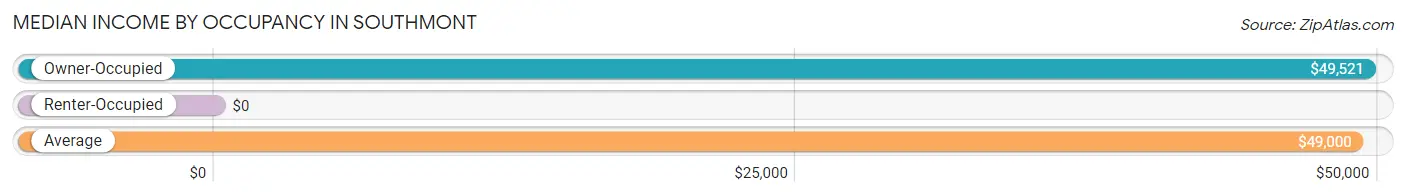
| Occupancy Type | # Households | Median Income |
| Owner-Occupied | 738 (93.6%) | $49,521 |
| Renter-Occupied | 50 (6.4%) | $0 |
| Average | 788 (100.0%) | $49,000 |
Occupancy by Householder Income Bracket in Southmont
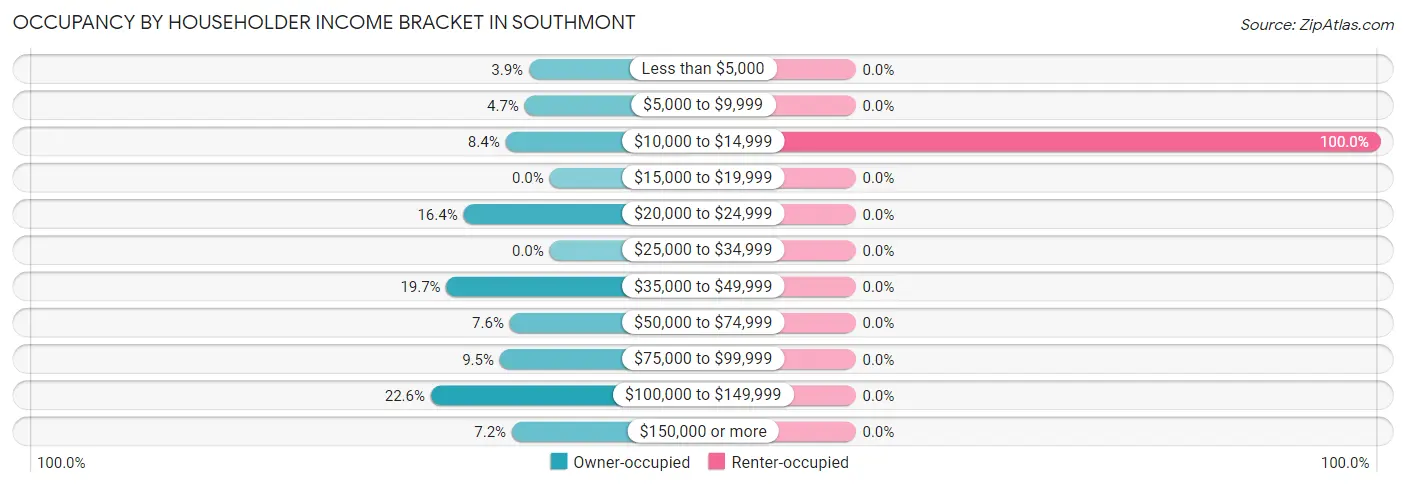
| Income Bracket | Owner-occupied | Renter-occupied |
| Less than $5,000 | 29 (3.9%) | 0 (0.0%) |
| $5,000 to $9,999 | 35 (4.7%) | 0 (0.0%) |
| $10,000 to $14,999 | 62 (8.4%) | 50 (100.0%) |
| $15,000 to $19,999 | 0 (0.0%) | 0 (0.0%) |
| $20,000 to $24,999 | 121 (16.4%) | 0 (0.0%) |
| $25,000 to $34,999 | 0 (0.0%) | 0 (0.0%) |
| $35,000 to $49,999 | 145 (19.7%) | 0 (0.0%) |
| $50,000 to $74,999 | 56 (7.6%) | 0 (0.0%) |
| $75,000 to $99,999 | 70 (9.5%) | 0 (0.0%) |
| $100,000 to $149,999 | 167 (22.6%) | 0 (0.0%) |
| $150,000 or more | 53 (7.2%) | 0 (0.0%) |
| Total | 738 (100.0%) | 50 (100.0%) |
Monthly Housing Cost Tiers in Southmont
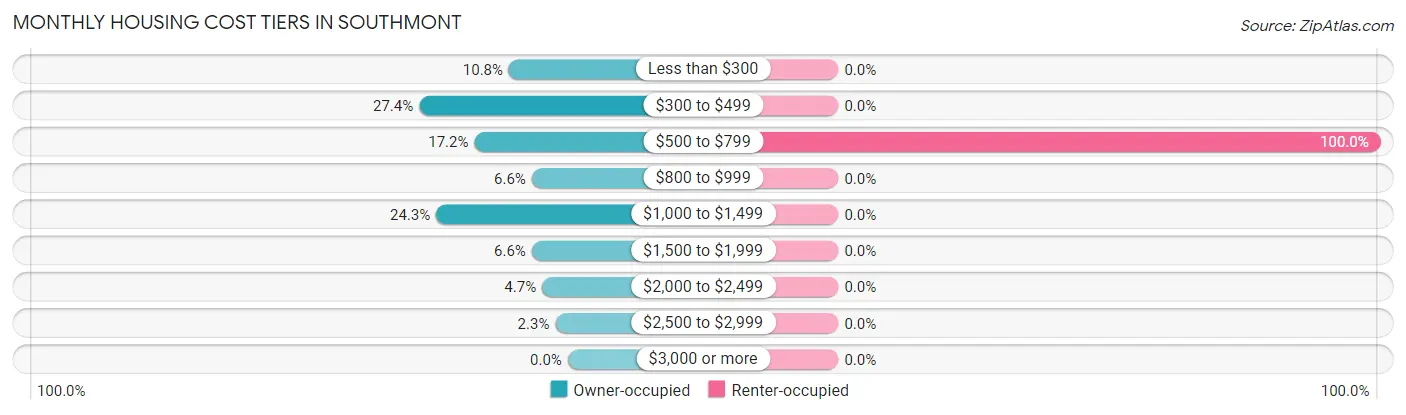
| Monthly Cost | Owner-occupied | Renter-occupied |
| Less than $300 | 80 (10.8%) | 0 (0.0%) |
| $300 to $499 | 202 (27.4%) | 0 (0.0%) |
| $500 to $799 | 127 (17.2%) | 50 (100.0%) |
| $800 to $999 | 49 (6.6%) | 0 (0.0%) |
| $1,000 to $1,499 | 179 (24.2%) | 0 (0.0%) |
| $1,500 to $1,999 | 49 (6.6%) | 0 (0.0%) |
| $2,000 to $2,499 | 35 (4.7%) | 0 (0.0%) |
| $2,500 to $2,999 | 17 (2.3%) | 0 (0.0%) |
| $3,000 or more | 0 (0.0%) | 0 (0.0%) |
| Total | 738 (100.0%) | 50 (100.0%) |
Physical Housing Characteristics in Southmont
Housing Structures in Southmont
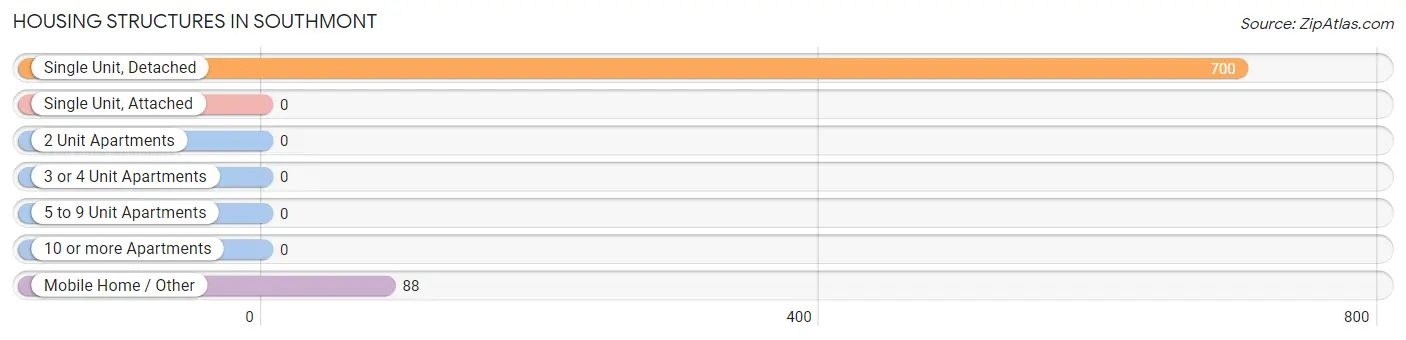
| Structure Type | # Housing Units | % Housing Units |
| Single Unit, Detached | 700 | 88.8% |
| Single Unit, Attached | 0 | 0.0% |
| 2 Unit Apartments | 0 | 0.0% |
| 3 or 4 Unit Apartments | 0 | 0.0% |
| 5 to 9 Unit Apartments | 0 | 0.0% |
| 10 or more Apartments | 0 | 0.0% |
| Mobile Home / Other | 88 | 11.2% |
| Total | 788 | 100.0% |
Housing Structures by Occupancy in Southmont
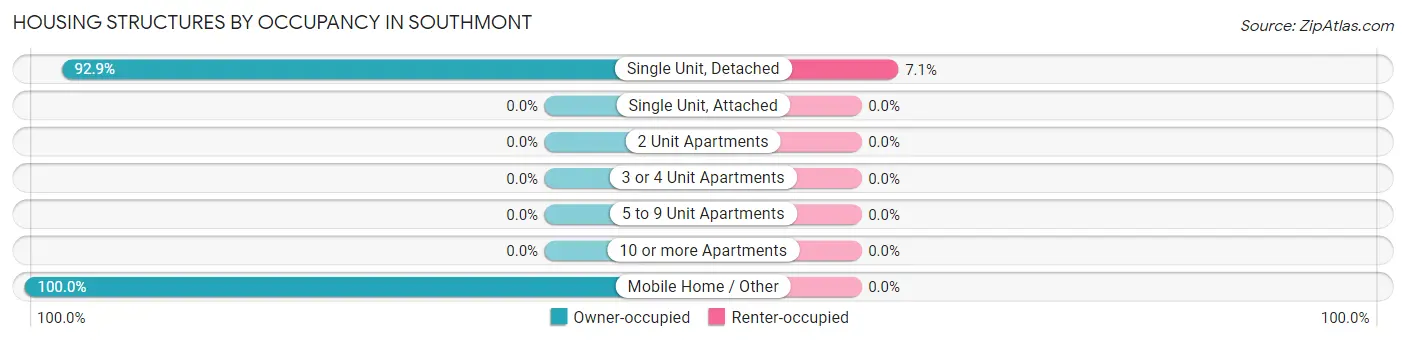
| Structure Type | Owner-occupied | Renter-occupied |
| Single Unit, Detached | 650 (92.9%) | 50 (7.1%) |
| Single Unit, Attached | 0 (0.0%) | 0 (0.0%) |
| 2 Unit Apartments | 0 (0.0%) | 0 (0.0%) |
| 3 or 4 Unit Apartments | 0 (0.0%) | 0 (0.0%) |
| 5 to 9 Unit Apartments | 0 (0.0%) | 0 (0.0%) |
| 10 or more Apartments | 0 (0.0%) | 0 (0.0%) |
| Mobile Home / Other | 88 (100.0%) | 0 (0.0%) |
| Total | 738 (93.6%) | 50 (6.4%) |
Housing Structures by Number of Rooms in Southmont
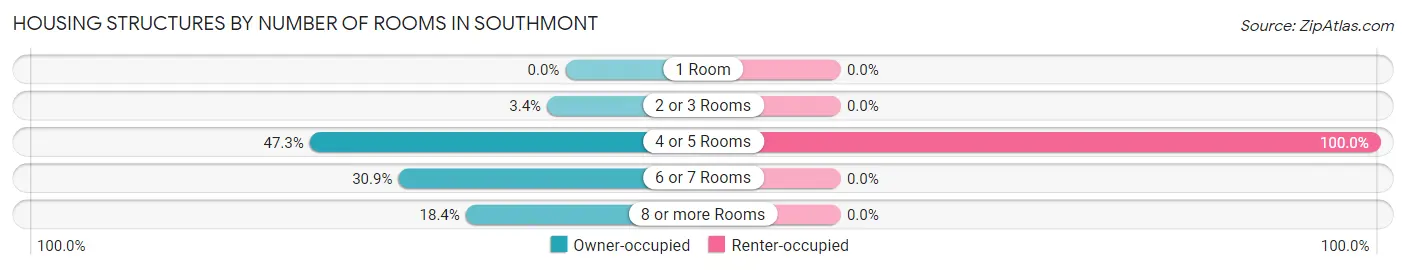
| Number of Rooms | Owner-occupied | Renter-occupied |
| 1 Room | 0 (0.0%) | 0 (0.0%) |
| 2 or 3 Rooms | 25 (3.4%) | 0 (0.0%) |
| 4 or 5 Rooms | 349 (47.3%) | 50 (100.0%) |
| 6 or 7 Rooms | 228 (30.9%) | 0 (0.0%) |
| 8 or more Rooms | 136 (18.4%) | 0 (0.0%) |
| Total | 738 (100.0%) | 50 (100.0%) |
Housing Structure by Heating Type in Southmont
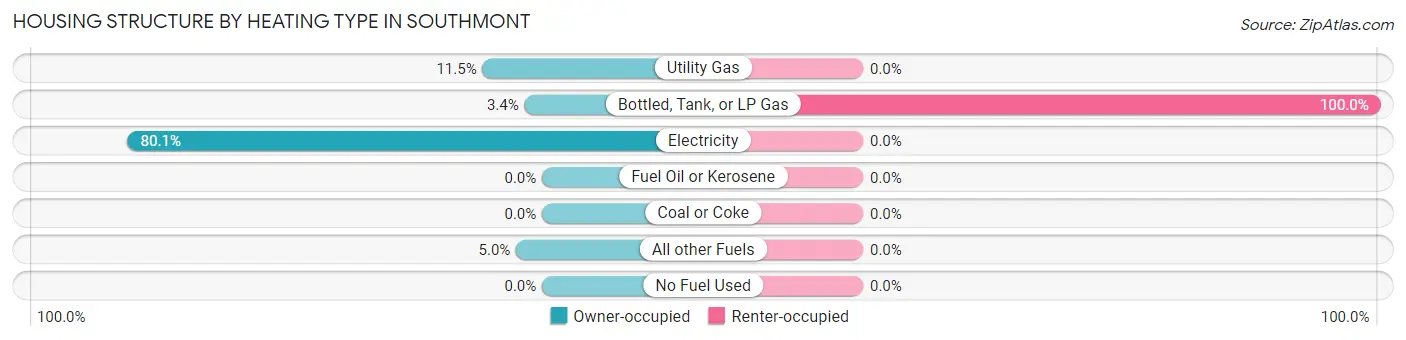
| Heating Type | Owner-occupied | Renter-occupied |
| Utility Gas | 85 (11.5%) | 0 (0.0%) |
| Bottled, Tank, or LP Gas | 25 (3.4%) | 50 (100.0%) |
| Electricity | 591 (80.1%) | 0 (0.0%) |
| Fuel Oil or Kerosene | 0 (0.0%) | 0 (0.0%) |
| Coal or Coke | 0 (0.0%) | 0 (0.0%) |
| All other Fuels | 37 (5.0%) | 0 (0.0%) |
| No Fuel Used | 0 (0.0%) | 0 (0.0%) |
| Total | 738 (100.0%) | 50 (100.0%) |
Household Vehicle Usage in Southmont
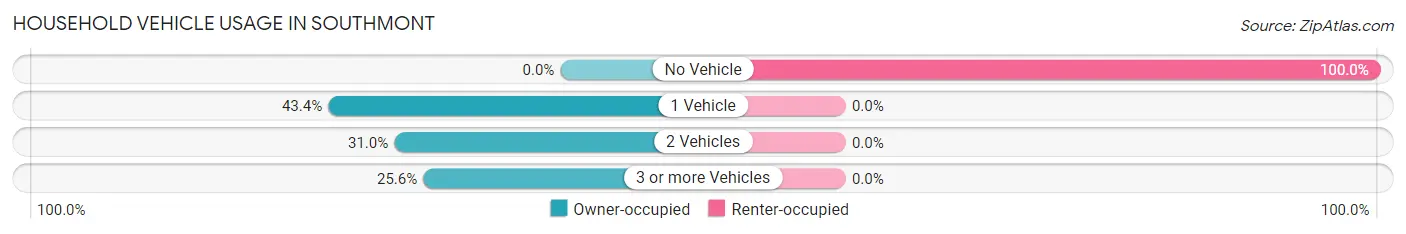
| Vehicles per Household | Owner-occupied | Renter-occupied |
| No Vehicle | 0 (0.0%) | 50 (100.0%) |
| 1 Vehicle | 320 (43.4%) | 0 (0.0%) |
| 2 Vehicles | 229 (31.0%) | 0 (0.0%) |
| 3 or more Vehicles | 189 (25.6%) | 0 (0.0%) |
| Total | 738 (100.0%) | 50 (100.0%) |
Real Estate & Mortgages in Southmont
Real Estate and Mortgage Overview in Southmont
| Characteristic | Without Mortgage | With Mortgage |
| Housing Units | 425 | 313 |
| Median Property Value | $207,100 | $230,300 |
| Median Household Income | $48,650 | $53 |
| Monthly Housing Costs | $430 | $0 |
| Real Estate Taxes | $950 | $0 |
Property Value by Mortgage Status in Southmont
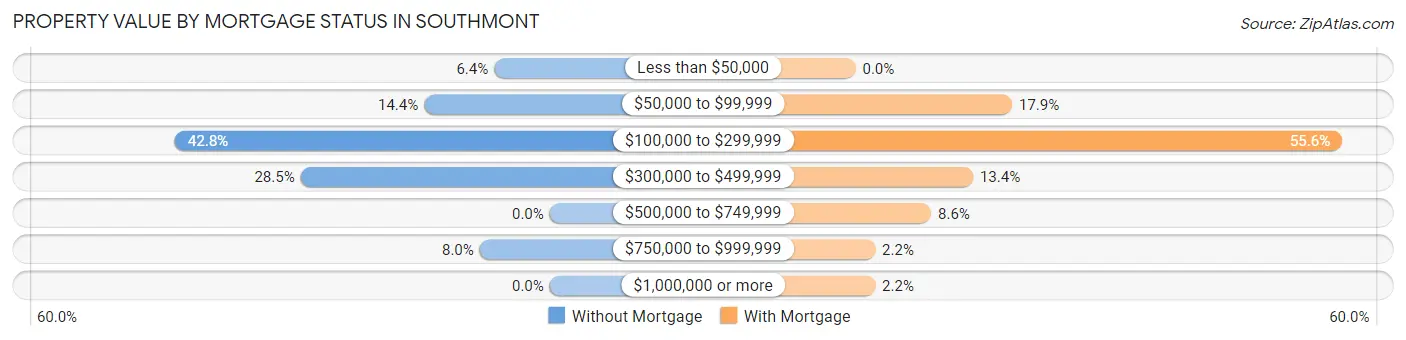
| Property Value | Without Mortgage | With Mortgage |
| Less than $50,000 | 27 (6.4%) | 0 (0.0%) |
| $50,000 to $99,999 | 61 (14.3%) | 56 (17.9%) |
| $100,000 to $299,999 | 182 (42.8%) | 174 (55.6%) |
| $300,000 to $499,999 | 121 (28.5%) | 42 (13.4%) |
| $500,000 to $749,999 | 0 (0.0%) | 27 (8.6%) |
| $750,000 to $999,999 | 34 (8.0%) | 7 (2.2%) |
| $1,000,000 or more | 0 (0.0%) | 7 (2.2%) |
| Total | 425 (100.0%) | 313 (100.0%) |
Household Income by Mortgage Status in Southmont
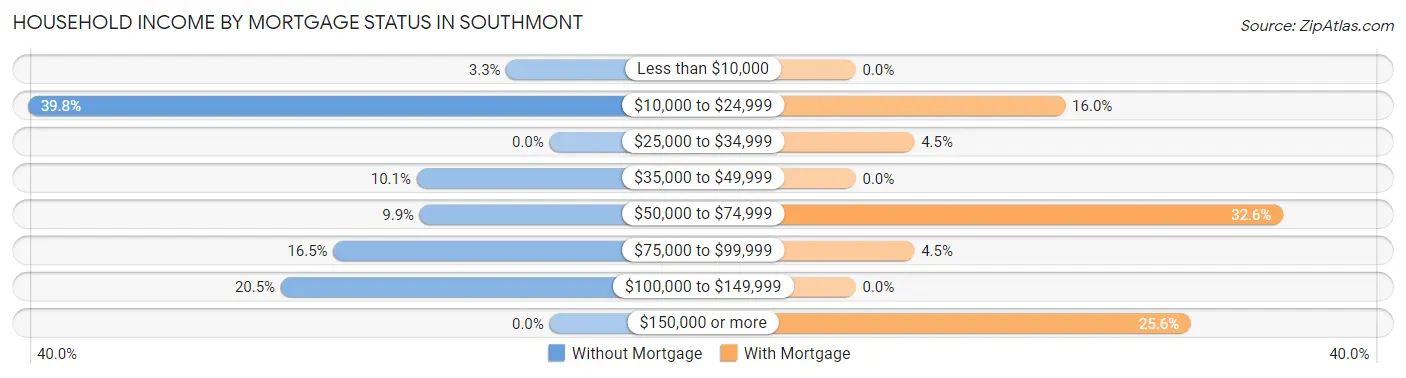
| Household Income | Without Mortgage | With Mortgage |
| Less than $10,000 | 14 (3.3%) | 0 (0.0%) |
| $10,000 to $24,999 | 169 (39.8%) | 50 (16.0%) |
| $25,000 to $34,999 | 0 (0.0%) | 14 (4.5%) |
| $35,000 to $49,999 | 43 (10.1%) | 0 (0.0%) |
| $50,000 to $74,999 | 42 (9.9%) | 102 (32.6%) |
| $75,000 to $99,999 | 70 (16.5%) | 14 (4.5%) |
| $100,000 to $149,999 | 87 (20.5%) | 0 (0.0%) |
| $150,000 or more | 0 (0.0%) | 80 (25.6%) |
| Total | 425 (100.0%) | 313 (100.0%) |
Property Value to Household Income Ratio in Southmont
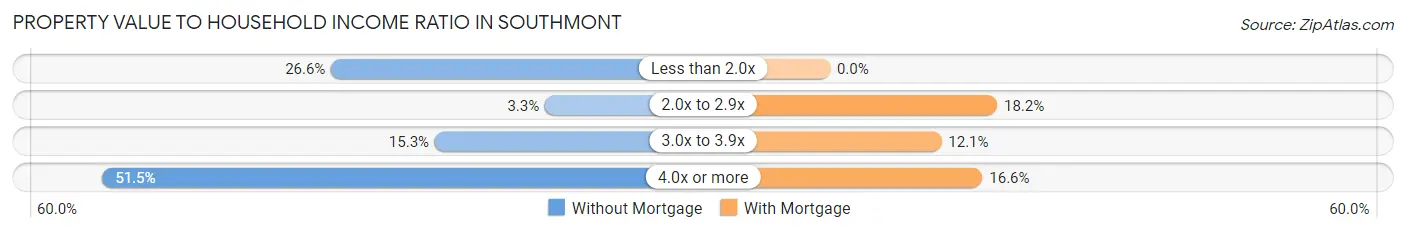
| Value-to-Income Ratio | Without Mortgage | With Mortgage |
| Less than 2.0x | 113 (26.6%) | 0 (0.0%) |
| 2.0x to 2.9x | 14 (3.3%) | 57 (18.2%) |
| 3.0x to 3.9x | 65 (15.3%) | 38 (12.1%) |
| 4.0x or more | 219 (51.5%) | 52 (16.6%) |
| Total | 425 (100.0%) | 313 (100.0%) |
Real Estate Taxes by Mortgage Status in Southmont
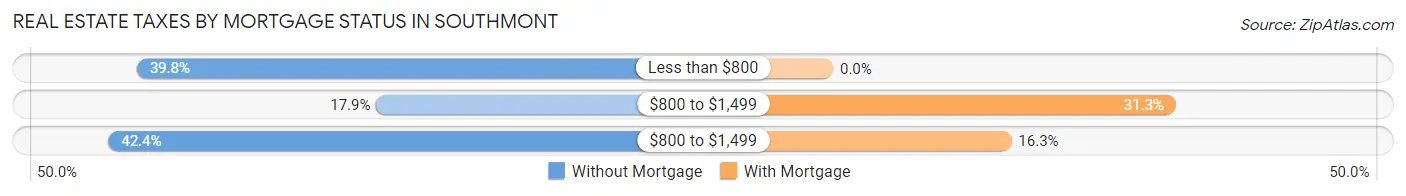
| Property Taxes | Without Mortgage | With Mortgage |
| Less than $800 | 169 (39.8%) | 0 (0.0%) |
| $800 to $1,499 | 76 (17.9%) | 98 (31.3%) |
| $800 to $1,499 | 180 (42.3%) | 51 (16.3%) |
| Total | 425 (100.0%) | 313 (100.0%) |
Health & Disability in Southmont
Health Insurance Coverage by Age in Southmont
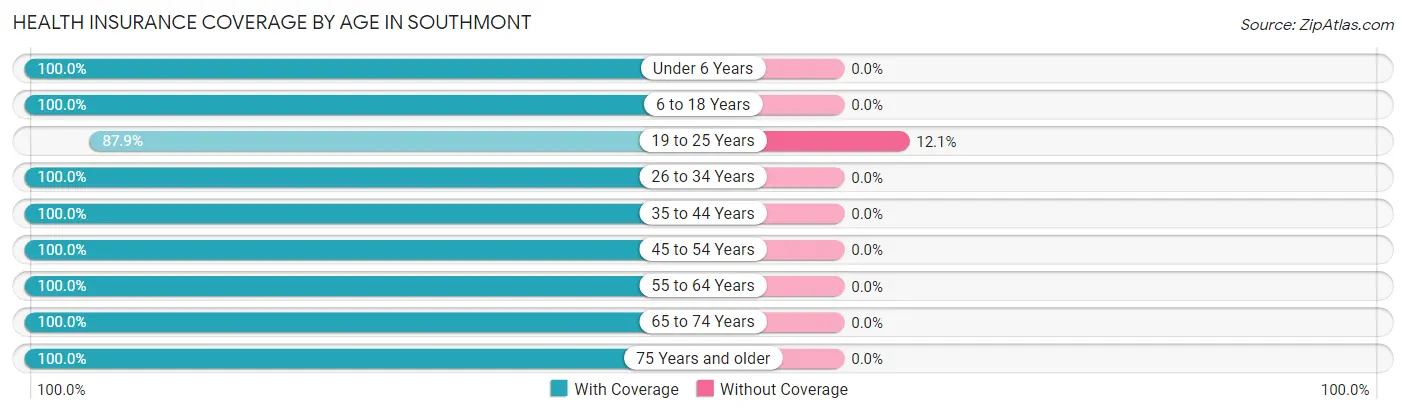
| Age Bracket | With Coverage | Without Coverage |
| Under 6 Years | 43 (100.0%) | 0 (0.0%) |
| 6 to 18 Years | 173 (100.0%) | 0 (0.0%) |
| 19 to 25 Years | 87 (87.9%) | 12 (12.1%) |
| 26 to 34 Years | 148 (100.0%) | 0 (0.0%) |
| 35 to 44 Years | 183 (100.0%) | 0 (0.0%) |
| 45 to 54 Years | 119 (100.0%) | 0 (0.0%) |
| 55 to 64 Years | 241 (100.0%) | 0 (0.0%) |
| 65 to 74 Years | 158 (100.0%) | 0 (0.0%) |
| 75 Years and older | 228 (100.0%) | 0 (0.0%) |
| Total | 1,380 (99.1%) | 12 (0.9%) |
Health Insurance Coverage by Citizenship Status in Southmont
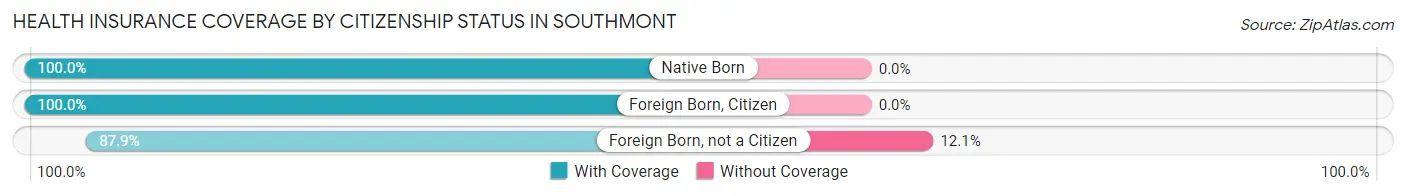
| Citizenship Status | With Coverage | Without Coverage |
| Native Born | 43 (100.0%) | 0 (0.0%) |
| Foreign Born, Citizen | 173 (100.0%) | 0 (0.0%) |
| Foreign Born, not a Citizen | 87 (87.9%) | 12 (12.1%) |
Health Insurance Coverage by Household Income in Southmont
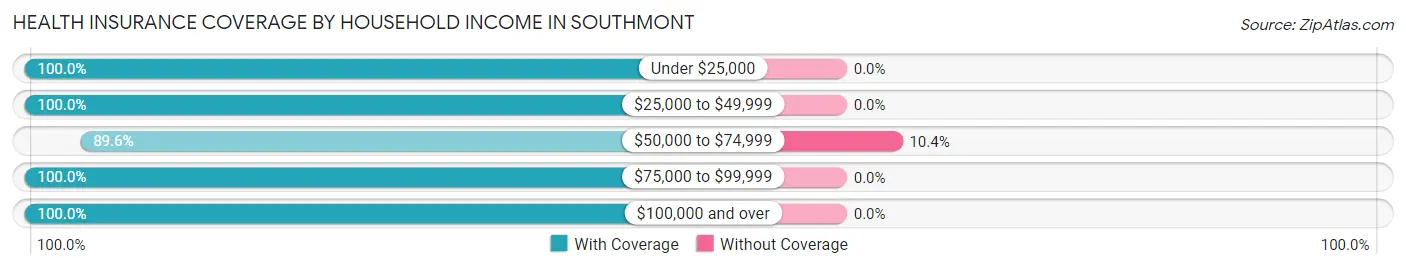
| Household Income | With Coverage | Without Coverage |
| Under $25,000 | 351 (100.0%) | 0 (0.0%) |
| $25,000 to $49,999 | 162 (100.0%) | 0 (0.0%) |
| $50,000 to $74,999 | 103 (89.6%) | 12 (10.4%) |
| $75,000 to $99,999 | 222 (100.0%) | 0 (0.0%) |
| $100,000 and over | 542 (100.0%) | 0 (0.0%) |
Public vs Private Health Insurance Coverage by Age in Southmont
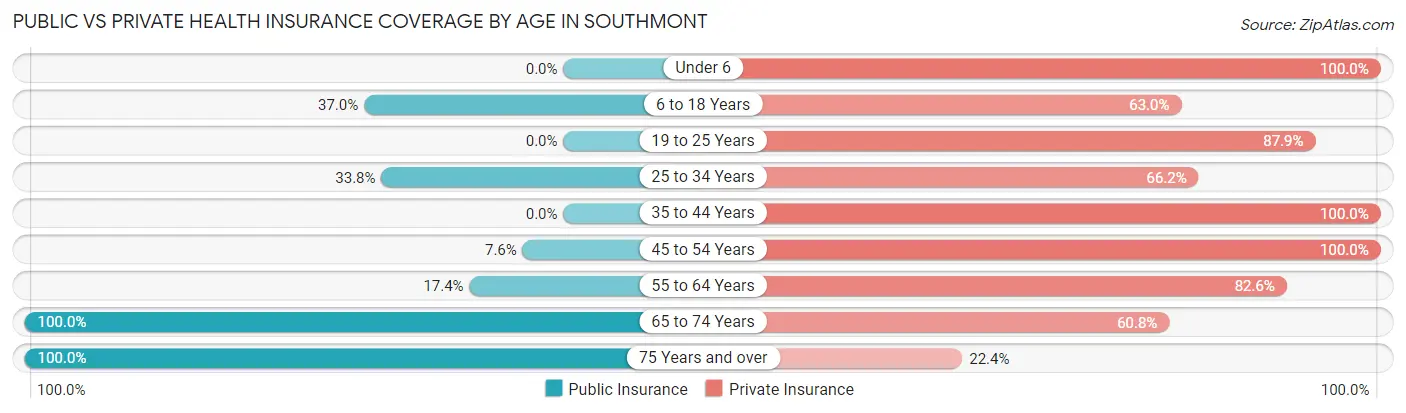
| Age Bracket | Public Insurance | Private Insurance |
| Under 6 | 0 (0.0%) | 43 (100.0%) |
| 6 to 18 Years | 64 (37.0%) | 109 (63.0%) |
| 19 to 25 Years | 0 (0.0%) | 87 (87.9%) |
| 25 to 34 Years | 50 (33.8%) | 98 (66.2%) |
| 35 to 44 Years | 0 (0.0%) | 183 (100.0%) |
| 45 to 54 Years | 9 (7.6%) | 119 (100.0%) |
| 55 to 64 Years | 42 (17.4%) | 199 (82.6%) |
| 65 to 74 Years | 158 (100.0%) | 96 (60.8%) |
| 75 Years and over | 228 (100.0%) | 51 (22.4%) |
| Total | 551 (39.6%) | 985 (70.8%) |
Disability Status by Sex by Age in Southmont
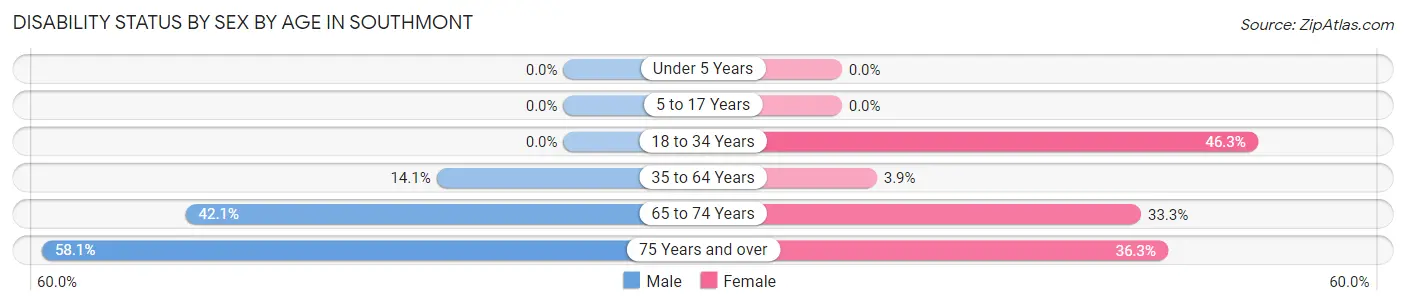
| Age Bracket | Male | Female |
| Under 5 Years | 0 (0.0%) | 0 (0.0%) |
| 5 to 17 Years | 0 (0.0%) | 0 (0.0%) |
| 18 to 34 Years | 0 (0.0%) | 50 (46.3%) |
| 35 to 64 Years | 26 (14.1%) | 14 (3.9%) |
| 65 to 74 Years | 45 (42.1%) | 17 (33.3%) |
| 75 Years and over | 54 (58.1%) | 49 (36.3%) |
Disability Class by Sex by Age in Southmont
Disability Class: Hearing Difficulty
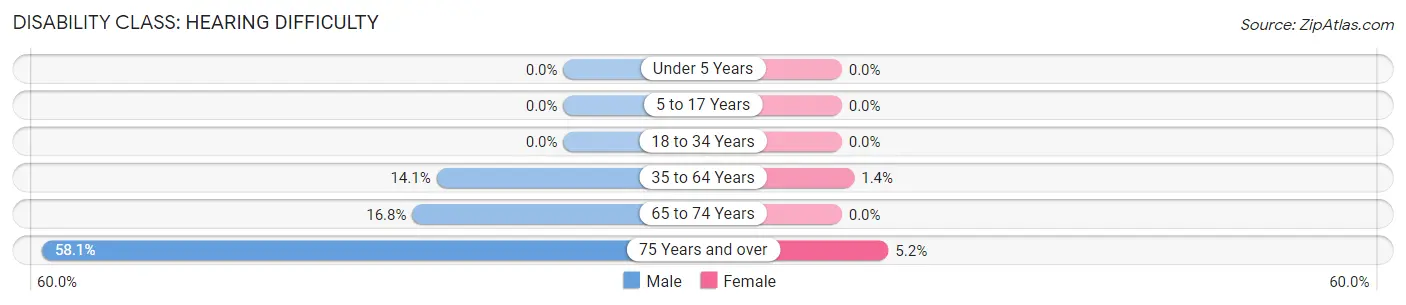
| Age Bracket | Male | Female |
| Under 5 Years | 0 (0.0%) | 0 (0.0%) |
| 5 to 17 Years | 0 (0.0%) | 0 (0.0%) |
| 18 to 34 Years | 0 (0.0%) | 0 (0.0%) |
| 35 to 64 Years | 26 (14.1%) | 5 (1.4%) |
| 65 to 74 Years | 18 (16.8%) | 0 (0.0%) |
| 75 Years and over | 54 (58.1%) | 7 (5.2%) |
Disability Class: Vision Difficulty
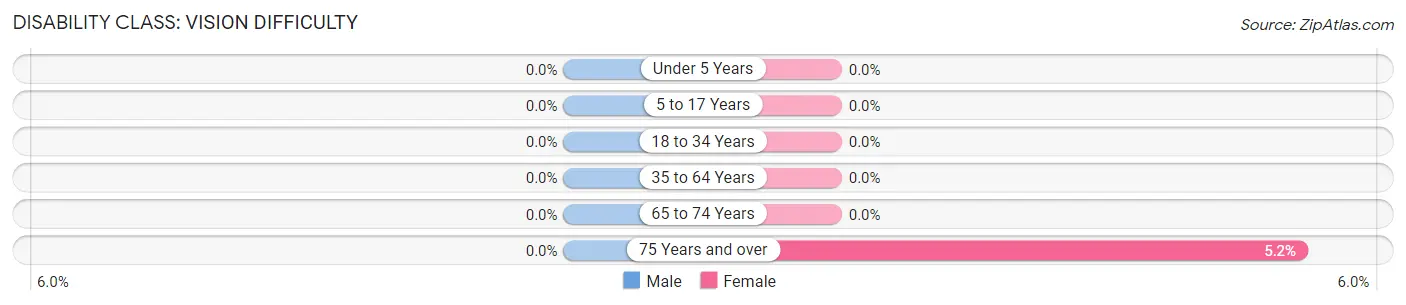
| Age Bracket | Male | Female |
| Under 5 Years | 0 (0.0%) | 0 (0.0%) |
| 5 to 17 Years | 0 (0.0%) | 0 (0.0%) |
| 18 to 34 Years | 0 (0.0%) | 0 (0.0%) |
| 35 to 64 Years | 0 (0.0%) | 0 (0.0%) |
| 65 to 74 Years | 0 (0.0%) | 0 (0.0%) |
| 75 Years and over | 0 (0.0%) | 7 (5.2%) |
Disability Class: Cognitive Difficulty
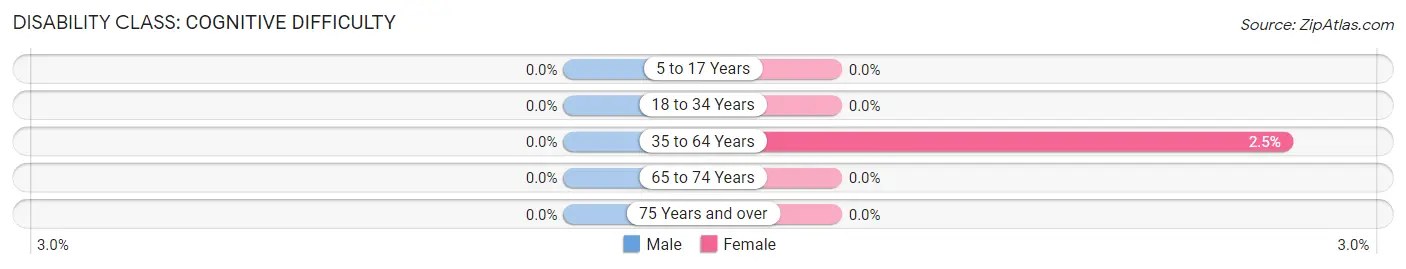
| Age Bracket | Male | Female |
| 5 to 17 Years | 0 (0.0%) | 0 (0.0%) |
| 18 to 34 Years | 0 (0.0%) | 0 (0.0%) |
| 35 to 64 Years | 0 (0.0%) | 9 (2.5%) |
| 65 to 74 Years | 0 (0.0%) | 0 (0.0%) |
| 75 Years and over | 0 (0.0%) | 0 (0.0%) |
Disability Class: Ambulatory Difficulty
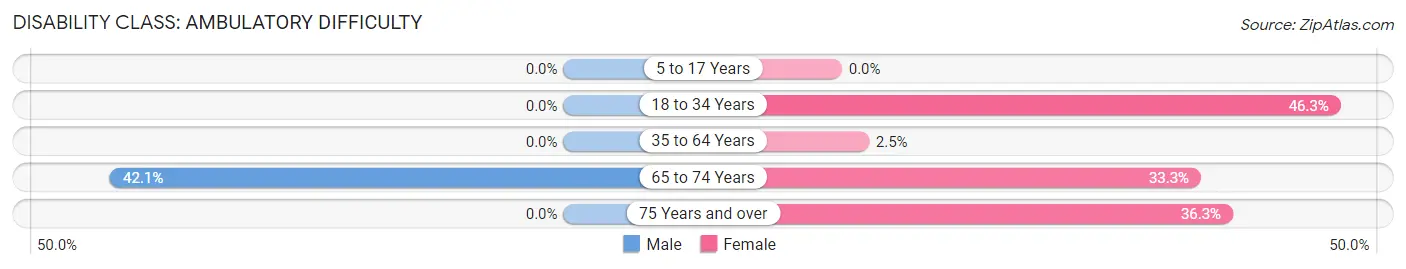
| Age Bracket | Male | Female |
| 5 to 17 Years | 0 (0.0%) | 0 (0.0%) |
| 18 to 34 Years | 0 (0.0%) | 50 (46.3%) |
| 35 to 64 Years | 0 (0.0%) | 9 (2.5%) |
| 65 to 74 Years | 45 (42.1%) | 17 (33.3%) |
| 75 Years and over | 0 (0.0%) | 49 (36.3%) |
Disability Class: Self-Care Difficulty
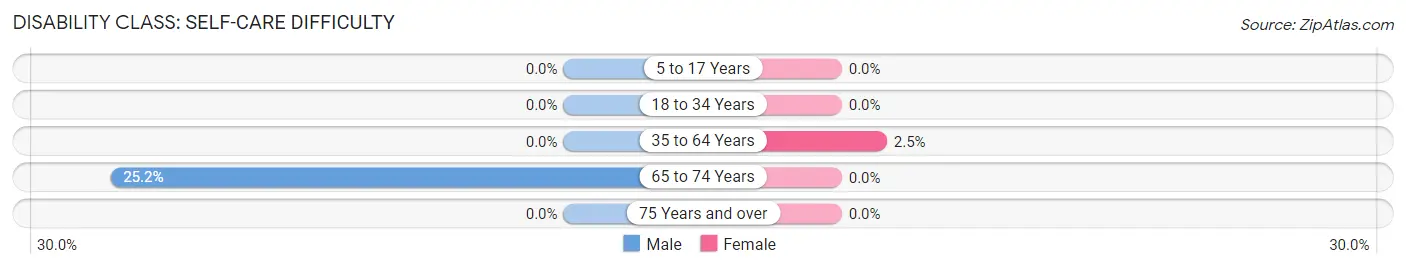
| Age Bracket | Male | Female |
| 5 to 17 Years | 0 (0.0%) | 0 (0.0%) |
| 18 to 34 Years | 0 (0.0%) | 0 (0.0%) |
| 35 to 64 Years | 0 (0.0%) | 9 (2.5%) |
| 65 to 74 Years | 27 (25.2%) | 0 (0.0%) |
| 75 Years and over | 0 (0.0%) | 0 (0.0%) |
Technology Access in Southmont
Computing Device Access in Southmont
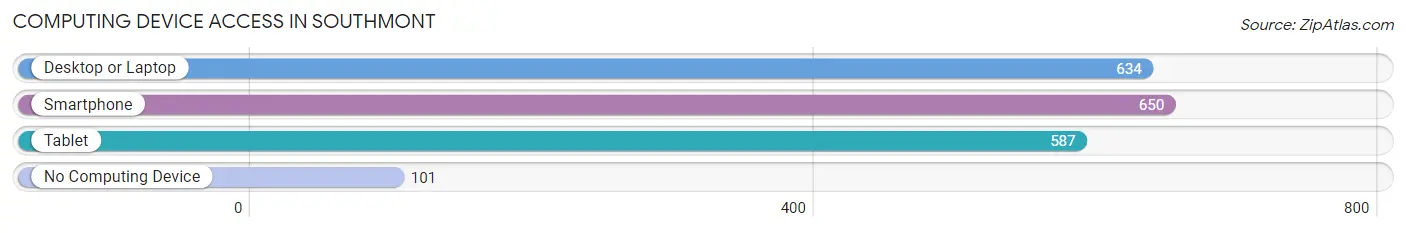
| Device Type | # Households | % Households |
| Desktop or Laptop | 634 | 80.5% |
| Smartphone | 650 | 82.5% |
| Tablet | 587 | 74.5% |
| No Computing Device | 101 | 12.8% |
| Total | 788 | 100.0% |
Internet Access in Southmont
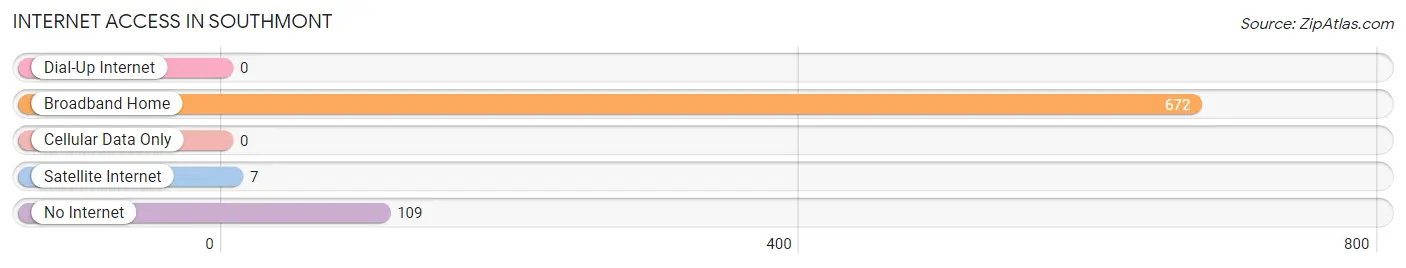
| Internet Type | # Households | % Households |
| Dial-Up Internet | 0 | 0.0% |
| Broadband Home | 672 | 85.3% |
| Cellular Data Only | 0 | 0.0% |
| Satellite Internet | 7 | 0.9% |
| No Internet | 109 | 13.8% |
| Total | 788 | 100.0% |
Southmont Summary
Montgomery County, North Carolina is home to the small town of Southmont, located in the foothills of the Blue Ridge Mountains. The town is situated in the Piedmont region of the state, and is located approximately 20 miles northeast of the city of Winston-Salem. Southmont is a small, rural community with a population of just over 1,000 people, according to the 2010 census.
History
Southmont was first settled in the late 1700s by a group of German immigrants. The town was originally known as “New Germany” and was located in the area now known as Southmont. The town was officially incorporated in 1891 and was named after the nearby South Mountain. The town was a small farming community for many years, but in the early 1900s, the town began to grow and develop. The town was home to several businesses, including a cotton mill, a furniture factory, and a brickyard.
Geography
Southmont is located in the foothills of the Blue Ridge Mountains in the Piedmont region of North Carolina. The town is situated in the Yadkin Valley, which is known for its rolling hills and lush forests. The town is located approximately 20 miles northeast of Winston-Salem and is bordered by the towns of Denton, East Bend, and Boonville. The town is situated at an elevation of 890 feet above sea level.
Economy
Southmont’s economy is largely based on agriculture and tourism. The town is home to several farms, which produce a variety of crops, including corn, soybeans, and tobacco. The town is also home to several wineries, which attract tourists from all over the state. In addition, the town is home to several small businesses, including restaurants, shops, and a hardware store.
Demographics
According to the 2010 census, Southmont had a population of 1,072 people. The town is predominantly white, with a population that is 94.3% white, 2.2% African American, 0.7% Hispanic, and 0.7% Asian. The median household income in the town is $37,500, and the median age is 43. The town is home to several churches, including Baptist, Methodist, and Presbyterian.
Southmont is a small, rural town with a rich history and a strong sense of community. The town is home to several farms and businesses, and is a popular destination for tourists. The town is predominantly white, with a median household income of $37,500 and a median age of 43. Southmont is a great place to live, work, and raise a family.
Common Questions
What is Per Capita Income in Southmont?
Per Capita income in Southmont is $36,397.
What is the Median Family Income in Southmont?
Median Family Income in Southmont is $84,347.
What is the Median Household income in Southmont?
Median Household Income in Southmont is $49,000.
What is Income or Wage Gap in Southmont?
Income or Wage Gap in Southmont is 41.0%.
Women in Southmont earn 59.0 cents for every dollar earned by a man.
What is Inequality or Gini Index in Southmont?
Inequality or Gini Index in Southmont is 0.46.
What is the Total Population of Southmont?
Total Population of Southmont is 1,392.
What is the Total Male Population of Southmont?
Total Male Population of Southmont is 553.
What is the Total Female Population of Southmont?
Total Female Population of Southmont is 839.
What is the Ratio of Males per 100 Females in Southmont?
There are 65.91 Males per 100 Females in Southmont.
What is the Ratio of Females per 100 Males in Southmont?
There are 151.72 Females per 100 Males in Southmont.
What is the Median Population Age in Southmont?
Median Population Age in Southmont is 50.7 Years.
What is the Average Family Size in Southmont
Average Family Size in Southmont is 2.5 People.
What is the Average Household Size in Southmont
Average Household Size in Southmont is 1.8 People.
How Large is the Labor Force in Southmont?
There are 532 People in the Labor Forcein in Southmont.
What is the Percentage of People in the Labor Force in Southmont?
45.2% of People are in the Labor Force in Southmont.