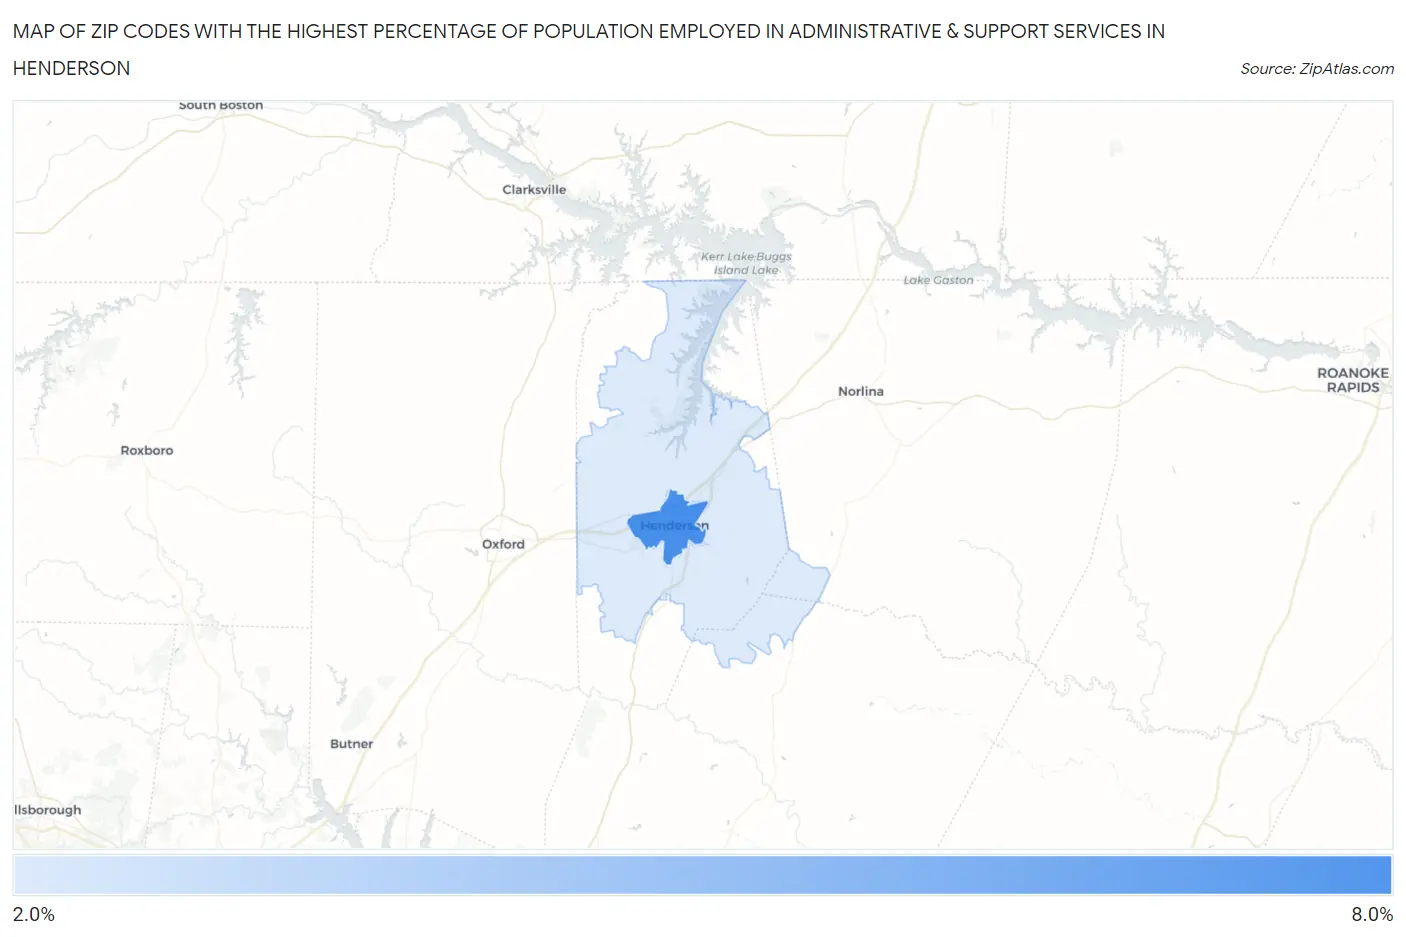
Zip Codes with the Highest Percentage of Population Employed in Administrative & Support Services in Henderson, NC
RELATED REPORTS & OPTIONS
Administrative & Support Services
Henderson
Compare Zip Codes
Map of Zip Codes with the Highest Percentage of Population Employed in Administrative & Support Services in Henderson
2.7%
6.9%
Zip Codes with the Highest Percentage of Population Employed in Administrative & Support Services in Henderson, NC
| Zip Code | % Employed | vs State | vs National | |
| 1. | 27536 | 6.9% | 4.3%(+2.64)#100 | 4.1%(+2.76)#3,333 |
| 2. | 27537 | 2.7% | 4.3%(-1.56)#536 | 4.1%(-1.44)#17,045 |
1
Common Questions
What are the Top Zip Codes with the Highest Percentage of Population Employed in Administrative & Support Services in Henderson, NC?
Top Zip Codes with the Highest Percentage of Population Employed in Administrative & Support Services in Henderson, NC are:
What zip code has the Highest Percentage of Population Employed in Administrative & Support Services in Henderson, NC?
27536 has the Highest Percentage of Population Employed in Administrative & Support Services in Henderson, NC with 6.9%.
What is the Percentage of Population Employed in Administrative & Support Services in Henderson, NC?
Percentage of Population Employed in Administrative & Support Services in Henderson is 6.2%.
What is the Percentage of Population Employed in Administrative & Support Services in North Carolina?
Percentage of Population Employed in Administrative & Support Services in North Carolina is 4.3%.
What is the Percentage of Population Employed in Administrative & Support Services in the United States?
Percentage of Population Employed in Administrative & Support Services in the United States is 4.1%.