Avon, NC Map & Demographics
Avon Map
Avon Overview
$30,566
PER CAPITA INCOME
$56,136
AVG FAMILY INCOME
$33,750
AVG HOUSEHOLD INCOME
35.0%
WAGE / INCOME GAP [ % ]
65.0¢/ $1
WAGE / INCOME GAP [ $ ]
0.28
INEQUALITY / GINI INDEX
370
TOTAL POPULATION
197
MALE POPULATION
173
FEMALE POPULATION
113.87
MALES / 100 FEMALES
87.82
FEMALES / 100 MALES
57.0
MEDIAN AGE
2.6
AVG FAMILY SIZE
1.2
AVG HOUSEHOLD SIZE
210
LABOR FORCE [ PEOPLE ]
56.8%
PERCENT IN LABOR FORCE
32.9%
UNEMPLOYMENT RATE
Avon Zip Codes
Avon Area Codes
Income in Avon
Income Overview in Avon
Per Capita Income in Avon is $30,566, while median incomes of families and households are $56,136 and $33,750 respectively.
| Characteristic | Number | Measure |
| Per Capita Income | 370 | $30,566 |
| Median Family Income | 28 | $56,136 |
| Mean Family Income | 28 | $64,496 |
| Median Household Income | 298 | $33,750 |
| Mean Household Income | 298 | $36,840 |
| Income Deficit | 28 | $0 |
| Wage / Income Gap (%) | 370 | 34.98% |
| Wage / Income Gap ($) | 370 | 65.02¢ per $1 |
| Gini / Inequality Index | 370 | 0.28 |
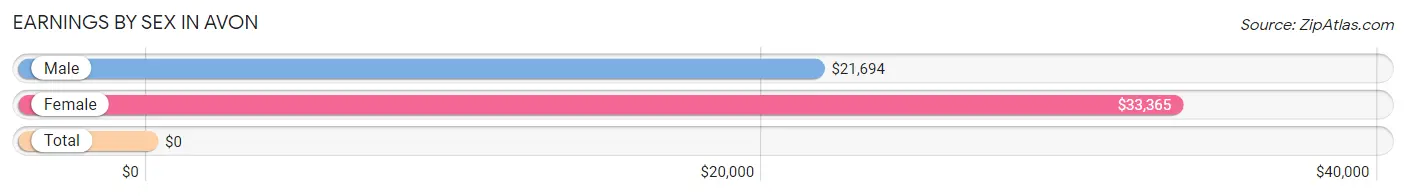
Earnings by Sex in Avon
| Sex | Number | Average Earnings |
| Male | 152 (63.9%) | $21,694 |
| Female | 86 (36.1%) | $33,365 |
| Total | 238 (100.0%) | $0 |
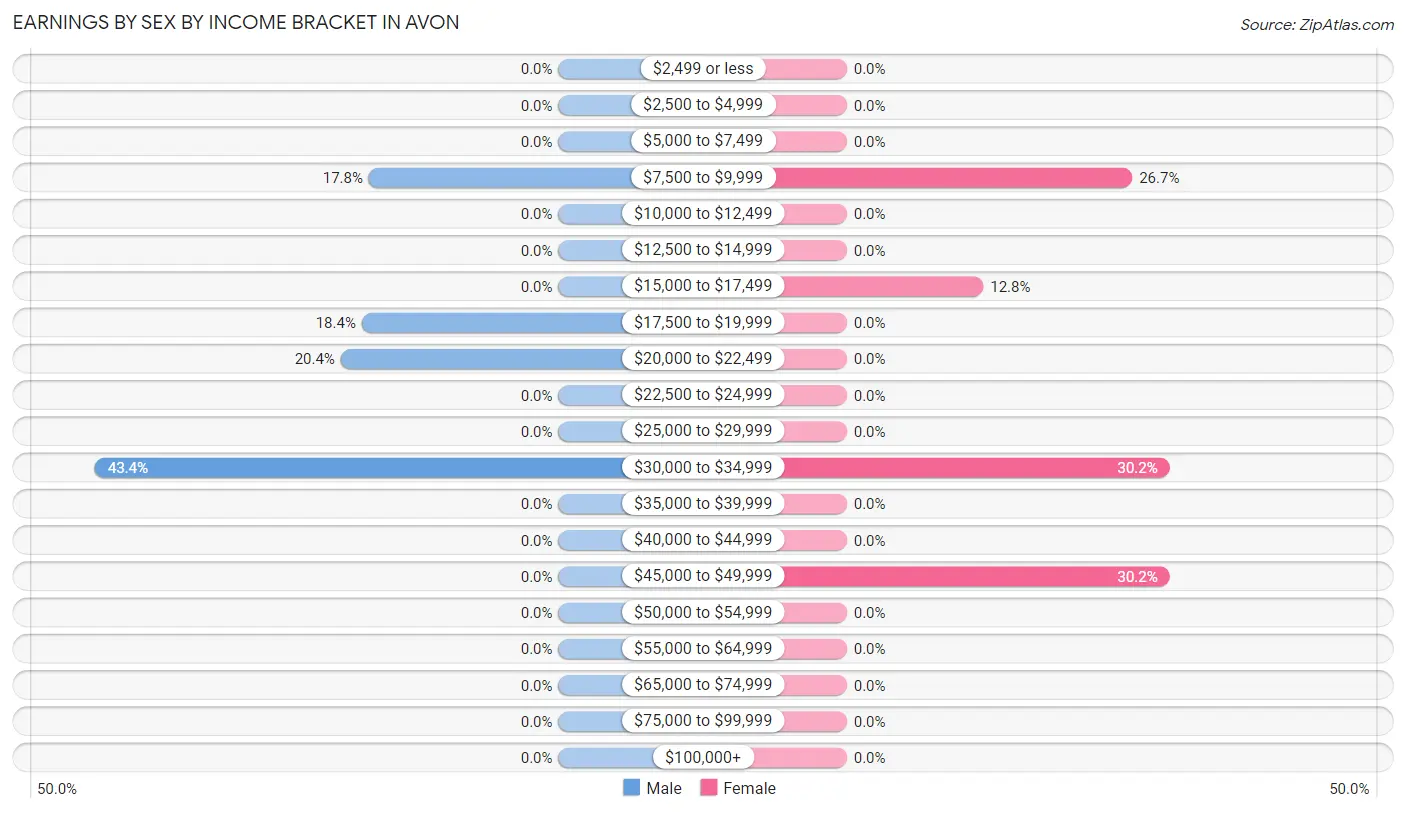
Earnings by Sex by Income Bracket in Avon
The most common earnings brackets in Avon are $30,000 to $34,999 for men (66 | 43.4%) and $30,000 to $34,999 for women (26 | 30.2%).
| Income | Male | Female |
| $2,499 or less | 0 (0.0%) | 0 (0.0%) |
| $2,500 to $4,999 | 0 (0.0%) | 0 (0.0%) |
| $5,000 to $7,499 | 0 (0.0%) | 0 (0.0%) |
| $7,500 to $9,999 | 27 (17.8%) | 23 (26.7%) |
| $10,000 to $12,499 | 0 (0.0%) | 0 (0.0%) |
| $12,500 to $14,999 | 0 (0.0%) | 0 (0.0%) |
| $15,000 to $17,499 | 0 (0.0%) | 11 (12.8%) |
| $17,500 to $19,999 | 28 (18.4%) | 0 (0.0%) |
| $20,000 to $22,499 | 31 (20.4%) | 0 (0.0%) |
| $22,500 to $24,999 | 0 (0.0%) | 0 (0.0%) |
| $25,000 to $29,999 | 0 (0.0%) | 0 (0.0%) |
| $30,000 to $34,999 | 66 (43.4%) | 26 (30.2%) |
| $35,000 to $39,999 | 0 (0.0%) | 0 (0.0%) |
| $40,000 to $44,999 | 0 (0.0%) | 0 (0.0%) |
| $45,000 to $49,999 | 0 (0.0%) | 26 (30.2%) |
| $50,000 to $54,999 | 0 (0.0%) | 0 (0.0%) |
| $55,000 to $64,999 | 0 (0.0%) | 0 (0.0%) |
| $65,000 to $74,999 | 0 (0.0%) | 0 (0.0%) |
| $75,000 to $99,999 | 0 (0.0%) | 0 (0.0%) |
| $100,000+ | 0 (0.0%) | 0 (0.0%) |
| Total | 152 (100.0%) | 86 (100.0%) |
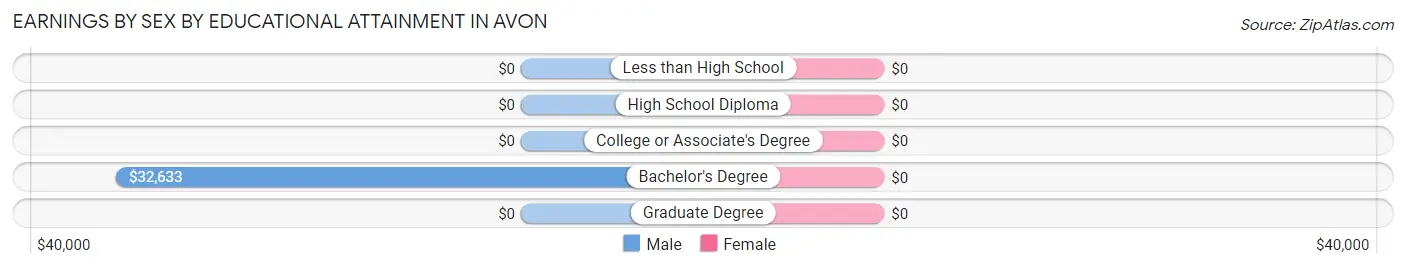
Earnings by Sex by Educational Attainment in Avon
| Educational Attainment | Male Income | Female Income |
| Less than High School | - | - |
| High School Diploma | - | - |
| College or Associate's Degree | - | - |
| Bachelor's Degree | $32,633 | $0 |
| Graduate Degree | - | - |
| Total | $21,694 | $33,365 |
Family Income in Avon
Family Income Brackets in Avon
According to the Avon family income data, there are 20 families falling into the $50,000 to $74,999 income range, which is the most common income bracket and makes up 71.4% of all families.
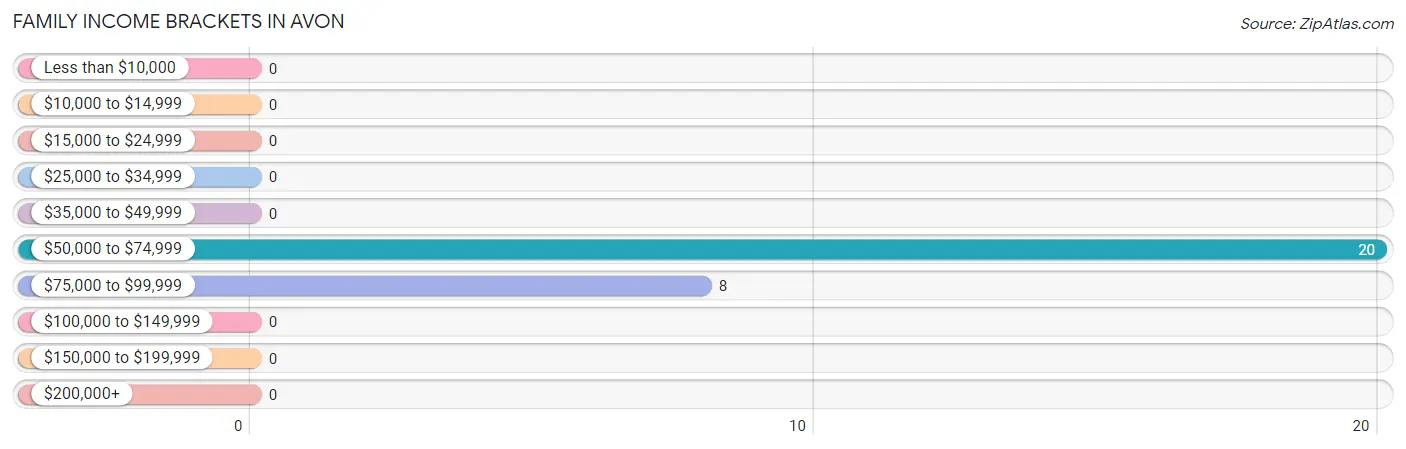
| Income Bracket | # Families | % Families |
| Less than $10,000 | 0 | 0.0% |
| $10,000 to $14,999 | 0 | 0.0% |
| $15,000 to $24,999 | 0 | 0.0% |
| $25,000 to $34,999 | 0 | 0.0% |
| $35,000 to $49,999 | 0 | 0.0% |
| $50,000 to $74,999 | 20 | 71.4% |
| $75,000 to $99,999 | 8 | 28.6% |
| $100,000 to $149,999 | 0 | 0.0% |
| $150,000 to $199,999 | 0 | 0.0% |
| $200,000+ | 0 | 0.0% |
Family Income by Famaliy Size in Avon
2-person families (28 | 100.0%) account for the highest median family income in Avon with $56,136 per family, while 2-person families (28 | 100.0%) have the highest median income of $28,068 per family member.
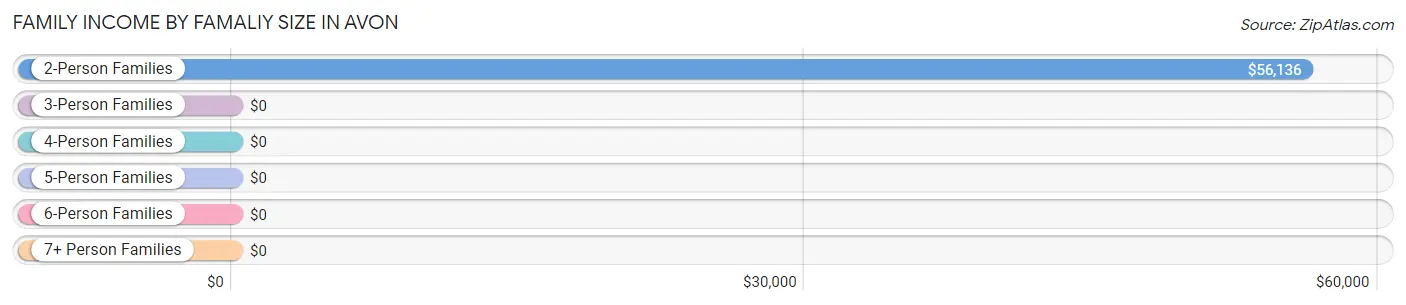
| Income Bracket | # Families | Median Income |
| 2-Person Families | 28 (100.0%) | $56,136 |
| 3-Person Families | 0 (0.0%) | $0 |
| 4-Person Families | 0 (0.0%) | $0 |
| 5-Person Families | 0 (0.0%) | $0 |
| 6-Person Families | 0 (0.0%) | $0 |
| 7+ Person Families | 0 (0.0%) | $0 |
| Total | 28 (100.0%) | $56,136 |
Family Income by Number of Earners in Avon
| Number of Earners | # Families | Median Income |
| No Earners | 17 (60.7%) | $0 |
| 1 Earner | 11 (39.3%) | $0 |
| 2 Earners | 0 (0.0%) | $0 |
| 3+ Earners | 0 (0.0%) | $0 |
| Total | 28 (100.0%) | $56,136 |
Household Income in Avon
Household Income Brackets in Avon
With 120 households falling in the category, the $25,000 to $34,999 income range is the most frequent in Avon, accounting for 40.3% of all households.
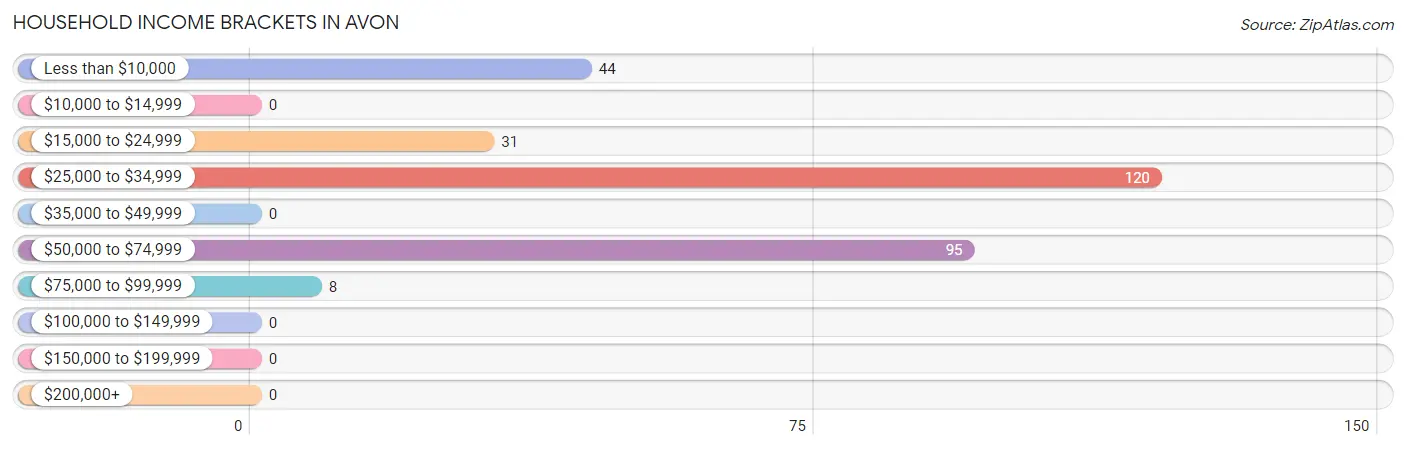
| Income Bracket | # Households | % Households |
| Less than $10,000 | 44 | 14.8% |
| $10,000 to $14,999 | 0 | 0.0% |
| $15,000 to $24,999 | 31 | 10.4% |
| $25,000 to $34,999 | 120 | 40.3% |
| $35,000 to $49,999 | 0 | 0.0% |
| $50,000 to $74,999 | 95 | 31.9% |
| $75,000 to $99,999 | 8 | 2.7% |
| $100,000 to $149,999 | 0 | 0.0% |
| $150,000 to $199,999 | 0 | 0.0% |
| $200,000+ | 0 | 0.0% |
Household Income by Householder Age in Avon
The median household income in Avon is $33,750, with the highest median household income of $55,979 found in the 65+ years age bracket for the primary householder. A total of 89 households (29.9%) fall into this category.
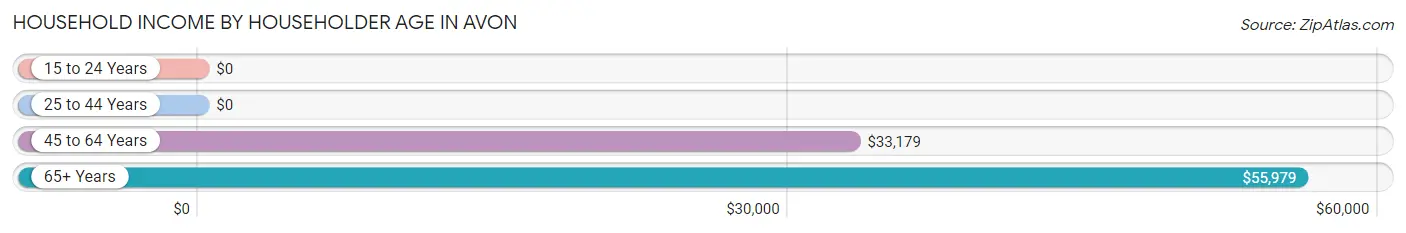
| Income Bracket | # Households | Median Income |
| 15 to 24 Years | 0 (0.0%) | $0 |
| 25 to 44 Years | 57 (19.1%) | $0 |
| 45 to 64 Years | 152 (51.0%) | $33,179 |
| 65+ Years | 89 (29.9%) | $55,979 |
| Total | 298 (100.0%) | $33,750 |
Poverty in Avon
Income Below Poverty by Sex and Age in Avon
With 13.7% poverty level for males and 25.4% for females among the residents of Avon, 35 to 44 year old males and 75 year old and over females are the most vulnerable to poverty, with 27 males (100.0%) and 21 females (100.0%) in their respective age groups living below the poverty level.
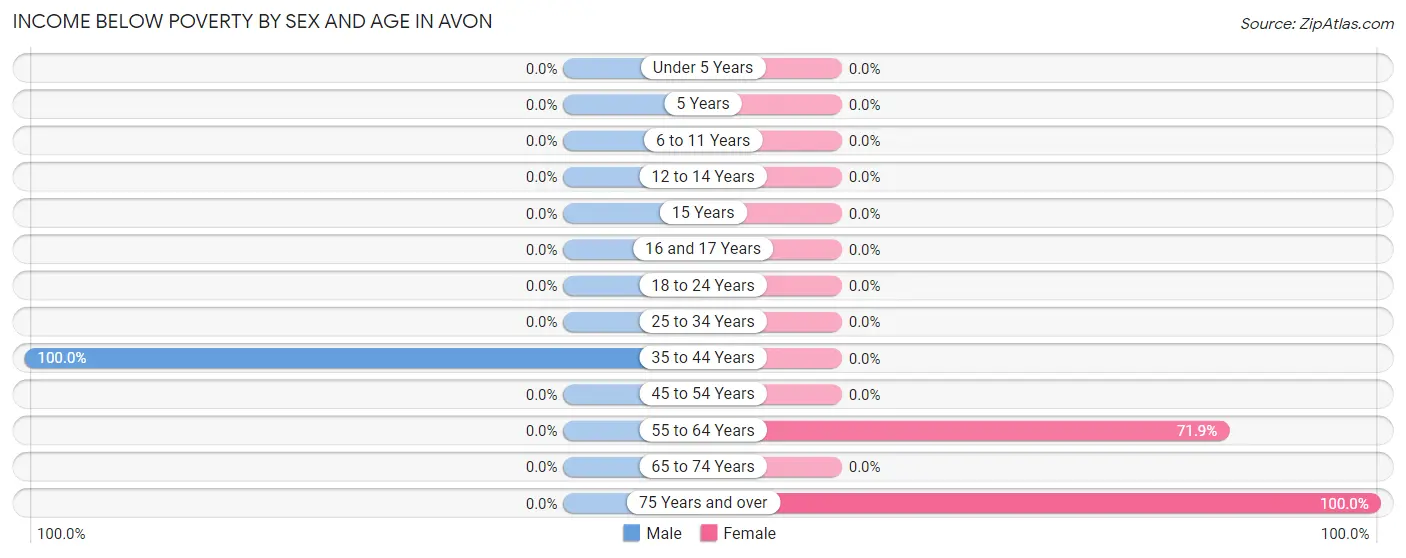
| Age Bracket | Male | Female |
| Under 5 Years | 0 (0.0%) | 0 (0.0%) |
| 5 Years | 0 (0.0%) | 0 (0.0%) |
| 6 to 11 Years | 0 (0.0%) | 0 (0.0%) |
| 12 to 14 Years | 0 (0.0%) | 0 (0.0%) |
| 15 Years | 0 (0.0%) | 0 (0.0%) |
| 16 and 17 Years | 0 (0.0%) | 0 (0.0%) |
| 18 to 24 Years | 0 (0.0%) | 0 (0.0%) |
| 25 to 34 Years | 0 (0.0%) | 0 (0.0%) |
| 35 to 44 Years | 27 (100.0%) | 0 (0.0%) |
| 45 to 54 Years | 0 (0.0%) | 0 (0.0%) |
| 55 to 64 Years | 0 (0.0%) | 23 (71.9%) |
| 65 to 74 Years | 0 (0.0%) | 0 (0.0%) |
| 75 Years and over | 0 (0.0%) | 21 (100.0%) |
| Total | 27 (13.7%) | 44 (25.4%) |
Income Above Poverty by Sex and Age in Avon
According to the poverty statistics in Avon, males aged 25 to 34 years and females aged 25 to 34 years are the age groups that are most secure financially, with 100.0% of males and 100.0% of females in these age groups living above the poverty line.
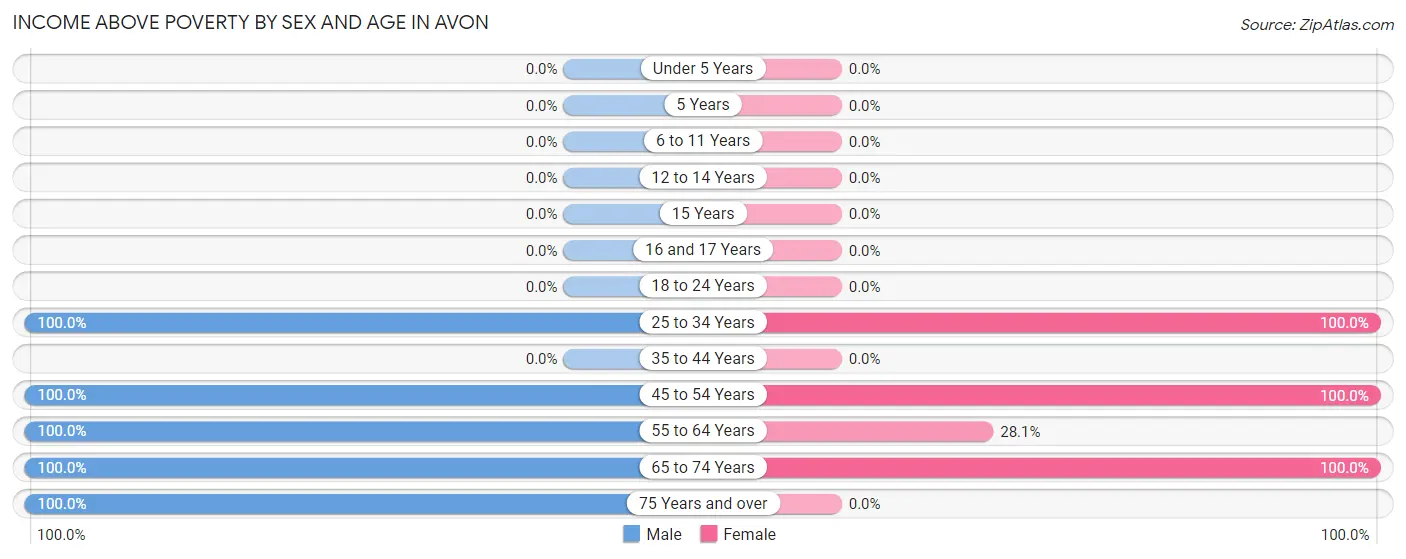
| Age Bracket | Male | Female |
| Under 5 Years | 0 (0.0%) | 0 (0.0%) |
| 5 Years | 0 (0.0%) | 0 (0.0%) |
| 6 to 11 Years | 0 (0.0%) | 0 (0.0%) |
| 12 to 14 Years | 0 (0.0%) | 0 (0.0%) |
| 15 Years | 0 (0.0%) | 0 (0.0%) |
| 16 and 17 Years | 0 (0.0%) | 0 (0.0%) |
| 18 to 24 Years | 0 (0.0%) | 0 (0.0%) |
| 25 to 34 Years | 31 (100.0%) | 26 (100.0%) |
| 35 to 44 Years | 0 (0.0%) | 0 (0.0%) |
| 45 to 54 Years | 66 (100.0%) | 26 (100.0%) |
| 55 to 64 Years | 28 (100.0%) | 9 (28.1%) |
| 65 to 74 Years | 37 (100.0%) | 68 (100.0%) |
| 75 Years and over | 8 (100.0%) | 0 (0.0%) |
| Total | 170 (86.3%) | 129 (74.6%) |
Income Below Poverty Among Married-Couple Families in Avon
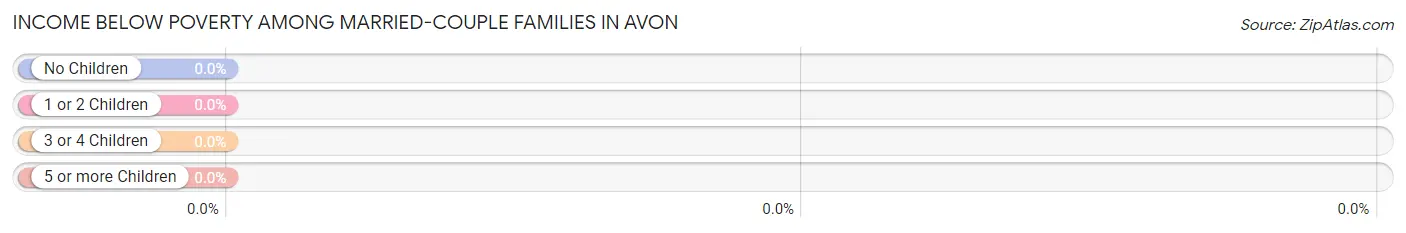
| Children | Above Poverty | Below Poverty |
| No Children | 17 (100.0%) | 0 (0.0%) |
| 1 or 2 Children | 0 (0.0%) | 0 (0.0%) |
| 3 or 4 Children | 0 (0.0%) | 0 (0.0%) |
| 5 or more Children | 0 (0.0%) | 0 (0.0%) |
| Total | 17 (100.0%) | 0 (0.0%) |
Income Below Poverty Among Single-Parent Households in Avon
| Children | Single Father | Single Mother |
| No Children | 0 (0.0%) | 0 (0.0%) |
| 1 or 2 Children | 0 (0.0%) | 0 (0.0%) |
| 3 or 4 Children | 0 (0.0%) | 0 (0.0%) |
| 5 or more Children | 0 (0.0%) | 0 (0.0%) |
| Total | 0 (0.0%) | 0 (0.0%) |
Income Below Poverty Among Married-Couple vs Single-Parent Households in Avon
| Children | Married-Couple Families | Single-Parent Households |
| No Children | 0 (0.0%) | 0 (0.0%) |
| 1 or 2 Children | 0 (0.0%) | 0 (0.0%) |
| 3 or 4 Children | 0 (0.0%) | 0 (0.0%) |
| 5 or more Children | 0 (0.0%) | 0 (0.0%) |
| Total | 0 (0.0%) | 0 (0.0%) |
Race in Avon
The most populous races in Avon are White / Caucasian (370 | 100.0%), and Hispanic or Latino (37 | 10.0%).
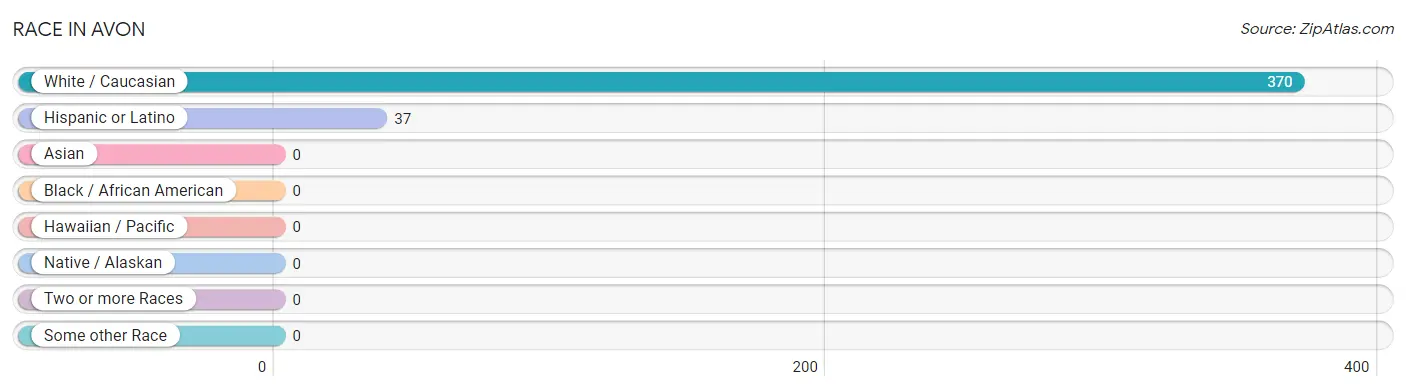
| Race | # Population | % Population |
| Asian | 0 | 0.0% |
| Black / African American | 0 | 0.0% |
| Hawaiian / Pacific | 0 | 0.0% |
| Hispanic or Latino | 37 | 10.0% |
| Native / Alaskan | 0 | 0.0% |
| White / Caucasian | 370 | 100.0% |
| Two or more Races | 0 | 0.0% |
| Some other Race | 0 | 0.0% |
| Total | 370 | 100.0% |
Ancestry in Avon
The most populous ancestries reported in Avon are Irish (108 | 29.2%), English (97 | 26.2%), German (91 | 24.6%), Central American (37 | 10.0%), and Panamanian (37 | 10.0%), together accounting for 100.0% of all Avon residents.
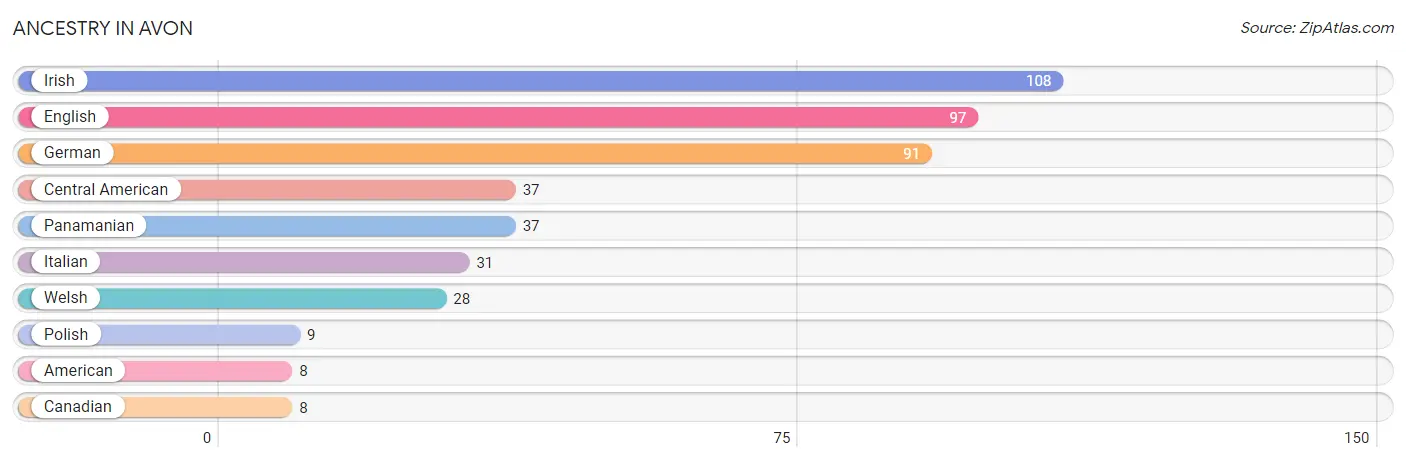
| Ancestry | # Population | % Population |
| American | 8 | 2.2% |
| Canadian | 8 | 2.2% |
| Central American | 37 | 10.0% |
| English | 97 | 26.2% |
| German | 91 | 24.6% |
| Irish | 108 | 29.2% |
| Italian | 31 | 8.4% |
| Panamanian | 37 | 10.0% |
| Polish | 9 | 2.4% |
| Welsh | 28 | 7.6% | View All 10 Rows |
Immigrants in Avon
The most numerous immigrant groups reported in Avon came from , and Canada (8 | 2.2%), together accounting for 2.2% of all Avon residents.

| Immigration Origin | # Population | % Population |
| Canada | 8 | 2.2% | View All 1 Rows |
Sex and Age in Avon
Sex and Age in Avon
The most populous age groups in Avon are 50 to 54 Years (66 | 33.5%) for men and 65 to 69 Years (49 | 28.3%) for women.
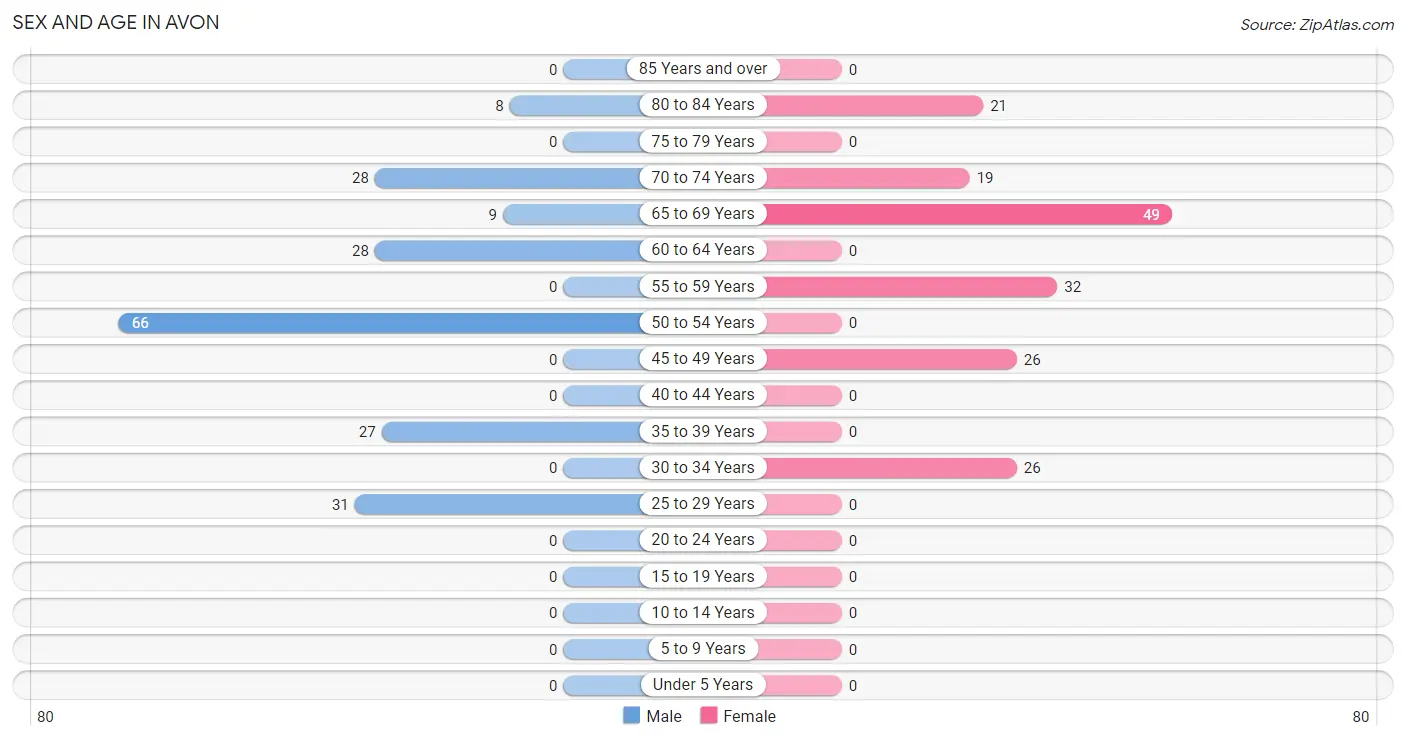
| Age Bracket | Male | Female |
| Under 5 Years | 0 (0.0%) | 0 (0.0%) |
| 5 to 9 Years | 0 (0.0%) | 0 (0.0%) |
| 10 to 14 Years | 0 (0.0%) | 0 (0.0%) |
| 15 to 19 Years | 0 (0.0%) | 0 (0.0%) |
| 20 to 24 Years | 0 (0.0%) | 0 (0.0%) |
| 25 to 29 Years | 31 (15.7%) | 0 (0.0%) |
| 30 to 34 Years | 0 (0.0%) | 26 (15.0%) |
| 35 to 39 Years | 27 (13.7%) | 0 (0.0%) |
| 40 to 44 Years | 0 (0.0%) | 0 (0.0%) |
| 45 to 49 Years | 0 (0.0%) | 26 (15.0%) |
| 50 to 54 Years | 66 (33.5%) | 0 (0.0%) |
| 55 to 59 Years | 0 (0.0%) | 32 (18.5%) |
| 60 to 64 Years | 28 (14.2%) | 0 (0.0%) |
| 65 to 69 Years | 9 (4.6%) | 49 (28.3%) |
| 70 to 74 Years | 28 (14.2%) | 19 (11.0%) |
| 75 to 79 Years | 0 (0.0%) | 0 (0.0%) |
| 80 to 84 Years | 8 (4.1%) | 21 (12.1%) |
| 85 Years and over | 0 (0.0%) | 0 (0.0%) |
| Total | 197 (100.0%) | 173 (100.0%) |
Families and Households in Avon
Median Family Size in Avon
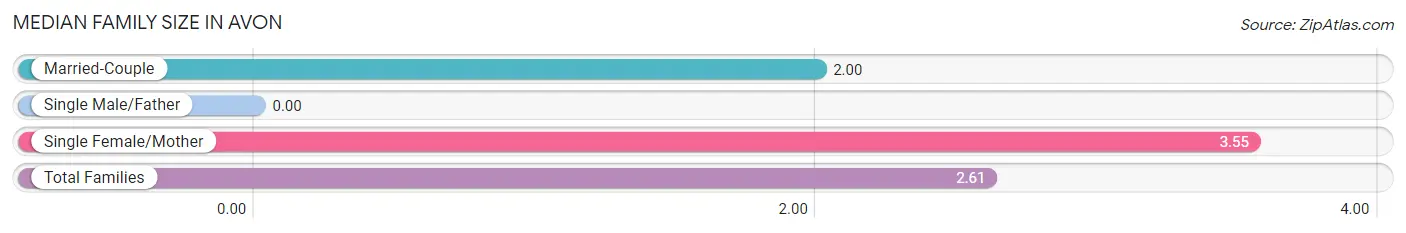
| Family Type | # Families | Family Size |
| Married-Couple | 17 (60.7%) | 2.00 |
| Single Male/Father | 0 (0.0%) | - |
| Single Female/Mother | 11 (39.3%) | 3.55 |
| Total Families | 28 (100.0%) | 2.61 |
Median Household Size in Avon
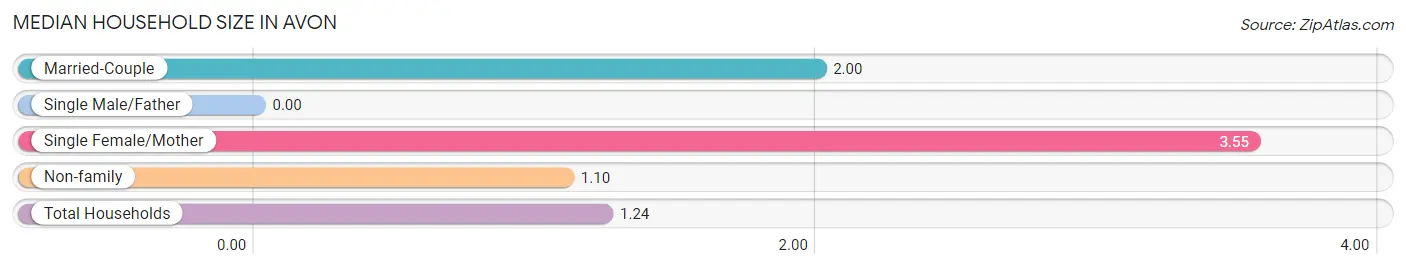
| Household Type | # Households | Household Size |
| Married-Couple | 17 (5.7%) | 2.00 |
| Single Male/Father | 0 (0.0%) | - |
| Single Female/Mother | 11 (3.7%) | 3.55 |
| Non-family | 270 (90.6%) | 1.10 |
| Total Households | 298 (100.0%) | 1.24 |
Household Size by Marriage Status in Avon
Out of a total of 298 households in Avon, 28 (9.4%) are family households, while 270 (90.6%) are nonfamily households. The most numerous type of family households are 2-person households, comprising 28, and the most common type of nonfamily households are 1-person households, comprising 244.
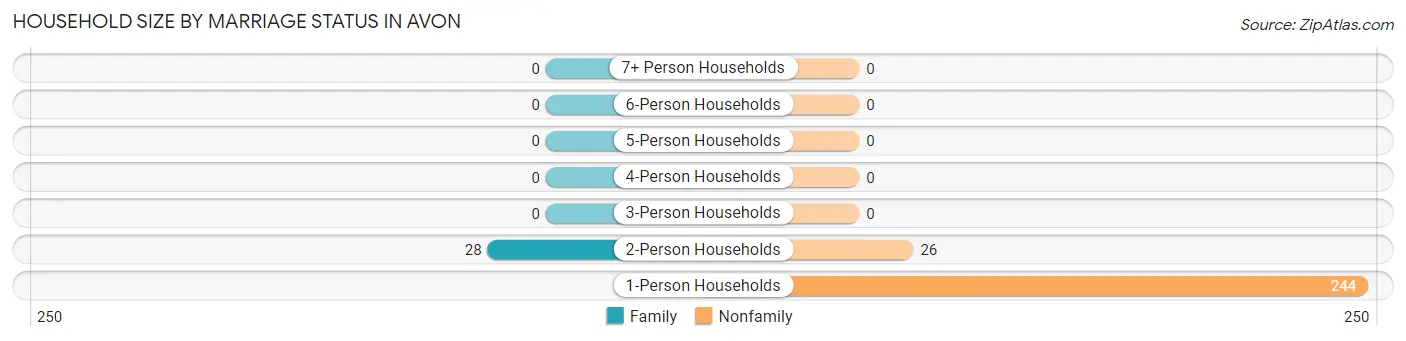
| Household Size | Family Households | Nonfamily Households |
| 1-Person Households | - | 244 (81.9%) |
| 2-Person Households | 28 (9.4%) | 26 (8.7%) |
| 3-Person Households | 0 (0.0%) | 0 (0.0%) |
| 4-Person Households | 0 (0.0%) | 0 (0.0%) |
| 5-Person Households | 0 (0.0%) | 0 (0.0%) |
| 6-Person Households | 0 (0.0%) | 0 (0.0%) |
| 7+ Person Households | 0 (0.0%) | 0 (0.0%) |
| Total | 28 (9.4%) | 270 (90.6%) |
Female Fertility in Avon
Fertility by Age in Avon
| Age Bracket | Women with Births | Births / 1,000 Women |
| 15 to 19 years | 0 (0.0%) | 0.0 |
| 20 to 34 years | 0 (0.0%) | 0.0 |
| 35 to 50 years | 0 (0.0%) | 0.0 |
| Total | 0 (0.0%) | 0.0 |
Fertility by Age by Marriage Status in Avon
| Age Bracket | Married | Unmarried |
| 15 to 19 years | 0 (0.0%) | 0 (0.0%) |
| 20 to 34 years | 0 (0.0%) | 0 (0.0%) |
| 35 to 50 years | 0 (0.0%) | 0 (0.0%) |
| Total | 0 (0.0%) | 0 (0.0%) |
Fertility by Education in Avon

| Educational Attainment | Women with Births | Births / 1,000 Women |
| Less than High School | 0 (0.0%) | 0.0 |
| High School Diploma | 0 (0.0%) | 0.0 |
| College or Associate's Degree | 0 (0.0%) | 0.0 |
| Bachelor's Degree | 0 (0.0%) | 0.0 |
| Graduate Degree | 0 (0.0%) | 0.0 |
| Total | 0 (0.0%) | 0.0 |
Fertility by Education by Marriage Status in Avon
| Educational Attainment | Married | Unmarried |
| Less than High School | 0 (0.0%) | 0 (0.0%) |
| High School Diploma | 0 (0.0%) | 0 (0.0%) |
| College or Associate's Degree | 0 (0.0%) | 0 (0.0%) |
| Bachelor's Degree | 0 (0.0%) | 0 (0.0%) |
| Graduate Degree | 0 (0.0%) | 0 (0.0%) |
| Total | 0 (0.0%) | 0 (0.0%) |
Employment Characteristics in Avon
Employment by Class of Employer in Avon
Among the 141 employed individuals in Avon, private company employees (118 | 83.7%), and state government employees (23 | 16.3%) make up the most common classes of employment.
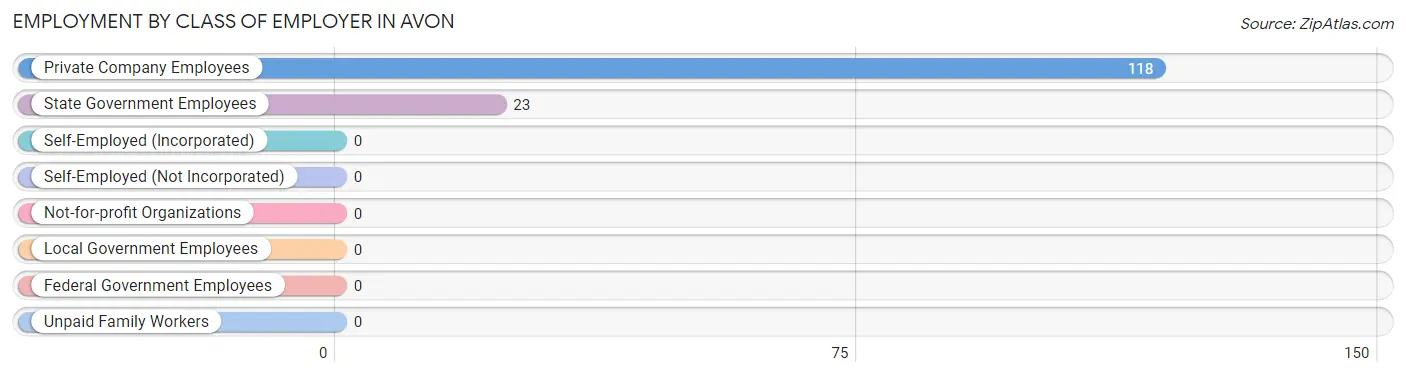
| Employer Class | # Employees | % Employees |
| Private Company Employees | 118 | 83.7% |
| Self-Employed (Incorporated) | 0 | 0.0% |
| Self-Employed (Not Incorporated) | 0 | 0.0% |
| Not-for-profit Organizations | 0 | 0.0% |
| Local Government Employees | 0 | 0.0% |
| State Government Employees | 23 | 16.3% |
| Federal Government Employees | 0 | 0.0% |
| Unpaid Family Workers | 0 | 0.0% |
| Total | 141 | 100.0% |
Employment Status by Age in Avon
According to the labor force statistics for Avon, out of the total population over 16 years of age (370), 56.8% or 210 individuals are in the labor force, with 32.9% or 69 of them unemployed. The age group with the highest labor force participation rate is 25 to 29 years, with 100.0% or 31 individuals in the labor force. Within the labor force, the 25 to 29 years age range has the highest percentage of unemployed individuals, with 100.0% or 31 of them being unemployed.
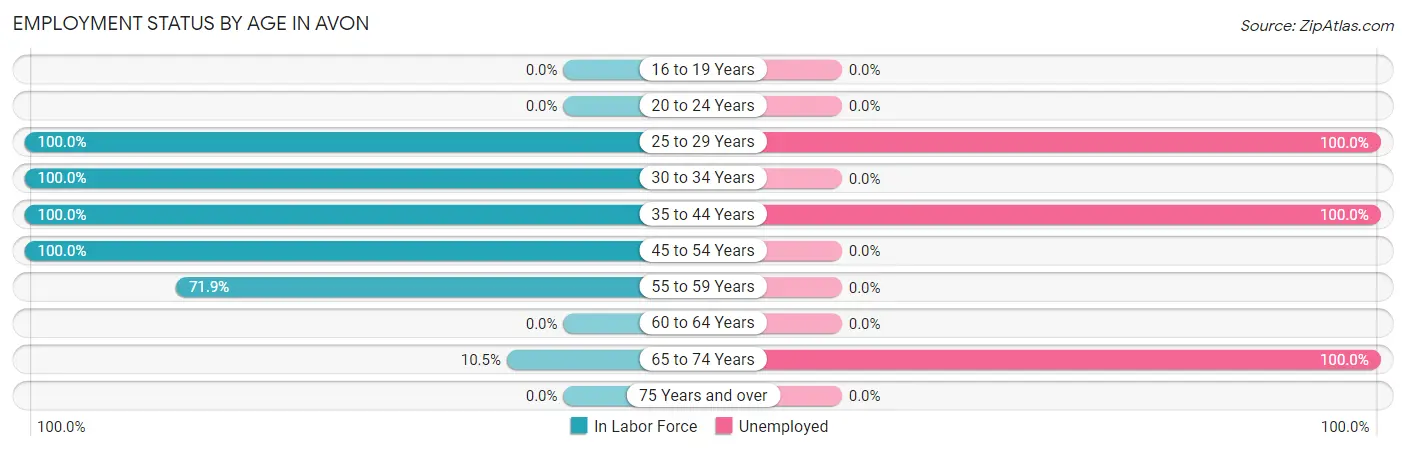
| Age Bracket | In Labor Force | Unemployed |
| 16 to 19 Years | 0 (0.0%) | 0 (0.0%) |
| 20 to 24 Years | 0 (0.0%) | 0 (0.0%) |
| 25 to 29 Years | 31 (100.0%) | 31 (100.0%) |
| 30 to 34 Years | 26 (100.0%) | 0 (0.0%) |
| 35 to 44 Years | 27 (100.0%) | 27 (100.0%) |
| 45 to 54 Years | 92 (100.0%) | 0 (0.0%) |
| 55 to 59 Years | 23 (71.9%) | 0 (0.0%) |
| 60 to 64 Years | 0 (0.0%) | 0 (0.0%) |
| 65 to 74 Years | 11 (10.5%) | 11 (100.0%) |
| 75 Years and over | 0 (0.0%) | 0 (0.0%) |
| Total | 210 (56.8%) | 69 (32.9%) |
Employment Status by Educational Attainment in Avon
According to labor force statistics for Avon, 84.3% of individuals (199) out of the total population between 25 and 64 years of age (236) are in the labor force, with 29.1% or 58 of them being unemployed. The group with the highest labor force participation rate are those with the educational attainment of high school diploma, with 100.0% or 27 individuals in the labor force. Within the labor force, individuals with high school diploma education have the highest percentage of unemployment, with 100.0% or 27 of them being unemployed.
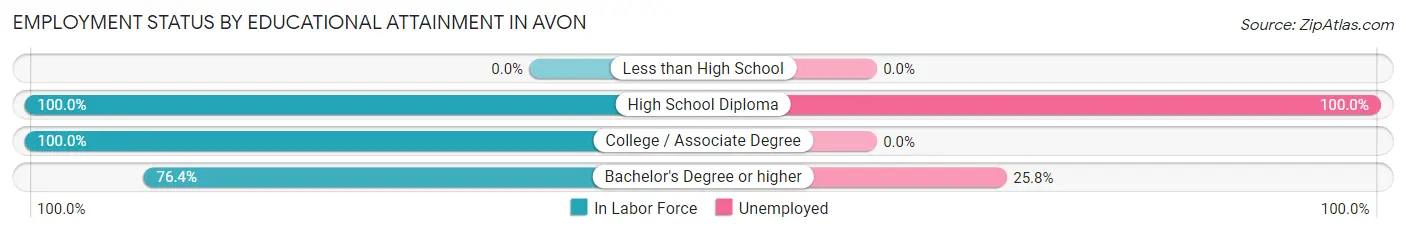
| Educational Attainment | In Labor Force | Unemployed |
| Less than High School | 0 (0.0%) | 0 (0.0%) |
| High School Diploma | 27 (100.0%) | 27 (100.0%) |
| College / Associate Degree | 52 (100.0%) | 0 (0.0%) |
| Bachelor's Degree or higher | 120 (76.4%) | 41 (25.8%) |
| Total | 199 (84.3%) | 69 (29.1%) |
Employment Occupations by Sex in Avon
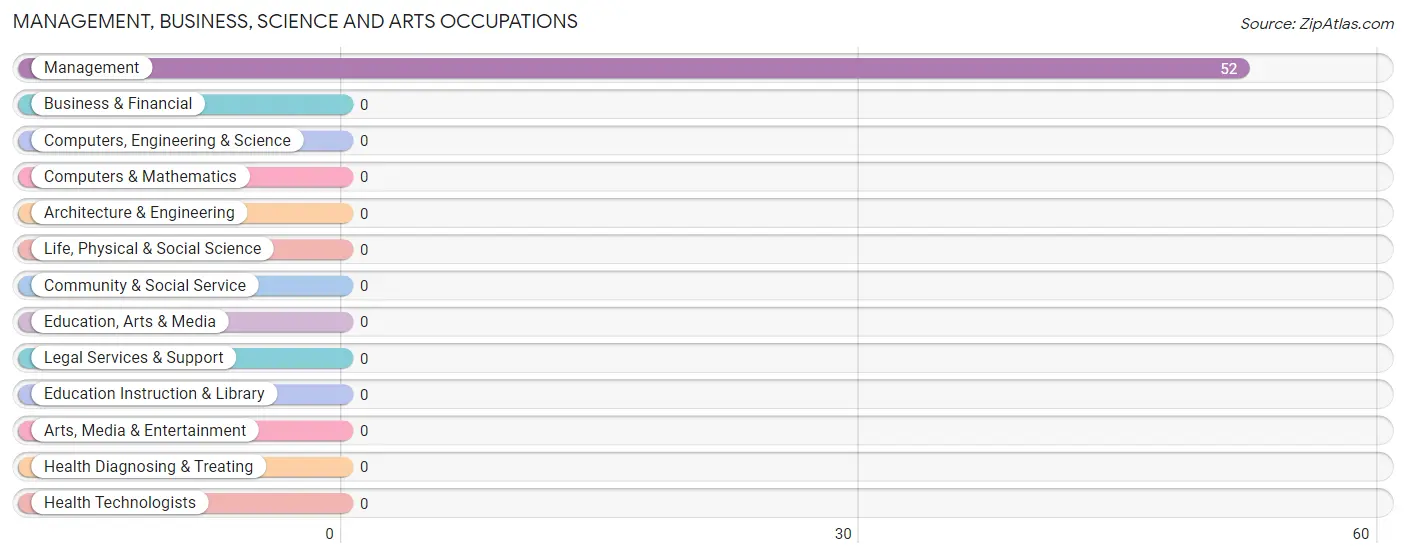
Management, Business, Science and Arts Occupations
The most common Management, Business, Science and Arts occupations in Avon are , and Management (52 | 36.9%).
Management, Business, Science and Arts Occupations by Sex
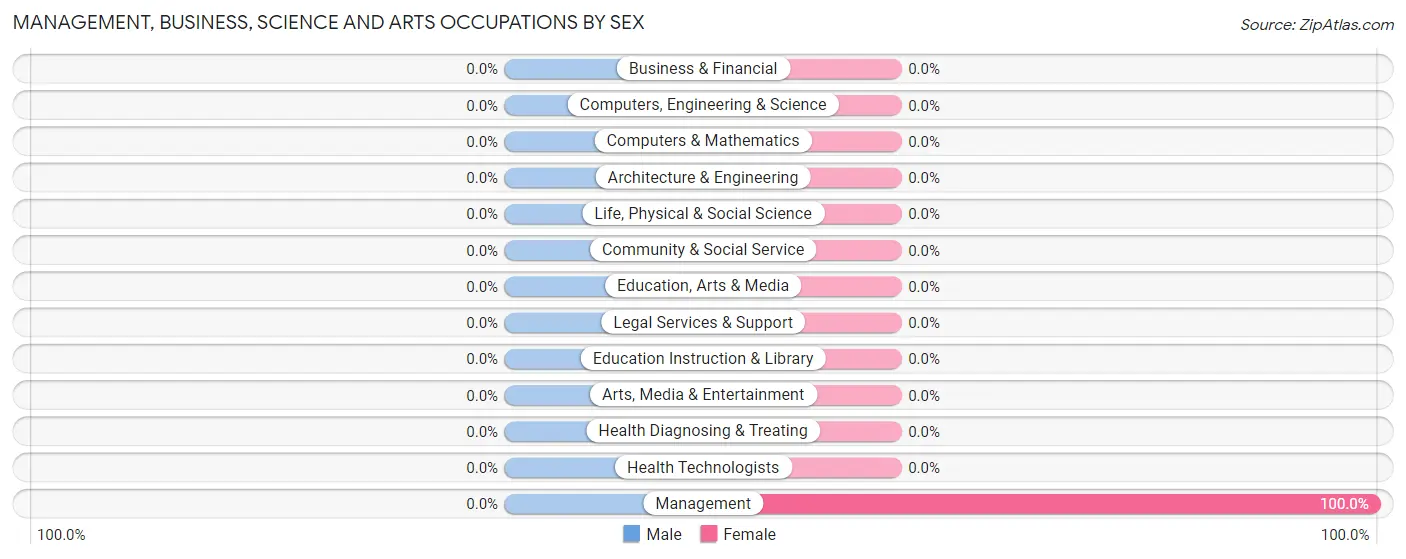
| Occupation | Male | Female |
| Management | 0 (0.0%) | 52 (100.0%) |
| Business & Financial | 0 (0.0%) | 0 (0.0%) |
| Computers, Engineering & Science | 0 (0.0%) | 0 (0.0%) |
| Computers & Mathematics | 0 (0.0%) | 0 (0.0%) |
| Architecture & Engineering | 0 (0.0%) | 0 (0.0%) |
| Life, Physical & Social Science | 0 (0.0%) | 0 (0.0%) |
| Community & Social Service | 0 (0.0%) | 0 (0.0%) |
| Education, Arts & Media | 0 (0.0%) | 0 (0.0%) |
| Legal Services & Support | 0 (0.0%) | 0 (0.0%) |
| Education Instruction & Library | 0 (0.0%) | 0 (0.0%) |
| Arts, Media & Entertainment | 0 (0.0%) | 0 (0.0%) |
| Health Diagnosing & Treating | 0 (0.0%) | 0 (0.0%) |
| Health Technologists | 0 (0.0%) | 0 (0.0%) |
| Total (Category) | 0 (0.0%) | 52 (100.0%) |
| Total (Overall) | 66 (46.8%) | 75 (53.2%) |
Services Occupations
The most common Services occupations in Avon are , and Cleaning & Maintenance (29 | 20.6%).
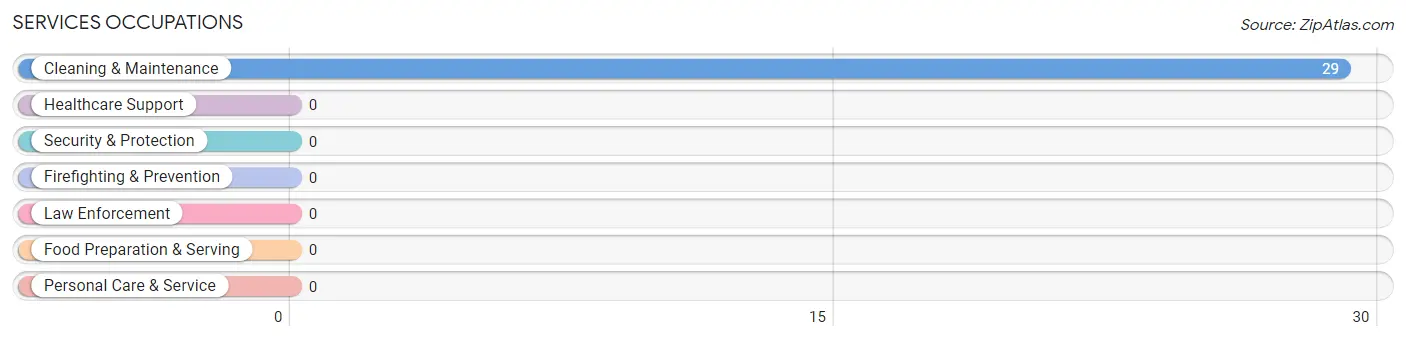
Services Occupations by Sex
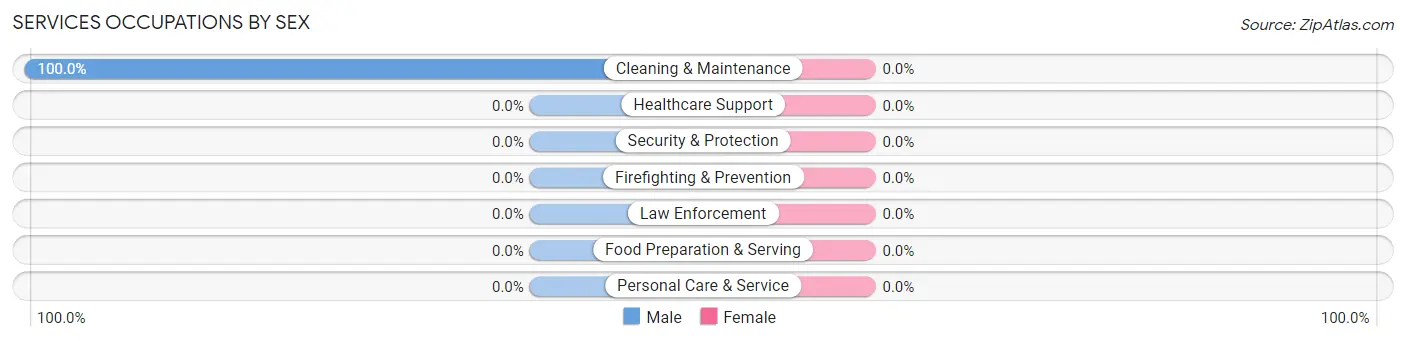
| Occupation | Male | Female |
| Healthcare Support | 0 (0.0%) | 0 (0.0%) |
| Security & Protection | 0 (0.0%) | 0 (0.0%) |
| Firefighting & Prevention | 0 (0.0%) | 0 (0.0%) |
| Law Enforcement | 0 (0.0%) | 0 (0.0%) |
| Food Preparation & Serving | 0 (0.0%) | 0 (0.0%) |
| Cleaning & Maintenance | 29 (100.0%) | 0 (0.0%) |
| Personal Care & Service | 0 (0.0%) | 0 (0.0%) |
| Total (Category) | 29 (100.0%) | 0 (0.0%) |
| Total (Overall) | 66 (46.8%) | 75 (53.2%) |
Sales and Office Occupations
The most common Sales and Office occupations in Avon are , and Office & Administration (23 | 16.3%).
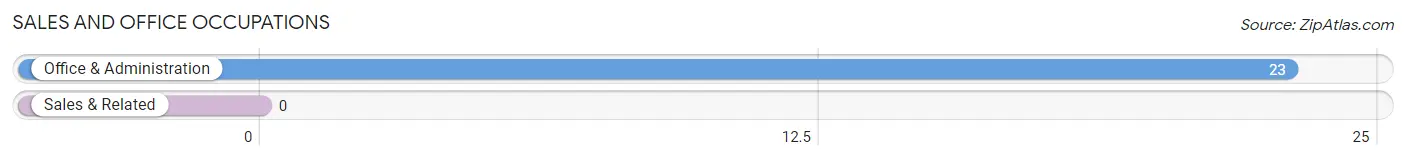
Sales and Office Occupations by Sex
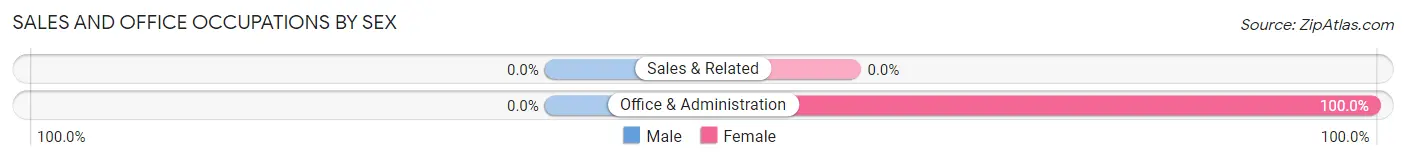
| Occupation | Male | Female |
| Sales & Related | 0 (0.0%) | 0 (0.0%) |
| Office & Administration | 0 (0.0%) | 23 (100.0%) |
| Total (Category) | 0 (0.0%) | 23 (100.0%) |
| Total (Overall) | 66 (46.8%) | 75 (53.2%) |
Natural Resources, Construction and Maintenance Occupations
The most common Natural Resources, Construction and Maintenance occupations in Avon are , and Installation, Maintenance & Repair (37 | 26.2%).
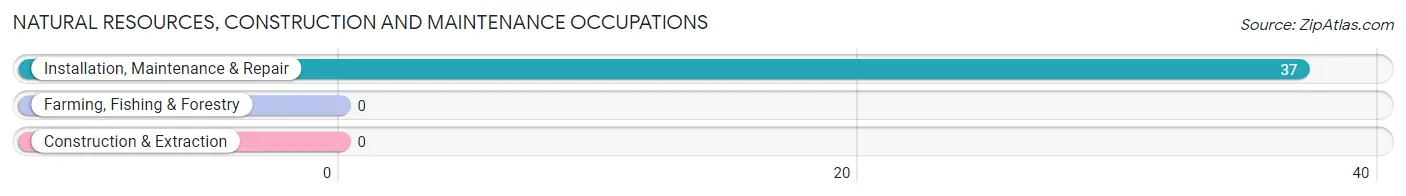
Natural Resources, Construction and Maintenance Occupations by Sex
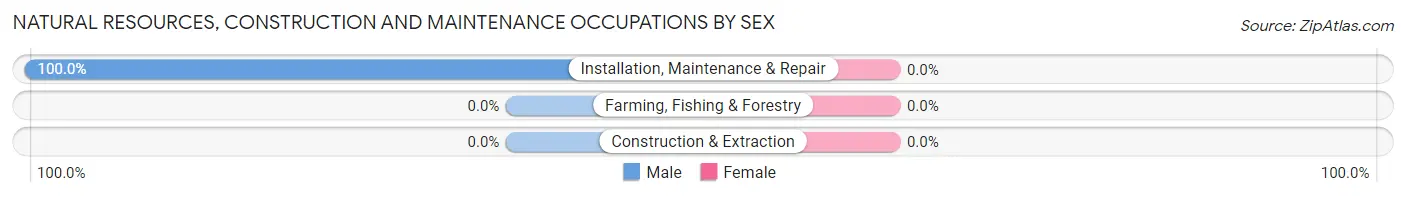
| Occupation | Male | Female |
| Farming, Fishing & Forestry | 0 (0.0%) | 0 (0.0%) |
| Construction & Extraction | 0 (0.0%) | 0 (0.0%) |
| Installation, Maintenance & Repair | 37 (100.0%) | 0 (0.0%) |
| Total (Category) | 37 (100.0%) | 0 (0.0%) |
| Total (Overall) | 66 (46.8%) | 75 (53.2%) |
Production, Transportation and Moving Occupations
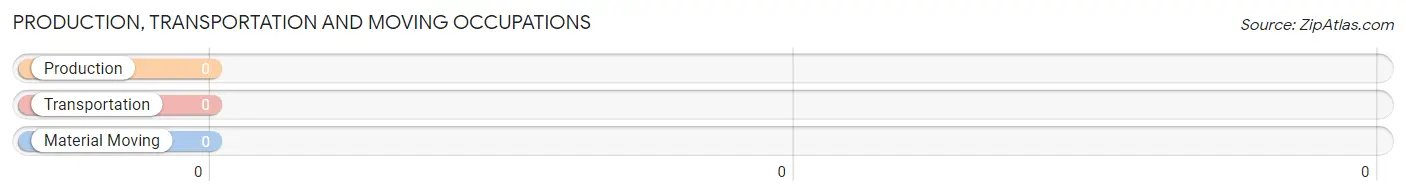
Production, Transportation and Moving Occupations by Sex
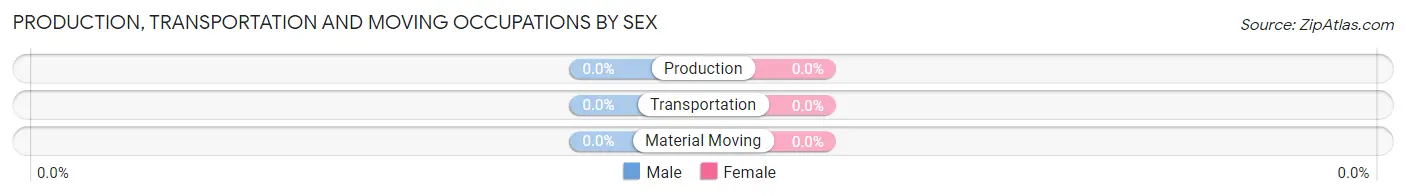
| Occupation | Male | Female |
| Production | 0 (0.0%) | 0 (0.0%) |
| Transportation | 0 (0.0%) | 0 (0.0%) |
| Material Moving | 0 (0.0%) | 0 (0.0%) |
| Total (Category) | 0 (0.0%) | 0 (0.0%) |
| Total (Overall) | 66 (46.8%) | 75 (53.2%) |
Employment Industries by Sex in Avon
Employment Industries in Avon
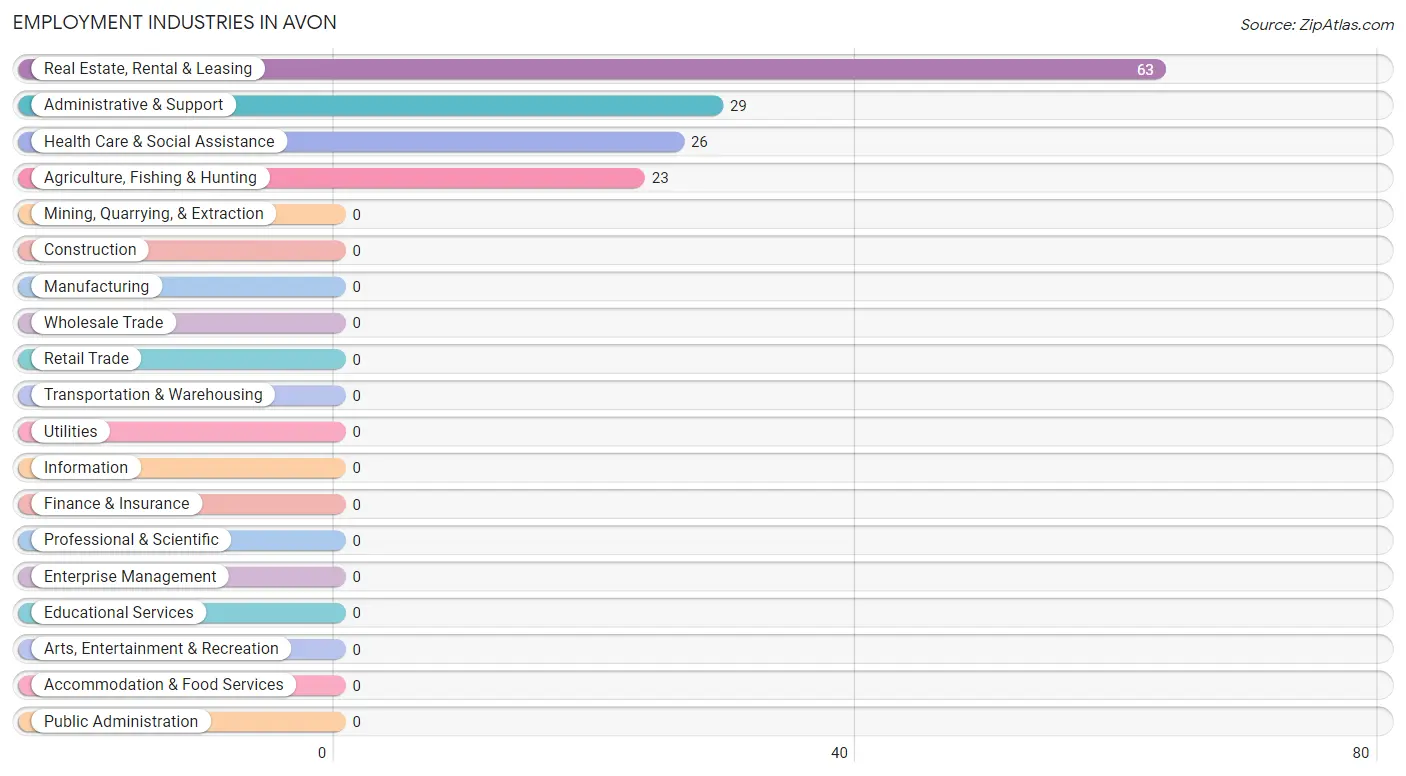
The major employment industries in Avon include Real Estate, Rental & Leasing (63 | 44.7%), Administrative & Support (29 | 20.6%), Health Care & Social Assistance (26 | 18.4%), and Agriculture, Fishing & Hunting (23 | 16.3%).
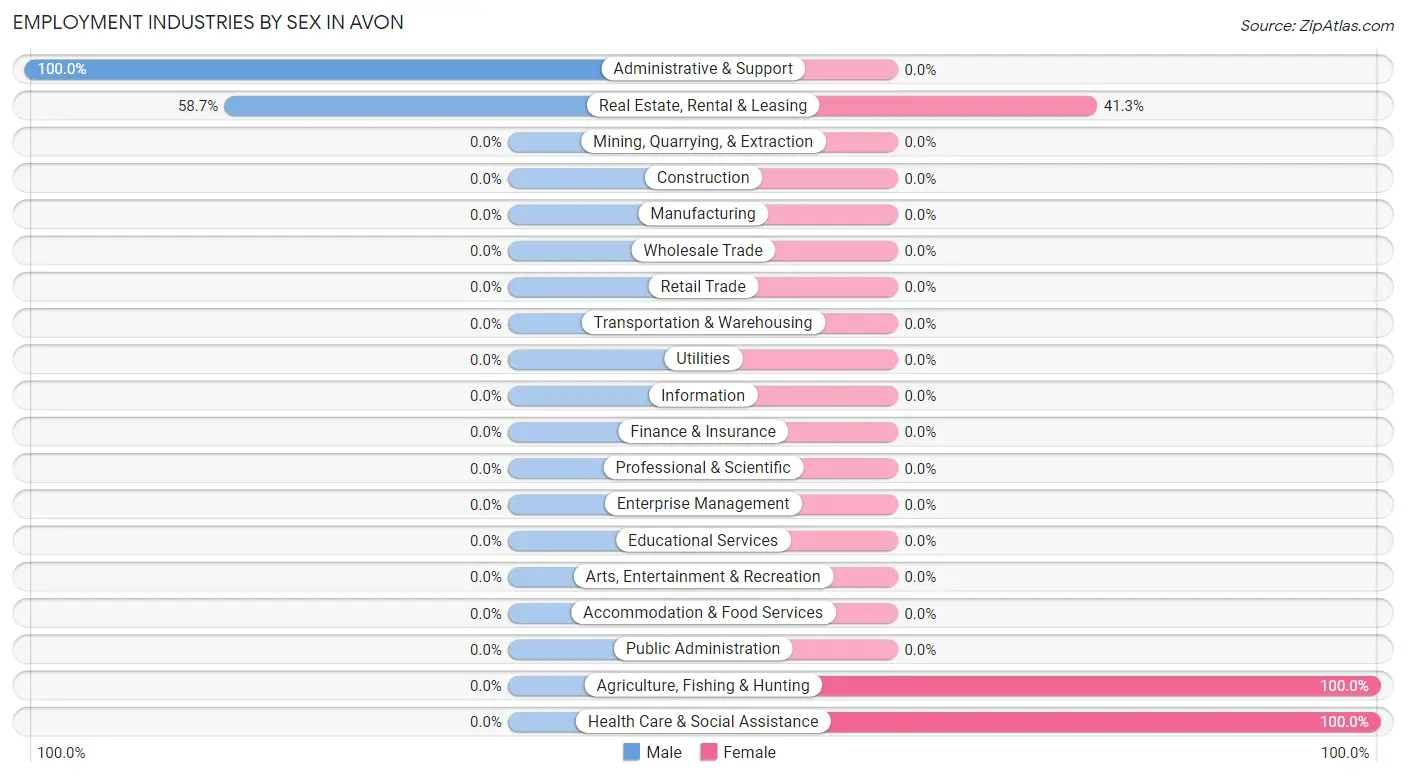
Employment Industries by Sex in Avon
The Avon industries that see more men than women are Administrative & Support (100.0%), and Real Estate, Rental & Leasing (58.7%), whereas the industries that tend to have a higher number of women are Agriculture, Fishing & Hunting (100.0%), Health Care & Social Assistance (100.0%), and Real Estate, Rental & Leasing (41.3%).
| Industry | Male | Female |
| Agriculture, Fishing & Hunting | 0 (0.0%) | 23 (100.0%) |
| Mining, Quarrying, & Extraction | 0 (0.0%) | 0 (0.0%) |
| Construction | 0 (0.0%) | 0 (0.0%) |
| Manufacturing | 0 (0.0%) | 0 (0.0%) |
| Wholesale Trade | 0 (0.0%) | 0 (0.0%) |
| Retail Trade | 0 (0.0%) | 0 (0.0%) |
| Transportation & Warehousing | 0 (0.0%) | 0 (0.0%) |
| Utilities | 0 (0.0%) | 0 (0.0%) |
| Information | 0 (0.0%) | 0 (0.0%) |
| Finance & Insurance | 0 (0.0%) | 0 (0.0%) |
| Real Estate, Rental & Leasing | 37 (58.7%) | 26 (41.3%) |
| Professional & Scientific | 0 (0.0%) | 0 (0.0%) |
| Enterprise Management | 0 (0.0%) | 0 (0.0%) |
| Administrative & Support | 29 (100.0%) | 0 (0.0%) |
| Educational Services | 0 (0.0%) | 0 (0.0%) |
| Health Care & Social Assistance | 0 (0.0%) | 26 (100.0%) |
| Arts, Entertainment & Recreation | 0 (0.0%) | 0 (0.0%) |
| Accommodation & Food Services | 0 (0.0%) | 0 (0.0%) |
| Public Administration | 0 (0.0%) | 0 (0.0%) |
| Total | 66 (46.8%) | 75 (53.2%) |
Education in Avon
School Enrollment in Avon
| School Level | # Students | % Students |
| Nursery / Preschool | 0 | 0.0% |
| Kindergarten | 0 | 0.0% |
| Elementary School | 0 | 0.0% |
| Middle School | 0 | 0.0% |
| High School | 0 | 0.0% |
| College / Undergraduate | 0 | 0.0% |
| Graduate / Professional | 0 | 0.0% |
| Total | 0 | 0.0% |
School Enrollment by Age by Funding Source in Avon
| Age Bracket | Public School | Private School |
| 3 to 4 Year Olds | 0 (0.0%) | 0 (0.0%) |
| 5 to 9 Year Old | 0 (0.0%) | 0 (0.0%) |
| 10 to 14 Year Olds | 0 (0.0%) | 0 (0.0%) |
| 15 to 17 Year Olds | 0 (0.0%) | 0 (0.0%) |
| 18 to 19 Year Olds | 0 (0.0%) | 0 (0.0%) |
| 20 to 24 Year Olds | 0 (0.0%) | 0 (0.0%) |
| 25 to 34 Year Olds | 0 (0.0%) | 0 (0.0%) |
| 35 Years and over | 0 (0.0%) | 0 (0.0%) |
| Total | 0 (0.0%) | 0 (0.0%) |
Educational Attainment by Field of Study in Avon
Science & technology (78 | 36.3%), social sciences (40 | 18.6%), arts & humanities (37 | 17.2%), literature & languages (28 | 13.0%), and education (23 | 10.7%) are the most common fields of study among 215 individuals in Avon who have obtained a bachelor's degree or higher.
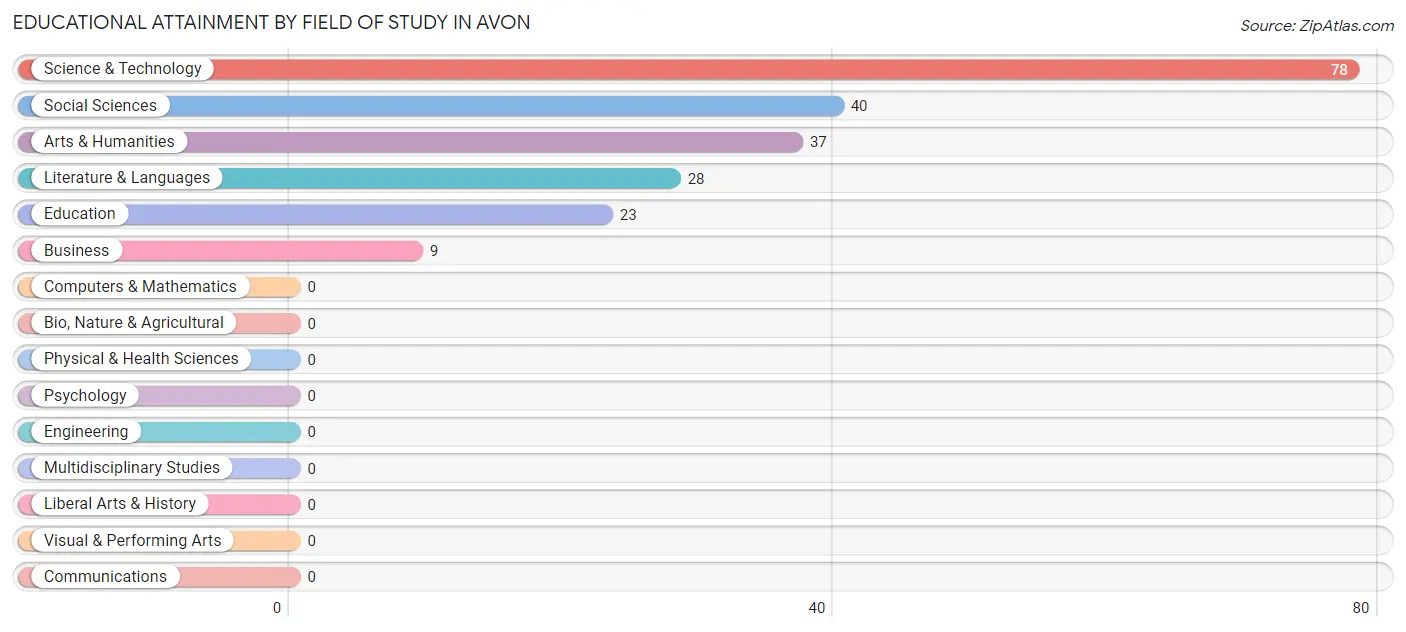
| Field of Study | # Graduates | % Graduates |
| Computers & Mathematics | 0 | 0.0% |
| Bio, Nature & Agricultural | 0 | 0.0% |
| Physical & Health Sciences | 0 | 0.0% |
| Psychology | 0 | 0.0% |
| Social Sciences | 40 | 18.6% |
| Engineering | 0 | 0.0% |
| Multidisciplinary Studies | 0 | 0.0% |
| Science & Technology | 78 | 36.3% |
| Business | 9 | 4.2% |
| Education | 23 | 10.7% |
| Literature & Languages | 28 | 13.0% |
| Liberal Arts & History | 0 | 0.0% |
| Visual & Performing Arts | 0 | 0.0% |
| Communications | 0 | 0.0% |
| Arts & Humanities | 37 | 17.2% |
| Total | 215 | 100.0% |
Transportation & Commute in Avon
Vehicle Availability by Sex in Avon
The most prevalent vehicle ownership categories in Avon are males with 3 vehicles (37, accounting for 56.1%) and females with 3 vehicles (0, making up 49.3%).
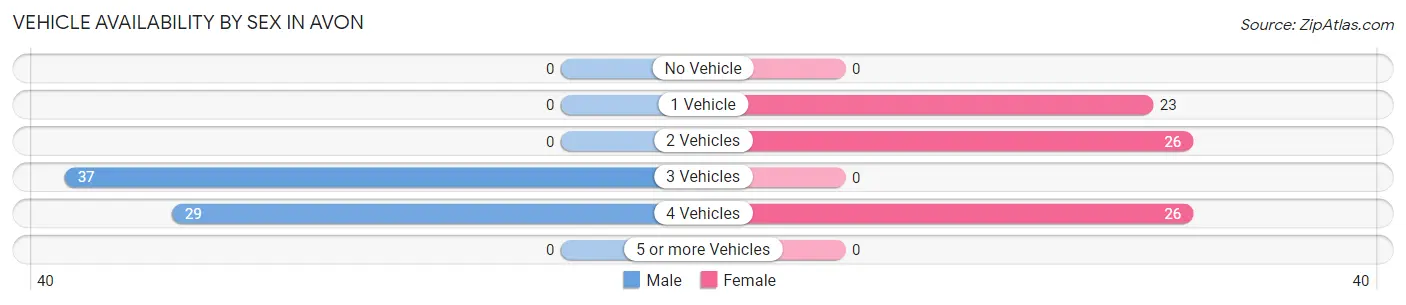
| Vehicles Available | Male | Female |
| No Vehicle | 0 (0.0%) | 0 (0.0%) |
| 1 Vehicle | 0 (0.0%) | 23 (30.7%) |
| 2 Vehicles | 0 (0.0%) | 26 (34.7%) |
| 3 Vehicles | 37 (56.1%) | 0 (0.0%) |
| 4 Vehicles | 29 (43.9%) | 26 (34.7%) |
| 5 or more Vehicles | 0 (0.0%) | 0 (0.0%) |
| Total | 66 (100.0%) | 75 (100.0%) |
Commute Time in Avon
The most frequently occuring commute durations in Avon are 15 to 19 minutes (37 commuters, 26.2%), 10 to 14 minutes (29 commuters, 20.6%), and 20 to 24 minutes (26 commuters, 18.4%).
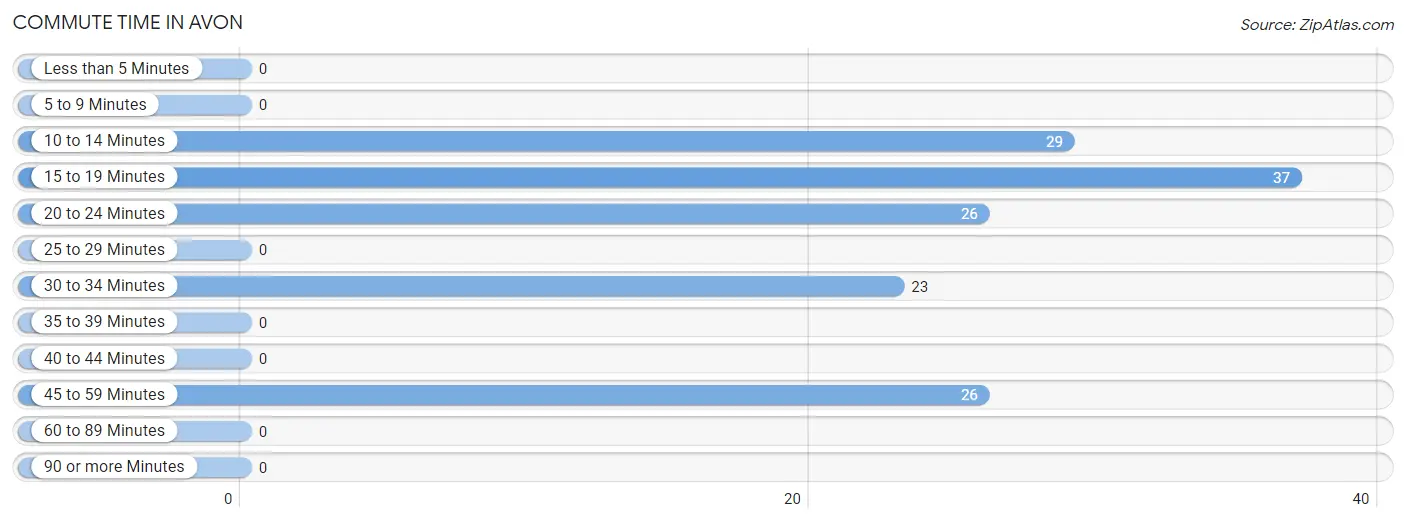
| Commute Time | # Commuters | % Commuters |
| Less than 5 Minutes | 0 | 0.0% |
| 5 to 9 Minutes | 0 | 0.0% |
| 10 to 14 Minutes | 29 | 20.6% |
| 15 to 19 Minutes | 37 | 26.2% |
| 20 to 24 Minutes | 26 | 18.4% |
| 25 to 29 Minutes | 0 | 0.0% |
| 30 to 34 Minutes | 23 | 16.3% |
| 35 to 39 Minutes | 0 | 0.0% |
| 40 to 44 Minutes | 0 | 0.0% |
| 45 to 59 Minutes | 26 | 18.4% |
| 60 to 89 Minutes | 0 | 0.0% |
| 90 or more Minutes | 0 | 0.0% |
Commute Time by Sex in Avon
The most common commute times in Avon are 15 to 19 minutes (37 commuters, 56.1%) for males and 20 to 24 minutes (26 commuters, 34.7%) for females.
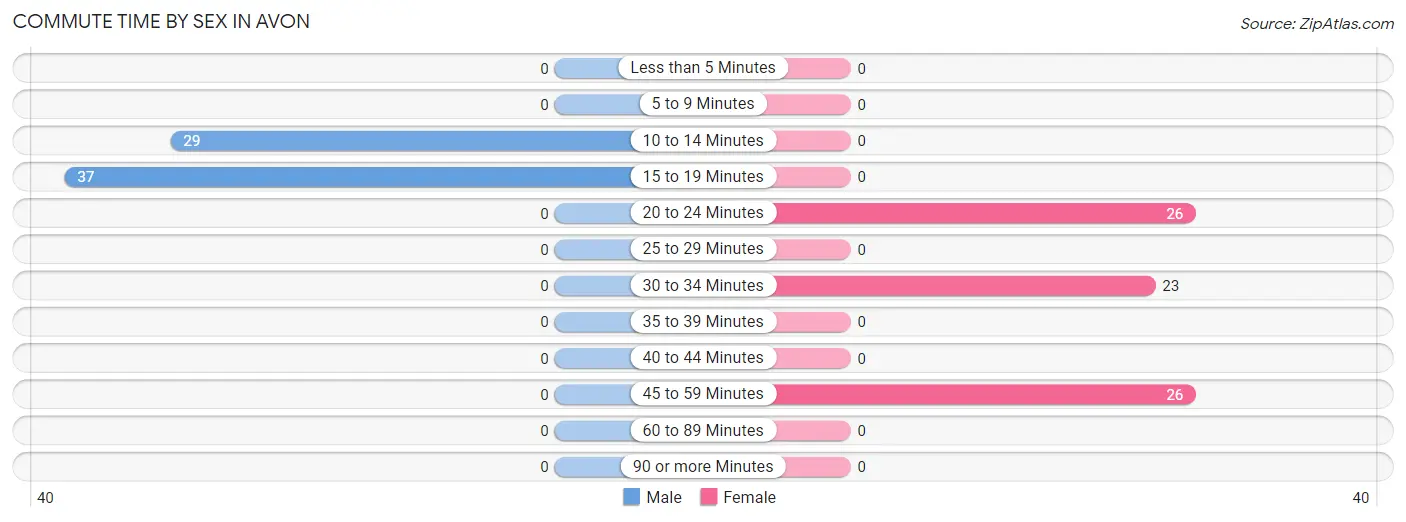
| Commute Time | Male | Female |
| Less than 5 Minutes | 0 (0.0%) | 0 (0.0%) |
| 5 to 9 Minutes | 0 (0.0%) | 0 (0.0%) |
| 10 to 14 Minutes | 29 (43.9%) | 0 (0.0%) |
| 15 to 19 Minutes | 37 (56.1%) | 0 (0.0%) |
| 20 to 24 Minutes | 0 (0.0%) | 26 (34.7%) |
| 25 to 29 Minutes | 0 (0.0%) | 0 (0.0%) |
| 30 to 34 Minutes | 0 (0.0%) | 23 (30.7%) |
| 35 to 39 Minutes | 0 (0.0%) | 0 (0.0%) |
| 40 to 44 Minutes | 0 (0.0%) | 0 (0.0%) |
| 45 to 59 Minutes | 0 (0.0%) | 26 (34.7%) |
| 60 to 89 Minutes | 0 (0.0%) | 0 (0.0%) |
| 90 or more Minutes | 0 (0.0%) | 0 (0.0%) |
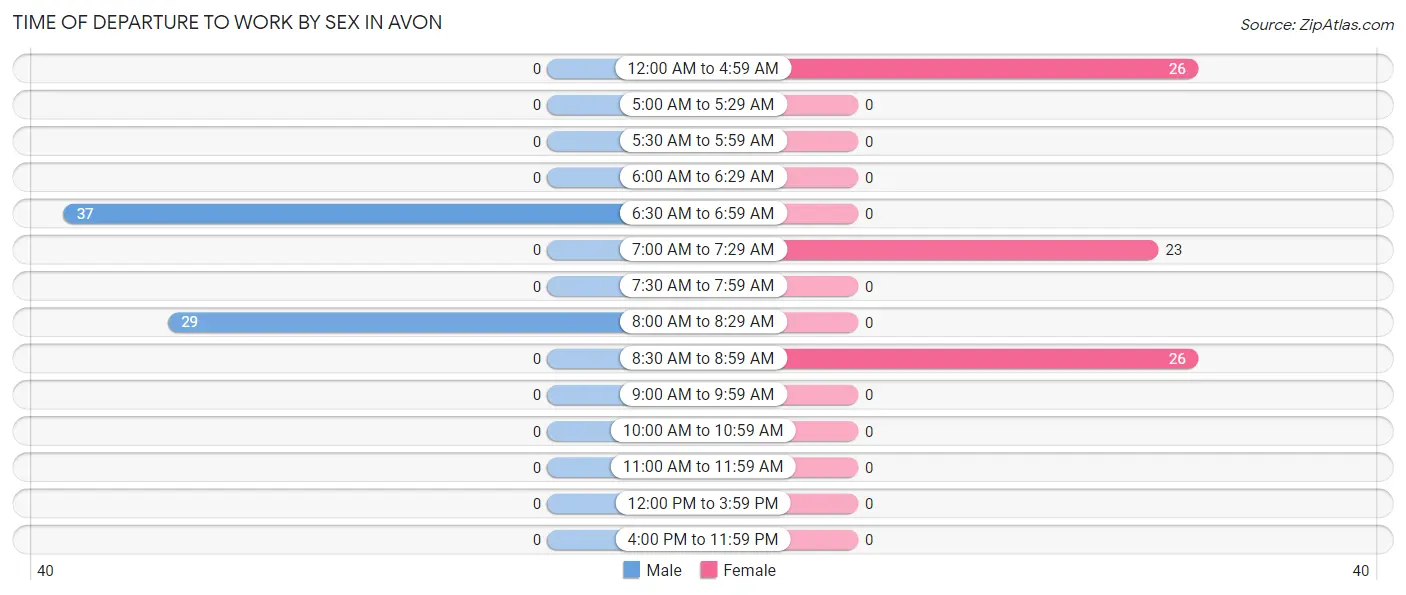
Time of Departure to Work by Sex in Avon
The most frequent times of departure to work in Avon are 6:30 AM to 6:59 AM (37, 56.1%) for males and 12:00 AM to 4:59 AM (26, 34.7%) for females.
| Time of Departure | Male | Female |
| 12:00 AM to 4:59 AM | 0 (0.0%) | 26 (34.7%) |
| 5:00 AM to 5:29 AM | 0 (0.0%) | 0 (0.0%) |
| 5:30 AM to 5:59 AM | 0 (0.0%) | 0 (0.0%) |
| 6:00 AM to 6:29 AM | 0 (0.0%) | 0 (0.0%) |
| 6:30 AM to 6:59 AM | 37 (56.1%) | 0 (0.0%) |
| 7:00 AM to 7:29 AM | 0 (0.0%) | 23 (30.7%) |
| 7:30 AM to 7:59 AM | 0 (0.0%) | 0 (0.0%) |
| 8:00 AM to 8:29 AM | 29 (43.9%) | 0 (0.0%) |
| 8:30 AM to 8:59 AM | 0 (0.0%) | 26 (34.7%) |
| 9:00 AM to 9:59 AM | 0 (0.0%) | 0 (0.0%) |
| 10:00 AM to 10:59 AM | 0 (0.0%) | 0 (0.0%) |
| 11:00 AM to 11:59 AM | 0 (0.0%) | 0 (0.0%) |
| 12:00 PM to 3:59 PM | 0 (0.0%) | 0 (0.0%) |
| 4:00 PM to 11:59 PM | 0 (0.0%) | 0 (0.0%) |
| Total | 66 (100.0%) | 75 (100.0%) |
Housing Occupancy in Avon
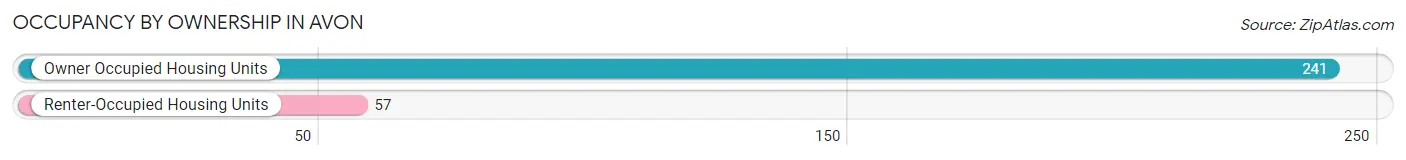
Occupancy by Ownership in Avon
Of the total 298 dwellings in Avon, owner-occupied units account for 241 (80.9%), while renter-occupied units make up 57 (19.1%).
| Occupancy | # Housing Units | % Housing Units |
| Owner Occupied Housing Units | 241 | 80.9% |
| Renter-Occupied Housing Units | 57 | 19.1% |
| Total Occupied Housing Units | 298 | 100.0% |
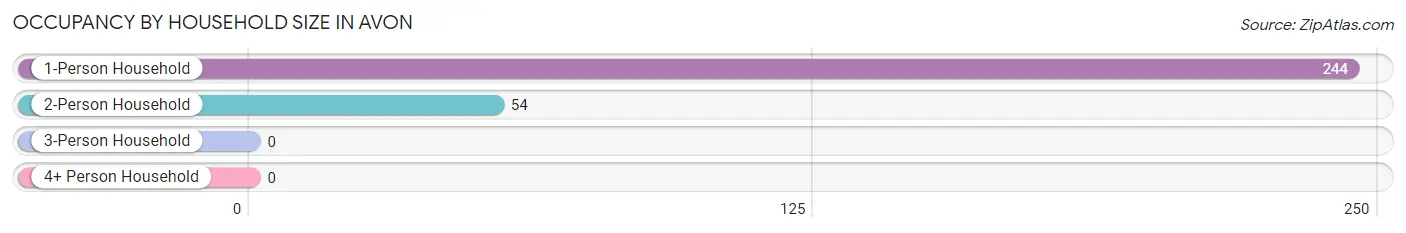
Occupancy by Household Size in Avon
| Household Size | # Housing Units | % Housing Units |
| 1-Person Household | 244 | 81.9% |
| 2-Person Household | 54 | 18.1% |
| 3-Person Household | 0 | 0.0% |
| 4+ Person Household | 0 | 0.0% |
| Total Housing Units | 298 | 100.0% |
Occupancy by Ownership by Household Size in Avon
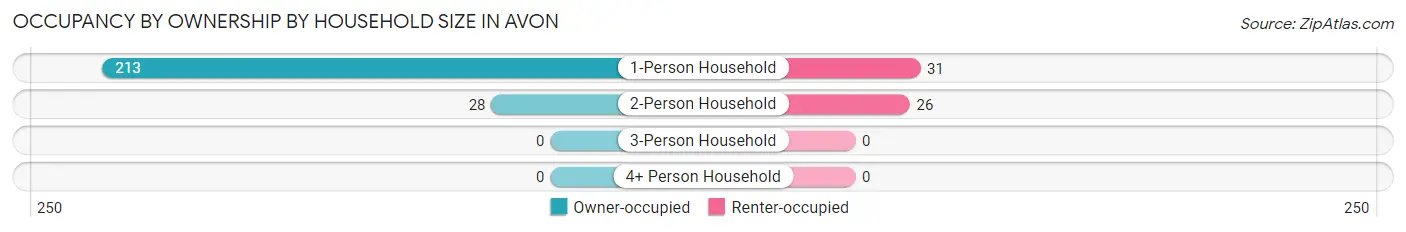
| Household Size | Owner-occupied | Renter-occupied |
| 1-Person Household | 213 (87.3%) | 31 (12.7%) |
| 2-Person Household | 28 (51.8%) | 26 (48.1%) |
| 3-Person Household | 0 (0.0%) | 0 (0.0%) |
| 4+ Person Household | 0 (0.0%) | 0 (0.0%) |
| Total Housing Units | 241 (80.9%) | 57 (19.1%) |
Occupancy by Educational Attainment in Avon
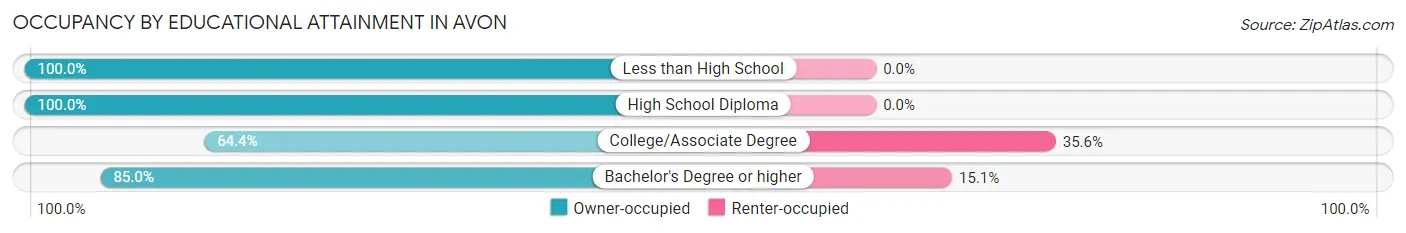
| Household Size | Owner-occupied | Renter-occupied |
| Less than High School | 11 (100.0%) | 0 (0.0%) |
| High School Diploma | 8 (100.0%) | 0 (0.0%) |
| College/Associate Degree | 47 (64.4%) | 26 (35.6%) |
| Bachelor's Degree or higher | 175 (85.0%) | 31 (15.0%) |
Occupancy by Age of Householder in Avon
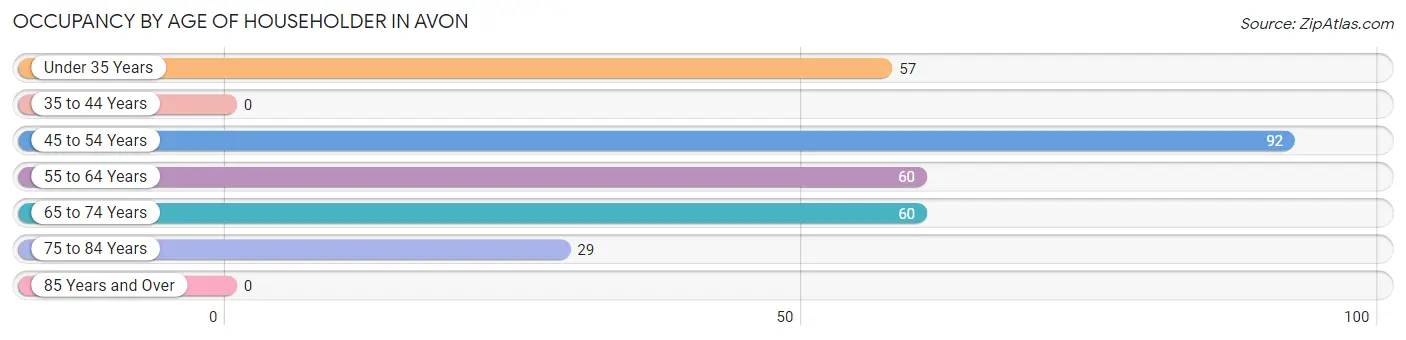
| Age Bracket | # Households | % Households |
| Under 35 Years | 57 | 19.1% |
| 35 to 44 Years | 0 | 0.0% |
| 45 to 54 Years | 92 | 30.9% |
| 55 to 64 Years | 60 | 20.1% |
| 65 to 74 Years | 60 | 20.1% |
| 75 to 84 Years | 29 | 9.7% |
| 85 Years and Over | 0 | 0.0% |
| Total | 298 | 100.0% |
Housing Finances in Avon
Median Income by Occupancy in Avon
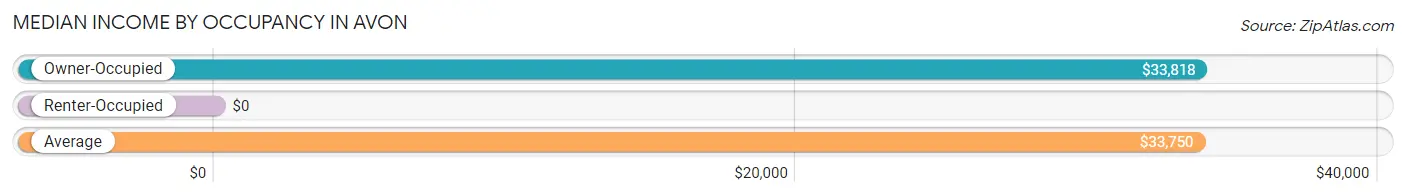
| Occupancy Type | # Households | Median Income |
| Owner-Occupied | 241 (80.9%) | $33,818 |
| Renter-Occupied | 57 (19.1%) | $0 |
| Average | 298 (100.0%) | $33,750 |
Occupancy by Householder Income Bracket in Avon
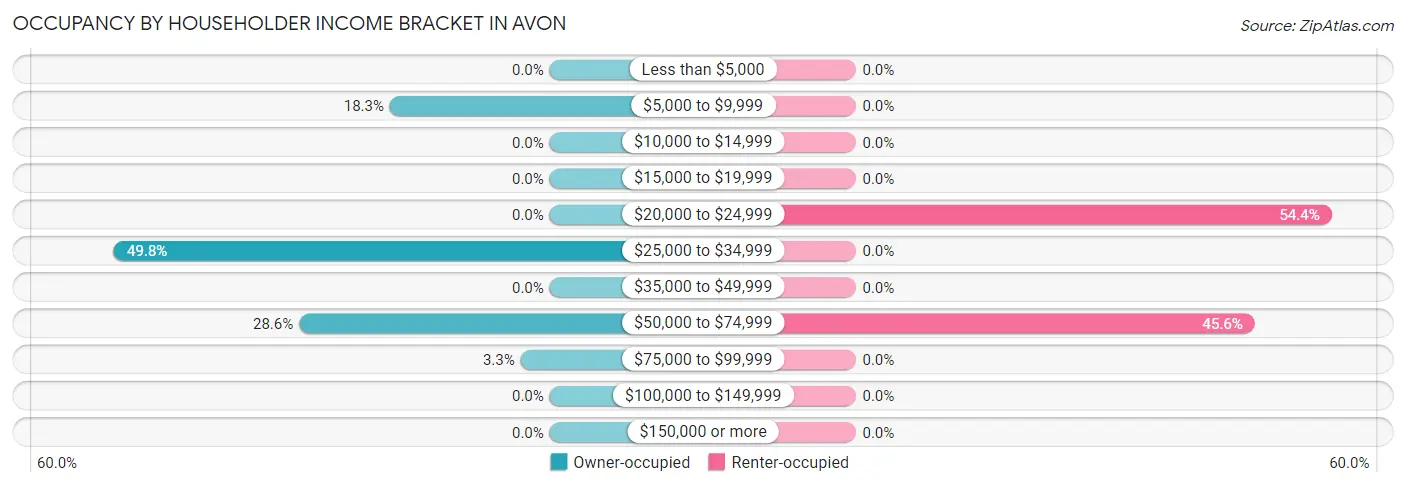
| Income Bracket | Owner-occupied | Renter-occupied |
| Less than $5,000 | 0 (0.0%) | 0 (0.0%) |
| $5,000 to $9,999 | 44 (18.3%) | 0 (0.0%) |
| $10,000 to $14,999 | 0 (0.0%) | 0 (0.0%) |
| $15,000 to $19,999 | 0 (0.0%) | 0 (0.0%) |
| $20,000 to $24,999 | 0 (0.0%) | 31 (54.4%) |
| $25,000 to $34,999 | 120 (49.8%) | 0 (0.0%) |
| $35,000 to $49,999 | 0 (0.0%) | 0 (0.0%) |
| $50,000 to $74,999 | 69 (28.6%) | 26 (45.6%) |
| $75,000 to $99,999 | 8 (3.3%) | 0 (0.0%) |
| $100,000 to $149,999 | 0 (0.0%) | 0 (0.0%) |
| $150,000 or more | 0 (0.0%) | 0 (0.0%) |
| Total | 241 (100.0%) | 57 (100.0%) |
Monthly Housing Cost Tiers in Avon
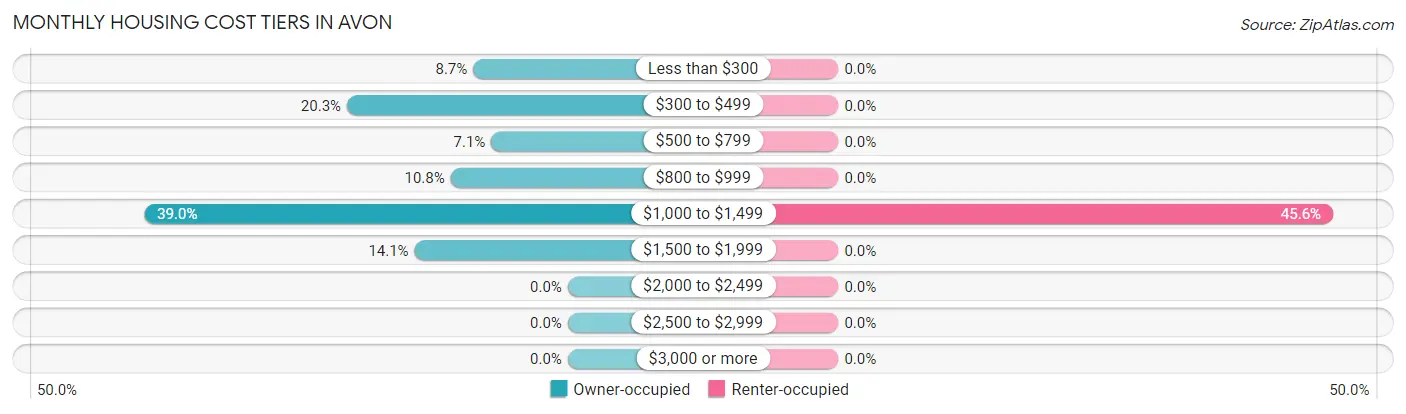
| Monthly Cost | Owner-occupied | Renter-occupied |
| Less than $300 | 21 (8.7%) | 0 (0.0%) |
| $300 to $499 | 49 (20.3%) | 0 (0.0%) |
| $500 to $799 | 17 (7.0%) | 0 (0.0%) |
| $800 to $999 | 26 (10.8%) | 0 (0.0%) |
| $1,000 to $1,499 | 94 (39.0%) | 26 (45.6%) |
| $1,500 to $1,999 | 34 (14.1%) | 0 (0.0%) |
| $2,000 to $2,499 | 0 (0.0%) | 0 (0.0%) |
| $2,500 to $2,999 | 0 (0.0%) | 0 (0.0%) |
| $3,000 or more | 0 (0.0%) | 0 (0.0%) |
| Total | 241 (100.0%) | 57 (100.0%) |
Physical Housing Characteristics in Avon
Housing Structures in Avon
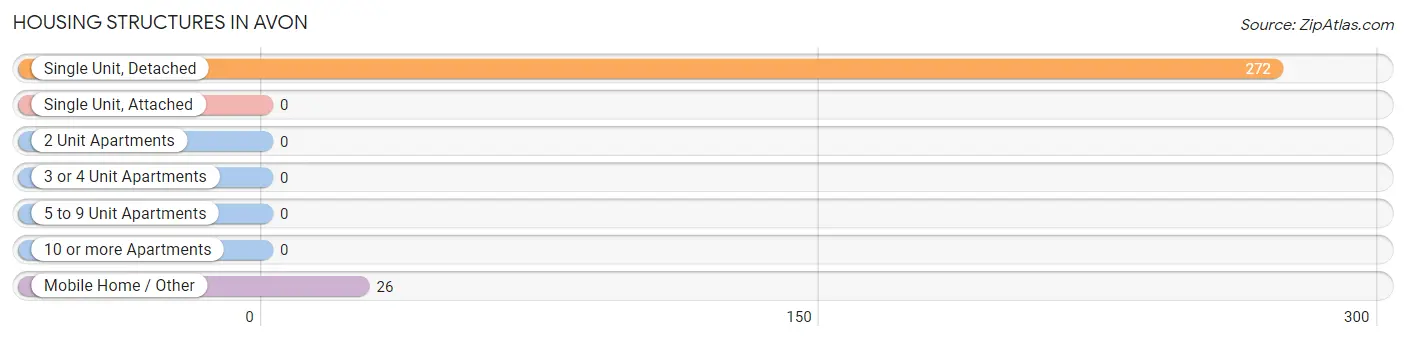
| Structure Type | # Housing Units | % Housing Units |
| Single Unit, Detached | 272 | 91.3% |
| Single Unit, Attached | 0 | 0.0% |
| 2 Unit Apartments | 0 | 0.0% |
| 3 or 4 Unit Apartments | 0 | 0.0% |
| 5 to 9 Unit Apartments | 0 | 0.0% |
| 10 or more Apartments | 0 | 0.0% |
| Mobile Home / Other | 26 | 8.7% |
| Total | 298 | 100.0% |
Housing Structures by Occupancy in Avon
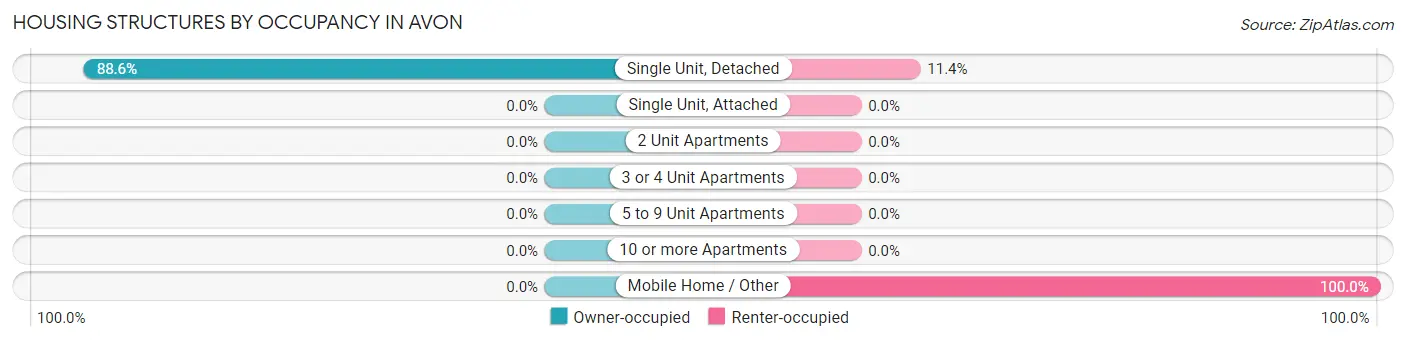
| Structure Type | Owner-occupied | Renter-occupied |
| Single Unit, Detached | 241 (88.6%) | 31 (11.4%) |
| Single Unit, Attached | 0 (0.0%) | 0 (0.0%) |
| 2 Unit Apartments | 0 (0.0%) | 0 (0.0%) |
| 3 or 4 Unit Apartments | 0 (0.0%) | 0 (0.0%) |
| 5 to 9 Unit Apartments | 0 (0.0%) | 0 (0.0%) |
| 10 or more Apartments | 0 (0.0%) | 0 (0.0%) |
| Mobile Home / Other | 0 (0.0%) | 26 (100.0%) |
| Total | 241 (80.9%) | 57 (19.1%) |
Housing Structures by Number of Rooms in Avon
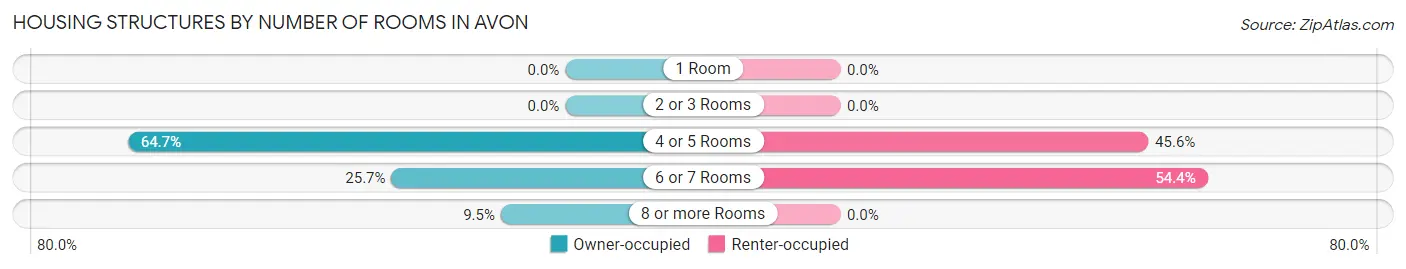
| Number of Rooms | Owner-occupied | Renter-occupied |
| 1 Room | 0 (0.0%) | 0 (0.0%) |
| 2 or 3 Rooms | 0 (0.0%) | 0 (0.0%) |
| 4 or 5 Rooms | 156 (64.7%) | 26 (45.6%) |
| 6 or 7 Rooms | 62 (25.7%) | 31 (54.4%) |
| 8 or more Rooms | 23 (9.5%) | 0 (0.0%) |
| Total | 241 (100.0%) | 57 (100.0%) |
Housing Structure by Heating Type in Avon
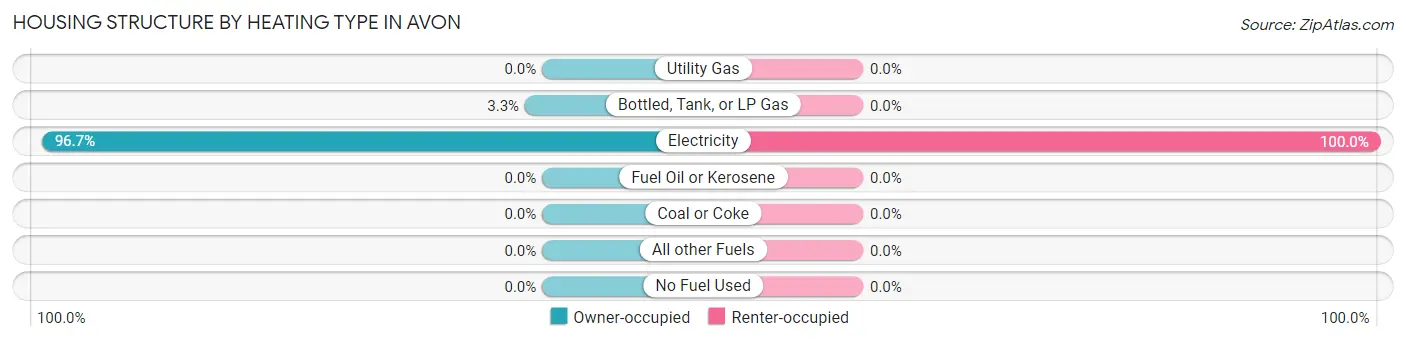
| Heating Type | Owner-occupied | Renter-occupied |
| Utility Gas | 0 (0.0%) | 0 (0.0%) |
| Bottled, Tank, or LP Gas | 8 (3.3%) | 0 (0.0%) |
| Electricity | 233 (96.7%) | 57 (100.0%) |
| Fuel Oil or Kerosene | 0 (0.0%) | 0 (0.0%) |
| Coal or Coke | 0 (0.0%) | 0 (0.0%) |
| All other Fuels | 0 (0.0%) | 0 (0.0%) |
| No Fuel Used | 0 (0.0%) | 0 (0.0%) |
| Total | 241 (100.0%) | 57 (100.0%) |
Household Vehicle Usage in Avon
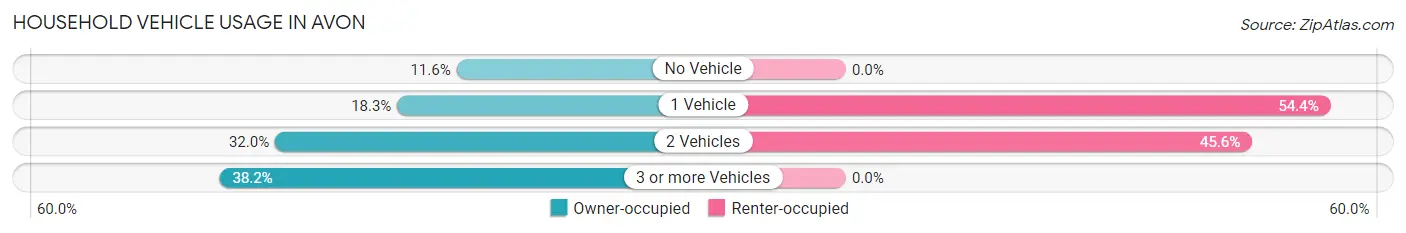
| Vehicles per Household | Owner-occupied | Renter-occupied |
| No Vehicle | 28 (11.6%) | 0 (0.0%) |
| 1 Vehicle | 44 (18.3%) | 31 (54.4%) |
| 2 Vehicles | 77 (32.0%) | 26 (45.6%) |
| 3 or more Vehicles | 92 (38.2%) | 0 (0.0%) |
| Total | 241 (100.0%) | 57 (100.0%) |
Real Estate & Mortgages in Avon
Real Estate and Mortgage Overview in Avon
| Characteristic | Without Mortgage | With Mortgage |
| Housing Units | 142 | 99 |
| Median Property Value | $243,900 | $345,700 |
| Median Household Income | - | - |
| Monthly Housing Costs | $611 | $0 |
| Real Estate Taxes | $1,929 | $0 |
Property Value by Mortgage Status in Avon
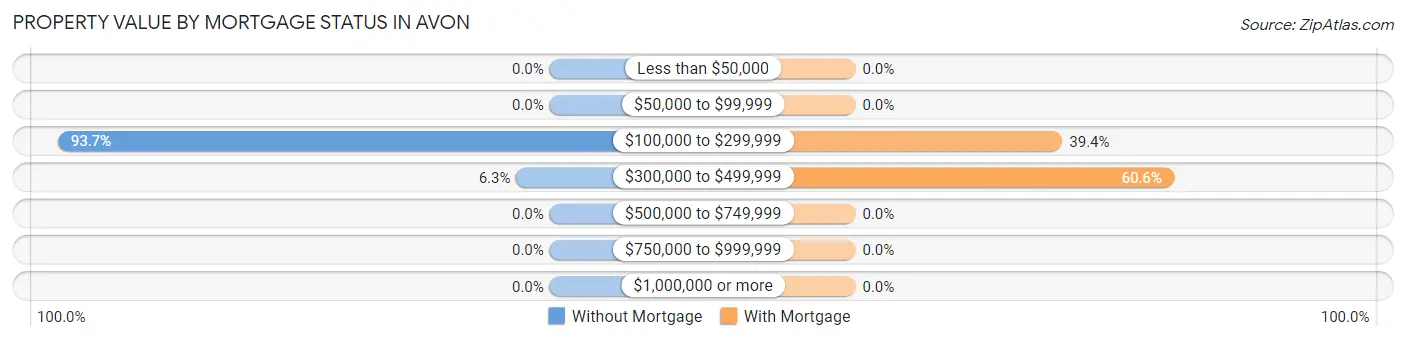
| Property Value | Without Mortgage | With Mortgage |
| Less than $50,000 | 0 (0.0%) | 0 (0.0%) |
| $50,000 to $99,999 | 0 (0.0%) | 0 (0.0%) |
| $100,000 to $299,999 | 133 (93.7%) | 39 (39.4%) |
| $300,000 to $499,999 | 9 (6.3%) | 60 (60.6%) |
| $500,000 to $749,999 | 0 (0.0%) | 0 (0.0%) |
| $750,000 to $999,999 | 0 (0.0%) | 0 (0.0%) |
| $1,000,000 or more | 0 (0.0%) | 0 (0.0%) |
| Total | 142 (100.0%) | 99 (100.0%) |
Household Income by Mortgage Status in Avon
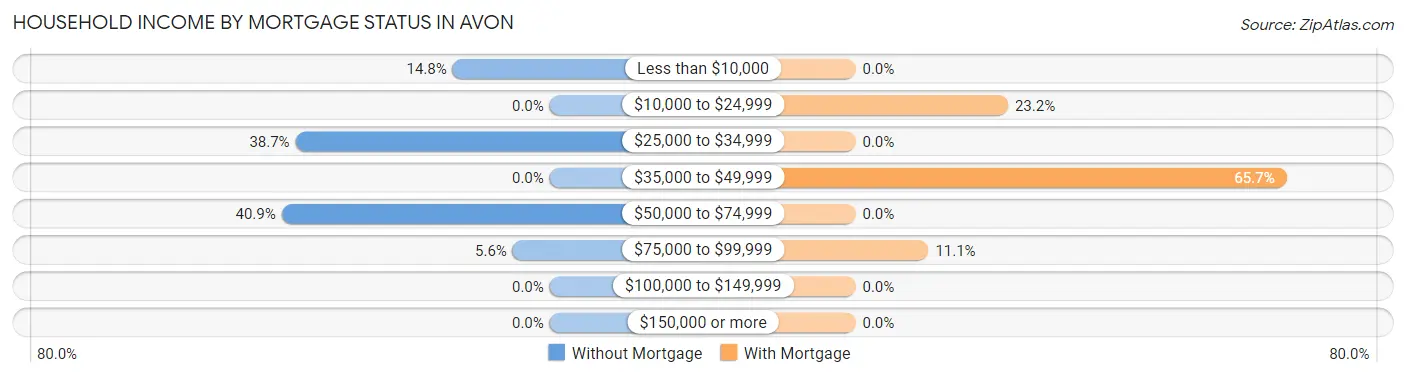
| Household Income | Without Mortgage | With Mortgage |
| Less than $10,000 | 21 (14.8%) | 0 (0.0%) |
| $10,000 to $24,999 | 0 (0.0%) | 23 (23.2%) |
| $25,000 to $34,999 | 55 (38.7%) | 0 (0.0%) |
| $35,000 to $49,999 | 0 (0.0%) | 65 (65.7%) |
| $50,000 to $74,999 | 58 (40.8%) | 0 (0.0%) |
| $75,000 to $99,999 | 8 (5.6%) | 11 (11.1%) |
| $100,000 to $149,999 | 0 (0.0%) | 0 (0.0%) |
| $150,000 or more | 0 (0.0%) | 0 (0.0%) |
| Total | 142 (100.0%) | 99 (100.0%) |
Property Value to Household Income Ratio in Avon
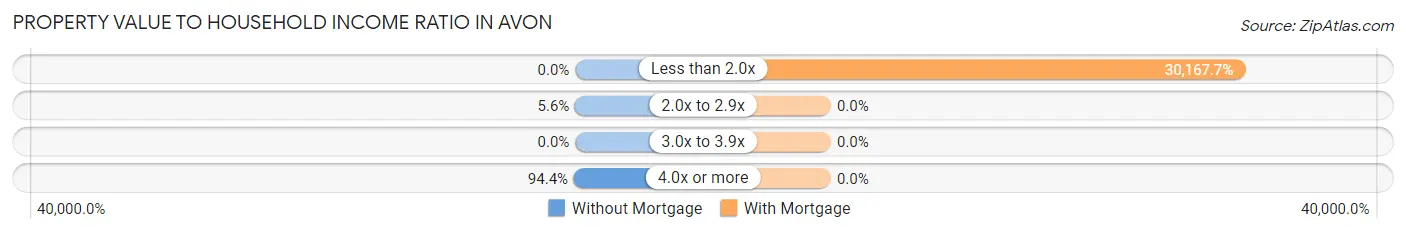
| Value-to-Income Ratio | Without Mortgage | With Mortgage |
| Less than 2.0x | 0 (0.0%) | 29,866 (30,167.7%) |
| 2.0x to 2.9x | 8 (5.6%) | 0 (0.0%) |
| 3.0x to 3.9x | 0 (0.0%) | 0 (0.0%) |
| 4.0x or more | 134 (94.4%) | 0 (0.0%) |
| Total | 142 (100.0%) | 99 (100.0%) |
Real Estate Taxes by Mortgage Status in Avon
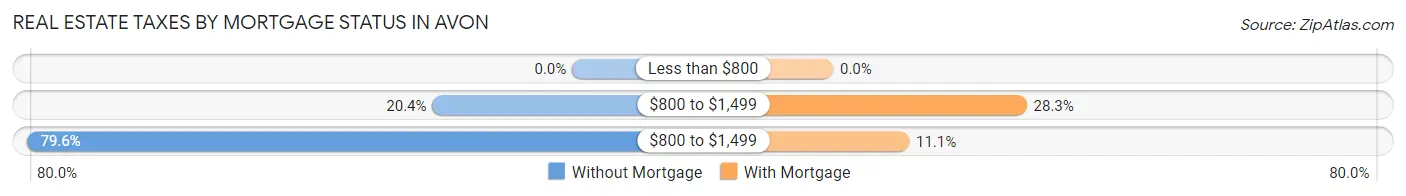
| Property Taxes | Without Mortgage | With Mortgage |
| Less than $800 | 0 (0.0%) | 0 (0.0%) |
| $800 to $1,499 | 29 (20.4%) | 28 (28.3%) |
| $800 to $1,499 | 113 (79.6%) | 11 (11.1%) |
| Total | 142 (100.0%) | 99 (100.0%) |
Health & Disability in Avon
Health Insurance Coverage by Age in Avon
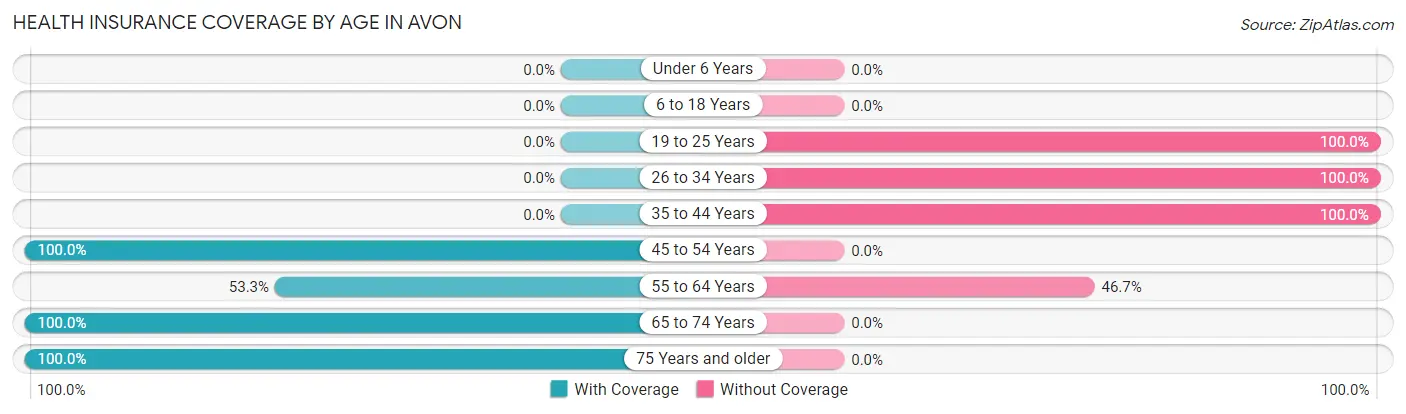
| Age Bracket | With Coverage | Without Coverage |
| Under 6 Years | 0 (0.0%) | 0 (0.0%) |
| 6 to 18 Years | 0 (0.0%) | 0 (0.0%) |
| 19 to 25 Years | 0 (0.0%) | 31 (100.0%) |
| 26 to 34 Years | 0 (0.0%) | 26 (100.0%) |
| 35 to 44 Years | 0 (0.0%) | 27 (100.0%) |
| 45 to 54 Years | 92 (100.0%) | 0 (0.0%) |
| 55 to 64 Years | 32 (53.3%) | 28 (46.7%) |
| 65 to 74 Years | 105 (100.0%) | 0 (0.0%) |
| 75 Years and older | 29 (100.0%) | 0 (0.0%) |
| Total | 258 (69.7%) | 112 (30.3%) |
Health Insurance Coverage by Citizenship Status in Avon
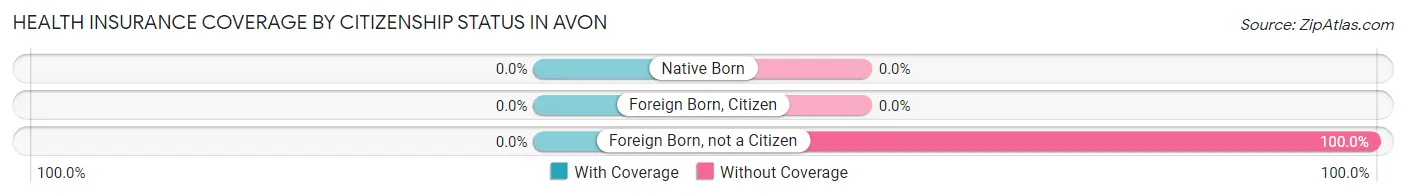
| Citizenship Status | With Coverage | Without Coverage |
| Native Born | 0 (0.0%) | 0 (0.0%) |
| Foreign Born, Citizen | 0 (0.0%) | 0 (0.0%) |
| Foreign Born, not a Citizen | 0 (0.0%) | 31 (100.0%) |
Health Insurance Coverage by Household Income in Avon
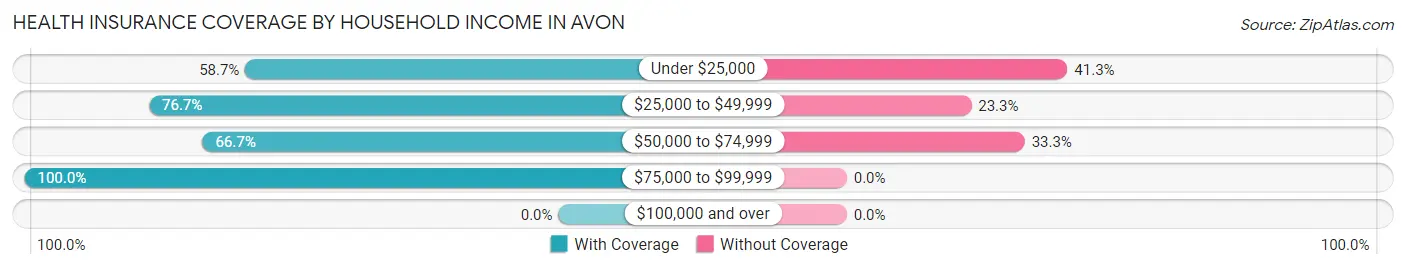
| Household Income | With Coverage | Without Coverage |
| Under $25,000 | 44 (58.7%) | 31 (41.3%) |
| $25,000 to $49,999 | 92 (76.7%) | 28 (23.3%) |
| $50,000 to $74,999 | 106 (66.7%) | 53 (33.3%) |
| $75,000 to $99,999 | 16 (100.0%) | 0 (0.0%) |
| $100,000 and over | 0 (0.0%) | 0 (0.0%) |
Public vs Private Health Insurance Coverage by Age in Avon
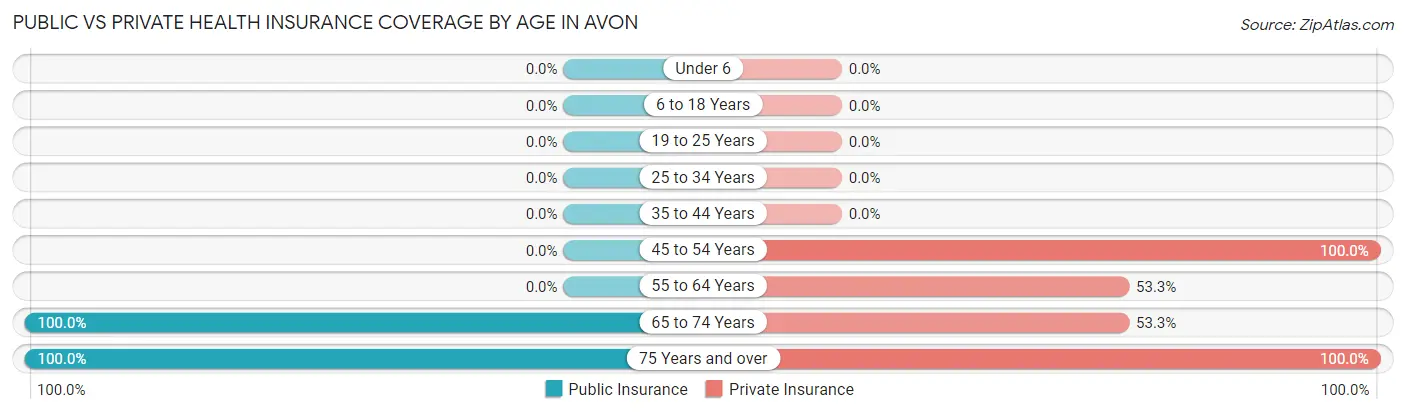
| Age Bracket | Public Insurance | Private Insurance |
| Under 6 | 0 (0.0%) | 0 (0.0%) |
| 6 to 18 Years | 0 (0.0%) | 0 (0.0%) |
| 19 to 25 Years | 0 (0.0%) | 0 (0.0%) |
| 25 to 34 Years | 0 (0.0%) | 0 (0.0%) |
| 35 to 44 Years | 0 (0.0%) | 0 (0.0%) |
| 45 to 54 Years | 0 (0.0%) | 92 (100.0%) |
| 55 to 64 Years | 0 (0.0%) | 32 (53.3%) |
| 65 to 74 Years | 105 (100.0%) | 56 (53.3%) |
| 75 Years and over | 29 (100.0%) | 29 (100.0%) |
| Total | 134 (36.2%) | 209 (56.5%) |
Disability Status by Sex by Age in Avon
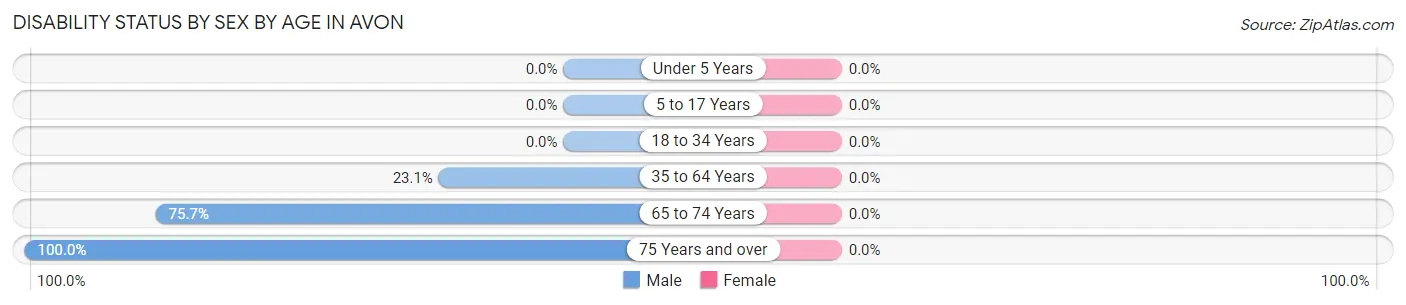
| Age Bracket | Male | Female |
| Under 5 Years | 0 (0.0%) | 0 (0.0%) |
| 5 to 17 Years | 0 (0.0%) | 0 (0.0%) |
| 18 to 34 Years | 0 (0.0%) | 0 (0.0%) |
| 35 to 64 Years | 28 (23.1%) | 0 (0.0%) |
| 65 to 74 Years | 28 (75.7%) | 0 (0.0%) |
| 75 Years and over | 8 (100.0%) | 0 (0.0%) |
Disability Class by Sex by Age in Avon
Disability Class: Hearing Difficulty
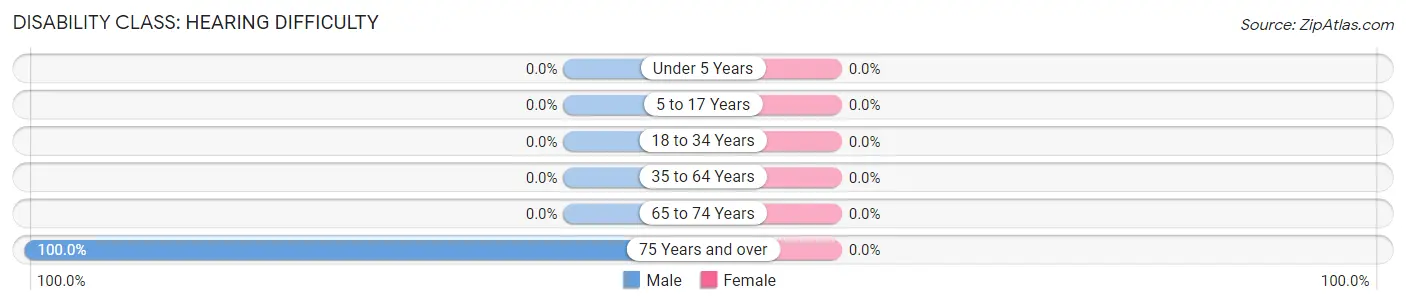
| Age Bracket | Male | Female |
| Under 5 Years | 0 (0.0%) | 0 (0.0%) |
| 5 to 17 Years | 0 (0.0%) | 0 (0.0%) |
| 18 to 34 Years | 0 (0.0%) | 0 (0.0%) |
| 35 to 64 Years | 0 (0.0%) | 0 (0.0%) |
| 65 to 74 Years | 0 (0.0%) | 0 (0.0%) |
| 75 Years and over | 8 (100.0%) | 0 (0.0%) |
Disability Class: Vision Difficulty
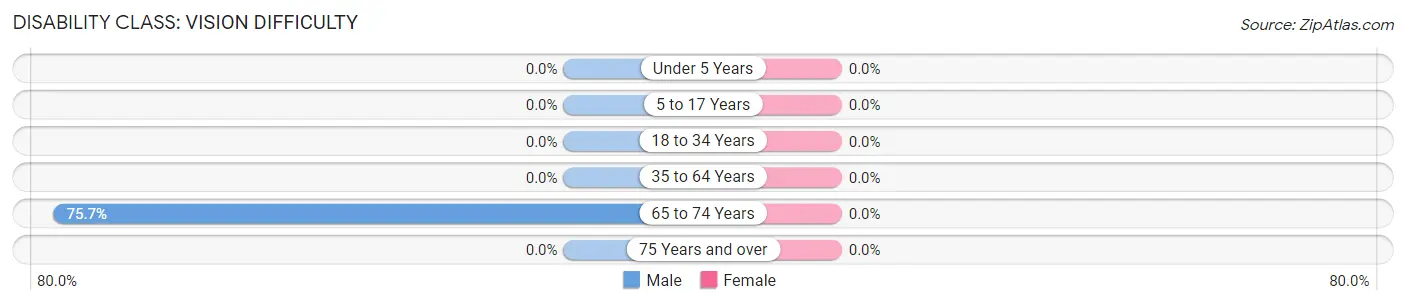
| Age Bracket | Male | Female |
| Under 5 Years | 0 (0.0%) | 0 (0.0%) |
| 5 to 17 Years | 0 (0.0%) | 0 (0.0%) |
| 18 to 34 Years | 0 (0.0%) | 0 (0.0%) |
| 35 to 64 Years | 0 (0.0%) | 0 (0.0%) |
| 65 to 74 Years | 28 (75.7%) | 0 (0.0%) |
| 75 Years and over | 0 (0.0%) | 0 (0.0%) |
Disability Class: Cognitive Difficulty
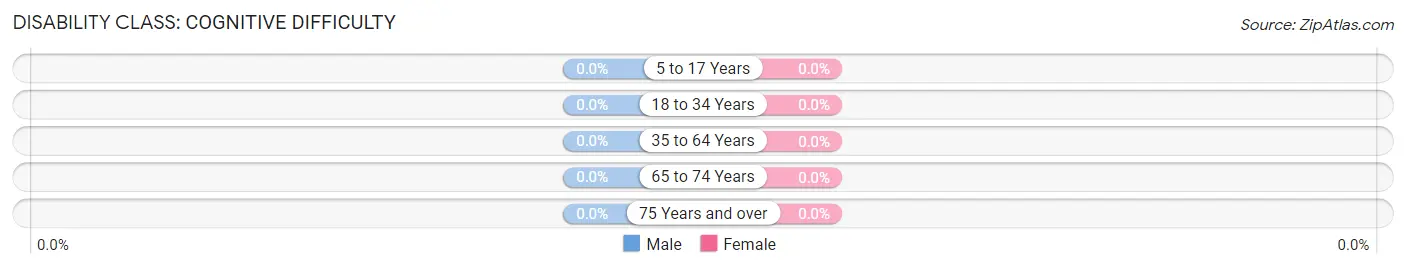
| Age Bracket | Male | Female |
| 5 to 17 Years | 0 (0.0%) | 0 (0.0%) |
| 18 to 34 Years | 0 (0.0%) | 0 (0.0%) |
| 35 to 64 Years | 0 (0.0%) | 0 (0.0%) |
| 65 to 74 Years | 0 (0.0%) | 0 (0.0%) |
| 75 Years and over | 0 (0.0%) | 0 (0.0%) |
Disability Class: Ambulatory Difficulty
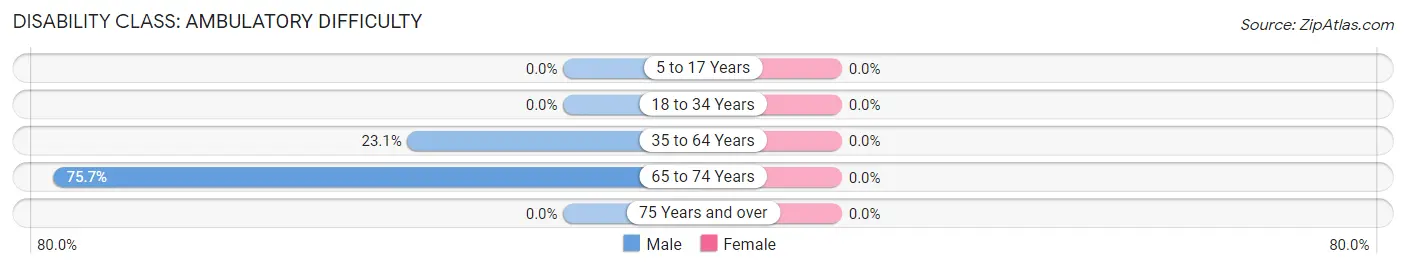
| Age Bracket | Male | Female |
| 5 to 17 Years | 0 (0.0%) | 0 (0.0%) |
| 18 to 34 Years | 0 (0.0%) | 0 (0.0%) |
| 35 to 64 Years | 28 (23.1%) | 0 (0.0%) |
| 65 to 74 Years | 28 (75.7%) | 0 (0.0%) |
| 75 Years and over | 0 (0.0%) | 0 (0.0%) |
Disability Class: Self-Care Difficulty
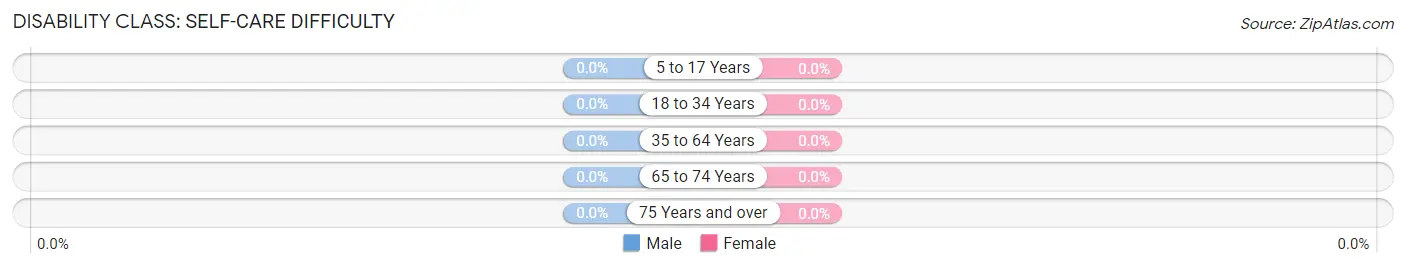
| Age Bracket | Male | Female |
| 5 to 17 Years | 0 (0.0%) | 0 (0.0%) |
| 18 to 34 Years | 0 (0.0%) | 0 (0.0%) |
| 35 to 64 Years | 0 (0.0%) | 0 (0.0%) |
| 65 to 74 Years | 0 (0.0%) | 0 (0.0%) |
| 75 Years and over | 0 (0.0%) | 0 (0.0%) |
Technology Access in Avon
Computing Device Access in Avon
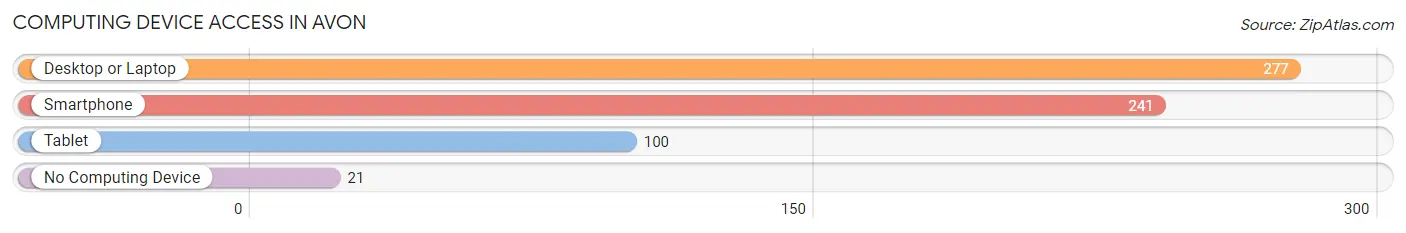
| Device Type | # Households | % Households |
| Desktop or Laptop | 277 | 92.9% |
| Smartphone | 241 | 80.9% |
| Tablet | 100 | 33.6% |
| No Computing Device | 21 | 7.0% |
| Total | 298 | 100.0% |
Internet Access in Avon
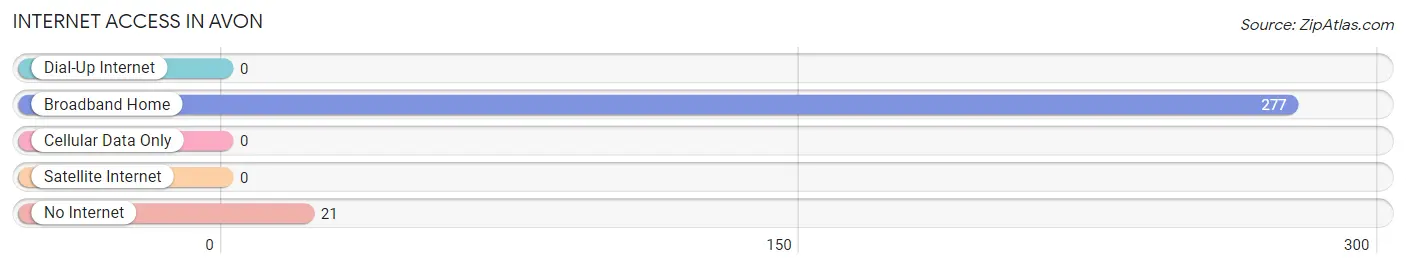
| Internet Type | # Households | % Households |
| Dial-Up Internet | 0 | 0.0% |
| Broadband Home | 277 | 92.9% |
| Cellular Data Only | 0 | 0.0% |
| Satellite Internet | 0 | 0.0% |
| No Internet | 21 | 7.0% |
| Total | 298 | 100.0% |
Avon Summary
Avon, North Carolina is a small town located in Dare County on the Outer Banks of North Carolina. It is situated on the northern end of Hatteras Island, just south of the town of Buxton. Avon is a popular tourist destination, known for its beautiful beaches, fishing, and outdoor activities.
Geography
Avon is located on the northern end of Hatteras Island, which is part of the Outer Banks of North Carolina. The town is situated between the Atlantic Ocean and Pamlico Sound, and is bordered by the towns of Buxton to the north and Rodanthe to the south. Avon is approximately 30 miles south of Nags Head, and is accessible by the Herbert C. Bonner Bridge, which connects the Outer Banks to the mainland.
Avon is a coastal town, and is known for its beautiful beaches. The town is home to several popular beaches, including Avon Beach, which is located on the Atlantic Ocean side of the island, and Avon Pier, which is located on the Pamlico Sound side. The town is also home to several parks, including the Avon Fishing Pier State Park, which offers fishing, swimming, and other recreational activities.
Economy
Avon’s economy is largely driven by tourism. The town is a popular destination for beachgoers, and is home to several hotels, restaurants, and other businesses that cater to tourists. The town is also home to several fishing charters, which offer deep-sea fishing trips.
Avon is also home to several commercial fishing operations, which provide seafood to local restaurants and markets. The town is also home to several small businesses, including retail stores, art galleries, and other shops.
Demographics
As of the 2010 census, Avon had a population of 1,068. The population is predominantly white (94.2%), with a small percentage of African Americans (3.2%) and Hispanics (2.6%). The median household income in Avon is $45,000, and the median age is 44.
Avon is a small town, but it is home to a diverse population. The town is home to several churches, including the Avon United Methodist Church, the Avon Baptist Church, and the Avon Presbyterian Church. The town is also home to several schools, including Avon Elementary School, Avon Middle School, and Avon High School.
Conclusion
Avon, North Carolina is a small town located on the Outer Banks of North Carolina. The town is known for its beautiful beaches, fishing, and outdoor activities, and is a popular tourist destination. The town’s economy is largely driven by tourism, and it is home to several small businesses, churches, and schools. Avon has a population of 1,068, and is predominantly white, with a small percentage of African Americans and Hispanics.
Common Questions
What is Per Capita Income in Avon?
Per Capita income in Avon is $30,566.
What is the Median Family Income in Avon?
Median Family Income in Avon is $56,136.
What is the Median Household income in Avon?
Median Household Income in Avon is $33,750.
What is Income or Wage Gap in Avon?
Income or Wage Gap in Avon is 35.0%.
Women in Avon earn 65.0 cents for every dollar earned by a man.
What is Inequality or Gini Index in Avon?
Inequality or Gini Index in Avon is 0.28.
What is the Total Population of Avon?
Total Population of Avon is 370.
What is the Total Male Population of Avon?
Total Male Population of Avon is 197.
What is the Total Female Population of Avon?
Total Female Population of Avon is 173.
What is the Ratio of Males per 100 Females in Avon?
There are 113.87 Males per 100 Females in Avon.
What is the Ratio of Females per 100 Males in Avon?
There are 87.82 Females per 100 Males in Avon.
What is the Median Population Age in Avon?
Median Population Age in Avon is 57.0 Years.
What is the Average Family Size in Avon
Average Family Size in Avon is 2.6 People.
What is the Average Household Size in Avon
Average Household Size in Avon is 1.2 People.
How Large is the Labor Force in Avon?
There are 210 People in the Labor Forcein in Avon.
What is the Percentage of People in the Labor Force in Avon?
56.8% of People are in the Labor Force in Avon.
What is the Unemployment Rate in Avon?
Unemployment Rate in Avon is 32.9%.