Warsaw, NC Map & Demographics
Warsaw Map
Warsaw Overview
$18,137
PER CAPITA INCOME
$41,846
AVG FAMILY INCOME
$41,831
AVG HOUSEHOLD INCOME
13.5%
WAGE / INCOME GAP [ % ]
86.5¢/ $1
WAGE / INCOME GAP [ $ ]
0.38
INEQUALITY / GINI INDEX
2,743
TOTAL POPULATION
912
MALE POPULATION
1,831
FEMALE POPULATION
49.81
MALES / 100 FEMALES
200.77
FEMALES / 100 MALES
34.3
MEDIAN AGE
4.3
AVG FAMILY SIZE
2.6
AVG HOUSEHOLD SIZE
1,040
LABOR FORCE [ PEOPLE ]
50.8%
PERCENT IN LABOR FORCE
6.0%
UNEMPLOYMENT RATE
Warsaw Zip Codes
Warsaw Area Codes
Income in Warsaw
Income Overview in Warsaw
Per Capita Income in Warsaw is $18,137, while median incomes of families and households are $41,846 and $41,831 respectively.
| Characteristic | Number | Measure |
| Per Capita Income | 2,743 | $18,137 |
| Median Family Income | 398 | $41,846 |
| Mean Family Income | 398 | $57,670 |
| Median Household Income | 1,025 | $41,831 |
| Mean Household Income | 1,025 | $47,631 |
| Income Deficit | 398 | $0 |
| Wage / Income Gap (%) | 2,743 | 13.46% |
| Wage / Income Gap ($) | 2,743 | 86.54¢ per $1 |
| Gini / Inequality Index | 2,743 | 0.38 |
Earnings by Sex in Warsaw
Average Earnings in Warsaw are $30,371, $31,777 for men and $27,500 for women, a difference of 13.5%.
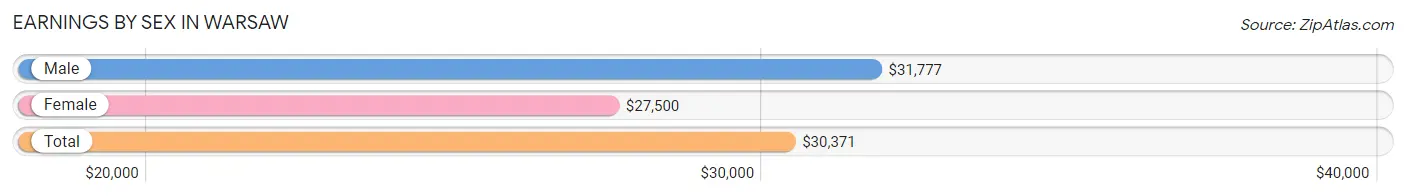
| Sex | Number | Average Earnings |
| Male | 597 (49.9%) | $31,777 |
| Female | 600 (50.1%) | $27,500 |
| Total | 1,197 (100.0%) | $30,371 |
Earnings by Sex by Income Bracket in Warsaw
The most common earnings brackets in Warsaw are $45,000 to $49,999 for men (161 | 27.0%) and $25,000 to $29,999 for women (159 | 26.5%).
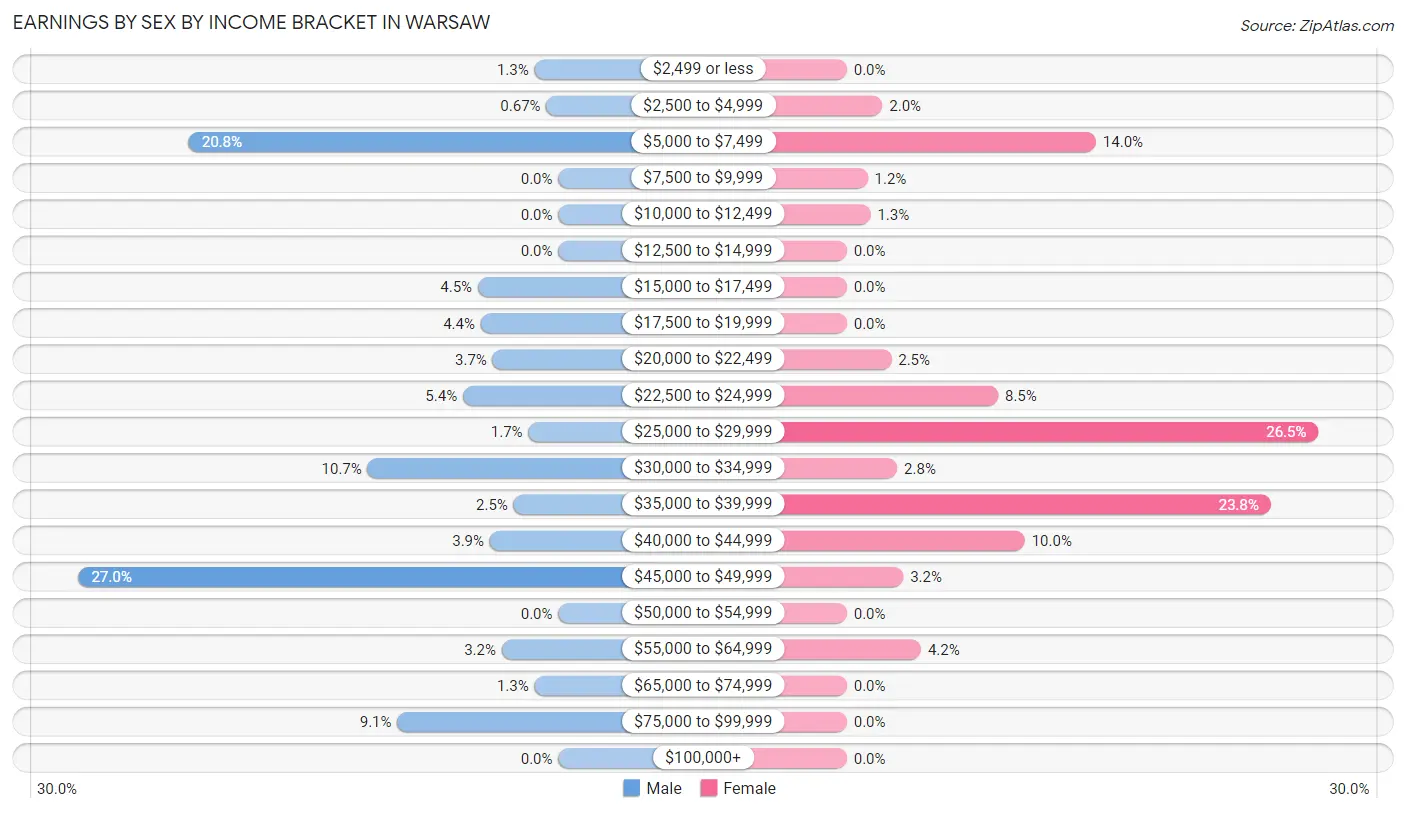
| Income | Male | Female |
| $2,499 or less | 8 (1.3%) | 0 (0.0%) |
| $2,500 to $4,999 | 4 (0.7%) | 12 (2.0%) |
| $5,000 to $7,499 | 124 (20.8%) | 84 (14.0%) |
| $7,500 to $9,999 | 0 (0.0%) | 7 (1.2%) |
| $10,000 to $12,499 | 0 (0.0%) | 8 (1.3%) |
| $12,500 to $14,999 | 0 (0.0%) | 0 (0.0%) |
| $15,000 to $17,499 | 27 (4.5%) | 0 (0.0%) |
| $17,500 to $19,999 | 26 (4.4%) | 0 (0.0%) |
| $20,000 to $22,499 | 22 (3.7%) | 15 (2.5%) |
| $22,500 to $24,999 | 32 (5.4%) | 51 (8.5%) |
| $25,000 to $29,999 | 10 (1.7%) | 159 (26.5%) |
| $30,000 to $34,999 | 64 (10.7%) | 17 (2.8%) |
| $35,000 to $39,999 | 15 (2.5%) | 143 (23.8%) |
| $40,000 to $44,999 | 23 (3.8%) | 60 (10.0%) |
| $45,000 to $49,999 | 161 (27.0%) | 19 (3.2%) |
| $50,000 to $54,999 | 0 (0.0%) | 0 (0.0%) |
| $55,000 to $64,999 | 19 (3.2%) | 25 (4.2%) |
| $65,000 to $74,999 | 8 (1.3%) | 0 (0.0%) |
| $75,000 to $99,999 | 54 (9.0%) | 0 (0.0%) |
| $100,000+ | 0 (0.0%) | 0 (0.0%) |
| Total | 597 (100.0%) | 600 (100.0%) |
Earnings by Sex by Educational Attainment in Warsaw
Average earnings in Warsaw are $32,441 for men and $37,587 for women, a difference of 13.7%. Men with an educational attainment of bachelor's degree enjoy the highest average annual earnings of $58,882, while those with college or associate's degree education earn the least with $39,083. Women with an educational attainment of high school diploma earn the most with the average annual earnings of $38,207, while those with college or associate's degree education have the smallest earnings of $35,446.
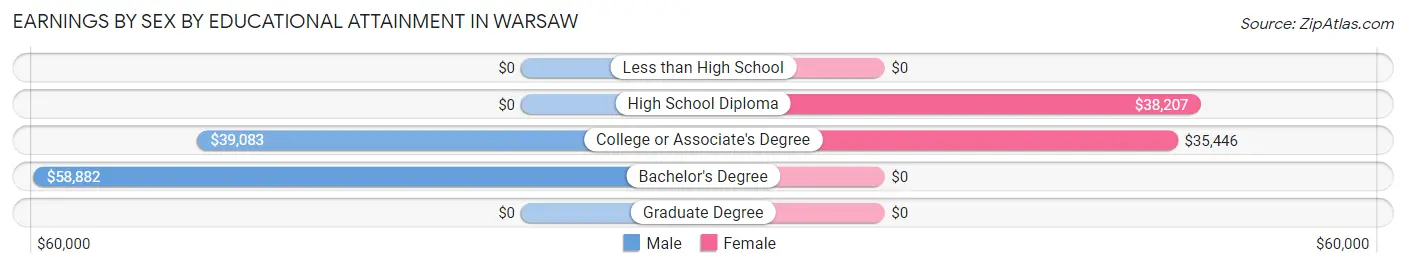
| Educational Attainment | Male Income | Female Income |
| Less than High School | - | - |
| High School Diploma | - | - |
| College or Associate's Degree | $39,083 | $35,446 |
| Bachelor's Degree | $58,882 | $0 |
| Graduate Degree | - | - |
| Total | $32,441 | $37,587 |
Family Income in Warsaw
Family Income Brackets in Warsaw
According to the Warsaw family income data, there are 143 families falling into the $35,000 to $49,999 income range, which is the most common income bracket and makes up 35.9% of all families.
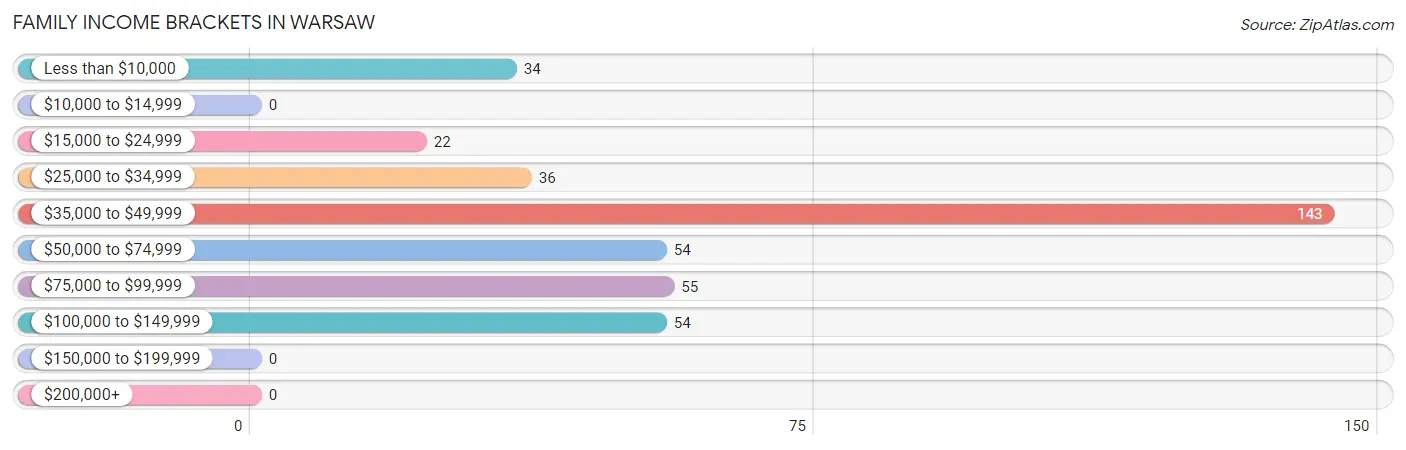
| Income Bracket | # Families | % Families |
| Less than $10,000 | 34 | 8.5% |
| $10,000 to $14,999 | 0 | 0.0% |
| $15,000 to $24,999 | 22 | 5.5% |
| $25,000 to $34,999 | 36 | 9.0% |
| $35,000 to $49,999 | 143 | 35.9% |
| $50,000 to $74,999 | 54 | 13.6% |
| $75,000 to $99,999 | 55 | 13.8% |
| $100,000 to $149,999 | 54 | 13.6% |
| $150,000 to $199,999 | 0 | 0.0% |
| $200,000+ | 0 | 0.0% |
Family Income by Famaliy Size in Warsaw
4-person families (82 | 20.6%) account for the highest median family income in Warsaw with $127,772 per family, while 4-person families (82 | 20.6%) have the highest median income of $31,943 per family member.
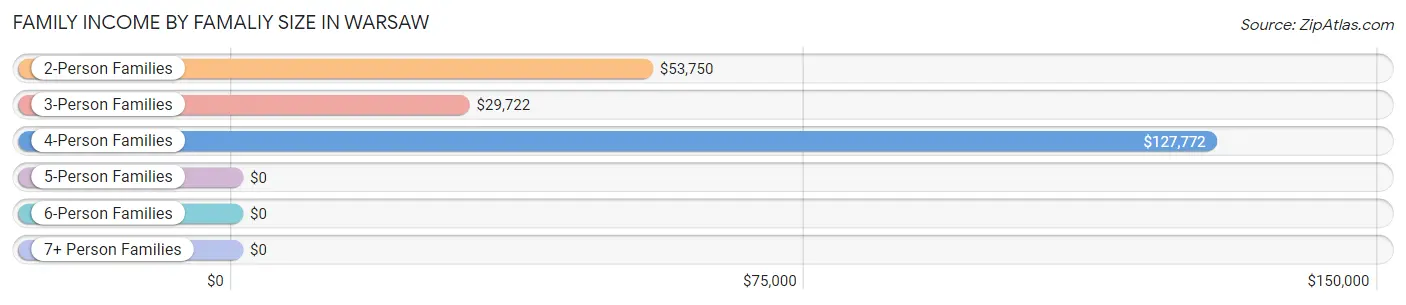
| Income Bracket | # Families | Median Income |
| 2-Person Families | 100 (25.1%) | $53,750 |
| 3-Person Families | 132 (33.2%) | $29,722 |
| 4-Person Families | 82 (20.6%) | $127,772 |
| 5-Person Families | 0 (0.0%) | $0 |
| 6-Person Families | 84 (21.1%) | $0 |
| 7+ Person Families | 0 (0.0%) | $0 |
| Total | 398 (100.0%) | $41,846 |
Family Income by Number of Earners in Warsaw
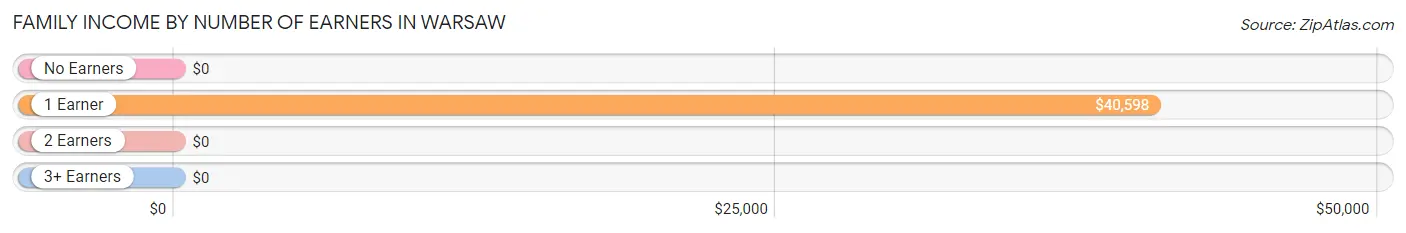
| Number of Earners | # Families | Median Income |
| No Earners | 78 (19.6%) | $0 |
| 1 Earner | 127 (31.9%) | $40,598 |
| 2 Earners | 65 (16.3%) | $0 |
| 3+ Earners | 128 (32.2%) | $0 |
| Total | 398 (100.0%) | $41,846 |
Household Income in Warsaw
Household Income Brackets in Warsaw
With 290 households falling in the category, the $35,000 to $49,999 income range is the most frequent in Warsaw, accounting for 28.3% of all households.
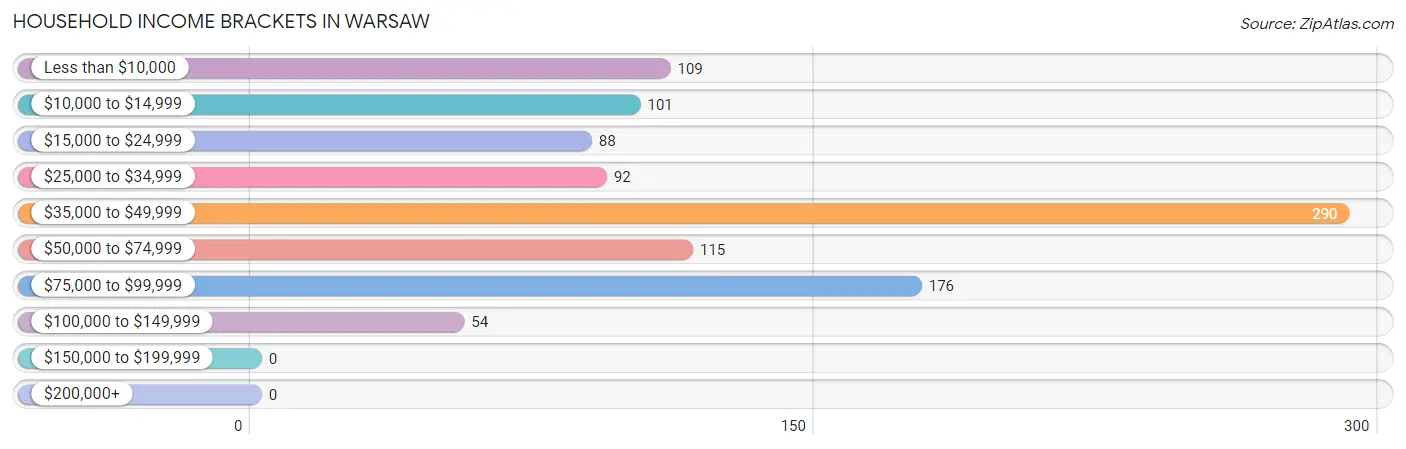
| Income Bracket | # Households | % Households |
| Less than $10,000 | 109 | 10.6% |
| $10,000 to $14,999 | 101 | 9.9% |
| $15,000 to $24,999 | 88 | 8.6% |
| $25,000 to $34,999 | 92 | 9.0% |
| $35,000 to $49,999 | 290 | 28.3% |
| $50,000 to $74,999 | 115 | 11.2% |
| $75,000 to $99,999 | 176 | 17.2% |
| $100,000 to $149,999 | 54 | 5.3% |
| $150,000 to $199,999 | 0 | 0.0% |
| $200,000+ | 0 | 0.0% |
Household Income by Householder Age in Warsaw
The median household income in Warsaw is $41,831, with the highest median household income of $48,102 found in the 45 to 64 years age bracket for the primary householder. A total of 212 households (20.7%) fall into this category. Meanwhile, the 15 to 24 years age bracket for the primary householder has the lowest median household income of $0, with 16 households (1.6%) in this group.
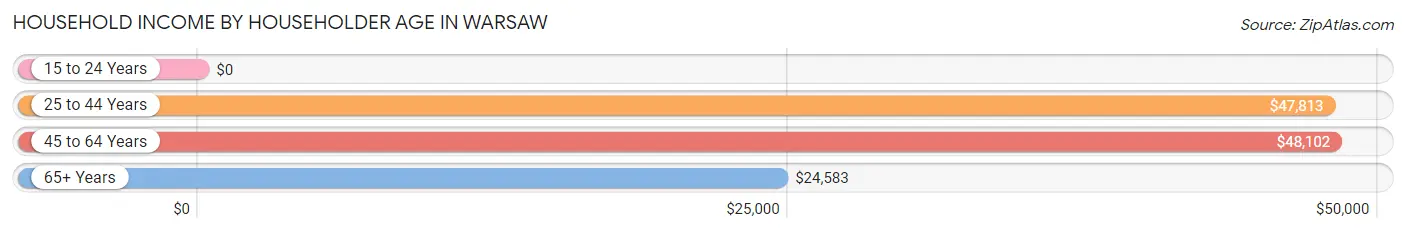
| Income Bracket | # Households | Median Income |
| 15 to 24 Years | 16 (1.6%) | $0 |
| 25 to 44 Years | 407 (39.7%) | $47,813 |
| 45 to 64 Years | 212 (20.7%) | $48,102 |
| 65+ Years | 390 (38.1%) | $24,583 |
| Total | 1,025 (100.0%) | $41,831 |
Poverty in Warsaw
Income Below Poverty by Sex and Age in Warsaw
With 8.2% poverty level for males and 11.3% for females among the residents of Warsaw, under 5 year old males and 45 to 54 year old females are the most vulnerable to poverty, with 44 males (100.0%) and 54 females (55.7%) in their respective age groups living below the poverty level.
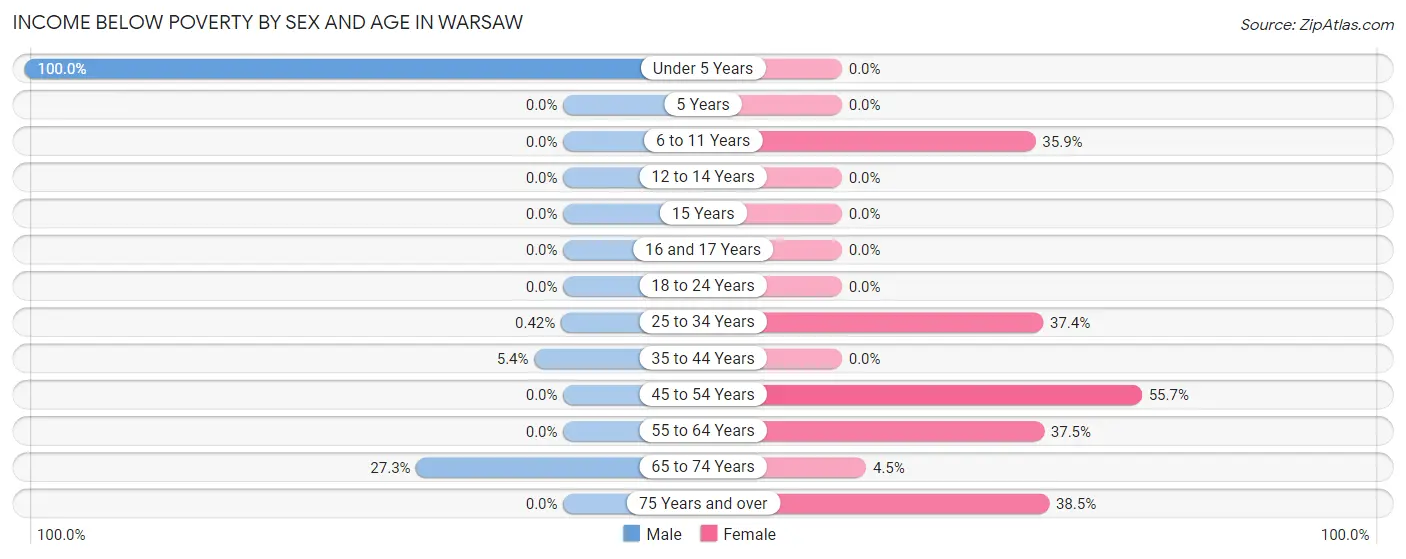
| Age Bracket | Male | Female |
| Under 5 Years | 44 (100.0%) | 0 (0.0%) |
| 5 Years | 0 (0.0%) | 0 (0.0%) |
| 6 to 11 Years | 0 (0.0%) | 23 (35.9%) |
| 12 to 14 Years | 0 (0.0%) | 0 (0.0%) |
| 15 Years | 0 (0.0%) | 0 (0.0%) |
| 16 and 17 Years | 0 (0.0%) | 0 (0.0%) |
| 18 to 24 Years | 0 (0.0%) | 0 (0.0%) |
| 25 to 34 Years | 1 (0.4%) | 34 (37.4%) |
| 35 to 44 Years | 10 (5.4%) | 0 (0.0%) |
| 45 to 54 Years | 0 (0.0%) | 54 (55.7%) |
| 55 to 64 Years | 0 (0.0%) | 12 (37.5%) |
| 65 to 74 Years | 12 (27.3%) | 9 (4.5%) |
| 75 Years and over | 0 (0.0%) | 65 (38.5%) |
| Total | 67 (8.2%) | 197 (11.3%) |
Income Above Poverty by Sex and Age in Warsaw
According to the poverty statistics in Warsaw, males aged 12 to 14 years and females aged under 5 years are the age groups that are most secure financially, with 100.0% of males and 100.0% of females in these age groups living above the poverty line.
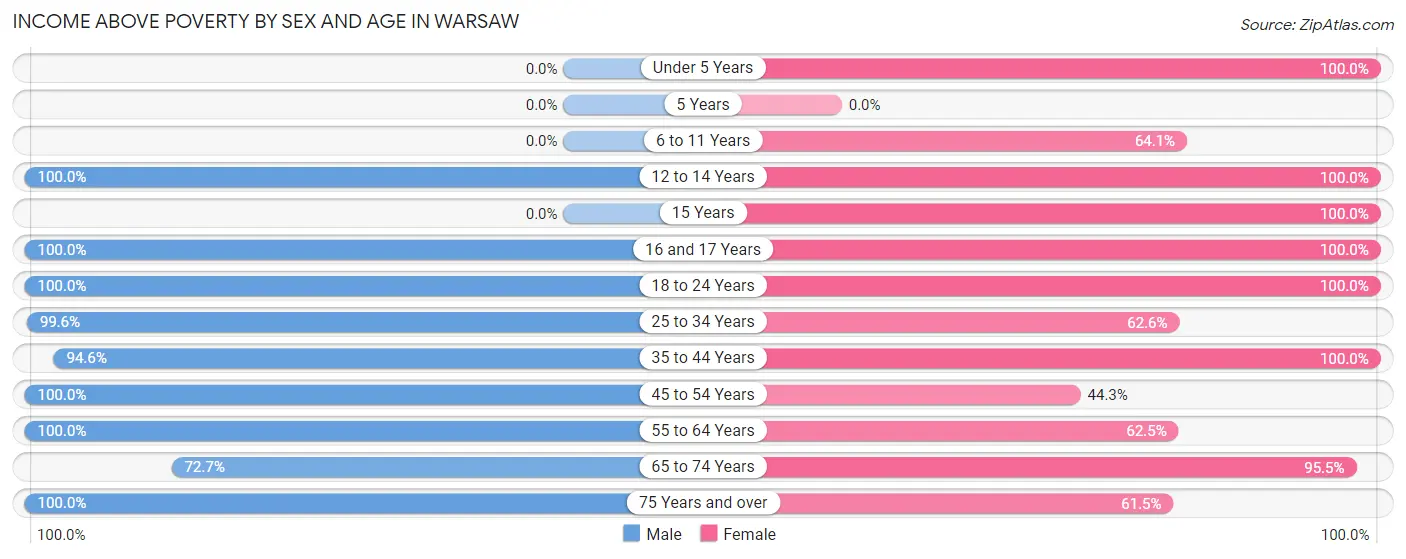
| Age Bracket | Male | Female |
| Under 5 Years | 0 (0.0%) | 208 (100.0%) |
| 5 Years | 0 (0.0%) | 0 (0.0%) |
| 6 to 11 Years | 0 (0.0%) | 41 (64.1%) |
| 12 to 14 Years | 34 (100.0%) | 96 (100.0%) |
| 15 Years | 0 (0.0%) | 161 (100.0%) |
| 16 and 17 Years | 8 (100.0%) | 12 (100.0%) |
| 18 to 24 Years | 26 (100.0%) | 327 (100.0%) |
| 25 to 34 Years | 236 (99.6%) | 57 (62.6%) |
| 35 to 44 Years | 176 (94.6%) | 294 (100.0%) |
| 45 to 54 Years | 61 (100.0%) | 43 (44.3%) |
| 55 to 64 Years | 91 (100.0%) | 20 (62.5%) |
| 65 to 74 Years | 32 (72.7%) | 191 (95.5%) |
| 75 Years and over | 86 (100.0%) | 104 (61.5%) |
| Total | 750 (91.8%) | 1,554 (88.7%) |
Income Below Poverty Among Married-Couple Families in Warsaw
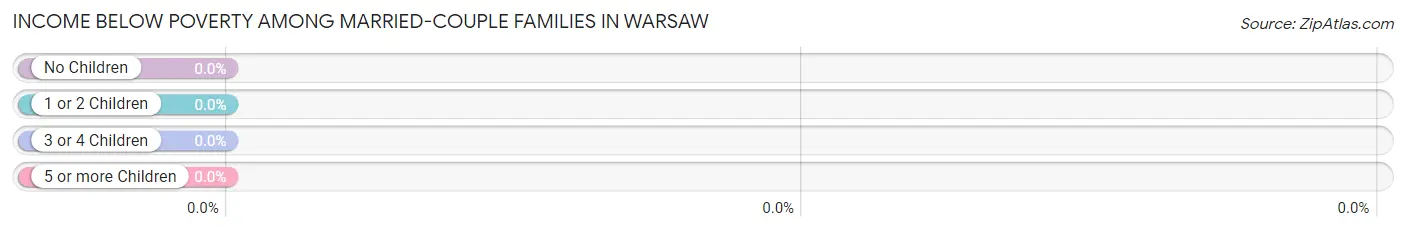
| Children | Above Poverty | Below Poverty |
| No Children | 100 (100.0%) | 0 (0.0%) |
| 1 or 2 Children | 97 (100.0%) | 0 (0.0%) |
| 3 or 4 Children | 84 (100.0%) | 0 (0.0%) |
| 5 or more Children | 0 (0.0%) | 0 (0.0%) |
| Total | 281 (100.0%) | 0 (0.0%) |
Income Below Poverty Among Single-Parent Households in Warsaw
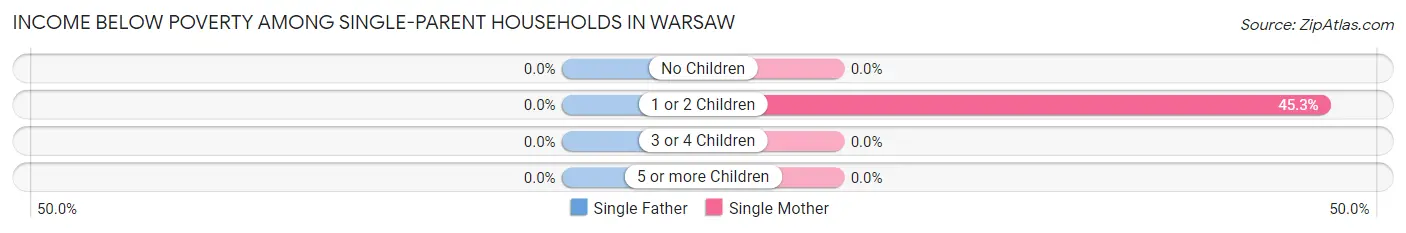
| Children | Single Father | Single Mother |
| No Children | 0 (0.0%) | 0 (0.0%) |
| 1 or 2 Children | 0 (0.0%) | 34 (45.3%) |
| 3 or 4 Children | 0 (0.0%) | 0 (0.0%) |
| 5 or more Children | 0 (0.0%) | 0 (0.0%) |
| Total | 0 (0.0%) | 34 (37.4%) |
Income Below Poverty Among Married-Couple vs Single-Parent Households in Warsaw
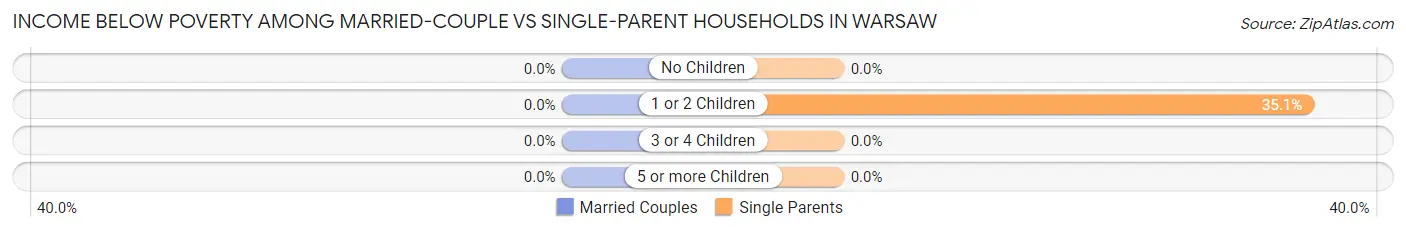
| Children | Married-Couple Families | Single-Parent Households |
| No Children | 0 (0.0%) | 0 (0.0%) |
| 1 or 2 Children | 0 (0.0%) | 34 (35.0%) |
| 3 or 4 Children | 0 (0.0%) | 0 (0.0%) |
| 5 or more Children | 0 (0.0%) | 0 (0.0%) |
| Total | 0 (0.0%) | 34 (29.1%) |
Race in Warsaw
The most populous races in Warsaw are Black / African American (1,176 | 42.9%), White / Caucasian (999 | 36.4%), and Hispanic or Latino (777 | 28.3%).
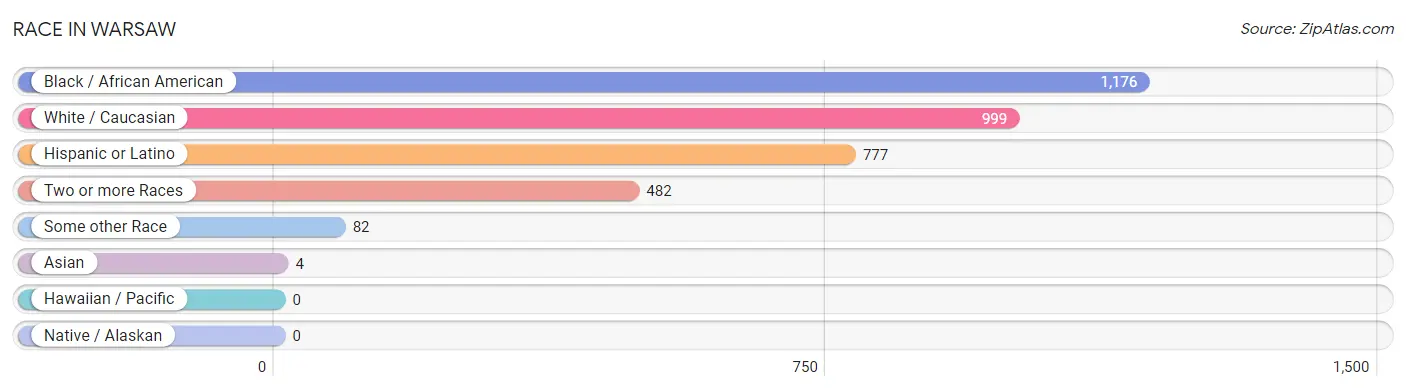
| Race | # Population | % Population |
| Asian | 4 | 0.2% |
| Black / African American | 1,176 | 42.9% |
| Hawaiian / Pacific | 0 | 0.0% |
| Hispanic or Latino | 777 | 28.3% |
| Native / Alaskan | 0 | 0.0% |
| White / Caucasian | 999 | 36.4% |
| Two or more Races | 482 | 17.6% |
| Some other Race | 82 | 3.0% |
| Total | 2,743 | 100.0% |
Ancestry in Warsaw
The most populous ancestries reported in Warsaw are Mexican (677 | 24.7%), Haitian (606 | 22.1%), American (181 | 6.6%), English (87 | 3.2%), and German (44 | 1.6%), together accounting for 58.1% of all Warsaw residents.
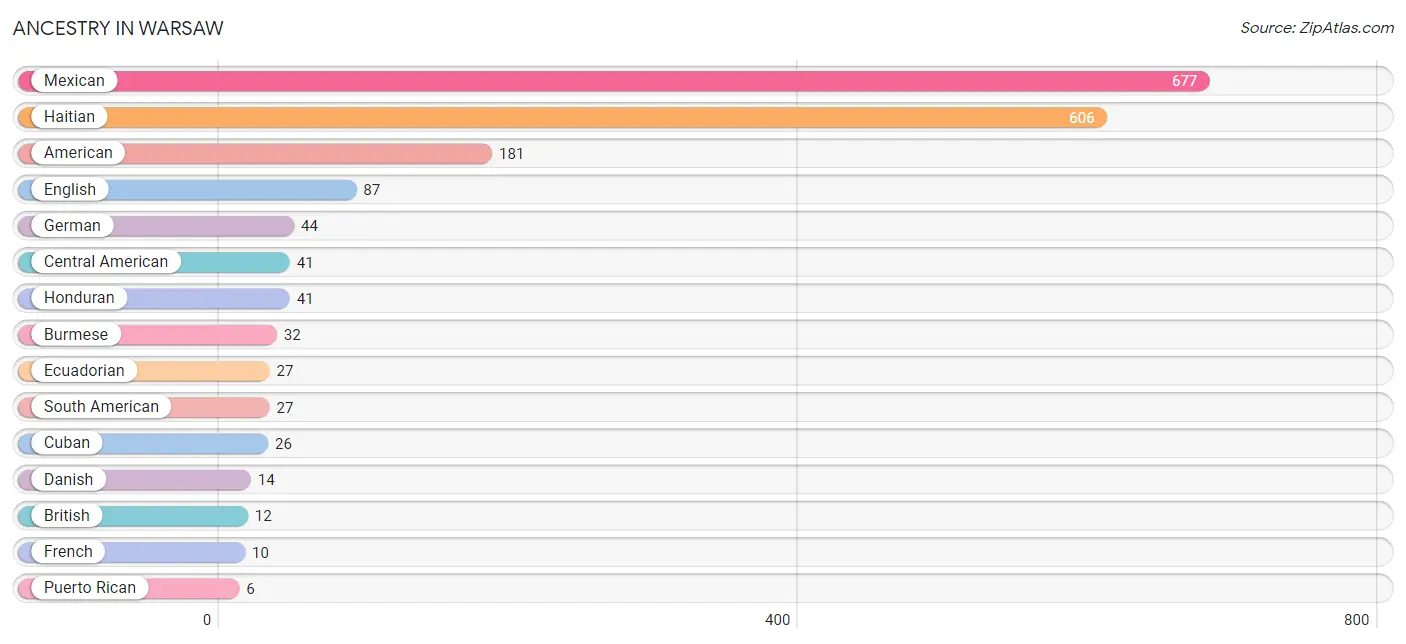
| Ancestry | # Population | % Population |
| African | 4 | 0.2% |
| American | 181 | 6.6% |
| British | 12 | 0.4% |
| Burmese | 32 | 1.2% |
| Central American | 41 | 1.5% |
| Cuban | 26 | 0.9% |
| Danish | 14 | 0.5% |
| Ecuadorian | 27 | 1.0% |
| English | 87 | 3.2% |
| French | 10 | 0.4% |
| German | 44 | 1.6% |
| Haitian | 606 | 22.1% |
| Honduran | 41 | 1.5% |
| Irish | 2 | 0.1% |
| Mexican | 677 | 24.7% |
| Puerto Rican | 6 | 0.2% |
| South American | 27 | 1.0% |
| Sri Lankan | 4 | 0.2% |
| Subsaharan African | 4 | 0.2% | View All 19 Rows |
Immigrants in Warsaw
The most numerous immigrant groups reported in Warsaw came from Latin America (1,288 | 47.0%), Central America (679 | 24.7%), Mexico (664 | 24.2%), Caribbean (582 | 21.2%), and Haiti (560 | 20.4%), together accounting for 137.6% of all Warsaw residents.
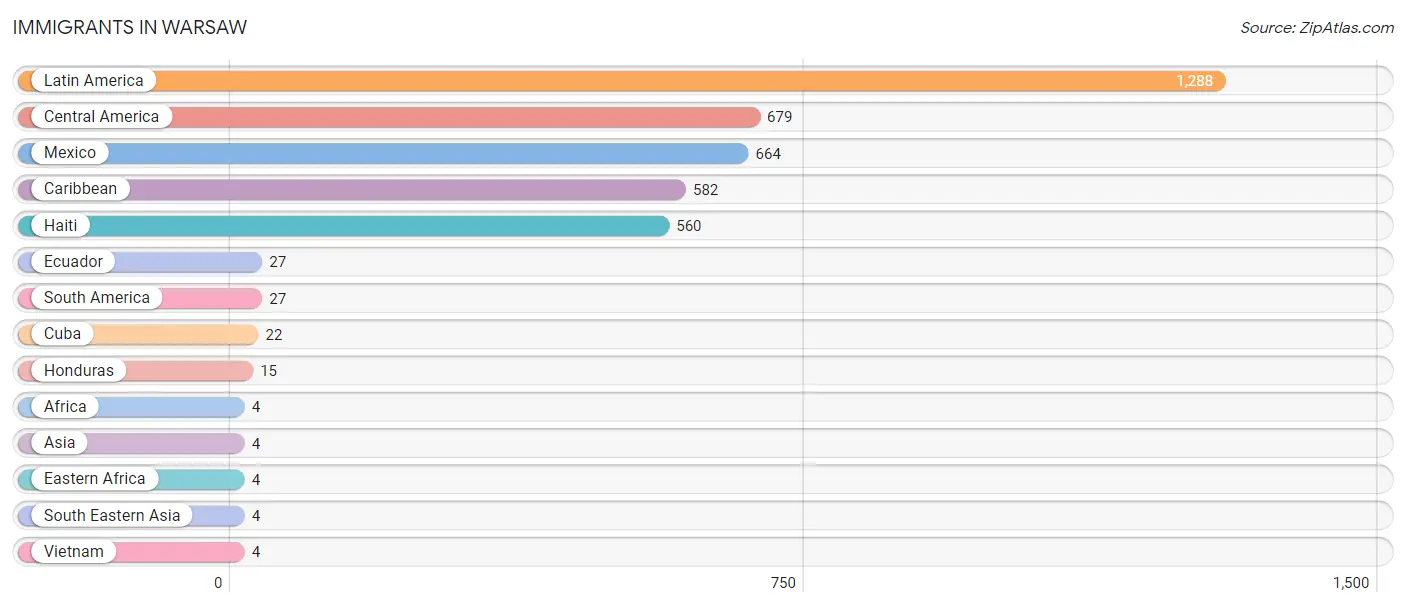
| Immigration Origin | # Population | % Population |
| Africa | 4 | 0.2% |
| Asia | 4 | 0.2% |
| Caribbean | 582 | 21.2% |
| Central America | 679 | 24.7% |
| Cuba | 22 | 0.8% |
| Eastern Africa | 4 | 0.2% |
| Ecuador | 27 | 1.0% |
| Haiti | 560 | 20.4% |
| Honduras | 15 | 0.5% |
| Latin America | 1,288 | 47.0% |
| Mexico | 664 | 24.2% |
| South America | 27 | 1.0% |
| South Eastern Asia | 4 | 0.2% |
| Vietnam | 4 | 0.2% | View All 14 Rows |
Sex and Age in Warsaw
Sex and Age in Warsaw
The most populous age groups in Warsaw are 30 to 34 Years (231 | 25.3%) for men and 20 to 24 Years (303 | 16.6%) for women.
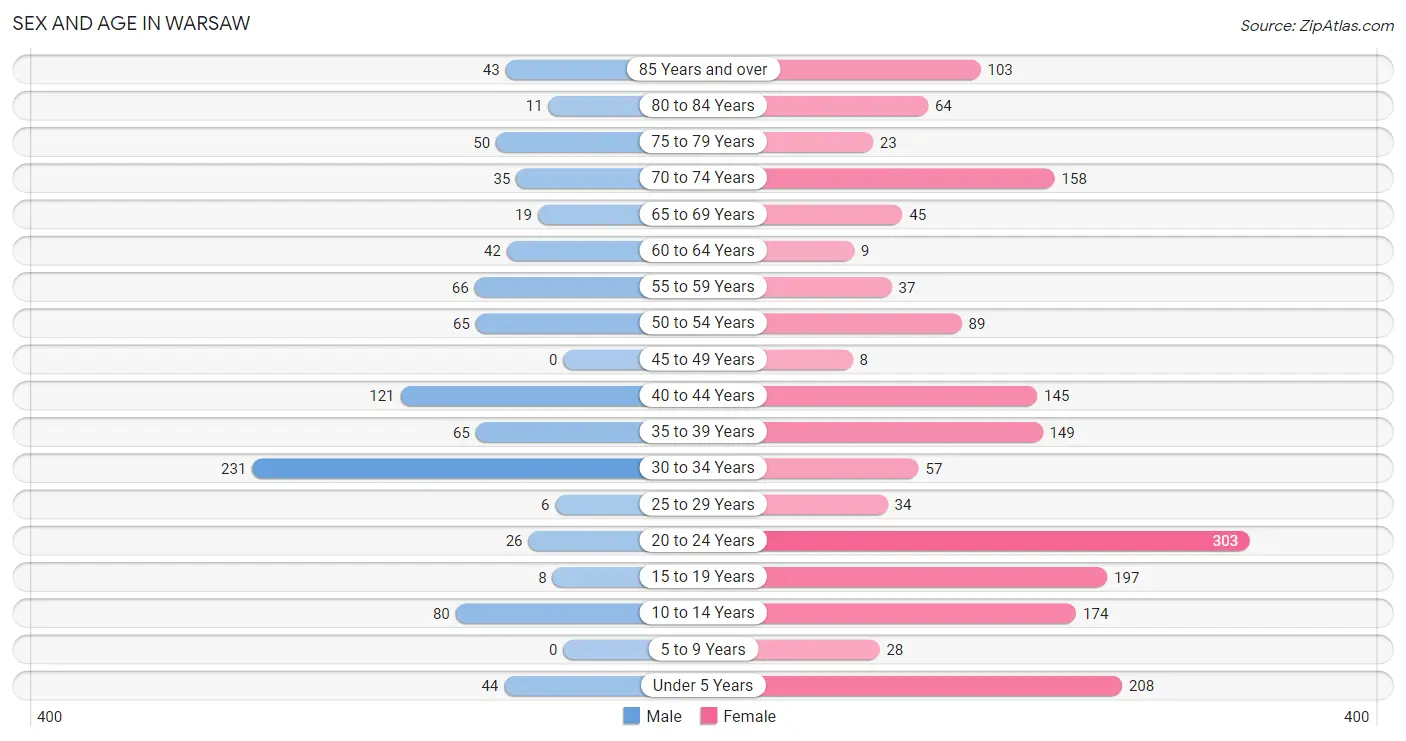
| Age Bracket | Male | Female |
| Under 5 Years | 44 (4.8%) | 208 (11.4%) |
| 5 to 9 Years | 0 (0.0%) | 28 (1.5%) |
| 10 to 14 Years | 80 (8.8%) | 174 (9.5%) |
| 15 to 19 Years | 8 (0.9%) | 197 (10.8%) |
| 20 to 24 Years | 26 (2.9%) | 303 (16.6%) |
| 25 to 29 Years | 6 (0.7%) | 34 (1.9%) |
| 30 to 34 Years | 231 (25.3%) | 57 (3.1%) |
| 35 to 39 Years | 65 (7.1%) | 149 (8.1%) |
| 40 to 44 Years | 121 (13.3%) | 145 (7.9%) |
| 45 to 49 Years | 0 (0.0%) | 8 (0.4%) |
| 50 to 54 Years | 65 (7.1%) | 89 (4.9%) |
| 55 to 59 Years | 66 (7.2%) | 37 (2.0%) |
| 60 to 64 Years | 42 (4.6%) | 9 (0.5%) |
| 65 to 69 Years | 19 (2.1%) | 45 (2.5%) |
| 70 to 74 Years | 35 (3.8%) | 158 (8.6%) |
| 75 to 79 Years | 50 (5.5%) | 23 (1.3%) |
| 80 to 84 Years | 11 (1.2%) | 64 (3.5%) |
| 85 Years and over | 43 (4.7%) | 103 (5.6%) |
| Total | 912 (100.0%) | 1,831 (100.0%) |
Families and Households in Warsaw
Median Family Size in Warsaw
The median family size in Warsaw is 4.27 persons per family, with married-couple families (281 | 70.6%) accounting for the largest median family size of 5 persons per family. On the other hand, single male/father families (26 | 6.5%) represent the smallest median family size with 1.77 persons per family.
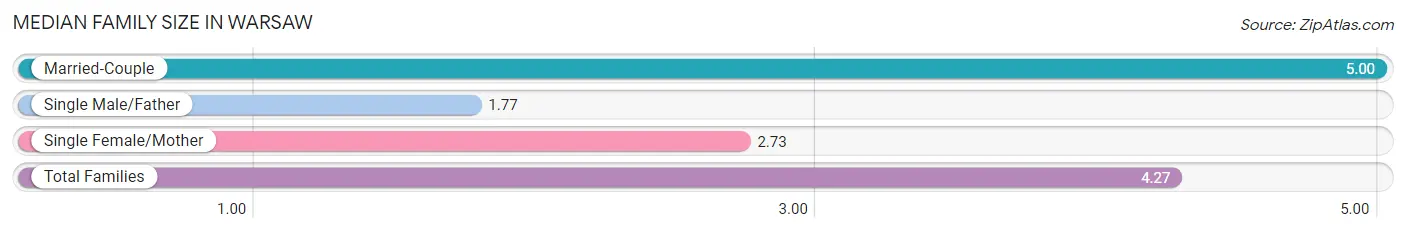
| Family Type | # Families | Family Size |
| Married-Couple | 281 (70.6%) | 5.00 |
| Single Male/Father | 26 (6.5%) | 1.77 |
| Single Female/Mother | 91 (22.9%) | 2.73 |
| Total Families | 398 (100.0%) | 4.27 |
Median Household Size in Warsaw
The median household size in Warsaw is 2.58 persons per household, with married-couple households (281 | 27.4%) accounting for the largest median household size of 5 persons per household. non-family households (627 | 61.2%) represent the smallest median household size with 1.49 persons per household.
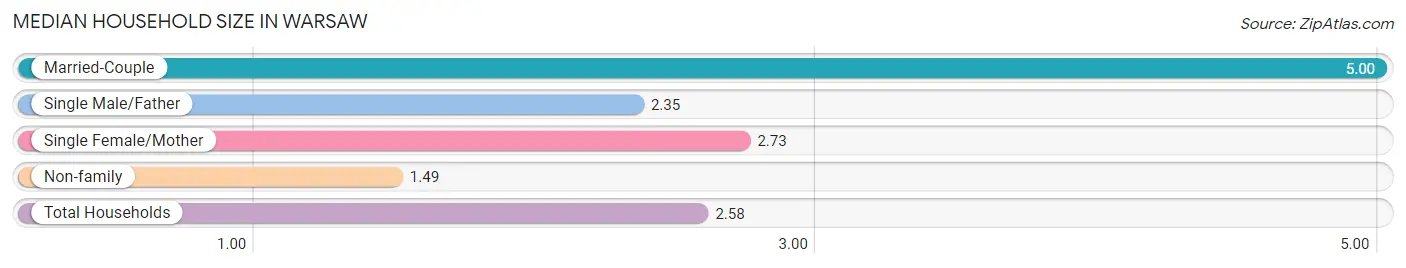
| Household Type | # Households | Household Size |
| Married-Couple | 281 (27.4%) | 5.00 |
| Single Male/Father | 26 (2.5%) | 2.35 |
| Single Female/Mother | 91 (8.9%) | 2.73 |
| Non-family | 627 (61.2%) | 1.49 |
| Total Households | 1,025 (100.0%) | 2.58 |
Household Size by Marriage Status in Warsaw
Out of a total of 1,025 households in Warsaw, 398 (38.8%) are family households, while 627 (61.2%) are nonfamily households. The most numerous type of family households are 3-person households, comprising 154, and the most common type of nonfamily households are 1-person households, comprising 410.
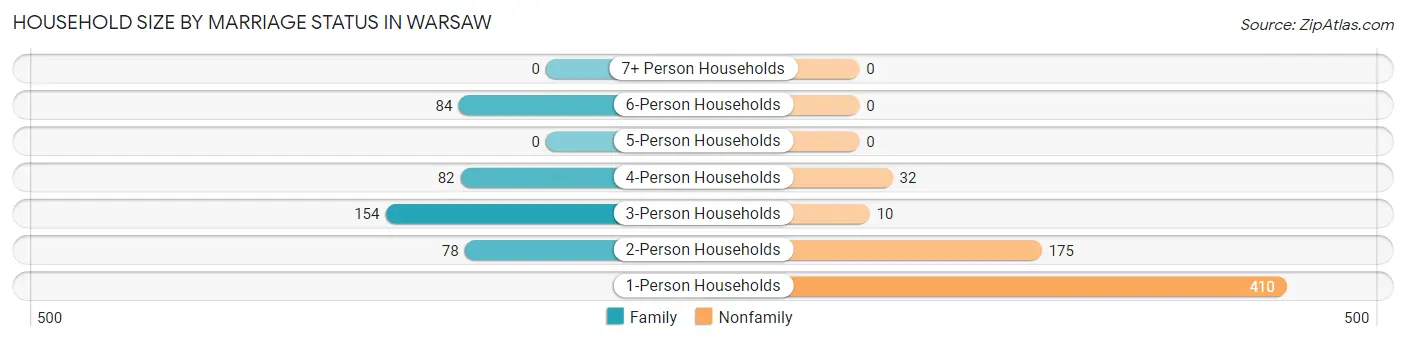
| Household Size | Family Households | Nonfamily Households |
| 1-Person Households | - | 410 (40.0%) |
| 2-Person Households | 78 (7.6%) | 175 (17.1%) |
| 3-Person Households | 154 (15.0%) | 10 (1.0%) |
| 4-Person Households | 82 (8.0%) | 32 (3.1%) |
| 5-Person Households | 0 (0.0%) | 0 (0.0%) |
| 6-Person Households | 84 (8.2%) | 0 (0.0%) |
| 7+ Person Households | 0 (0.0%) | 0 (0.0%) |
| Total | 398 (38.8%) | 627 (61.2%) |
Female Fertility in Warsaw
Fertility by Age in Warsaw
Average fertility rate in Warsaw is 332.0 births per 1,000 women. Women in the age bracket of 20 to 34 years have the highest fertility rate with 769.0 births per 1,000 women. Women in the age bracket of 20 to 34 years acount for 100.0% of all women with births.
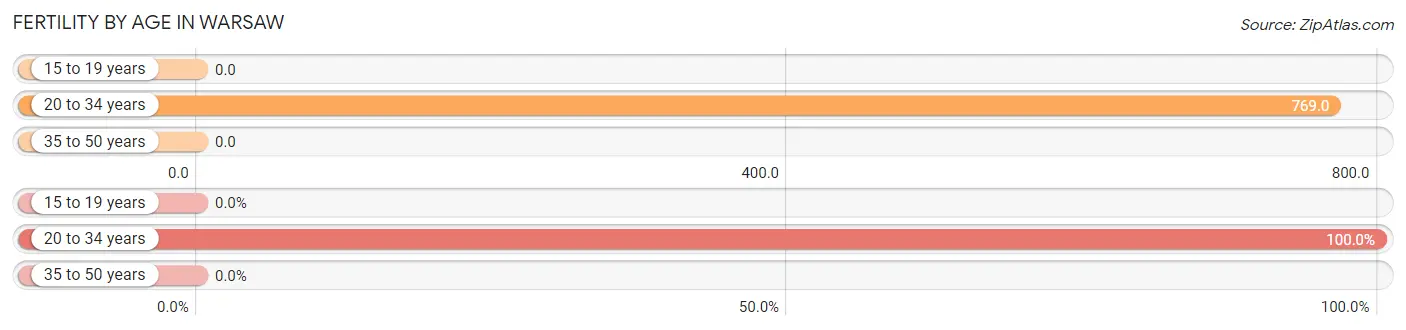
| Age Bracket | Women with Births | Births / 1,000 Women |
| 15 to 19 years | 0 (0.0%) | 0.0 |
| 20 to 34 years | 303 (100.0%) | 769.0 |
| 35 to 50 years | 0 (0.0%) | 0.0 |
| Total | 303 (100.0%) | 332.0 |
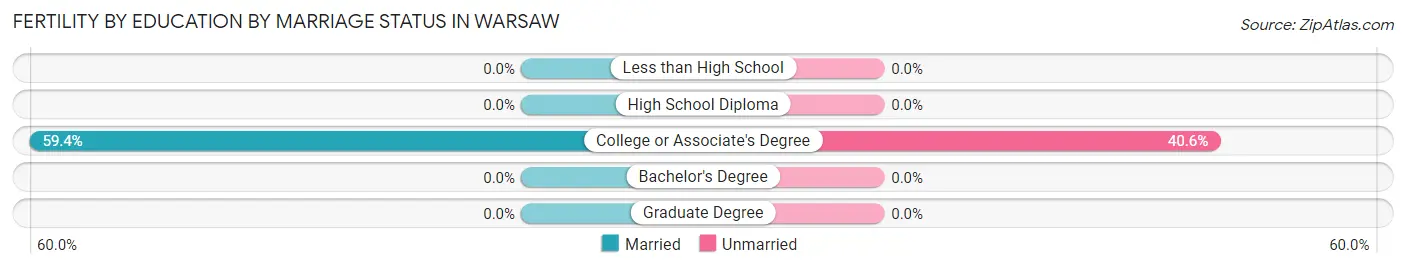
Fertility by Age by Marriage Status in Warsaw
59.4% of women with births (303) in Warsaw are married. The highest percentage of unmarried women with births falls into 20 to 34 years age bracket with 40.6% of them unmarried at the time of birth, while the lowest percentage of unmarried women with births belong to 20 to 34 years age bracket with 40.6% of them unmarried.
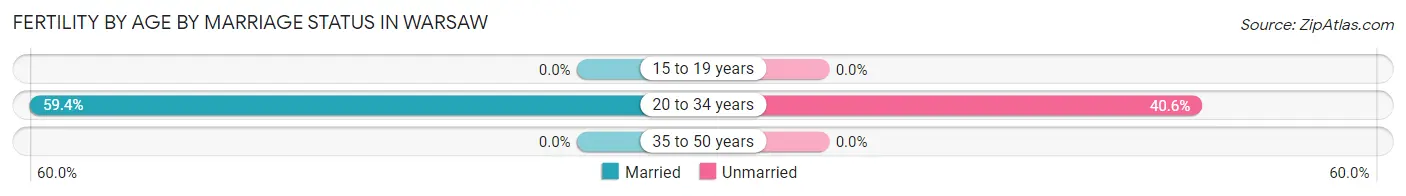
| Age Bracket | Married | Unmarried |
| 15 to 19 years | 0 (0.0%) | 0 (0.0%) |
| 20 to 34 years | 180 (59.4%) | 123 (40.6%) |
| 35 to 50 years | 0 (0.0%) | 0 (0.0%) |
| Total | 180 (59.4%) | 123 (40.6%) |
Fertility by Education in Warsaw
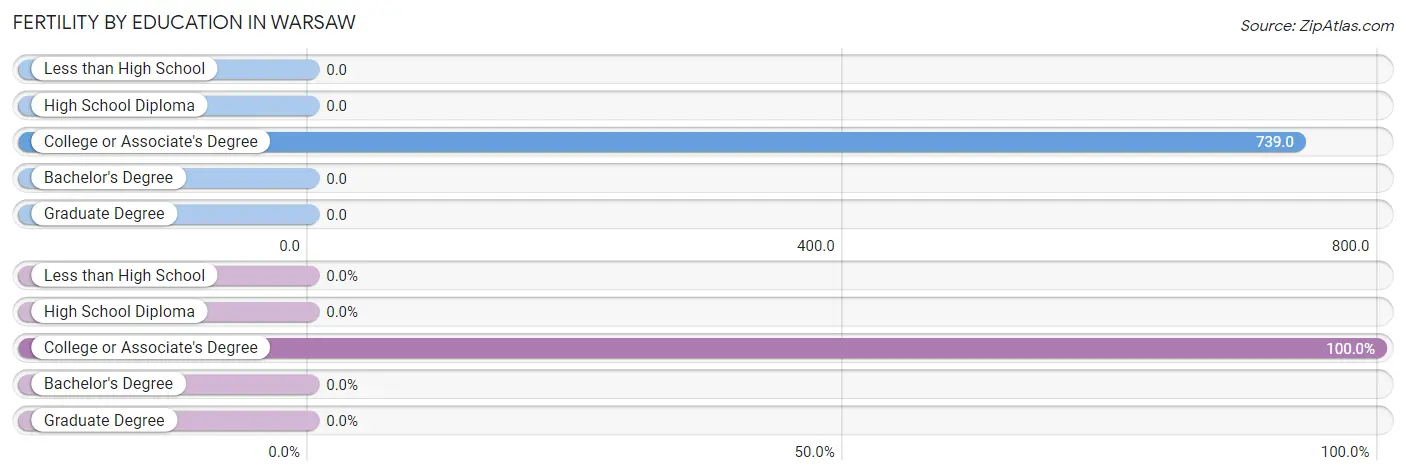
| Educational Attainment | Women with Births | Births / 1,000 Women |
| Less than High School | 0 (0.0%) | 0.0 |
| High School Diploma | 0 (0.0%) | 0.0 |
| College or Associate's Degree | 303 (100.0%) | 739.0 |
| Bachelor's Degree | 0 (0.0%) | 0.0 |
| Graduate Degree | 0 (0.0%) | 0.0 |
| Total | 303 (100.0%) | 332.0 |
Fertility by Education by Marriage Status in Warsaw
40.6% of women with births in Warsaw are unmarried. Women with the educational attainment of college or associate's degree are most likely to be married with 59.4% of them married at childbirth, while women with the educational attainment of college or associate's degree are least likely to be married with 40.6% of them unmarried at childbirth.
| Educational Attainment | Married | Unmarried |
| Less than High School | 0 (0.0%) | 0 (0.0%) |
| High School Diploma | 0 (0.0%) | 0 (0.0%) |
| College or Associate's Degree | 180 (59.4%) | 123 (40.6%) |
| Bachelor's Degree | 0 (0.0%) | 0 (0.0%) |
| Graduate Degree | 0 (0.0%) | 0 (0.0%) |
| Total | 180 (59.4%) | 123 (40.6%) |
Employment Characteristics in Warsaw
Employment by Class of Employer in Warsaw
Among the 978 employed individuals in Warsaw, private company employees (743 | 76.0%), self-employed (not incorporated) (89 | 9.1%), and self-employed (incorporated) (54 | 5.5%) make up the most common classes of employment.
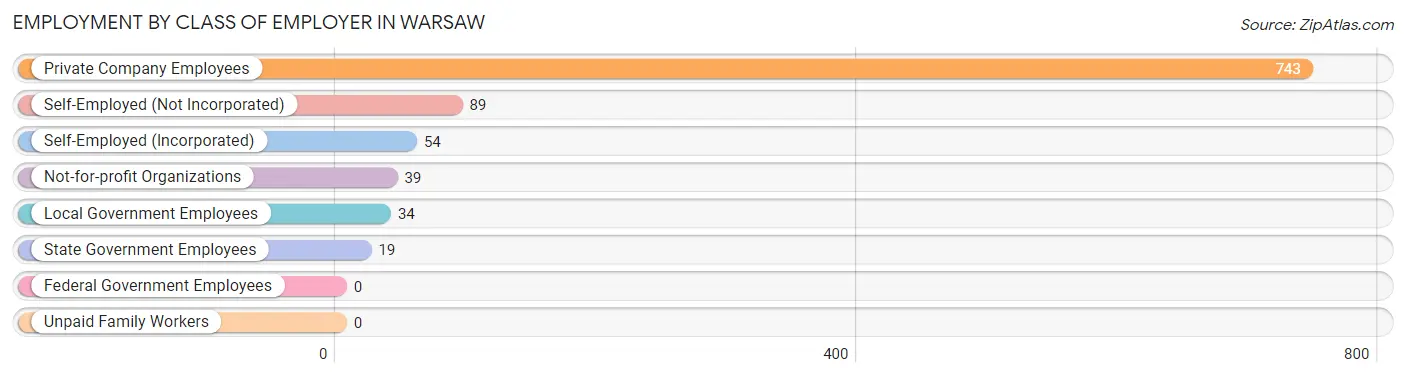
| Employer Class | # Employees | % Employees |
| Private Company Employees | 743 | 76.0% |
| Self-Employed (Incorporated) | 54 | 5.5% |
| Self-Employed (Not Incorporated) | 89 | 9.1% |
| Not-for-profit Organizations | 39 | 4.0% |
| Local Government Employees | 34 | 3.5% |
| State Government Employees | 19 | 1.9% |
| Federal Government Employees | 0 | 0.0% |
| Unpaid Family Workers | 0 | 0.0% |
| Total | 978 | 100.0% |
Employment Status by Age in Warsaw
According to the labor force statistics for Warsaw, out of the total population over 16 years of age (2,048), 50.8% or 1,040 individuals are in the labor force, with 6.0% or 62 of them unemployed. The age group with the highest labor force participation rate is 35 to 44 years, with 96.5% or 463 individuals in the labor force. Within the labor force, the 35 to 44 years age range has the highest percentage of unemployed individuals, with 8.6% or 40 of them being unemployed.
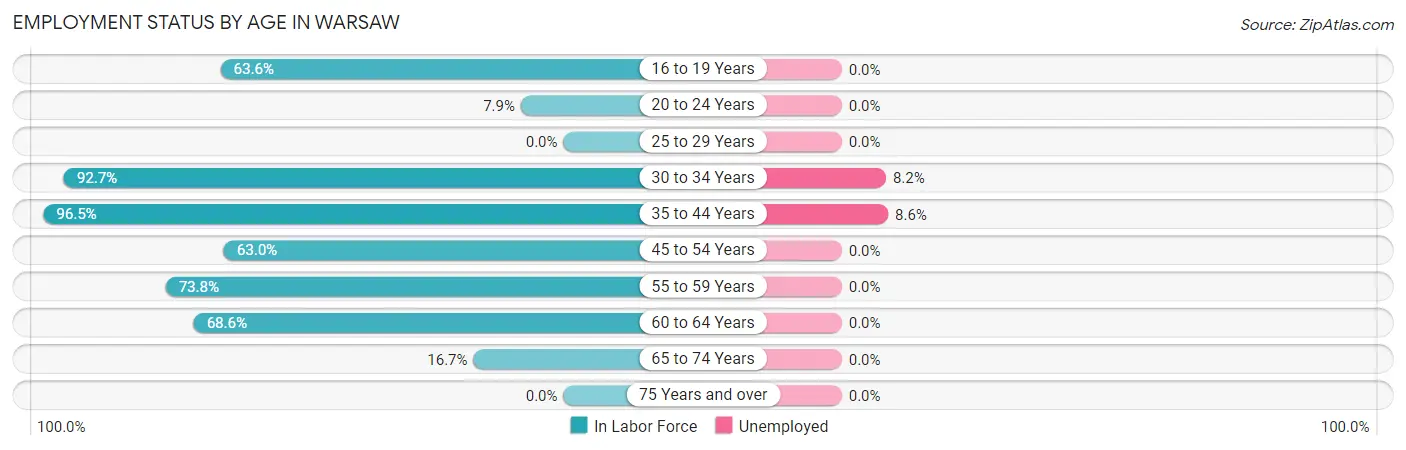
| Age Bracket | In Labor Force | Unemployed |
| 16 to 19 Years | 28 (63.6%) | 0 (0.0%) |
| 20 to 24 Years | 26 (7.9%) | 0 (0.0%) |
| 25 to 29 Years | 0 (0.0%) | 0 (0.0%) |
| 30 to 34 Years | 267 (92.7%) | 22 (8.2%) |
| 35 to 44 Years | 463 (96.5%) | 40 (8.6%) |
| 45 to 54 Years | 102 (63.0%) | 0 (0.0%) |
| 55 to 59 Years | 76 (73.8%) | 0 (0.0%) |
| 60 to 64 Years | 35 (68.6%) | 0 (0.0%) |
| 65 to 74 Years | 43 (16.7%) | 0 (0.0%) |
| 75 Years and over | 0 (0.0%) | 0 (0.0%) |
| Total | 1,040 (50.8%) | 62 (6.0%) |
Employment Status by Educational Attainment in Warsaw
According to labor force statistics for Warsaw, 83.9% of individuals (943) out of the total population between 25 and 64 years of age (1,124) are in the labor force, with 6.6% or 62 of them being unemployed. The group with the highest labor force participation rate are those with the educational attainment of bachelor's degree or higher, with 100.0% or 33 individuals in the labor force. Within the labor force, individuals with less than high school education have the highest percentage of unemployment, with 14.2% or 22 of them being unemployed.
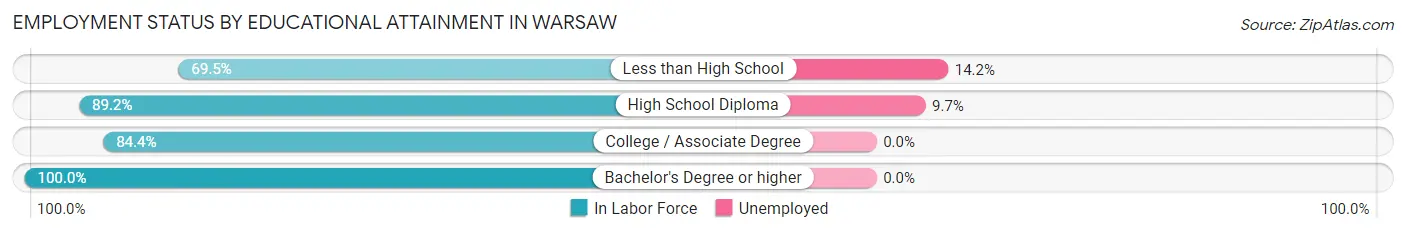
| Educational Attainment | In Labor Force | Unemployed |
| Less than High School | 155 (69.5%) | 32 (14.2%) |
| High School Diploma | 413 (89.2%) | 45 (9.7%) |
| College / Associate Degree | 342 (84.4%) | 0 (0.0%) |
| Bachelor's Degree or higher | 33 (100.0%) | 0 (0.0%) |
| Total | 943 (83.9%) | 74 (6.6%) |
Employment Occupations by Sex in Warsaw
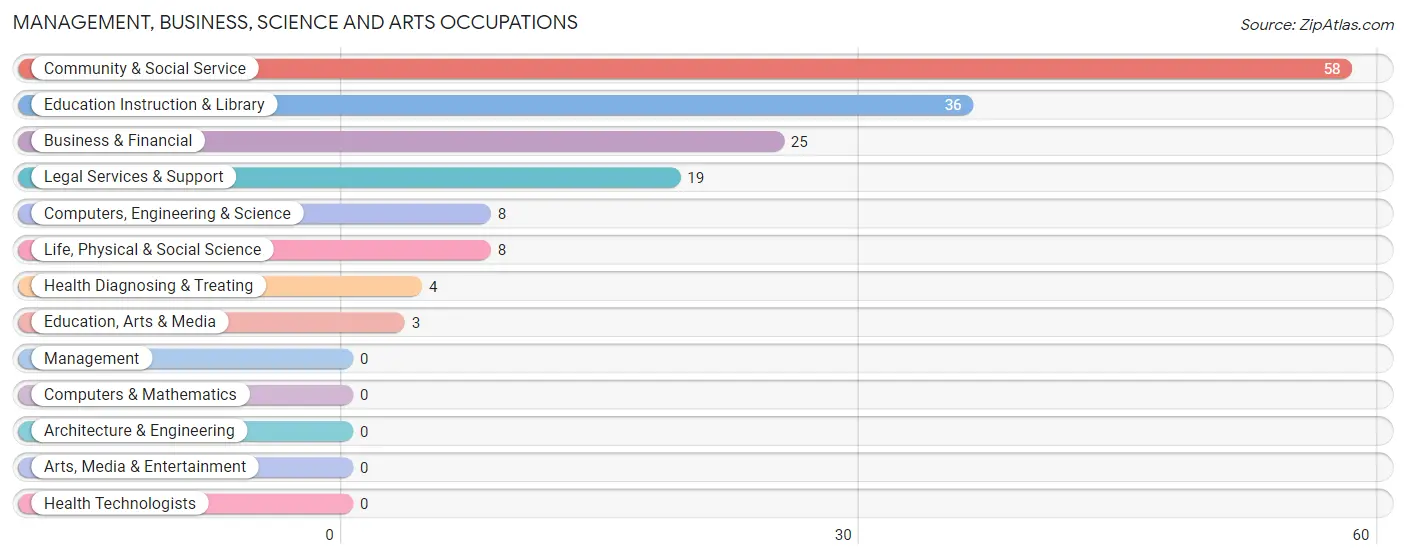
Management, Business, Science and Arts Occupations
The most common Management, Business, Science and Arts occupations in Warsaw are Community & Social Service (58 | 5.9%), Education Instruction & Library (36 | 3.7%), Business & Financial (25 | 2.6%), Legal Services & Support (19 | 1.9%), and Computers, Engineering & Science (8 | 0.8%).
Management, Business, Science and Arts Occupations by Sex
Within the Management, Business, Science and Arts occupations in Warsaw, the most male-oriented occupations are Computers, Engineering & Science (100.0%), Life, Physical & Social Science (100.0%), and Legal Services & Support (100.0%), while the most female-oriented occupations are Business & Financial (100.0%), Education, Arts & Media (100.0%), and Education Instruction & Library (100.0%).
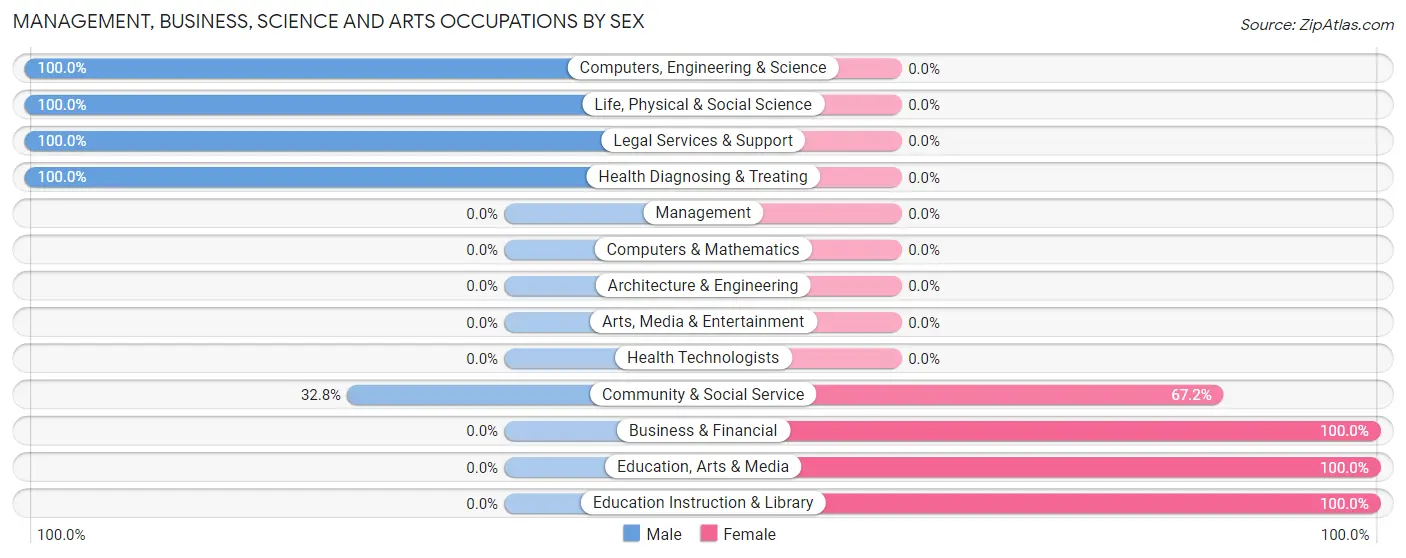
| Occupation | Male | Female |
| Management | 0 (0.0%) | 0 (0.0%) |
| Business & Financial | 0 (0.0%) | 25 (100.0%) |
| Computers, Engineering & Science | 8 (100.0%) | 0 (0.0%) |
| Computers & Mathematics | 0 (0.0%) | 0 (0.0%) |
| Architecture & Engineering | 0 (0.0%) | 0 (0.0%) |
| Life, Physical & Social Science | 8 (100.0%) | 0 (0.0%) |
| Community & Social Service | 19 (32.8%) | 39 (67.2%) |
| Education, Arts & Media | 0 (0.0%) | 3 (100.0%) |
| Legal Services & Support | 19 (100.0%) | 0 (0.0%) |
| Education Instruction & Library | 0 (0.0%) | 36 (100.0%) |
| Arts, Media & Entertainment | 0 (0.0%) | 0 (0.0%) |
| Health Diagnosing & Treating | 4 (100.0%) | 0 (0.0%) |
| Health Technologists | 0 (0.0%) | 0 (0.0%) |
| Total (Category) | 31 (32.6%) | 64 (67.4%) |
| Total (Overall) | 531 (54.3%) | 447 (45.7%) |
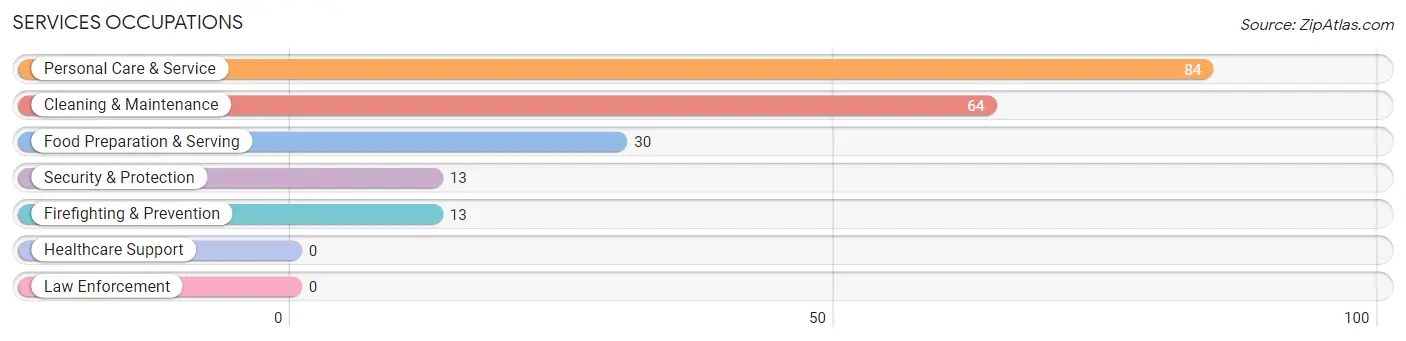
Services Occupations
The most common Services occupations in Warsaw are Personal Care & Service (84 | 8.6%), Cleaning & Maintenance (64 | 6.5%), Food Preparation & Serving (30 | 3.1%), Security & Protection (13 | 1.3%), and Firefighting & Prevention (13 | 1.3%).
Services Occupations by Sex
Within the Services occupations in Warsaw, the most male-oriented occupations are Cleaning & Maintenance (100.0%), and Food Preparation & Serving (50.0%), while the most female-oriented occupations are Security & Protection (100.0%), Firefighting & Prevention (100.0%), and Personal Care & Service (100.0%).
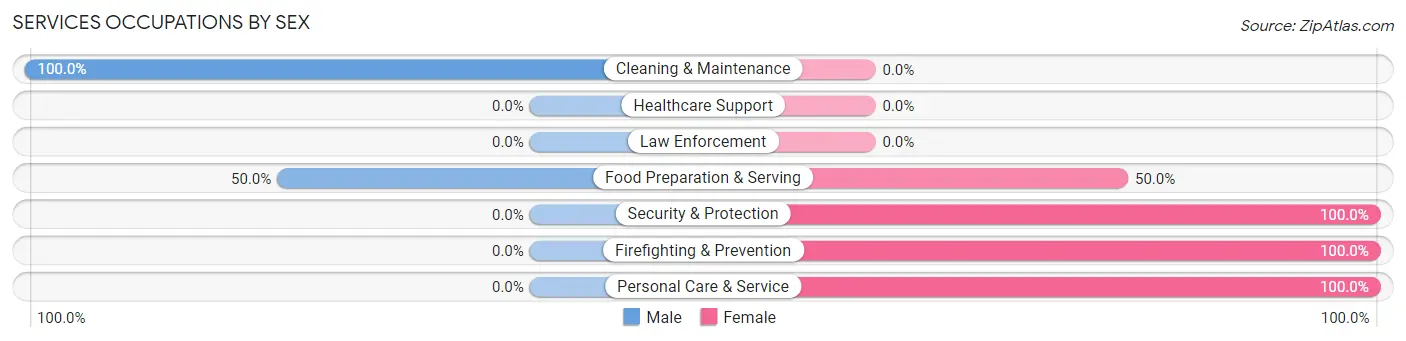
| Occupation | Male | Female |
| Healthcare Support | 0 (0.0%) | 0 (0.0%) |
| Security & Protection | 0 (0.0%) | 13 (100.0%) |
| Firefighting & Prevention | 0 (0.0%) | 13 (100.0%) |
| Law Enforcement | 0 (0.0%) | 0 (0.0%) |
| Food Preparation & Serving | 15 (50.0%) | 15 (50.0%) |
| Cleaning & Maintenance | 64 (100.0%) | 0 (0.0%) |
| Personal Care & Service | 0 (0.0%) | 84 (100.0%) |
| Total (Category) | 79 (41.4%) | 112 (58.6%) |
| Total (Overall) | 531 (54.3%) | 447 (45.7%) |
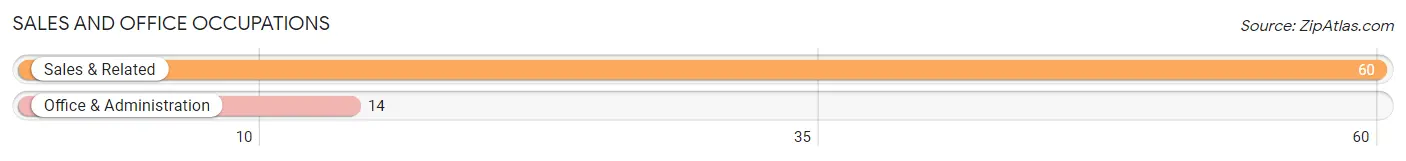
Sales and Office Occupations
The most common Sales and Office occupations in Warsaw are Sales & Related (60 | 6.1%), and Office & Administration (14 | 1.4%).
Sales and Office Occupations by Sex

| Occupation | Male | Female |
| Sales & Related | 40 (66.7%) | 20 (33.3%) |
| Office & Administration | 0 (0.0%) | 14 (100.0%) |
| Total (Category) | 40 (54.0%) | 34 (46.0%) |
| Total (Overall) | 531 (54.3%) | 447 (45.7%) |
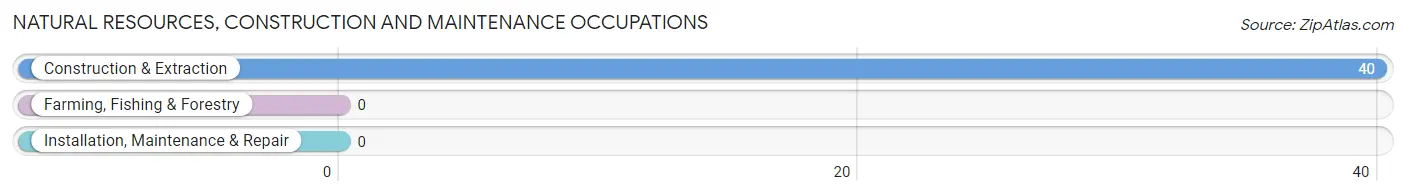
Natural Resources, Construction and Maintenance Occupations
The most common Natural Resources, Construction and Maintenance occupations in Warsaw are , and Construction & Extraction (40 | 4.1%).
Natural Resources, Construction and Maintenance Occupations by Sex
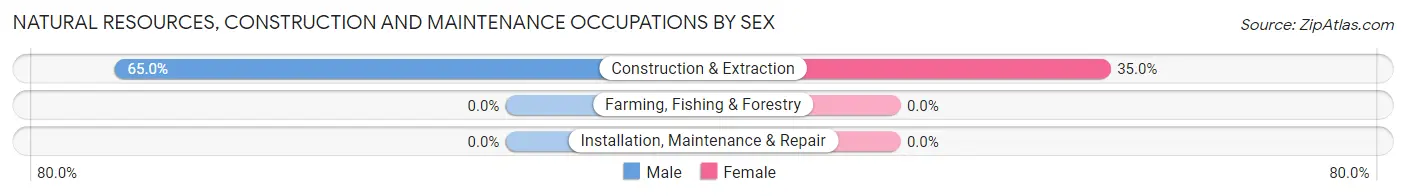
| Occupation | Male | Female |
| Farming, Fishing & Forestry | 0 (0.0%) | 0 (0.0%) |
| Construction & Extraction | 26 (65.0%) | 14 (35.0%) |
| Installation, Maintenance & Repair | 0 (0.0%) | 0 (0.0%) |
| Total (Category) | 26 (65.0%) | 14 (35.0%) |
| Total (Overall) | 531 (54.3%) | 447 (45.7%) |
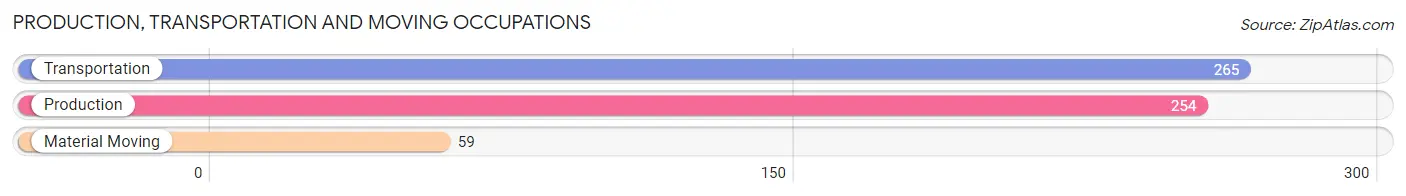
Production, Transportation and Moving Occupations
The most common Production, Transportation and Moving occupations in Warsaw are Transportation (265 | 27.1%), Production (254 | 26.0%), and Material Moving (59 | 6.0%).
Production, Transportation and Moving Occupations by Sex
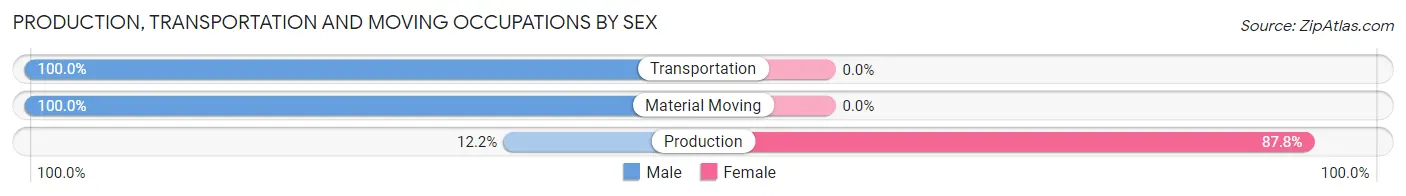
| Occupation | Male | Female |
| Production | 31 (12.2%) | 223 (87.8%) |
| Transportation | 265 (100.0%) | 0 (0.0%) |
| Material Moving | 59 (100.0%) | 0 (0.0%) |
| Total (Category) | 355 (61.4%) | 223 (38.6%) |
| Total (Overall) | 531 (54.3%) | 447 (45.7%) |
Employment Industries by Sex in Warsaw
Employment Industries in Warsaw
The major employment industries in Warsaw include Manufacturing (359 | 36.7%), Transportation & Warehousing (219 | 22.4%), Retail Trade (78 | 8.0%), Administrative & Support (77 | 7.9%), and Educational Services (36 | 3.7%).
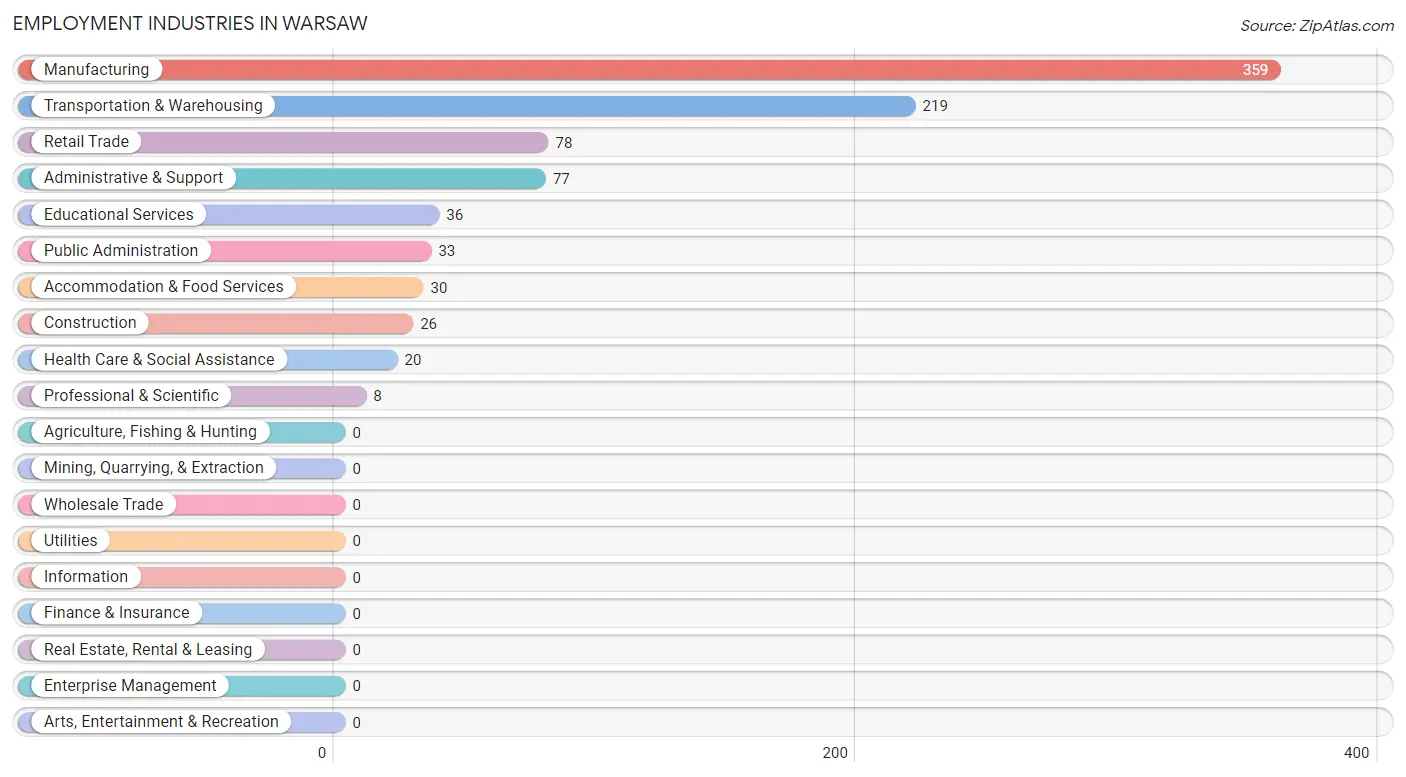
Employment Industries by Sex in Warsaw
The Warsaw industries that see more men than women are Construction (100.0%), Transportation & Warehousing (100.0%), and Professional & Scientific (100.0%), whereas the industries that tend to have a higher number of women are Educational Services (100.0%), Health Care & Social Assistance (100.0%), and Manufacturing (62.1%).
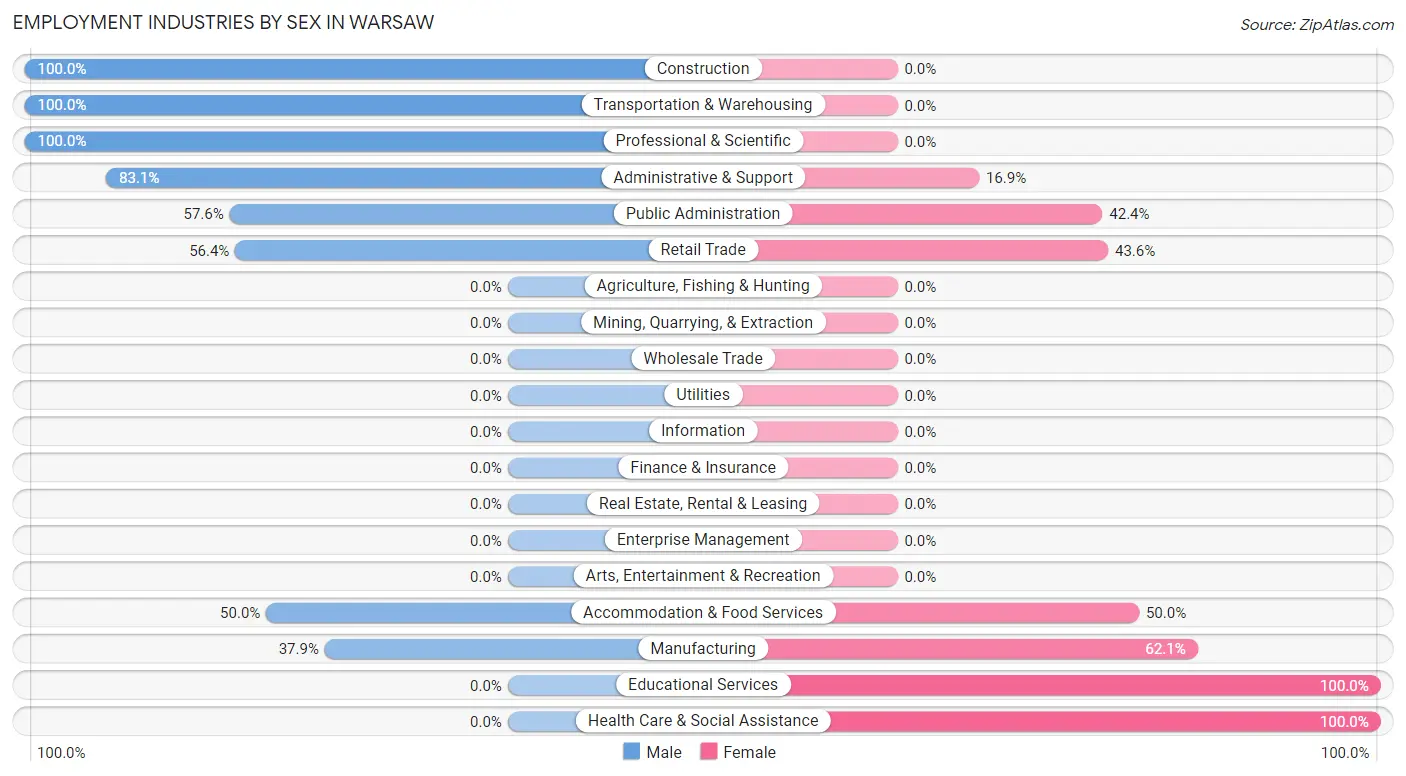
| Industry | Male | Female |
| Agriculture, Fishing & Hunting | 0 (0.0%) | 0 (0.0%) |
| Mining, Quarrying, & Extraction | 0 (0.0%) | 0 (0.0%) |
| Construction | 26 (100.0%) | 0 (0.0%) |
| Manufacturing | 136 (37.9%) | 223 (62.1%) |
| Wholesale Trade | 0 (0.0%) | 0 (0.0%) |
| Retail Trade | 44 (56.4%) | 34 (43.6%) |
| Transportation & Warehousing | 219 (100.0%) | 0 (0.0%) |
| Utilities | 0 (0.0%) | 0 (0.0%) |
| Information | 0 (0.0%) | 0 (0.0%) |
| Finance & Insurance | 0 (0.0%) | 0 (0.0%) |
| Real Estate, Rental & Leasing | 0 (0.0%) | 0 (0.0%) |
| Professional & Scientific | 8 (100.0%) | 0 (0.0%) |
| Enterprise Management | 0 (0.0%) | 0 (0.0%) |
| Administrative & Support | 64 (83.1%) | 13 (16.9%) |
| Educational Services | 0 (0.0%) | 36 (100.0%) |
| Health Care & Social Assistance | 0 (0.0%) | 20 (100.0%) |
| Arts, Entertainment & Recreation | 0 (0.0%) | 0 (0.0%) |
| Accommodation & Food Services | 15 (50.0%) | 15 (50.0%) |
| Public Administration | 19 (57.6%) | 14 (42.4%) |
| Total | 531 (54.3%) | 447 (45.7%) |
Education in Warsaw
School Enrollment in Warsaw
The most common levels of schooling among the 618 students in Warsaw are middle school (218 | 35.3%), high school (181 | 29.3%), and college / undergraduate (155 | 25.1%).
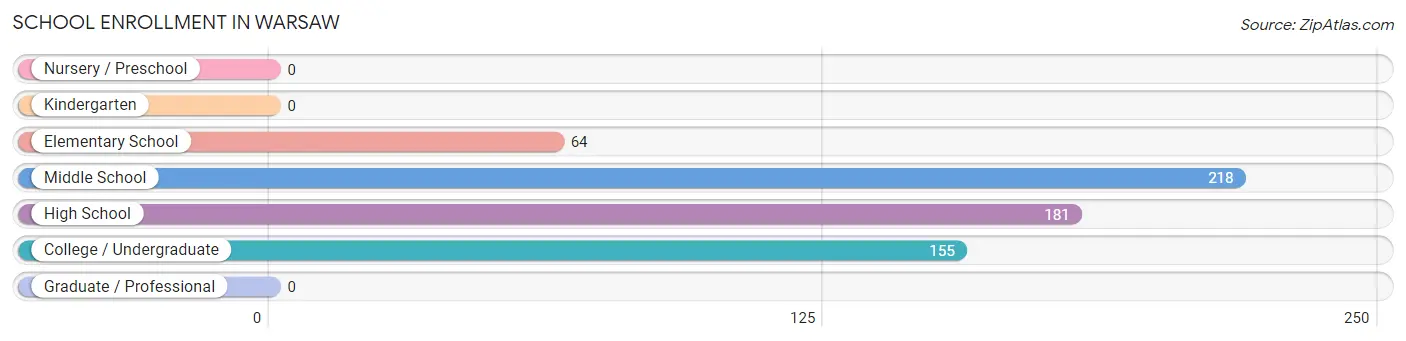
| School Level | # Students | % Students |
| Nursery / Preschool | 0 | 0.0% |
| Kindergarten | 0 | 0.0% |
| Elementary School | 64 | 10.4% |
| Middle School | 218 | 35.3% |
| High School | 181 | 29.3% |
| College / Undergraduate | 155 | 25.1% |
| Graduate / Professional | 0 | 0.0% |
| Total | 618 | 100.0% |
School Enrollment by Age by Funding Source in Warsaw
Out of a total of 618 students who are enrolled in schools in Warsaw, 26 (4.2%) attend a private institution, while the remaining 592 (95.8%) are enrolled in public schools. The age group of 20 to 24 year olds has the highest likelihood of being enrolled in private schools, with 26 (17.4% in the age bracket) enrolled. Conversely, the age group of 5 to 9 year old has the lowest likelihood of being enrolled in a private school, with 28 (100.0% in the age bracket) attending a public institution.
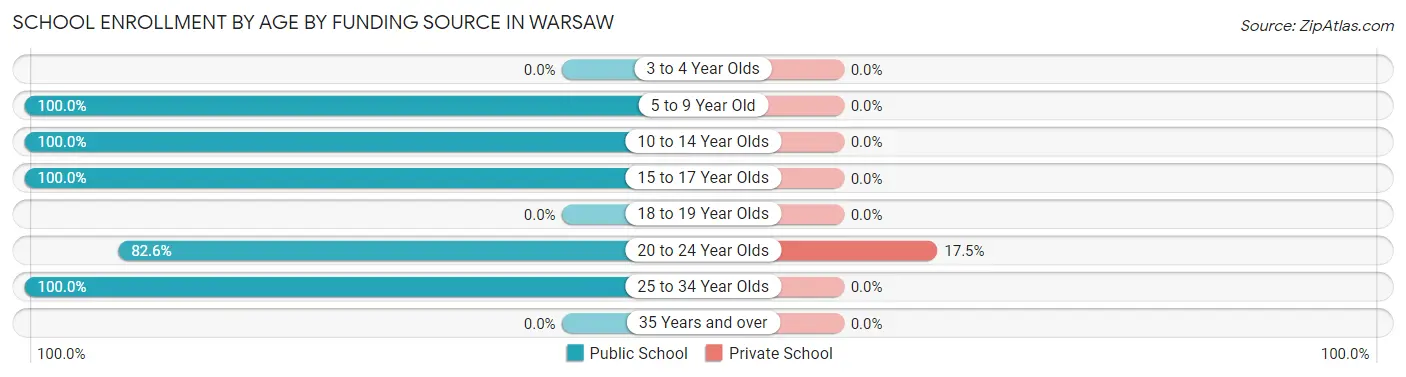
| Age Bracket | Public School | Private School |
| 3 to 4 Year Olds | 0 (0.0%) | 0 (0.0%) |
| 5 to 9 Year Old | 28 (100.0%) | 0 (0.0%) |
| 10 to 14 Year Olds | 254 (100.0%) | 0 (0.0%) |
| 15 to 17 Year Olds | 181 (100.0%) | 0 (0.0%) |
| 18 to 19 Year Olds | 0 (0.0%) | 0 (0.0%) |
| 20 to 24 Year Olds | 123 (82.6%) | 26 (17.4%) |
| 25 to 34 Year Olds | 6 (100.0%) | 0 (0.0%) |
| 35 Years and over | 0 (0.0%) | 0 (0.0%) |
| Total | 592 (95.8%) | 26 (4.2%) |
Educational Attainment by Field of Study in Warsaw
Arts & humanities (25 | 49.0%), education (15 | 29.4%), physical & health sciences (8 | 15.7%), and liberal arts & history (3 | 5.9%) are the most common fields of study among 51 individuals in Warsaw who have obtained a bachelor's degree or higher.
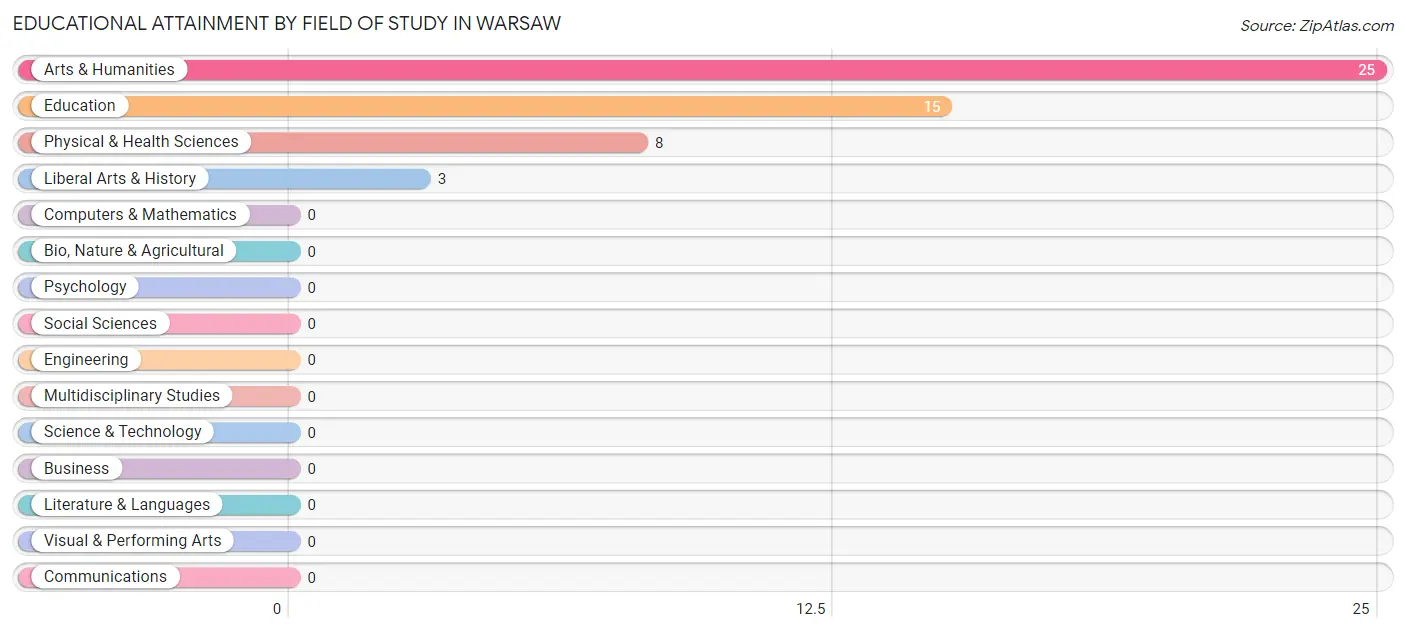
| Field of Study | # Graduates | % Graduates |
| Computers & Mathematics | 0 | 0.0% |
| Bio, Nature & Agricultural | 0 | 0.0% |
| Physical & Health Sciences | 8 | 15.7% |
| Psychology | 0 | 0.0% |
| Social Sciences | 0 | 0.0% |
| Engineering | 0 | 0.0% |
| Multidisciplinary Studies | 0 | 0.0% |
| Science & Technology | 0 | 0.0% |
| Business | 0 | 0.0% |
| Education | 15 | 29.4% |
| Literature & Languages | 0 | 0.0% |
| Liberal Arts & History | 3 | 5.9% |
| Visual & Performing Arts | 0 | 0.0% |
| Communications | 0 | 0.0% |
| Arts & Humanities | 25 | 49.0% |
| Total | 51 | 100.0% |
Transportation & Commute in Warsaw
Vehicle Availability by Sex in Warsaw
The most prevalent vehicle ownership categories in Warsaw are males with 2 vehicles (294, accounting for 55.4%) and females with 2 vehicles (283, making up 65.8%).
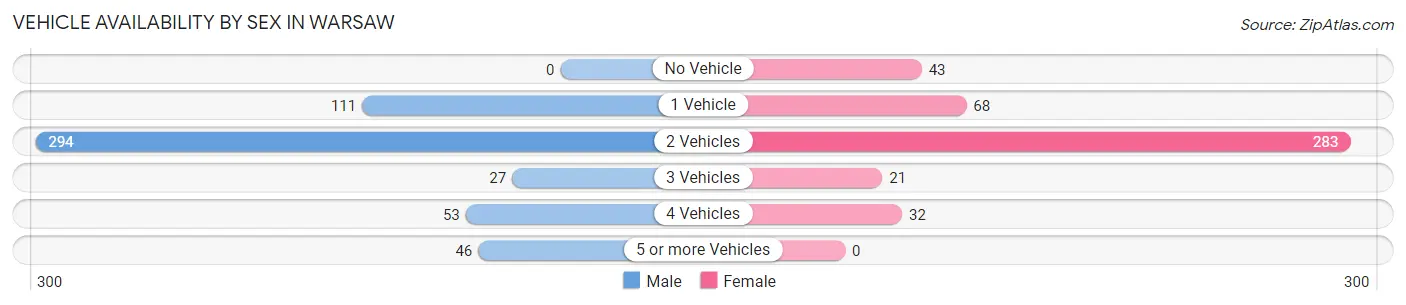
| Vehicles Available | Male | Female |
| No Vehicle | 0 (0.0%) | 43 (9.6%) |
| 1 Vehicle | 111 (20.9%) | 68 (15.2%) |
| 2 Vehicles | 294 (55.4%) | 283 (63.3%) |
| 3 Vehicles | 27 (5.1%) | 21 (4.7%) |
| 4 Vehicles | 53 (10.0%) | 32 (7.2%) |
| 5 or more Vehicles | 46 (8.7%) | 0 (0.0%) |
| Total | 531 (100.0%) | 447 (100.0%) |
Commute Time in Warsaw
The most frequently occuring commute durations in Warsaw are 20 to 24 minutes (220 commuters, 22.7%), 30 to 34 minutes (214 commuters, 22.1%), and 15 to 19 minutes (180 commuters, 18.6%).
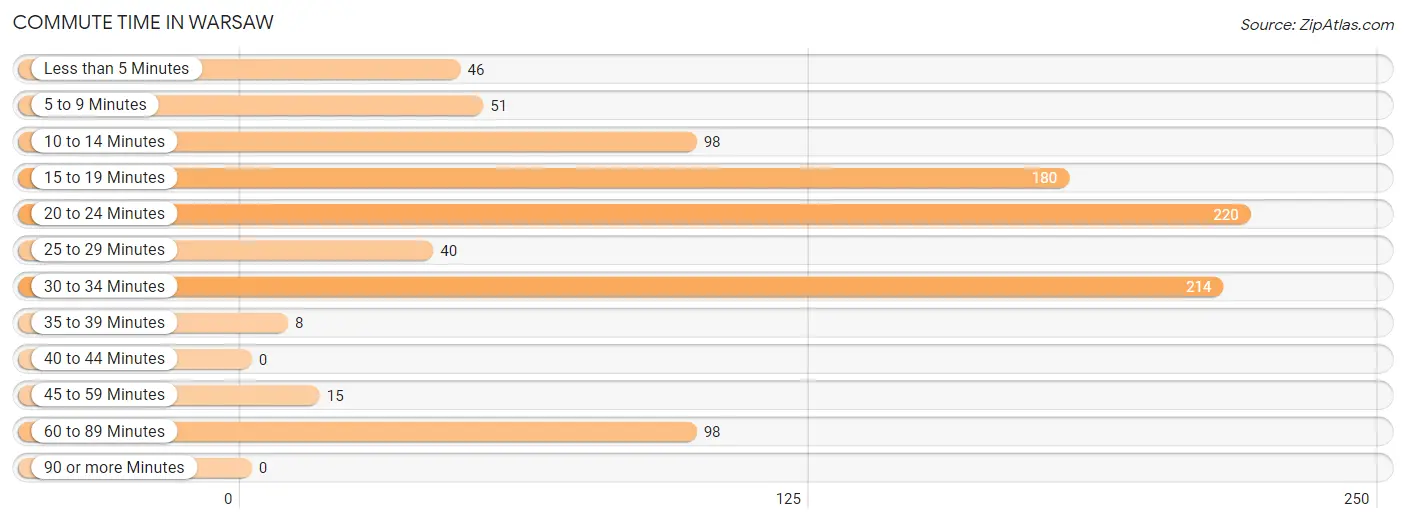
| Commute Time | # Commuters | % Commuters |
| Less than 5 Minutes | 46 | 4.7% |
| 5 to 9 Minutes | 51 | 5.3% |
| 10 to 14 Minutes | 98 | 10.1% |
| 15 to 19 Minutes | 180 | 18.6% |
| 20 to 24 Minutes | 220 | 22.7% |
| 25 to 29 Minutes | 40 | 4.1% |
| 30 to 34 Minutes | 214 | 22.1% |
| 35 to 39 Minutes | 8 | 0.8% |
| 40 to 44 Minutes | 0 | 0.0% |
| 45 to 59 Minutes | 15 | 1.5% |
| 60 to 89 Minutes | 98 | 10.1% |
| 90 or more Minutes | 0 | 0.0% |
Commute Time by Sex in Warsaw
The most common commute times in Warsaw are 20 to 24 minutes (214 commuters, 40.9%) for males and 15 to 19 minutes (180 commuters, 40.3%) for females.
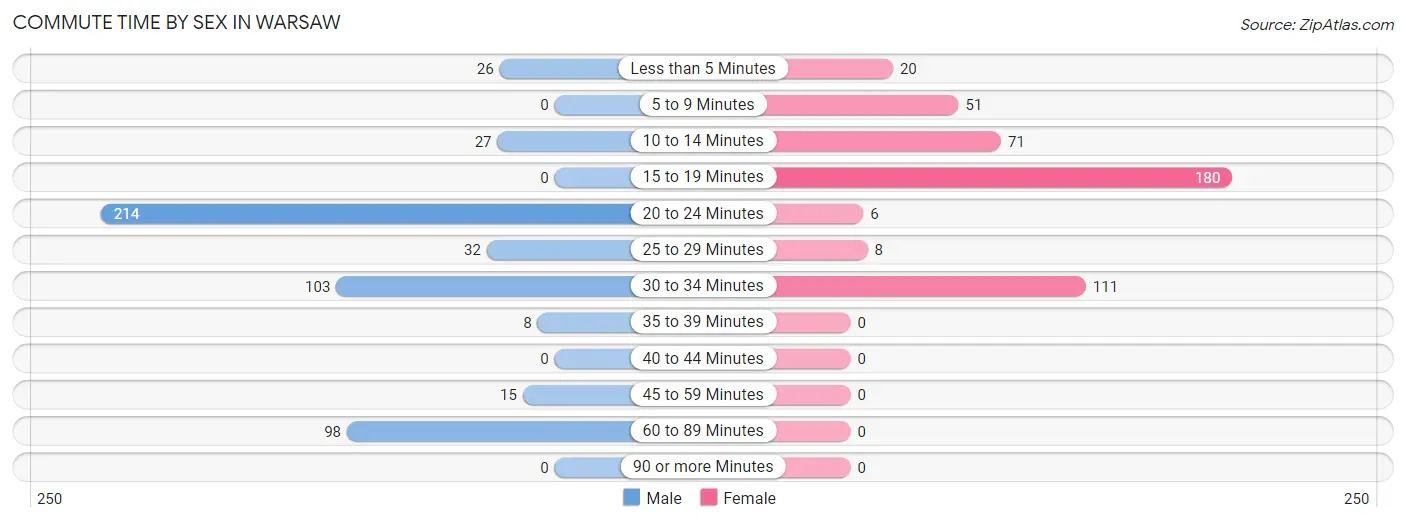
| Commute Time | Male | Female |
| Less than 5 Minutes | 26 (5.0%) | 20 (4.5%) |
| 5 to 9 Minutes | 0 (0.0%) | 51 (11.4%) |
| 10 to 14 Minutes | 27 (5.2%) | 71 (15.9%) |
| 15 to 19 Minutes | 0 (0.0%) | 180 (40.3%) |
| 20 to 24 Minutes | 214 (40.9%) | 6 (1.3%) |
| 25 to 29 Minutes | 32 (6.1%) | 8 (1.8%) |
| 30 to 34 Minutes | 103 (19.7%) | 111 (24.8%) |
| 35 to 39 Minutes | 8 (1.5%) | 0 (0.0%) |
| 40 to 44 Minutes | 0 (0.0%) | 0 (0.0%) |
| 45 to 59 Minutes | 15 (2.9%) | 0 (0.0%) |
| 60 to 89 Minutes | 98 (18.7%) | 0 (0.0%) |
| 90 or more Minutes | 0 (0.0%) | 0 (0.0%) |
Time of Departure to Work by Sex in Warsaw
The most frequent times of departure to work in Warsaw are 5:00 AM to 5:29 AM (219, 41.9%) for males and 5:30 AM to 5:59 AM (142, 31.8%) for females.
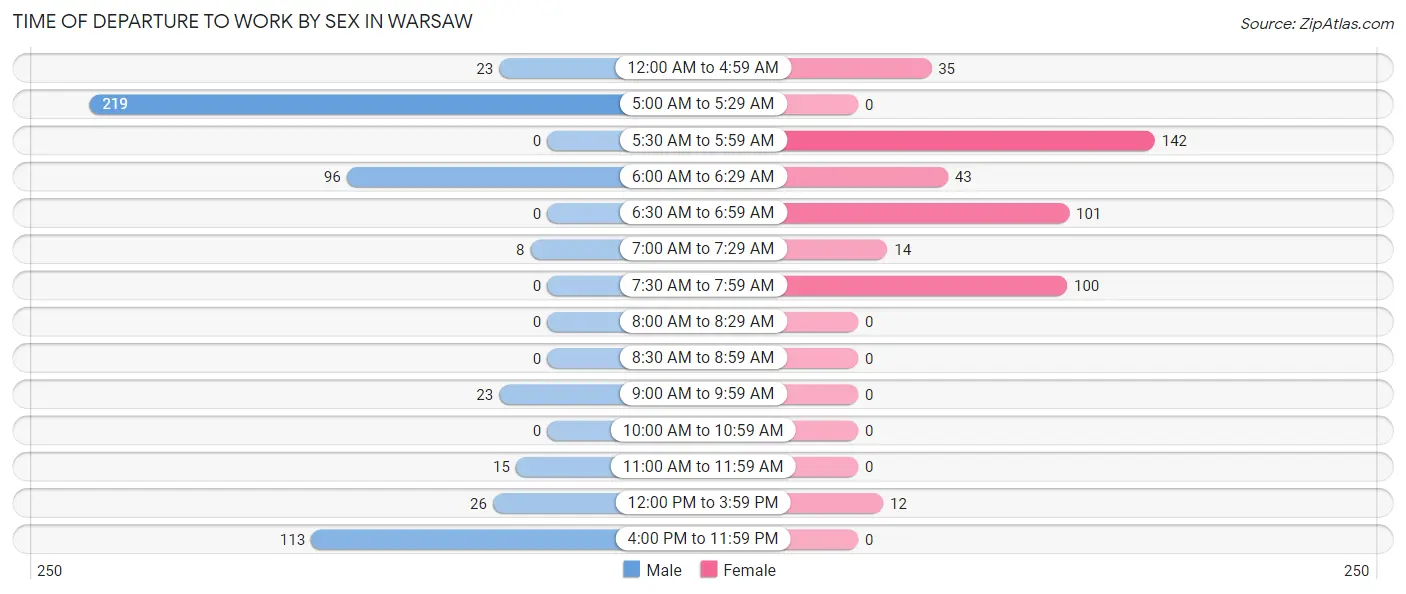
| Time of Departure | Male | Female |
| 12:00 AM to 4:59 AM | 23 (4.4%) | 35 (7.8%) |
| 5:00 AM to 5:29 AM | 219 (41.9%) | 0 (0.0%) |
| 5:30 AM to 5:59 AM | 0 (0.0%) | 142 (31.8%) |
| 6:00 AM to 6:29 AM | 96 (18.4%) | 43 (9.6%) |
| 6:30 AM to 6:59 AM | 0 (0.0%) | 101 (22.6%) |
| 7:00 AM to 7:29 AM | 8 (1.5%) | 14 (3.1%) |
| 7:30 AM to 7:59 AM | 0 (0.0%) | 100 (22.4%) |
| 8:00 AM to 8:29 AM | 0 (0.0%) | 0 (0.0%) |
| 8:30 AM to 8:59 AM | 0 (0.0%) | 0 (0.0%) |
| 9:00 AM to 9:59 AM | 23 (4.4%) | 0 (0.0%) |
| 10:00 AM to 10:59 AM | 0 (0.0%) | 0 (0.0%) |
| 11:00 AM to 11:59 AM | 15 (2.9%) | 0 (0.0%) |
| 12:00 PM to 3:59 PM | 26 (5.0%) | 12 (2.7%) |
| 4:00 PM to 11:59 PM | 113 (21.6%) | 0 (0.0%) |
| Total | 523 (100.0%) | 447 (100.0%) |
Housing Occupancy in Warsaw
Occupancy by Ownership in Warsaw
Of the total 1,025 dwellings in Warsaw, owner-occupied units account for 357 (34.8%), while renter-occupied units make up 668 (65.2%).
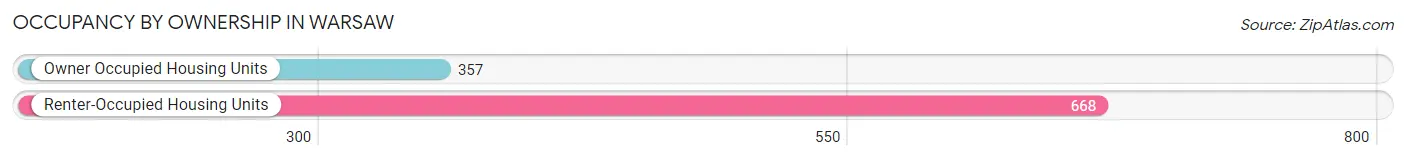
| Occupancy | # Housing Units | % Housing Units |
| Owner Occupied Housing Units | 357 | 34.8% |
| Renter-Occupied Housing Units | 668 | 65.2% |
| Total Occupied Housing Units | 1,025 | 100.0% |
Occupancy by Household Size in Warsaw
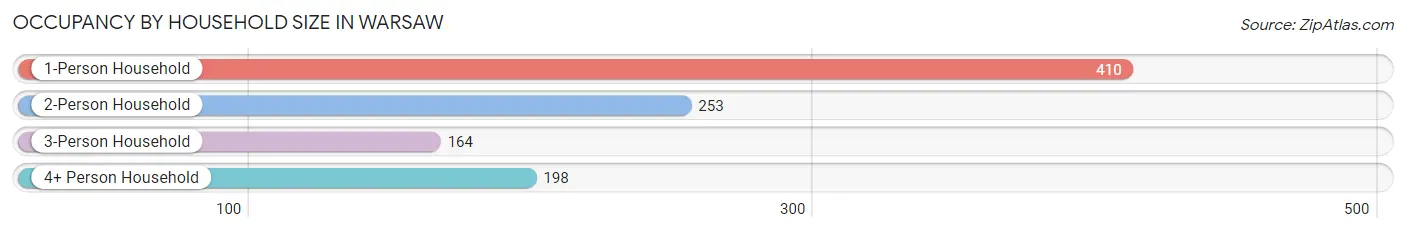
| Household Size | # Housing Units | % Housing Units |
| 1-Person Household | 410 | 40.0% |
| 2-Person Household | 253 | 24.7% |
| 3-Person Household | 164 | 16.0% |
| 4+ Person Household | 198 | 19.3% |
| Total Housing Units | 1,025 | 100.0% |
Occupancy by Ownership by Household Size in Warsaw
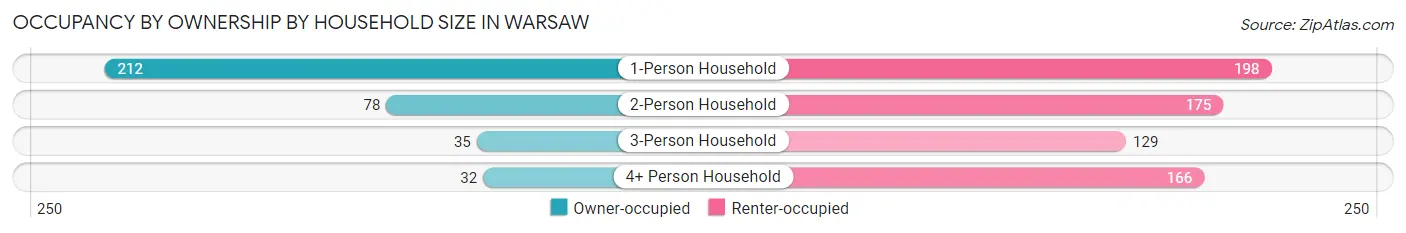
| Household Size | Owner-occupied | Renter-occupied |
| 1-Person Household | 212 (51.7%) | 198 (48.3%) |
| 2-Person Household | 78 (30.8%) | 175 (69.2%) |
| 3-Person Household | 35 (21.3%) | 129 (78.7%) |
| 4+ Person Household | 32 (16.2%) | 166 (83.8%) |
| Total Housing Units | 357 (34.8%) | 668 (65.2%) |
Occupancy by Educational Attainment in Warsaw
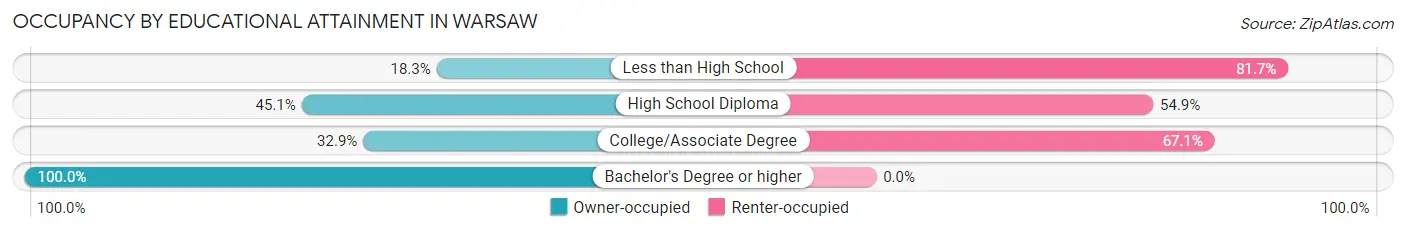
| Household Size | Owner-occupied | Renter-occupied |
| Less than High School | 50 (18.3%) | 223 (81.7%) |
| High School Diploma | 124 (45.1%) | 151 (54.9%) |
| College/Associate Degree | 144 (32.9%) | 294 (67.1%) |
| Bachelor's Degree or higher | 39 (100.0%) | 0 (0.0%) |
Occupancy by Age of Householder in Warsaw
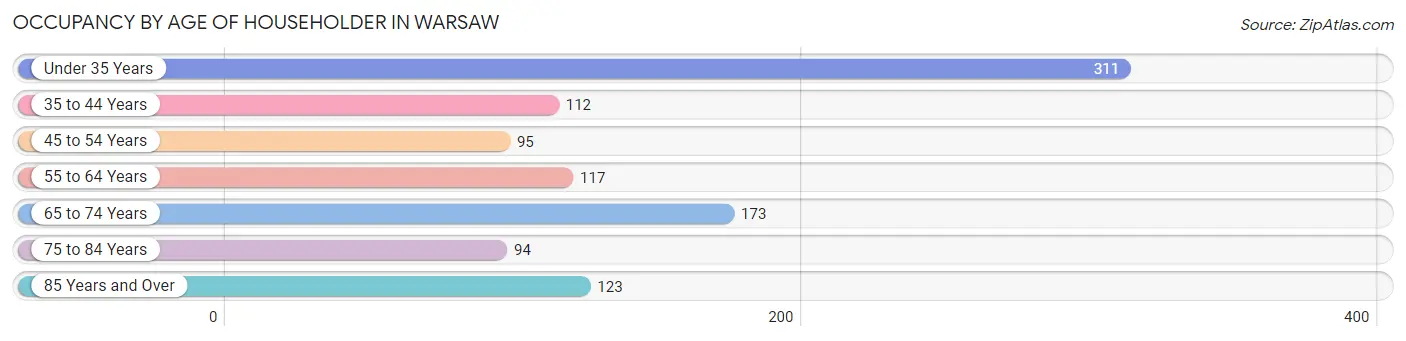
| Age Bracket | # Households | % Households |
| Under 35 Years | 311 | 30.3% |
| 35 to 44 Years | 112 | 10.9% |
| 45 to 54 Years | 95 | 9.3% |
| 55 to 64 Years | 117 | 11.4% |
| 65 to 74 Years | 173 | 16.9% |
| 75 to 84 Years | 94 | 9.2% |
| 85 Years and Over | 123 | 12.0% |
| Total | 1,025 | 100.0% |
Housing Finances in Warsaw
Median Income by Occupancy in Warsaw
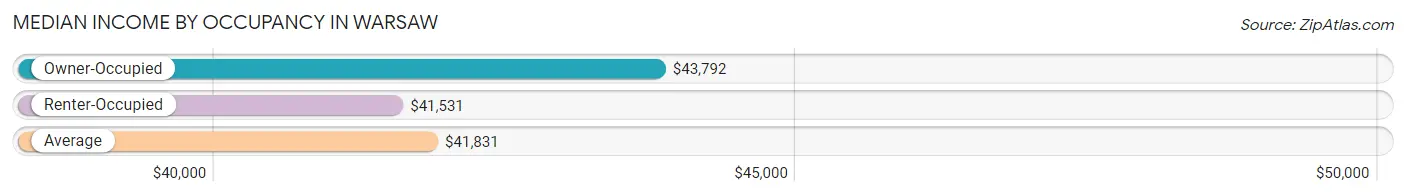
| Occupancy Type | # Households | Median Income |
| Owner-Occupied | 357 (34.8%) | $43,792 |
| Renter-Occupied | 668 (65.2%) | $41,531 |
| Average | 1,025 (100.0%) | $41,831 |
Occupancy by Householder Income Bracket in Warsaw
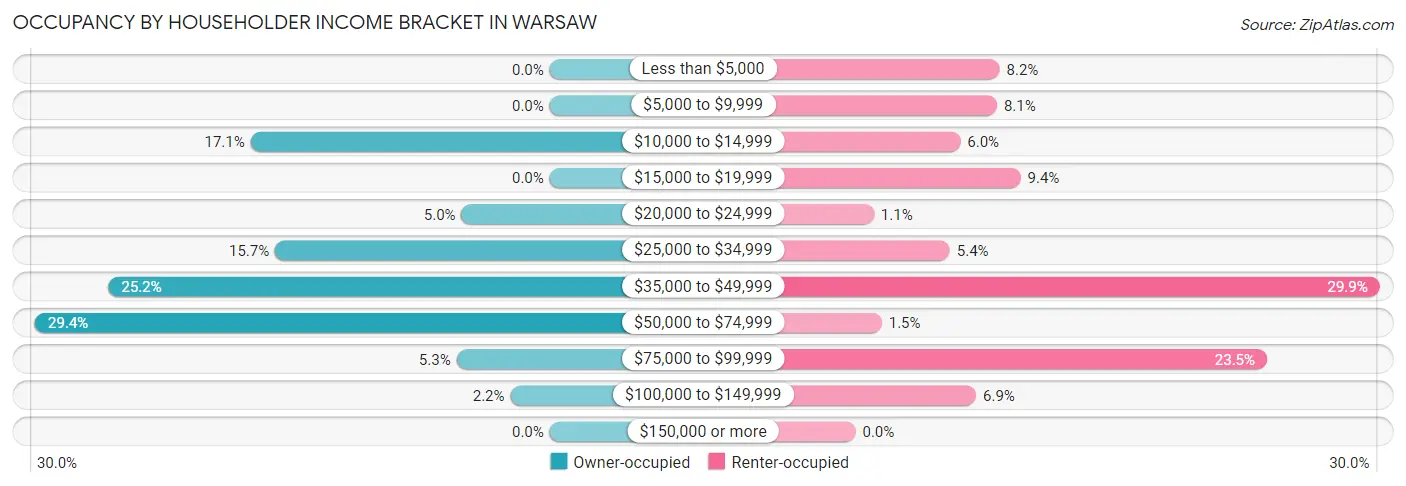
| Income Bracket | Owner-occupied | Renter-occupied |
| Less than $5,000 | 0 (0.0%) | 55 (8.2%) |
| $5,000 to $9,999 | 0 (0.0%) | 54 (8.1%) |
| $10,000 to $14,999 | 61 (17.1%) | 40 (6.0%) |
| $15,000 to $19,999 | 0 (0.0%) | 63 (9.4%) |
| $20,000 to $24,999 | 18 (5.0%) | 7 (1.1%) |
| $25,000 to $34,999 | 56 (15.7%) | 36 (5.4%) |
| $35,000 to $49,999 | 90 (25.2%) | 200 (29.9%) |
| $50,000 to $74,999 | 105 (29.4%) | 10 (1.5%) |
| $75,000 to $99,999 | 19 (5.3%) | 157 (23.5%) |
| $100,000 to $149,999 | 8 (2.2%) | 46 (6.9%) |
| $150,000 or more | 0 (0.0%) | 0 (0.0%) |
| Total | 357 (100.0%) | 668 (100.0%) |
Monthly Housing Cost Tiers in Warsaw
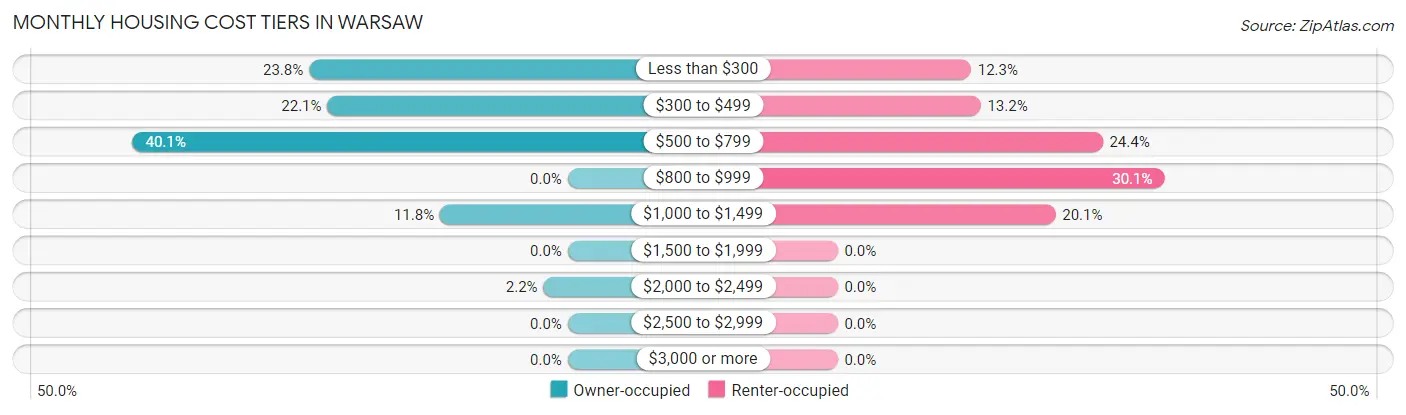
| Monthly Cost | Owner-occupied | Renter-occupied |
| Less than $300 | 85 (23.8%) | 82 (12.3%) |
| $300 to $499 | 79 (22.1%) | 88 (13.2%) |
| $500 to $799 | 143 (40.1%) | 163 (24.4%) |
| $800 to $999 | 0 (0.0%) | 201 (30.1%) |
| $1,000 to $1,499 | 42 (11.8%) | 134 (20.1%) |
| $1,500 to $1,999 | 0 (0.0%) | 0 (0.0%) |
| $2,000 to $2,499 | 8 (2.2%) | 0 (0.0%) |
| $2,500 to $2,999 | 0 (0.0%) | 0 (0.0%) |
| $3,000 or more | 0 (0.0%) | 0 (0.0%) |
| Total | 357 (100.0%) | 668 (100.0%) |
Physical Housing Characteristics in Warsaw
Housing Structures in Warsaw
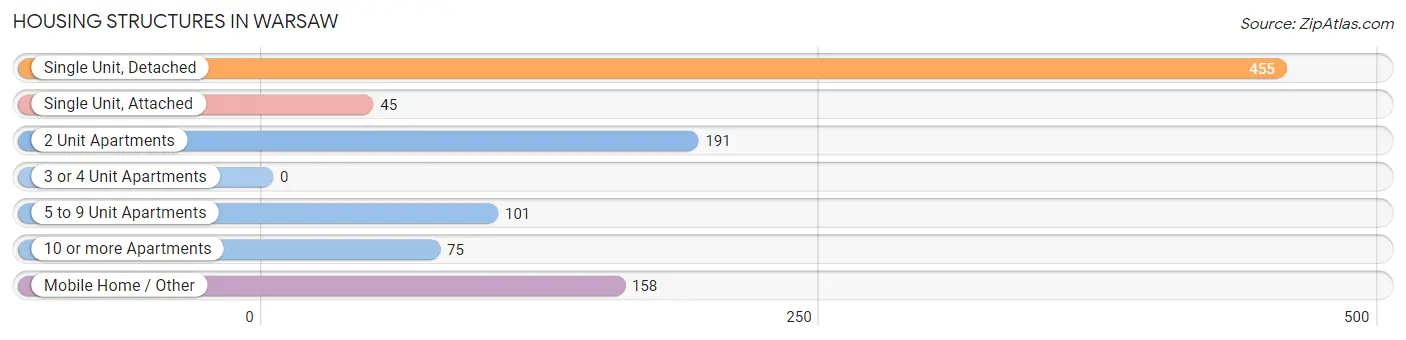
| Structure Type | # Housing Units | % Housing Units |
| Single Unit, Detached | 455 | 44.4% |
| Single Unit, Attached | 45 | 4.4% |
| 2 Unit Apartments | 191 | 18.6% |
| 3 or 4 Unit Apartments | 0 | 0.0% |
| 5 to 9 Unit Apartments | 101 | 9.9% |
| 10 or more Apartments | 75 | 7.3% |
| Mobile Home / Other | 158 | 15.4% |
| Total | 1,025 | 100.0% |
Housing Structures by Occupancy in Warsaw
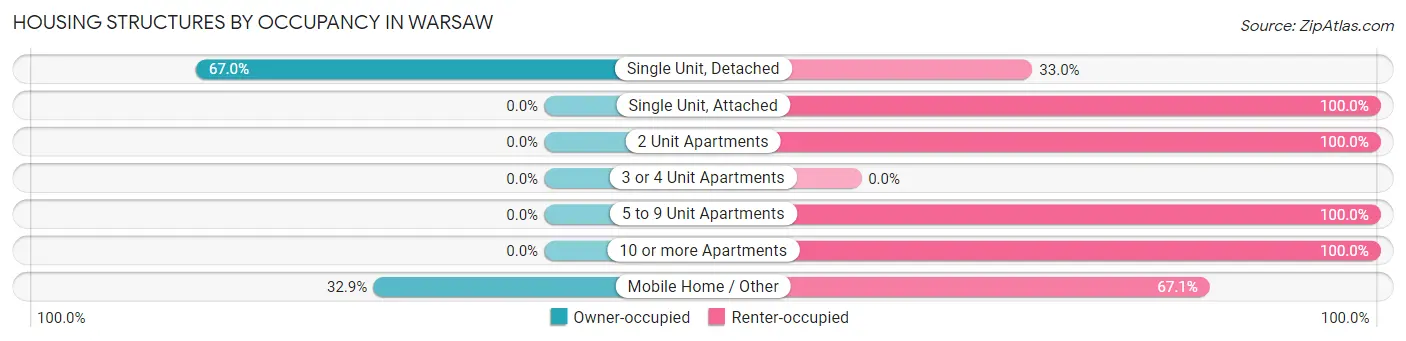
| Structure Type | Owner-occupied | Renter-occupied |
| Single Unit, Detached | 305 (67.0%) | 150 (33.0%) |
| Single Unit, Attached | 0 (0.0%) | 45 (100.0%) |
| 2 Unit Apartments | 0 (0.0%) | 191 (100.0%) |
| 3 or 4 Unit Apartments | 0 (0.0%) | 0 (0.0%) |
| 5 to 9 Unit Apartments | 0 (0.0%) | 101 (100.0%) |
| 10 or more Apartments | 0 (0.0%) | 75 (100.0%) |
| Mobile Home / Other | 52 (32.9%) | 106 (67.1%) |
| Total | 357 (34.8%) | 668 (65.2%) |
Housing Structures by Number of Rooms in Warsaw
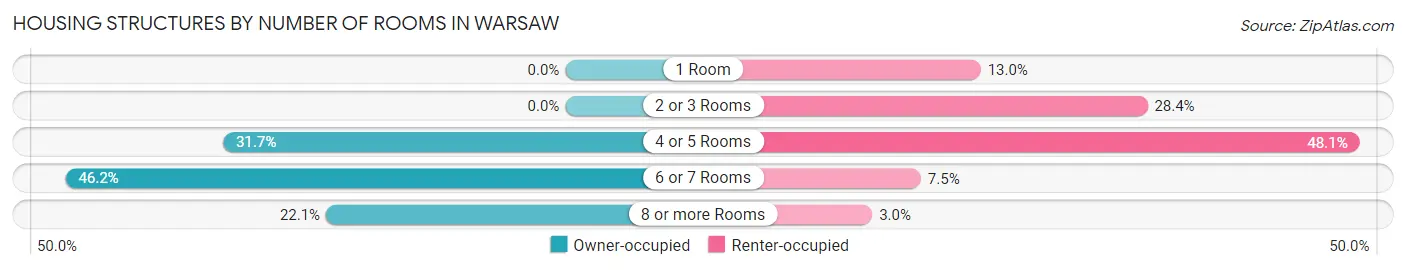
| Number of Rooms | Owner-occupied | Renter-occupied |
| 1 Room | 0 (0.0%) | 87 (13.0%) |
| 2 or 3 Rooms | 0 (0.0%) | 190 (28.4%) |
| 4 or 5 Rooms | 113 (31.7%) | 321 (48.0%) |
| 6 or 7 Rooms | 165 (46.2%) | 50 (7.5%) |
| 8 or more Rooms | 79 (22.1%) | 20 (3.0%) |
| Total | 357 (100.0%) | 668 (100.0%) |
Housing Structure by Heating Type in Warsaw
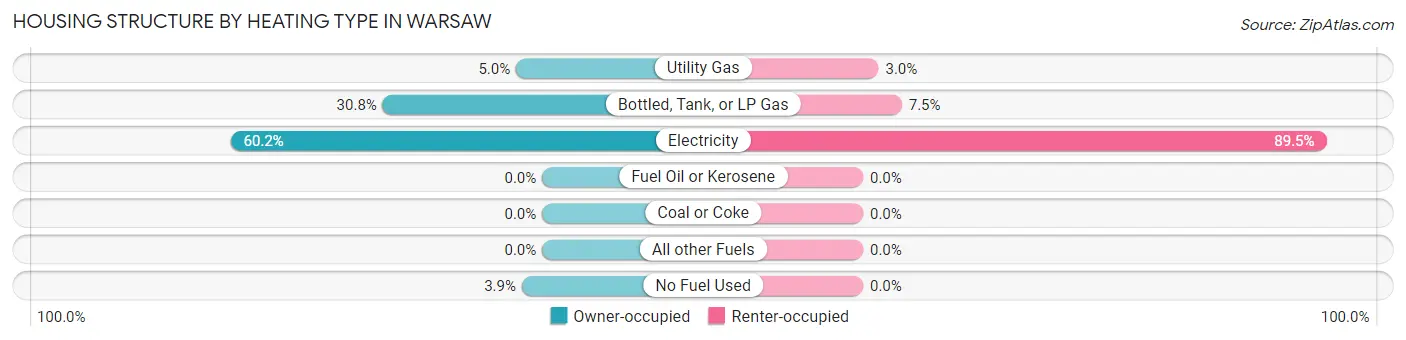
| Heating Type | Owner-occupied | Renter-occupied |
| Utility Gas | 18 (5.0%) | 20 (3.0%) |
| Bottled, Tank, or LP Gas | 110 (30.8%) | 50 (7.5%) |
| Electricity | 215 (60.2%) | 598 (89.5%) |
| Fuel Oil or Kerosene | 0 (0.0%) | 0 (0.0%) |
| Coal or Coke | 0 (0.0%) | 0 (0.0%) |
| All other Fuels | 0 (0.0%) | 0 (0.0%) |
| No Fuel Used | 14 (3.9%) | 0 (0.0%) |
| Total | 357 (100.0%) | 668 (100.0%) |
Household Vehicle Usage in Warsaw
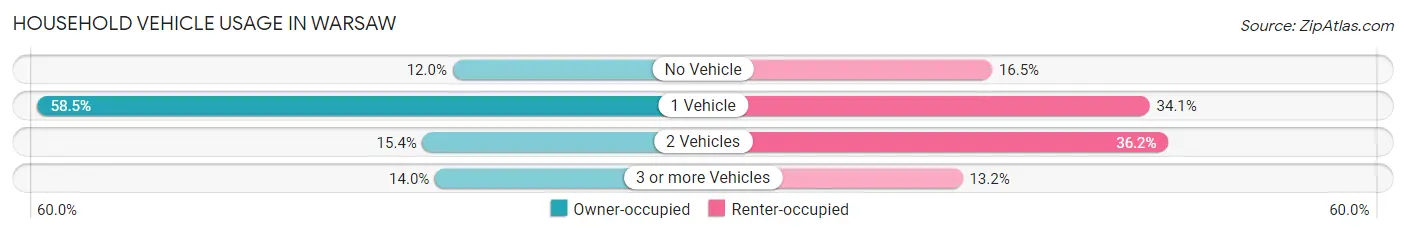
| Vehicles per Household | Owner-occupied | Renter-occupied |
| No Vehicle | 43 (12.0%) | 110 (16.5%) |
| 1 Vehicle | 209 (58.5%) | 228 (34.1%) |
| 2 Vehicles | 55 (15.4%) | 242 (36.2%) |
| 3 or more Vehicles | 50 (14.0%) | 88 (13.2%) |
| Total | 357 (100.0%) | 668 (100.0%) |
Real Estate & Mortgages in Warsaw
Real Estate and Mortgage Overview in Warsaw
| Characteristic | Without Mortgage | With Mortgage |
| Housing Units | 293 | 64 |
| Median Property Value | $73,000 | $0 |
| Median Household Income | $44,292 | $0 |
| Monthly Housing Costs | $471 | $0 |
| Real Estate Taxes | $1,423 | $0 |
Property Value by Mortgage Status in Warsaw
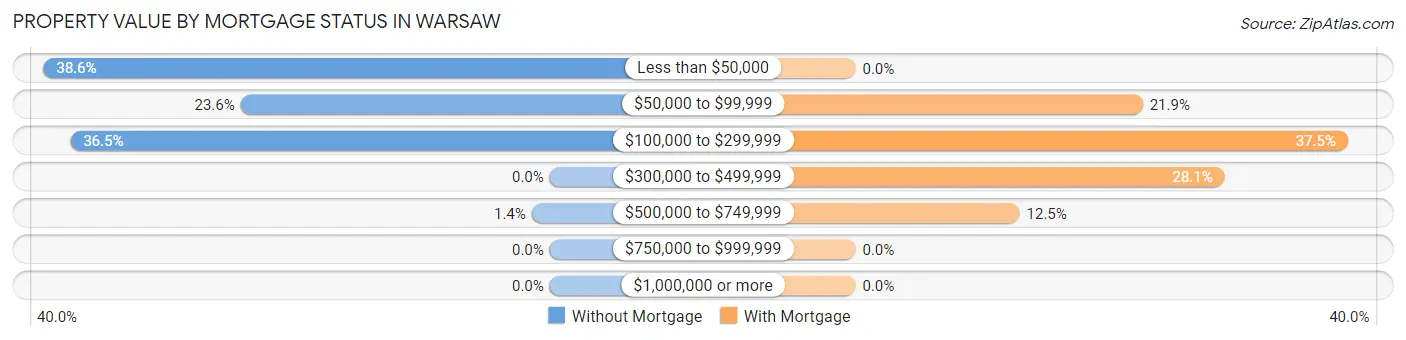
| Property Value | Without Mortgage | With Mortgage |
| Less than $50,000 | 113 (38.6%) | 0 (0.0%) |
| $50,000 to $99,999 | 69 (23.5%) | 14 (21.9%) |
| $100,000 to $299,999 | 107 (36.5%) | 24 (37.5%) |
| $300,000 to $499,999 | 0 (0.0%) | 18 (28.1%) |
| $500,000 to $749,999 | 4 (1.4%) | 8 (12.5%) |
| $750,000 to $999,999 | 0 (0.0%) | 0 (0.0%) |
| $1,000,000 or more | 0 (0.0%) | 0 (0.0%) |
| Total | 293 (100.0%) | 64 (100.0%) |
Household Income by Mortgage Status in Warsaw
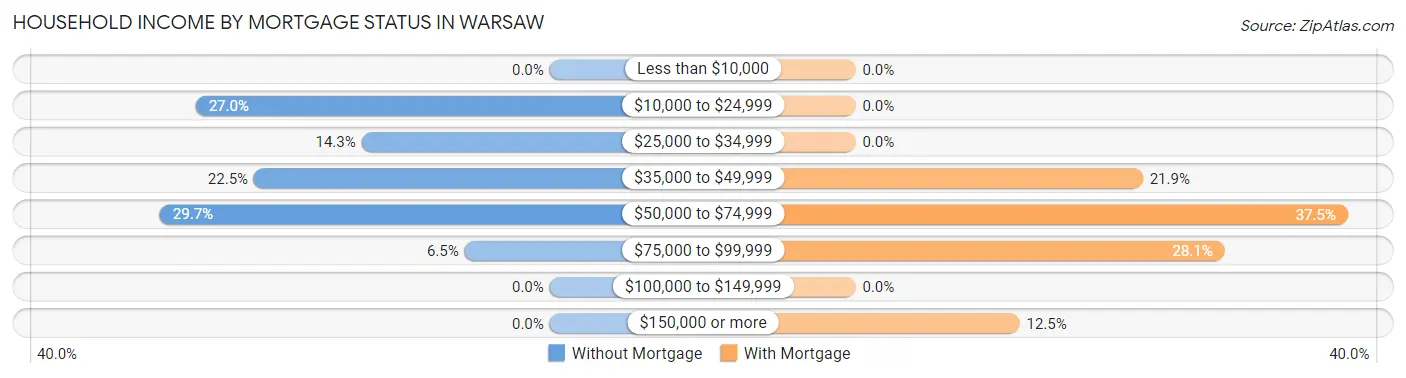
| Household Income | Without Mortgage | With Mortgage |
| Less than $10,000 | 0 (0.0%) | 0 (0.0%) |
| $10,000 to $24,999 | 79 (27.0%) | 0 (0.0%) |
| $25,000 to $34,999 | 42 (14.3%) | 0 (0.0%) |
| $35,000 to $49,999 | 66 (22.5%) | 14 (21.9%) |
| $50,000 to $74,999 | 87 (29.7%) | 24 (37.5%) |
| $75,000 to $99,999 | 19 (6.5%) | 18 (28.1%) |
| $100,000 to $149,999 | 0 (0.0%) | 0 (0.0%) |
| $150,000 or more | 0 (0.0%) | 8 (12.5%) |
| Total | 293 (100.0%) | 64 (100.0%) |
Property Value to Household Income Ratio in Warsaw
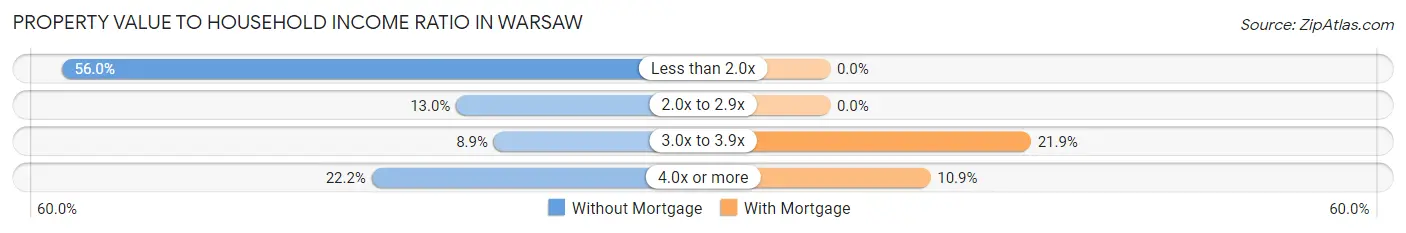
| Value-to-Income Ratio | Without Mortgage | With Mortgage |
| Less than 2.0x | 164 (56.0%) | 0 (0.0%) |
| 2.0x to 2.9x | 38 (13.0%) | 0 (0.0%) |
| 3.0x to 3.9x | 26 (8.9%) | 14 (21.9%) |
| 4.0x or more | 65 (22.2%) | 7 (10.9%) |
| Total | 293 (100.0%) | 64 (100.0%) |
Real Estate Taxes by Mortgage Status in Warsaw
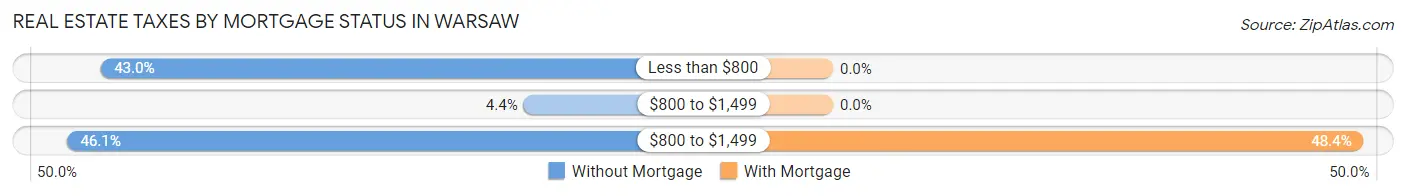
| Property Taxes | Without Mortgage | With Mortgage |
| Less than $800 | 126 (43.0%) | 0 (0.0%) |
| $800 to $1,499 | 13 (4.4%) | 0 (0.0%) |
| $800 to $1,499 | 135 (46.1%) | 31 (48.4%) |
| Total | 293 (100.0%) | 64 (100.0%) |
Health & Disability in Warsaw
Health Insurance Coverage by Age in Warsaw
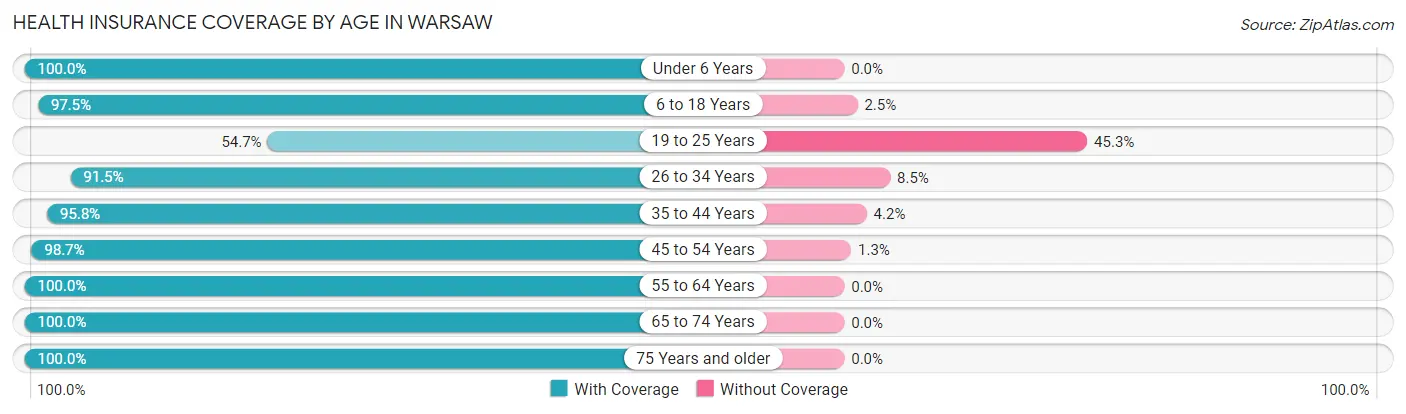
| Age Bracket | With Coverage | Without Coverage |
| Under 6 Years | 252 (100.0%) | 0 (0.0%) |
| 6 to 18 Years | 475 (97.5%) | 12 (2.5%) |
| 19 to 25 Years | 180 (54.7%) | 149 (45.3%) |
| 26 to 34 Years | 300 (91.5%) | 28 (8.5%) |
| 35 to 44 Years | 460 (95.8%) | 20 (4.2%) |
| 45 to 54 Years | 156 (98.7%) | 2 (1.3%) |
| 55 to 64 Years | 123 (100.0%) | 0 (0.0%) |
| 65 to 74 Years | 244 (100.0%) | 0 (0.0%) |
| 75 Years and older | 255 (100.0%) | 0 (0.0%) |
| Total | 2,445 (92.1%) | 211 (7.9%) |
Health Insurance Coverage by Citizenship Status in Warsaw
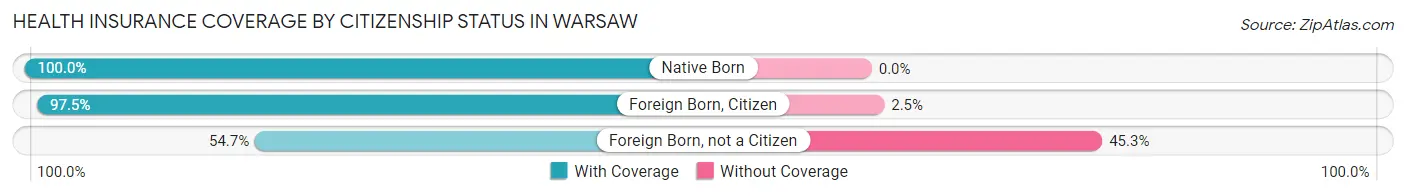
| Citizenship Status | With Coverage | Without Coverage |
| Native Born | 252 (100.0%) | 0 (0.0%) |
| Foreign Born, Citizen | 475 (97.5%) | 12 (2.5%) |
| Foreign Born, not a Citizen | 180 (54.7%) | 149 (45.3%) |
Health Insurance Coverage by Household Income in Warsaw
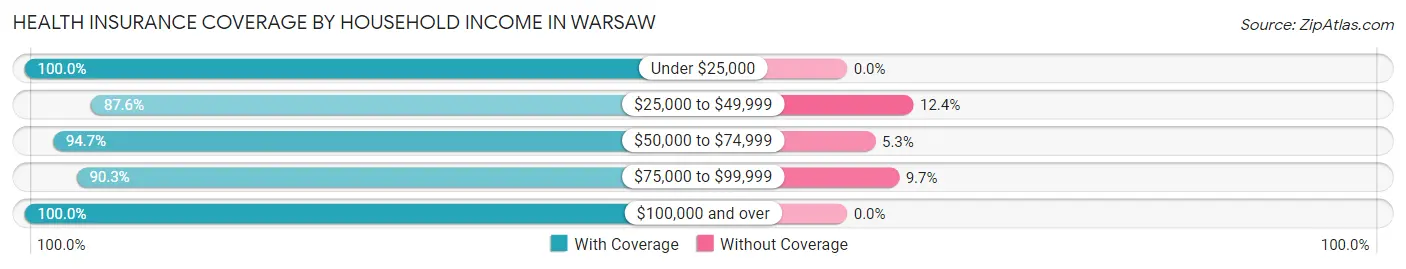
| Household Income | With Coverage | Without Coverage |
| Under $25,000 | 365 (100.0%) | 0 (0.0%) |
| $25,000 to $49,999 | 1,143 (87.6%) | 162 (12.4%) |
| $50,000 to $74,999 | 197 (94.7%) | 11 (5.3%) |
| $75,000 to $99,999 | 353 (90.3%) | 38 (9.7%) |
| $100,000 and over | 380 (100.0%) | 0 (0.0%) |
Public vs Private Health Insurance Coverage by Age in Warsaw
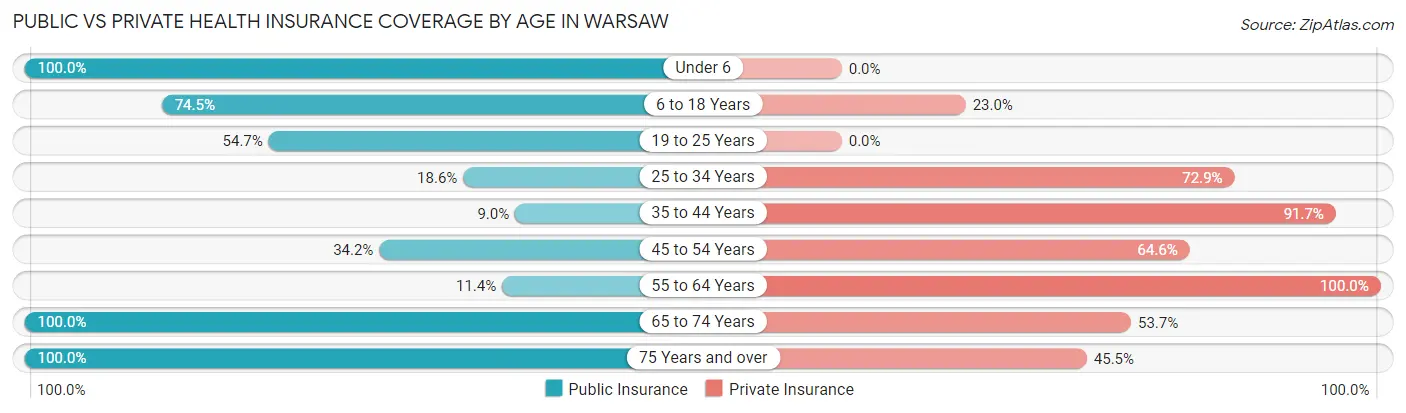
| Age Bracket | Public Insurance | Private Insurance |
| Under 6 | 252 (100.0%) | 0 (0.0%) |
| 6 to 18 Years | 363 (74.5%) | 112 (23.0%) |
| 19 to 25 Years | 180 (54.7%) | 0 (0.0%) |
| 25 to 34 Years | 61 (18.6%) | 239 (72.9%) |
| 35 to 44 Years | 43 (9.0%) | 440 (91.7%) |
| 45 to 54 Years | 54 (34.2%) | 102 (64.6%) |
| 55 to 64 Years | 14 (11.4%) | 123 (100.0%) |
| 65 to 74 Years | 244 (100.0%) | 131 (53.7%) |
| 75 Years and over | 255 (100.0%) | 116 (45.5%) |
| Total | 1,466 (55.2%) | 1,263 (47.5%) |
Disability Status by Sex by Age in Warsaw
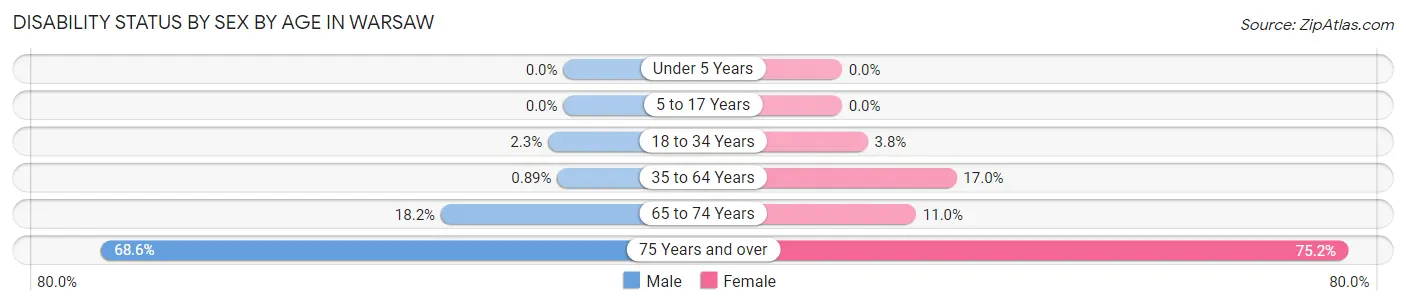
| Age Bracket | Male | Female |
| Under 5 Years | 0 (0.0%) | 0 (0.0%) |
| 5 to 17 Years | 0 (0.0%) | 0 (0.0%) |
| 18 to 34 Years | 6 (2.3%) | 16 (3.8%) |
| 35 to 64 Years | 3 (0.9%) | 72 (17.0%) |
| 65 to 74 Years | 8 (18.2%) | 22 (11.0%) |
| 75 Years and over | 59 (68.6%) | 127 (75.1%) |
Disability Class by Sex by Age in Warsaw
Disability Class: Hearing Difficulty
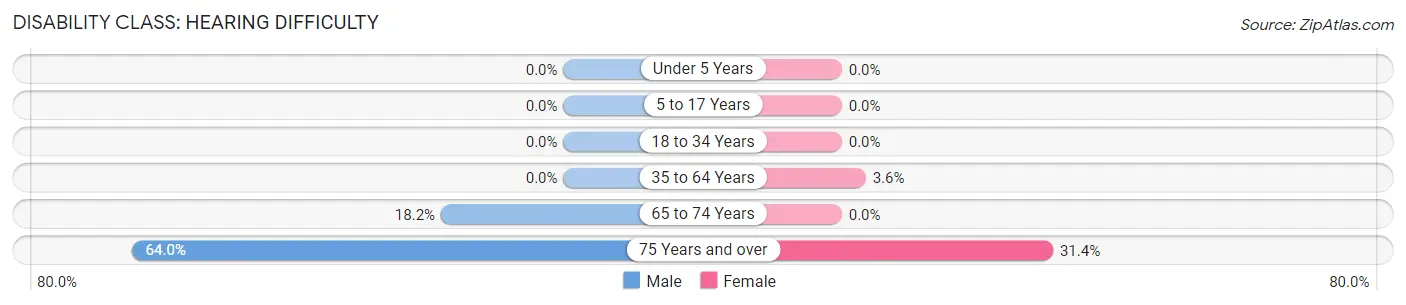
| Age Bracket | Male | Female |
| Under 5 Years | 0 (0.0%) | 0 (0.0%) |
| 5 to 17 Years | 0 (0.0%) | 0 (0.0%) |
| 18 to 34 Years | 0 (0.0%) | 0 (0.0%) |
| 35 to 64 Years | 0 (0.0%) | 15 (3.5%) |
| 65 to 74 Years | 8 (18.2%) | 0 (0.0%) |
| 75 Years and over | 55 (63.9%) | 53 (31.4%) |
Disability Class: Vision Difficulty
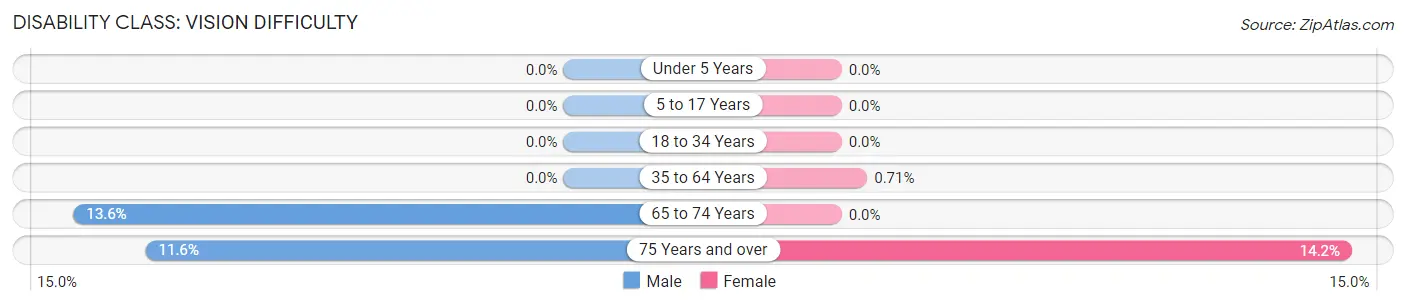
| Age Bracket | Male | Female |
| Under 5 Years | 0 (0.0%) | 0 (0.0%) |
| 5 to 17 Years | 0 (0.0%) | 0 (0.0%) |
| 18 to 34 Years | 0 (0.0%) | 0 (0.0%) |
| 35 to 64 Years | 0 (0.0%) | 3 (0.7%) |
| 65 to 74 Years | 6 (13.6%) | 0 (0.0%) |
| 75 Years and over | 10 (11.6%) | 24 (14.2%) |
Disability Class: Cognitive Difficulty
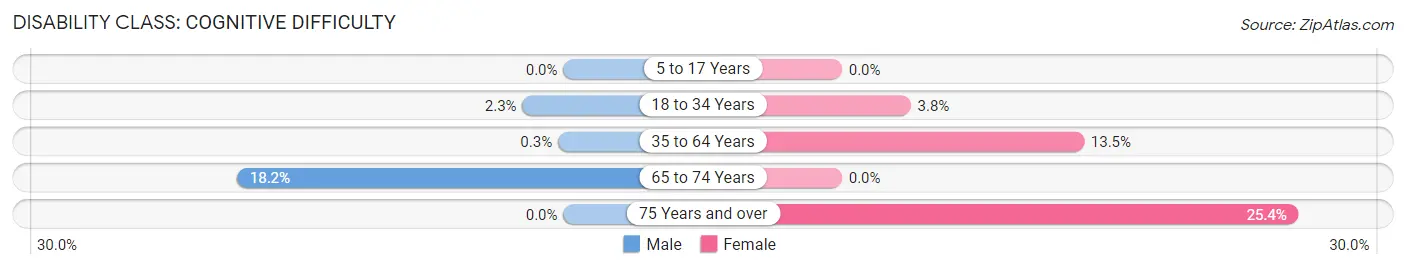
| Age Bracket | Male | Female |
| 5 to 17 Years | 0 (0.0%) | 0 (0.0%) |
| 18 to 34 Years | 6 (2.3%) | 16 (3.8%) |
| 35 to 64 Years | 1 (0.3%) | 57 (13.5%) |
| 65 to 74 Years | 8 (18.2%) | 0 (0.0%) |
| 75 Years and over | 0 (0.0%) | 43 (25.4%) |
Disability Class: Ambulatory Difficulty
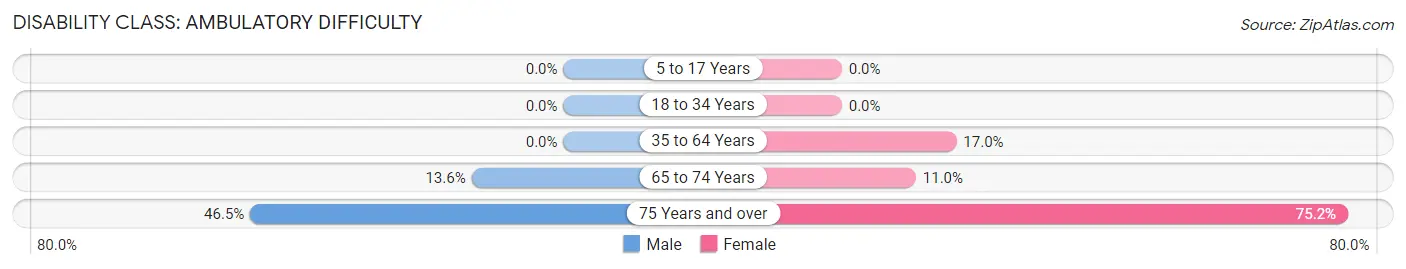
| Age Bracket | Male | Female |
| 5 to 17 Years | 0 (0.0%) | 0 (0.0%) |
| 18 to 34 Years | 0 (0.0%) | 0 (0.0%) |
| 35 to 64 Years | 0 (0.0%) | 72 (17.0%) |
| 65 to 74 Years | 6 (13.6%) | 22 (11.0%) |
| 75 Years and over | 40 (46.5%) | 127 (75.1%) |
Disability Class: Self-Care Difficulty
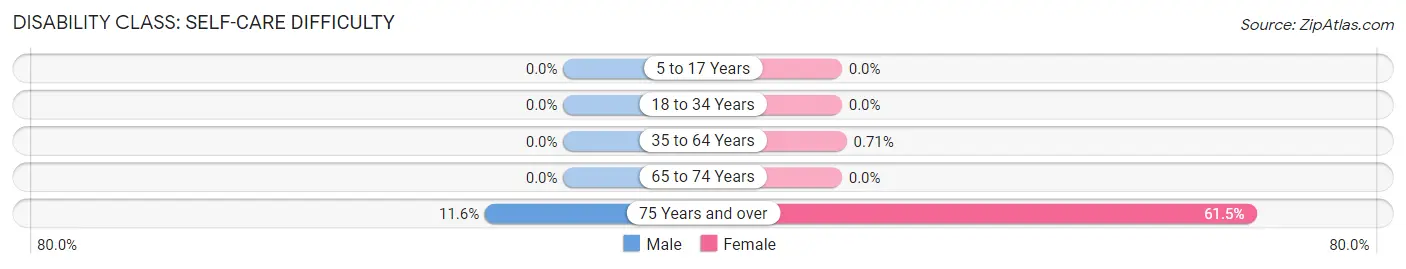
| Age Bracket | Male | Female |
| 5 to 17 Years | 0 (0.0%) | 0 (0.0%) |
| 18 to 34 Years | 0 (0.0%) | 0 (0.0%) |
| 35 to 64 Years | 0 (0.0%) | 3 (0.7%) |
| 65 to 74 Years | 0 (0.0%) | 0 (0.0%) |
| 75 Years and over | 10 (11.6%) | 104 (61.5%) |
Technology Access in Warsaw
Computing Device Access in Warsaw
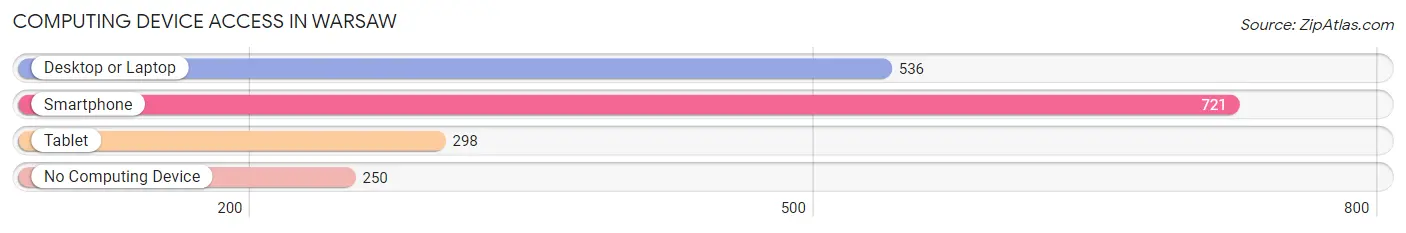
| Device Type | # Households | % Households |
| Desktop or Laptop | 536 | 52.3% |
| Smartphone | 721 | 70.3% |
| Tablet | 298 | 29.1% |
| No Computing Device | 250 | 24.4% |
| Total | 1,025 | 100.0% |
Internet Access in Warsaw
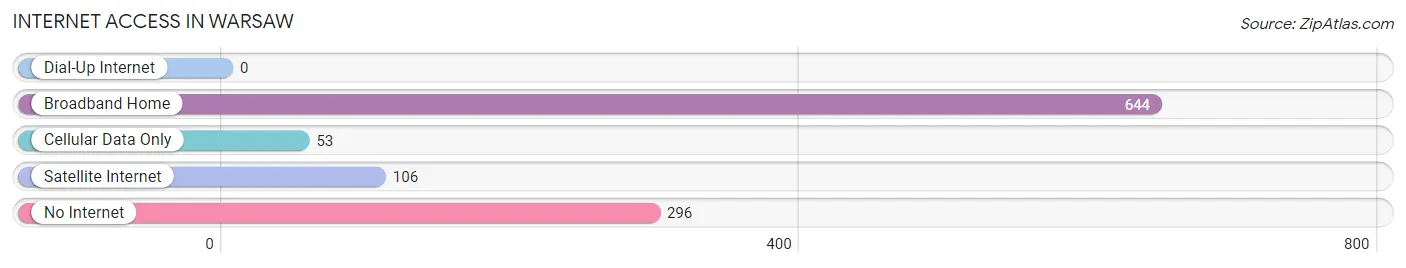
| Internet Type | # Households | % Households |
| Dial-Up Internet | 0 | 0.0% |
| Broadband Home | 644 | 62.8% |
| Cellular Data Only | 53 | 5.2% |
| Satellite Internet | 106 | 10.3% |
| No Internet | 296 | 28.9% |
| Total | 1,025 | 100.0% |
Warsaw Summary
Warsaw, North Carolina is a small town located in Duplin County, North Carolina. It is situated on the banks of the Northeast Cape Fear River, approximately 40 miles southeast of Raleigh. The town has a population of approximately 3,000 people and is the county seat of Duplin County.
Geography
Warsaw is located in the Coastal Plain region of North Carolina, which is characterized by flat terrain and sandy soils. The town is situated on the banks of the Northeast Cape Fear River, which is a major tributary of the Cape Fear River. The town is located at an elevation of approximately 30 feet above sea level. The climate in Warsaw is humid subtropical, with hot, humid summers and mild winters.
History
The area that is now Warsaw was first settled in the late 1700s by European settlers. The town was officially incorporated in 1817 and was named after the city of Warsaw in Poland. The town was an important trading center in the early 19th century, and it was the site of a major Civil War battle in 1865. After the war, the town experienced a period of growth and prosperity, and it became the county seat of Duplin County in 1868.
Economy
The economy of Warsaw is largely based on agriculture and manufacturing. The town is home to several large poultry processing plants, as well as a number of smaller businesses. The town is also home to a number of retail stores, restaurants, and other businesses.
Demographics
As of the 2010 census, the population of Warsaw was 3,068. The racial makeup of the town was 79.3% White, 16.2% African American, 0.5% Native American, 0.7% Asian, 0.1% Pacific Islander, and 2.2% from other races. The median household income in Warsaw was $31,944, and the median family income was $41,250. The per capita income in Warsaw was $17,845.
Conclusion
Warsaw, North Carolina is a small town located in Duplin County, North Carolina. It is situated on the banks of the Northeast Cape Fear River, approximately 40 miles southeast of Raleigh. The town has a population of approximately 3,000 people and is the county seat of Duplin County. The economy of Warsaw is largely based on agriculture and manufacturing, and the town is home to several large poultry processing plants, as well as a number of smaller businesses. The racial makeup of the town is 79.3% White, 16.2% African American, 0.5% Native American, 0.7% Asian, 0.1% Pacific Islander, and 2.2% from other races. The median household income in Warsaw was $31,944, and the median family income was $41,250. The per capita income in Warsaw was $17,845.
Common Questions
What is Per Capita Income in Warsaw?
Per Capita income in Warsaw is $18,137.
What is the Median Family Income in Warsaw?
Median Family Income in Warsaw is $41,846.
What is the Median Household income in Warsaw?
Median Household Income in Warsaw is $41,831.
What is Income or Wage Gap in Warsaw?
Income or Wage Gap in Warsaw is 13.5%.
Women in Warsaw earn 86.5 cents for every dollar earned by a man.
What is Inequality or Gini Index in Warsaw?
Inequality or Gini Index in Warsaw is 0.38.
What is the Total Population of Warsaw?
Total Population of Warsaw is 2,743.
What is the Total Male Population of Warsaw?
Total Male Population of Warsaw is 912.
What is the Total Female Population of Warsaw?
Total Female Population of Warsaw is 1,831.
What is the Ratio of Males per 100 Females in Warsaw?
There are 49.81 Males per 100 Females in Warsaw.
What is the Ratio of Females per 100 Males in Warsaw?
There are 200.77 Females per 100 Males in Warsaw.
What is the Median Population Age in Warsaw?
Median Population Age in Warsaw is 34.3 Years.
What is the Average Family Size in Warsaw
Average Family Size in Warsaw is 4.3 People.
What is the Average Household Size in Warsaw
Average Household Size in Warsaw is 2.6 People.
How Large is the Labor Force in Warsaw?
There are 1,040 People in the Labor Forcein in Warsaw.
What is the Percentage of People in the Labor Force in Warsaw?
50.8% of People are in the Labor Force in Warsaw.
What is the Unemployment Rate in Warsaw?
Unemployment Rate in Warsaw is 6.0%.