Light Oak, NC Map & Demographics
Light Oak Map
Light Oak Overview
$15,774
PER CAPITA INCOME
0.51
INEQUALITY / GINI INDEX
677
TOTAL POPULATION
363
MALE POPULATION
314
FEMALE POPULATION
115.61
MALES / 100 FEMALES
86.50
FEMALES / 100 MALES
29.8
MEDIAN AGE
2.7
AVG FAMILY SIZE
3.6
AVG HOUSEHOLD SIZE
225
LABOR FORCE [ PEOPLE ]
39.8%
PERCENT IN LABOR FORCE
27.1%
UNEMPLOYMENT RATE
Income in Light Oak
Income Overview in Light Oak
| Characteristic | Number | Measure |
| Per Capita Income | 677 | $15,774 |
| Median Family Income | 186 | $0 |
| Mean Family Income | 186 | $43,992 |
| Median Household Income | 186 | $0 |
| Mean Household Income | 186 | $48,015 |
| Income Deficit | 186 | $0 |
| Wage / Income Gap (%) | 677 | 0.00% |
| Wage / Income Gap ($) | 677 | 100.00¢ per $1 |
| Gini / Inequality Index | 677 | 0.51 |
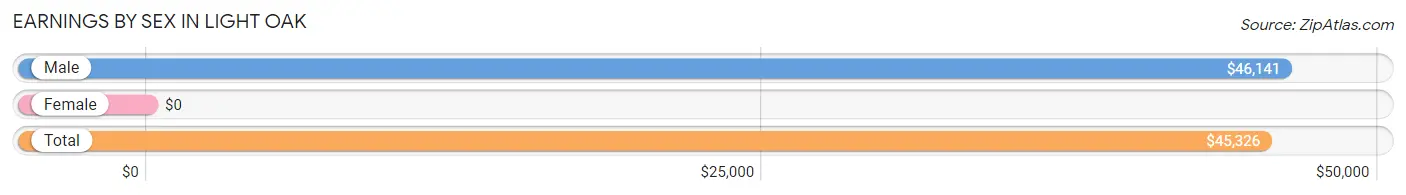
Earnings by Sex in Light Oak
| Sex | Number | Average Earnings |
| Male | 81 (49.4%) | $46,141 |
| Female | 83 (50.6%) | $0 |
| Total | 164 (100.0%) | $45,326 |
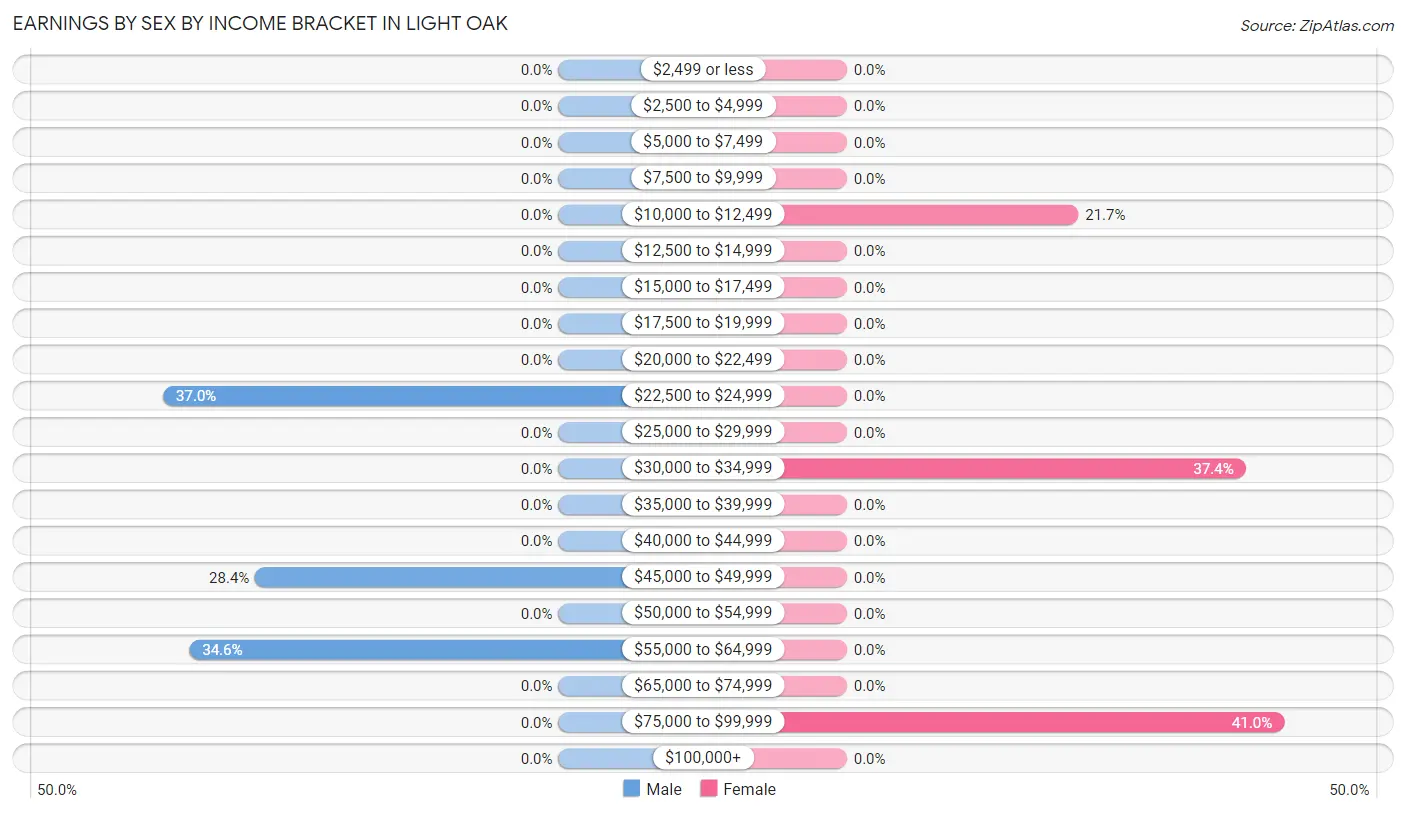
Earnings by Sex by Income Bracket in Light Oak
The most common earnings brackets in Light Oak are $22,500 to $24,999 for men (30 | 37.0%) and $75,000 to $99,999 for women (34 | 41.0%).
| Income | Male | Female |
| $2,499 or less | 0 (0.0%) | 0 (0.0%) |
| $2,500 to $4,999 | 0 (0.0%) | 0 (0.0%) |
| $5,000 to $7,499 | 0 (0.0%) | 0 (0.0%) |
| $7,500 to $9,999 | 0 (0.0%) | 0 (0.0%) |
| $10,000 to $12,499 | 0 (0.0%) | 18 (21.7%) |
| $12,500 to $14,999 | 0 (0.0%) | 0 (0.0%) |
| $15,000 to $17,499 | 0 (0.0%) | 0 (0.0%) |
| $17,500 to $19,999 | 0 (0.0%) | 0 (0.0%) |
| $20,000 to $22,499 | 0 (0.0%) | 0 (0.0%) |
| $22,500 to $24,999 | 30 (37.0%) | 0 (0.0%) |
| $25,000 to $29,999 | 0 (0.0%) | 0 (0.0%) |
| $30,000 to $34,999 | 0 (0.0%) | 31 (37.3%) |
| $35,000 to $39,999 | 0 (0.0%) | 0 (0.0%) |
| $40,000 to $44,999 | 0 (0.0%) | 0 (0.0%) |
| $45,000 to $49,999 | 23 (28.4%) | 0 (0.0%) |
| $50,000 to $54,999 | 0 (0.0%) | 0 (0.0%) |
| $55,000 to $64,999 | 28 (34.6%) | 0 (0.0%) |
| $65,000 to $74,999 | 0 (0.0%) | 0 (0.0%) |
| $75,000 to $99,999 | 0 (0.0%) | 34 (41.0%) |
| $100,000+ | 0 (0.0%) | 0 (0.0%) |
| Total | 81 (100.0%) | 83 (100.0%) |
Earnings by Sex by Educational Attainment in Light Oak
| Educational Attainment | Male Income | Female Income |
| Less than High School | - | - |
| High School Diploma | - | - |
| College or Associate's Degree | - | - |
| Bachelor's Degree | - | - |
| Graduate Degree | - | - |
| Total | - | - |
Family Income in Light Oak
Family Income Brackets in Light Oak
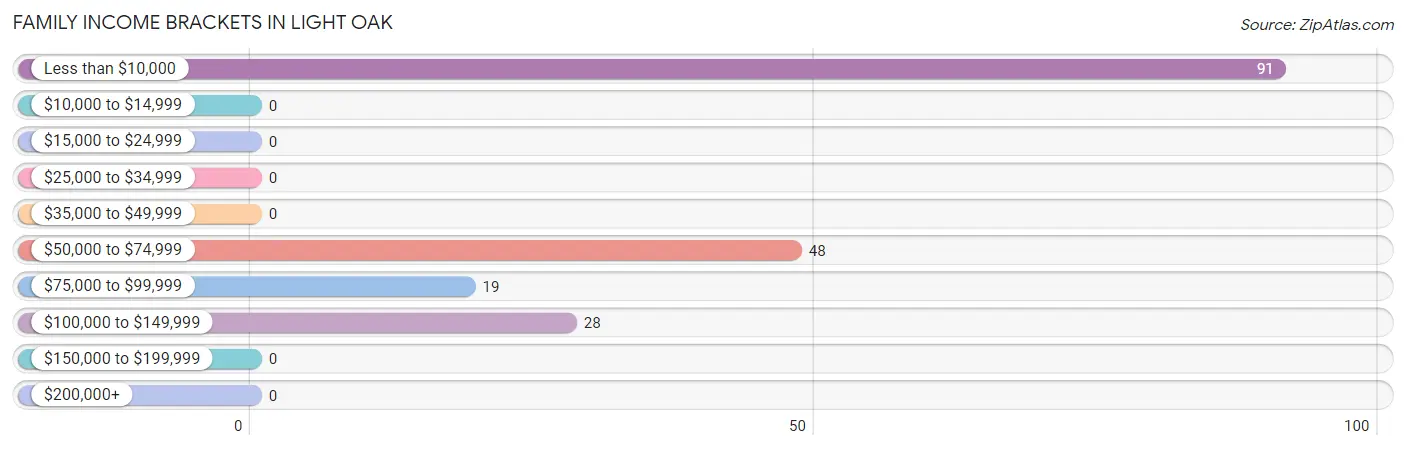
According to the Light Oak family income data, there are 91 families falling into the less than $10,000 income range, which is the most common income bracket and makes up 48.9% of all families.
| Income Bracket | # Families | % Families |
| Less than $10,000 | 91 | 48.9% |
| $10,000 to $14,999 | 0 | 0.0% |
| $15,000 to $24,999 | 0 | 0.0% |
| $25,000 to $34,999 | 0 | 0.0% |
| $35,000 to $49,999 | 0 | 0.0% |
| $50,000 to $74,999 | 48 | 25.8% |
| $75,000 to $99,999 | 19 | 10.2% |
| $100,000 to $149,999 | 28 | 15.1% |
| $150,000 to $199,999 | 0 | 0.0% |
| $200,000+ | 0 | 0.0% |
Family Income by Famaliy Size in Light Oak
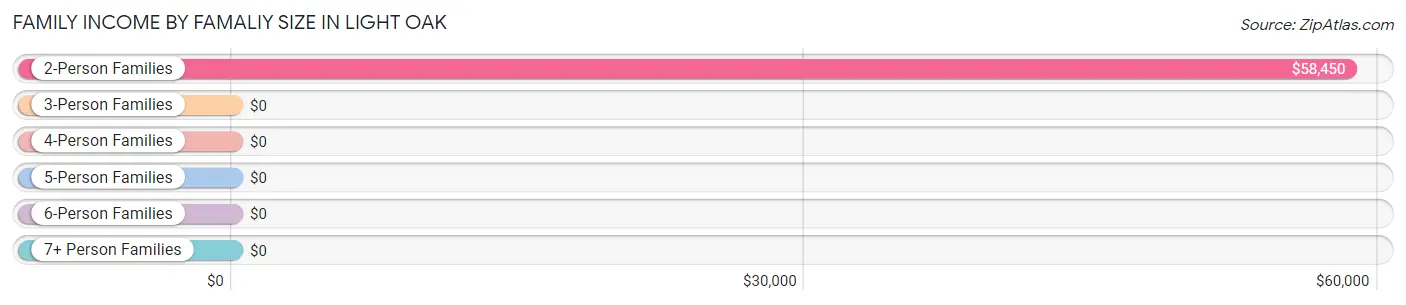
2-person families (69 | 37.1%) account for the highest median family income in Light Oak with $58,450 per family, while 2-person families (69 | 37.1%) have the highest median income of $29,225 per family member.
| Income Bracket | # Families | Median Income |
| 2-Person Families | 69 (37.1%) | $58,450 |
| 3-Person Families | 89 (47.8%) | $0 |
| 4-Person Families | 28 (15.0%) | $0 |
| 5-Person Families | 0 (0.0%) | $0 |
| 6-Person Families | 0 (0.0%) | $0 |
| 7+ Person Families | 0 (0.0%) | $0 |
| Total | 186 (100.0%) | $0 |
Family Income by Number of Earners in Light Oak
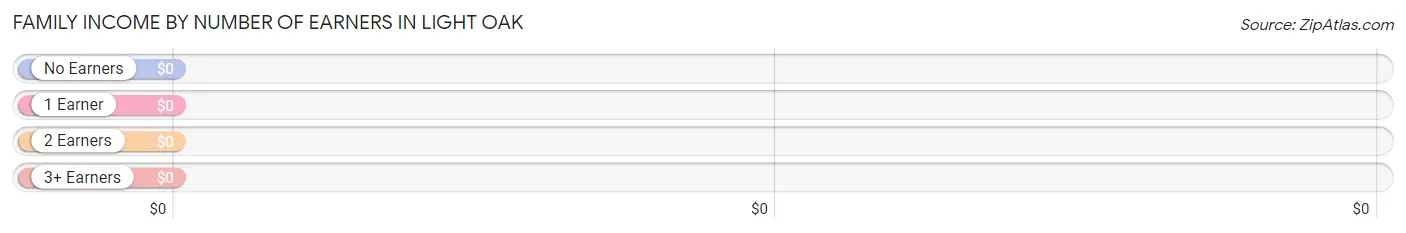
| Number of Earners | # Families | Median Income |
| No Earners | 116 (62.4%) | $0 |
| 1 Earner | 19 (10.2%) | $0 |
| 2 Earners | 23 (12.4%) | $0 |
| 3+ Earners | 28 (15.0%) | $0 |
| Total | 186 (100.0%) | $0 |
Household Income in Light Oak
Household Income Brackets in Light Oak
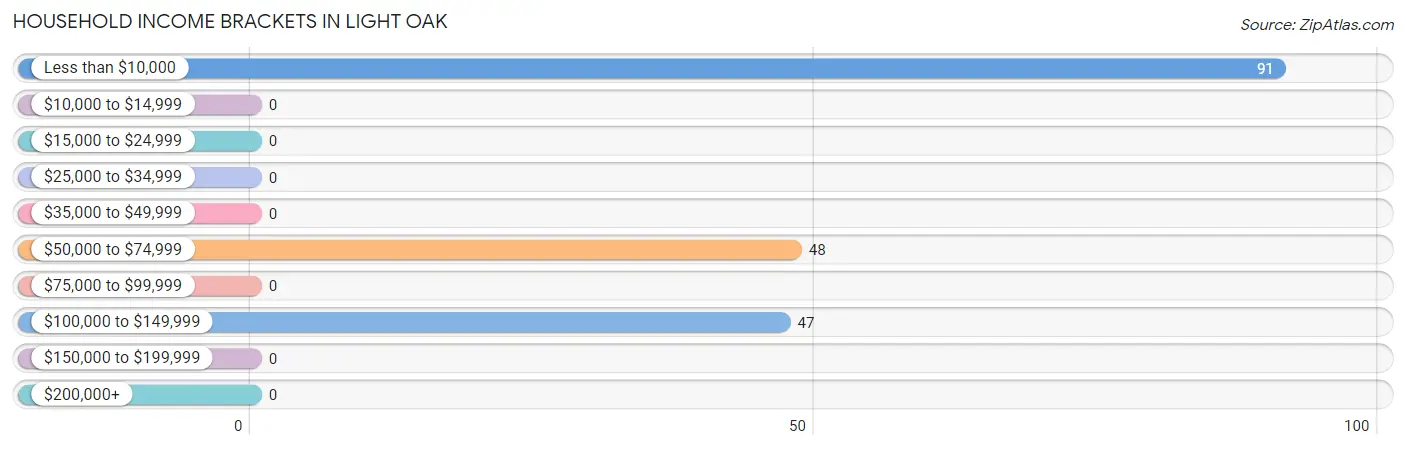
With 91 households falling in the category, the less than $10,000 income range is the most frequent in Light Oak, accounting for 48.9% of all households.
| Income Bracket | # Households | % Households |
| Less than $10,000 | 91 | 48.9% |
| $10,000 to $14,999 | 0 | 0.0% |
| $15,000 to $24,999 | 0 | 0.0% |
| $25,000 to $34,999 | 0 | 0.0% |
| $35,000 to $49,999 | 0 | 0.0% |
| $50,000 to $74,999 | 48 | 25.8% |
| $75,000 to $99,999 | 0 | 0.0% |
| $100,000 to $149,999 | 47 | 25.3% |
| $150,000 to $199,999 | 0 | 0.0% |
| $200,000+ | 0 | 0.0% |
Household Income by Householder Age in Light Oak
| Income Bracket | # Households | Median Income |
| 15 to 24 Years | 0 (0.0%) | $0 |
| 25 to 44 Years | 89 (47.8%) | $0 |
| 45 to 64 Years | 47 (25.3%) | $0 |
| 65+ Years | 50 (26.9%) | $0 |
| Total | 186 (100.0%) | $0 |
Poverty in Light Oak
Income Below Poverty by Sex and Age in Light Oak
With 54.0% poverty level for males and 43.3% for females among the residents of Light Oak, 6 to 11 year old males and 25 to 34 year old females are the most vulnerable to poverty, with 86 males (100.0%) and 66 females (100.0%) in their respective age groups living below the poverty level.
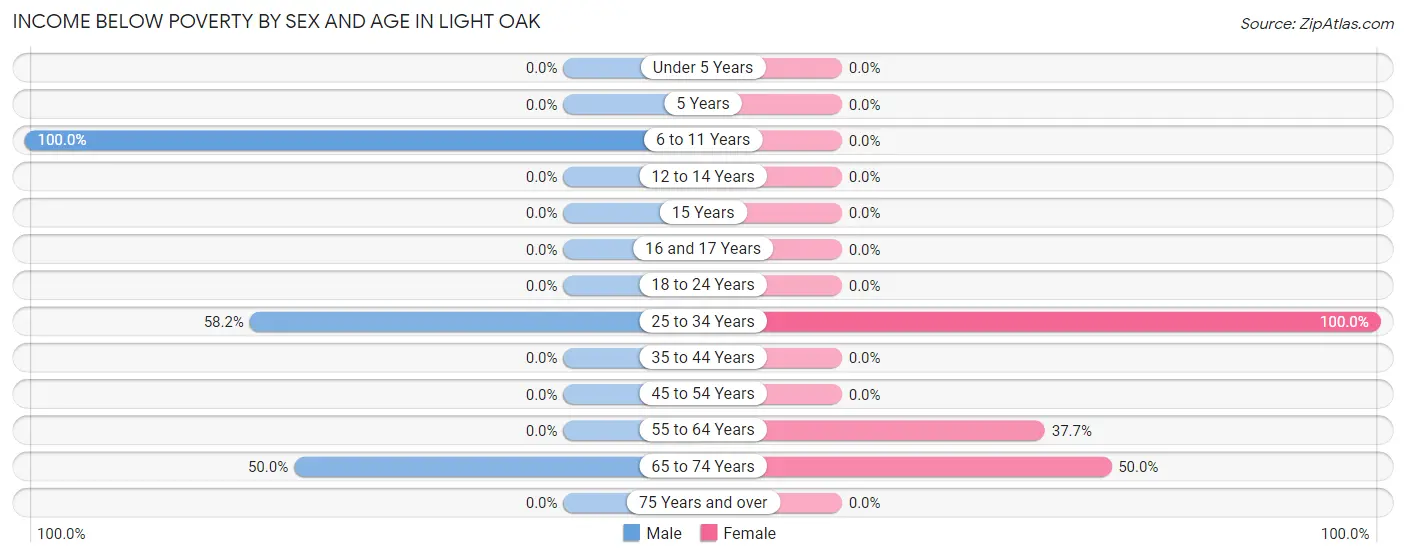
| Age Bracket | Male | Female |
| Under 5 Years | 0 (0.0%) | 0 (0.0%) |
| 5 Years | 0 (0.0%) | 0 (0.0%) |
| 6 to 11 Years | 86 (100.0%) | 0 (0.0%) |
| 12 to 14 Years | 0 (0.0%) | 0 (0.0%) |
| 15 Years | 0 (0.0%) | 0 (0.0%) |
| 16 and 17 Years | 0 (0.0%) | 0 (0.0%) |
| 18 to 24 Years | 0 (0.0%) | 0 (0.0%) |
| 25 to 34 Years | 85 (58.2%) | 66 (100.0%) |
| 35 to 44 Years | 0 (0.0%) | 0 (0.0%) |
| 45 to 54 Years | 0 (0.0%) | 0 (0.0%) |
| 55 to 64 Years | 0 (0.0%) | 52 (37.7%) |
| 65 to 74 Years | 25 (50.0%) | 18 (50.0%) |
| 75 Years and over | 0 (0.0%) | 0 (0.0%) |
| Total | 196 (54.0%) | 136 (43.3%) |
Income Above Poverty by Sex and Age in Light Oak
According to the poverty statistics in Light Oak, males aged 18 to 24 years and females aged 6 to 11 years are the age groups that are most secure financially, with 100.0% of males and 100.0% of females in these age groups living above the poverty line.
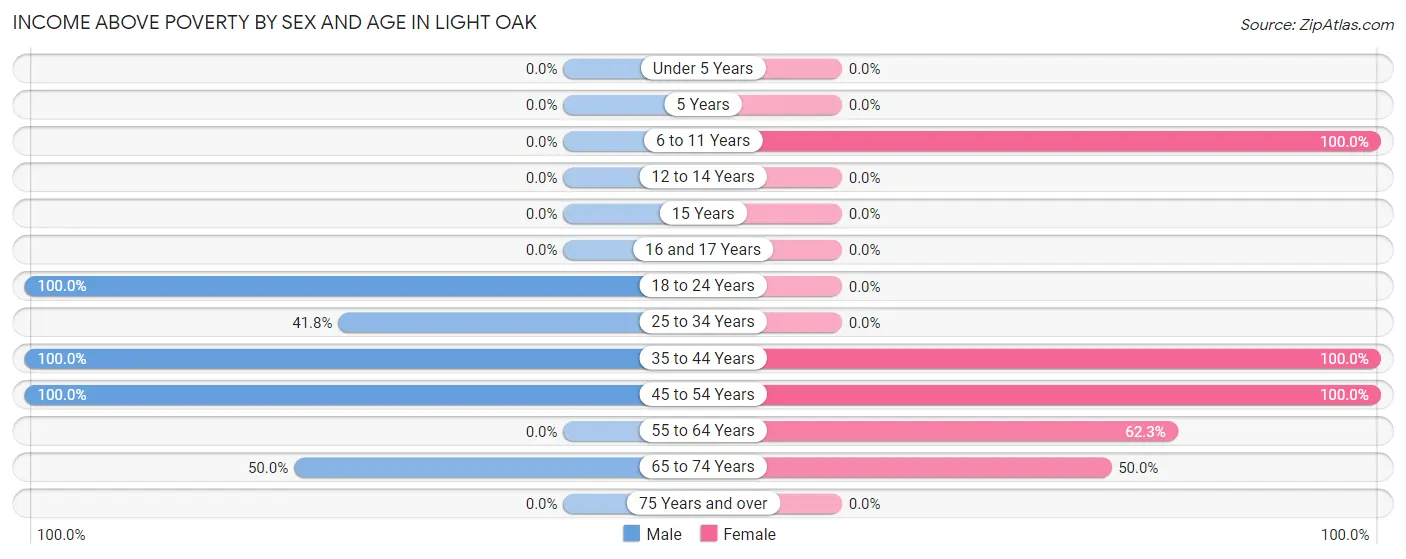
| Age Bracket | Male | Female |
| Under 5 Years | 0 (0.0%) | 0 (0.0%) |
| 5 Years | 0 (0.0%) | 0 (0.0%) |
| 6 to 11 Years | 0 (0.0%) | 25 (100.0%) |
| 12 to 14 Years | 0 (0.0%) | 0 (0.0%) |
| 15 Years | 0 (0.0%) | 0 (0.0%) |
| 16 and 17 Years | 0 (0.0%) | 0 (0.0%) |
| 18 to 24 Years | 30 (100.0%) | 0 (0.0%) |
| 25 to 34 Years | 61 (41.8%) | 0 (0.0%) |
| 35 to 44 Years | 23 (100.0%) | 18 (100.0%) |
| 45 to 54 Years | 28 (100.0%) | 31 (100.0%) |
| 55 to 64 Years | 0 (0.0%) | 86 (62.3%) |
| 65 to 74 Years | 25 (50.0%) | 18 (50.0%) |
| 75 Years and over | 0 (0.0%) | 0 (0.0%) |
| Total | 167 (46.0%) | 178 (56.7%) |
Income Below Poverty Among Married-Couple Families in Light Oak
The poverty statistics for married-couple families in Light Oak show that 24.7% or 25 of the total 101 families live below the poverty line. Families with no children have the highest poverty rate of 32.1%, comprising of 25 families. On the other hand, families with 1 or 2 children have the lowest poverty rate of 0.0%, which includes 0 families.
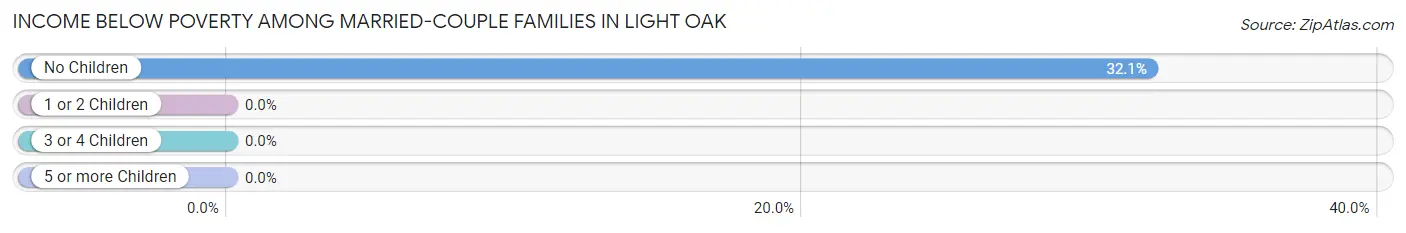
| Children | Above Poverty | Below Poverty |
| No Children | 53 (67.9%) | 25 (32.1%) |
| 1 or 2 Children | 23 (100.0%) | 0 (0.0%) |
| 3 or 4 Children | 0 (0.0%) | 0 (0.0%) |
| 5 or more Children | 0 (0.0%) | 0 (0.0%) |
| Total | 76 (75.2%) | 25 (24.7%) |
Income Below Poverty Among Single-Parent Households in Light Oak
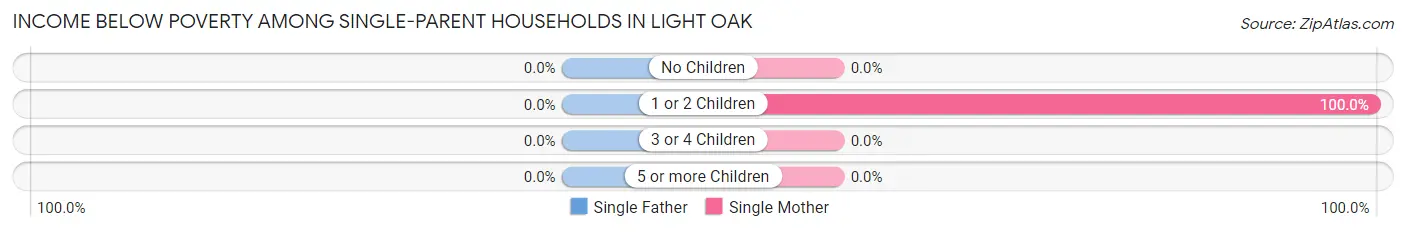
| Children | Single Father | Single Mother |
| No Children | 0 (0.0%) | 0 (0.0%) |
| 1 or 2 Children | 0 (0.0%) | 66 (100.0%) |
| 3 or 4 Children | 0 (0.0%) | 0 (0.0%) |
| 5 or more Children | 0 (0.0%) | 0 (0.0%) |
| Total | 0 (0.0%) | 66 (77.6%) |
Income Below Poverty Among Married-Couple vs Single-Parent Households in Light Oak
The poverty data for Light Oak shows that 25 of the married-couple family households (24.7%) and 66 of the single-parent households (77.6%) are living below the poverty level. Within the married-couple family households, those with no children have the highest poverty rate, with 25 households (32.1%) falling below the poverty line. Among the single-parent households, those with 1 or 2 children have the highest poverty rate, with 66 household (100.0%) living below poverty.
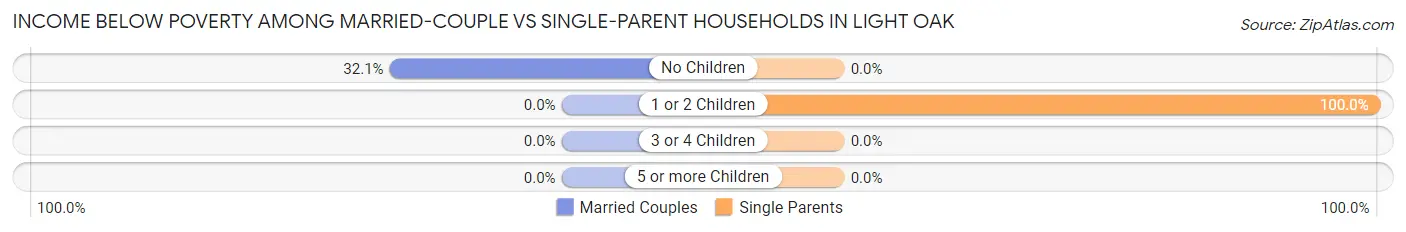
| Children | Married-Couple Families | Single-Parent Households |
| No Children | 25 (32.1%) | 0 (0.0%) |
| 1 or 2 Children | 0 (0.0%) | 66 (100.0%) |
| 3 or 4 Children | 0 (0.0%) | 0 (0.0%) |
| 5 or more Children | 0 (0.0%) | 0 (0.0%) |
| Total | 25 (24.7%) | 66 (77.6%) |
Race in Light Oak
The most populous races in Light Oak are Black / African American (611 | 90.2%), Hispanic or Latino (66 | 9.8%), and Two or more Races (66 | 9.8%).
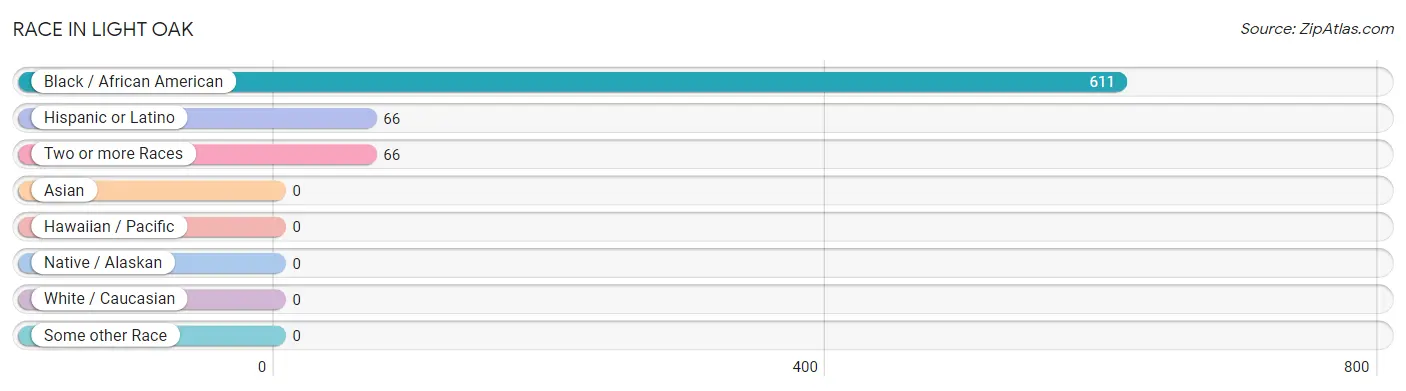
| Race | # Population | % Population |
| Asian | 0 | 0.0% |
| Black / African American | 611 | 90.2% |
| Hawaiian / Pacific | 0 | 0.0% |
| Hispanic or Latino | 66 | 9.8% |
| Native / Alaskan | 0 | 0.0% |
| White / Caucasian | 0 | 0.0% |
| Two or more Races | 66 | 9.8% |
| Some other Race | 0 | 0.0% |
| Total | 677 | 100.0% |
Ancestry in Light Oak
The most populous ancestries reported in Light Oak are , and Mexican (66 | 9.8%), together accounting for 9.8% of all Light Oak residents.

| Ancestry | # Population | % Population |
| Mexican | 66 | 9.8% | View All 1 Rows |
Immigrants in Light Oak

| Immigration Origin | # Population | % Population | View All 0 Rows |
Sex and Age in Light Oak
Sex and Age in Light Oak
The most populous age groups in Light Oak are 25 to 29 Years (146 | 40.2%) for men and 55 to 59 Years (138 | 44.0%) for women.
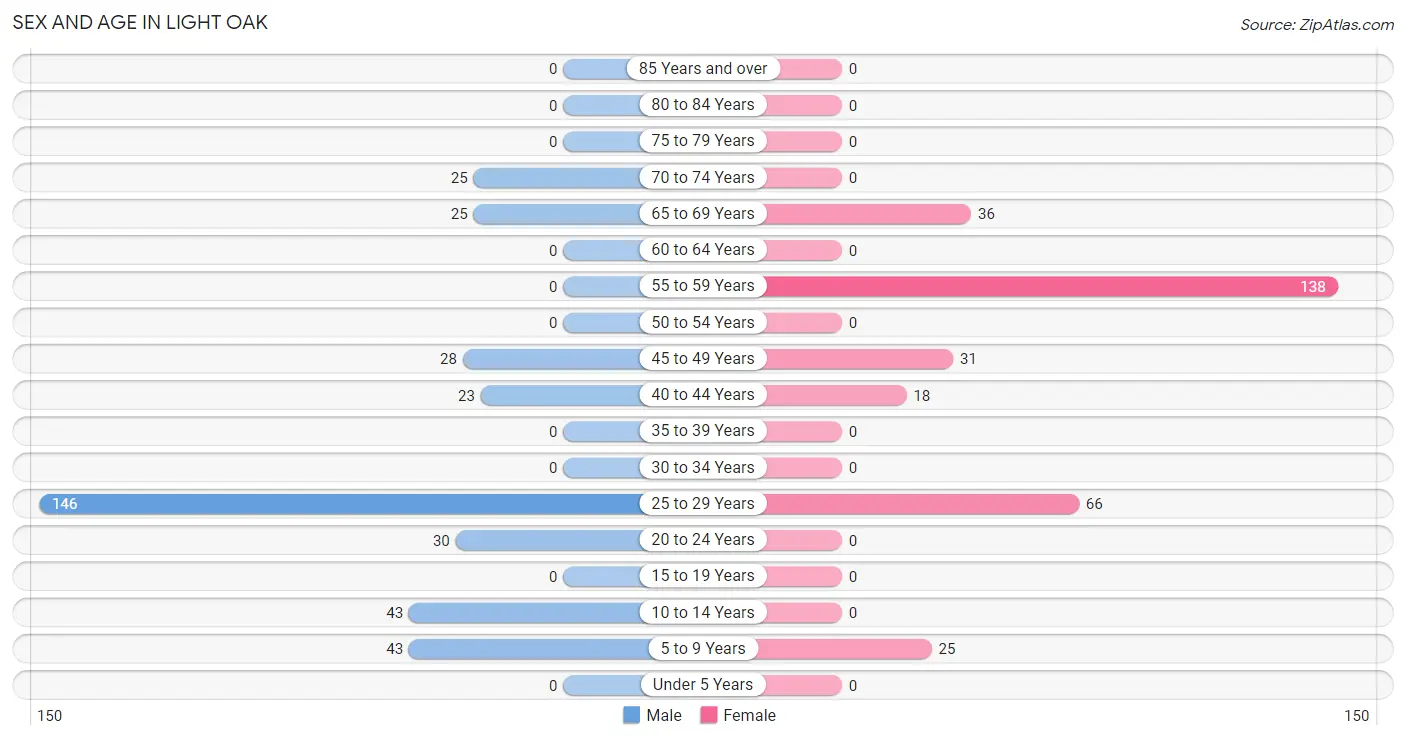
| Age Bracket | Male | Female |
| Under 5 Years | 0 (0.0%) | 0 (0.0%) |
| 5 to 9 Years | 43 (11.8%) | 25 (8.0%) |
| 10 to 14 Years | 43 (11.8%) | 0 (0.0%) |
| 15 to 19 Years | 0 (0.0%) | 0 (0.0%) |
| 20 to 24 Years | 30 (8.3%) | 0 (0.0%) |
| 25 to 29 Years | 146 (40.2%) | 66 (21.0%) |
| 30 to 34 Years | 0 (0.0%) | 0 (0.0%) |
| 35 to 39 Years | 0 (0.0%) | 0 (0.0%) |
| 40 to 44 Years | 23 (6.3%) | 18 (5.7%) |
| 45 to 49 Years | 28 (7.7%) | 31 (9.9%) |
| 50 to 54 Years | 0 (0.0%) | 0 (0.0%) |
| 55 to 59 Years | 0 (0.0%) | 138 (44.0%) |
| 60 to 64 Years | 0 (0.0%) | 0 (0.0%) |
| 65 to 69 Years | 25 (6.9%) | 36 (11.5%) |
| 70 to 74 Years | 25 (6.9%) | 0 (0.0%) |
| 75 to 79 Years | 0 (0.0%) | 0 (0.0%) |
| 80 to 84 Years | 0 (0.0%) | 0 (0.0%) |
| 85 Years and over | 0 (0.0%) | 0 (0.0%) |
| Total | 363 (100.0%) | 314 (100.0%) |
Families and Households in Light Oak
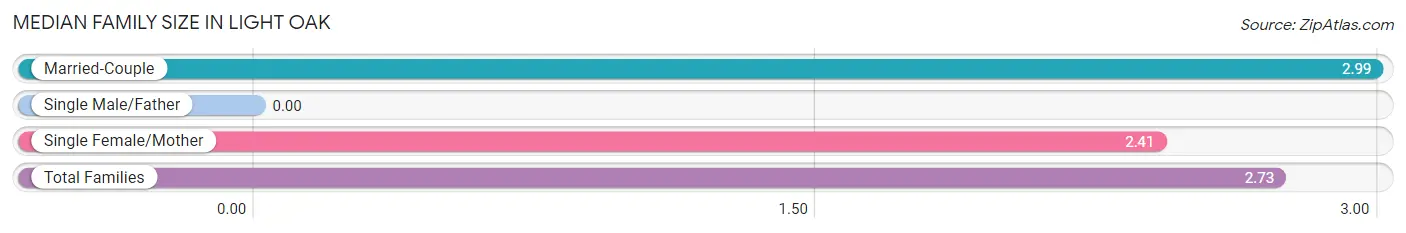
Median Family Size in Light Oak
| Family Type | # Families | Family Size |
| Married-Couple | 101 (54.3%) | 2.99 |
| Single Male/Father | 0 (0.0%) | - |
| Single Female/Mother | 85 (45.7%) | 2.41 |
| Total Families | 186 (100.0%) | 2.73 |
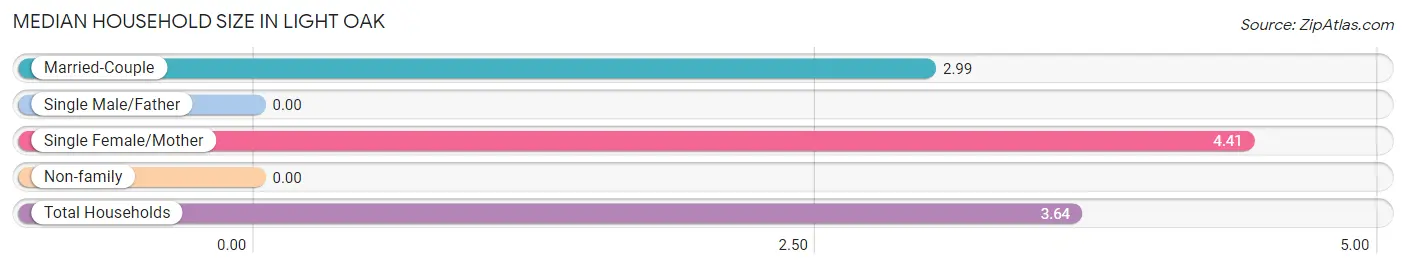
Median Household Size in Light Oak
| Household Type | # Households | Household Size |
| Married-Couple | 101 (54.3%) | 2.99 |
| Single Male/Father | 0 (0.0%) | - |
| Single Female/Mother | 85 (45.7%) | 4.41 |
| Non-family | 0 (0.0%) | - |
| Total Households | 186 (100.0%) | 3.64 |
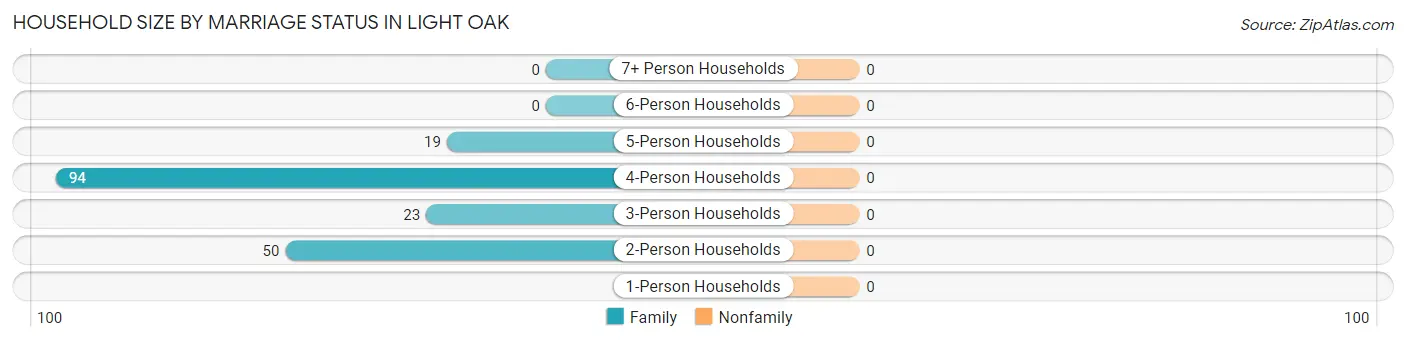
Household Size by Marriage Status in Light Oak
| Household Size | Family Households | Nonfamily Households |
| 1-Person Households | - | 0 (0.0%) |
| 2-Person Households | 50 (26.9%) | 0 (0.0%) |
| 3-Person Households | 23 (12.4%) | 0 (0.0%) |
| 4-Person Households | 94 (50.5%) | 0 (0.0%) |
| 5-Person Households | 19 (10.2%) | 0 (0.0%) |
| 6-Person Households | 0 (0.0%) | 0 (0.0%) |
| 7+ Person Households | 0 (0.0%) | 0 (0.0%) |
| Total | 186 (100.0%) | 0 (0.0%) |
Female Fertility in Light Oak
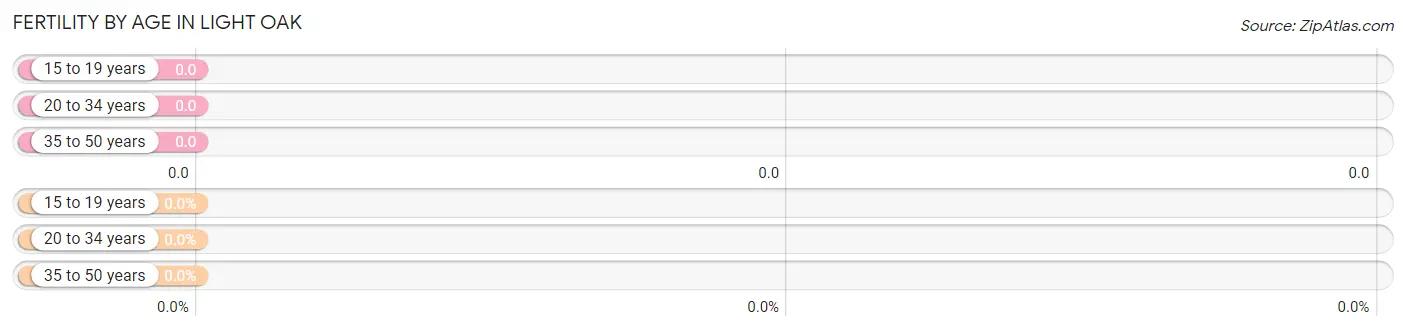
Fertility by Age in Light Oak
| Age Bracket | Women with Births | Births / 1,000 Women |
| 15 to 19 years | 0 (0.0%) | 0.0 |
| 20 to 34 years | 0 (0.0%) | 0.0 |
| 35 to 50 years | 0 (0.0%) | 0.0 |
| Total | 0 (0.0%) | 0.0 |
Fertility by Age by Marriage Status in Light Oak
| Age Bracket | Married | Unmarried |
| 15 to 19 years | 0 (0.0%) | 0 (0.0%) |
| 20 to 34 years | 0 (0.0%) | 0 (0.0%) |
| 35 to 50 years | 0 (0.0%) | 0 (0.0%) |
| Total | 0 (0.0%) | 0 (0.0%) |
Fertility by Education in Light Oak
| Educational Attainment | Women with Births | Births / 1,000 Women |
| Less than High School | 0 (0.0%) | 0.0 |
| High School Diploma | 0 (0.0%) | 0.0 |
| College or Associate's Degree | 0 (0.0%) | 0.0 |
| Bachelor's Degree | 0 (0.0%) | 0.0 |
| Graduate Degree | 0 (0.0%) | 0.0 |
| Total | 0 (0.0%) | 0.0 |
Fertility by Education by Marriage Status in Light Oak
| Educational Attainment | Married | Unmarried |
| Less than High School | 0 (0.0%) | 0 (0.0%) |
| High School Diploma | 0 (0.0%) | 0 (0.0%) |
| College or Associate's Degree | 0 (0.0%) | 0 (0.0%) |
| Bachelor's Degree | 0 (0.0%) | 0 (0.0%) |
| Graduate Degree | 0 (0.0%) | 0 (0.0%) |
| Total | 0 (0.0%) | 0 (0.0%) |
Employment Characteristics in Light Oak
Employment by Class of Employer in Light Oak
Among the 123 employed individuals in Light Oak, private company employees (89 | 72.4%), and not-for-profit organizations (34 | 27.6%) make up the most common classes of employment.
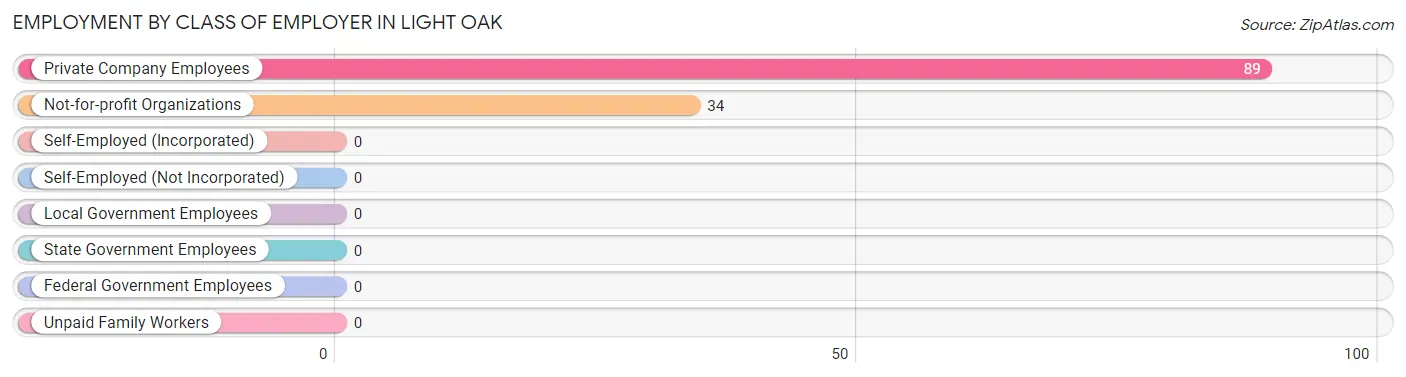
| Employer Class | # Employees | % Employees |
| Private Company Employees | 89 | 72.4% |
| Self-Employed (Incorporated) | 0 | 0.0% |
| Self-Employed (Not Incorporated) | 0 | 0.0% |
| Not-for-profit Organizations | 34 | 27.6% |
| Local Government Employees | 0 | 0.0% |
| State Government Employees | 0 | 0.0% |
| Federal Government Employees | 0 | 0.0% |
| Unpaid Family Workers | 0 | 0.0% |
| Total | 123 | 100.0% |
Employment Status by Age in Light Oak
According to the labor force statistics for Light Oak, out of the total population over 16 years of age (566), 39.8% or 225 individuals are in the labor force, with 27.1% or 61 of them unemployed. The age group with the highest labor force participation rate is 20 to 24 years, with 100.0% or 30 individuals in the labor force. Within the labor force, the 25 to 29 years age range has the highest percentage of unemployed individuals, with 100.0% or 61 of them being unemployed.
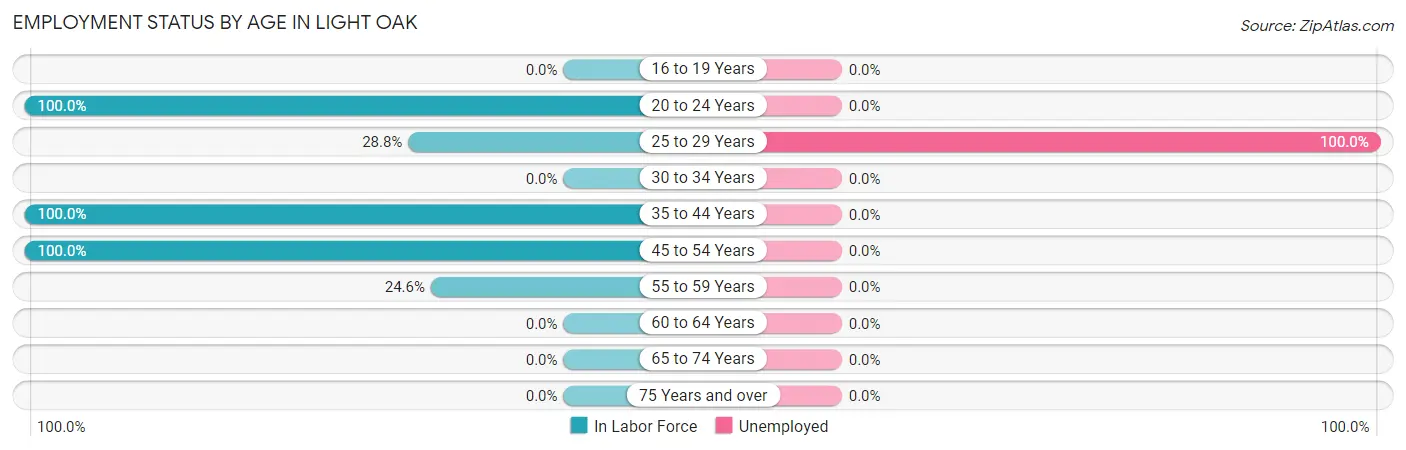
| Age Bracket | In Labor Force | Unemployed |
| 16 to 19 Years | 0 (0.0%) | 0 (0.0%) |
| 20 to 24 Years | 30 (100.0%) | 0 (0.0%) |
| 25 to 29 Years | 61 (28.8%) | 61 (100.0%) |
| 30 to 34 Years | 0 (0.0%) | 0 (0.0%) |
| 35 to 44 Years | 41 (100.0%) | 0 (0.0%) |
| 45 to 54 Years | 59 (100.0%) | 0 (0.0%) |
| 55 to 59 Years | 34 (24.6%) | 0 (0.0%) |
| 60 to 64 Years | 0 (0.0%) | 0 (0.0%) |
| 65 to 74 Years | 0 (0.0%) | 0 (0.0%) |
| 75 Years and over | 0 (0.0%) | 0 (0.0%) |
| Total | 225 (39.8%) | 61 (27.1%) |
Employment Status by Educational Attainment in Light Oak
According to labor force statistics for Light Oak, 43.3% of individuals (195) out of the total population between 25 and 64 years of age (450) are in the labor force, with 31.3% or 61 of them being unemployed. The group with the highest labor force participation rate are those with the educational attainment of college / associate degree, with 44.4% or 83 individuals in the labor force. Within the labor force, individuals with less than high school education have the highest percentage of unemployment, with 100.0% or 61 of them being unemployed.
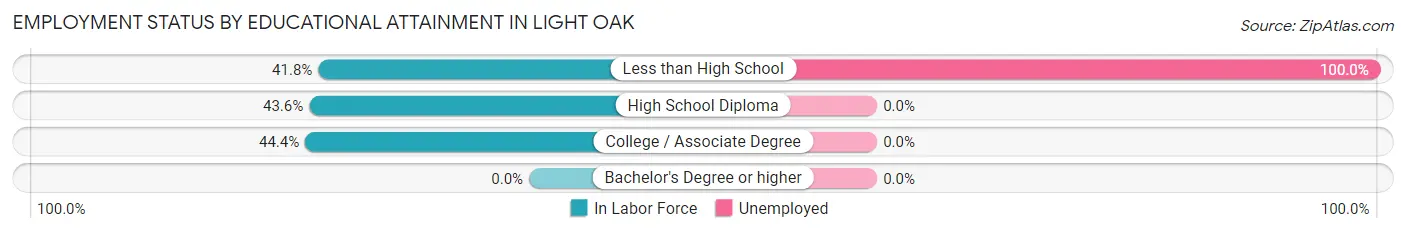
| Educational Attainment | In Labor Force | Unemployed |
| Less than High School | 61 (41.8%) | 146 (100.0%) |
| High School Diploma | 51 (43.6%) | 0 (0.0%) |
| College / Associate Degree | 83 (44.4%) | 0 (0.0%) |
| Bachelor's Degree or higher | 0 (0.0%) | 0 (0.0%) |
| Total | 195 (43.3%) | 141 (31.3%) |
Employment Occupations by Sex in Light Oak
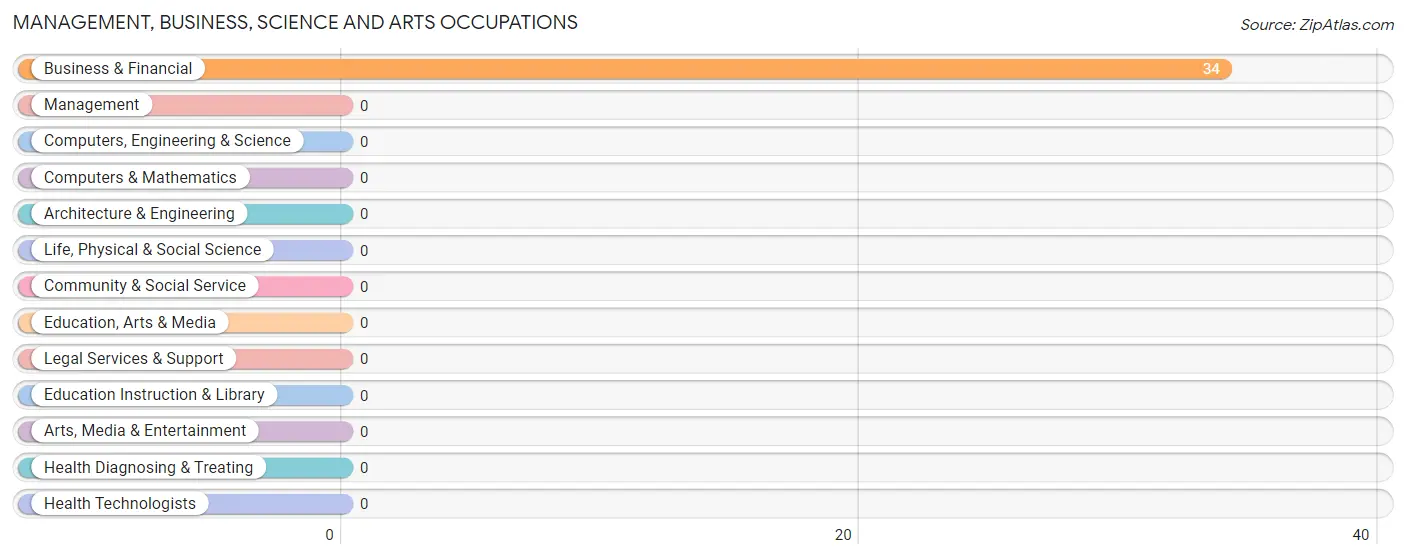
Management, Business, Science and Arts Occupations
The most common Management, Business, Science and Arts occupations in Light Oak are , and Business & Financial (34 | 20.7%).
Management, Business, Science and Arts Occupations by Sex
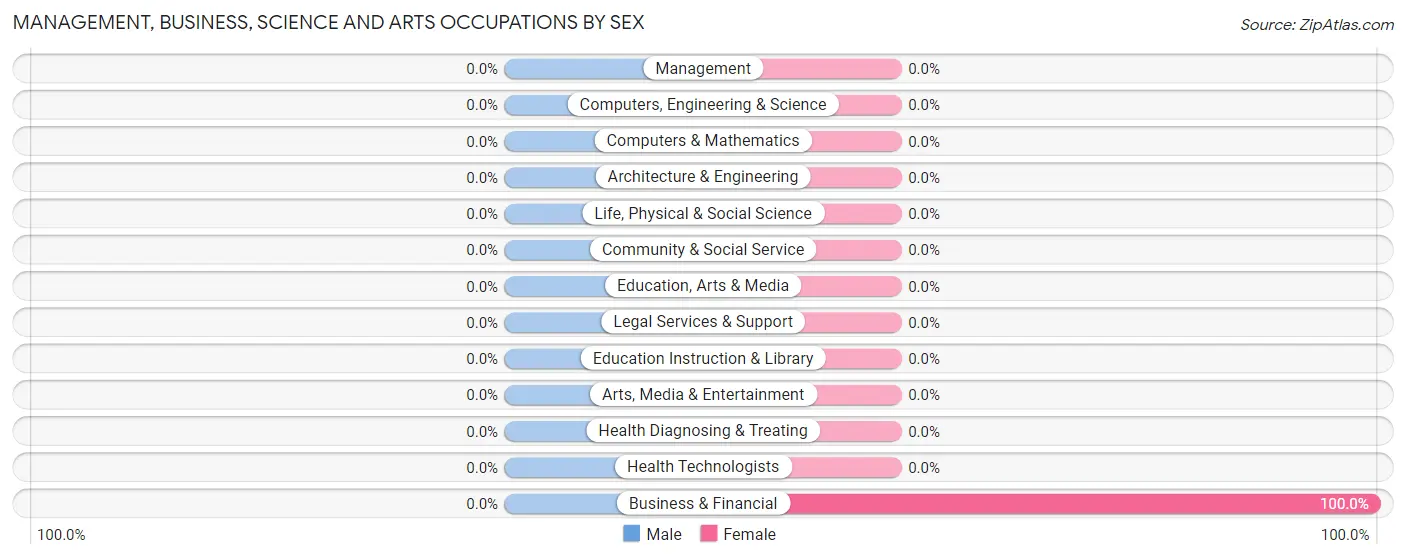
| Occupation | Male | Female |
| Management | 0 (0.0%) | 0 (0.0%) |
| Business & Financial | 0 (0.0%) | 34 (100.0%) |
| Computers, Engineering & Science | 0 (0.0%) | 0 (0.0%) |
| Computers & Mathematics | 0 (0.0%) | 0 (0.0%) |
| Architecture & Engineering | 0 (0.0%) | 0 (0.0%) |
| Life, Physical & Social Science | 0 (0.0%) | 0 (0.0%) |
| Community & Social Service | 0 (0.0%) | 0 (0.0%) |
| Education, Arts & Media | 0 (0.0%) | 0 (0.0%) |
| Legal Services & Support | 0 (0.0%) | 0 (0.0%) |
| Education Instruction & Library | 0 (0.0%) | 0 (0.0%) |
| Arts, Media & Entertainment | 0 (0.0%) | 0 (0.0%) |
| Health Diagnosing & Treating | 0 (0.0%) | 0 (0.0%) |
| Health Technologists | 0 (0.0%) | 0 (0.0%) |
| Total (Category) | 0 (0.0%) | 34 (100.0%) |
| Total (Overall) | 81 (49.4%) | 83 (50.6%) |
Services Occupations
The most common Services occupations in Light Oak are , and Cleaning & Maintenance (41 | 25.0%).
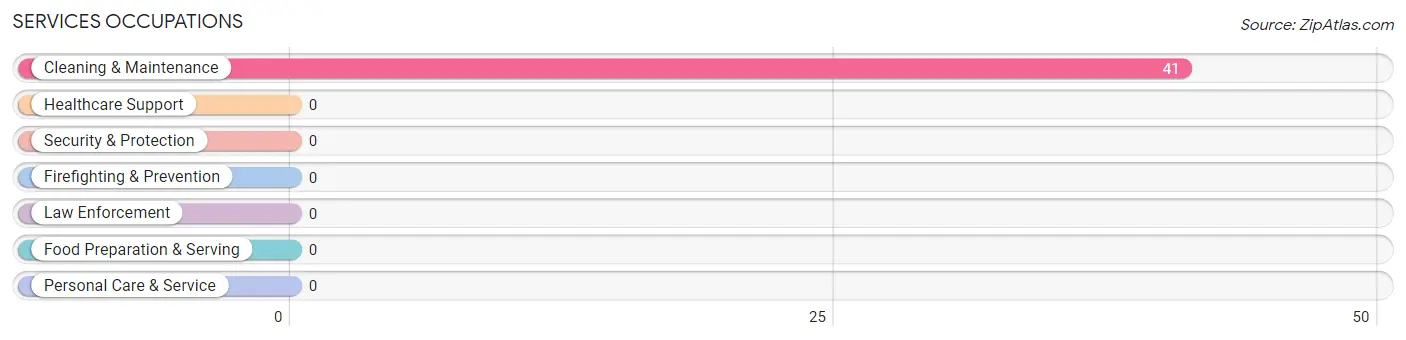
Services Occupations by Sex
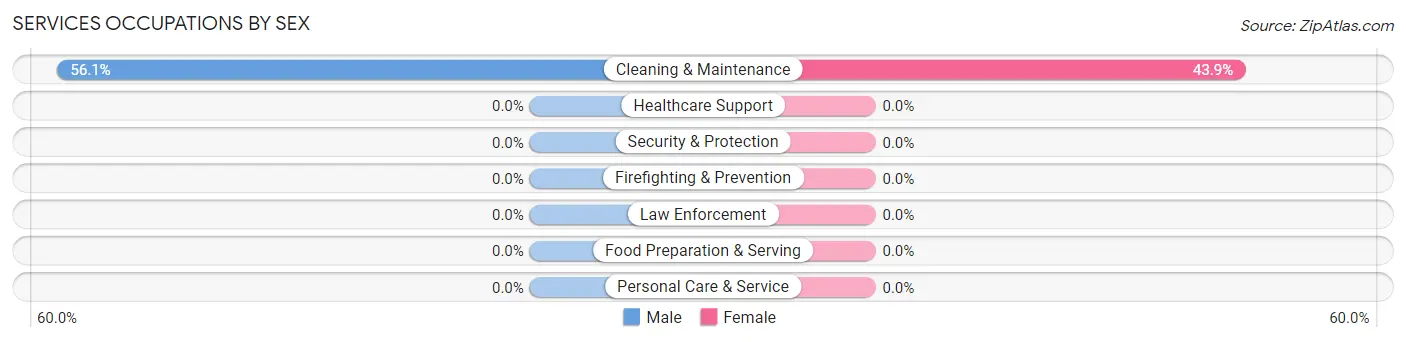
| Occupation | Male | Female |
| Healthcare Support | 0 (0.0%) | 0 (0.0%) |
| Security & Protection | 0 (0.0%) | 0 (0.0%) |
| Firefighting & Prevention | 0 (0.0%) | 0 (0.0%) |
| Law Enforcement | 0 (0.0%) | 0 (0.0%) |
| Food Preparation & Serving | 0 (0.0%) | 0 (0.0%) |
| Cleaning & Maintenance | 23 (56.1%) | 18 (43.9%) |
| Personal Care & Service | 0 (0.0%) | 0 (0.0%) |
| Total (Category) | 23 (56.1%) | 18 (43.9%) |
| Total (Overall) | 81 (49.4%) | 83 (50.6%) |
Sales and Office Occupations
The most common Sales and Office occupations in Light Oak are , and Sales & Related (30 | 18.3%).
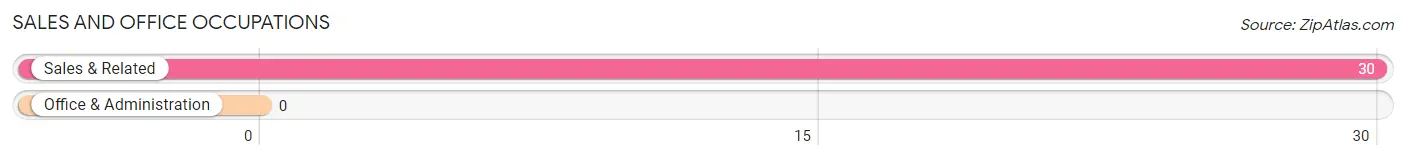
Sales and Office Occupations by Sex
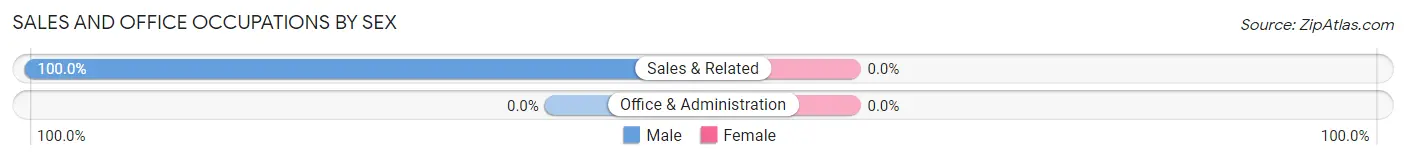
| Occupation | Male | Female |
| Sales & Related | 30 (100.0%) | 0 (0.0%) |
| Office & Administration | 0 (0.0%) | 0 (0.0%) |
| Total (Category) | 30 (100.0%) | 0 (0.0%) |
| Total (Overall) | 81 (49.4%) | 83 (50.6%) |
Natural Resources, Construction and Maintenance Occupations
Natural Resources, Construction and Maintenance Occupations by Sex
| Occupation | Male | Female |
| Farming, Fishing & Forestry | 0 (0.0%) | 0 (0.0%) |
| Construction & Extraction | 0 (0.0%) | 0 (0.0%) |
| Installation, Maintenance & Repair | 0 (0.0%) | 0 (0.0%) |
| Total (Category) | 0 (0.0%) | 0 (0.0%) |
| Total (Overall) | 81 (49.4%) | 83 (50.6%) |
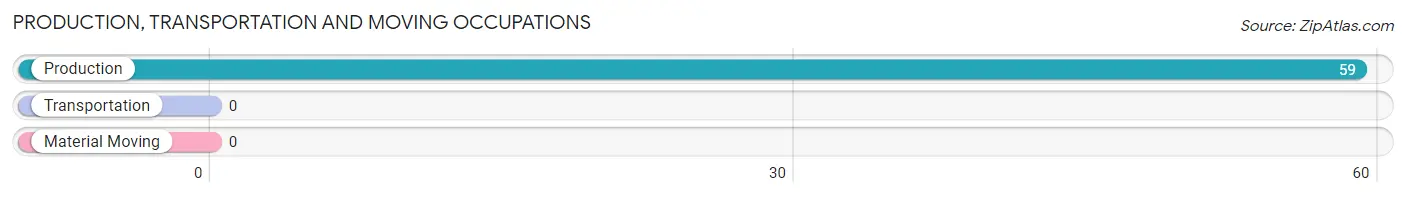
Production, Transportation and Moving Occupations
The most common Production, Transportation and Moving occupations in Light Oak are , and Production (59 | 36.0%).
Production, Transportation and Moving Occupations by Sex
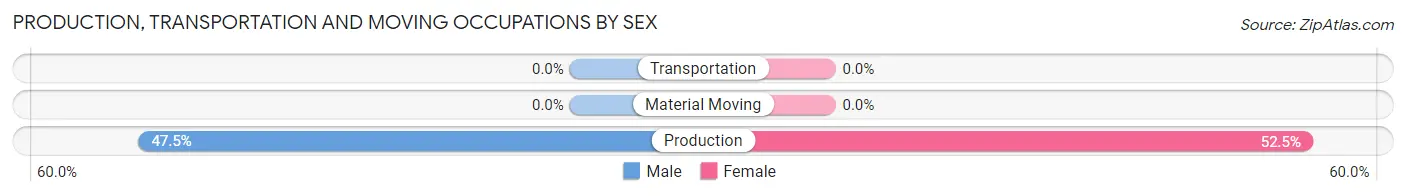
| Occupation | Male | Female |
| Production | 28 (47.5%) | 31 (52.5%) |
| Transportation | 0 (0.0%) | 0 (0.0%) |
| Material Moving | 0 (0.0%) | 0 (0.0%) |
| Total (Category) | 28 (47.5%) | 31 (52.5%) |
| Total (Overall) | 81 (49.4%) | 83 (50.6%) |
Employment Industries by Sex in Light Oak
Employment Industries in Light Oak
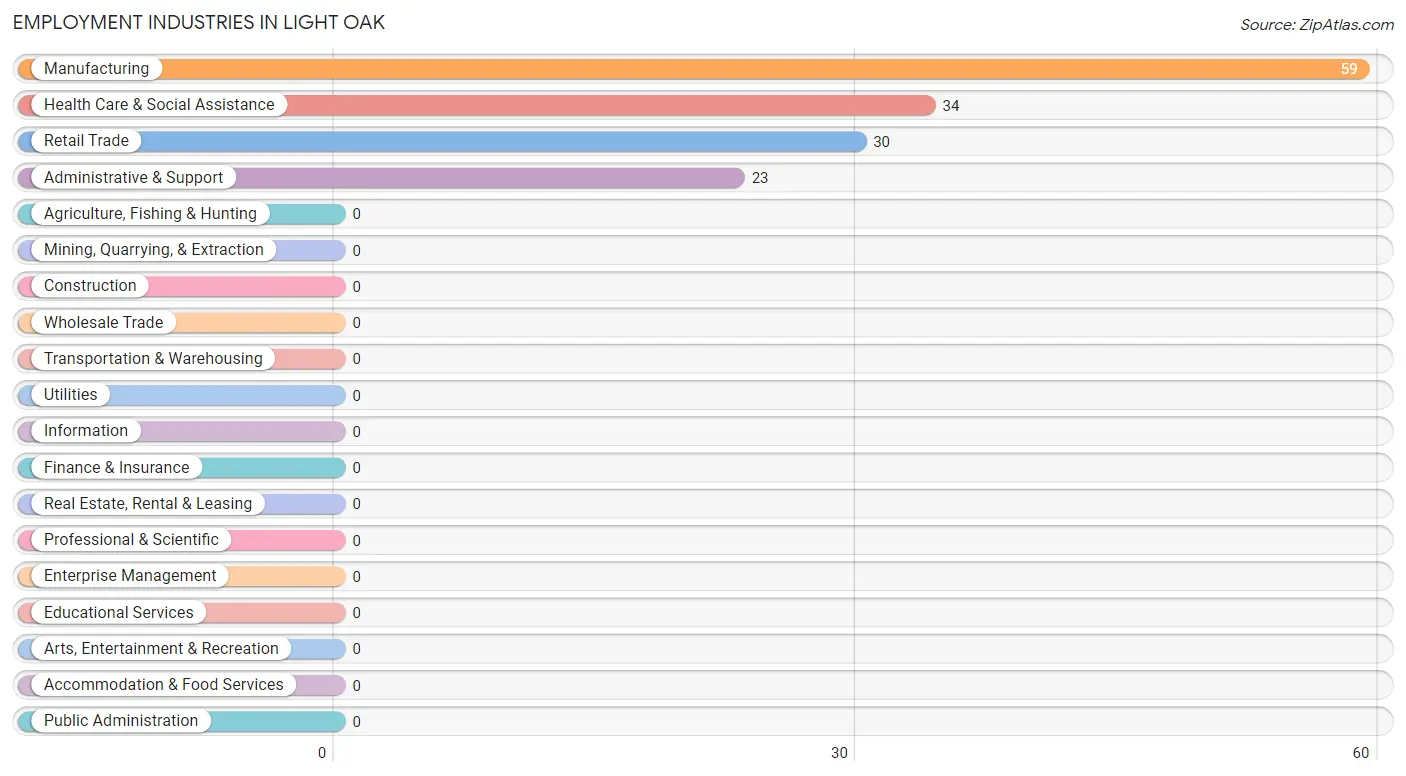
The major employment industries in Light Oak include Manufacturing (59 | 36.0%), Health Care & Social Assistance (34 | 20.7%), Retail Trade (30 | 18.3%), and Administrative & Support (23 | 14.0%).
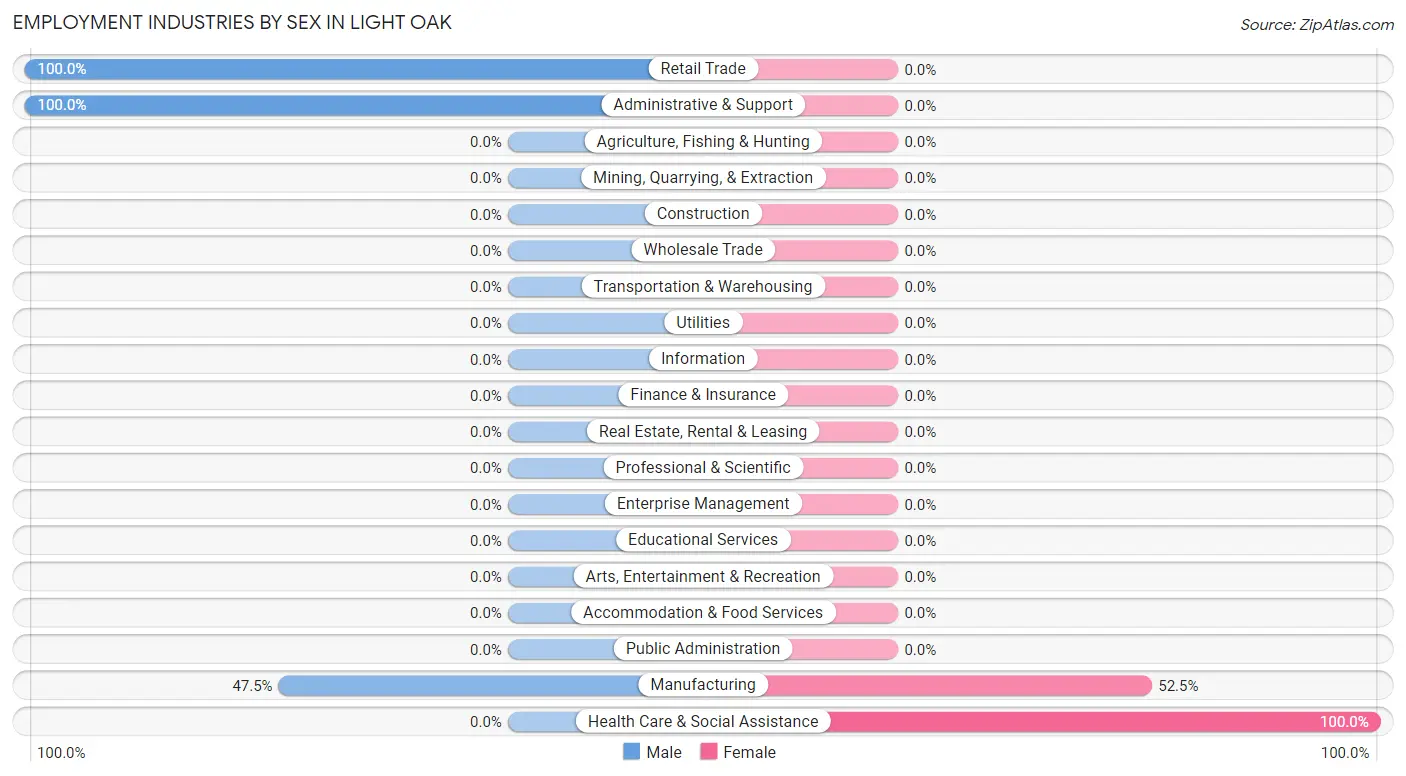
Employment Industries by Sex in Light Oak
The Light Oak industries that see more men than women are Retail Trade (100.0%), Administrative & Support (100.0%), and Manufacturing (47.5%), whereas the industries that tend to have a higher number of women are Health Care & Social Assistance (100.0%), and Manufacturing (52.5%).
| Industry | Male | Female |
| Agriculture, Fishing & Hunting | 0 (0.0%) | 0 (0.0%) |
| Mining, Quarrying, & Extraction | 0 (0.0%) | 0 (0.0%) |
| Construction | 0 (0.0%) | 0 (0.0%) |
| Manufacturing | 28 (47.5%) | 31 (52.5%) |
| Wholesale Trade | 0 (0.0%) | 0 (0.0%) |
| Retail Trade | 30 (100.0%) | 0 (0.0%) |
| Transportation & Warehousing | 0 (0.0%) | 0 (0.0%) |
| Utilities | 0 (0.0%) | 0 (0.0%) |
| Information | 0 (0.0%) | 0 (0.0%) |
| Finance & Insurance | 0 (0.0%) | 0 (0.0%) |
| Real Estate, Rental & Leasing | 0 (0.0%) | 0 (0.0%) |
| Professional & Scientific | 0 (0.0%) | 0 (0.0%) |
| Enterprise Management | 0 (0.0%) | 0 (0.0%) |
| Administrative & Support | 23 (100.0%) | 0 (0.0%) |
| Educational Services | 0 (0.0%) | 0 (0.0%) |
| Health Care & Social Assistance | 0 (0.0%) | 34 (100.0%) |
| Arts, Entertainment & Recreation | 0 (0.0%) | 0 (0.0%) |
| Accommodation & Food Services | 0 (0.0%) | 0 (0.0%) |
| Public Administration | 0 (0.0%) | 0 (0.0%) |
| Total | 81 (49.4%) | 83 (50.6%) |
Education in Light Oak
School Enrollment in Light Oak
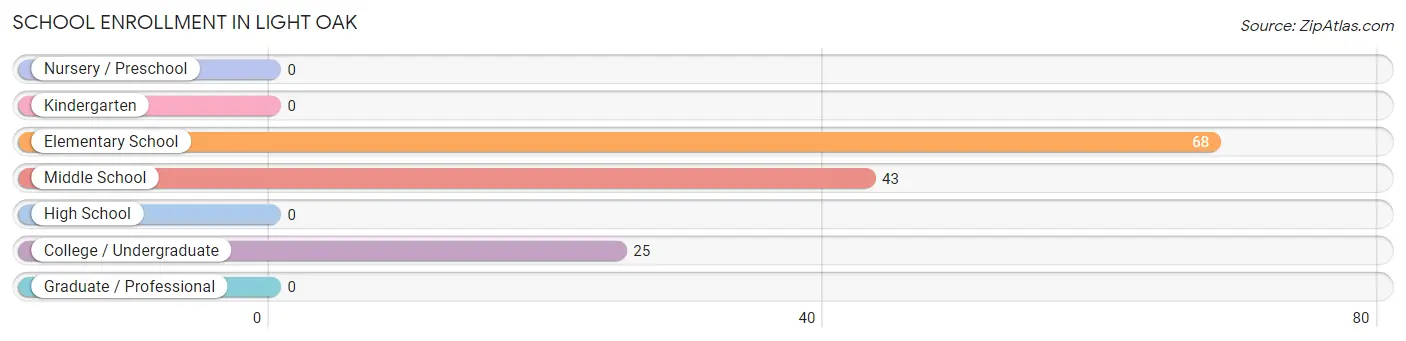
The most common levels of schooling among the 136 students in Light Oak are elementary school (68 | 50.0%), middle school (43 | 31.6%), and college / undergraduate (25 | 18.4%).
| School Level | # Students | % Students |
| Nursery / Preschool | 0 | 0.0% |
| Kindergarten | 0 | 0.0% |
| Elementary School | 68 | 50.0% |
| Middle School | 43 | 31.6% |
| High School | 0 | 0.0% |
| College / Undergraduate | 25 | 18.4% |
| Graduate / Professional | 0 | 0.0% |
| Total | 136 | 100.0% |
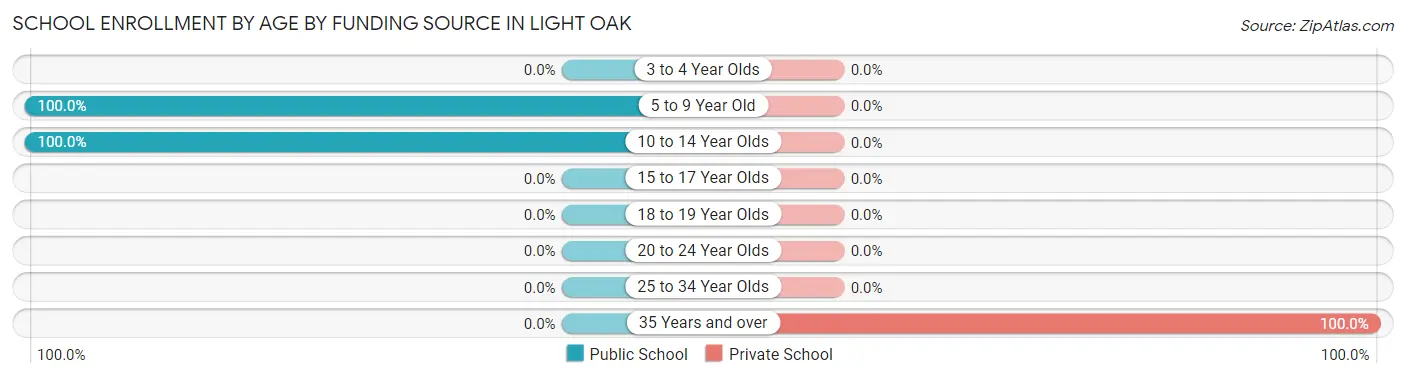
School Enrollment by Age by Funding Source in Light Oak
Out of a total of 136 students who are enrolled in schools in Light Oak, 25 (18.4%) attend a private institution, while the remaining 111 (81.6%) are enrolled in public schools. The age group of 35 years and over has the highest likelihood of being enrolled in private schools, with 25 (100.0% in the age bracket) enrolled. Conversely, the age group of 5 to 9 year old has the lowest likelihood of being enrolled in a private school, with 68 (100.0% in the age bracket) attending a public institution.
| Age Bracket | Public School | Private School |
| 3 to 4 Year Olds | 0 (0.0%) | 0 (0.0%) |
| 5 to 9 Year Old | 68 (100.0%) | 0 (0.0%) |
| 10 to 14 Year Olds | 43 (100.0%) | 0 (0.0%) |
| 15 to 17 Year Olds | 0 (0.0%) | 0 (0.0%) |
| 18 to 19 Year Olds | 0 (0.0%) | 0 (0.0%) |
| 20 to 24 Year Olds | 0 (0.0%) | 0 (0.0%) |
| 25 to 34 Year Olds | 0 (0.0%) | 0 (0.0%) |
| 35 Years and over | 0 (0.0%) | 25 (100.0%) |
| Total | 111 (81.6%) | 25 (18.4%) |
Educational Attainment by Field of Study in Light Oak
, and psychology (25 | 100.0%) are the most common fields of study among 25 individuals in Light Oak who have obtained a bachelor's degree or higher.
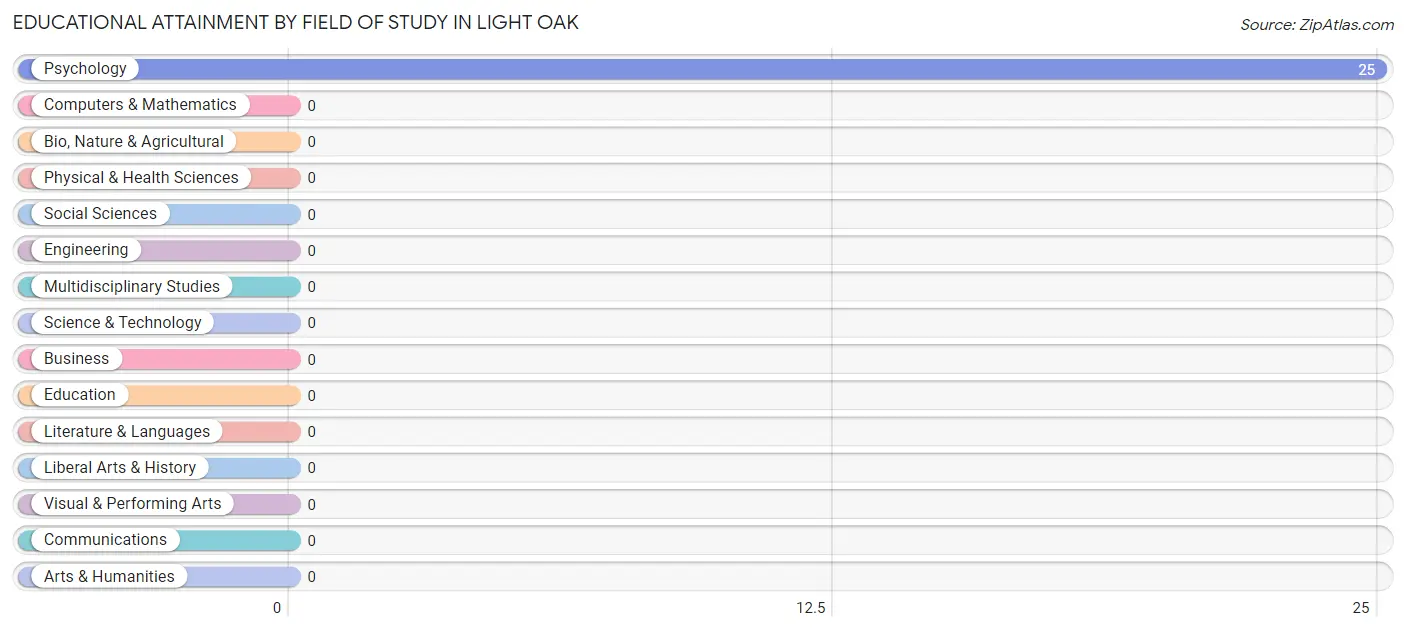
| Field of Study | # Graduates | % Graduates |
| Computers & Mathematics | 0 | 0.0% |
| Bio, Nature & Agricultural | 0 | 0.0% |
| Physical & Health Sciences | 0 | 0.0% |
| Psychology | 25 | 100.0% |
| Social Sciences | 0 | 0.0% |
| Engineering | 0 | 0.0% |
| Multidisciplinary Studies | 0 | 0.0% |
| Science & Technology | 0 | 0.0% |
| Business | 0 | 0.0% |
| Education | 0 | 0.0% |
| Literature & Languages | 0 | 0.0% |
| Liberal Arts & History | 0 | 0.0% |
| Visual & Performing Arts | 0 | 0.0% |
| Communications | 0 | 0.0% |
| Arts & Humanities | 0 | 0.0% |
| Total | 25 | 100.0% |
Transportation & Commute in Light Oak
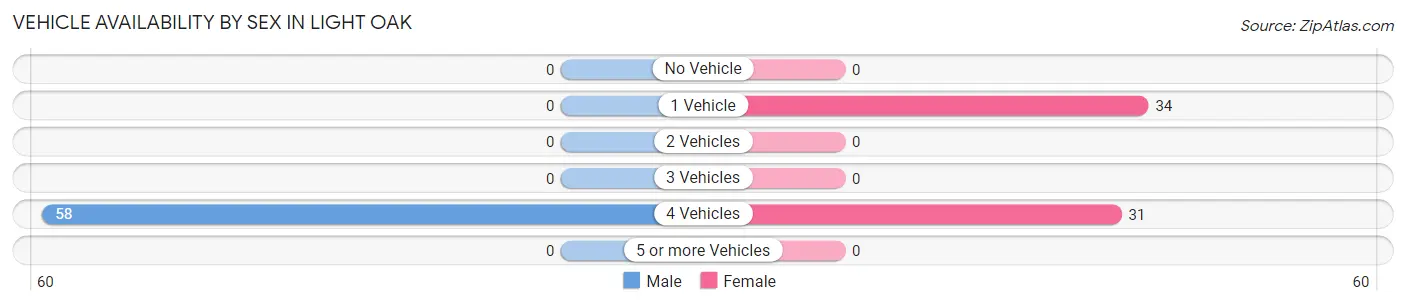
Vehicle Availability by Sex in Light Oak
The most prevalent vehicle ownership categories in Light Oak are males with 4 vehicles (58, accounting for 100.0%) and females with 4 vehicles (31, making up 89.2%).
| Vehicles Available | Male | Female |
| No Vehicle | 0 (0.0%) | 0 (0.0%) |
| 1 Vehicle | 0 (0.0%) | 34 (52.3%) |
| 2 Vehicles | 0 (0.0%) | 0 (0.0%) |
| 3 Vehicles | 0 (0.0%) | 0 (0.0%) |
| 4 Vehicles | 58 (100.0%) | 31 (47.7%) |
| 5 or more Vehicles | 0 (0.0%) | 0 (0.0%) |
| Total | 58 (100.0%) | 65 (100.0%) |
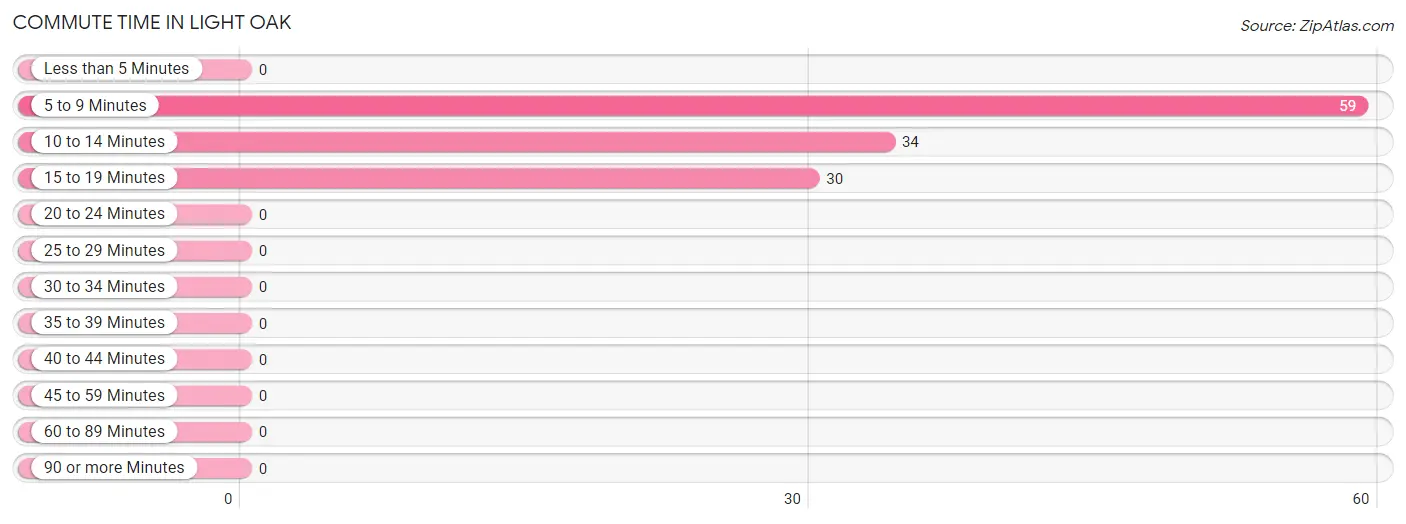
Commute Time in Light Oak
The most frequently occuring commute durations in Light Oak are 5 to 9 minutes (59 commuters, 48.0%), 10 to 14 minutes (34 commuters, 27.6%), and 15 to 19 minutes (30 commuters, 24.4%).
| Commute Time | # Commuters | % Commuters |
| Less than 5 Minutes | 0 | 0.0% |
| 5 to 9 Minutes | 59 | 48.0% |
| 10 to 14 Minutes | 34 | 27.6% |
| 15 to 19 Minutes | 30 | 24.4% |
| 20 to 24 Minutes | 0 | 0.0% |
| 25 to 29 Minutes | 0 | 0.0% |
| 30 to 34 Minutes | 0 | 0.0% |
| 35 to 39 Minutes | 0 | 0.0% |
| 40 to 44 Minutes | 0 | 0.0% |
| 45 to 59 Minutes | 0 | 0.0% |
| 60 to 89 Minutes | 0 | 0.0% |
| 90 or more Minutes | 0 | 0.0% |
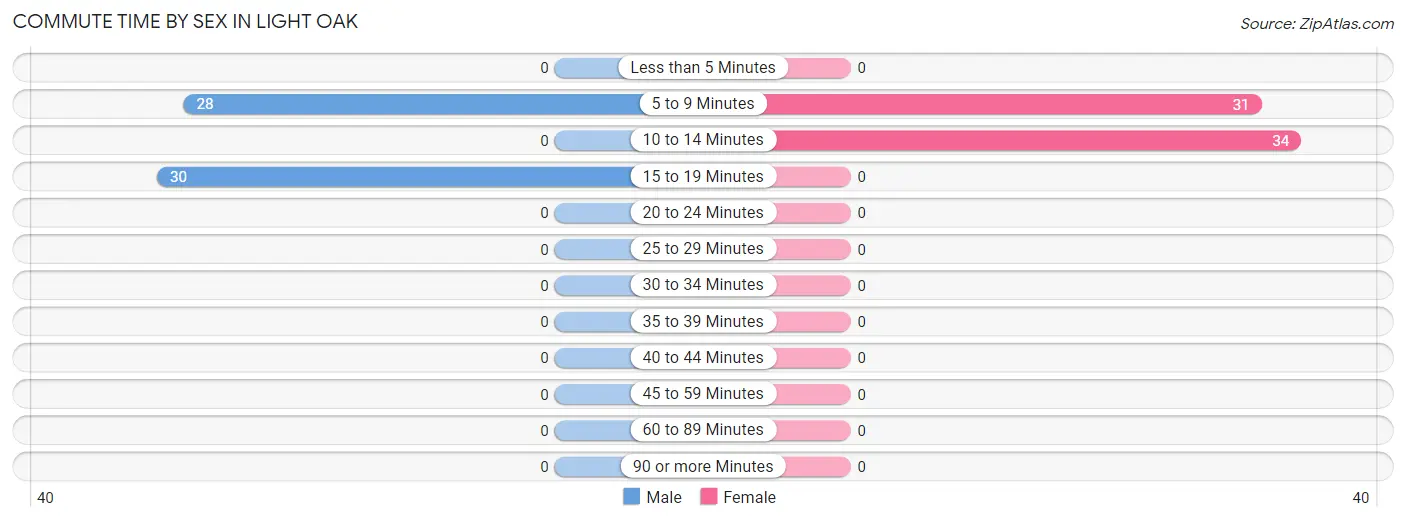
Commute Time by Sex in Light Oak
The most common commute times in Light Oak are 15 to 19 minutes (30 commuters, 51.7%) for males and 10 to 14 minutes (34 commuters, 52.3%) for females.
| Commute Time | Male | Female |
| Less than 5 Minutes | 0 (0.0%) | 0 (0.0%) |
| 5 to 9 Minutes | 28 (48.3%) | 31 (47.7%) |
| 10 to 14 Minutes | 0 (0.0%) | 34 (52.3%) |
| 15 to 19 Minutes | 30 (51.7%) | 0 (0.0%) |
| 20 to 24 Minutes | 0 (0.0%) | 0 (0.0%) |
| 25 to 29 Minutes | 0 (0.0%) | 0 (0.0%) |
| 30 to 34 Minutes | 0 (0.0%) | 0 (0.0%) |
| 35 to 39 Minutes | 0 (0.0%) | 0 (0.0%) |
| 40 to 44 Minutes | 0 (0.0%) | 0 (0.0%) |
| 45 to 59 Minutes | 0 (0.0%) | 0 (0.0%) |
| 60 to 89 Minutes | 0 (0.0%) | 0 (0.0%) |
| 90 or more Minutes | 0 (0.0%) | 0 (0.0%) |
Time of Departure to Work by Sex in Light Oak
The most frequent times of departure to work in Light Oak are 7:00 AM to 7:29 AM (30, 51.7%) for males and 7:30 AM to 7:59 AM (34, 52.3%) for females.
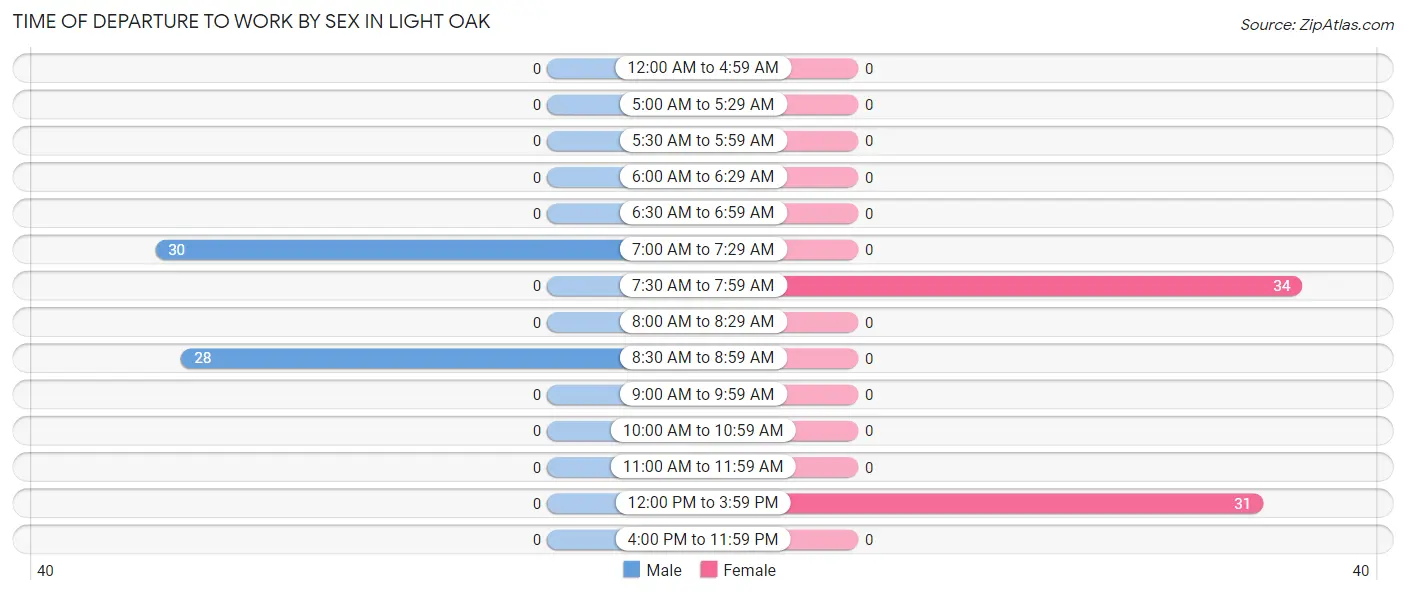
| Time of Departure | Male | Female |
| 12:00 AM to 4:59 AM | 0 (0.0%) | 0 (0.0%) |
| 5:00 AM to 5:29 AM | 0 (0.0%) | 0 (0.0%) |
| 5:30 AM to 5:59 AM | 0 (0.0%) | 0 (0.0%) |
| 6:00 AM to 6:29 AM | 0 (0.0%) | 0 (0.0%) |
| 6:30 AM to 6:59 AM | 0 (0.0%) | 0 (0.0%) |
| 7:00 AM to 7:29 AM | 30 (51.7%) | 0 (0.0%) |
| 7:30 AM to 7:59 AM | 0 (0.0%) | 34 (52.3%) |
| 8:00 AM to 8:29 AM | 0 (0.0%) | 0 (0.0%) |
| 8:30 AM to 8:59 AM | 28 (48.3%) | 0 (0.0%) |
| 9:00 AM to 9:59 AM | 0 (0.0%) | 0 (0.0%) |
| 10:00 AM to 10:59 AM | 0 (0.0%) | 0 (0.0%) |
| 11:00 AM to 11:59 AM | 0 (0.0%) | 0 (0.0%) |
| 12:00 PM to 3:59 PM | 0 (0.0%) | 31 (47.7%) |
| 4:00 PM to 11:59 PM | 0 (0.0%) | 0 (0.0%) |
| Total | 58 (100.0%) | 65 (100.0%) |
Housing Occupancy in Light Oak
Occupancy by Ownership in Light Oak
Of the total 186 dwellings in Light Oak, owner-occupied units account for 97 (52.1%), while renter-occupied units make up 89 (47.8%).
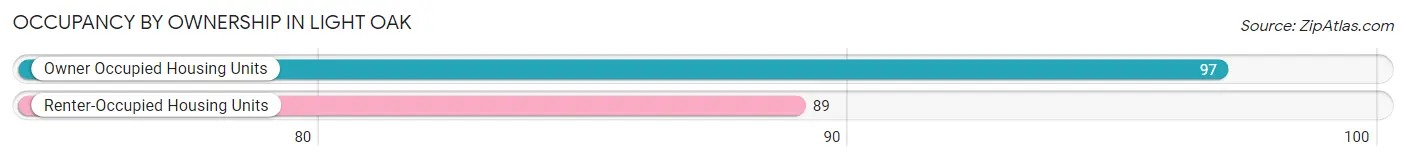
| Occupancy | # Housing Units | % Housing Units |
| Owner Occupied Housing Units | 97 | 52.1% |
| Renter-Occupied Housing Units | 89 | 47.8% |
| Total Occupied Housing Units | 186 | 100.0% |
Occupancy by Household Size in Light Oak
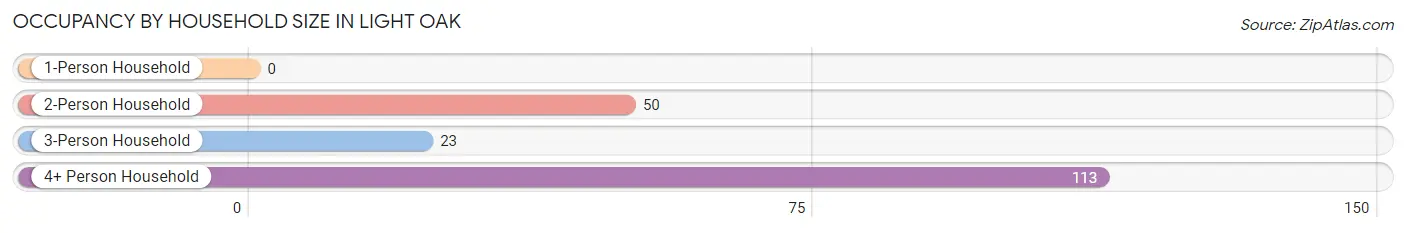
| Household Size | # Housing Units | % Housing Units |
| 1-Person Household | 0 | 0.0% |
| 2-Person Household | 50 | 26.9% |
| 3-Person Household | 23 | 12.4% |
| 4+ Person Household | 113 | 60.8% |
| Total Housing Units | 186 | 100.0% |
Occupancy by Ownership by Household Size in Light Oak
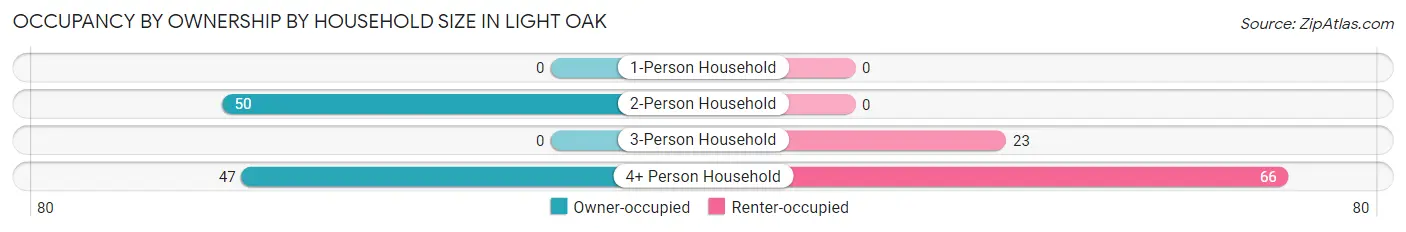
| Household Size | Owner-occupied | Renter-occupied |
| 1-Person Household | 0 (0.0%) | 0 (0.0%) |
| 2-Person Household | 50 (100.0%) | 0 (0.0%) |
| 3-Person Household | 0 (0.0%) | 23 (100.0%) |
| 4+ Person Household | 47 (41.6%) | 66 (58.4%) |
| Total Housing Units | 97 (52.1%) | 89 (47.8%) |
Occupancy by Educational Attainment in Light Oak
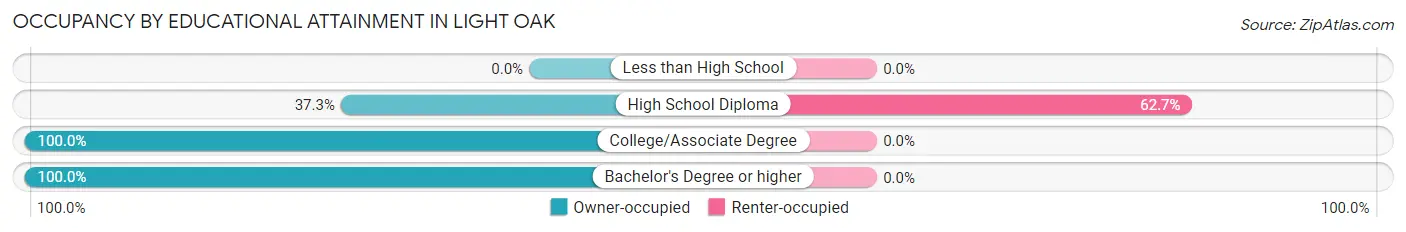
| Household Size | Owner-occupied | Renter-occupied |
| Less than High School | 0 (0.0%) | 0 (0.0%) |
| High School Diploma | 53 (37.3%) | 89 (62.7%) |
| College/Associate Degree | 19 (100.0%) | 0 (0.0%) |
| Bachelor's Degree or higher | 25 (100.0%) | 0 (0.0%) |
Occupancy by Age of Householder in Light Oak
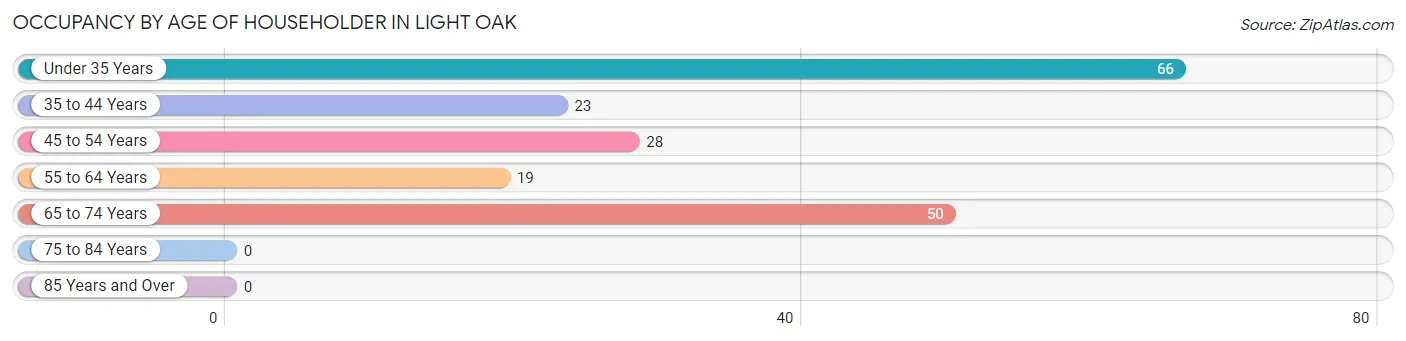
| Age Bracket | # Households | % Households |
| Under 35 Years | 66 | 35.5% |
| 35 to 44 Years | 23 | 12.4% |
| 45 to 54 Years | 28 | 15.0% |
| 55 to 64 Years | 19 | 10.2% |
| 65 to 74 Years | 50 | 26.9% |
| 75 to 84 Years | 0 | 0.0% |
| 85 Years and Over | 0 | 0.0% |
| Total | 186 | 100.0% |
Housing Finances in Light Oak
Median Income by Occupancy in Light Oak
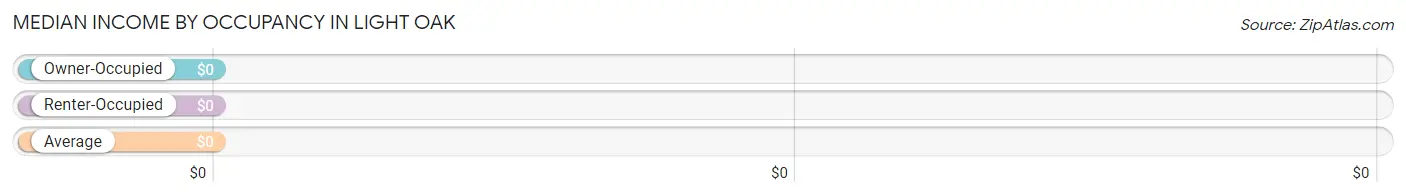
| Occupancy Type | # Households | Median Income |
| Owner-Occupied | 97 (52.1%) | $0 |
| Renter-Occupied | 89 (47.8%) | $0 |
| Average | 186 (100.0%) | $0 |
Occupancy by Householder Income Bracket in Light Oak
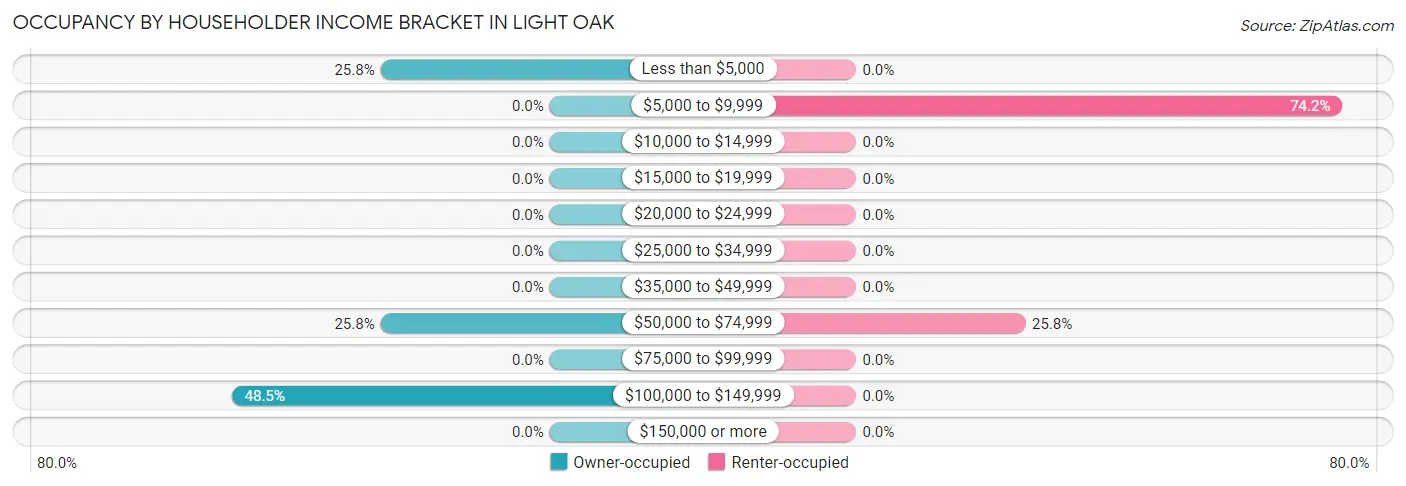
| Income Bracket | Owner-occupied | Renter-occupied |
| Less than $5,000 | 25 (25.8%) | 0 (0.0%) |
| $5,000 to $9,999 | 0 (0.0%) | 66 (74.2%) |
| $10,000 to $14,999 | 0 (0.0%) | 0 (0.0%) |
| $15,000 to $19,999 | 0 (0.0%) | 0 (0.0%) |
| $20,000 to $24,999 | 0 (0.0%) | 0 (0.0%) |
| $25,000 to $34,999 | 0 (0.0%) | 0 (0.0%) |
| $35,000 to $49,999 | 0 (0.0%) | 0 (0.0%) |
| $50,000 to $74,999 | 25 (25.8%) | 23 (25.8%) |
| $75,000 to $99,999 | 0 (0.0%) | 0 (0.0%) |
| $100,000 to $149,999 | 47 (48.4%) | 0 (0.0%) |
| $150,000 or more | 0 (0.0%) | 0 (0.0%) |
| Total | 97 (100.0%) | 89 (100.0%) |
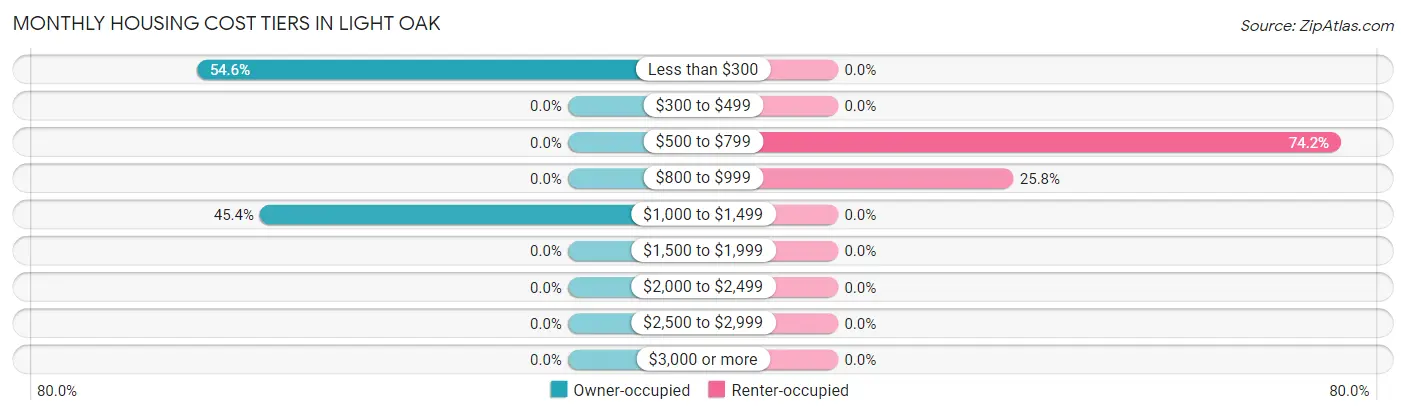
Monthly Housing Cost Tiers in Light Oak
| Monthly Cost | Owner-occupied | Renter-occupied |
| Less than $300 | 53 (54.6%) | 0 (0.0%) |
| $300 to $499 | 0 (0.0%) | 0 (0.0%) |
| $500 to $799 | 0 (0.0%) | 66 (74.2%) |
| $800 to $999 | 0 (0.0%) | 23 (25.8%) |
| $1,000 to $1,499 | 44 (45.4%) | 0 (0.0%) |
| $1,500 to $1,999 | 0 (0.0%) | 0 (0.0%) |
| $2,000 to $2,499 | 0 (0.0%) | 0 (0.0%) |
| $2,500 to $2,999 | 0 (0.0%) | 0 (0.0%) |
| $3,000 or more | 0 (0.0%) | 0 (0.0%) |
| Total | 97 (100.0%) | 89 (100.0%) |
Physical Housing Characteristics in Light Oak
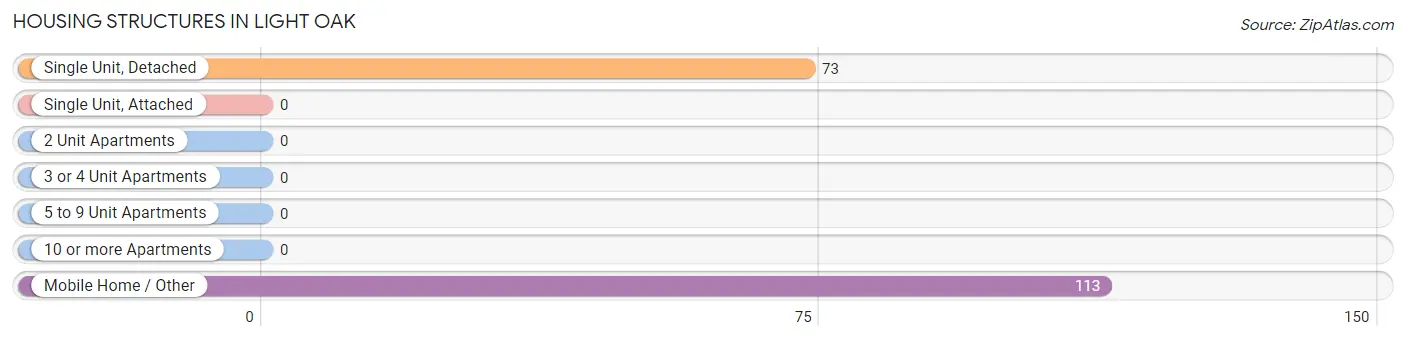
Housing Structures in Light Oak
| Structure Type | # Housing Units | % Housing Units |
| Single Unit, Detached | 73 | 39.3% |
| Single Unit, Attached | 0 | 0.0% |
| 2 Unit Apartments | 0 | 0.0% |
| 3 or 4 Unit Apartments | 0 | 0.0% |
| 5 to 9 Unit Apartments | 0 | 0.0% |
| 10 or more Apartments | 0 | 0.0% |
| Mobile Home / Other | 113 | 60.8% |
| Total | 186 | 100.0% |
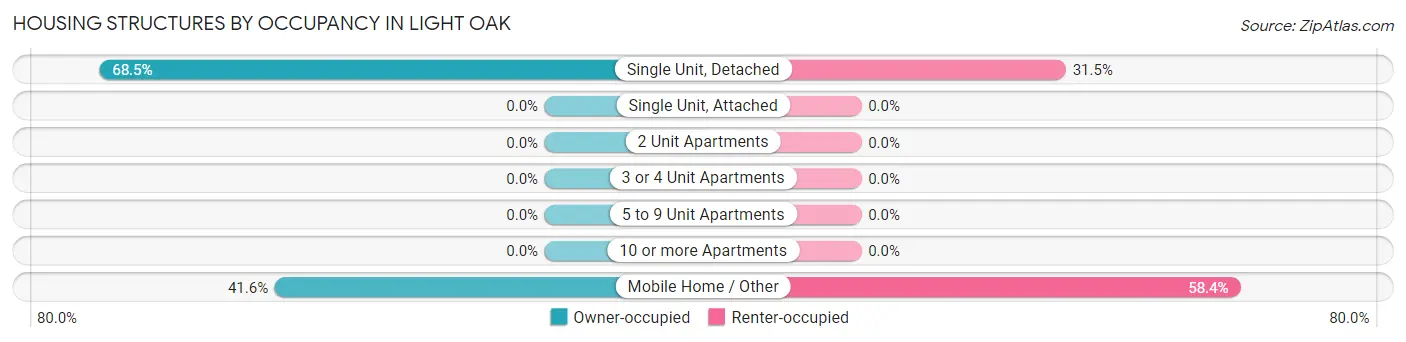
Housing Structures by Occupancy in Light Oak
| Structure Type | Owner-occupied | Renter-occupied |
| Single Unit, Detached | 50 (68.5%) | 23 (31.5%) |
| Single Unit, Attached | 0 (0.0%) | 0 (0.0%) |
| 2 Unit Apartments | 0 (0.0%) | 0 (0.0%) |
| 3 or 4 Unit Apartments | 0 (0.0%) | 0 (0.0%) |
| 5 to 9 Unit Apartments | 0 (0.0%) | 0 (0.0%) |
| 10 or more Apartments | 0 (0.0%) | 0 (0.0%) |
| Mobile Home / Other | 47 (41.6%) | 66 (58.4%) |
| Total | 97 (52.1%) | 89 (47.8%) |
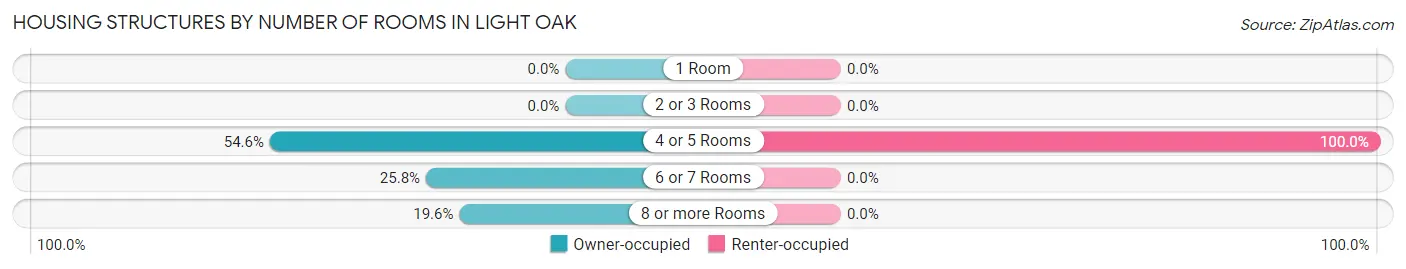
Housing Structures by Number of Rooms in Light Oak
| Number of Rooms | Owner-occupied | Renter-occupied |
| 1 Room | 0 (0.0%) | 0 (0.0%) |
| 2 or 3 Rooms | 0 (0.0%) | 0 (0.0%) |
| 4 or 5 Rooms | 53 (54.6%) | 89 (100.0%) |
| 6 or 7 Rooms | 25 (25.8%) | 0 (0.0%) |
| 8 or more Rooms | 19 (19.6%) | 0 (0.0%) |
| Total | 97 (100.0%) | 89 (100.0%) |
Housing Structure by Heating Type in Light Oak
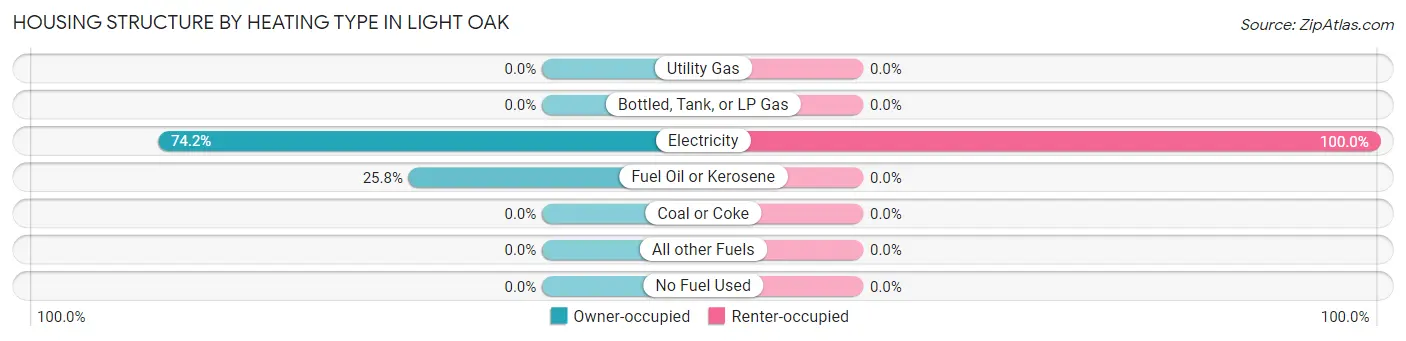
| Heating Type | Owner-occupied | Renter-occupied |
| Utility Gas | 0 (0.0%) | 0 (0.0%) |
| Bottled, Tank, or LP Gas | 0 (0.0%) | 0 (0.0%) |
| Electricity | 72 (74.2%) | 89 (100.0%) |
| Fuel Oil or Kerosene | 25 (25.8%) | 0 (0.0%) |
| Coal or Coke | 0 (0.0%) | 0 (0.0%) |
| All other Fuels | 0 (0.0%) | 0 (0.0%) |
| No Fuel Used | 0 (0.0%) | 0 (0.0%) |
| Total | 97 (100.0%) | 89 (100.0%) |
Household Vehicle Usage in Light Oak
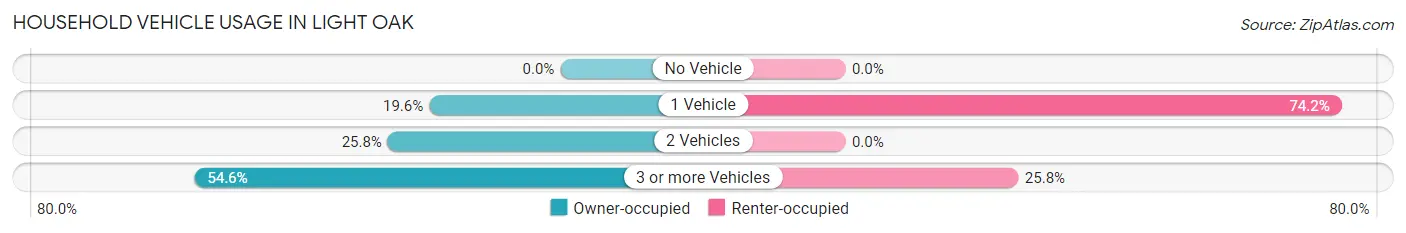
| Vehicles per Household | Owner-occupied | Renter-occupied |
| No Vehicle | 0 (0.0%) | 0 (0.0%) |
| 1 Vehicle | 19 (19.6%) | 66 (74.2%) |
| 2 Vehicles | 25 (25.8%) | 0 (0.0%) |
| 3 or more Vehicles | 53 (54.6%) | 23 (25.8%) |
| Total | 97 (100.0%) | 89 (100.0%) |
Real Estate & Mortgages in Light Oak
Real Estate and Mortgage Overview in Light Oak
| Characteristic | Without Mortgage | With Mortgage |
| Housing Units | 53 | 44 |
| Median Property Value | - | - |
| Median Household Income | - | - |
| Monthly Housing Costs | - | - |
| Real Estate Taxes | - | - |
Property Value by Mortgage Status in Light Oak
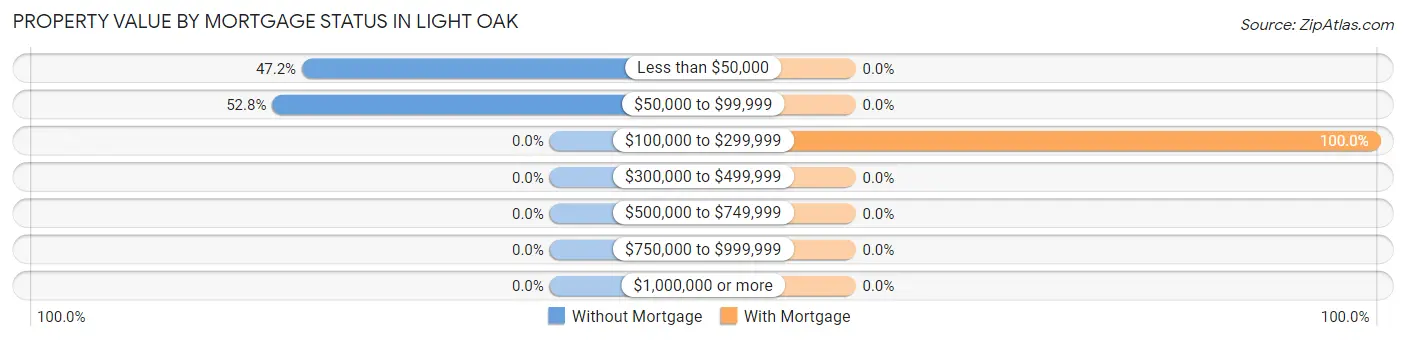
| Property Value | Without Mortgage | With Mortgage |
| Less than $50,000 | 25 (47.2%) | 0 (0.0%) |
| $50,000 to $99,999 | 28 (52.8%) | 0 (0.0%) |
| $100,000 to $299,999 | 0 (0.0%) | 44 (100.0%) |
| $300,000 to $499,999 | 0 (0.0%) | 0 (0.0%) |
| $500,000 to $749,999 | 0 (0.0%) | 0 (0.0%) |
| $750,000 to $999,999 | 0 (0.0%) | 0 (0.0%) |
| $1,000,000 or more | 0 (0.0%) | 0 (0.0%) |
| Total | 53 (100.0%) | 44 (100.0%) |
Household Income by Mortgage Status in Light Oak
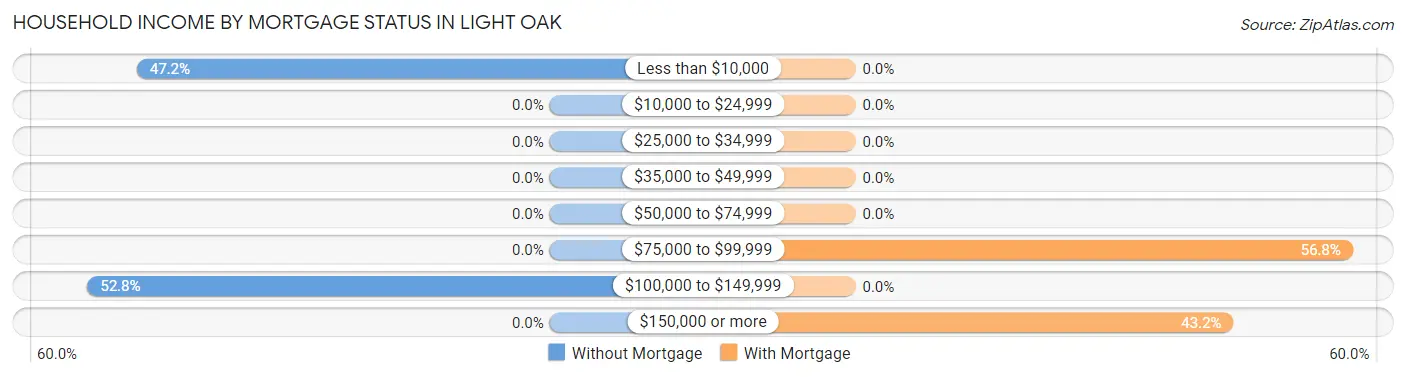
| Household Income | Without Mortgage | With Mortgage |
| Less than $10,000 | 25 (47.2%) | 0 (0.0%) |
| $10,000 to $24,999 | 0 (0.0%) | 0 (0.0%) |
| $25,000 to $34,999 | 0 (0.0%) | 0 (0.0%) |
| $35,000 to $49,999 | 0 (0.0%) | 0 (0.0%) |
| $50,000 to $74,999 | 0 (0.0%) | 0 (0.0%) |
| $75,000 to $99,999 | 0 (0.0%) | 25 (56.8%) |
| $100,000 to $149,999 | 28 (52.8%) | 0 (0.0%) |
| $150,000 or more | 0 (0.0%) | 19 (43.2%) |
| Total | 53 (100.0%) | 44 (100.0%) |
Property Value to Household Income Ratio in Light Oak
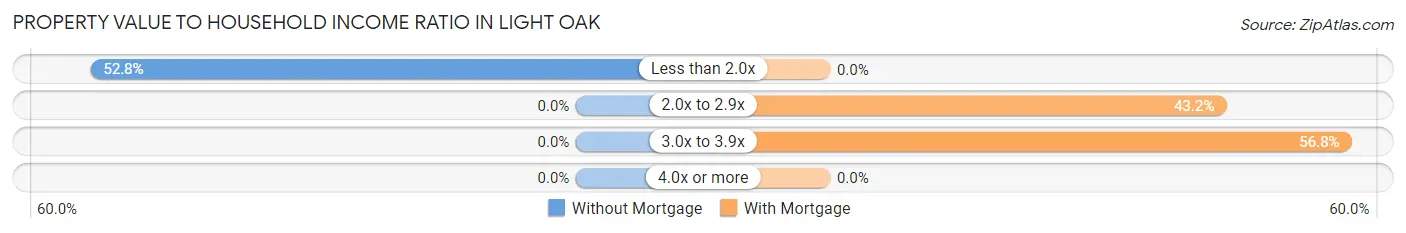
| Value-to-Income Ratio | Without Mortgage | With Mortgage |
| Less than 2.0x | 28 (52.8%) | 0 (0.0%) |
| 2.0x to 2.9x | 0 (0.0%) | 19 (43.2%) |
| 3.0x to 3.9x | 0 (0.0%) | 25 (56.8%) |
| 4.0x or more | 0 (0.0%) | 0 (0.0%) |
| Total | 53 (100.0%) | 44 (100.0%) |
Real Estate Taxes by Mortgage Status in Light Oak
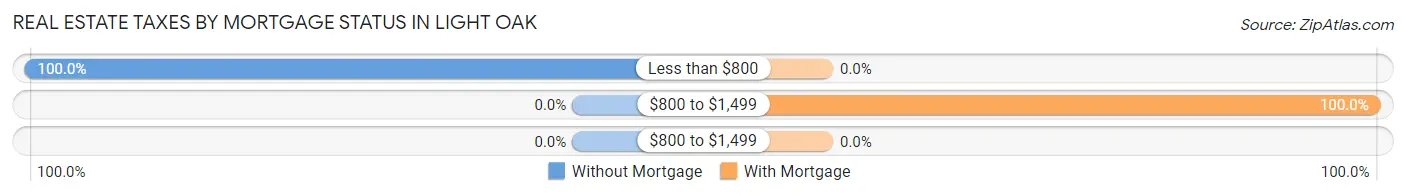
| Property Taxes | Without Mortgage | With Mortgage |
| Less than $800 | 53 (100.0%) | 0 (0.0%) |
| $800 to $1,499 | 0 (0.0%) | 44 (100.0%) |
| $800 to $1,499 | 0 (0.0%) | 0 (0.0%) |
| Total | 53 (100.0%) | 44 (100.0%) |
Health & Disability in Light Oak
Health Insurance Coverage by Age in Light Oak
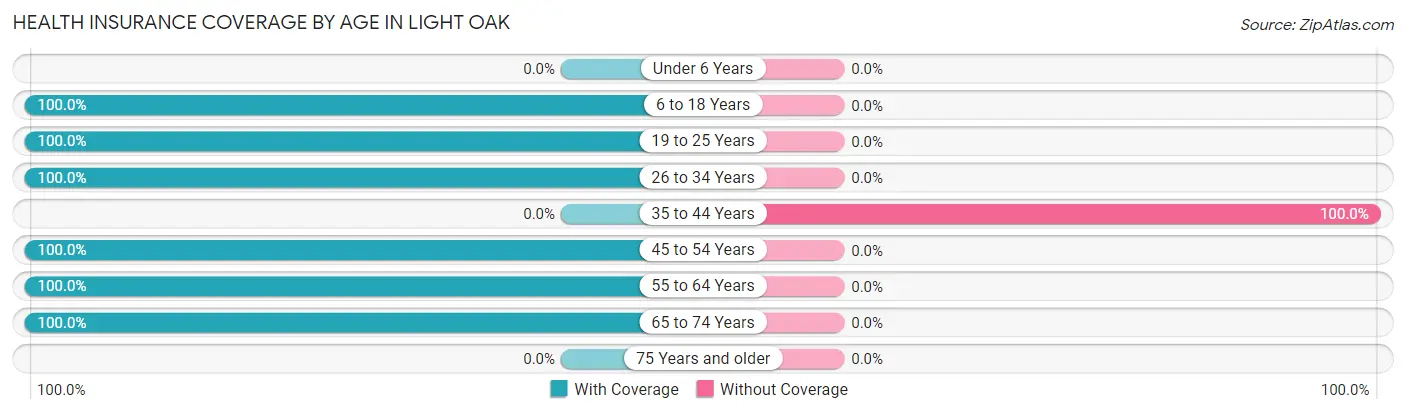
| Age Bracket | With Coverage | Without Coverage |
| Under 6 Years | 0 (0.0%) | 0 (0.0%) |
| 6 to 18 Years | 111 (100.0%) | 0 (0.0%) |
| 19 to 25 Years | 30 (100.0%) | 0 (0.0%) |
| 26 to 34 Years | 212 (100.0%) | 0 (0.0%) |
| 35 to 44 Years | 0 (0.0%) | 41 (100.0%) |
| 45 to 54 Years | 59 (100.0%) | 0 (0.0%) |
| 55 to 64 Years | 138 (100.0%) | 0 (0.0%) |
| 65 to 74 Years | 86 (100.0%) | 0 (0.0%) |
| 75 Years and older | 0 (0.0%) | 0 (0.0%) |
| Total | 636 (93.9%) | 41 (6.1%) |
Health Insurance Coverage by Citizenship Status in Light Oak
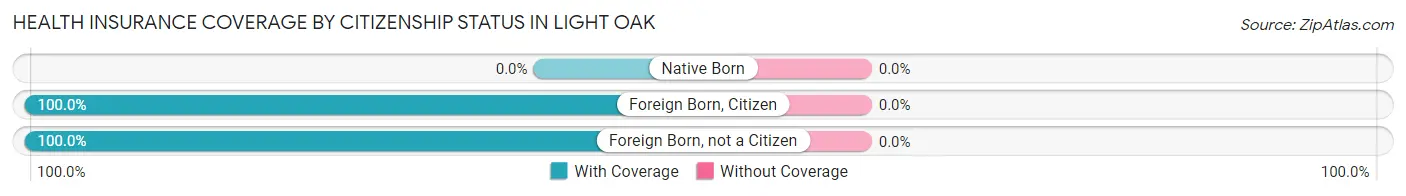
| Citizenship Status | With Coverage | Without Coverage |
| Native Born | 0 (0.0%) | 0 (0.0%) |
| Foreign Born, Citizen | 111 (100.0%) | 0 (0.0%) |
| Foreign Born, not a Citizen | 30 (100.0%) | 0 (0.0%) |
Health Insurance Coverage by Household Income in Light Oak
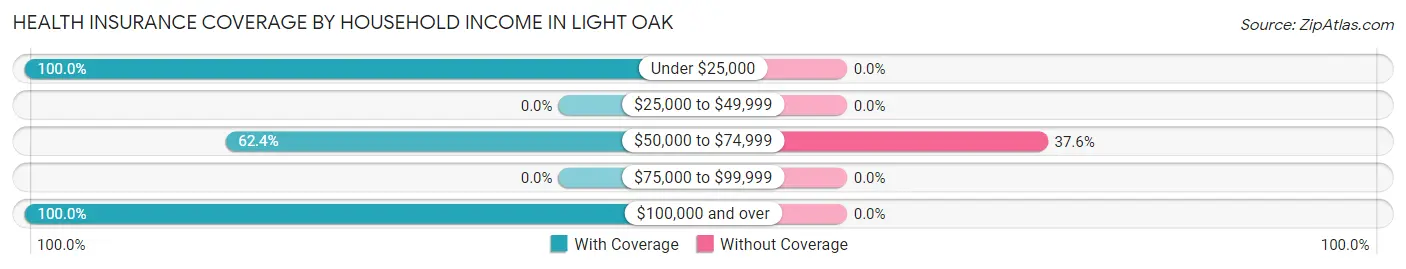
| Household Income | With Coverage | Without Coverage |
| Under $25,000 | 280 (100.0%) | 0 (0.0%) |
| $25,000 to $49,999 | 0 (0.0%) | 0 (0.0%) |
| $50,000 to $74,999 | 68 (62.4%) | 41 (37.6%) |
| $75,000 to $99,999 | 0 (0.0%) | 0 (0.0%) |
| $100,000 and over | 288 (100.0%) | 0 (0.0%) |
Public vs Private Health Insurance Coverage by Age in Light Oak
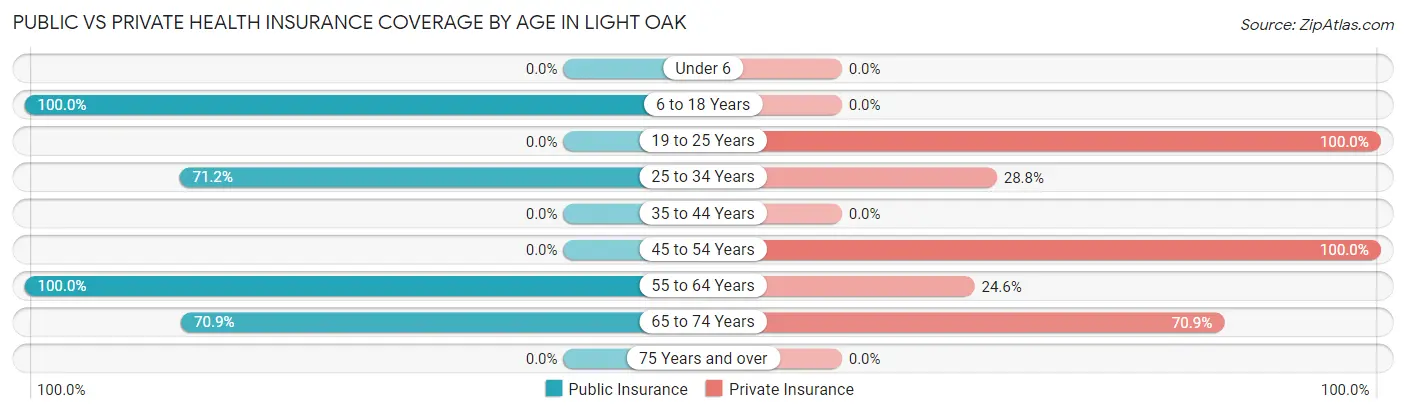
| Age Bracket | Public Insurance | Private Insurance |
| Under 6 | 0 (0.0%) | 0 (0.0%) |
| 6 to 18 Years | 111 (100.0%) | 0 (0.0%) |
| 19 to 25 Years | 0 (0.0%) | 30 (100.0%) |
| 25 to 34 Years | 151 (71.2%) | 61 (28.8%) |
| 35 to 44 Years | 0 (0.0%) | 0 (0.0%) |
| 45 to 54 Years | 0 (0.0%) | 59 (100.0%) |
| 55 to 64 Years | 138 (100.0%) | 34 (24.6%) |
| 65 to 74 Years | 61 (70.9%) | 61 (70.9%) |
| 75 Years and over | 0 (0.0%) | 0 (0.0%) |
| Total | 461 (68.1%) | 245 (36.2%) |
Disability Status by Sex by Age in Light Oak
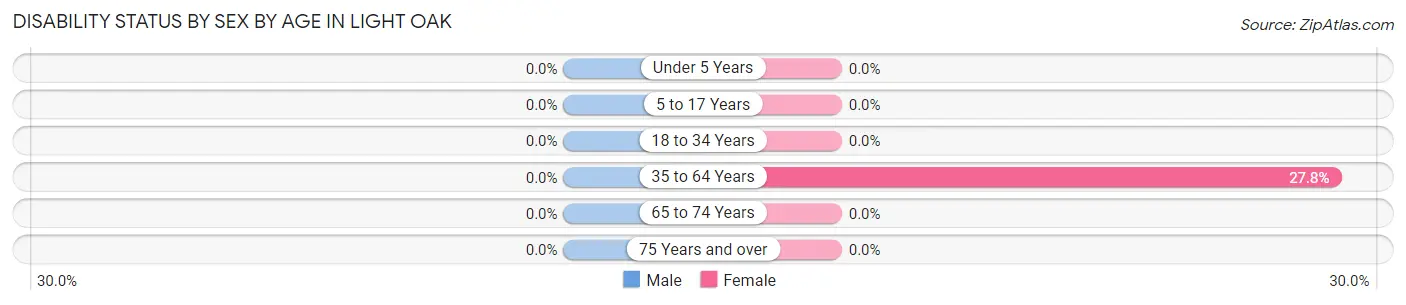
| Age Bracket | Male | Female |
| Under 5 Years | 0 (0.0%) | 0 (0.0%) |
| 5 to 17 Years | 0 (0.0%) | 0 (0.0%) |
| 18 to 34 Years | 0 (0.0%) | 0 (0.0%) |
| 35 to 64 Years | 0 (0.0%) | 52 (27.8%) |
| 65 to 74 Years | 0 (0.0%) | 0 (0.0%) |
| 75 Years and over | 0 (0.0%) | 0 (0.0%) |
Disability Class by Sex by Age in Light Oak
Disability Class: Hearing Difficulty
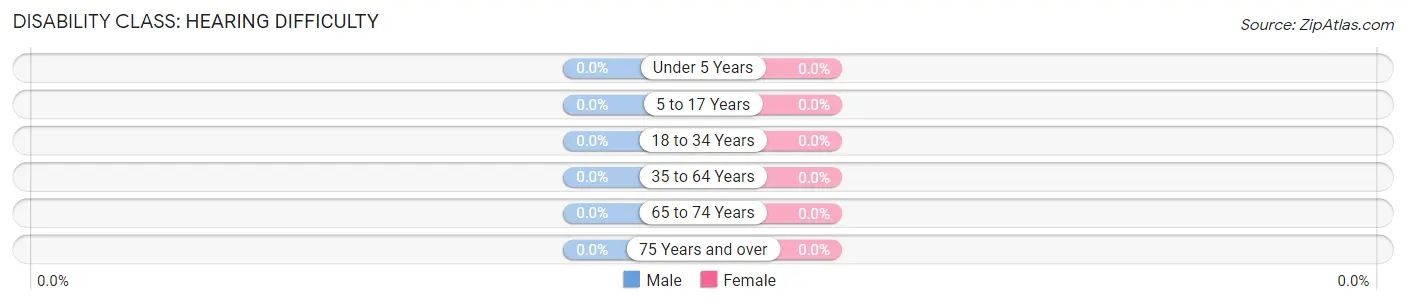
| Age Bracket | Male | Female |
| Under 5 Years | 0 (0.0%) | 0 (0.0%) |
| 5 to 17 Years | 0 (0.0%) | 0 (0.0%) |
| 18 to 34 Years | 0 (0.0%) | 0 (0.0%) |
| 35 to 64 Years | 0 (0.0%) | 0 (0.0%) |
| 65 to 74 Years | 0 (0.0%) | 0 (0.0%) |
| 75 Years and over | 0 (0.0%) | 0 (0.0%) |
Disability Class: Vision Difficulty
| Age Bracket | Male | Female |
| Under 5 Years | 0 (0.0%) | 0 (0.0%) |
| 5 to 17 Years | 0 (0.0%) | 0 (0.0%) |
| 18 to 34 Years | 0 (0.0%) | 0 (0.0%) |
| 35 to 64 Years | 0 (0.0%) | 0 (0.0%) |
| 65 to 74 Years | 0 (0.0%) | 0 (0.0%) |
| 75 Years and over | 0 (0.0%) | 0 (0.0%) |
Disability Class: Cognitive Difficulty
| Age Bracket | Male | Female |
| 5 to 17 Years | 0 (0.0%) | 0 (0.0%) |
| 18 to 34 Years | 0 (0.0%) | 0 (0.0%) |
| 35 to 64 Years | 0 (0.0%) | 0 (0.0%) |
| 65 to 74 Years | 0 (0.0%) | 0 (0.0%) |
| 75 Years and over | 0 (0.0%) | 0 (0.0%) |
Disability Class: Ambulatory Difficulty
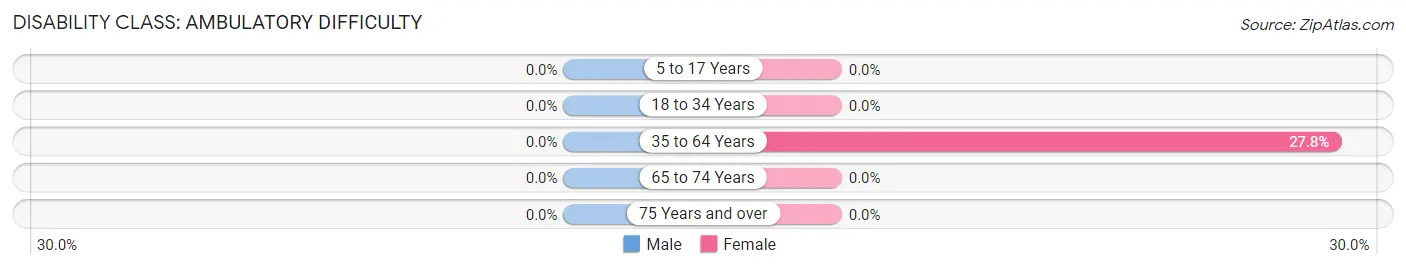
| Age Bracket | Male | Female |
| 5 to 17 Years | 0 (0.0%) | 0 (0.0%) |
| 18 to 34 Years | 0 (0.0%) | 0 (0.0%) |
| 35 to 64 Years | 0 (0.0%) | 52 (27.8%) |
| 65 to 74 Years | 0 (0.0%) | 0 (0.0%) |
| 75 Years and over | 0 (0.0%) | 0 (0.0%) |
Disability Class: Self-Care Difficulty
| Age Bracket | Male | Female |
| 5 to 17 Years | 0 (0.0%) | 0 (0.0%) |
| 18 to 34 Years | 0 (0.0%) | 0 (0.0%) |
| 35 to 64 Years | 0 (0.0%) | 0 (0.0%) |
| 65 to 74 Years | 0 (0.0%) | 0 (0.0%) |
| 75 Years and over | 0 (0.0%) | 0 (0.0%) |
Technology Access in Light Oak
Computing Device Access in Light Oak
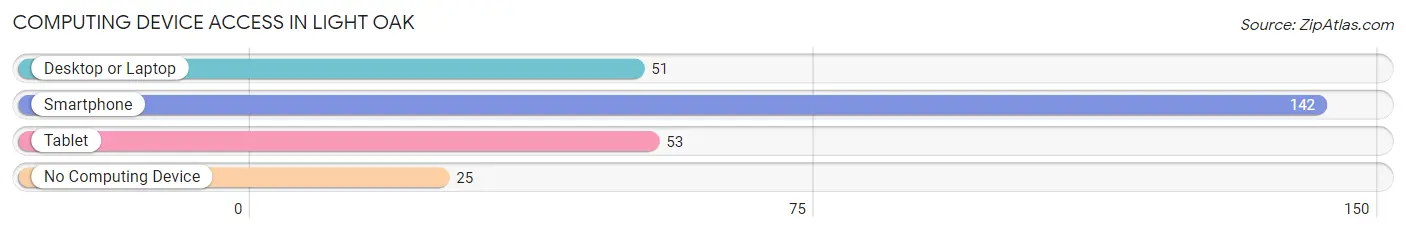
| Device Type | # Households | % Households |
| Desktop or Laptop | 51 | 27.4% |
| Smartphone | 142 | 76.3% |
| Tablet | 53 | 28.5% |
| No Computing Device | 25 | 13.4% |
| Total | 186 | 100.0% |
Internet Access in Light Oak
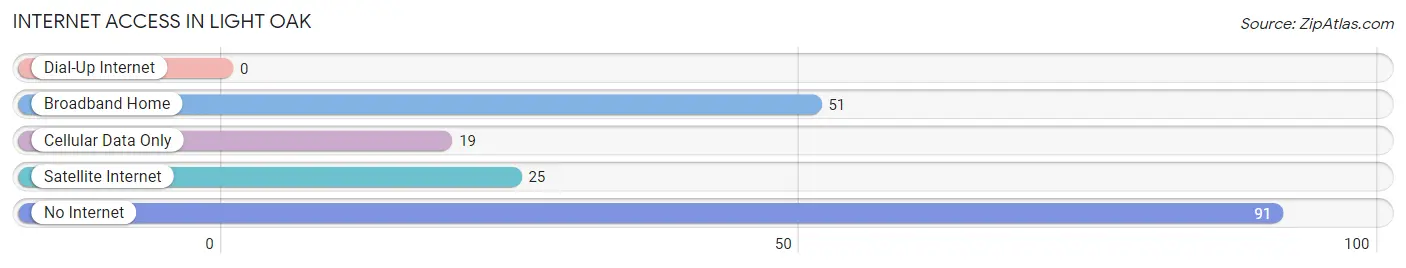
| Internet Type | # Households | % Households |
| Dial-Up Internet | 0 | 0.0% |
| Broadband Home | 51 | 27.4% |
| Cellular Data Only | 19 | 10.2% |
| Satellite Internet | 25 | 13.4% |
| No Internet | 91 | 48.9% |
| Total | 186 | 100.0% |
Light Oak Summary
Oak, North Carolina is a small town located in the western part of the state, in the foothills of the Blue Ridge Mountains. It is situated in the Yadkin Valley, and is part of the larger Winston-Salem metropolitan area. The town has a population of just over 1,000 people, and is known for its rural charm and small-town atmosphere.
Geography
Oak is located in the foothills of the Blue Ridge Mountains, in the Yadkin Valley. The town is situated on the banks of the Yadkin River, and is surrounded by rolling hills and lush forests. The town is located about 25 miles west of Winston-Salem, and is part of the larger metropolitan area. The town is located at an elevation of 890 feet above sea level.
History
Oak was first settled in the early 1800s by settlers from the nearby town of Salem. The town was originally known as Oak Grove, and was named after the many oak trees that grew in the area. The town was incorporated in 1891, and the first post office was established in 1892. The town grew slowly over the years, and by the early 1900s, it had become a popular destination for tourists and vacationers.
Economy
Oak’s economy is largely based on agriculture and tourism. The town is home to several farms, which produce a variety of crops, including corn, soybeans, and tobacco. The town is also home to several wineries, which produce a variety of wines. Tourism is also an important part of the local economy, as the town is a popular destination for outdoor activities, such as hiking, camping, and fishing.
Demographics
As of the 2010 census, Oak had a population of 1,072 people. The racial makeup of the town was 95.3% White, 1.2% African American, 0.3% Native American, 0.7% Asian, 0.1% Pacific Islander, and 2.4% from other races. The median household income was $37,917, and the median family income was $45,625. The per capita income was $19,945.
Conclusion
Oak, North Carolina is a small town located in the western part of the state, in the foothills of the Blue Ridge Mountains. It is situated in the Yadkin Valley, and is part of the larger Winston-Salem metropolitan area. The town has a population of just over 1,000 people, and is known for its rural charm and small-town atmosphere. The town’s economy is largely based on agriculture and tourism, and the town is home to several wineries and farms. The town has a diverse population, with a median household income of $37,917. Oak is a charming and peaceful town, and is a great place to visit or live.
Common Questions
What is Per Capita Income in Light Oak?
Per Capita income in Light Oak is $15,774.
What is Inequality or Gini Index in Light Oak?
Inequality or Gini Index in Light Oak is 0.51.
What is the Total Population of Light Oak?
Total Population of Light Oak is 677.
What is the Total Male Population of Light Oak?
Total Male Population of Light Oak is 363.
What is the Total Female Population of Light Oak?
Total Female Population of Light Oak is 314.
What is the Ratio of Males per 100 Females in Light Oak?
There are 115.61 Males per 100 Females in Light Oak.
What is the Ratio of Females per 100 Males in Light Oak?
There are 86.50 Females per 100 Males in Light Oak.
What is the Median Population Age in Light Oak?
Median Population Age in Light Oak is 29.8 Years.
What is the Average Family Size in Light Oak
Average Family Size in Light Oak is 2.7 People.
What is the Average Household Size in Light Oak
Average Household Size in Light Oak is 3.6 People.
How Large is the Labor Force in Light Oak?
There are 225 People in the Labor Forcein in Light Oak.
What is the Percentage of People in the Labor Force in Light Oak?
39.8% of People are in the Labor Force in Light Oak.
What is the Unemployment Rate in Light Oak?
Unemployment Rate in Light Oak is 27.1%.