Toast, NC Map & Demographics
Toast Map
Toast Overview
$20,188
PER CAPITA INCOME
$34,966
AVG FAMILY INCOME
$33,665
AVG HOUSEHOLD INCOME
25.6%
WAGE / INCOME GAP [ % ]
74.4¢/ $1
WAGE / INCOME GAP [ $ ]
0.40
INEQUALITY / GINI INDEX
1,210
TOTAL POPULATION
569
MALE POPULATION
641
FEMALE POPULATION
88.77
MALES / 100 FEMALES
112.65
FEMALES / 100 MALES
40.3
MEDIAN AGE
2.7
AVG FAMILY SIZE
2.4
AVG HOUSEHOLD SIZE
609
LABOR FORCE [ PEOPLE ]
67.0%
PERCENT IN LABOR FORCE
8.0%
UNEMPLOYMENT RATE
Toast Area Codes
Income in Toast
Income Overview in Toast
Per Capita Income in Toast is $20,188, while median incomes of families and households are $34,966 and $33,665 respectively.
| Characteristic | Number | Measure |
| Per Capita Income | 1,210 | $20,188 |
| Median Family Income | 409 | $34,966 |
| Mean Family Income | 409 | $54,312 |
| Median Household Income | 499 | $33,665 |
| Mean Household Income | 499 | $49,247 |
| Income Deficit | 409 | $0 |
| Wage / Income Gap (%) | 1,210 | 25.57% |
| Wage / Income Gap ($) | 1,210 | 74.43¢ per $1 |
| Gini / Inequality Index | 1,210 | 0.40 |
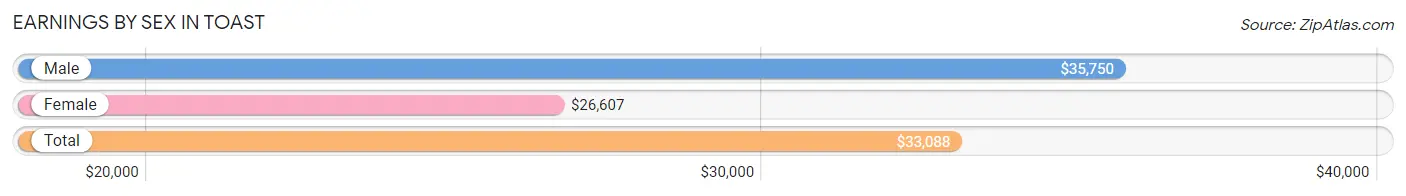
Earnings by Sex in Toast
Average Earnings in Toast are $33,088, $35,750 for men and $26,607 for women, a difference of 25.6%.
| Sex | Number | Average Earnings |
| Male | 227 (39.6%) | $35,750 |
| Female | 347 (60.5%) | $26,607 |
| Total | 574 (100.0%) | $33,088 |
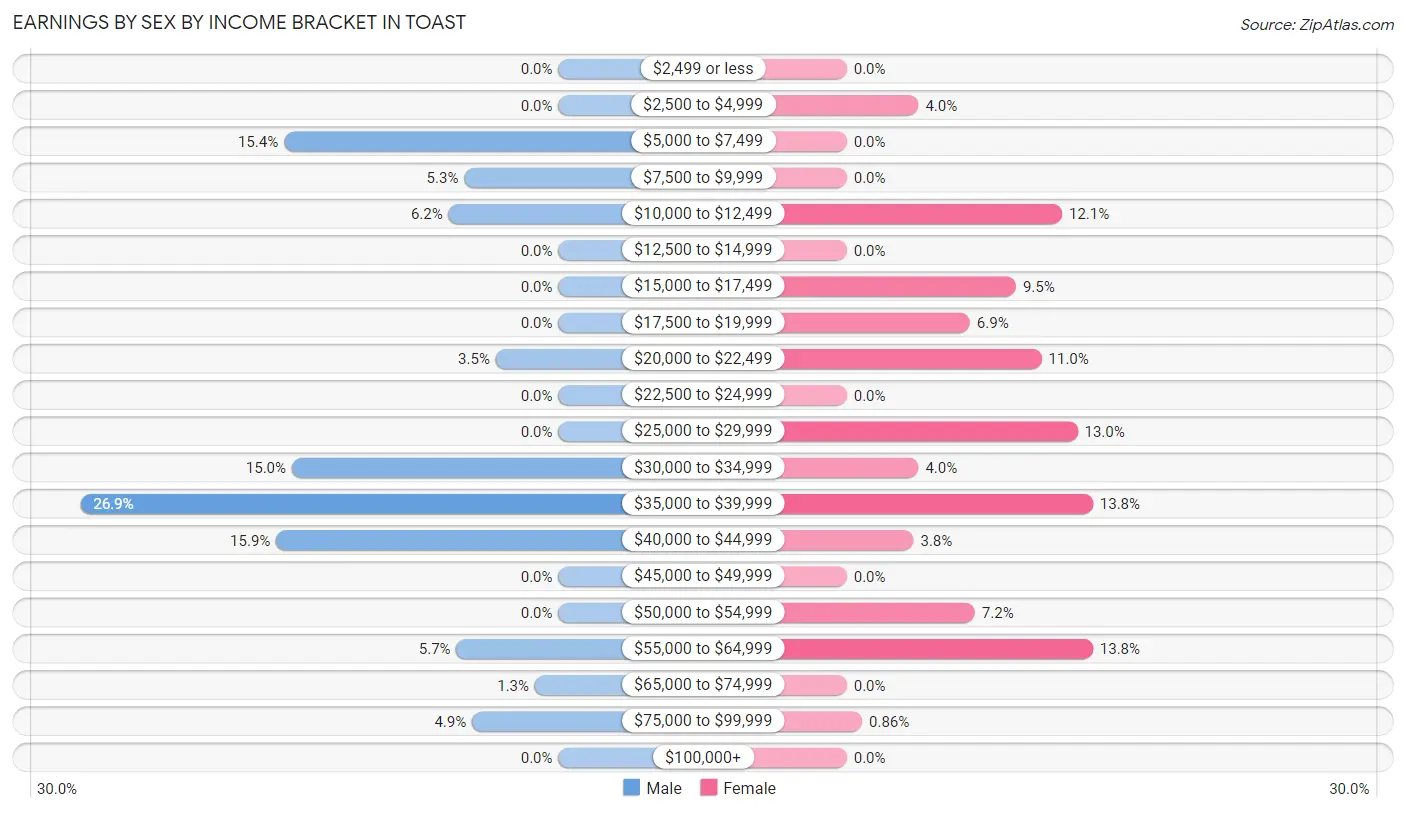
Earnings by Sex by Income Bracket in Toast
The most common earnings brackets in Toast are $35,000 to $39,999 for men (61 | 26.9%) and $35,000 to $39,999 for women (48 | 13.8%).
| Income | Male | Female |
| $2,499 or less | 0 (0.0%) | 0 (0.0%) |
| $2,500 to $4,999 | 0 (0.0%) | 14 (4.0%) |
| $5,000 to $7,499 | 35 (15.4%) | 0 (0.0%) |
| $7,500 to $9,999 | 12 (5.3%) | 0 (0.0%) |
| $10,000 to $12,499 | 14 (6.2%) | 42 (12.1%) |
| $12,500 to $14,999 | 0 (0.0%) | 0 (0.0%) |
| $15,000 to $17,499 | 0 (0.0%) | 33 (9.5%) |
| $17,500 to $19,999 | 0 (0.0%) | 24 (6.9%) |
| $20,000 to $22,499 | 8 (3.5%) | 38 (11.0%) |
| $22,500 to $24,999 | 0 (0.0%) | 0 (0.0%) |
| $25,000 to $29,999 | 0 (0.0%) | 45 (13.0%) |
| $30,000 to $34,999 | 34 (15.0%) | 14 (4.0%) |
| $35,000 to $39,999 | 61 (26.9%) | 48 (13.8%) |
| $40,000 to $44,999 | 36 (15.9%) | 13 (3.7%) |
| $45,000 to $49,999 | 0 (0.0%) | 0 (0.0%) |
| $50,000 to $54,999 | 0 (0.0%) | 25 (7.2%) |
| $55,000 to $64,999 | 13 (5.7%) | 48 (13.8%) |
| $65,000 to $74,999 | 3 (1.3%) | 0 (0.0%) |
| $75,000 to $99,999 | 11 (4.9%) | 3 (0.9%) |
| $100,000+ | 0 (0.0%) | 0 (0.0%) |
| Total | 227 (100.0%) | 347 (100.0%) |
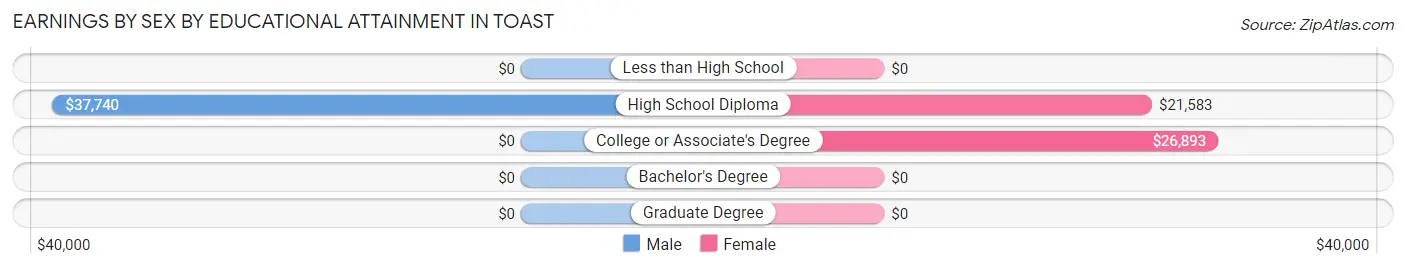
Earnings by Sex by Educational Attainment in Toast
Average earnings in Toast are $36,179 for men and $26,571 for women, a difference of 26.6%. Men with an educational attainment of high school diploma enjoy the highest average annual earnings of $37,740, while those with high school diploma education earn the least with $37,740. Women with an educational attainment of college or associate's degree earn the most with the average annual earnings of $26,893, while those with high school diploma education have the smallest earnings of $21,583.
| Educational Attainment | Male Income | Female Income |
| Less than High School | - | - |
| High School Diploma | $37,740 | $21,583 |
| College or Associate's Degree | - | - |
| Bachelor's Degree | - | - |
| Graduate Degree | - | - |
| Total | $36,179 | $26,571 |
Family Income in Toast
Family Income Brackets in Toast
According to the Toast family income data, there are 111 families falling into the $25,000 to $34,999 income range, which is the most common income bracket and makes up 27.1% of all families.
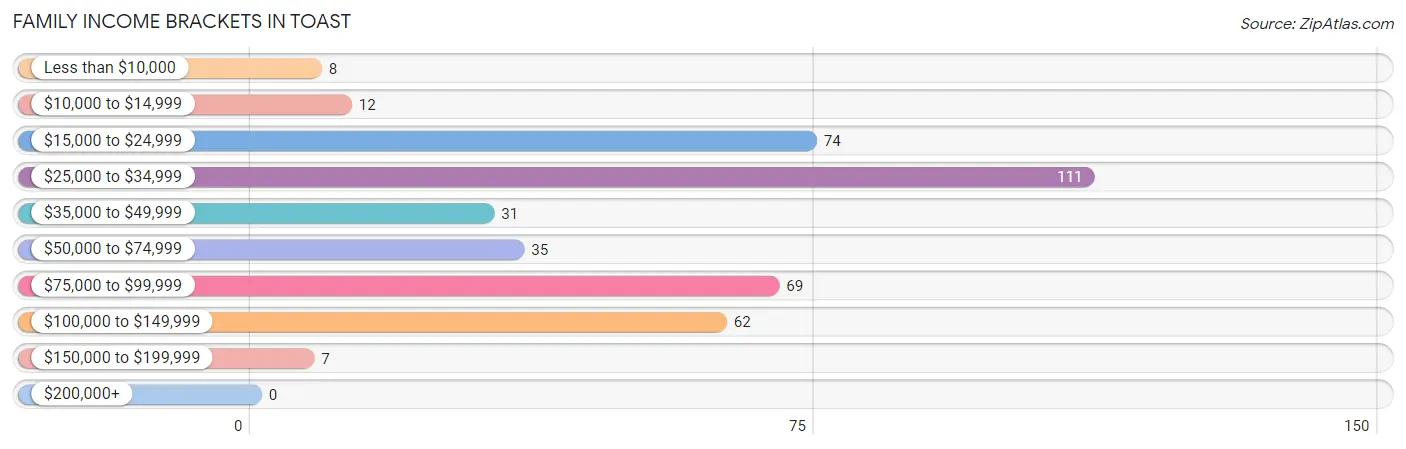
| Income Bracket | # Families | % Families |
| Less than $10,000 | 8 | 2.0% |
| $10,000 to $14,999 | 12 | 2.9% |
| $15,000 to $24,999 | 74 | 18.1% |
| $25,000 to $34,999 | 111 | 27.1% |
| $35,000 to $49,999 | 31 | 7.6% |
| $50,000 to $74,999 | 35 | 8.6% |
| $75,000 to $99,999 | 69 | 16.9% |
| $100,000 to $149,999 | 62 | 15.2% |
| $150,000 to $199,999 | 7 | 1.7% |
| $200,000+ | 0 | 0.0% |
Family Income by Famaliy Size in Toast
3-person families (57 | 13.9%) account for the highest median family income in Toast with $90,817 per family, while 3-person families (57 | 13.9%) have the highest median income of $30,272 per family member.
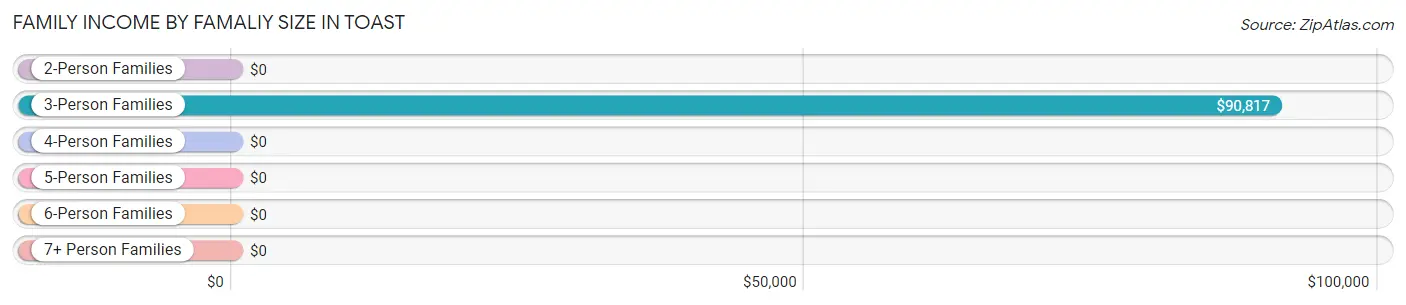
| Income Bracket | # Families | Median Income |
| 2-Person Families | 277 (67.7%) | $0 |
| 3-Person Families | 57 (13.9%) | $90,817 |
| 4-Person Families | 67 (16.4%) | $0 |
| 5-Person Families | 8 (2.0%) | $0 |
| 6-Person Families | 0 (0.0%) | $0 |
| 7+ Person Families | 0 (0.0%) | $0 |
| Total | 409 (100.0%) | $34,966 |
Family Income by Number of Earners in Toast
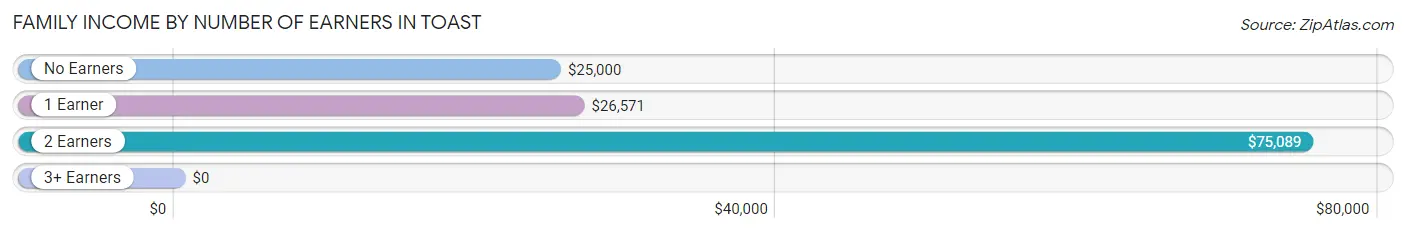
| Number of Earners | # Families | Median Income |
| No Earners | 120 (29.3%) | $25,000 |
| 1 Earner | 62 (15.2%) | $26,571 |
| 2 Earners | 208 (50.9%) | $75,089 |
| 3+ Earners | 19 (4.6%) | $0 |
| Total | 409 (100.0%) | $34,966 |
Household Income in Toast
Household Income Brackets in Toast
With 125 households falling in the category, the $25,000 to $34,999 income range is the most frequent in Toast, accounting for 25.1% of all households.
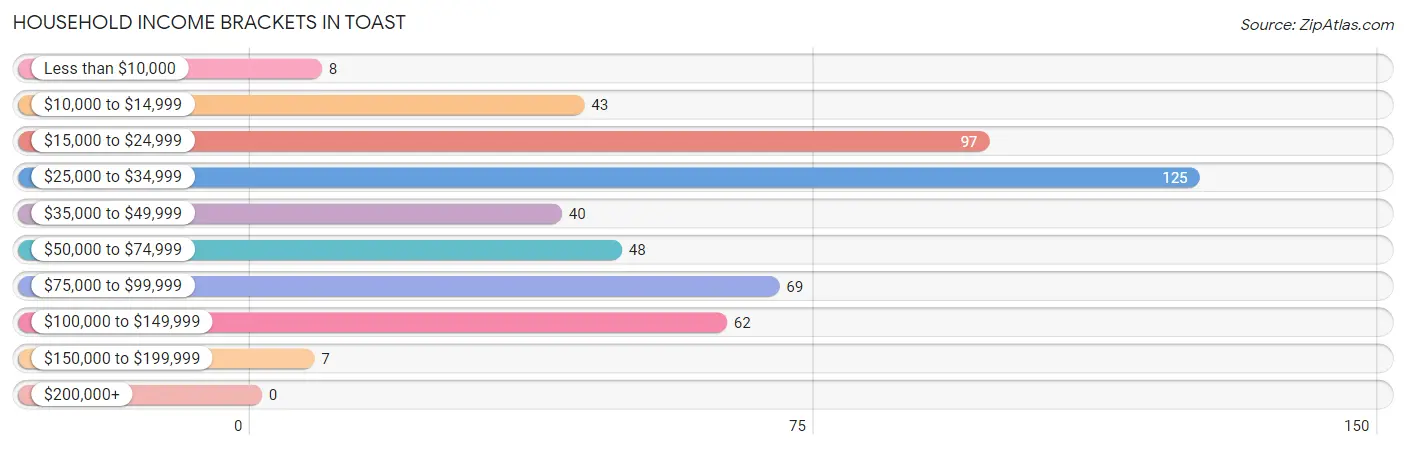
| Income Bracket | # Households | % Households |
| Less than $10,000 | 8 | 1.6% |
| $10,000 to $14,999 | 43 | 8.6% |
| $15,000 to $24,999 | 97 | 19.4% |
| $25,000 to $34,999 | 125 | 25.1% |
| $35,000 to $49,999 | 40 | 8.0% |
| $50,000 to $74,999 | 48 | 9.6% |
| $75,000 to $99,999 | 69 | 13.8% |
| $100,000 to $149,999 | 62 | 12.4% |
| $150,000 to $199,999 | 7 | 1.4% |
| $200,000+ | 0 | 0.0% |
Household Income by Householder Age in Toast
The median household income in Toast is $33,665, with the highest median household income of $58,269 found in the 45 to 64 years age bracket for the primary householder. A total of 154 households (30.9%) fall into this category. Meanwhile, the 15 to 24 years age bracket for the primary householder has the lowest median household income of $0, with 60 households (12.0%) in this group.
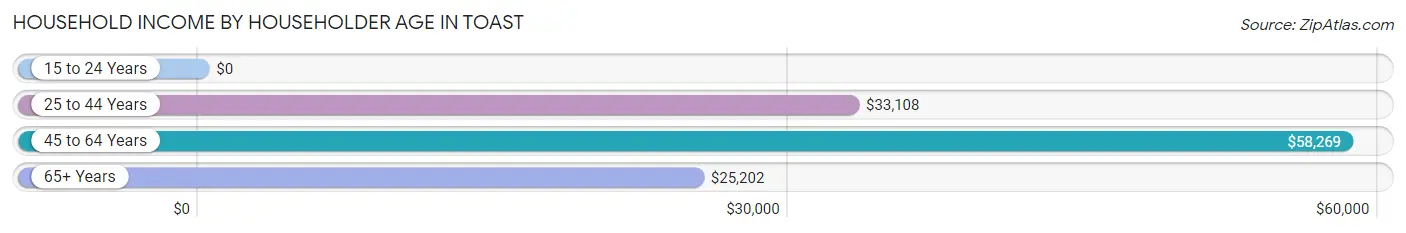
| Income Bracket | # Households | Median Income |
| 15 to 24 Years | 60 (12.0%) | $0 |
| 25 to 44 Years | 116 (23.3%) | $33,108 |
| 45 to 64 Years | 154 (30.9%) | $58,269 |
| 65+ Years | 169 (33.9%) | $25,202 |
| Total | 499 (100.0%) | $33,665 |
Poverty in Toast
Income Below Poverty by Sex and Age in Toast
With 13.7% poverty level for males and 7.8% for females among the residents of Toast, 65 to 74 year old males and 65 to 74 year old females are the most vulnerable to poverty, with 44 males (41.9%) and 28 females (36.8%) in their respective age groups living below the poverty level.
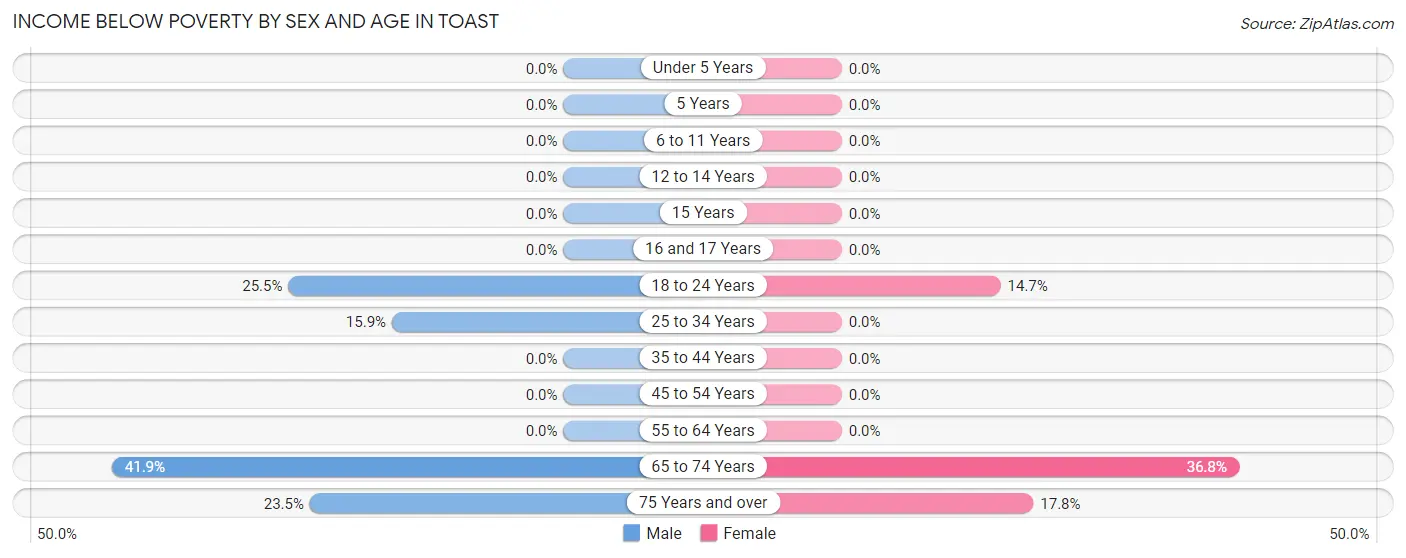
| Age Bracket | Male | Female |
| Under 5 Years | 0 (0.0%) | 0 (0.0%) |
| 5 Years | 0 (0.0%) | 0 (0.0%) |
| 6 to 11 Years | 0 (0.0%) | 0 (0.0%) |
| 12 to 14 Years | 0 (0.0%) | 0 (0.0%) |
| 15 Years | 0 (0.0%) | 0 (0.0%) |
| 16 and 17 Years | 0 (0.0%) | 0 (0.0%) |
| 18 to 24 Years | 12 (25.5%) | 14 (14.7%) |
| 25 to 34 Years | 14 (15.9%) | 0 (0.0%) |
| 35 to 44 Years | 0 (0.0%) | 0 (0.0%) |
| 45 to 54 Years | 0 (0.0%) | 0 (0.0%) |
| 55 to 64 Years | 0 (0.0%) | 0 (0.0%) |
| 65 to 74 Years | 44 (41.9%) | 28 (36.8%) |
| 75 Years and over | 8 (23.5%) | 8 (17.8%) |
| Total | 78 (13.7%) | 50 (7.8%) |
Income Above Poverty by Sex and Age in Toast
According to the poverty statistics in Toast, males aged under 5 years and females aged 6 to 11 years are the age groups that are most secure financially, with 100.0% of males and 100.0% of females in these age groups living above the poverty line.
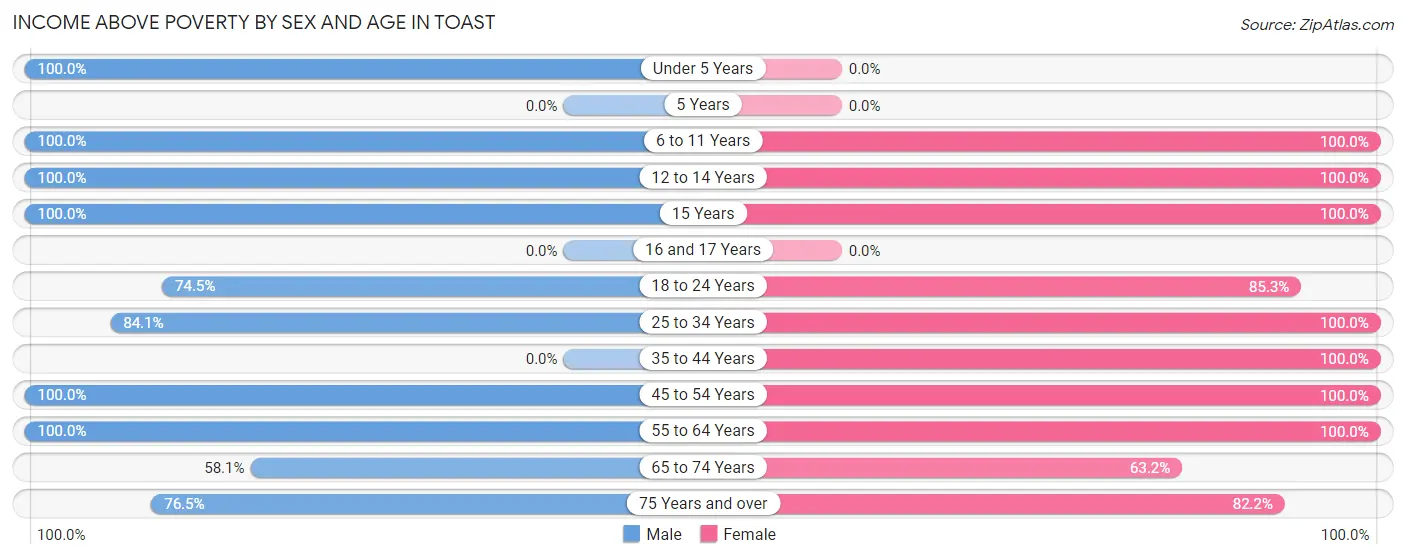
| Age Bracket | Male | Female |
| Under 5 Years | 67 (100.0%) | 0 (0.0%) |
| 5 Years | 0 (0.0%) | 0 (0.0%) |
| 6 to 11 Years | 11 (100.0%) | 111 (100.0%) |
| 12 to 14 Years | 54 (100.0%) | 11 (100.0%) |
| 15 Years | 9 (100.0%) | 38 (100.0%) |
| 16 and 17 Years | 0 (0.0%) | 0 (0.0%) |
| 18 to 24 Years | 35 (74.5%) | 81 (85.3%) |
| 25 to 34 Years | 74 (84.1%) | 24 (100.0%) |
| 35 to 44 Years | 0 (0.0%) | 114 (100.0%) |
| 45 to 54 Years | 97 (100.0%) | 25 (100.0%) |
| 55 to 64 Years | 57 (100.0%) | 102 (100.0%) |
| 65 to 74 Years | 61 (58.1%) | 48 (63.2%) |
| 75 Years and over | 26 (76.5%) | 37 (82.2%) |
| Total | 491 (86.3%) | 591 (92.2%) |
Income Below Poverty Among Married-Couple Families in Toast
The poverty statistics for married-couple families in Toast show that 14.1% or 39 of the total 276 families live below the poverty line. Families with no children have the highest poverty rate of 20.3%, comprising of 39 families. On the other hand, families with 1 or 2 children have the lowest poverty rate of 0.0%, which includes 0 families.
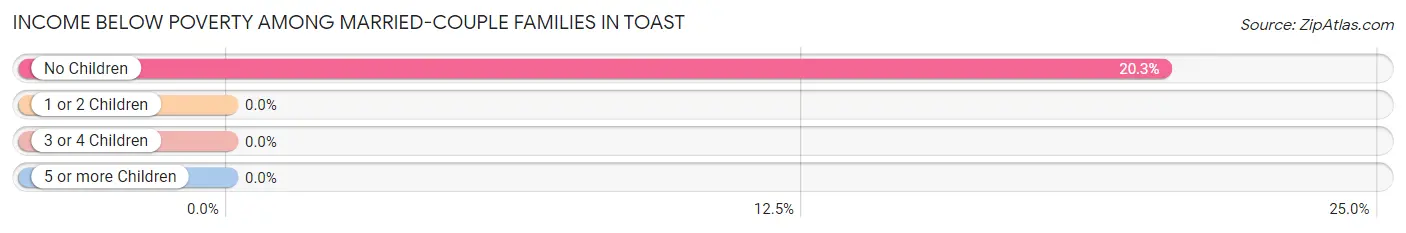
| Children | Above Poverty | Below Poverty |
| No Children | 153 (79.7%) | 39 (20.3%) |
| 1 or 2 Children | 84 (100.0%) | 0 (0.0%) |
| 3 or 4 Children | 0 (0.0%) | 0 (0.0%) |
| 5 or more Children | 0 (0.0%) | 0 (0.0%) |
| Total | 237 (85.9%) | 39 (14.1%) |
Income Below Poverty Among Single-Parent Households in Toast
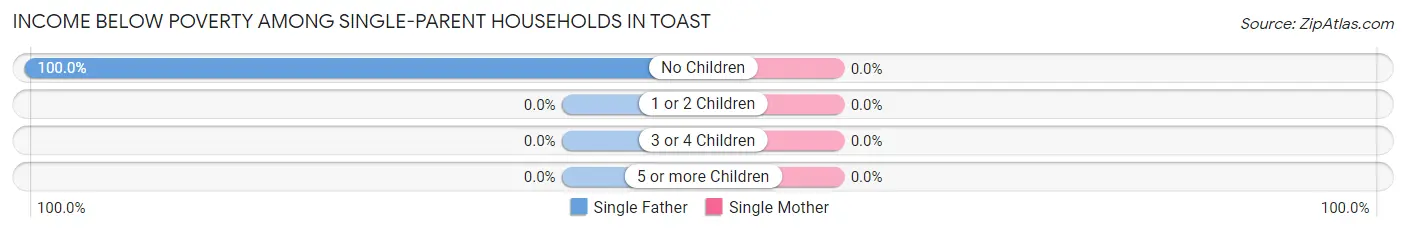
| Children | Single Father | Single Mother |
| No Children | 8 (100.0%) | 0 (0.0%) |
| 1 or 2 Children | 0 (0.0%) | 0 (0.0%) |
| 3 or 4 Children | 0 (0.0%) | 0 (0.0%) |
| 5 or more Children | 0 (0.0%) | 0 (0.0%) |
| Total | 8 (100.0%) | 0 (0.0%) |
Income Below Poverty Among Married-Couple vs Single-Parent Households in Toast
The poverty data for Toast shows that 39 of the married-couple family households (14.1%) and 8 of the single-parent households (6.0%) are living below the poverty level. Within the married-couple family households, those with no children have the highest poverty rate, with 39 households (20.3%) falling below the poverty line. Among the single-parent households, those with no children have the highest poverty rate, with 8 household (16.7%) living below poverty.
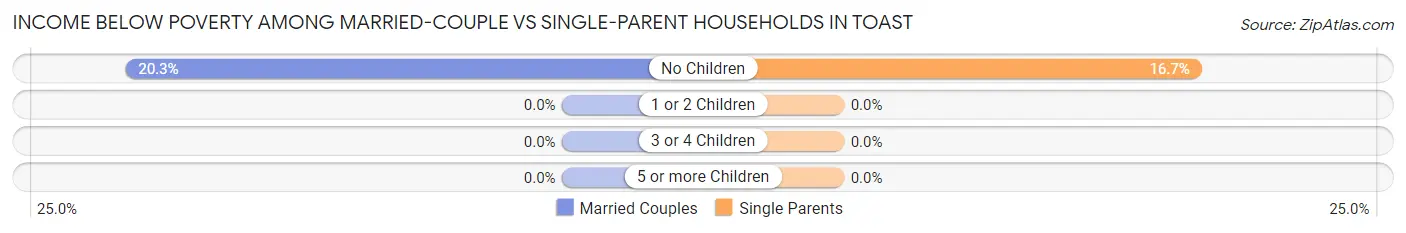
| Children | Married-Couple Families | Single-Parent Households |
| No Children | 39 (20.3%) | 8 (16.7%) |
| 1 or 2 Children | 0 (0.0%) | 0 (0.0%) |
| 3 or 4 Children | 0 (0.0%) | 0 (0.0%) |
| 5 or more Children | 0 (0.0%) | 0 (0.0%) |
| Total | 39 (14.1%) | 8 (6.0%) |
Race in Toast
The most populous races in Toast are White / Caucasian (964 | 79.7%), Hispanic or Latino (222 | 18.3%), and Two or more Races (178 | 14.7%).
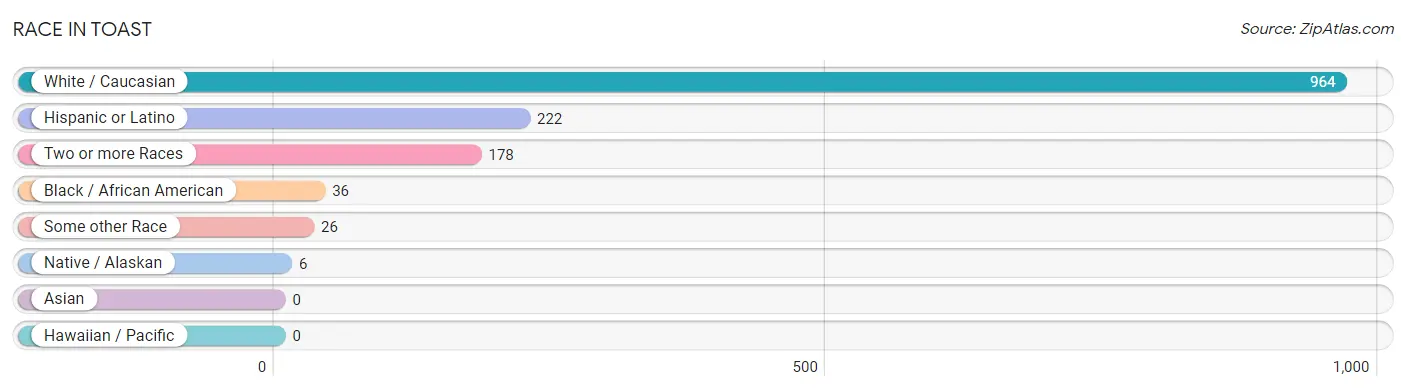
| Race | # Population | % Population |
| Asian | 0 | 0.0% |
| Black / African American | 36 | 3.0% |
| Hawaiian / Pacific | 0 | 0.0% |
| Hispanic or Latino | 222 | 18.3% |
| Native / Alaskan | 6 | 0.5% |
| White / Caucasian | 964 | 79.7% |
| Two or more Races | 178 | 14.7% |
| Some other Race | 26 | 2.1% |
| Total | 1,210 | 100.0% |
Ancestry in Toast
The most populous ancestries reported in Toast are American (221 | 18.3%), Irish (179 | 14.8%), Mexican (117 | 9.7%), Scottish (39 | 3.2%), and Central American (38 | 3.1%), together accounting for 49.1% of all Toast residents.
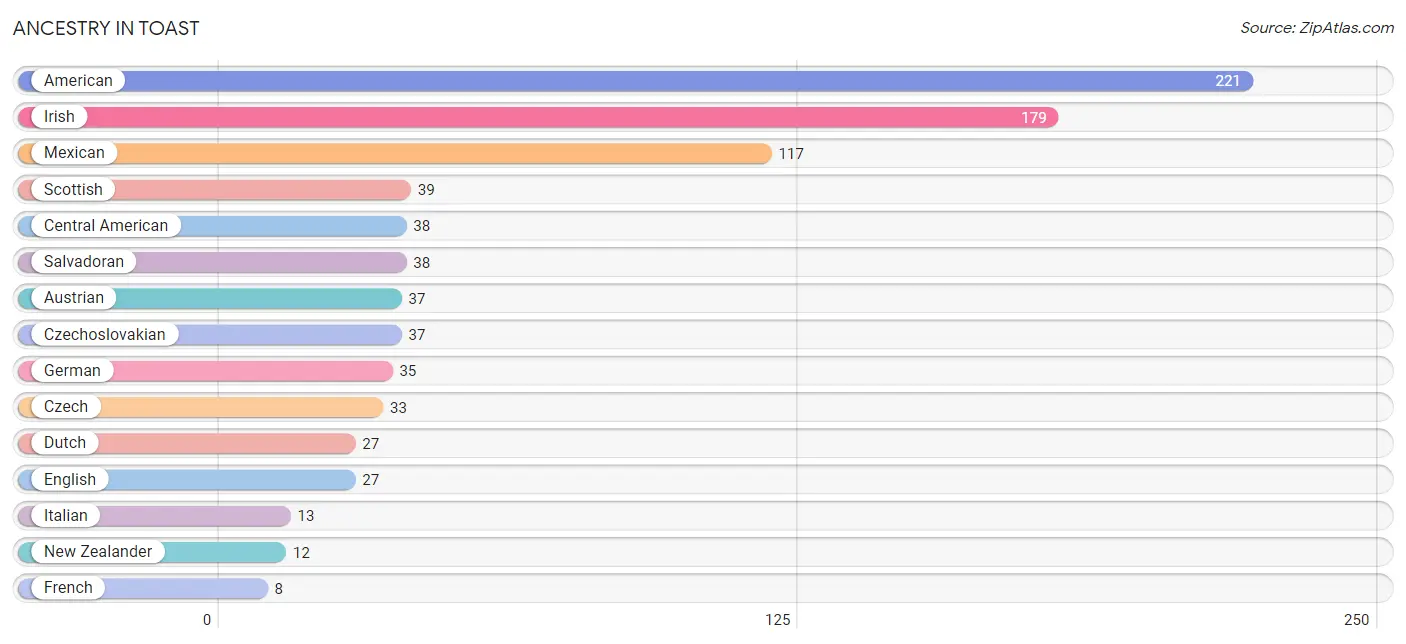
| Ancestry | # Population | % Population |
| American | 221 | 18.3% |
| Austrian | 37 | 3.1% |
| Central American | 38 | 3.1% |
| Czech | 33 | 2.7% |
| Czechoslovakian | 37 | 3.1% |
| Dutch | 27 | 2.2% |
| English | 27 | 2.2% |
| French | 8 | 0.7% |
| German | 35 | 2.9% |
| Irish | 179 | 14.8% |
| Italian | 13 | 1.1% |
| Lumbee | 6 | 0.5% |
| Mexican | 117 | 9.7% |
| New Zealander | 12 | 1.0% |
| Salvadoran | 38 | 3.1% |
| Scotch-Irish | 7 | 0.6% |
| Scottish | 39 | 3.2% | View All 17 Rows |
Immigrants in Toast
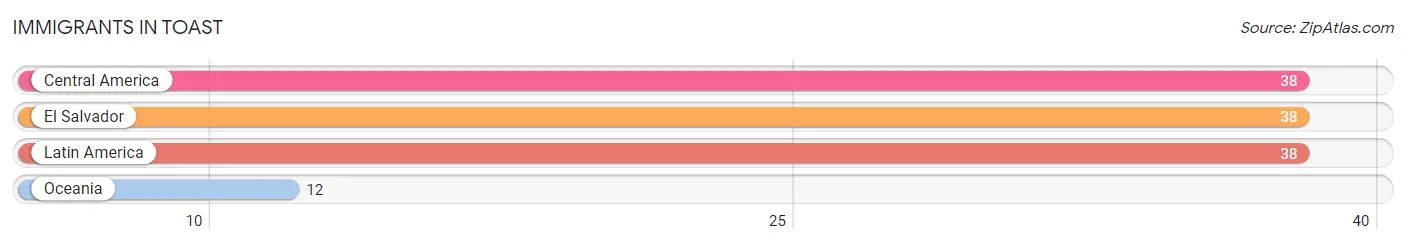
The most numerous immigrant groups reported in Toast came from Central America (38 | 3.1%), El Salvador (38 | 3.1%), Latin America (38 | 3.1%), and Oceania (12 | 1.0%), together accounting for 10.4% of all Toast residents.
| Immigration Origin | # Population | % Population |
| Central America | 38 | 3.1% |
| El Salvador | 38 | 3.1% |
| Latin America | 38 | 3.1% |
| Oceania | 12 | 1.0% | View All 4 Rows |
Sex and Age in Toast
Sex and Age in Toast
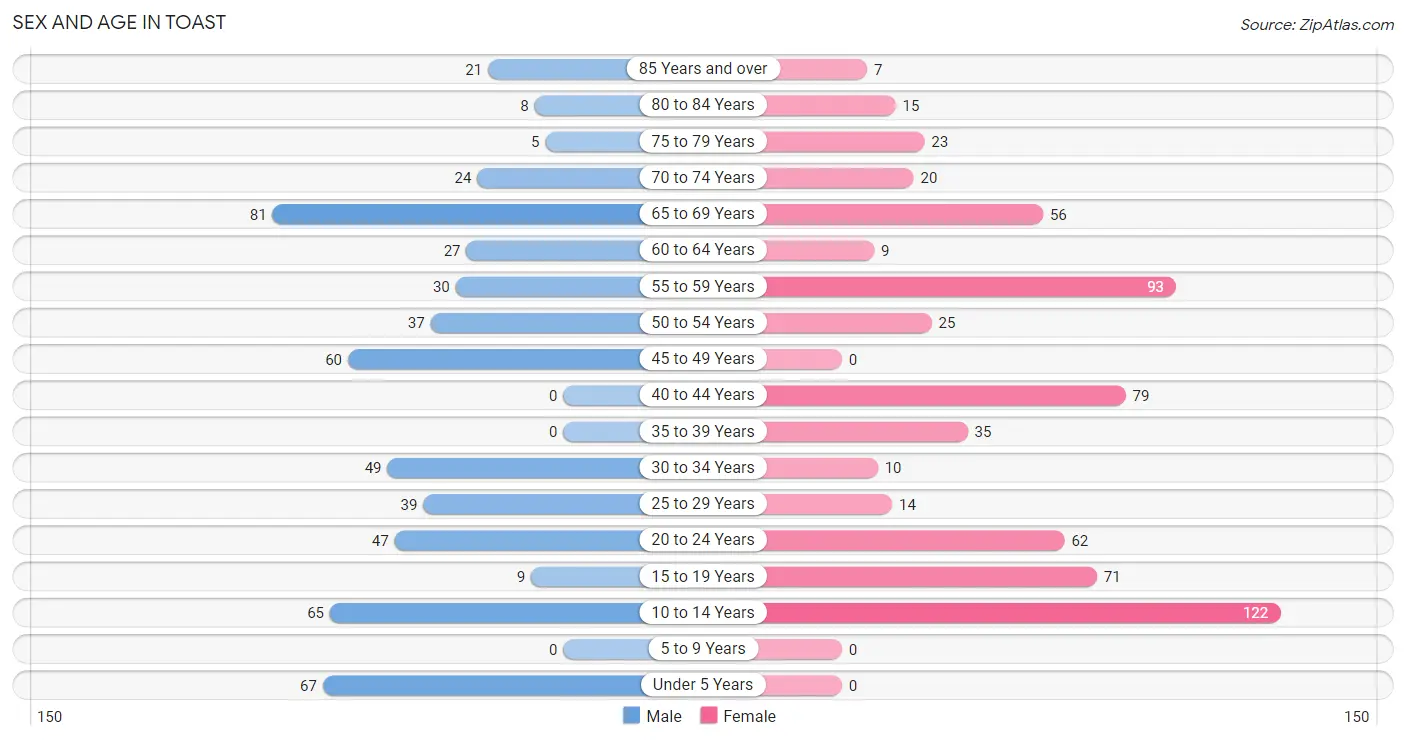
The most populous age groups in Toast are 65 to 69 Years (81 | 14.2%) for men and 10 to 14 Years (122 | 19.0%) for women.
| Age Bracket | Male | Female |
| Under 5 Years | 67 (11.8%) | 0 (0.0%) |
| 5 to 9 Years | 0 (0.0%) | 0 (0.0%) |
| 10 to 14 Years | 65 (11.4%) | 122 (19.0%) |
| 15 to 19 Years | 9 (1.6%) | 71 (11.1%) |
| 20 to 24 Years | 47 (8.3%) | 62 (9.7%) |
| 25 to 29 Years | 39 (6.9%) | 14 (2.2%) |
| 30 to 34 Years | 49 (8.6%) | 10 (1.6%) |
| 35 to 39 Years | 0 (0.0%) | 35 (5.5%) |
| 40 to 44 Years | 0 (0.0%) | 79 (12.3%) |
| 45 to 49 Years | 60 (10.5%) | 0 (0.0%) |
| 50 to 54 Years | 37 (6.5%) | 25 (3.9%) |
| 55 to 59 Years | 30 (5.3%) | 93 (14.5%) |
| 60 to 64 Years | 27 (4.8%) | 9 (1.4%) |
| 65 to 69 Years | 81 (14.2%) | 56 (8.7%) |
| 70 to 74 Years | 24 (4.2%) | 20 (3.1%) |
| 75 to 79 Years | 5 (0.9%) | 23 (3.6%) |
| 80 to 84 Years | 8 (1.4%) | 15 (2.3%) |
| 85 Years and over | 21 (3.7%) | 7 (1.1%) |
| Total | 569 (100.0%) | 641 (100.0%) |
Families and Households in Toast
Median Family Size in Toast
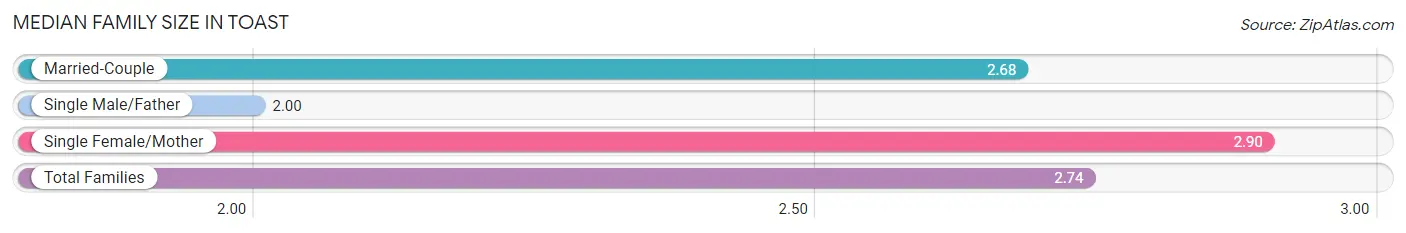
The median family size in Toast is 2.74 persons per family, with single female/mother families (125 | 30.6%) accounting for the largest median family size of 2.9 persons per family. On the other hand, single male/father families (8 | 2.0%) represent the smallest median family size with 2.00 persons per family.
| Family Type | # Families | Family Size |
| Married-Couple | 276 (67.5%) | 2.68 |
| Single Male/Father | 8 (2.0%) | 2.00 |
| Single Female/Mother | 125 (30.6%) | 2.90 |
| Total Families | 409 (100.0%) | 2.74 |
Median Household Size in Toast
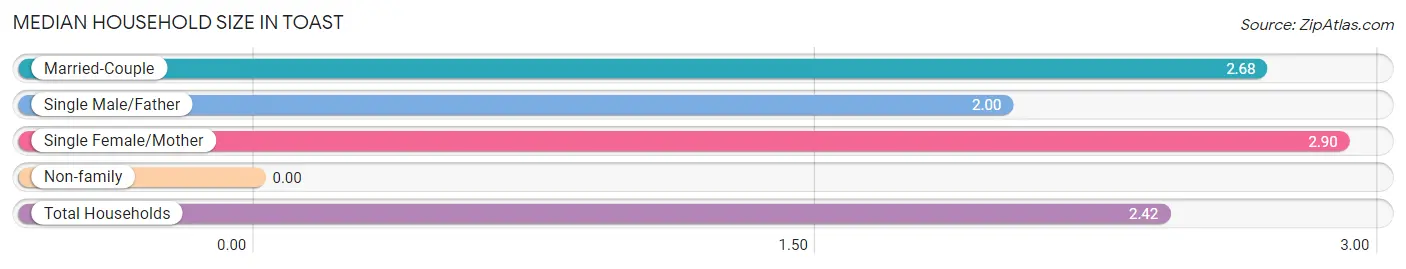
| Household Type | # Households | Household Size |
| Married-Couple | 276 (55.3%) | 2.68 |
| Single Male/Father | 8 (1.6%) | 2.00 |
| Single Female/Mother | 125 (25.1%) | 2.90 |
| Non-family | 90 (18.0%) | - |
| Total Households | 499 (100.0%) | 2.42 |
Household Size by Marriage Status in Toast
Out of a total of 499 households in Toast, 409 (82.0%) are family households, while 90 (18.0%) are nonfamily households. The most numerous type of family households are 2-person households, comprising 277, and the most common type of nonfamily households are 1-person households, comprising 90.
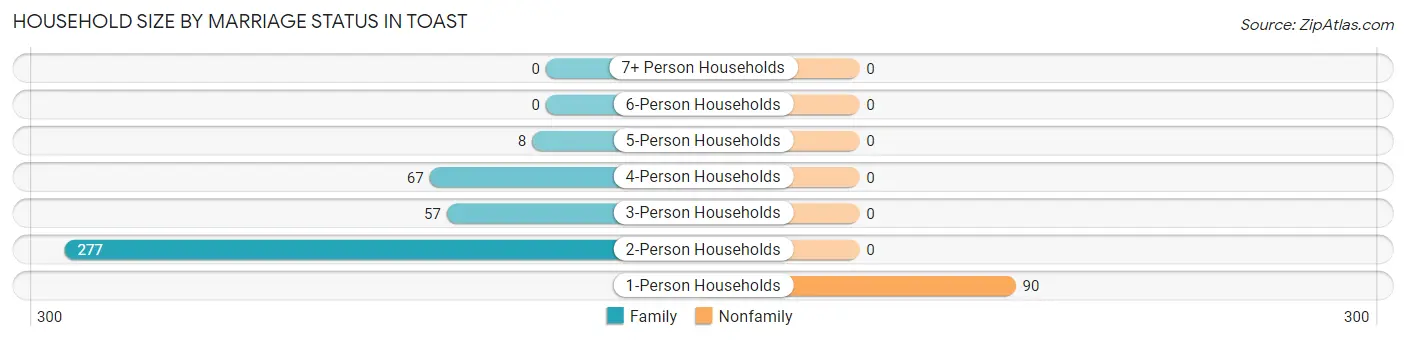
| Household Size | Family Households | Nonfamily Households |
| 1-Person Households | - | 90 (18.0%) |
| 2-Person Households | 277 (55.5%) | 0 (0.0%) |
| 3-Person Households | 57 (11.4%) | 0 (0.0%) |
| 4-Person Households | 67 (13.4%) | 0 (0.0%) |
| 5-Person Households | 8 (1.6%) | 0 (0.0%) |
| 6-Person Households | 0 (0.0%) | 0 (0.0%) |
| 7+ Person Households | 0 (0.0%) | 0 (0.0%) |
| Total | 409 (82.0%) | 90 (18.0%) |
Female Fertility in Toast
Fertility by Age in Toast
| Age Bracket | Women with Births | Births / 1,000 Women |
| 15 to 19 years | 0 (0.0%) | 0.0 |
| 20 to 34 years | 0 (0.0%) | 0.0 |
| 35 to 50 years | 0 (0.0%) | 0.0 |
| Total | 0 (0.0%) | 0.0 |
Fertility by Age by Marriage Status in Toast
| Age Bracket | Married | Unmarried |
| 15 to 19 years | 0 (0.0%) | 0 (0.0%) |
| 20 to 34 years | 0 (0.0%) | 0 (0.0%) |
| 35 to 50 years | 0 (0.0%) | 0 (0.0%) |
| Total | 0 (0.0%) | 0 (0.0%) |
Fertility by Education in Toast
| Educational Attainment | Women with Births | Births / 1,000 Women |
| Less than High School | 0 (0.0%) | 0.0 |
| High School Diploma | 0 (0.0%) | 0.0 |
| College or Associate's Degree | 0 (0.0%) | 0.0 |
| Bachelor's Degree | 0 (0.0%) | 0.0 |
| Graduate Degree | 0 (0.0%) | 0.0 |
| Total | 0 (0.0%) | 0.0 |
Fertility by Education by Marriage Status in Toast
| Educational Attainment | Married | Unmarried |
| Less than High School | 0 (0.0%) | 0 (0.0%) |
| High School Diploma | 0 (0.0%) | 0 (0.0%) |
| College or Associate's Degree | 0 (0.0%) | 0 (0.0%) |
| Bachelor's Degree | 0 (0.0%) | 0 (0.0%) |
| Graduate Degree | 0 (0.0%) | 0 (0.0%) |
| Total | 0 (0.0%) | 0 (0.0%) |
Employment Characteristics in Toast
Employment by Class of Employer in Toast
Among the 522 employed individuals in Toast, private company employees (484 | 92.7%), not-for-profit organizations (16 | 3.1%), and local government employees (12 | 2.3%) make up the most common classes of employment.
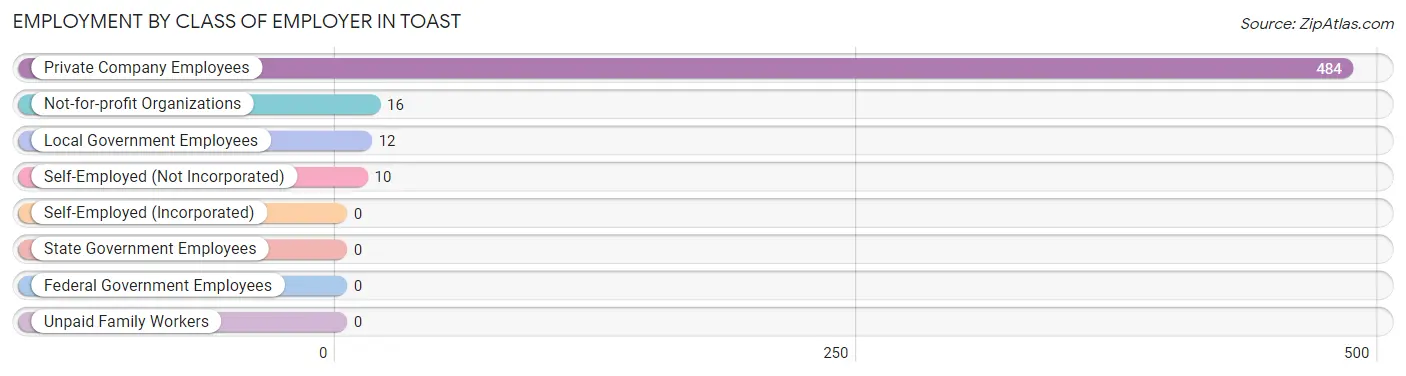
| Employer Class | # Employees | % Employees |
| Private Company Employees | 484 | 92.7% |
| Self-Employed (Incorporated) | 0 | 0.0% |
| Self-Employed (Not Incorporated) | 10 | 1.9% |
| Not-for-profit Organizations | 16 | 3.1% |
| Local Government Employees | 12 | 2.3% |
| State Government Employees | 0 | 0.0% |
| Federal Government Employees | 0 | 0.0% |
| Unpaid Family Workers | 0 | 0.0% |
| Total | 522 | 100.0% |
Employment Status by Age in Toast
According to the labor force statistics for Toast, out of the total population over 16 years of age (909), 67.0% or 609 individuals are in the labor force, with 8.0% or 49 of them unemployed. The age group with the highest labor force participation rate is 16 to 19 years, with 100.0% or 33 individuals in the labor force. Within the labor force, the 20 to 24 years age range has the highest percentage of unemployed individuals, with 32.1% or 35 of them being unemployed.
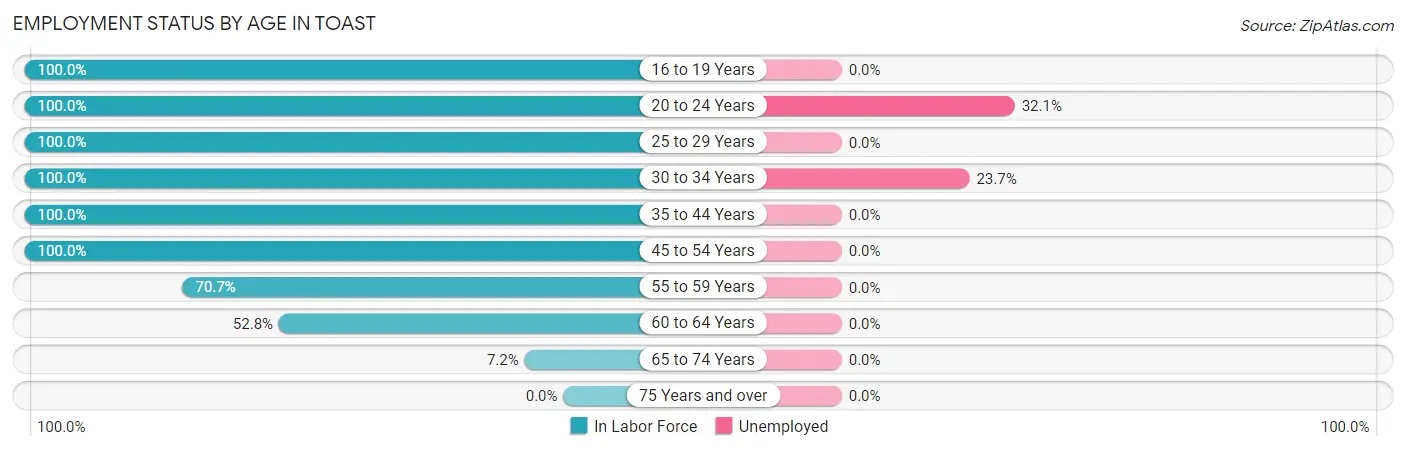
| Age Bracket | In Labor Force | Unemployed |
| 16 to 19 Years | 33 (100.0%) | 0 (0.0%) |
| 20 to 24 Years | 109 (100.0%) | 35 (32.1%) |
| 25 to 29 Years | 53 (100.0%) | 0 (0.0%) |
| 30 to 34 Years | 59 (100.0%) | 14 (23.7%) |
| 35 to 44 Years | 114 (100.0%) | 0 (0.0%) |
| 45 to 54 Years | 122 (100.0%) | 0 (0.0%) |
| 55 to 59 Years | 87 (70.7%) | 0 (0.0%) |
| 60 to 64 Years | 19 (52.8%) | 0 (0.0%) |
| 65 to 74 Years | 13 (7.2%) | 0 (0.0%) |
| 75 Years and over | 0 (0.0%) | 0 (0.0%) |
| Total | 609 (67.0%) | 49 (8.0%) |
Employment Status by Educational Attainment in Toast
According to labor force statistics for Toast, 89.5% of individuals (454) out of the total population between 25 and 64 years of age (507) are in the labor force, with 3.1% or 14 of them being unemployed. The group with the highest labor force participation rate are those with the educational attainment of less than high school, with 100.0% or 10 individuals in the labor force. Within the labor force, individuals with college / associate degree education have the highest percentage of unemployment, with 6.2% or 14 of them being unemployed.
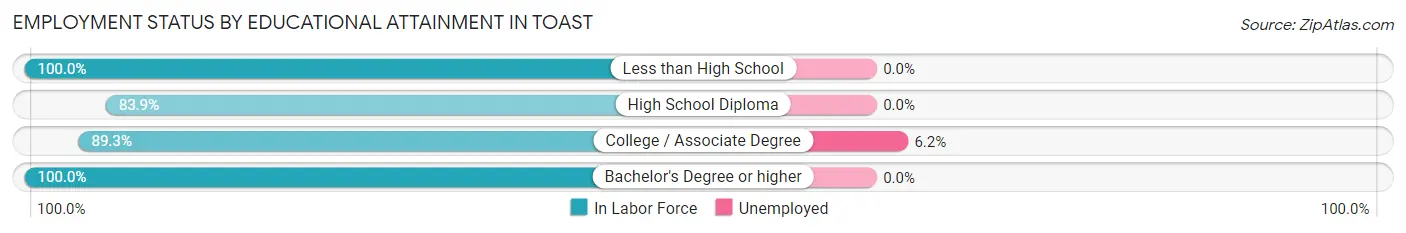
| Educational Attainment | In Labor Force | Unemployed |
| Less than High School | 10 (100.0%) | 0 (0.0%) |
| High School Diploma | 135 (83.9%) | 0 (0.0%) |
| College / Associate Degree | 225 (89.3%) | 16 (6.2%) |
| Bachelor's Degree or higher | 84 (100.0%) | 0 (0.0%) |
| Total | 454 (89.5%) | 16 (3.1%) |
Employment Occupations by Sex in Toast
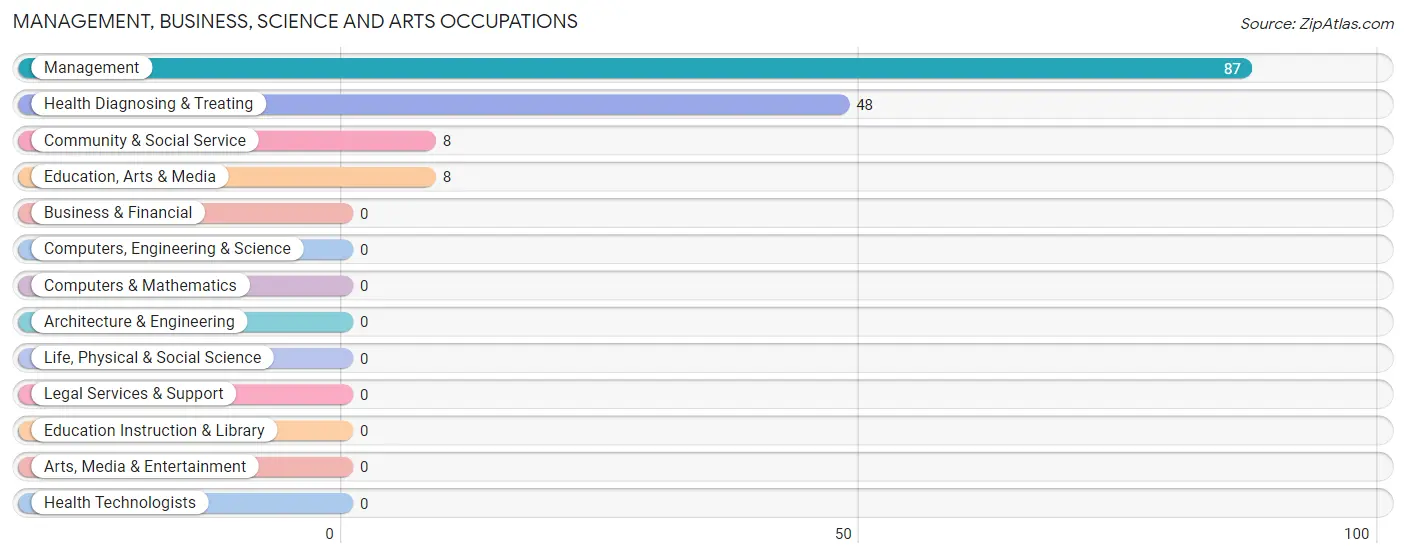
Management, Business, Science and Arts Occupations
The most common Management, Business, Science and Arts occupations in Toast are Management (87 | 15.5%), Health Diagnosing & Treating (48 | 8.6%), Community & Social Service (8 | 1.4%), and Education, Arts & Media (8 | 1.4%).
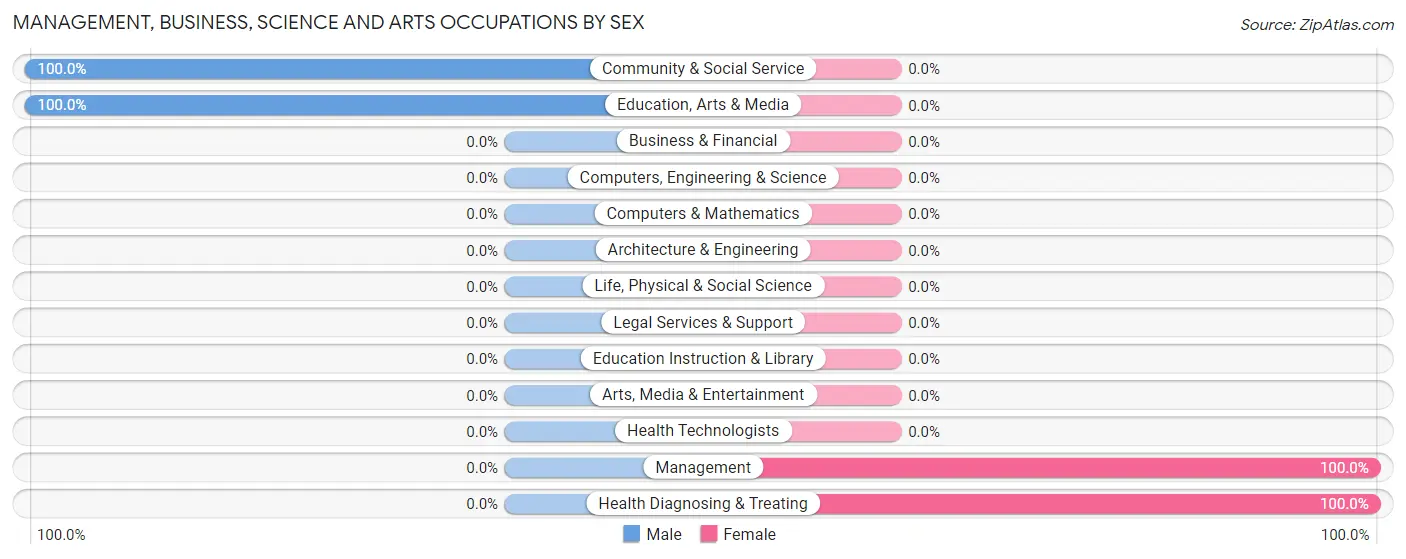
Management, Business, Science and Arts Occupations by Sex
Within the Management, Business, Science and Arts occupations in Toast, the most male-oriented occupations are Community & Social Service (100.0%), and Education, Arts & Media (100.0%), while the most female-oriented occupations are Management (100.0%), and Health Diagnosing & Treating (100.0%).
| Occupation | Male | Female |
| Management | 0 (0.0%) | 87 (100.0%) |
| Business & Financial | 0 (0.0%) | 0 (0.0%) |
| Computers, Engineering & Science | 0 (0.0%) | 0 (0.0%) |
| Computers & Mathematics | 0 (0.0%) | 0 (0.0%) |
| Architecture & Engineering | 0 (0.0%) | 0 (0.0%) |
| Life, Physical & Social Science | 0 (0.0%) | 0 (0.0%) |
| Community & Social Service | 8 (100.0%) | 0 (0.0%) |
| Education, Arts & Media | 8 (100.0%) | 0 (0.0%) |
| Legal Services & Support | 0 (0.0%) | 0 (0.0%) |
| Education Instruction & Library | 0 (0.0%) | 0 (0.0%) |
| Arts, Media & Entertainment | 0 (0.0%) | 0 (0.0%) |
| Health Diagnosing & Treating | 0 (0.0%) | 48 (100.0%) |
| Health Technologists | 0 (0.0%) | 0 (0.0%) |
| Total (Category) | 8 (5.6%) | 135 (94.4%) |
| Total (Overall) | 213 (38.0%) | 347 (62.0%) |
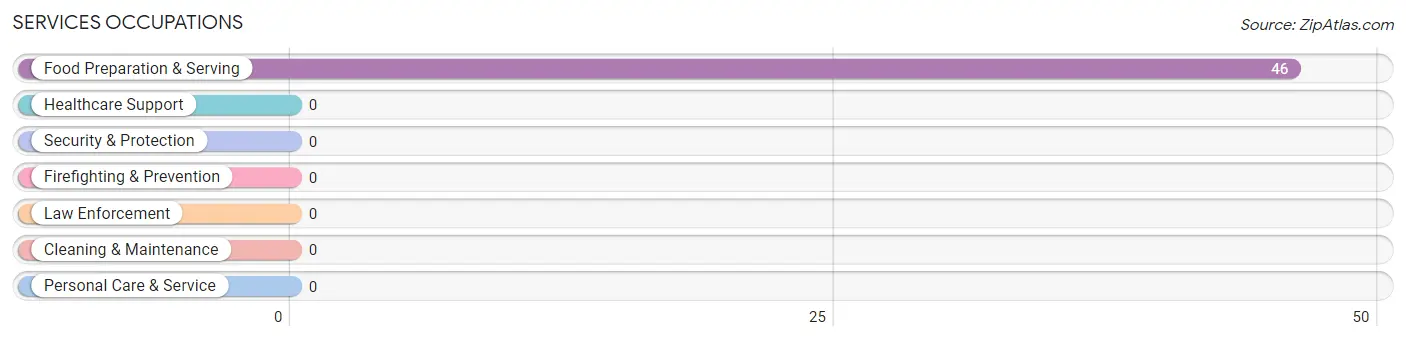
Services Occupations
The most common Services occupations in Toast are , and Food Preparation & Serving (46 | 8.2%).
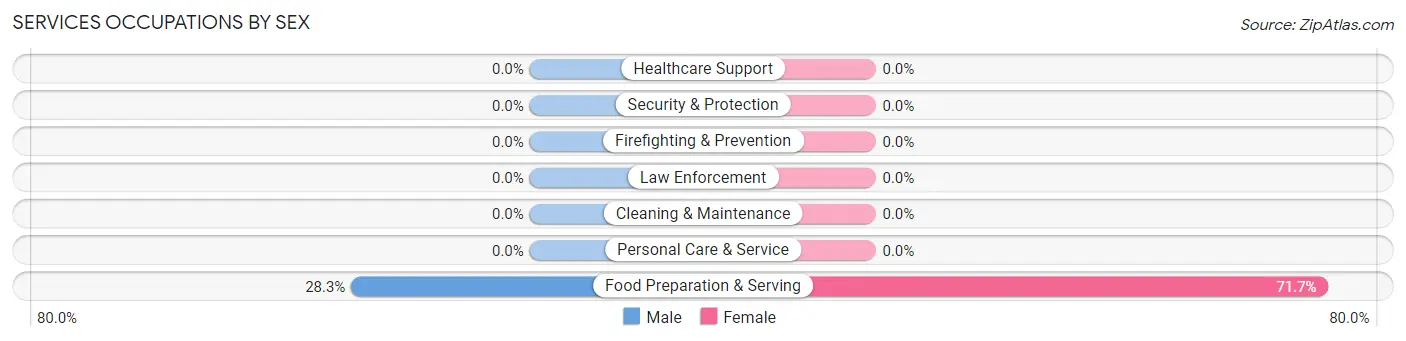
Services Occupations by Sex
| Occupation | Male | Female |
| Healthcare Support | 0 (0.0%) | 0 (0.0%) |
| Security & Protection | 0 (0.0%) | 0 (0.0%) |
| Firefighting & Prevention | 0 (0.0%) | 0 (0.0%) |
| Law Enforcement | 0 (0.0%) | 0 (0.0%) |
| Food Preparation & Serving | 13 (28.3%) | 33 (71.7%) |
| Cleaning & Maintenance | 0 (0.0%) | 0 (0.0%) |
| Personal Care & Service | 0 (0.0%) | 0 (0.0%) |
| Total (Category) | 13 (28.3%) | 33 (71.7%) |
| Total (Overall) | 213 (38.0%) | 347 (62.0%) |
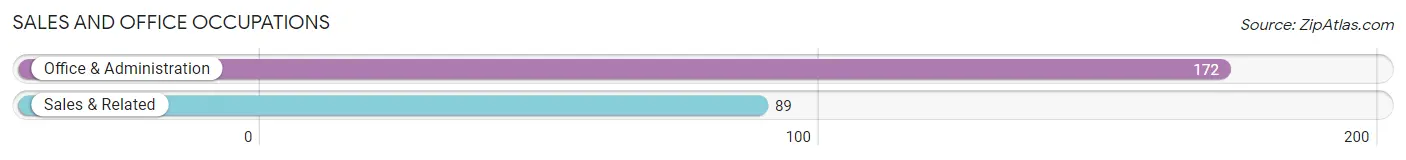
Sales and Office Occupations
The most common Sales and Office occupations in Toast are Office & Administration (172 | 30.7%), and Sales & Related (89 | 15.9%).
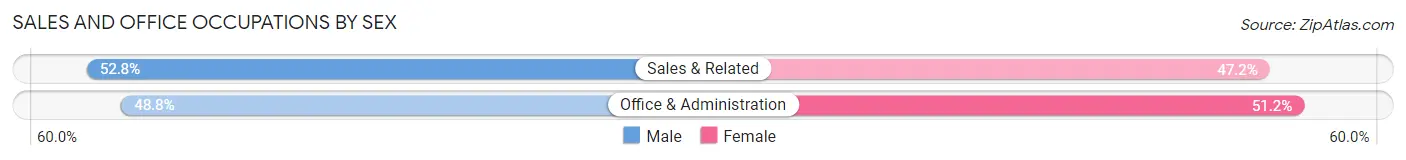
Sales and Office Occupations by Sex
| Occupation | Male | Female |
| Sales & Related | 47 (52.8%) | 42 (47.2%) |
| Office & Administration | 84 (48.8%) | 88 (51.2%) |
| Total (Category) | 131 (50.2%) | 130 (49.8%) |
| Total (Overall) | 213 (38.0%) | 347 (62.0%) |
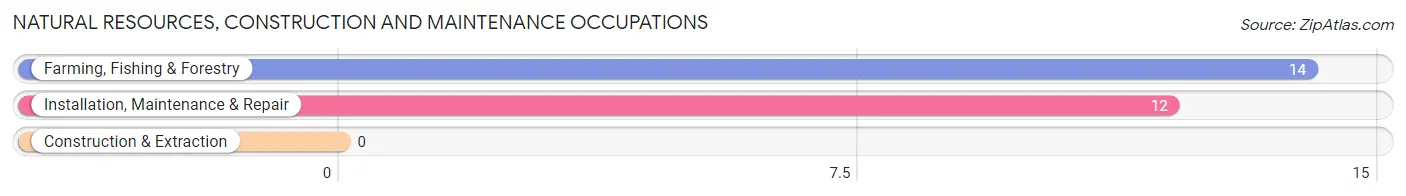
Natural Resources, Construction and Maintenance Occupations
The most common Natural Resources, Construction and Maintenance occupations in Toast are Farming, Fishing & Forestry (14 | 2.5%), and Installation, Maintenance & Repair (12 | 2.1%).
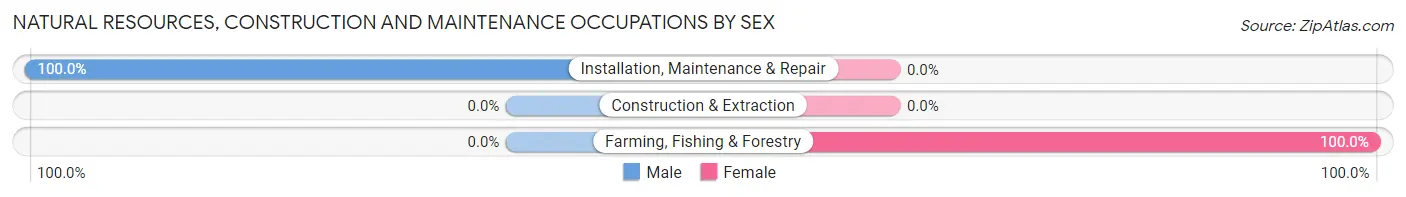
Natural Resources, Construction and Maintenance Occupations by Sex
| Occupation | Male | Female |
| Farming, Fishing & Forestry | 0 (0.0%) | 14 (100.0%) |
| Construction & Extraction | 0 (0.0%) | 0 (0.0%) |
| Installation, Maintenance & Repair | 12 (100.0%) | 0 (0.0%) |
| Total (Category) | 12 (46.2%) | 14 (53.8%) |
| Total (Overall) | 213 (38.0%) | 347 (62.0%) |
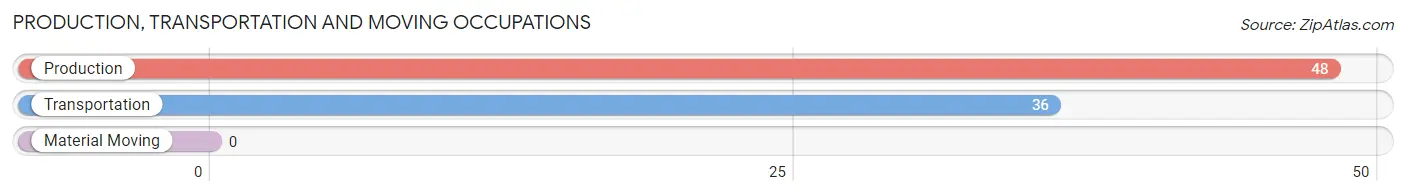
Production, Transportation and Moving Occupations
The most common Production, Transportation and Moving occupations in Toast are Production (48 | 8.6%), and Transportation (36 | 6.4%).
Production, Transportation and Moving Occupations by Sex
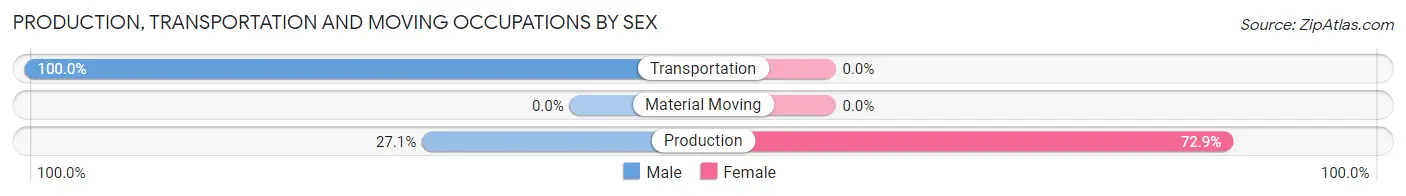
| Occupation | Male | Female |
| Production | 13 (27.1%) | 35 (72.9%) |
| Transportation | 36 (100.0%) | 0 (0.0%) |
| Material Moving | 0 (0.0%) | 0 (0.0%) |
| Total (Category) | 49 (58.3%) | 35 (41.7%) |
| Total (Overall) | 213 (38.0%) | 347 (62.0%) |
Employment Industries by Sex in Toast
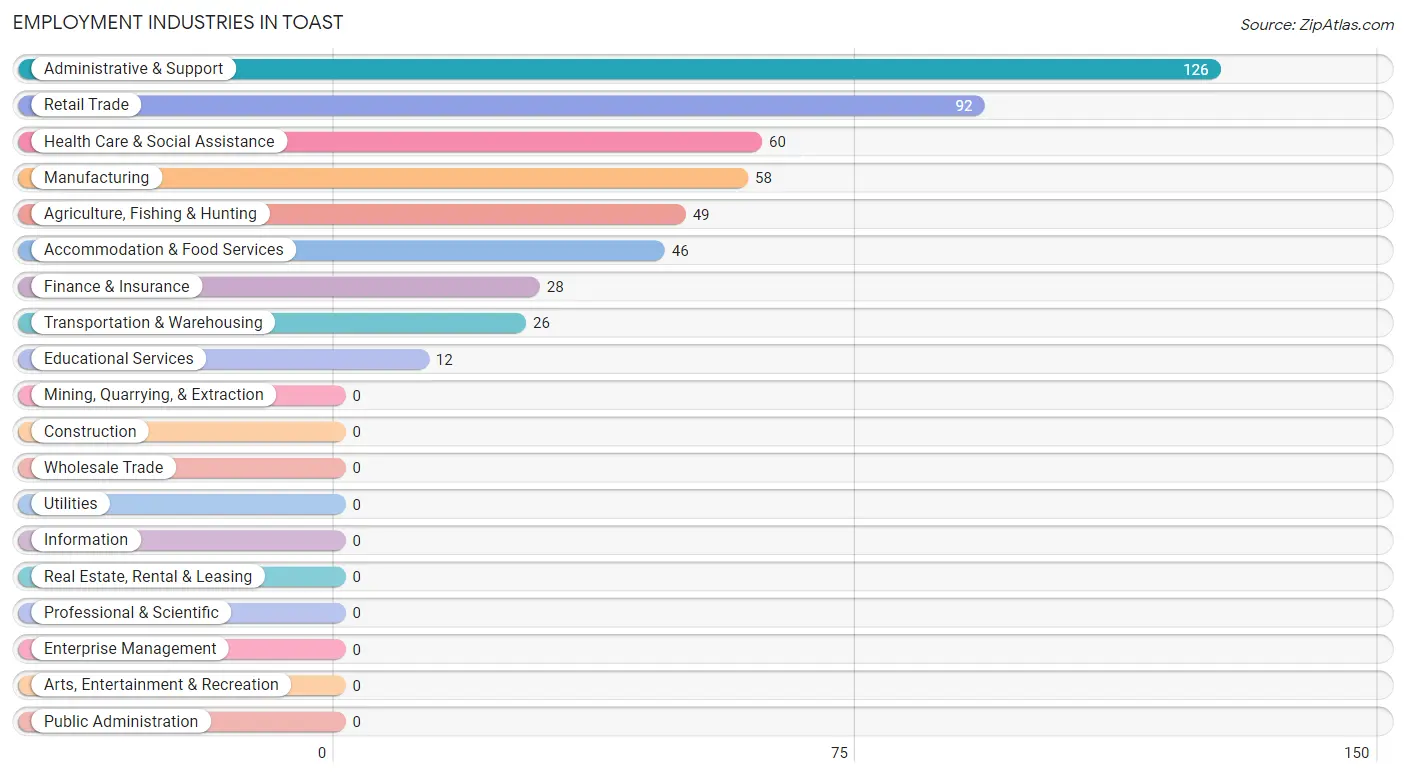
Employment Industries in Toast
The major employment industries in Toast include Administrative & Support (126 | 22.5%), Retail Trade (92 | 16.4%), Health Care & Social Assistance (60 | 10.7%), Manufacturing (58 | 10.4%), and Agriculture, Fishing & Hunting (49 | 8.7%).
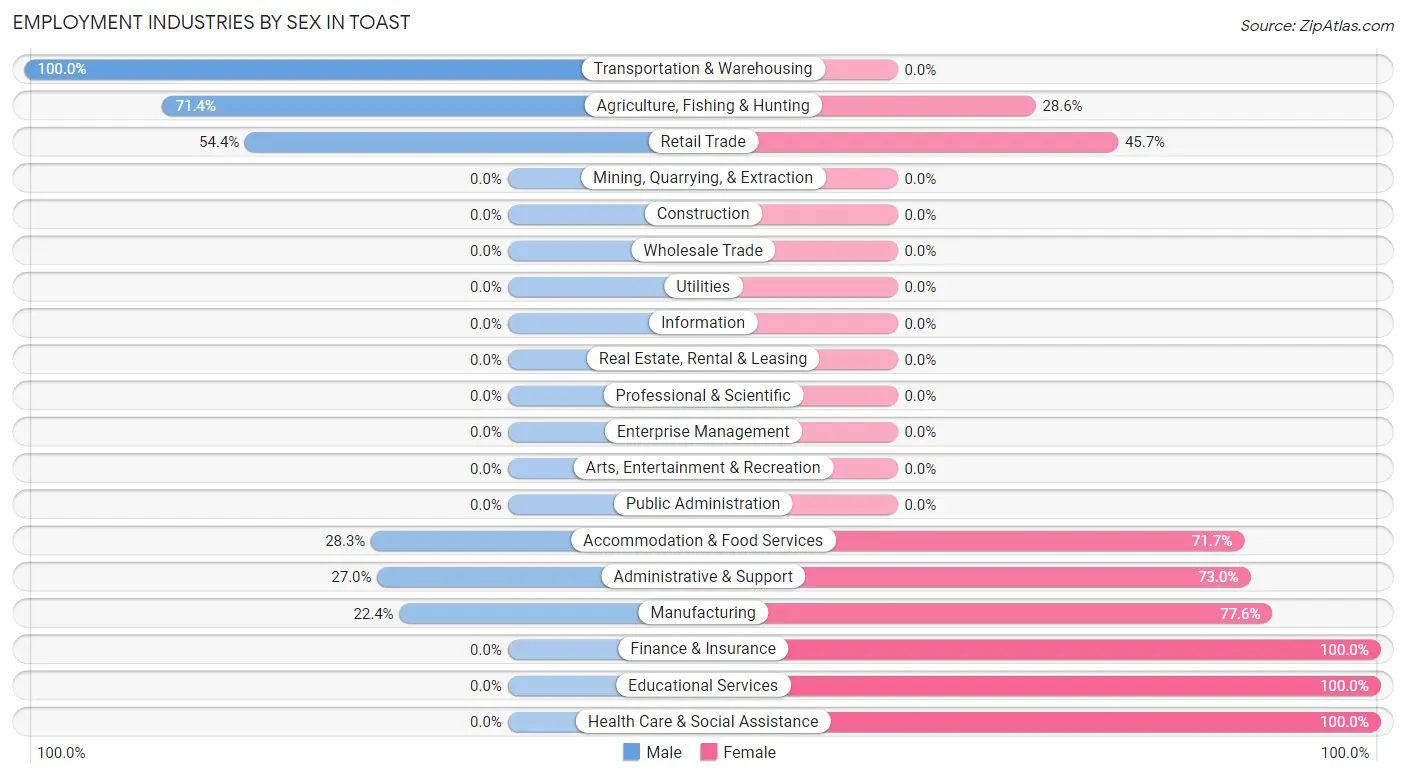
Employment Industries by Sex in Toast
The Toast industries that see more men than women are Transportation & Warehousing (100.0%), Agriculture, Fishing & Hunting (71.4%), and Retail Trade (54.3%), whereas the industries that tend to have a higher number of women are Finance & Insurance (100.0%), Educational Services (100.0%), and Health Care & Social Assistance (100.0%).
| Industry | Male | Female |
| Agriculture, Fishing & Hunting | 35 (71.4%) | 14 (28.6%) |
| Mining, Quarrying, & Extraction | 0 (0.0%) | 0 (0.0%) |
| Construction | 0 (0.0%) | 0 (0.0%) |
| Manufacturing | 13 (22.4%) | 45 (77.6%) |
| Wholesale Trade | 0 (0.0%) | 0 (0.0%) |
| Retail Trade | 50 (54.3%) | 42 (45.7%) |
| Transportation & Warehousing | 26 (100.0%) | 0 (0.0%) |
| Utilities | 0 (0.0%) | 0 (0.0%) |
| Information | 0 (0.0%) | 0 (0.0%) |
| Finance & Insurance | 0 (0.0%) | 28 (100.0%) |
| Real Estate, Rental & Leasing | 0 (0.0%) | 0 (0.0%) |
| Professional & Scientific | 0 (0.0%) | 0 (0.0%) |
| Enterprise Management | 0 (0.0%) | 0 (0.0%) |
| Administrative & Support | 34 (27.0%) | 92 (73.0%) |
| Educational Services | 0 (0.0%) | 12 (100.0%) |
| Health Care & Social Assistance | 0 (0.0%) | 60 (100.0%) |
| Arts, Entertainment & Recreation | 0 (0.0%) | 0 (0.0%) |
| Accommodation & Food Services | 13 (28.3%) | 33 (71.7%) |
| Public Administration | 0 (0.0%) | 0 (0.0%) |
| Total | 213 (38.0%) | 347 (62.0%) |
Education in Toast
School Enrollment in Toast
The most common levels of schooling among the 252 students in Toast are middle school (112 | 44.4%), elementary school (64 | 25.4%), and high school (58 | 23.0%).
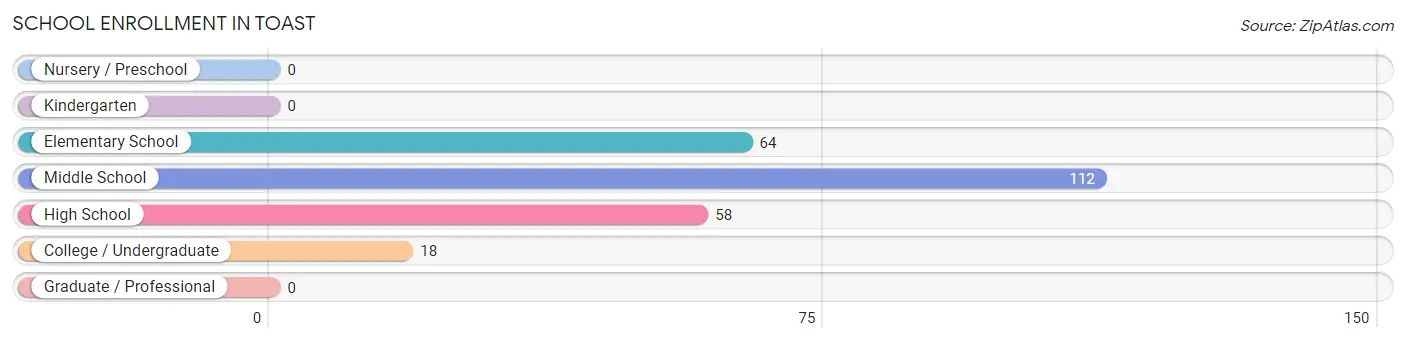
| School Level | # Students | % Students |
| Nursery / Preschool | 0 | 0.0% |
| Kindergarten | 0 | 0.0% |
| Elementary School | 64 | 25.4% |
| Middle School | 112 | 44.4% |
| High School | 58 | 23.0% |
| College / Undergraduate | 18 | 7.1% |
| Graduate / Professional | 0 | 0.0% |
| Total | 252 | 100.0% |
School Enrollment by Age by Funding Source in Toast
Out of a total of 252 students who are enrolled in schools in Toast, 133 (52.8%) attend a private institution, while the remaining 119 (47.2%) are enrolled in public schools. The age group of 10 to 14 year olds has the highest likelihood of being enrolled in private schools, with 133 (71.1% in the age bracket) enrolled. Conversely, the age group of 15 to 17 year olds has the lowest likelihood of being enrolled in a private school, with 47 (100.0% in the age bracket) attending a public institution.
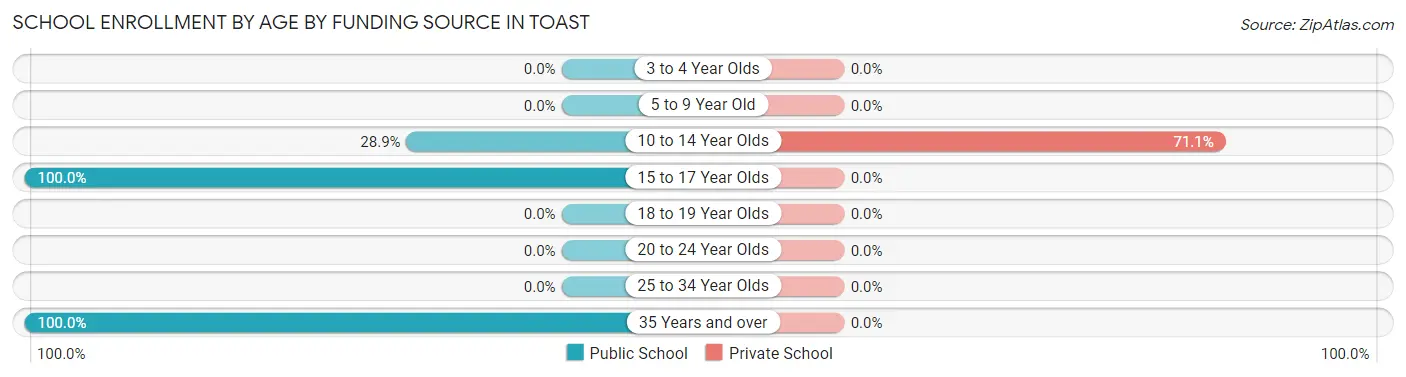
| Age Bracket | Public School | Private School |
| 3 to 4 Year Olds | 0 (0.0%) | 0 (0.0%) |
| 5 to 9 Year Old | 0 (0.0%) | 0 (0.0%) |
| 10 to 14 Year Olds | 54 (28.9%) | 133 (71.1%) |
| 15 to 17 Year Olds | 47 (100.0%) | 0 (0.0%) |
| 18 to 19 Year Olds | 0 (0.0%) | 0 (0.0%) |
| 20 to 24 Year Olds | 0 (0.0%) | 0 (0.0%) |
| 25 to 34 Year Olds | 0 (0.0%) | 0 (0.0%) |
| 35 Years and over | 18 (100.0%) | 0 (0.0%) |
| Total | 119 (47.2%) | 133 (52.8%) |
Educational Attainment by Field of Study in Toast
Business (49 | 58.3%), and bio, nature & agricultural (35 | 41.7%) are the most common fields of study among 84 individuals in Toast who have obtained a bachelor's degree or higher.
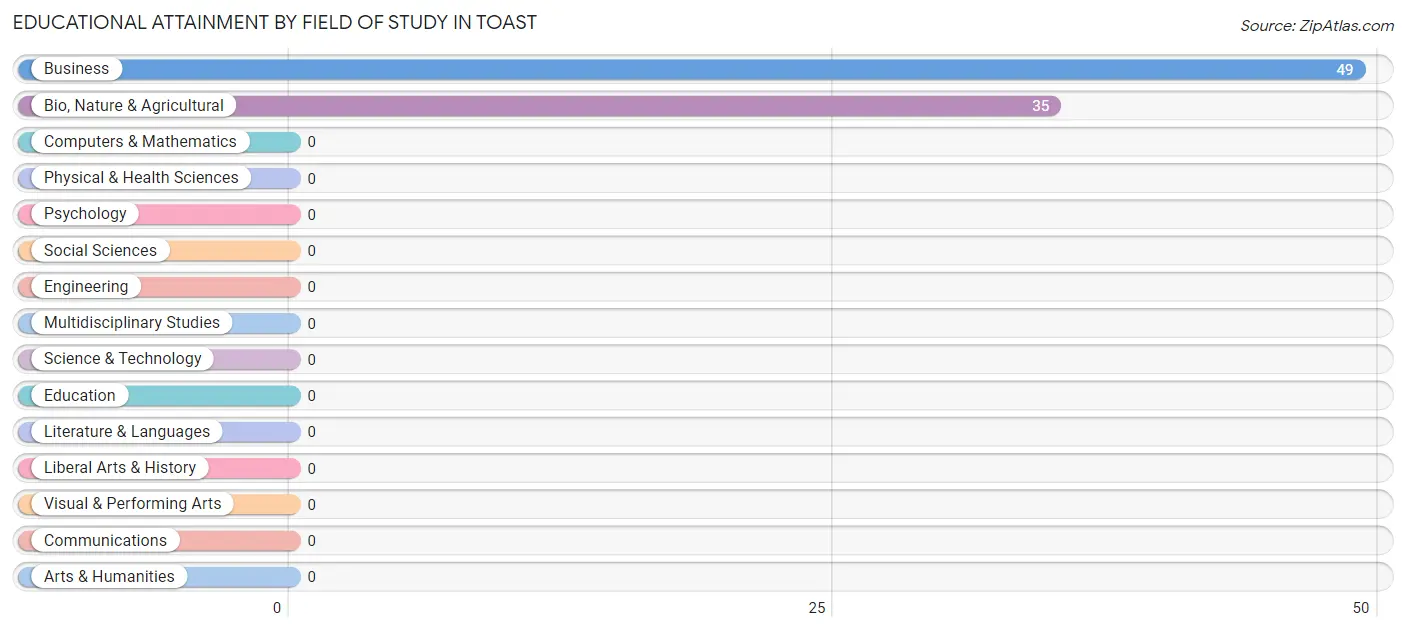
| Field of Study | # Graduates | % Graduates |
| Computers & Mathematics | 0 | 0.0% |
| Bio, Nature & Agricultural | 35 | 41.7% |
| Physical & Health Sciences | 0 | 0.0% |
| Psychology | 0 | 0.0% |
| Social Sciences | 0 | 0.0% |
| Engineering | 0 | 0.0% |
| Multidisciplinary Studies | 0 | 0.0% |
| Science & Technology | 0 | 0.0% |
| Business | 49 | 58.3% |
| Education | 0 | 0.0% |
| Literature & Languages | 0 | 0.0% |
| Liberal Arts & History | 0 | 0.0% |
| Visual & Performing Arts | 0 | 0.0% |
| Communications | 0 | 0.0% |
| Arts & Humanities | 0 | 0.0% |
| Total | 84 | 100.0% |
Transportation & Commute in Toast
Vehicle Availability by Sex in Toast
The most prevalent vehicle ownership categories in Toast are males with 1 vehicle (60, accounting for 34.3%) and females with 1 vehicle (55, making up 17.3%).
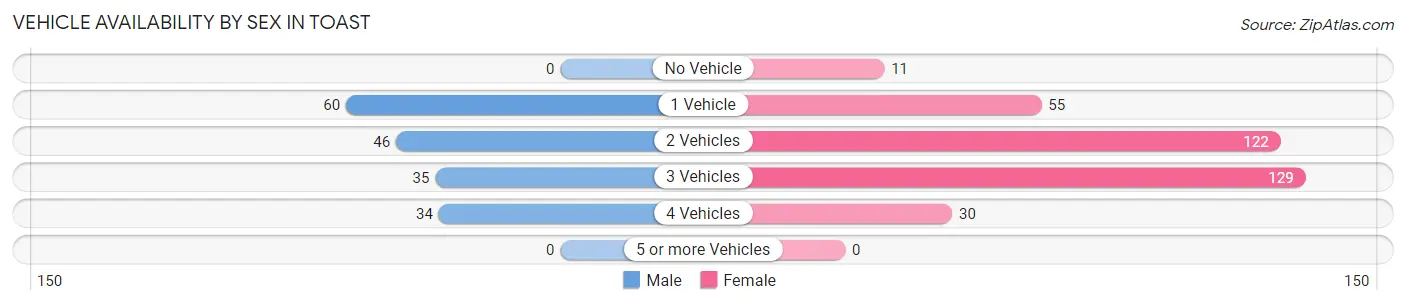
| Vehicles Available | Male | Female |
| No Vehicle | 0 (0.0%) | 11 (3.2%) |
| 1 Vehicle | 60 (34.3%) | 55 (15.9%) |
| 2 Vehicles | 46 (26.3%) | 122 (35.2%) |
| 3 Vehicles | 35 (20.0%) | 129 (37.2%) |
| 4 Vehicles | 34 (19.4%) | 30 (8.6%) |
| 5 or more Vehicles | 0 (0.0%) | 0 (0.0%) |
| Total | 175 (100.0%) | 347 (100.0%) |
Commute Time in Toast
The most frequently occuring commute durations in Toast are 5 to 9 minutes (199 commuters, 43.3%), 10 to 14 minutes (86 commuters, 18.7%), and 15 to 19 minutes (42 commuters, 9.1%).
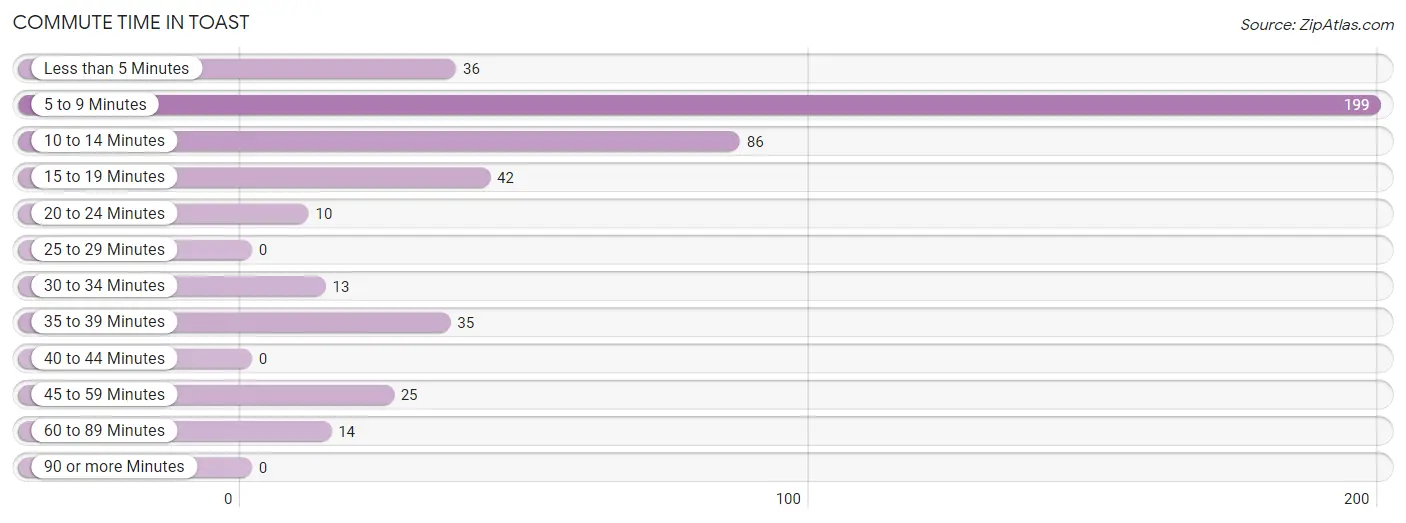
| Commute Time | # Commuters | % Commuters |
| Less than 5 Minutes | 36 | 7.8% |
| 5 to 9 Minutes | 199 | 43.3% |
| 10 to 14 Minutes | 86 | 18.7% |
| 15 to 19 Minutes | 42 | 9.1% |
| 20 to 24 Minutes | 10 | 2.2% |
| 25 to 29 Minutes | 0 | 0.0% |
| 30 to 34 Minutes | 13 | 2.8% |
| 35 to 39 Minutes | 35 | 7.6% |
| 40 to 44 Minutes | 0 | 0.0% |
| 45 to 59 Minutes | 25 | 5.4% |
| 60 to 89 Minutes | 14 | 3.0% |
| 90 or more Minutes | 0 | 0.0% |
Commute Time by Sex in Toast
The most common commute times in Toast are 5 to 9 minutes (81 commuters, 46.3%) for males and 5 to 9 minutes (118 commuters, 41.4%) for females.
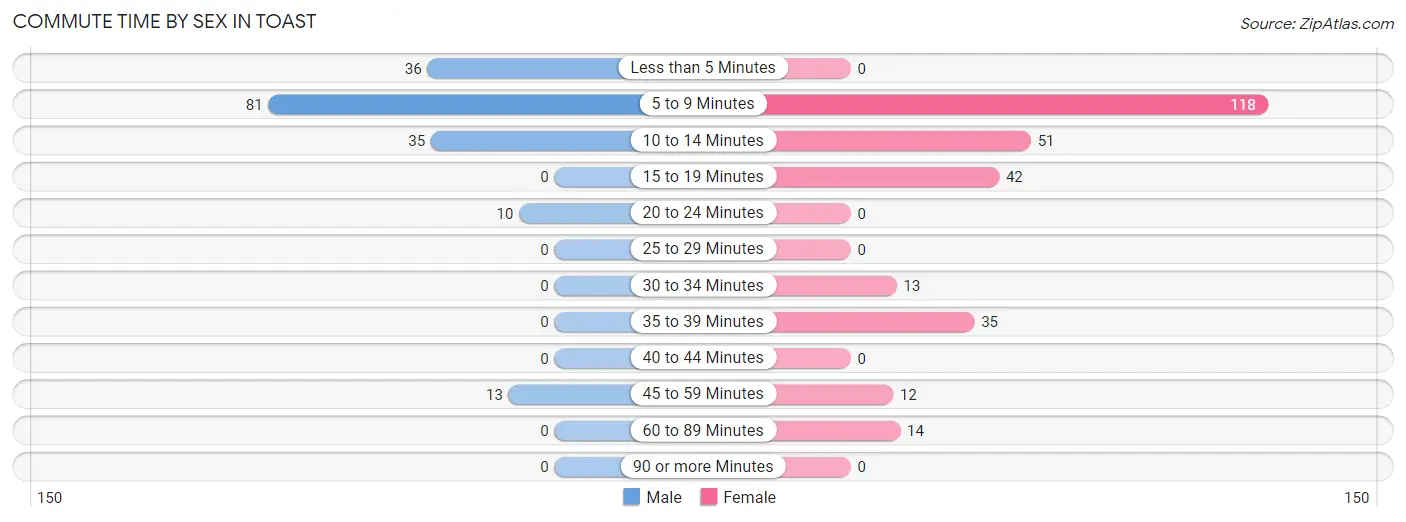
| Commute Time | Male | Female |
| Less than 5 Minutes | 36 (20.6%) | 0 (0.0%) |
| 5 to 9 Minutes | 81 (46.3%) | 118 (41.4%) |
| 10 to 14 Minutes | 35 (20.0%) | 51 (17.9%) |
| 15 to 19 Minutes | 0 (0.0%) | 42 (14.7%) |
| 20 to 24 Minutes | 10 (5.7%) | 0 (0.0%) |
| 25 to 29 Minutes | 0 (0.0%) | 0 (0.0%) |
| 30 to 34 Minutes | 0 (0.0%) | 13 (4.6%) |
| 35 to 39 Minutes | 0 (0.0%) | 35 (12.3%) |
| 40 to 44 Minutes | 0 (0.0%) | 0 (0.0%) |
| 45 to 59 Minutes | 13 (7.4%) | 12 (4.2%) |
| 60 to 89 Minutes | 0 (0.0%) | 14 (4.9%) |
| 90 or more Minutes | 0 (0.0%) | 0 (0.0%) |
Time of Departure to Work by Sex in Toast
The most frequent times of departure to work in Toast are 7:00 AM to 7:29 AM (81, 46.3%) for males and 9:00 AM to 9:59 AM (93, 32.6%) for females.
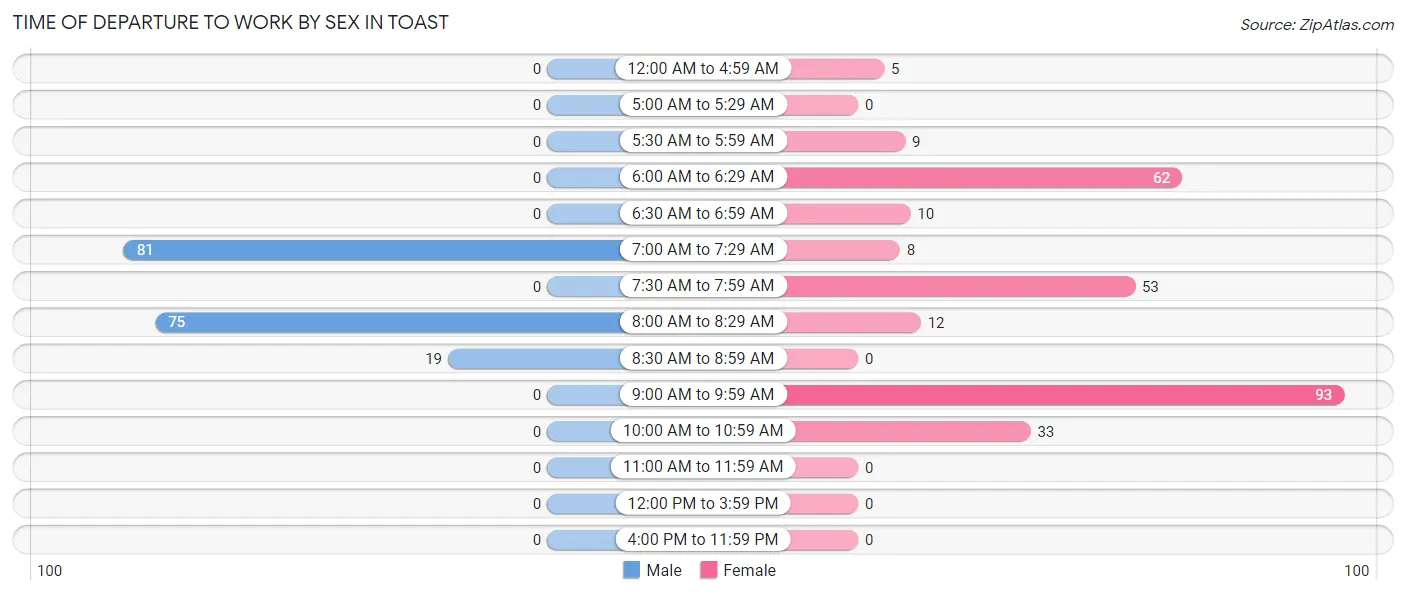
| Time of Departure | Male | Female |
| 12:00 AM to 4:59 AM | 0 (0.0%) | 5 (1.8%) |
| 5:00 AM to 5:29 AM | 0 (0.0%) | 0 (0.0%) |
| 5:30 AM to 5:59 AM | 0 (0.0%) | 9 (3.2%) |
| 6:00 AM to 6:29 AM | 0 (0.0%) | 62 (21.7%) |
| 6:30 AM to 6:59 AM | 0 (0.0%) | 10 (3.5%) |
| 7:00 AM to 7:29 AM | 81 (46.3%) | 8 (2.8%) |
| 7:30 AM to 7:59 AM | 0 (0.0%) | 53 (18.6%) |
| 8:00 AM to 8:29 AM | 75 (42.9%) | 12 (4.2%) |
| 8:30 AM to 8:59 AM | 19 (10.9%) | 0 (0.0%) |
| 9:00 AM to 9:59 AM | 0 (0.0%) | 93 (32.6%) |
| 10:00 AM to 10:59 AM | 0 (0.0%) | 33 (11.6%) |
| 11:00 AM to 11:59 AM | 0 (0.0%) | 0 (0.0%) |
| 12:00 PM to 3:59 PM | 0 (0.0%) | 0 (0.0%) |
| 4:00 PM to 11:59 PM | 0 (0.0%) | 0 (0.0%) |
| Total | 175 (100.0%) | 285 (100.0%) |
Housing Occupancy in Toast
Occupancy by Ownership in Toast
Of the total 499 dwellings in Toast, owner-occupied units account for 373 (74.8%), while renter-occupied units make up 126 (25.3%).
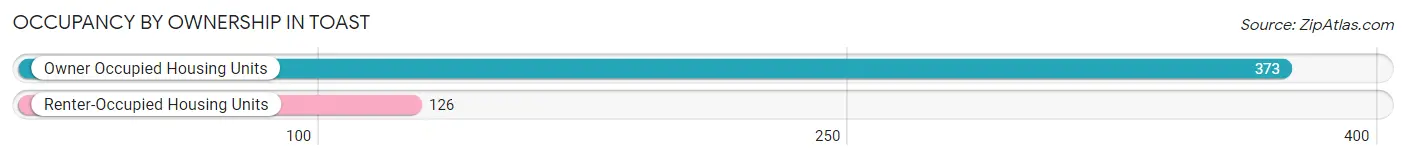
| Occupancy | # Housing Units | % Housing Units |
| Owner Occupied Housing Units | 373 | 74.8% |
| Renter-Occupied Housing Units | 126 | 25.3% |
| Total Occupied Housing Units | 499 | 100.0% |
Occupancy by Household Size in Toast
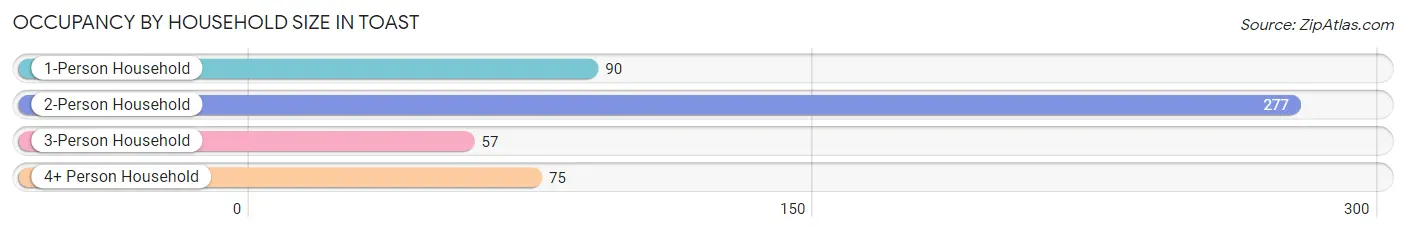
| Household Size | # Housing Units | % Housing Units |
| 1-Person Household | 90 | 18.0% |
| 2-Person Household | 277 | 55.5% |
| 3-Person Household | 57 | 11.4% |
| 4+ Person Household | 75 | 15.0% |
| Total Housing Units | 499 | 100.0% |
Occupancy by Ownership by Household Size in Toast
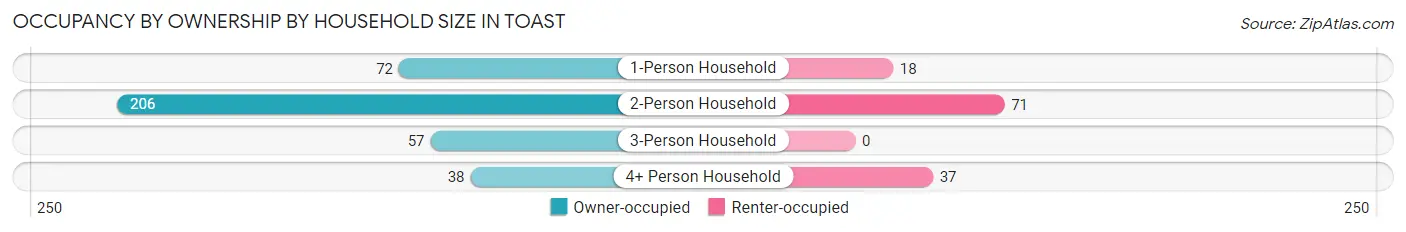
| Household Size | Owner-occupied | Renter-occupied |
| 1-Person Household | 72 (80.0%) | 18 (20.0%) |
| 2-Person Household | 206 (74.4%) | 71 (25.6%) |
| 3-Person Household | 57 (100.0%) | 0 (0.0%) |
| 4+ Person Household | 38 (50.7%) | 37 (49.3%) |
| Total Housing Units | 373 (74.8%) | 126 (25.3%) |
Occupancy by Educational Attainment in Toast
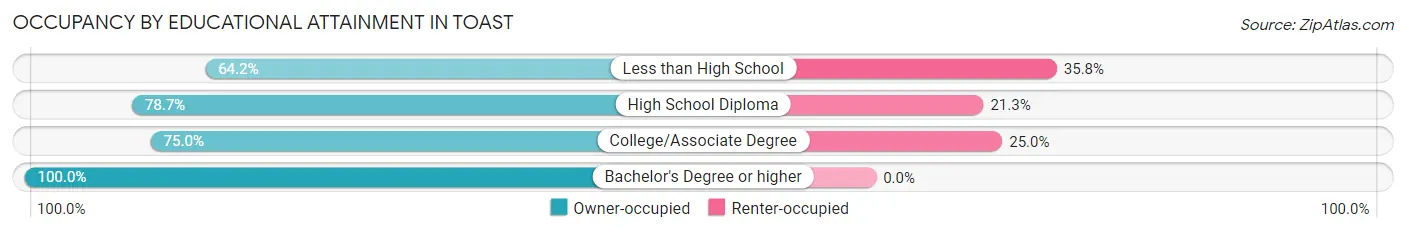
| Household Size | Owner-occupied | Renter-occupied |
| Less than High School | 43 (64.2%) | 24 (35.8%) |
| High School Diploma | 111 (78.7%) | 30 (21.3%) |
| College/Associate Degree | 216 (75.0%) | 72 (25.0%) |
| Bachelor's Degree or higher | 3 (100.0%) | 0 (0.0%) |
Occupancy by Age of Householder in Toast
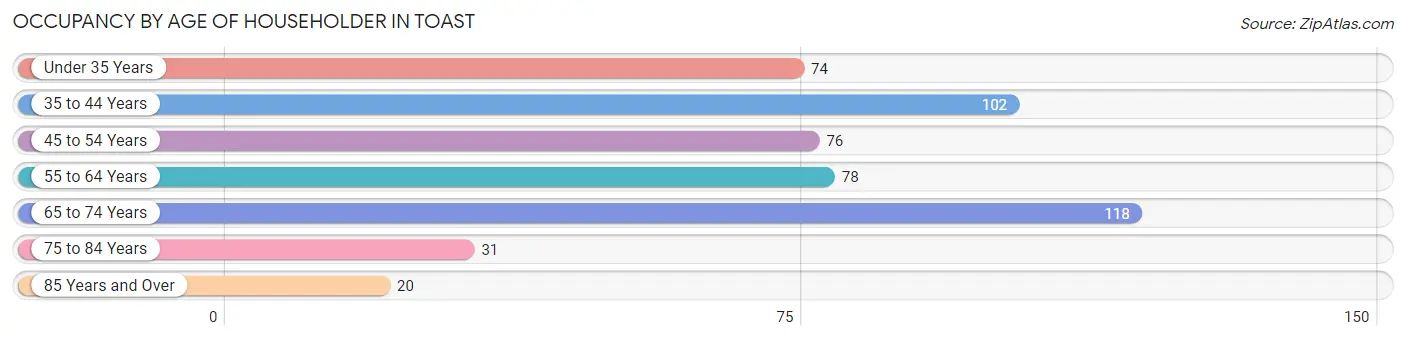
| Age Bracket | # Households | % Households |
| Under 35 Years | 74 | 14.8% |
| 35 to 44 Years | 102 | 20.4% |
| 45 to 54 Years | 76 | 15.2% |
| 55 to 64 Years | 78 | 15.6% |
| 65 to 74 Years | 118 | 23.6% |
| 75 to 84 Years | 31 | 6.2% |
| 85 Years and Over | 20 | 4.0% |
| Total | 499 | 100.0% |
Housing Finances in Toast
Median Income by Occupancy in Toast
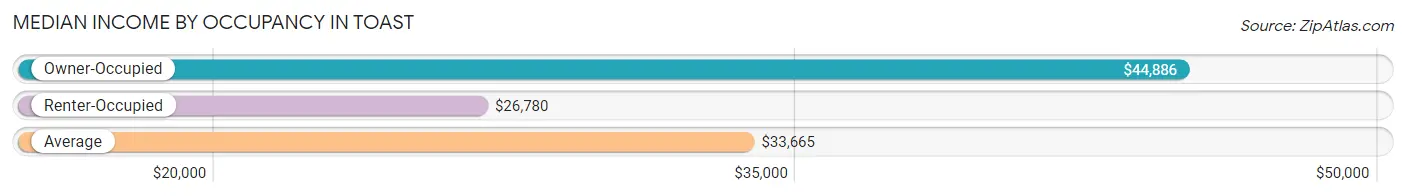
| Occupancy Type | # Households | Median Income |
| Owner-Occupied | 373 (74.8%) | $44,886 |
| Renter-Occupied | 126 (25.3%) | $26,780 |
| Average | 499 (100.0%) | $33,665 |
Occupancy by Householder Income Bracket in Toast
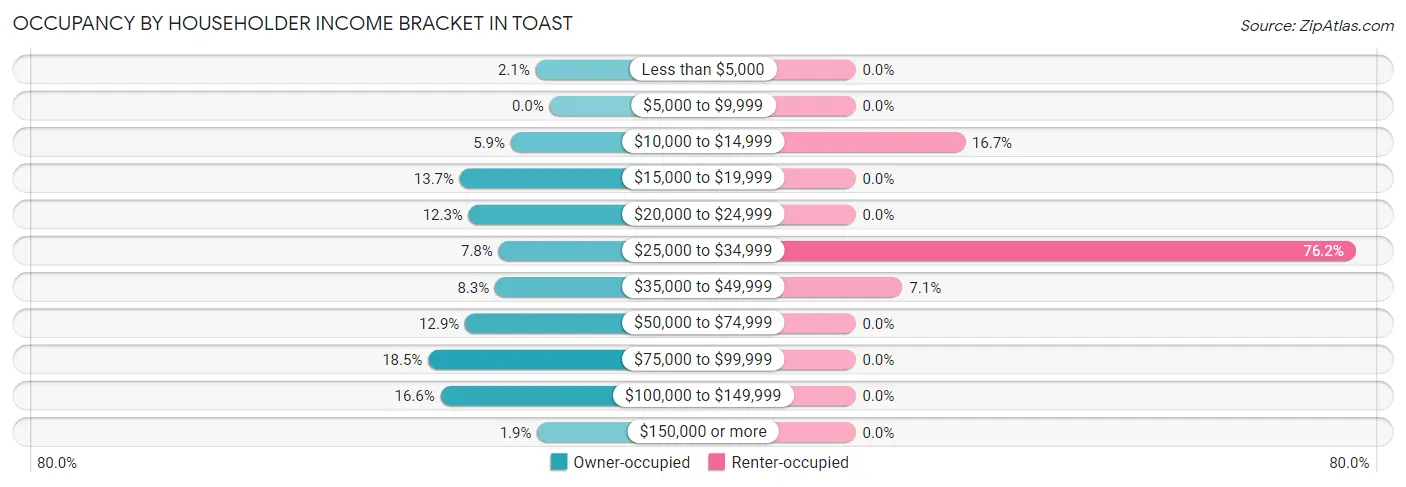
| Income Bracket | Owner-occupied | Renter-occupied |
| Less than $5,000 | 8 (2.1%) | 0 (0.0%) |
| $5,000 to $9,999 | 0 (0.0%) | 0 (0.0%) |
| $10,000 to $14,999 | 22 (5.9%) | 21 (16.7%) |
| $15,000 to $19,999 | 51 (13.7%) | 0 (0.0%) |
| $20,000 to $24,999 | 46 (12.3%) | 0 (0.0%) |
| $25,000 to $34,999 | 29 (7.8%) | 96 (76.2%) |
| $35,000 to $49,999 | 31 (8.3%) | 9 (7.1%) |
| $50,000 to $74,999 | 48 (12.9%) | 0 (0.0%) |
| $75,000 to $99,999 | 69 (18.5%) | 0 (0.0%) |
| $100,000 to $149,999 | 62 (16.6%) | 0 (0.0%) |
| $150,000 or more | 7 (1.9%) | 0 (0.0%) |
| Total | 373 (100.0%) | 126 (100.0%) |
Monthly Housing Cost Tiers in Toast
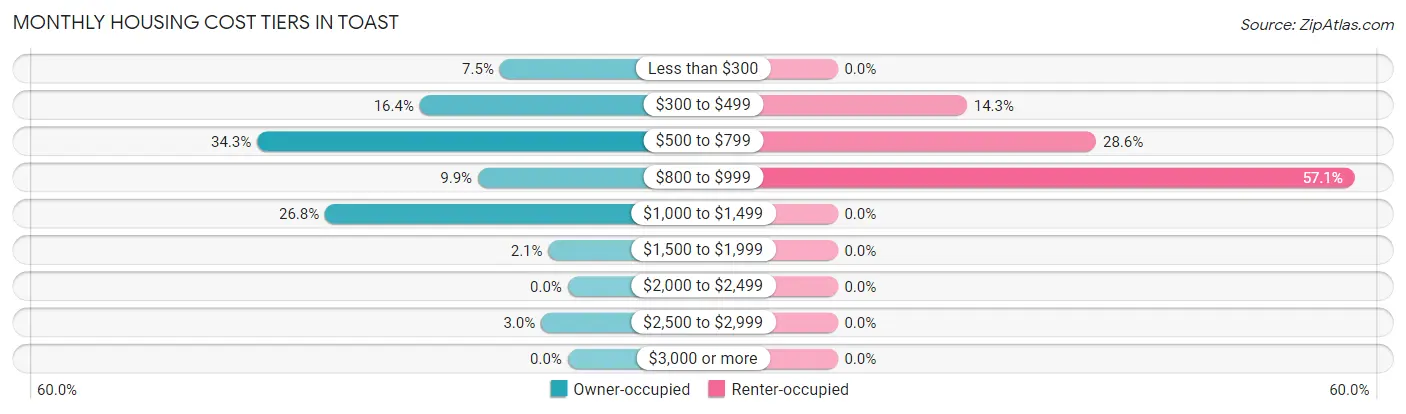
| Monthly Cost | Owner-occupied | Renter-occupied |
| Less than $300 | 28 (7.5%) | 0 (0.0%) |
| $300 to $499 | 61 (16.4%) | 18 (14.3%) |
| $500 to $799 | 128 (34.3%) | 36 (28.6%) |
| $800 to $999 | 37 (9.9%) | 72 (57.1%) |
| $1,000 to $1,499 | 100 (26.8%) | 0 (0.0%) |
| $1,500 to $1,999 | 8 (2.1%) | 0 (0.0%) |
| $2,000 to $2,499 | 0 (0.0%) | 0 (0.0%) |
| $2,500 to $2,999 | 11 (2.9%) | 0 (0.0%) |
| $3,000 or more | 0 (0.0%) | 0 (0.0%) |
| Total | 373 (100.0%) | 126 (100.0%) |
Physical Housing Characteristics in Toast
Housing Structures in Toast
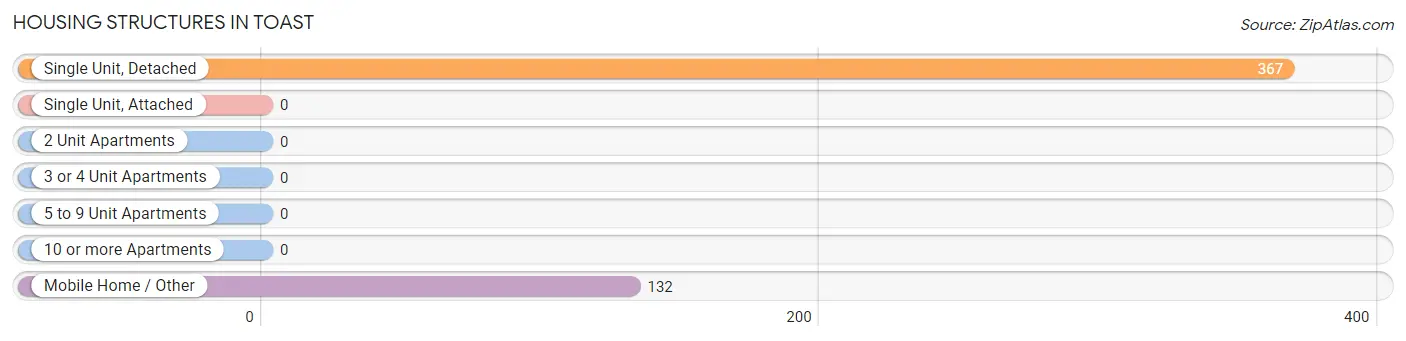
| Structure Type | # Housing Units | % Housing Units |
| Single Unit, Detached | 367 | 73.6% |
| Single Unit, Attached | 0 | 0.0% |
| 2 Unit Apartments | 0 | 0.0% |
| 3 or 4 Unit Apartments | 0 | 0.0% |
| 5 to 9 Unit Apartments | 0 | 0.0% |
| 10 or more Apartments | 0 | 0.0% |
| Mobile Home / Other | 132 | 26.5% |
| Total | 499 | 100.0% |
Housing Structures by Occupancy in Toast
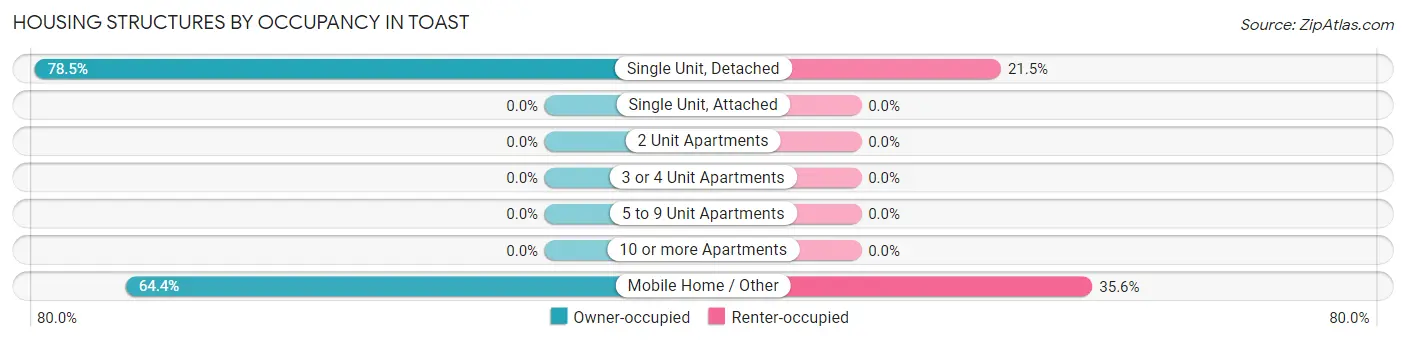
| Structure Type | Owner-occupied | Renter-occupied |
| Single Unit, Detached | 288 (78.5%) | 79 (21.5%) |
| Single Unit, Attached | 0 (0.0%) | 0 (0.0%) |
| 2 Unit Apartments | 0 (0.0%) | 0 (0.0%) |
| 3 or 4 Unit Apartments | 0 (0.0%) | 0 (0.0%) |
| 5 to 9 Unit Apartments | 0 (0.0%) | 0 (0.0%) |
| 10 or more Apartments | 0 (0.0%) | 0 (0.0%) |
| Mobile Home / Other | 85 (64.4%) | 47 (35.6%) |
| Total | 373 (74.8%) | 126 (25.3%) |
Housing Structures by Number of Rooms in Toast
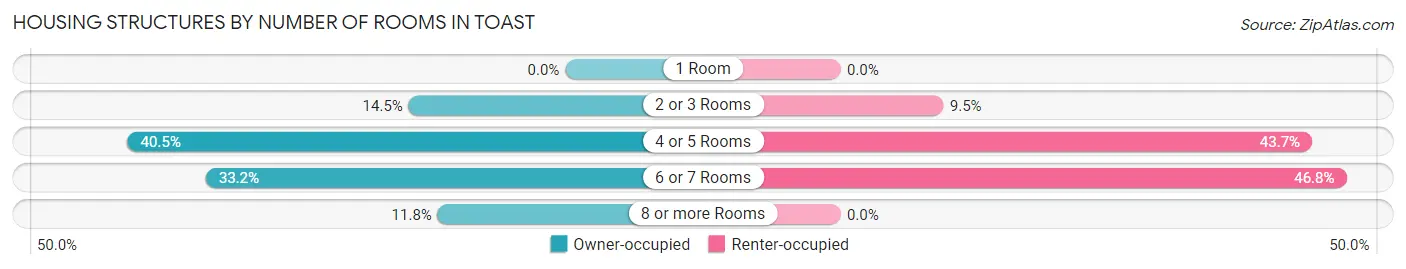
| Number of Rooms | Owner-occupied | Renter-occupied |
| 1 Room | 0 (0.0%) | 0 (0.0%) |
| 2 or 3 Rooms | 54 (14.5%) | 12 (9.5%) |
| 4 or 5 Rooms | 151 (40.5%) | 55 (43.6%) |
| 6 or 7 Rooms | 124 (33.2%) | 59 (46.8%) |
| 8 or more Rooms | 44 (11.8%) | 0 (0.0%) |
| Total | 373 (100.0%) | 126 (100.0%) |
Housing Structure by Heating Type in Toast
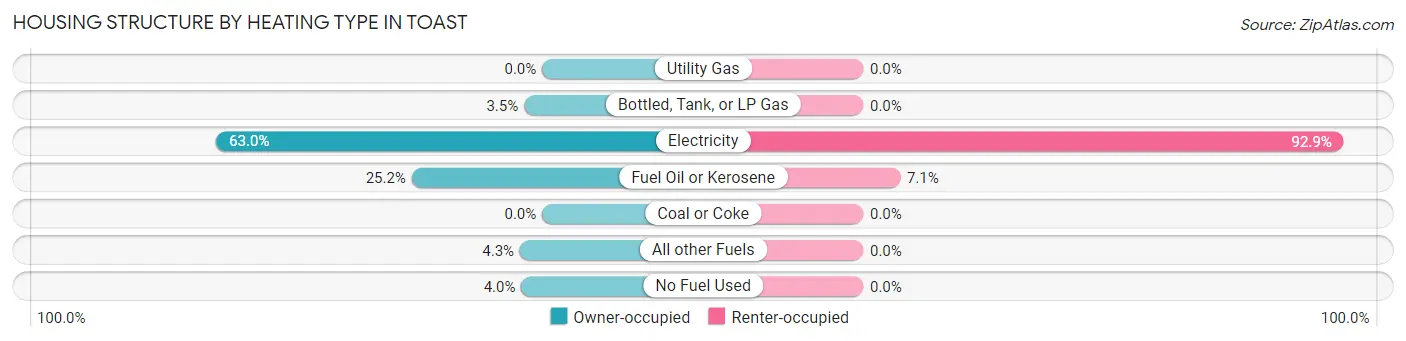
| Heating Type | Owner-occupied | Renter-occupied |
| Utility Gas | 0 (0.0%) | 0 (0.0%) |
| Bottled, Tank, or LP Gas | 13 (3.5%) | 0 (0.0%) |
| Electricity | 235 (63.0%) | 117 (92.9%) |
| Fuel Oil or Kerosene | 94 (25.2%) | 9 (7.1%) |
| Coal or Coke | 0 (0.0%) | 0 (0.0%) |
| All other Fuels | 16 (4.3%) | 0 (0.0%) |
| No Fuel Used | 15 (4.0%) | 0 (0.0%) |
| Total | 373 (100.0%) | 126 (100.0%) |
Household Vehicle Usage in Toast
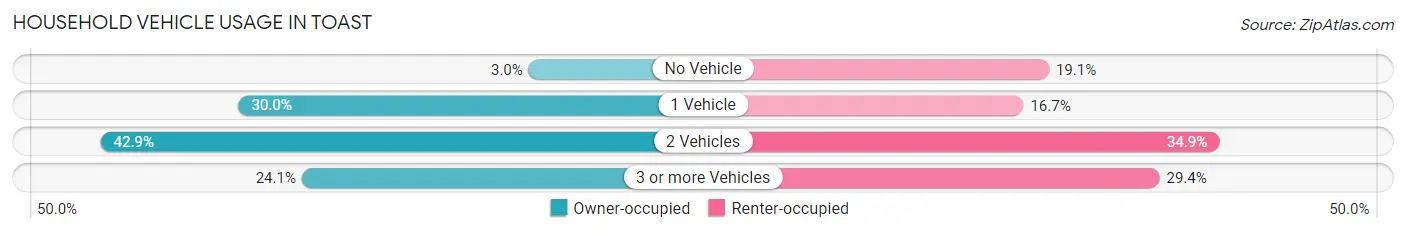
| Vehicles per Household | Owner-occupied | Renter-occupied |
| No Vehicle | 11 (2.9%) | 24 (19.1%) |
| 1 Vehicle | 112 (30.0%) | 21 (16.7%) |
| 2 Vehicles | 160 (42.9%) | 44 (34.9%) |
| 3 or more Vehicles | 90 (24.1%) | 37 (29.4%) |
| Total | 373 (100.0%) | 126 (100.0%) |
Real Estate & Mortgages in Toast
Real Estate and Mortgage Overview in Toast
| Characteristic | Without Mortgage | With Mortgage |
| Housing Units | 96 | 277 |
| Median Property Value | $87,500 | $94,800 |
| Median Household Income | $24,048 | $0 |
| Monthly Housing Costs | $363 | $0 |
| Real Estate Taxes | $625 | $0 |
Property Value by Mortgage Status in Toast
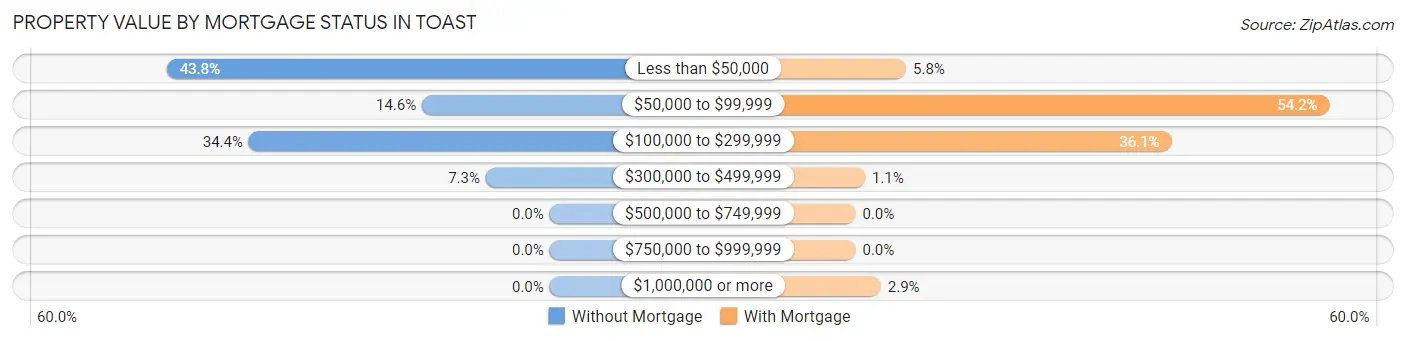
| Property Value | Without Mortgage | With Mortgage |
| Less than $50,000 | 42 (43.8%) | 16 (5.8%) |
| $50,000 to $99,999 | 14 (14.6%) | 150 (54.1%) |
| $100,000 to $299,999 | 33 (34.4%) | 100 (36.1%) |
| $300,000 to $499,999 | 7 (7.3%) | 3 (1.1%) |
| $500,000 to $749,999 | 0 (0.0%) | 0 (0.0%) |
| $750,000 to $999,999 | 0 (0.0%) | 0 (0.0%) |
| $1,000,000 or more | 0 (0.0%) | 8 (2.9%) |
| Total | 96 (100.0%) | 277 (100.0%) |
Household Income by Mortgage Status in Toast
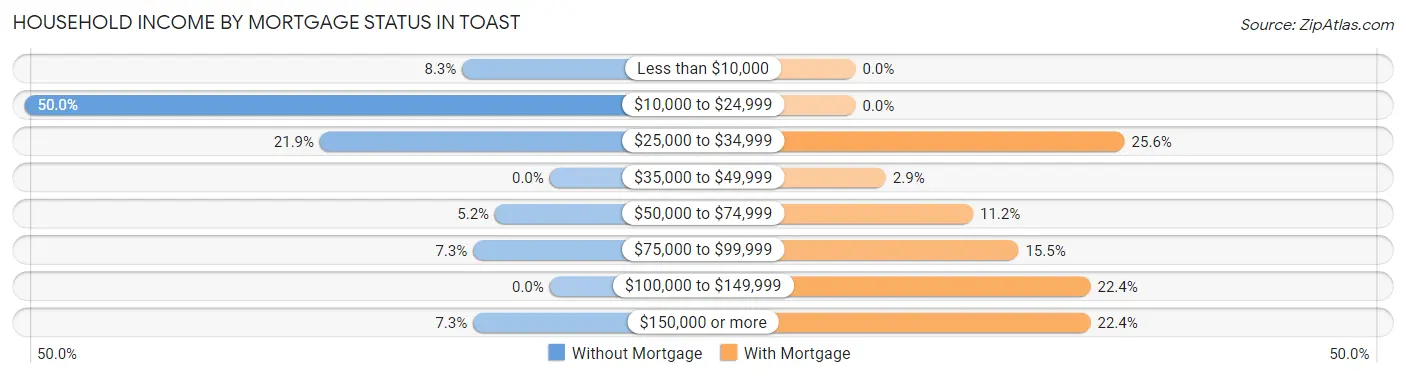
| Household Income | Without Mortgage | With Mortgage |
| Less than $10,000 | 8 (8.3%) | 0 (0.0%) |
| $10,000 to $24,999 | 48 (50.0%) | 0 (0.0%) |
| $25,000 to $34,999 | 21 (21.9%) | 71 (25.6%) |
| $35,000 to $49,999 | 0 (0.0%) | 8 (2.9%) |
| $50,000 to $74,999 | 5 (5.2%) | 31 (11.2%) |
| $75,000 to $99,999 | 7 (7.3%) | 43 (15.5%) |
| $100,000 to $149,999 | 0 (0.0%) | 62 (22.4%) |
| $150,000 or more | 7 (7.3%) | 62 (22.4%) |
| Total | 96 (100.0%) | 277 (100.0%) |
Property Value to Household Income Ratio in Toast
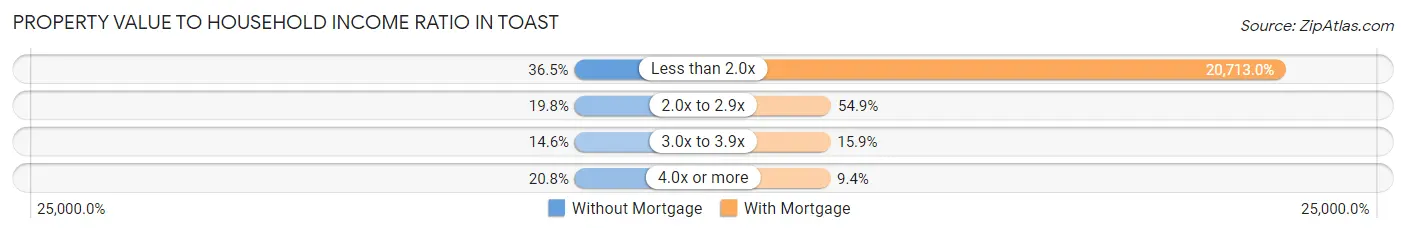
| Value-to-Income Ratio | Without Mortgage | With Mortgage |
| Less than 2.0x | 35 (36.5%) | 57,375 (20,713.0%) |
| 2.0x to 2.9x | 19 (19.8%) | 152 (54.9%) |
| 3.0x to 3.9x | 14 (14.6%) | 44 (15.9%) |
| 4.0x or more | 20 (20.8%) | 26 (9.4%) |
| Total | 96 (100.0%) | 277 (100.0%) |
Real Estate Taxes by Mortgage Status in Toast
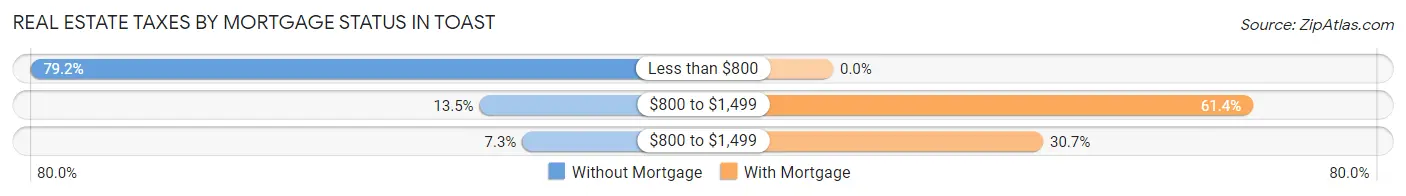
| Property Taxes | Without Mortgage | With Mortgage |
| Less than $800 | 76 (79.2%) | 0 (0.0%) |
| $800 to $1,499 | 13 (13.5%) | 170 (61.4%) |
| $800 to $1,499 | 7 (7.3%) | 85 (30.7%) |
| Total | 96 (100.0%) | 277 (100.0%) |
Health & Disability in Toast
Health Insurance Coverage by Age in Toast
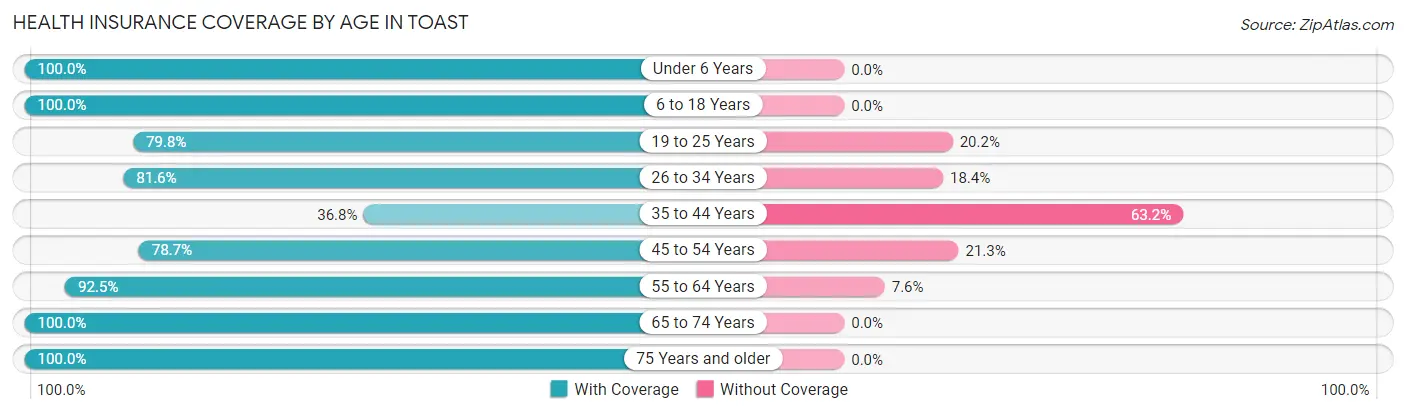
| Age Bracket | With Coverage | Without Coverage |
| Under 6 Years | 67 (100.0%) | 0 (0.0%) |
| 6 to 18 Years | 234 (100.0%) | 0 (0.0%) |
| 19 to 25 Years | 142 (79.8%) | 36 (20.2%) |
| 26 to 34 Years | 62 (81.6%) | 14 (18.4%) |
| 35 to 44 Years | 42 (36.8%) | 72 (63.2%) |
| 45 to 54 Years | 96 (78.7%) | 26 (21.3%) |
| 55 to 64 Years | 147 (92.4%) | 12 (7.5%) |
| 65 to 74 Years | 181 (100.0%) | 0 (0.0%) |
| 75 Years and older | 79 (100.0%) | 0 (0.0%) |
| Total | 1,050 (86.8%) | 160 (13.2%) |
Health Insurance Coverage by Citizenship Status in Toast
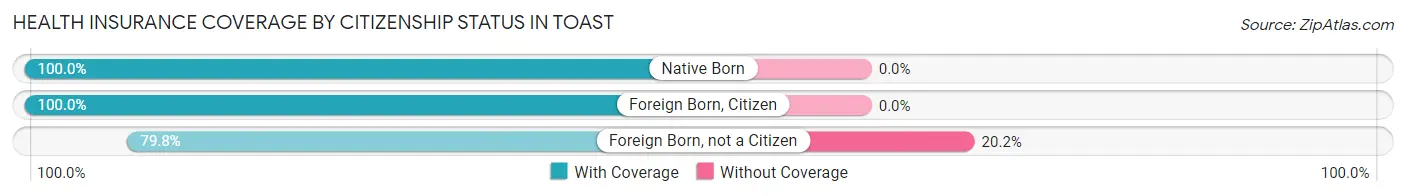
| Citizenship Status | With Coverage | Without Coverage |
| Native Born | 67 (100.0%) | 0 (0.0%) |
| Foreign Born, Citizen | 234 (100.0%) | 0 (0.0%) |
| Foreign Born, not a Citizen | 142 (79.8%) | 36 (20.2%) |
Health Insurance Coverage by Household Income in Toast
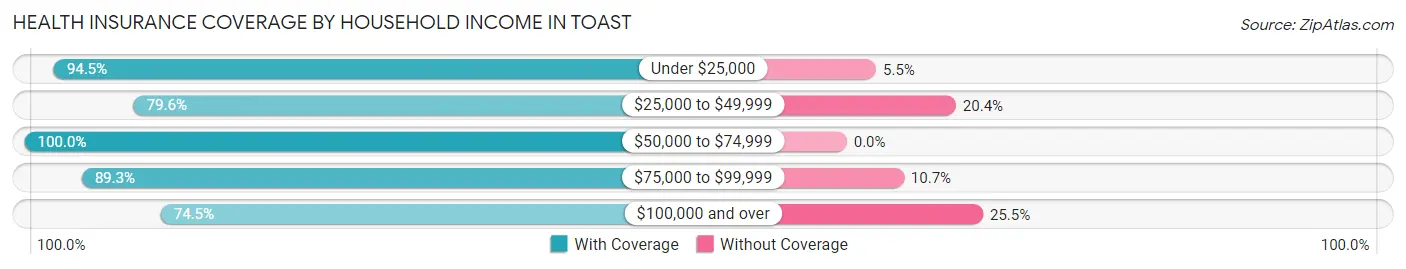
| Household Income | With Coverage | Without Coverage |
| Under $25,000 | 241 (94.5%) | 14 (5.5%) |
| $25,000 to $49,999 | 327 (79.6%) | 84 (20.4%) |
| $50,000 to $74,999 | 160 (100.0%) | 0 (0.0%) |
| $75,000 to $99,999 | 217 (89.3%) | 26 (10.7%) |
| $100,000 and over | 105 (74.5%) | 36 (25.5%) |
Public vs Private Health Insurance Coverage by Age in Toast
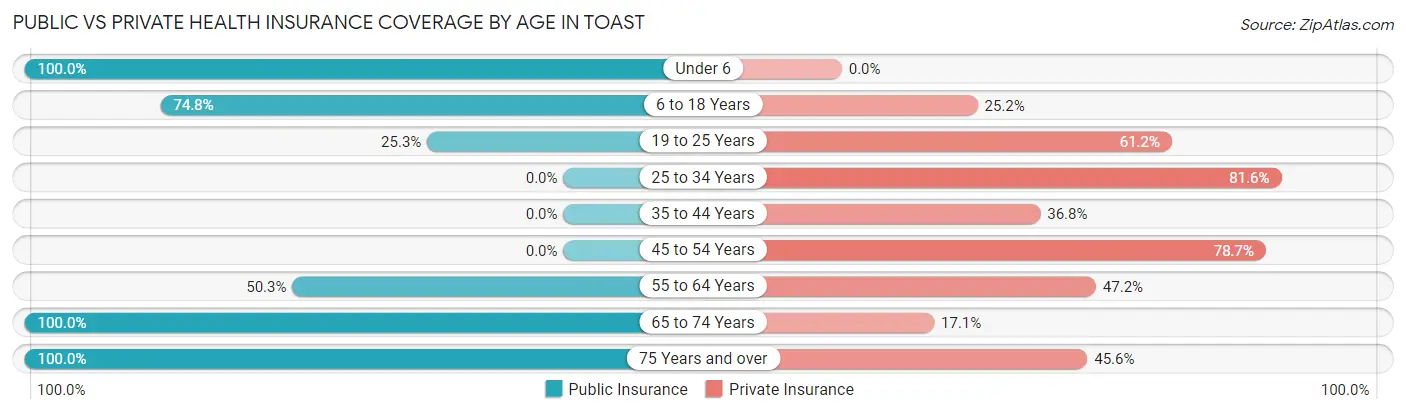
| Age Bracket | Public Insurance | Private Insurance |
| Under 6 | 67 (100.0%) | 0 (0.0%) |
| 6 to 18 Years | 175 (74.8%) | 59 (25.2%) |
| 19 to 25 Years | 45 (25.3%) | 109 (61.2%) |
| 25 to 34 Years | 0 (0.0%) | 62 (81.6%) |
| 35 to 44 Years | 0 (0.0%) | 42 (36.8%) |
| 45 to 54 Years | 0 (0.0%) | 96 (78.7%) |
| 55 to 64 Years | 80 (50.3%) | 75 (47.2%) |
| 65 to 74 Years | 181 (100.0%) | 31 (17.1%) |
| 75 Years and over | 79 (100.0%) | 36 (45.6%) |
| Total | 627 (51.8%) | 510 (42.1%) |
Disability Status by Sex by Age in Toast
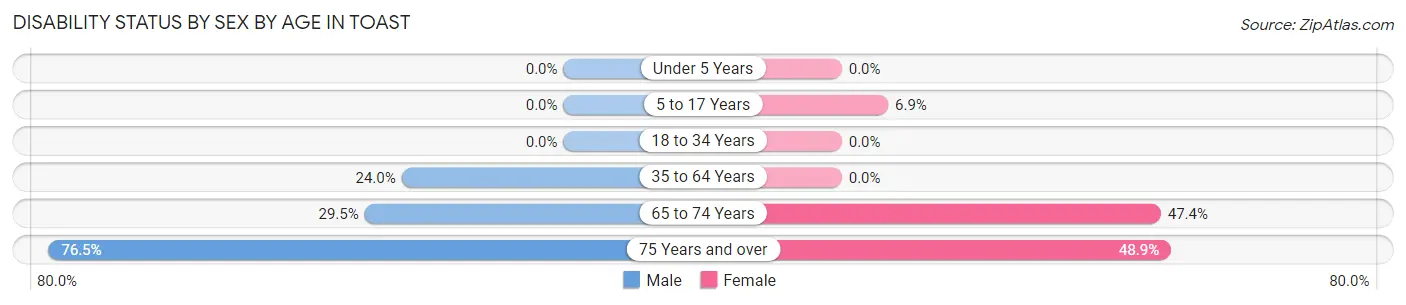
| Age Bracket | Male | Female |
| Under 5 Years | 0 (0.0%) | 0 (0.0%) |
| 5 to 17 Years | 0 (0.0%) | 11 (6.9%) |
| 18 to 34 Years | 0 (0.0%) | 0 (0.0%) |
| 35 to 64 Years | 37 (24.0%) | 0 (0.0%) |
| 65 to 74 Years | 31 (29.5%) | 36 (47.4%) |
| 75 Years and over | 26 (76.5%) | 22 (48.9%) |
Disability Class by Sex by Age in Toast
Disability Class: Hearing Difficulty
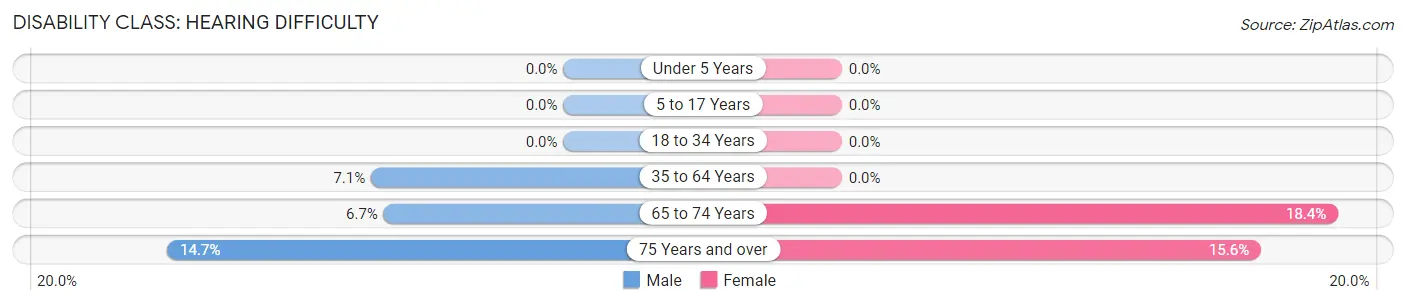
| Age Bracket | Male | Female |
| Under 5 Years | 0 (0.0%) | 0 (0.0%) |
| 5 to 17 Years | 0 (0.0%) | 0 (0.0%) |
| 18 to 34 Years | 0 (0.0%) | 0 (0.0%) |
| 35 to 64 Years | 11 (7.1%) | 0 (0.0%) |
| 65 to 74 Years | 7 (6.7%) | 14 (18.4%) |
| 75 Years and over | 5 (14.7%) | 7 (15.6%) |
Disability Class: Vision Difficulty
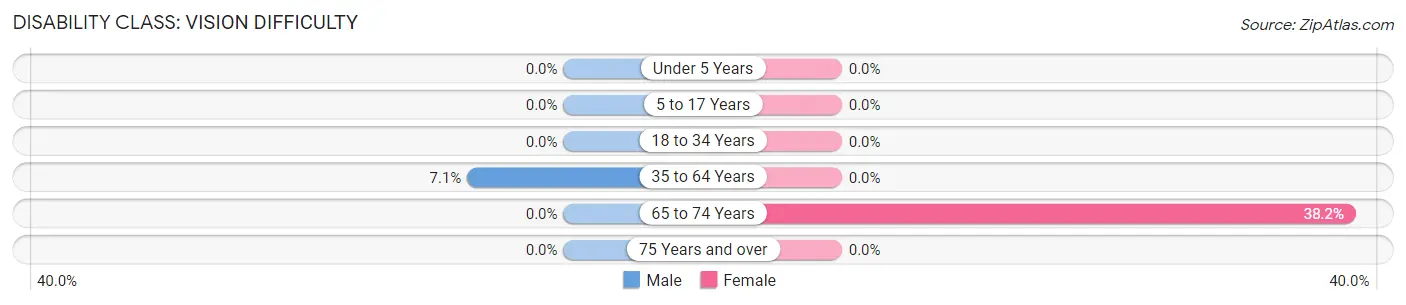
| Age Bracket | Male | Female |
| Under 5 Years | 0 (0.0%) | 0 (0.0%) |
| 5 to 17 Years | 0 (0.0%) | 0 (0.0%) |
| 18 to 34 Years | 0 (0.0%) | 0 (0.0%) |
| 35 to 64 Years | 11 (7.1%) | 0 (0.0%) |
| 65 to 74 Years | 0 (0.0%) | 29 (38.2%) |
| 75 Years and over | 0 (0.0%) | 0 (0.0%) |
Disability Class: Cognitive Difficulty
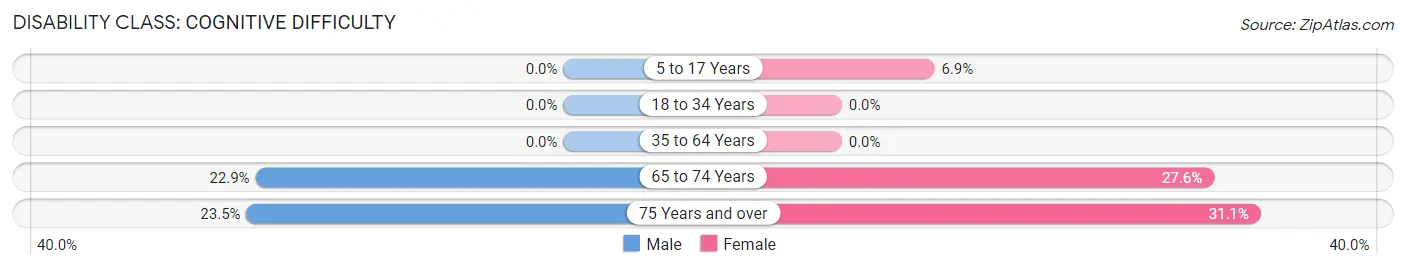
| Age Bracket | Male | Female |
| 5 to 17 Years | 0 (0.0%) | 11 (6.9%) |
| 18 to 34 Years | 0 (0.0%) | 0 (0.0%) |
| 35 to 64 Years | 0 (0.0%) | 0 (0.0%) |
| 65 to 74 Years | 24 (22.9%) | 21 (27.6%) |
| 75 Years and over | 8 (23.5%) | 14 (31.1%) |
Disability Class: Ambulatory Difficulty
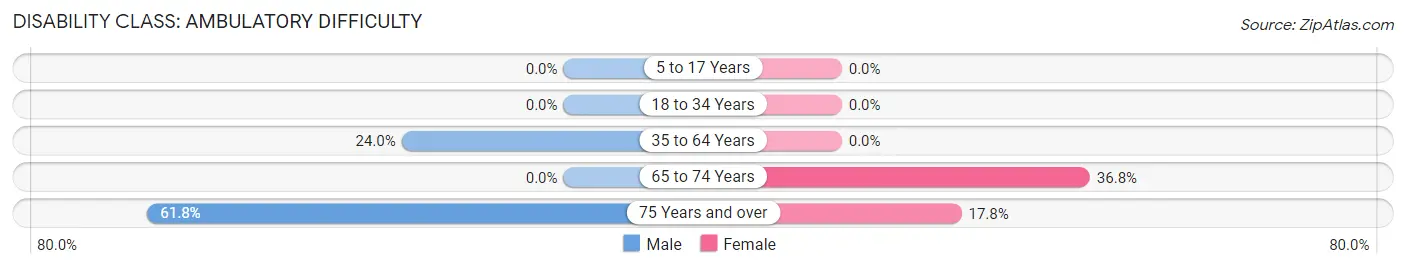
| Age Bracket | Male | Female |
| 5 to 17 Years | 0 (0.0%) | 0 (0.0%) |
| 18 to 34 Years | 0 (0.0%) | 0 (0.0%) |
| 35 to 64 Years | 37 (24.0%) | 0 (0.0%) |
| 65 to 74 Years | 0 (0.0%) | 28 (36.8%) |
| 75 Years and over | 21 (61.8%) | 8 (17.8%) |
Disability Class: Self-Care Difficulty
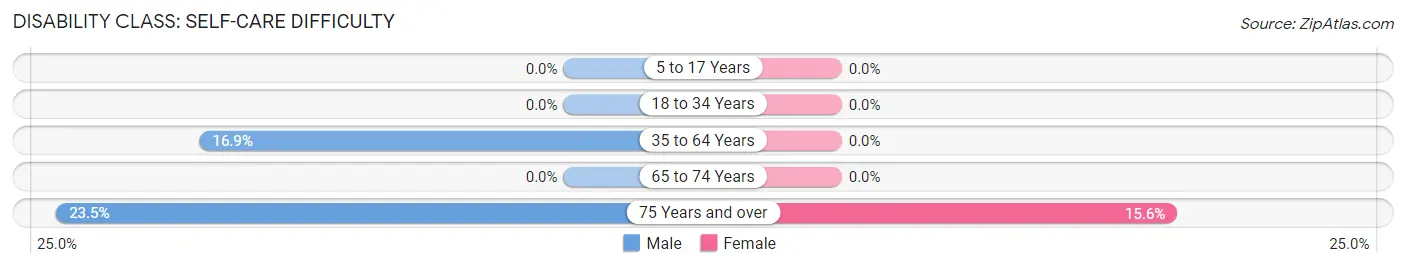
| Age Bracket | Male | Female |
| 5 to 17 Years | 0 (0.0%) | 0 (0.0%) |
| 18 to 34 Years | 0 (0.0%) | 0 (0.0%) |
| 35 to 64 Years | 26 (16.9%) | 0 (0.0%) |
| 65 to 74 Years | 0 (0.0%) | 0 (0.0%) |
| 75 Years and over | 8 (23.5%) | 7 (15.6%) |
Technology Access in Toast
Computing Device Access in Toast
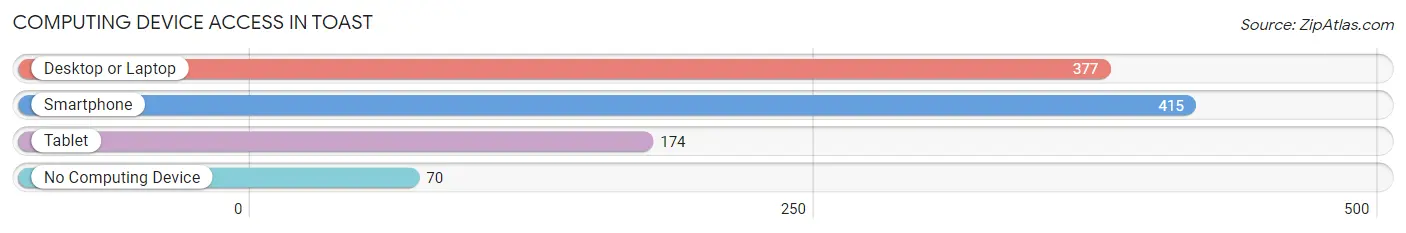
| Device Type | # Households | % Households |
| Desktop or Laptop | 377 | 75.5% |
| Smartphone | 415 | 83.2% |
| Tablet | 174 | 34.9% |
| No Computing Device | 70 | 14.0% |
| Total | 499 | 100.0% |
Internet Access in Toast
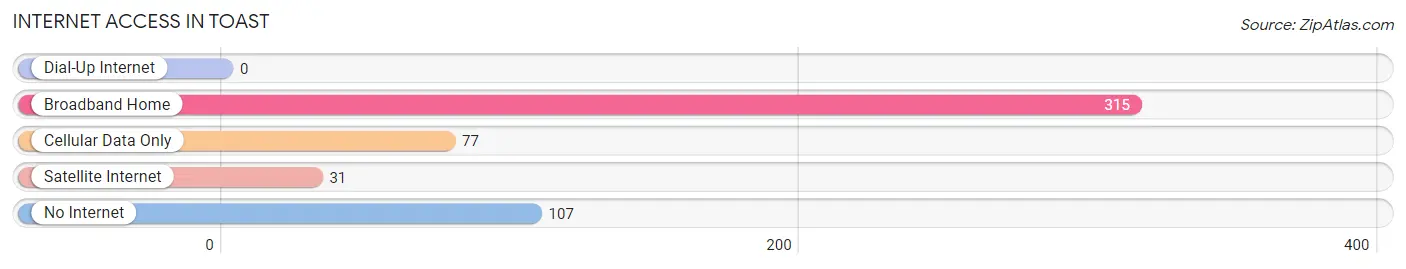
| Internet Type | # Households | % Households |
| Dial-Up Internet | 0 | 0.0% |
| Broadband Home | 315 | 63.1% |
| Cellular Data Only | 77 | 15.4% |
| Satellite Internet | 31 | 6.2% |
| No Internet | 107 | 21.4% |
| Total | 499 | 100.0% |
Toast Summary
North Carolina is a state located in the southeastern United States. It is bordered by South Carolina to the south, Georgia to the southwest, Tennessee to the west, Virginia to the north, and the Atlantic Ocean to the east. North Carolina is the 28th most populous state in the United States, with an estimated population of 10.3 million in 2019.
History
North Carolina was first inhabited by Native Americans, including the Cherokee, Catawba, and Tuscarora tribes. The first European settlers arrived in the late 16th century, and the area was eventually colonized by the English in the 17th century. North Carolina was one of the original 13 colonies and was the first state to declare independence from Britain in 1776. It was also the 12th state to ratify the U.S. Constitution in 1789.
During the Civil War, North Carolina was a Confederate state and was the site of several major battles. After the war, the state experienced a period of Reconstruction and industrialization. In the 20th century, North Carolina became a major center for the textile and furniture industries.
Geography
North Carolina is located in the southeastern United States and covers an area of 53,819 square miles. It is the 28th largest state in the country. The state is divided into three distinct geographic regions: the Appalachian Mountains in the west, the Piedmont Plateau in the central part of the state, and the Coastal Plain in the east.
The Appalachian Mountains are the oldest mountain range in North America and are home to some of the highest peaks in the eastern United States. The highest peak in the state is Mount Mitchell, which stands at 6,684 feet. The Piedmont Plateau is a region of rolling hills and valleys, and is home to the state capital, Raleigh. The Coastal Plain is a flat, low-lying region that is home to many of the state’s beaches and barrier islands.
Economy
North Carolina’s economy is largely driven by agriculture, manufacturing, and technology. The state is a major producer of tobacco, cotton, and other agricultural products. It is also a major producer of furniture, textiles, and other manufactured goods.
The state is home to several major corporations, including Bank of America, Duke Energy, and Lowe’s. The Research Triangle Park, located in the Raleigh-Durham area, is a major center for technology and research. The state is also home to several military bases, including Fort Bragg and Camp Lejeune.
Demographics
As of 2019, North Carolina had an estimated population of 10.3 million. The state is racially and ethnically diverse, with a population that is roughly 60% white, 22% African American, 8% Hispanic or Latino, and 6% Asian. The state’s largest cities are Charlotte, Raleigh, Greensboro, Durham, and Winston-Salem.
North Carolina is home to several major universities, including the University of North Carolina at Chapel Hill, Duke University, and North Carolina State University. The state is also home to several professional sports teams, including the Carolina Panthers of the NFL and the Charlotte Hornets of the NBA.
Common Questions
What is Per Capita Income in Toast?
Per Capita income in Toast is $20,188.
What is the Median Family Income in Toast?
Median Family Income in Toast is $34,966.
What is the Median Household income in Toast?
Median Household Income in Toast is $33,665.
What is Income or Wage Gap in Toast?
Income or Wage Gap in Toast is 25.6%.
Women in Toast earn 74.4 cents for every dollar earned by a man.
What is Inequality or Gini Index in Toast?
Inequality or Gini Index in Toast is 0.40.
What is the Total Population of Toast?
Total Population of Toast is 1,210.
What is the Total Male Population of Toast?
Total Male Population of Toast is 569.
What is the Total Female Population of Toast?
Total Female Population of Toast is 641.
What is the Ratio of Males per 100 Females in Toast?
There are 88.77 Males per 100 Females in Toast.
What is the Ratio of Females per 100 Males in Toast?
There are 112.65 Females per 100 Males in Toast.
What is the Median Population Age in Toast?
Median Population Age in Toast is 40.3 Years.
What is the Average Family Size in Toast
Average Family Size in Toast is 2.7 People.
What is the Average Household Size in Toast
Average Household Size in Toast is 2.4 People.
How Large is the Labor Force in Toast?
There are 609 People in the Labor Forcein in Toast.
What is the Percentage of People in the Labor Force in Toast?
67.0% of People are in the Labor Force in Toast.
What is the Unemployment Rate in Toast?
Unemployment Rate in Toast is 8.0%.