Zip Codes with the Highest Percentage of Population Employed in Administrative & Support Services in Waynesville, NC
RELATED REPORTS & OPTIONS
Administrative & Support Services
Waynesville
Compare Zip Codes
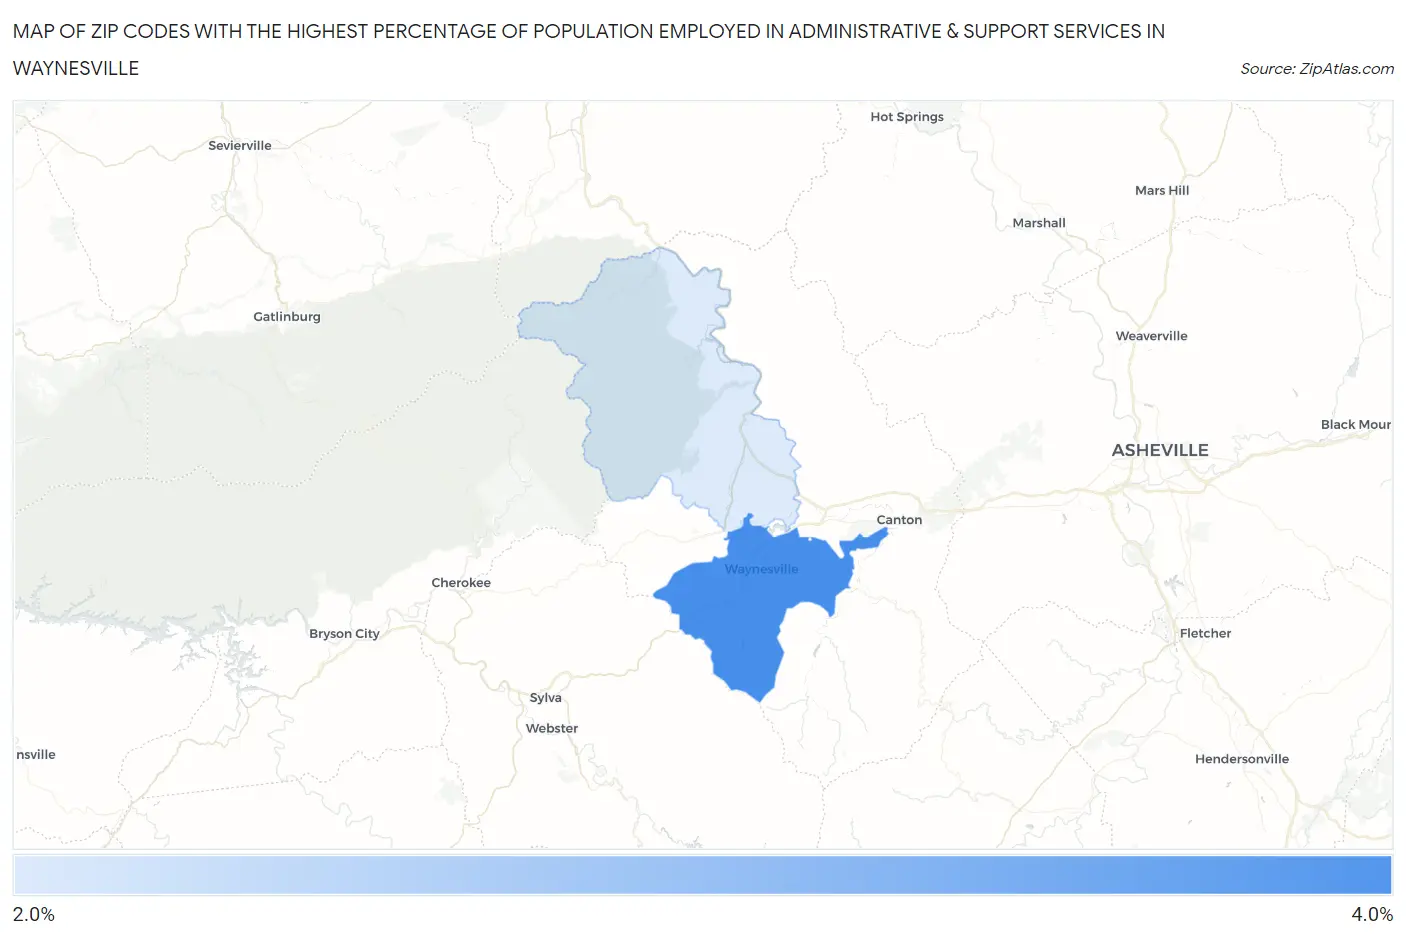
Map of Zip Codes with the Highest Percentage of Population Employed in Administrative & Support Services in Waynesville
2.8%
3.1%
Zip Codes with the Highest Percentage of Population Employed in Administrative & Support Services in Waynesville, NC
| Zip Code | % Employed | vs State | vs National | |
| 1. | 28786 | 3.1% | 4.3%(-1.21)#492 | 4.1%(-1.09)#15,208 |
| 2. | 28785 | 2.8% | 4.3%(-1.43)#519 | 4.1%(-1.32)#16,362 |
1
Common Questions
What are the Top Zip Codes with the Highest Percentage of Population Employed in Administrative & Support Services in Waynesville, NC?
Top Zip Codes with the Highest Percentage of Population Employed in Administrative & Support Services in Waynesville, NC are:
What zip code has the Highest Percentage of Population Employed in Administrative & Support Services in Waynesville, NC?
28786 has the Highest Percentage of Population Employed in Administrative & Support Services in Waynesville, NC with 3.1%.
What is the Percentage of Population Employed in Administrative & Support Services in Waynesville, NC?
Percentage of Population Employed in Administrative & Support Services in Waynesville is 2.0%.
What is the Percentage of Population Employed in Administrative & Support Services in North Carolina?
Percentage of Population Employed in Administrative & Support Services in North Carolina is 4.3%.
What is the Percentage of Population Employed in Administrative & Support Services in the United States?
Percentage of Population Employed in Administrative & Support Services in the United States is 4.1%.