Macon, NC Map & Demographics
Macon Map
Macon Overview
$25,722
PER CAPITA INCOME
$79,375
AVG FAMILY INCOME
$77,917
AVG HOUSEHOLD INCOME
25.9%
WAGE / INCOME GAP [ % ]
74.1¢/ $1
WAGE / INCOME GAP [ $ ]
0.24
INEQUALITY / GINI INDEX
90
TOTAL POPULATION
48
MALE POPULATION
42
FEMALE POPULATION
114.29
MALES / 100 FEMALES
87.50
FEMALES / 100 MALES
41.0
MEDIAN AGE
2.6
AVG FAMILY SIZE
2.2
AVG HOUSEHOLD SIZE
50
LABOR FORCE [ PEOPLE ]
74.6%
PERCENT IN LABOR FORCE
16.0%
UNEMPLOYMENT RATE
Macon Zip Codes
Macon Area Codes
Income in Macon
Income Overview in Macon
Per Capita Income in Macon is $25,722, while median incomes of families and households are $79,375 and $77,917 respectively.
| Characteristic | Number | Measure |
| Per Capita Income | 90 | $25,722 |
| Median Family Income | 31 | $79,375 |
| Mean Family Income | 31 | $81,013 |
| Median Household Income | 40 | $77,917 |
| Mean Household Income | 40 | $72,643 |
| Income Deficit | 31 | $0 |
| Wage / Income Gap (%) | 90 | 25.87% |
| Wage / Income Gap ($) | 90 | 74.13¢ per $1 |
| Gini / Inequality Index | 90 | 0.24 |
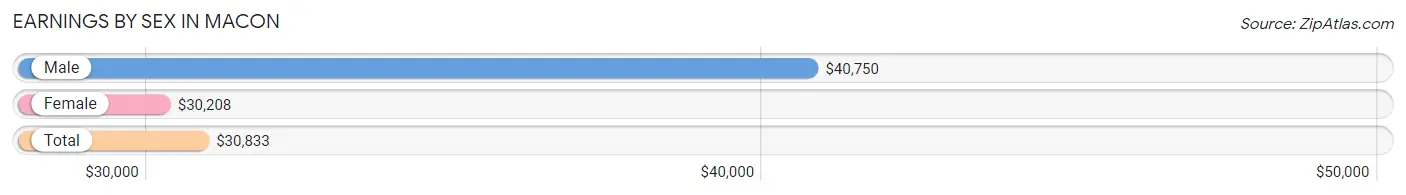
Earnings by Sex in Macon
Average Earnings in Macon are $30,833, $40,750 for men and $30,208 for women, a difference of 25.9%.
| Sex | Number | Average Earnings |
| Male | 19 (38.0%) | $40,750 |
| Female | 31 (62.0%) | $30,208 |
| Total | 50 (100.0%) | $30,833 |
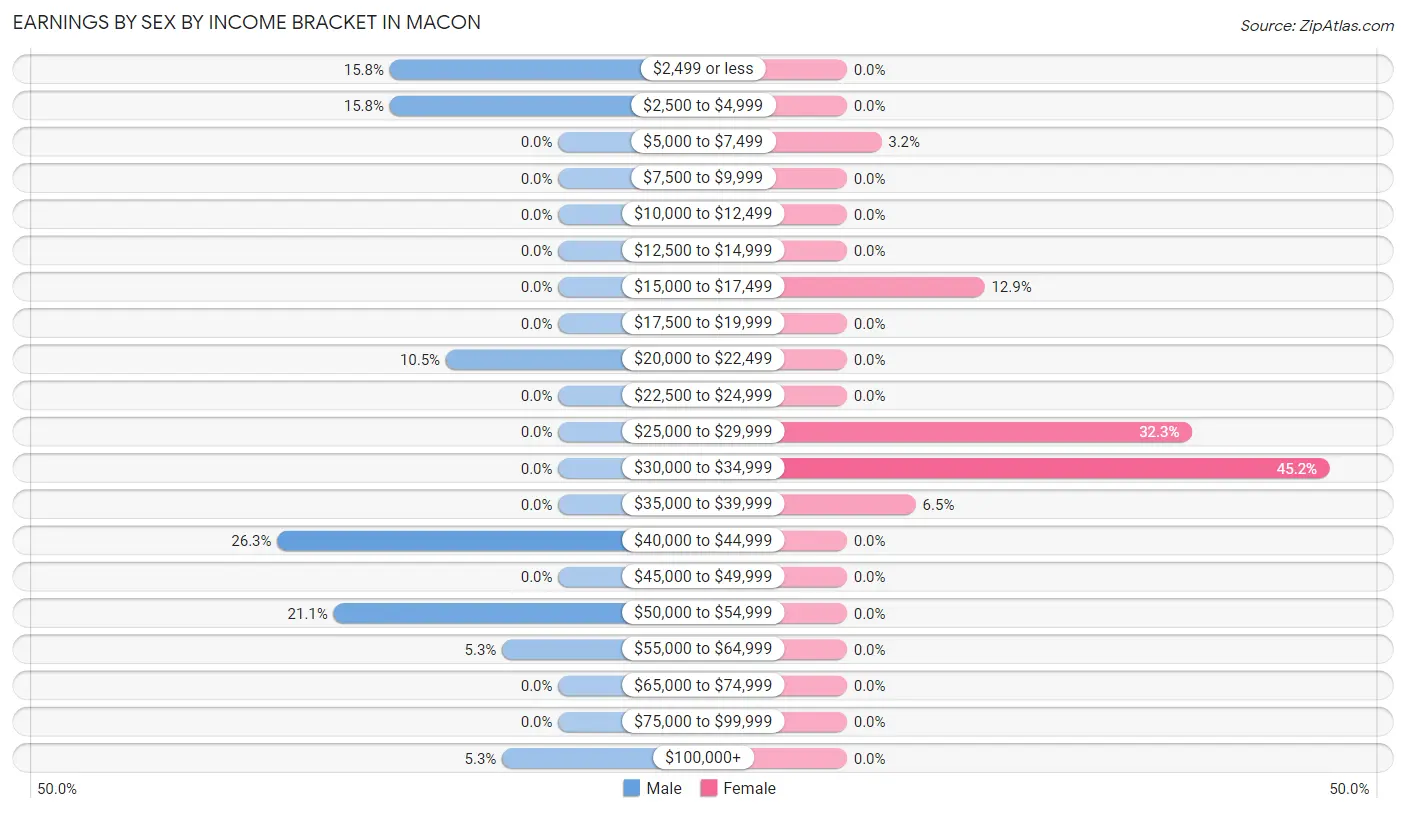
Earnings by Sex by Income Bracket in Macon
The most common earnings brackets in Macon are $40,000 to $44,999 for men (5 | 26.3%) and $30,000 to $34,999 for women (14 | 45.2%).
| Income | Male | Female |
| $2,499 or less | 3 (15.8%) | 0 (0.0%) |
| $2,500 to $4,999 | 3 (15.8%) | 0 (0.0%) |
| $5,000 to $7,499 | 0 (0.0%) | 1 (3.2%) |
| $7,500 to $9,999 | 0 (0.0%) | 0 (0.0%) |
| $10,000 to $12,499 | 0 (0.0%) | 0 (0.0%) |
| $12,500 to $14,999 | 0 (0.0%) | 0 (0.0%) |
| $15,000 to $17,499 | 0 (0.0%) | 4 (12.9%) |
| $17,500 to $19,999 | 0 (0.0%) | 0 (0.0%) |
| $20,000 to $22,499 | 2 (10.5%) | 0 (0.0%) |
| $22,500 to $24,999 | 0 (0.0%) | 0 (0.0%) |
| $25,000 to $29,999 | 0 (0.0%) | 10 (32.3%) |
| $30,000 to $34,999 | 0 (0.0%) | 14 (45.2%) |
| $35,000 to $39,999 | 0 (0.0%) | 2 (6.5%) |
| $40,000 to $44,999 | 5 (26.3%) | 0 (0.0%) |
| $45,000 to $49,999 | 0 (0.0%) | 0 (0.0%) |
| $50,000 to $54,999 | 4 (21.0%) | 0 (0.0%) |
| $55,000 to $64,999 | 1 (5.3%) | 0 (0.0%) |
| $65,000 to $74,999 | 0 (0.0%) | 0 (0.0%) |
| $75,000 to $99,999 | 0 (0.0%) | 0 (0.0%) |
| $100,000+ | 1 (5.3%) | 0 (0.0%) |
| Total | 19 (100.0%) | 31 (100.0%) |
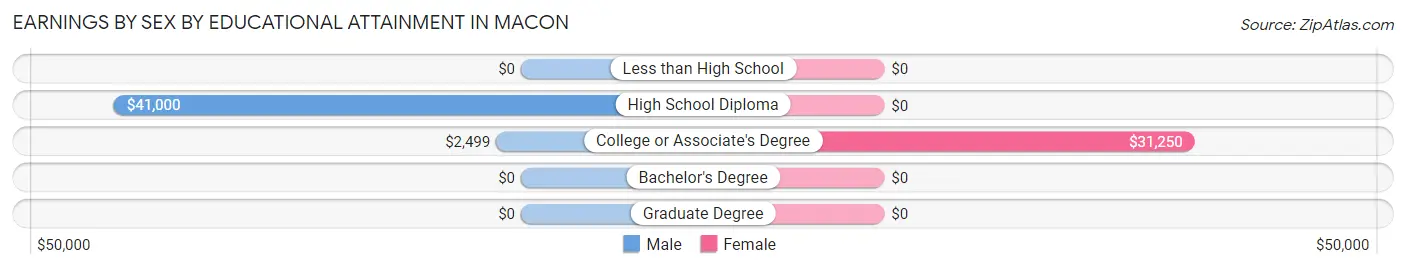
Earnings by Sex by Educational Attainment in Macon
| Educational Attainment | Male Income | Female Income |
| Less than High School | - | - |
| High School Diploma | $41,000 | $0 |
| College or Associate's Degree | $2,499 | $31,250 |
| Bachelor's Degree | - | - |
| Graduate Degree | - | - |
| Total | - | - |
Family Income in Macon
Family Income Brackets in Macon
According to the Macon family income data, there are 18 families falling into the $75,000 to $99,999 income range, which is the most common income bracket and makes up 58.1% of all families.
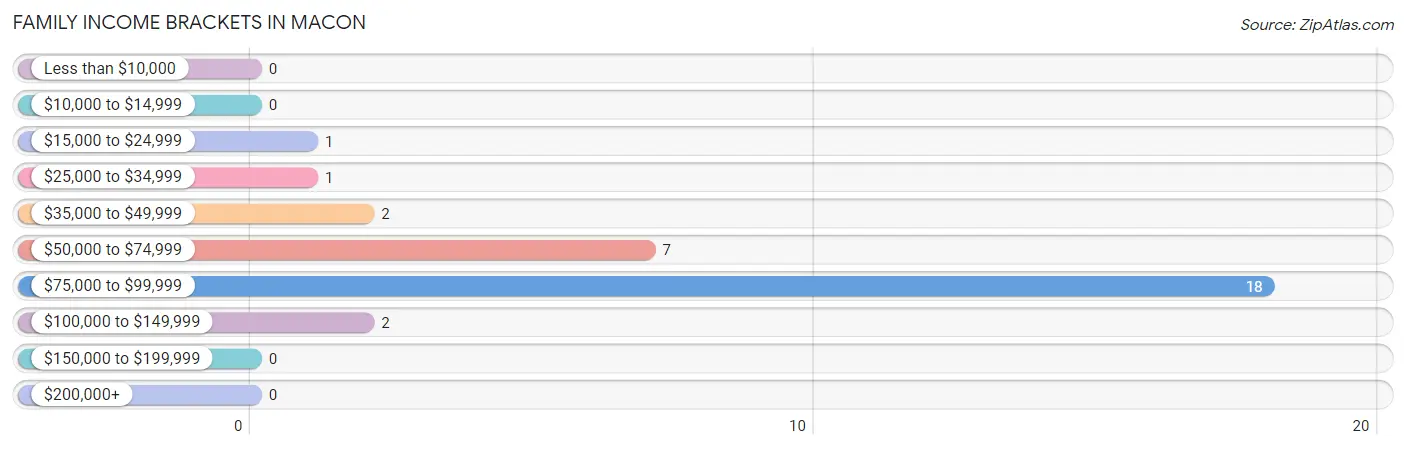
| Income Bracket | # Families | % Families |
| Less than $10,000 | 0 | 0.0% |
| $10,000 to $14,999 | 0 | 0.0% |
| $15,000 to $24,999 | 1 | 3.2% |
| $25,000 to $34,999 | 1 | 3.2% |
| $35,000 to $49,999 | 2 | 6.5% |
| $50,000 to $74,999 | 7 | 22.6% |
| $75,000 to $99,999 | 18 | 58.1% |
| $100,000 to $149,999 | 2 | 6.5% |
| $150,000 to $199,999 | 0 | 0.0% |
| $200,000+ | 0 | 0.0% |
Family Income by Famaliy Size in Macon
3-person families (20 | 64.5%) account for the highest median family income in Macon with $93,000 per family, while 2-person families (9 | 29.0%) have the highest median income of $39,219 per family member.
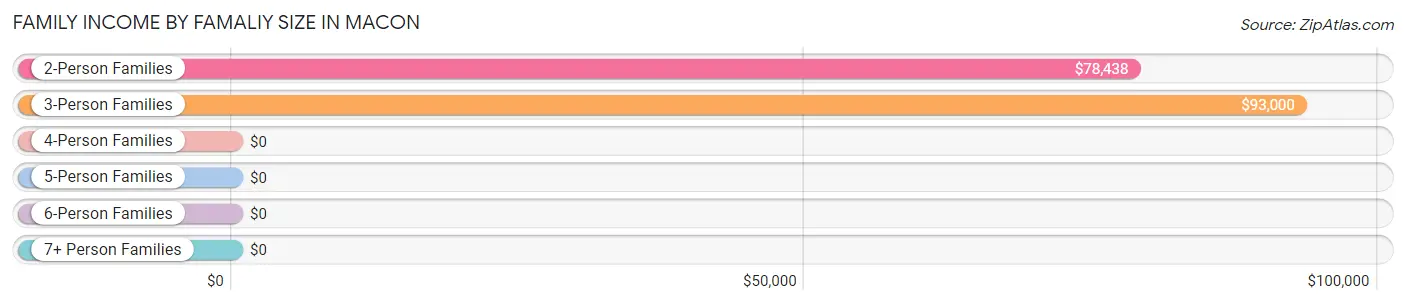
| Income Bracket | # Families | Median Income |
| 2-Person Families | 9 (29.0%) | $78,438 |
| 3-Person Families | 20 (64.5%) | $93,000 |
| 4-Person Families | 0 (0.0%) | $0 |
| 5-Person Families | 0 (0.0%) | $0 |
| 6-Person Families | 0 (0.0%) | $0 |
| 7+ Person Families | 2 (6.5%) | $0 |
| Total | 31 (100.0%) | $79,375 |
Family Income by Number of Earners in Macon
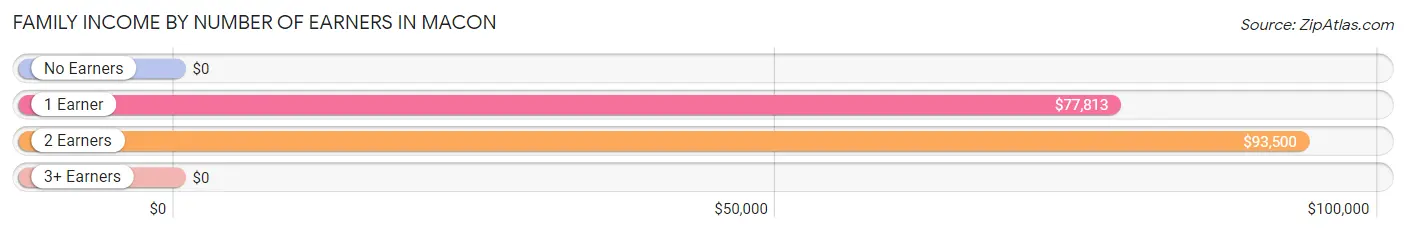
| Number of Earners | # Families | Median Income |
| No Earners | 2 (6.5%) | $0 |
| 1 Earner | 7 (22.6%) | $77,813 |
| 2 Earners | 20 (64.5%) | $93,500 |
| 3+ Earners | 2 (6.5%) | $0 |
| Total | 31 (100.0%) | $79,375 |
Household Income in Macon
Household Income Brackets in Macon
With 18 households falling in the category, the $75,000 to $99,999 income range is the most frequent in Macon, accounting for 45.0% of all households.
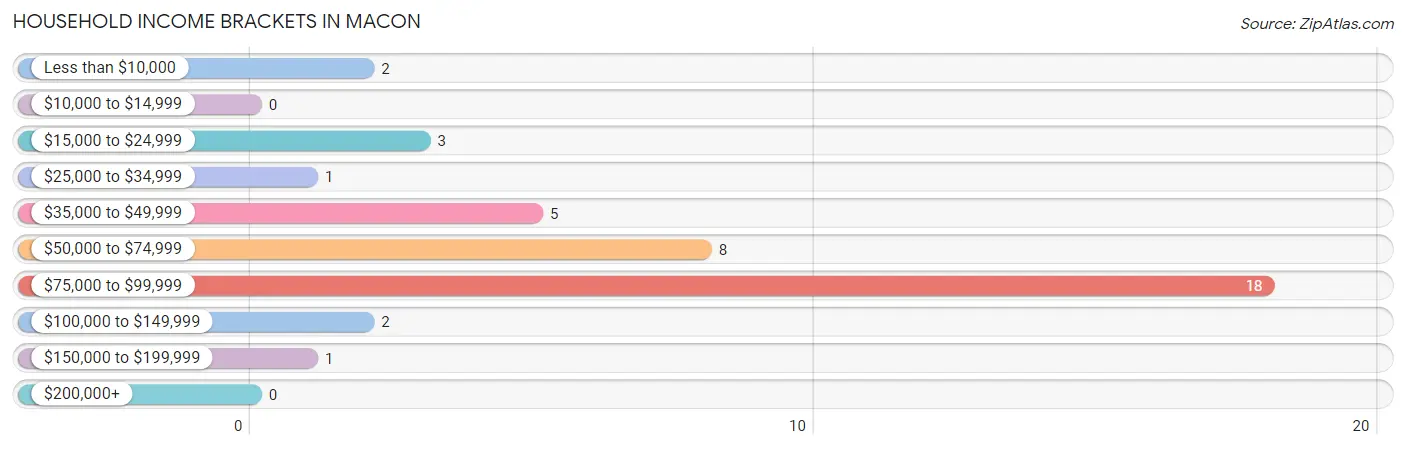
| Income Bracket | # Households | % Households |
| Less than $10,000 | 2 | 5.0% |
| $10,000 to $14,999 | 0 | 0.0% |
| $15,000 to $24,999 | 3 | 7.5% |
| $25,000 to $34,999 | 1 | 2.5% |
| $35,000 to $49,999 | 5 | 12.5% |
| $50,000 to $74,999 | 8 | 20.0% |
| $75,000 to $99,999 | 18 | 45.0% |
| $100,000 to $149,999 | 2 | 5.0% |
| $150,000 to $199,999 | 1 | 2.5% |
| $200,000+ | 0 | 0.0% |
Household Income by Householder Age in Macon
The median household income in Macon is $77,917, with the highest median household income of $93,250 found in the 45 to 64 years age bracket for the primary householder. A total of 18 households (45.0%) fall into this category. Meanwhile, the 15 to 24 years age bracket for the primary householder has the lowest median household income of $0, with 2 households (5.0%) in this group.
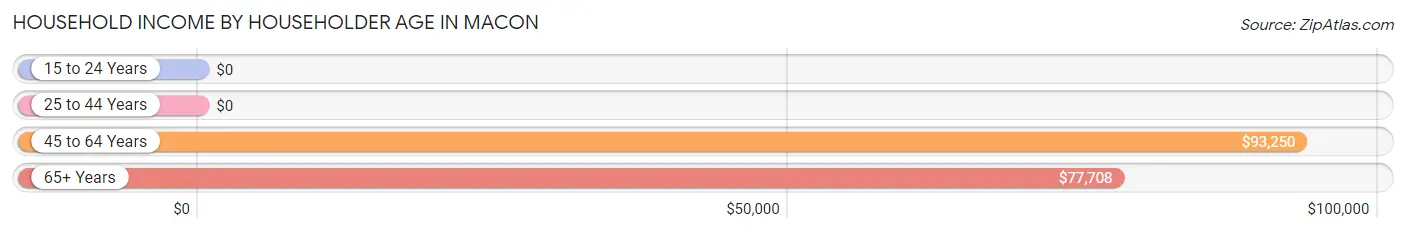
| Income Bracket | # Households | Median Income |
| 15 to 24 Years | 2 (5.0%) | $0 |
| 25 to 44 Years | 7 (17.5%) | $0 |
| 45 to 64 Years | 18 (45.0%) | $93,250 |
| 65+ Years | 13 (32.5%) | $77,708 |
| Total | 40 (100.0%) | $77,917 |
Poverty in Macon
Income Below Poverty by Sex and Age in Macon
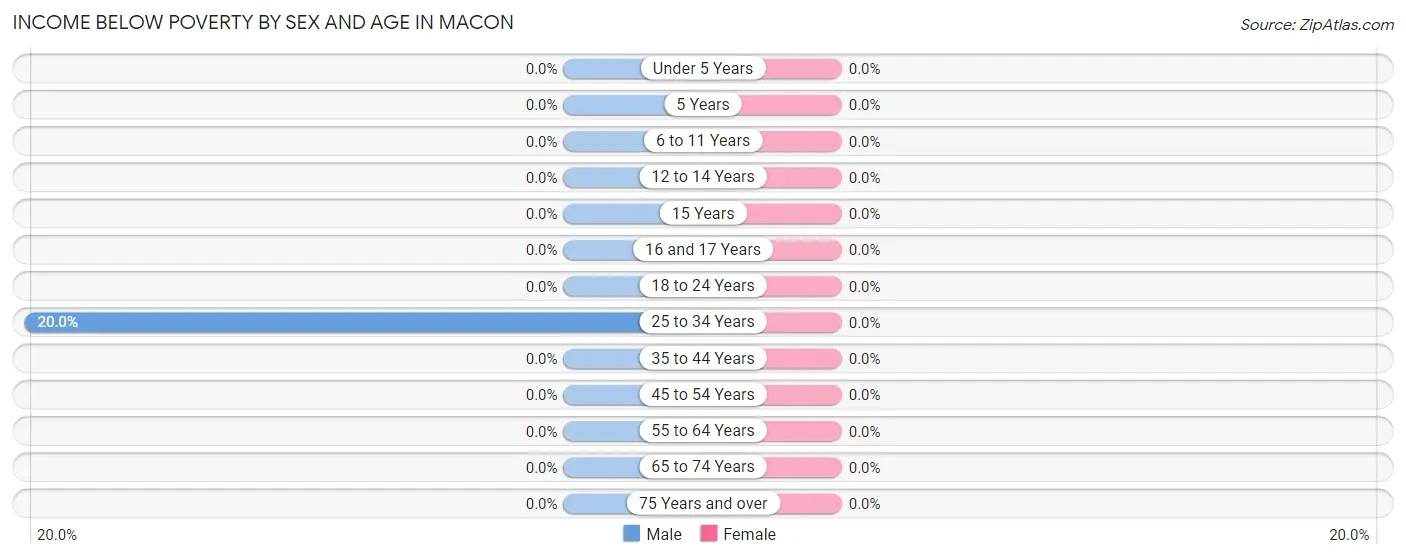
| Age Bracket | Male | Female |
| Under 5 Years | 0 (0.0%) | 0 (0.0%) |
| 5 Years | 0 (0.0%) | 0 (0.0%) |
| 6 to 11 Years | 0 (0.0%) | 0 (0.0%) |
| 12 to 14 Years | 0 (0.0%) | 0 (0.0%) |
| 15 Years | 0 (0.0%) | 0 (0.0%) |
| 16 and 17 Years | 0 (0.0%) | 0 (0.0%) |
| 18 to 24 Years | 0 (0.0%) | 0 (0.0%) |
| 25 to 34 Years | 2 (20.0%) | 0 (0.0%) |
| 35 to 44 Years | 0 (0.0%) | 0 (0.0%) |
| 45 to 54 Years | 0 (0.0%) | 0 (0.0%) |
| 55 to 64 Years | 0 (0.0%) | 0 (0.0%) |
| 65 to 74 Years | 0 (0.0%) | 0 (0.0%) |
| 75 Years and over | 0 (0.0%) | 0 (0.0%) |
| Total | 2 (4.2%) | 0 (0.0%) |
Income Above Poverty by Sex and Age in Macon
According to the poverty statistics in Macon, males aged under 5 years and females aged 5 years are the age groups that are most secure financially, with 100.0% of males and 100.0% of females in these age groups living above the poverty line.
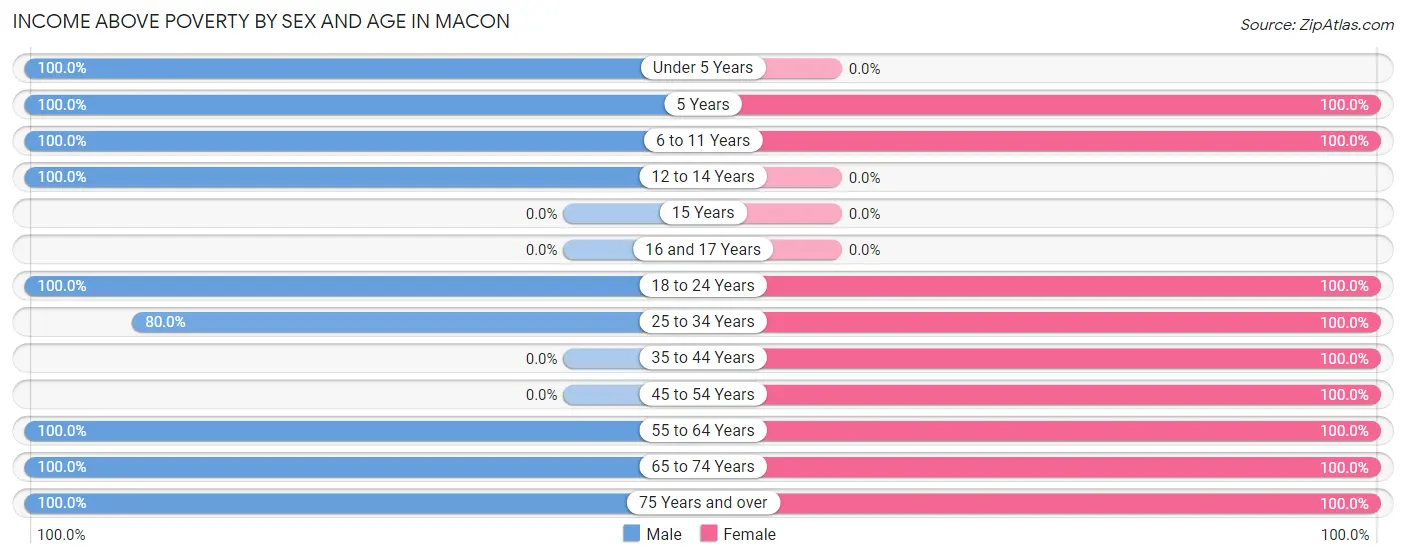
| Age Bracket | Male | Female |
| Under 5 Years | 14 (100.0%) | 0 (0.0%) |
| 5 Years | 1 (100.0%) | 3 (100.0%) |
| 6 to 11 Years | 1 (100.0%) | 2 (100.0%) |
| 12 to 14 Years | 2 (100.0%) | 0 (0.0%) |
| 15 Years | 0 (0.0%) | 0 (0.0%) |
| 16 and 17 Years | 0 (0.0%) | 0 (0.0%) |
| 18 to 24 Years | 2 (100.0%) | 2 (100.0%) |
| 25 to 34 Years | 8 (80.0%) | 6 (100.0%) |
| 35 to 44 Years | 0 (0.0%) | 2 (100.0%) |
| 45 to 54 Years | 0 (0.0%) | 10 (100.0%) |
| 55 to 64 Years | 5 (100.0%) | 11 (100.0%) |
| 65 to 74 Years | 10 (100.0%) | 2 (100.0%) |
| 75 Years and over | 3 (100.0%) | 4 (100.0%) |
| Total | 46 (95.8%) | 42 (100.0%) |
Income Below Poverty Among Married-Couple Families in Macon
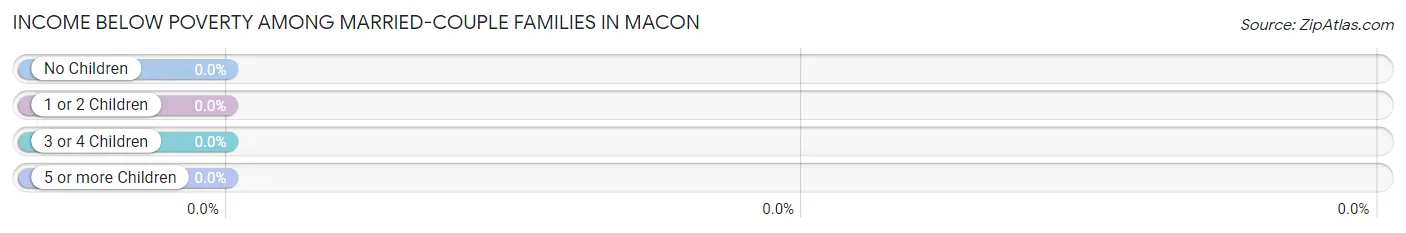
| Children | Above Poverty | Below Poverty |
| No Children | 11 (100.0%) | 0 (0.0%) |
| 1 or 2 Children | 17 (100.0%) | 0 (0.0%) |
| 3 or 4 Children | 2 (100.0%) | 0 (0.0%) |
| 5 or more Children | 0 (0.0%) | 0 (0.0%) |
| Total | 30 (100.0%) | 0 (0.0%) |
Income Below Poverty Among Single-Parent Households in Macon
| Children | Single Father | Single Mother |
| No Children | 0 (0.0%) | 0 (0.0%) |
| 1 or 2 Children | 0 (0.0%) | 0 (0.0%) |
| 3 or 4 Children | 0 (0.0%) | 0 (0.0%) |
| 5 or more Children | 0 (0.0%) | 0 (0.0%) |
| Total | 0 (0.0%) | 0 (0.0%) |
Income Below Poverty Among Married-Couple vs Single-Parent Households in Macon
| Children | Married-Couple Families | Single-Parent Households |
| No Children | 0 (0.0%) | 0 (0.0%) |
| 1 or 2 Children | 0 (0.0%) | 0 (0.0%) |
| 3 or 4 Children | 0 (0.0%) | 0 (0.0%) |
| 5 or more Children | 0 (0.0%) | 0 (0.0%) |
| Total | 0 (0.0%) | 0 (0.0%) |
Race in Macon
The most populous races in Macon are , and White / Caucasian (90 | 100.0%).
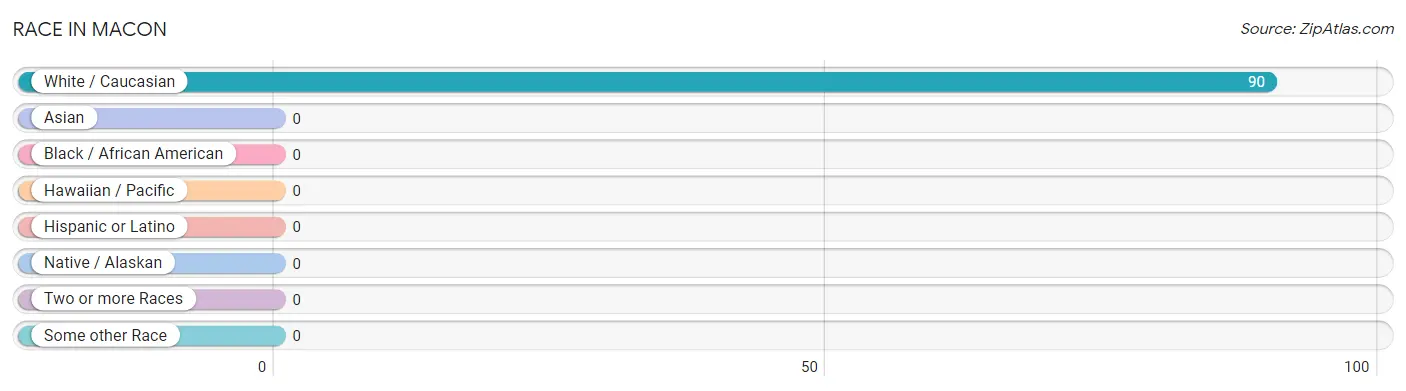
| Race | # Population | % Population |
| Asian | 0 | 0.0% |
| Black / African American | 0 | 0.0% |
| Hawaiian / Pacific | 0 | 0.0% |
| Hispanic or Latino | 0 | 0.0% |
| Native / Alaskan | 0 | 0.0% |
| White / Caucasian | 90 | 100.0% |
| Two or more Races | 0 | 0.0% |
| Some other Race | 0 | 0.0% |
| Total | 90 | 100.0% |
Ancestry in Macon
The most populous ancestries reported in Macon are American (37 | 41.1%), Irish (17 | 18.9%), English (16 | 17.8%), Danish (10 | 11.1%), and Scottish (4 | 4.4%), together accounting for 93.3% of all Macon residents.
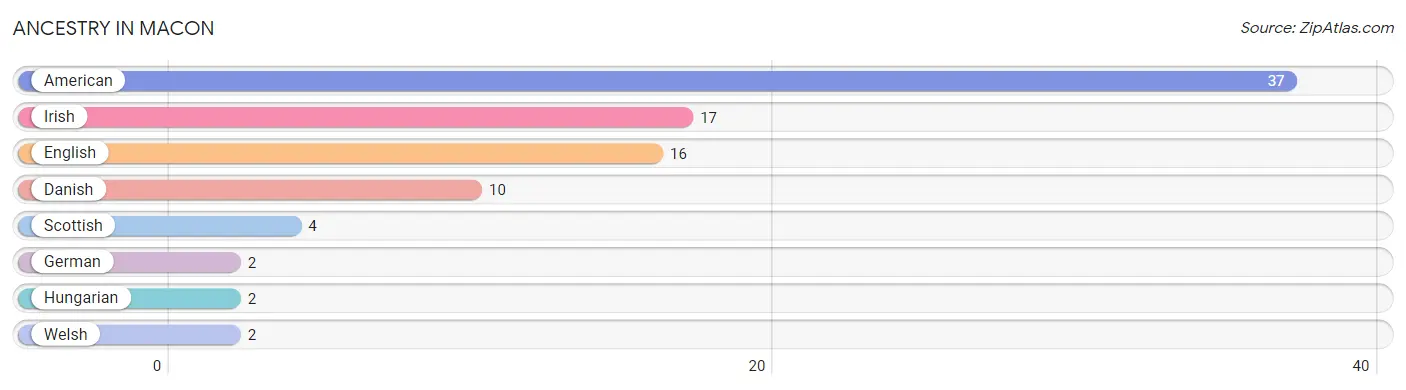
| Ancestry | # Population | % Population |
| American | 37 | 41.1% |
| Danish | 10 | 11.1% |
| English | 16 | 17.8% |
| German | 2 | 2.2% |
| Hungarian | 2 | 2.2% |
| Irish | 17 | 18.9% |
| Scottish | 4 | 4.4% |
| Welsh | 2 | 2.2% | View All 8 Rows |
Immigrants in Macon

| Immigration Origin | # Population | % Population | View All 0 Rows |
Sex and Age in Macon
Sex and Age in Macon
The most populous age groups in Macon are Under 5 Years (14 | 29.2%) for men and 45 to 49 Years (10 | 23.8%) for women.
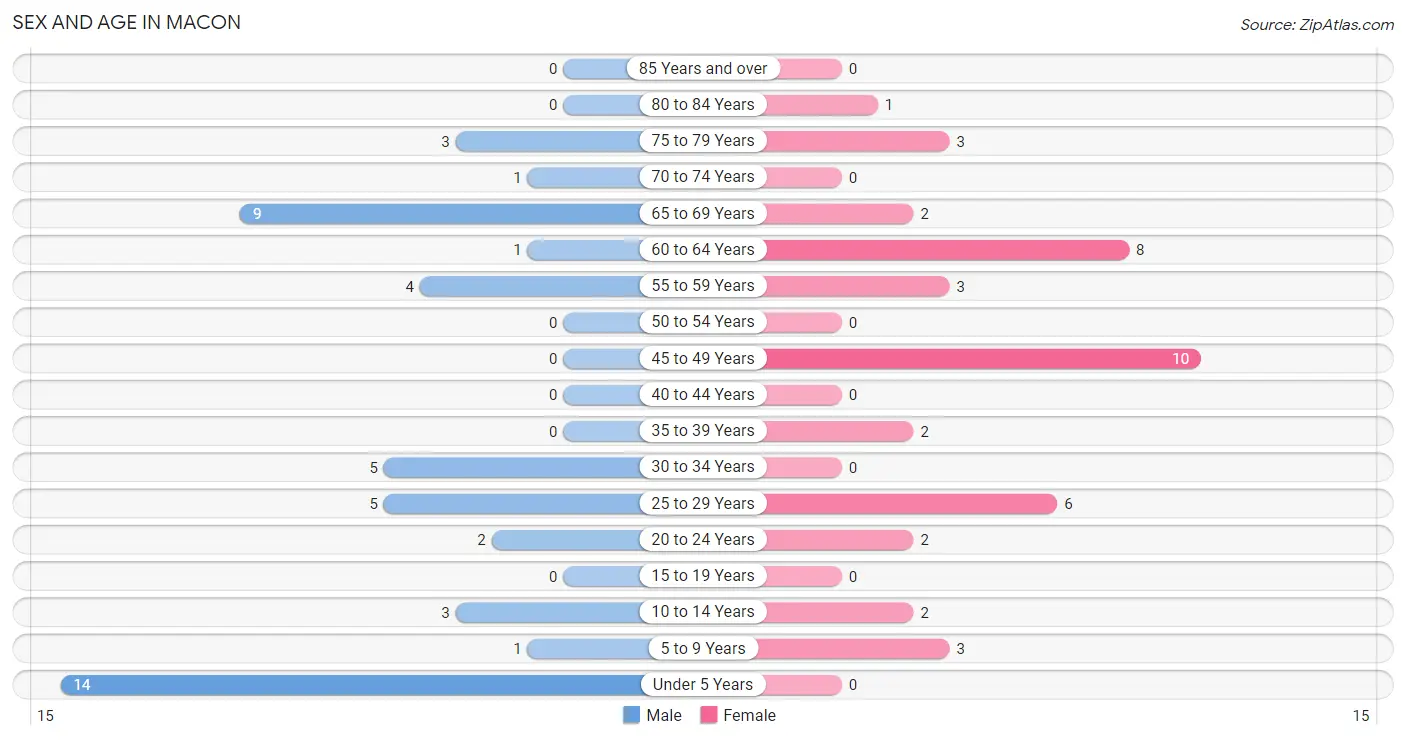
| Age Bracket | Male | Female |
| Under 5 Years | 14 (29.2%) | 0 (0.0%) |
| 5 to 9 Years | 1 (2.1%) | 3 (7.1%) |
| 10 to 14 Years | 3 (6.2%) | 2 (4.8%) |
| 15 to 19 Years | 0 (0.0%) | 0 (0.0%) |
| 20 to 24 Years | 2 (4.2%) | 2 (4.8%) |
| 25 to 29 Years | 5 (10.4%) | 6 (14.3%) |
| 30 to 34 Years | 5 (10.4%) | 0 (0.0%) |
| 35 to 39 Years | 0 (0.0%) | 2 (4.8%) |
| 40 to 44 Years | 0 (0.0%) | 0 (0.0%) |
| 45 to 49 Years | 0 (0.0%) | 10 (23.8%) |
| 50 to 54 Years | 0 (0.0%) | 0 (0.0%) |
| 55 to 59 Years | 4 (8.3%) | 3 (7.1%) |
| 60 to 64 Years | 1 (2.1%) | 8 (19.1%) |
| 65 to 69 Years | 9 (18.8%) | 2 (4.8%) |
| 70 to 74 Years | 1 (2.1%) | 0 (0.0%) |
| 75 to 79 Years | 3 (6.2%) | 3 (7.1%) |
| 80 to 84 Years | 0 (0.0%) | 1 (2.4%) |
| 85 Years and over | 0 (0.0%) | 0 (0.0%) |
| Total | 48 (100.0%) | 42 (100.0%) |
Families and Households in Macon
Median Family Size in Macon
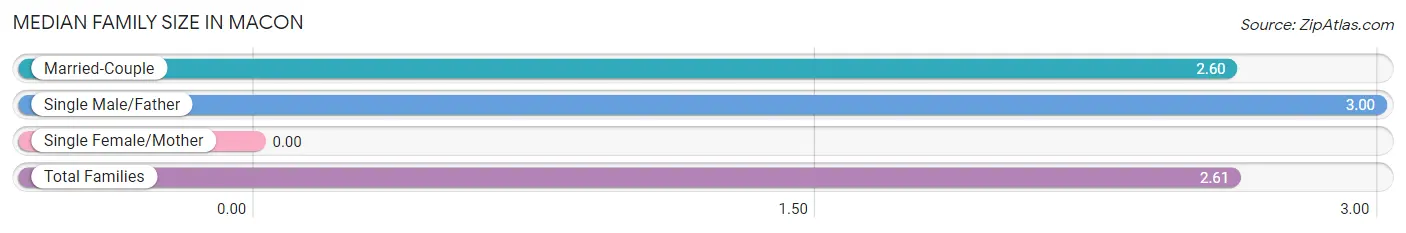
| Family Type | # Families | Family Size |
| Married-Couple | 30 (96.8%) | 2.60 |
| Single Male/Father | 1 (3.2%) | 3.00 |
| Single Female/Mother | 0 (0.0%) | - |
| Total Families | 31 (100.0%) | 2.61 |
Median Household Size in Macon
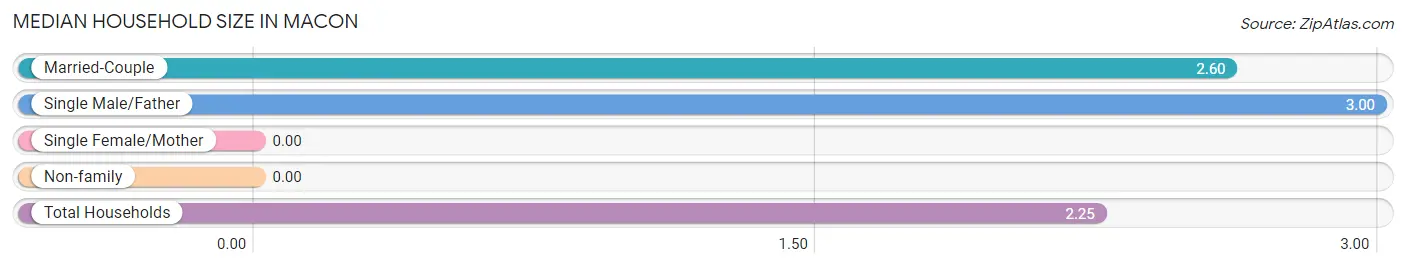
| Household Type | # Households | Household Size |
| Married-Couple | 30 (75.0%) | 2.60 |
| Single Male/Father | 1 (2.5%) | 3.00 |
| Single Female/Mother | 0 (0.0%) | - |
| Non-family | 9 (22.5%) | - |
| Total Households | 40 (100.0%) | 2.25 |
Household Size by Marriage Status in Macon
Out of a total of 40 households in Macon, 31 (77.5%) are family households, while 9 (22.5%) are nonfamily households. The most numerous type of family households are 3-person households, comprising 20, and the most common type of nonfamily households are 1-person households, comprising 9.
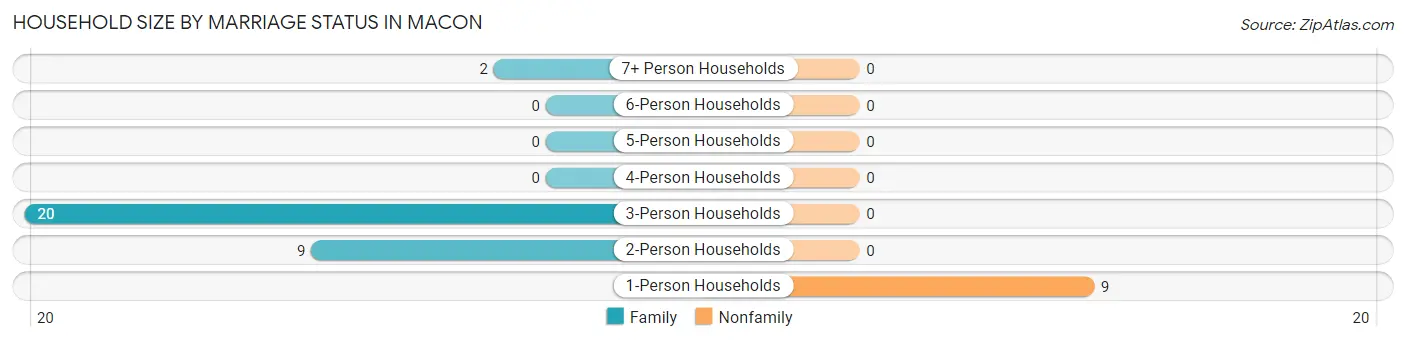
| Household Size | Family Households | Nonfamily Households |
| 1-Person Households | - | 9 (22.5%) |
| 2-Person Households | 9 (22.5%) | 0 (0.0%) |
| 3-Person Households | 20 (50.0%) | 0 (0.0%) |
| 4-Person Households | 0 (0.0%) | 0 (0.0%) |
| 5-Person Households | 0 (0.0%) | 0 (0.0%) |
| 6-Person Households | 0 (0.0%) | 0 (0.0%) |
| 7+ Person Households | 2 (5.0%) | 0 (0.0%) |
| Total | 31 (77.5%) | 9 (22.5%) |
Female Fertility in Macon
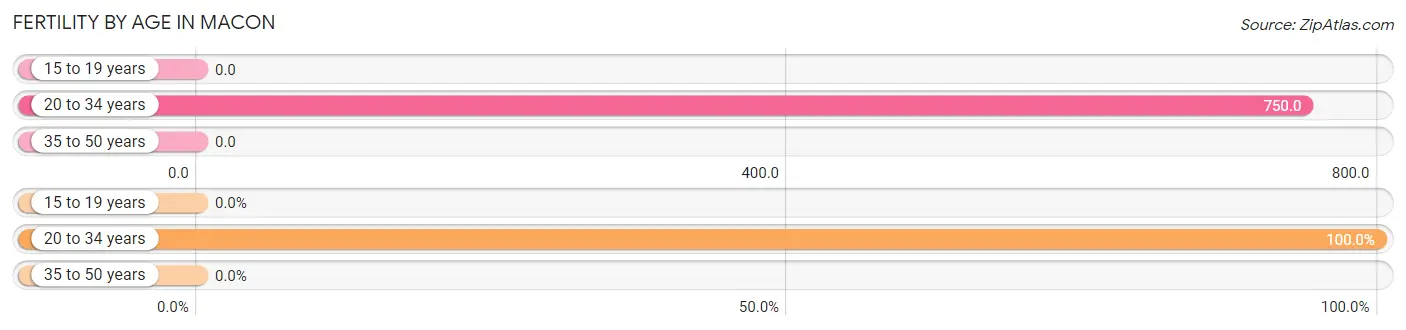
Fertility by Age in Macon
Average fertility rate in Macon is 300.0 births per 1,000 women. Women in the age bracket of 20 to 34 years have the highest fertility rate with 750.0 births per 1,000 women. Women in the age bracket of 20 to 34 years acount for 100.0% of all women with births.
| Age Bracket | Women with Births | Births / 1,000 Women |
| 15 to 19 years | 0 (0.0%) | 0.0 |
| 20 to 34 years | 6 (100.0%) | 750.0 |
| 35 to 50 years | 0 (0.0%) | 0.0 |
| Total | 6 (100.0%) | 300.0 |
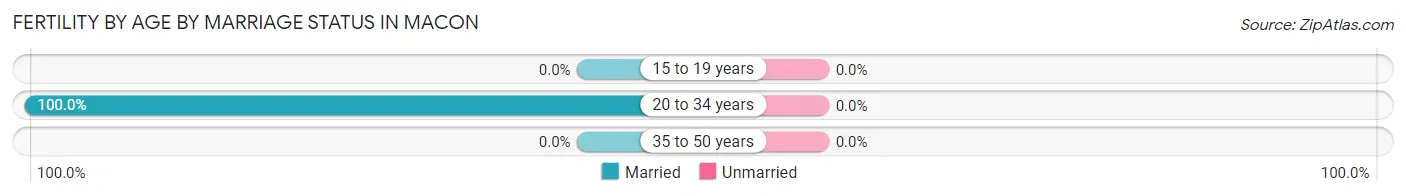
Fertility by Age by Marriage Status in Macon
| Age Bracket | Married | Unmarried |
| 15 to 19 years | 0 (0.0%) | 0 (0.0%) |
| 20 to 34 years | 6 (100.0%) | 0 (0.0%) |
| 35 to 50 years | 0 (0.0%) | 0 (0.0%) |
| Total | 6 (100.0%) | 0 (0.0%) |
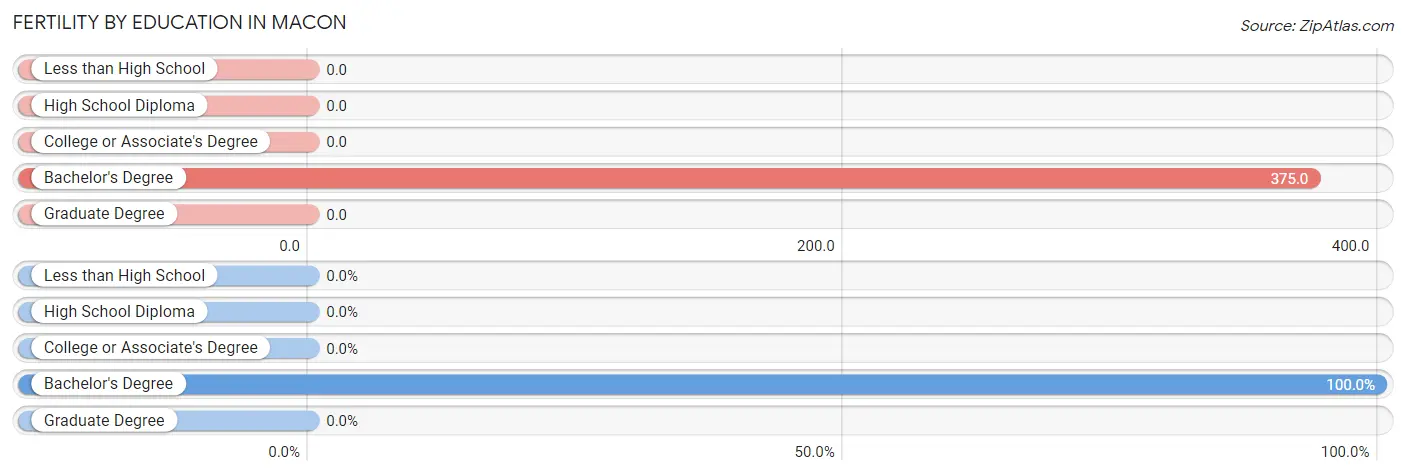
Fertility by Education in Macon
| Educational Attainment | Women with Births | Births / 1,000 Women |
| Less than High School | 0 (0.0%) | 0.0 |
| High School Diploma | 0 (0.0%) | 0.0 |
| College or Associate's Degree | 0 (0.0%) | 0.0 |
| Bachelor's Degree | 6 (100.0%) | 375.0 |
| Graduate Degree | 0 (0.0%) | 0.0 |
| Total | 6 (100.0%) | 300.0 |
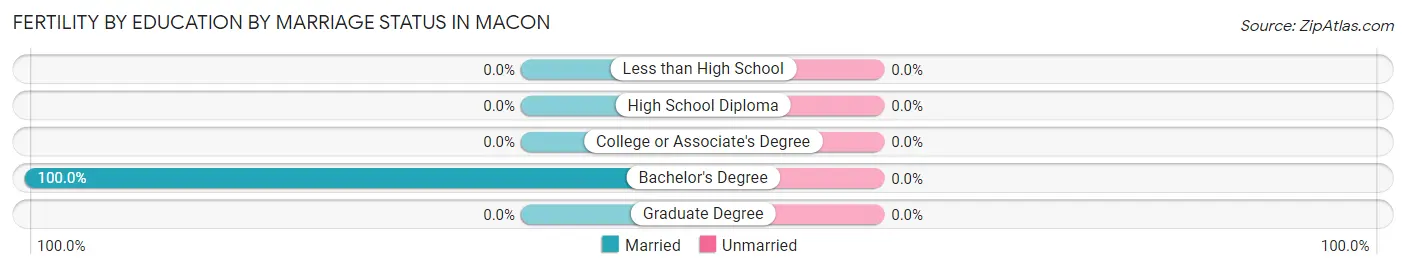
Fertility by Education by Marriage Status in Macon
| Educational Attainment | Married | Unmarried |
| Less than High School | 0 (0.0%) | 0 (0.0%) |
| High School Diploma | 0 (0.0%) | 0 (0.0%) |
| College or Associate's Degree | 0 (0.0%) | 0 (0.0%) |
| Bachelor's Degree | 6 (100.0%) | 0 (0.0%) |
| Graduate Degree | 0 (0.0%) | 0 (0.0%) |
| Total | 6 (100.0%) | 0 (0.0%) |
Employment Characteristics in Macon
Employment by Class of Employer in Macon
Among the 42 employed individuals in Macon, private company employees (29 | 69.1%), not-for-profit organizations (5 | 11.9%), and local government employees (5 | 11.9%) make up the most common classes of employment.
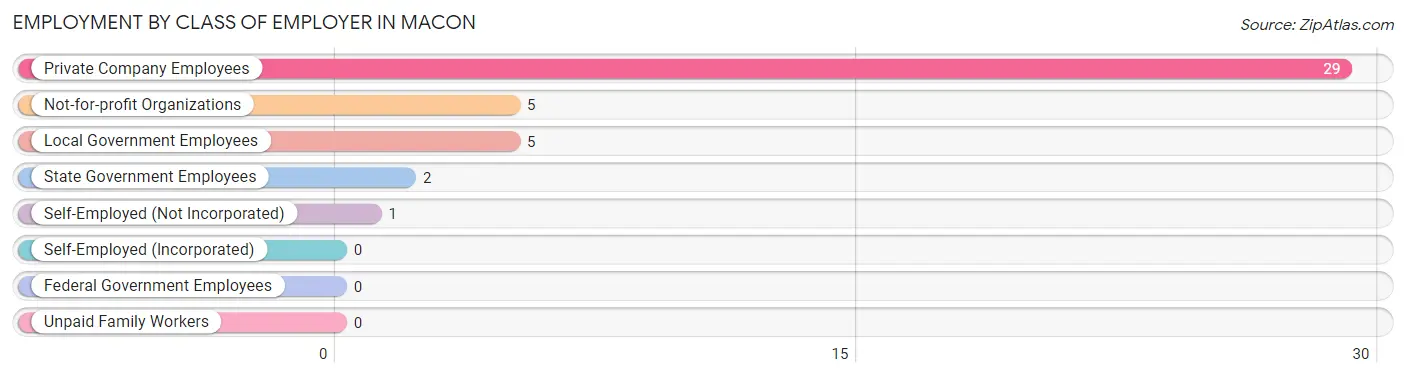
| Employer Class | # Employees | % Employees |
| Private Company Employees | 29 | 69.1% |
| Self-Employed (Incorporated) | 0 | 0.0% |
| Self-Employed (Not Incorporated) | 1 | 2.4% |
| Not-for-profit Organizations | 5 | 11.9% |
| Local Government Employees | 5 | 11.9% |
| State Government Employees | 2 | 4.8% |
| Federal Government Employees | 0 | 0.0% |
| Unpaid Family Workers | 0 | 0.0% |
| Total | 42 | 100.0% |
Employment Status by Age in Macon
According to the labor force statistics for Macon, out of the total population over 16 years of age (67), 74.6% or 50 individuals are in the labor force, with 16.0% or 8 of them unemployed. The age group with the highest labor force participation rate is 20 to 24 years, with 100.0% or 4 individuals in the labor force. Within the labor force, the 25 to 29 years age range has the highest percentage of unemployed individuals, with 72.7% or 8 of them being unemployed.
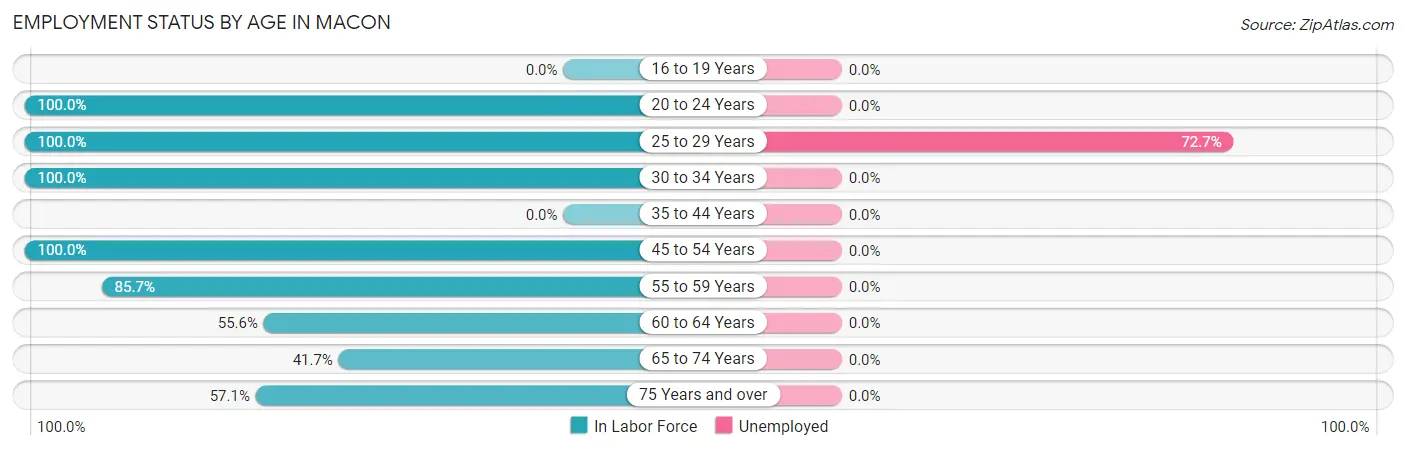
| Age Bracket | In Labor Force | Unemployed |
| 16 to 19 Years | 0 (0.0%) | 0 (0.0%) |
| 20 to 24 Years | 4 (100.0%) | 0 (0.0%) |
| 25 to 29 Years | 11 (100.0%) | 8 (72.7%) |
| 30 to 34 Years | 5 (100.0%) | 0 (0.0%) |
| 35 to 44 Years | 0 (0.0%) | 0 (0.0%) |
| 45 to 54 Years | 10 (100.0%) | 0 (0.0%) |
| 55 to 59 Years | 6 (85.7%) | 0 (0.0%) |
| 60 to 64 Years | 5 (55.6%) | 0 (0.0%) |
| 65 to 74 Years | 5 (41.7%) | 0 (0.0%) |
| 75 Years and over | 4 (57.1%) | 0 (0.0%) |
| Total | 50 (74.6%) | 8 (16.0%) |
Employment Status by Educational Attainment in Macon
According to labor force statistics for Macon, 84.1% of individuals (37) out of the total population between 25 and 64 years of age (44) are in the labor force, with 21.6% or 8 of them being unemployed. The group with the highest labor force participation rate are those with the educational attainment of less than high school, with 100.0% or 3 individuals in the labor force. Within the labor force, individuals with bachelor's degree or higher education have the highest percentage of unemployment, with 37.5% or 6 of them being unemployed.
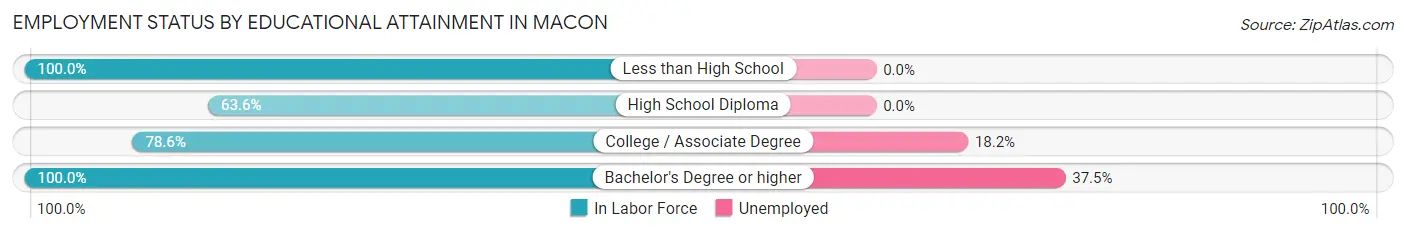
| Educational Attainment | In Labor Force | Unemployed |
| Less than High School | 3 (100.0%) | 0 (0.0%) |
| High School Diploma | 7 (63.6%) | 0 (0.0%) |
| College / Associate Degree | 11 (78.6%) | 3 (18.2%) |
| Bachelor's Degree or higher | 16 (100.0%) | 6 (37.5%) |
| Total | 37 (84.1%) | 10 (21.6%) |
Employment Occupations by Sex in Macon
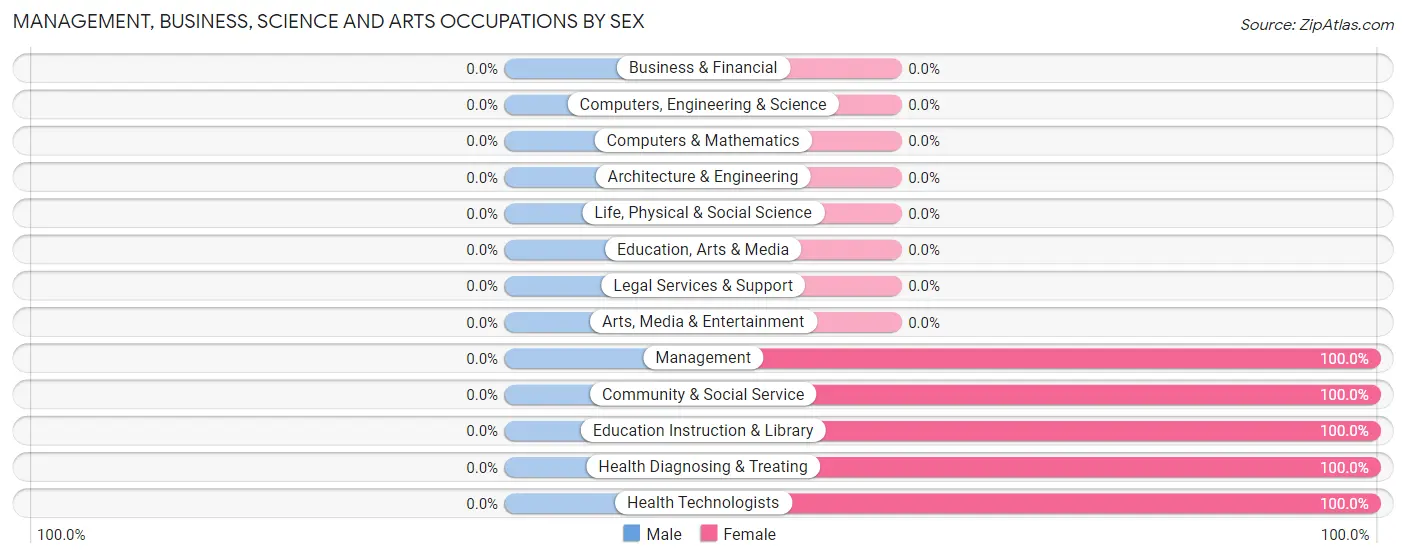
Management, Business, Science and Arts Occupations
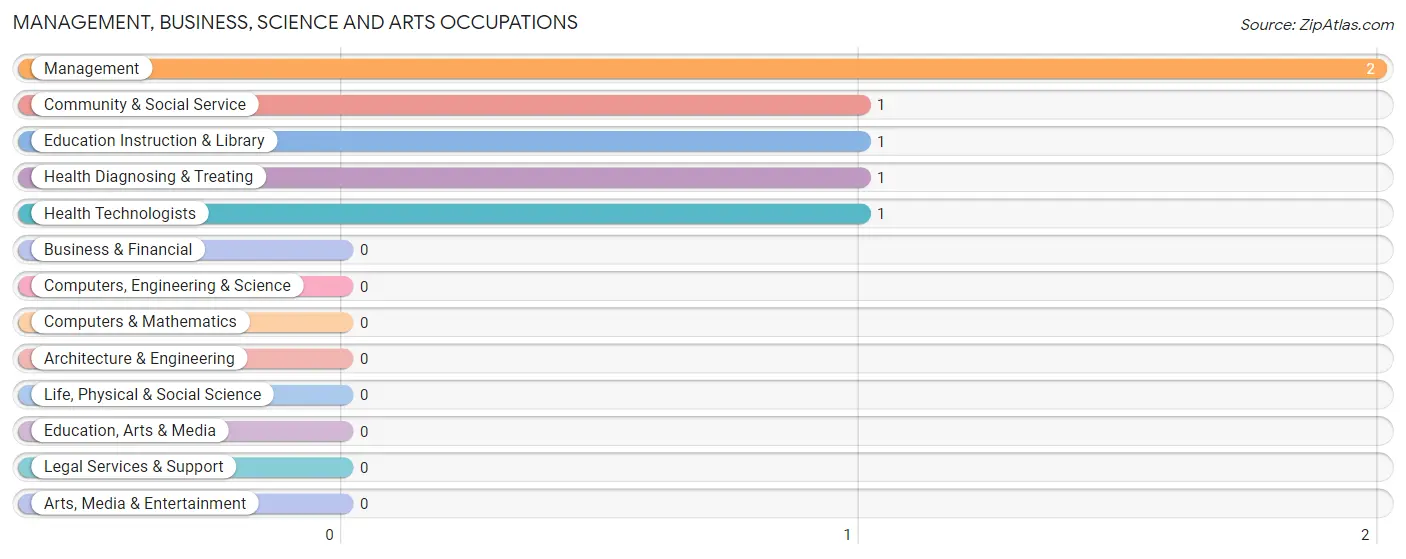
The most common Management, Business, Science and Arts occupations in Macon are Management (2 | 4.8%), Community & Social Service (1 | 2.4%), Education Instruction & Library (1 | 2.4%), Health Diagnosing & Treating (1 | 2.4%), and Health Technologists (1 | 2.4%).
Management, Business, Science and Arts Occupations by Sex
| Occupation | Male | Female |
| Management | 0 (0.0%) | 2 (100.0%) |
| Business & Financial | 0 (0.0%) | 0 (0.0%) |
| Computers, Engineering & Science | 0 (0.0%) | 0 (0.0%) |
| Computers & Mathematics | 0 (0.0%) | 0 (0.0%) |
| Architecture & Engineering | 0 (0.0%) | 0 (0.0%) |
| Life, Physical & Social Science | 0 (0.0%) | 0 (0.0%) |
| Community & Social Service | 0 (0.0%) | 1 (100.0%) |
| Education, Arts & Media | 0 (0.0%) | 0 (0.0%) |
| Legal Services & Support | 0 (0.0%) | 0 (0.0%) |
| Education Instruction & Library | 0 (0.0%) | 1 (100.0%) |
| Arts, Media & Entertainment | 0 (0.0%) | 0 (0.0%) |
| Health Diagnosing & Treating | 0 (0.0%) | 1 (100.0%) |
| Health Technologists | 0 (0.0%) | 1 (100.0%) |
| Total (Category) | 0 (0.0%) | 4 (100.0%) |
| Total (Overall) | 17 (40.5%) | 25 (59.5%) |
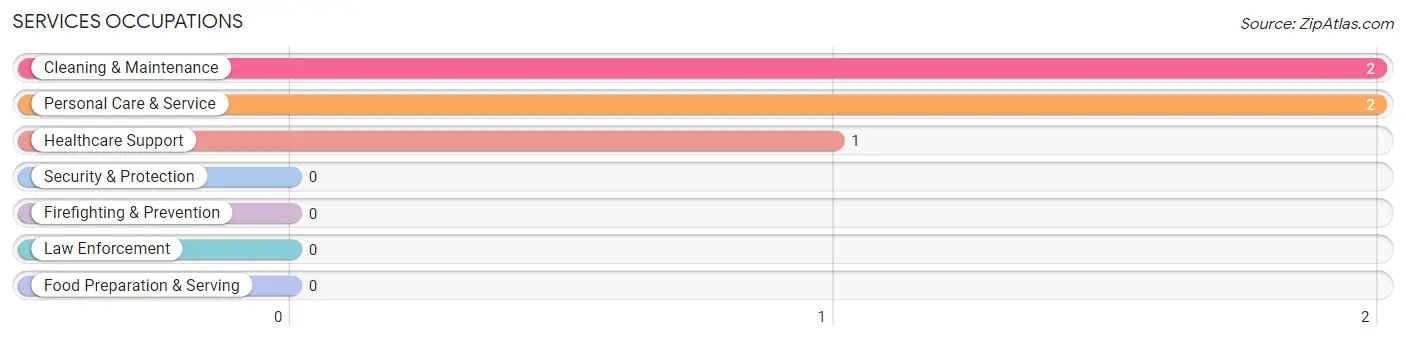
Services Occupations
The most common Services occupations in Macon are Cleaning & Maintenance (2 | 4.8%), Personal Care & Service (2 | 4.8%), and Healthcare Support (1 | 2.4%).
Services Occupations by Sex
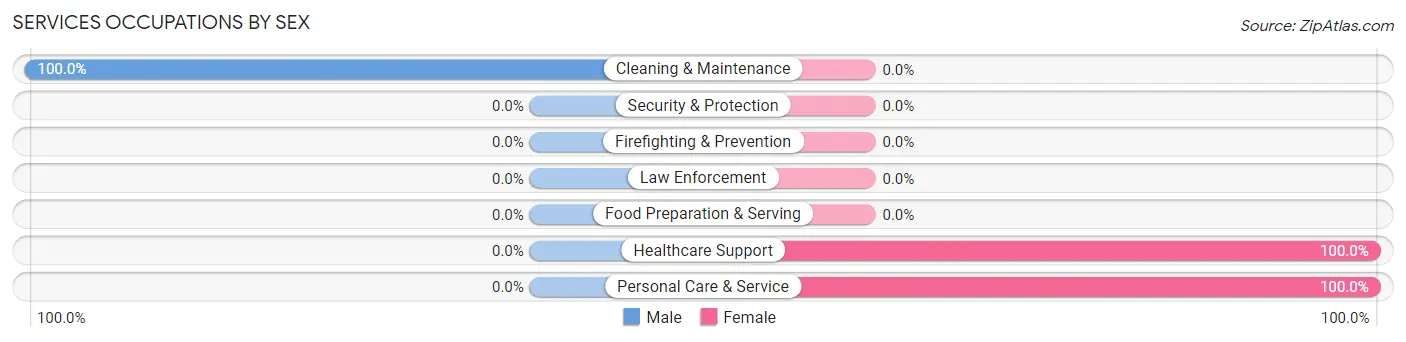
| Occupation | Male | Female |
| Healthcare Support | 0 (0.0%) | 1 (100.0%) |
| Security & Protection | 0 (0.0%) | 0 (0.0%) |
| Firefighting & Prevention | 0 (0.0%) | 0 (0.0%) |
| Law Enforcement | 0 (0.0%) | 0 (0.0%) |
| Food Preparation & Serving | 0 (0.0%) | 0 (0.0%) |
| Cleaning & Maintenance | 2 (100.0%) | 0 (0.0%) |
| Personal Care & Service | 0 (0.0%) | 2 (100.0%) |
| Total (Category) | 2 (40.0%) | 3 (60.0%) |
| Total (Overall) | 17 (40.5%) | 25 (59.5%) |
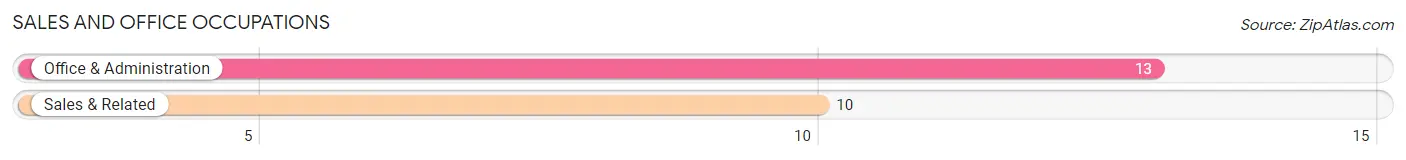
Sales and Office Occupations
The most common Sales and Office occupations in Macon are Office & Administration (13 | 30.9%), and Sales & Related (10 | 23.8%).
Sales and Office Occupations by Sex

| Occupation | Male | Female |
| Sales & Related | 0 (0.0%) | 10 (100.0%) |
| Office & Administration | 5 (38.5%) | 8 (61.5%) |
| Total (Category) | 5 (21.7%) | 18 (78.3%) |
| Total (Overall) | 17 (40.5%) | 25 (59.5%) |
Natural Resources, Construction and Maintenance Occupations
The most common Natural Resources, Construction and Maintenance occupations in Macon are , and Construction & Extraction (1 | 2.4%).
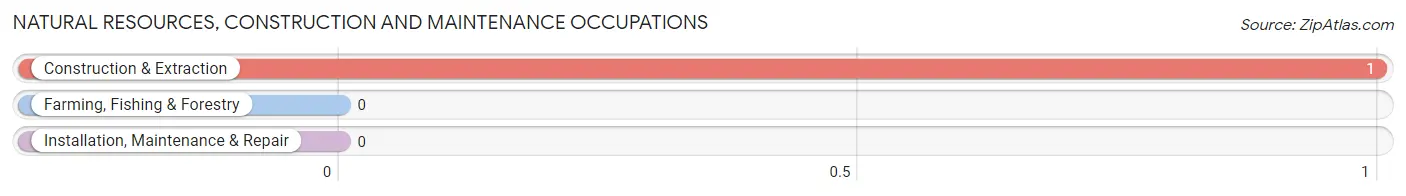
Natural Resources, Construction and Maintenance Occupations by Sex
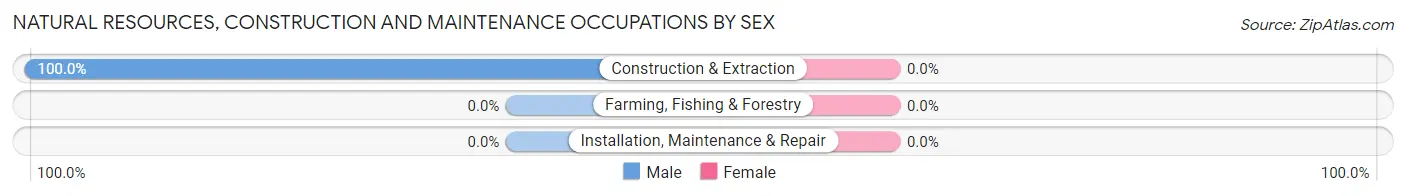
| Occupation | Male | Female |
| Farming, Fishing & Forestry | 0 (0.0%) | 0 (0.0%) |
| Construction & Extraction | 1 (100.0%) | 0 (0.0%) |
| Installation, Maintenance & Repair | 0 (0.0%) | 0 (0.0%) |
| Total (Category) | 1 (100.0%) | 0 (0.0%) |
| Total (Overall) | 17 (40.5%) | 25 (59.5%) |
Production, Transportation and Moving Occupations
The most common Production, Transportation and Moving occupations in Macon are Production (5 | 11.9%), and Transportation (4 | 9.5%).
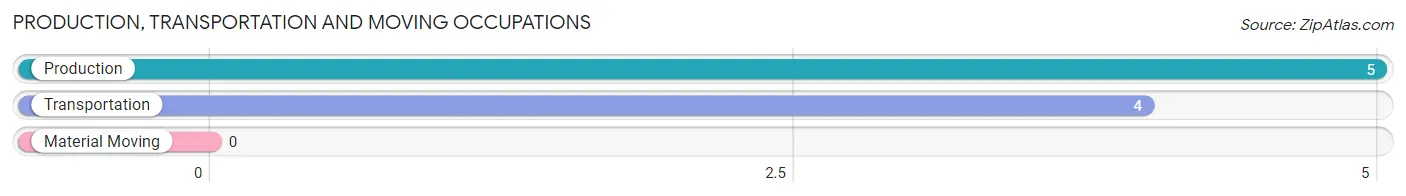
Production, Transportation and Moving Occupations by Sex
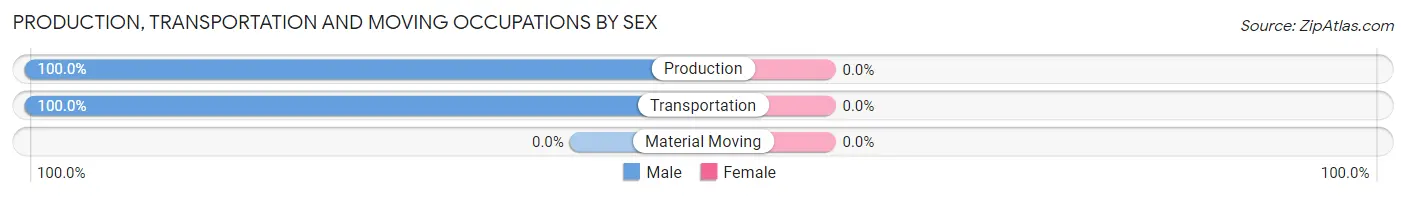
| Occupation | Male | Female |
| Production | 5 (100.0%) | 0 (0.0%) |
| Transportation | 4 (100.0%) | 0 (0.0%) |
| Material Moving | 0 (0.0%) | 0 (0.0%) |
| Total (Category) | 9 (100.0%) | 0 (0.0%) |
| Total (Overall) | 17 (40.5%) | 25 (59.5%) |
Employment Industries by Sex in Macon
Employment Industries in Macon
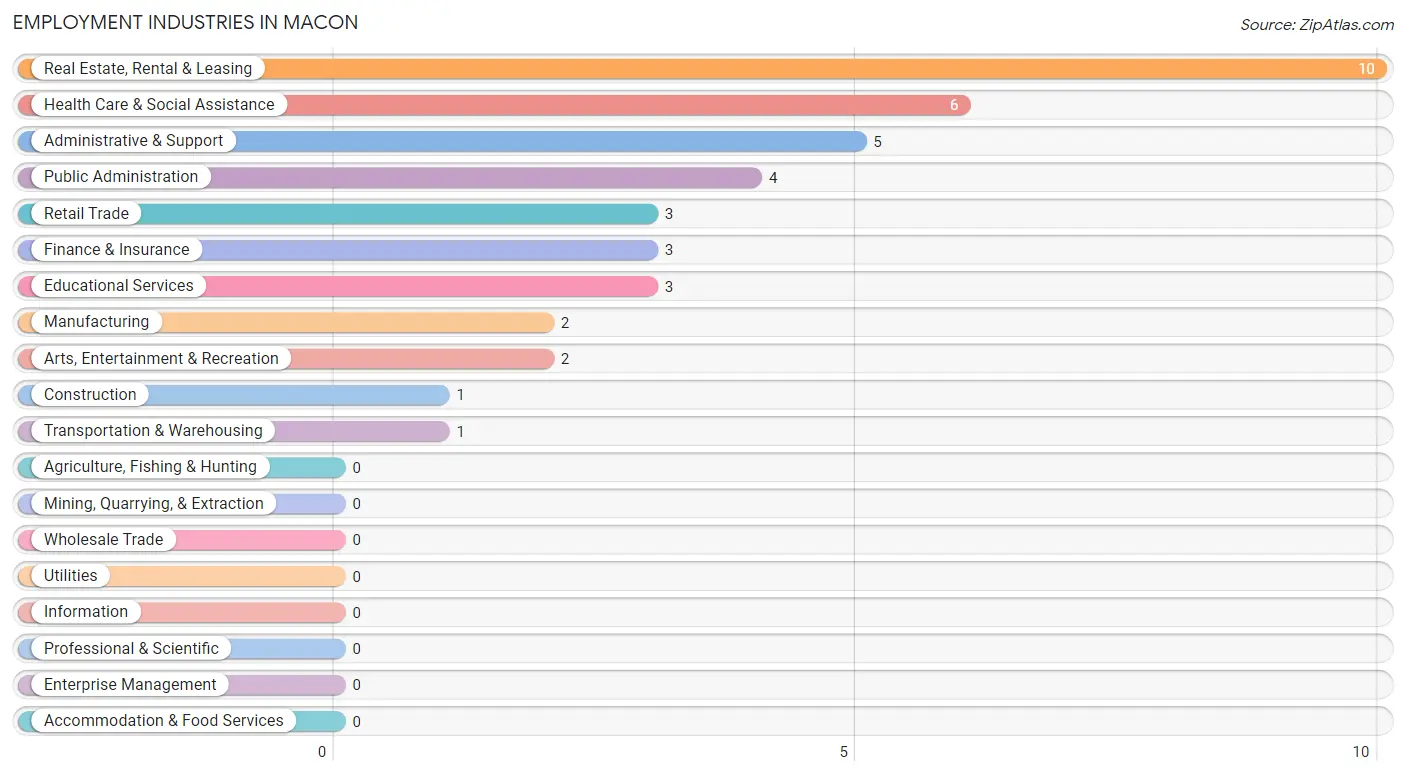
The major employment industries in Macon include Real Estate, Rental & Leasing (10 | 23.8%), Health Care & Social Assistance (6 | 14.3%), Administrative & Support (5 | 11.9%), Public Administration (4 | 9.5%), and Retail Trade (3 | 7.1%).
Employment Industries by Sex in Macon
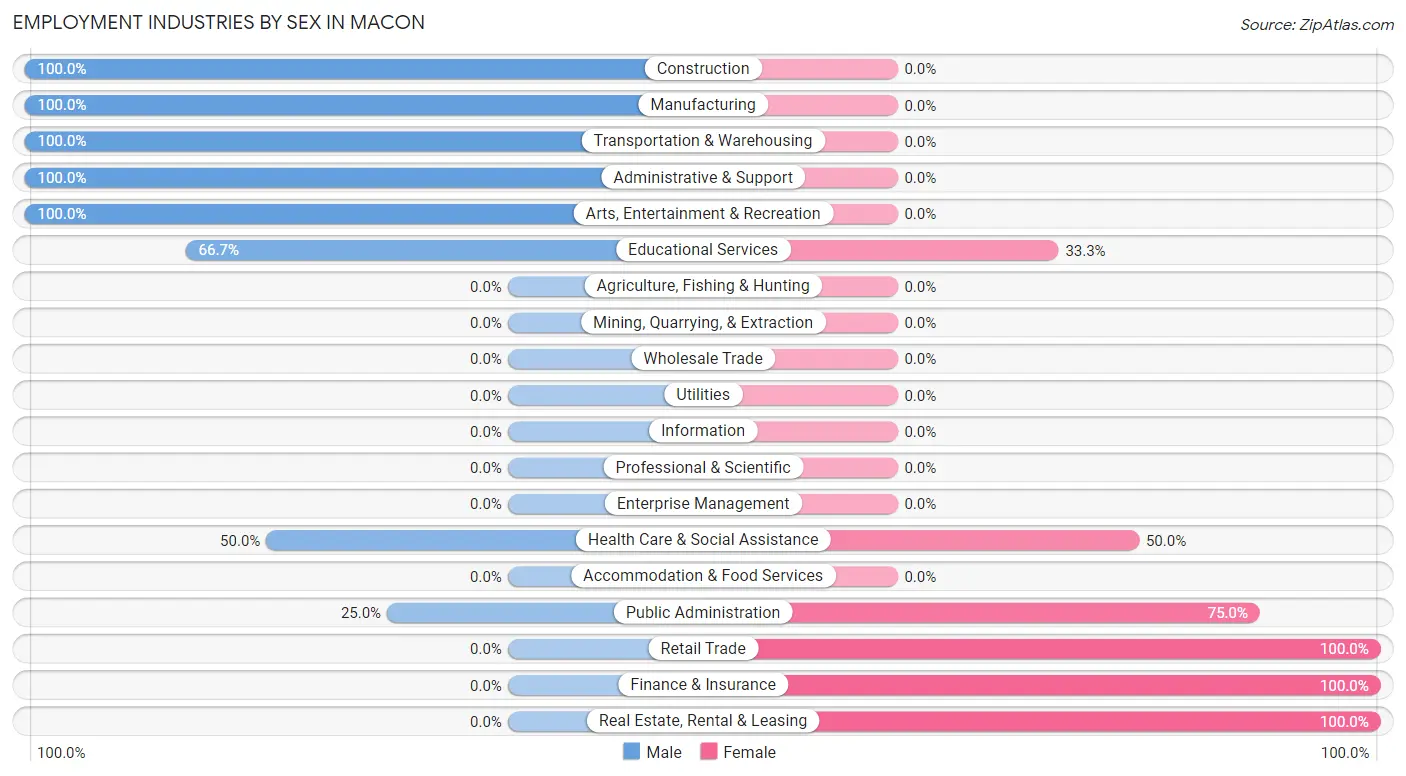
The Macon industries that see more men than women are Construction (100.0%), Manufacturing (100.0%), and Transportation & Warehousing (100.0%), whereas the industries that tend to have a higher number of women are Retail Trade (100.0%), Finance & Insurance (100.0%), and Real Estate, Rental & Leasing (100.0%).
| Industry | Male | Female |
| Agriculture, Fishing & Hunting | 0 (0.0%) | 0 (0.0%) |
| Mining, Quarrying, & Extraction | 0 (0.0%) | 0 (0.0%) |
| Construction | 1 (100.0%) | 0 (0.0%) |
| Manufacturing | 2 (100.0%) | 0 (0.0%) |
| Wholesale Trade | 0 (0.0%) | 0 (0.0%) |
| Retail Trade | 0 (0.0%) | 3 (100.0%) |
| Transportation & Warehousing | 1 (100.0%) | 0 (0.0%) |
| Utilities | 0 (0.0%) | 0 (0.0%) |
| Information | 0 (0.0%) | 0 (0.0%) |
| Finance & Insurance | 0 (0.0%) | 3 (100.0%) |
| Real Estate, Rental & Leasing | 0 (0.0%) | 10 (100.0%) |
| Professional & Scientific | 0 (0.0%) | 0 (0.0%) |
| Enterprise Management | 0 (0.0%) | 0 (0.0%) |
| Administrative & Support | 5 (100.0%) | 0 (0.0%) |
| Educational Services | 2 (66.7%) | 1 (33.3%) |
| Health Care & Social Assistance | 3 (50.0%) | 3 (50.0%) |
| Arts, Entertainment & Recreation | 2 (100.0%) | 0 (0.0%) |
| Accommodation & Food Services | 0 (0.0%) | 0 (0.0%) |
| Public Administration | 1 (25.0%) | 3 (75.0%) |
| Total | 17 (40.5%) | 25 (59.5%) |
Education in Macon
School Enrollment in Macon
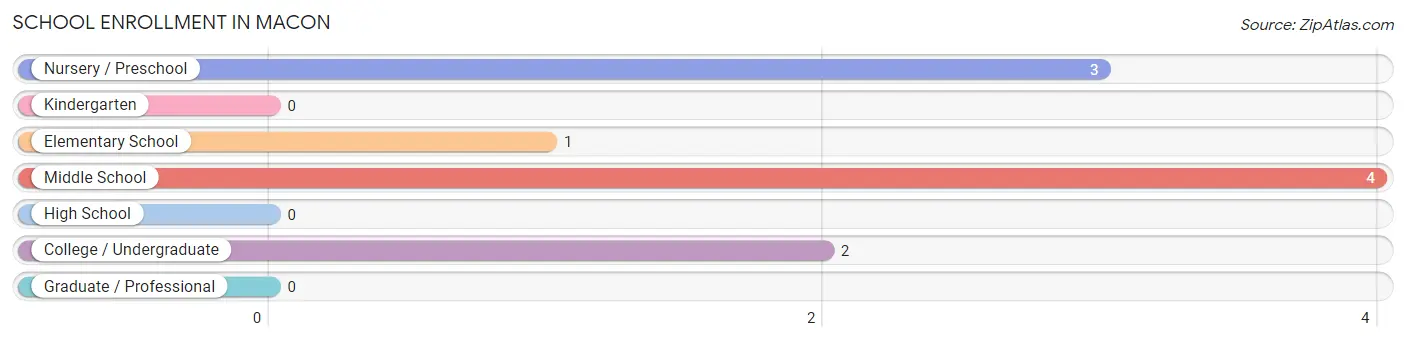
The most common levels of schooling among the 10 students in Macon are middle school (4 | 40.0%), nursery / preschool (3 | 30.0%), and college / undergraduate (2 | 20.0%).
| School Level | # Students | % Students |
| Nursery / Preschool | 3 | 30.0% |
| Kindergarten | 0 | 0.0% |
| Elementary School | 1 | 10.0% |
| Middle School | 4 | 40.0% |
| High School | 0 | 0.0% |
| College / Undergraduate | 2 | 20.0% |
| Graduate / Professional | 0 | 0.0% |
| Total | 10 | 100.0% |
School Enrollment by Age by Funding Source in Macon
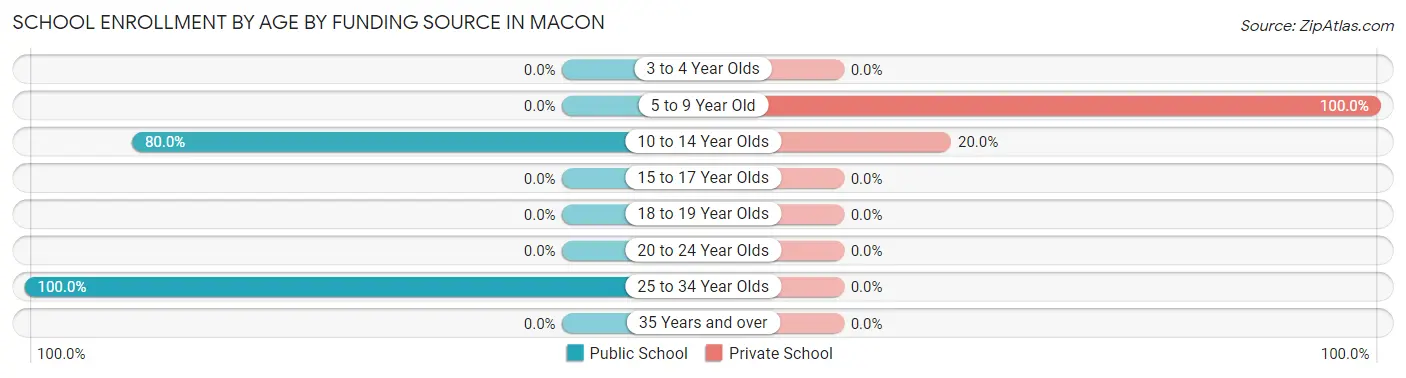
Out of a total of 10 students who are enrolled in schools in Macon, 4 (40.0%) attend a private institution, while the remaining 6 (60.0%) are enrolled in public schools. The age group of 5 to 9 year old has the highest likelihood of being enrolled in private schools, with 3 (100.0% in the age bracket) enrolled. Conversely, the age group of 25 to 34 year olds has the lowest likelihood of being enrolled in a private school, with 2 (100.0% in the age bracket) attending a public institution.
| Age Bracket | Public School | Private School |
| 3 to 4 Year Olds | 0 (0.0%) | 0 (0.0%) |
| 5 to 9 Year Old | 0 (0.0%) | 3 (100.0%) |
| 10 to 14 Year Olds | 4 (80.0%) | 1 (20.0%) |
| 15 to 17 Year Olds | 0 (0.0%) | 0 (0.0%) |
| 18 to 19 Year Olds | 0 (0.0%) | 0 (0.0%) |
| 20 to 24 Year Olds | 0 (0.0%) | 0 (0.0%) |
| 25 to 34 Year Olds | 2 (100.0%) | 0 (0.0%) |
| 35 Years and over | 0 (0.0%) | 0 (0.0%) |
| Total | 6 (60.0%) | 4 (40.0%) |
Educational Attainment by Field of Study in Macon
Social sciences (10 | 38.5%), business (10 | 38.5%), and arts & humanities (6 | 23.1%) are the most common fields of study among 26 individuals in Macon who have obtained a bachelor's degree or higher.
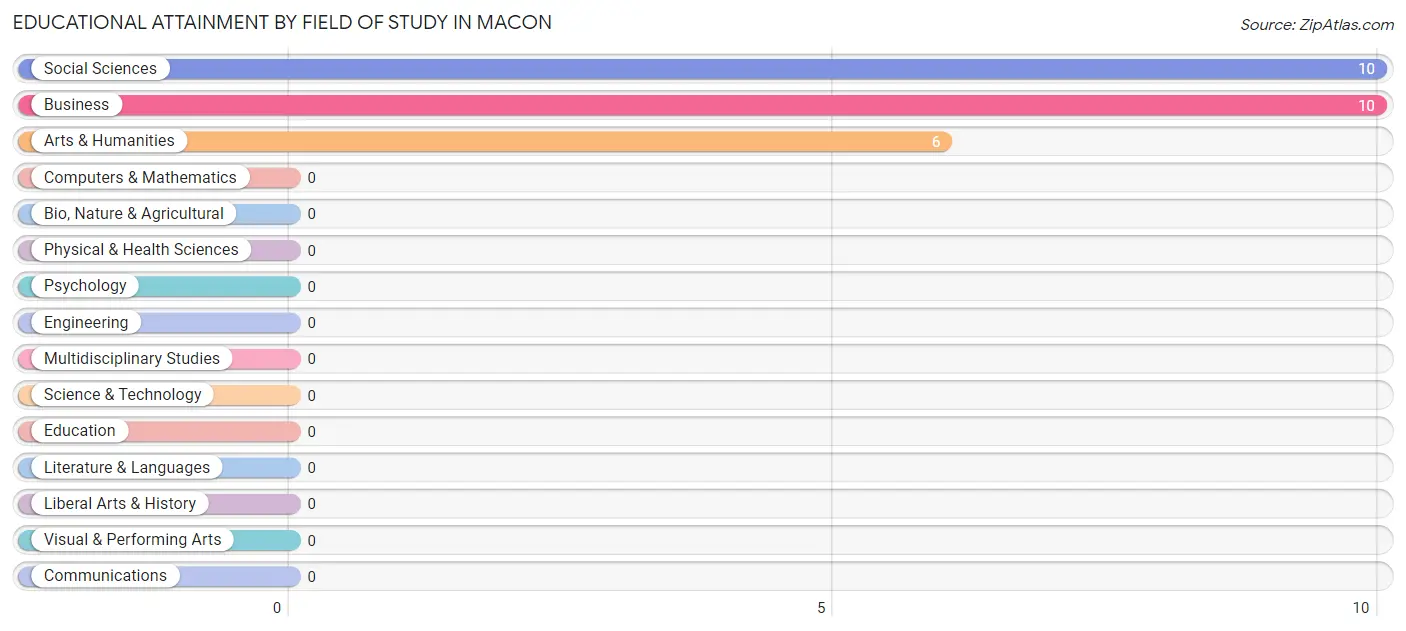
| Field of Study | # Graduates | % Graduates |
| Computers & Mathematics | 0 | 0.0% |
| Bio, Nature & Agricultural | 0 | 0.0% |
| Physical & Health Sciences | 0 | 0.0% |
| Psychology | 0 | 0.0% |
| Social Sciences | 10 | 38.5% |
| Engineering | 0 | 0.0% |
| Multidisciplinary Studies | 0 | 0.0% |
| Science & Technology | 0 | 0.0% |
| Business | 10 | 38.5% |
| Education | 0 | 0.0% |
| Literature & Languages | 0 | 0.0% |
| Liberal Arts & History | 0 | 0.0% |
| Visual & Performing Arts | 0 | 0.0% |
| Communications | 0 | 0.0% |
| Arts & Humanities | 6 | 23.1% |
| Total | 26 | 100.0% |
Transportation & Commute in Macon
Vehicle Availability by Sex in Macon
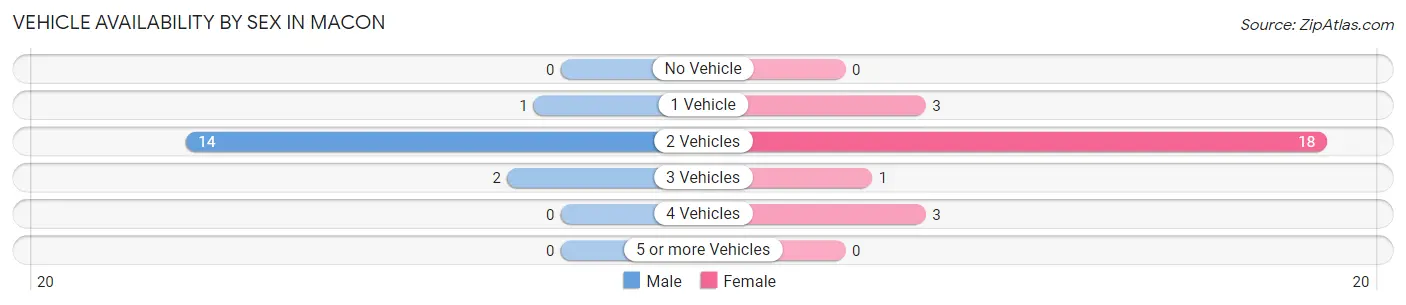
The most prevalent vehicle ownership categories in Macon are males with 2 vehicles (14, accounting for 82.4%) and females with 2 vehicles (18, making up 56.0%).
| Vehicles Available | Male | Female |
| No Vehicle | 0 (0.0%) | 0 (0.0%) |
| 1 Vehicle | 1 (5.9%) | 3 (12.0%) |
| 2 Vehicles | 14 (82.4%) | 18 (72.0%) |
| 3 Vehicles | 2 (11.8%) | 1 (4.0%) |
| 4 Vehicles | 0 (0.0%) | 3 (12.0%) |
| 5 or more Vehicles | 0 (0.0%) | 0 (0.0%) |
| Total | 17 (100.0%) | 25 (100.0%) |
Commute Time in Macon
The most frequently occuring commute durations in Macon are 15 to 19 minutes (15 commuters, 35.7%), 30 to 34 minutes (8 commuters, 19.1%), and 10 to 14 minutes (7 commuters, 16.7%).
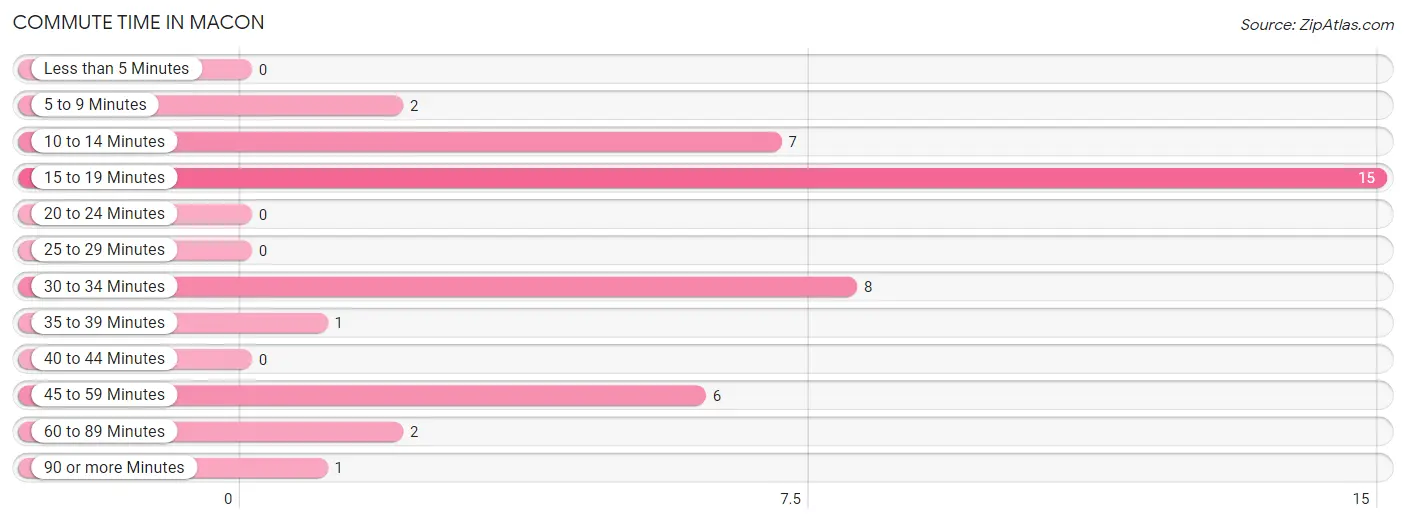
| Commute Time | # Commuters | % Commuters |
| Less than 5 Minutes | 0 | 0.0% |
| 5 to 9 Minutes | 2 | 4.8% |
| 10 to 14 Minutes | 7 | 16.7% |
| 15 to 19 Minutes | 15 | 35.7% |
| 20 to 24 Minutes | 0 | 0.0% |
| 25 to 29 Minutes | 0 | 0.0% |
| 30 to 34 Minutes | 8 | 19.1% |
| 35 to 39 Minutes | 1 | 2.4% |
| 40 to 44 Minutes | 0 | 0.0% |
| 45 to 59 Minutes | 6 | 14.3% |
| 60 to 89 Minutes | 2 | 4.8% |
| 90 or more Minutes | 1 | 2.4% |
Commute Time by Sex in Macon
The most common commute times in Macon are 30 to 34 minutes (5 commuters, 29.4%) for males and 15 to 19 minutes (11 commuters, 44.0%) for females.
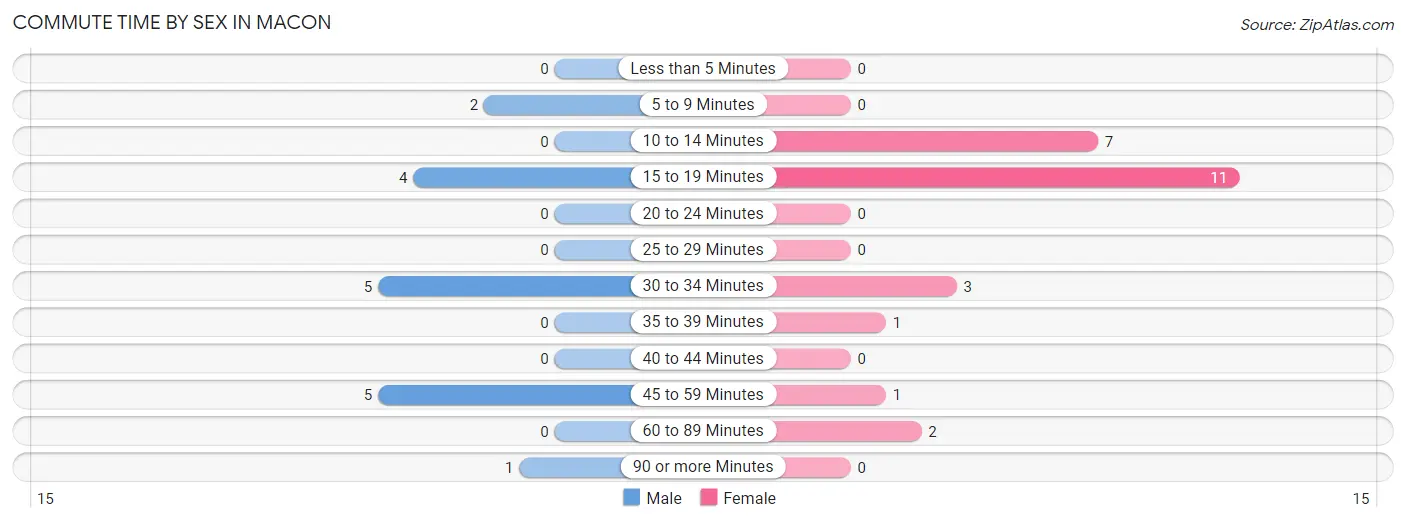
| Commute Time | Male | Female |
| Less than 5 Minutes | 0 (0.0%) | 0 (0.0%) |
| 5 to 9 Minutes | 2 (11.8%) | 0 (0.0%) |
| 10 to 14 Minutes | 0 (0.0%) | 7 (28.0%) |
| 15 to 19 Minutes | 4 (23.5%) | 11 (44.0%) |
| 20 to 24 Minutes | 0 (0.0%) | 0 (0.0%) |
| 25 to 29 Minutes | 0 (0.0%) | 0 (0.0%) |
| 30 to 34 Minutes | 5 (29.4%) | 3 (12.0%) |
| 35 to 39 Minutes | 0 (0.0%) | 1 (4.0%) |
| 40 to 44 Minutes | 0 (0.0%) | 0 (0.0%) |
| 45 to 59 Minutes | 5 (29.4%) | 1 (4.0%) |
| 60 to 89 Minutes | 0 (0.0%) | 2 (8.0%) |
| 90 or more Minutes | 1 (5.9%) | 0 (0.0%) |
Time of Departure to Work by Sex in Macon
The most frequent times of departure to work in Macon are 7:00 AM to 7:29 AM (5, 29.4%) for males and 8:30 AM to 8:59 AM (10, 40.0%) for females.
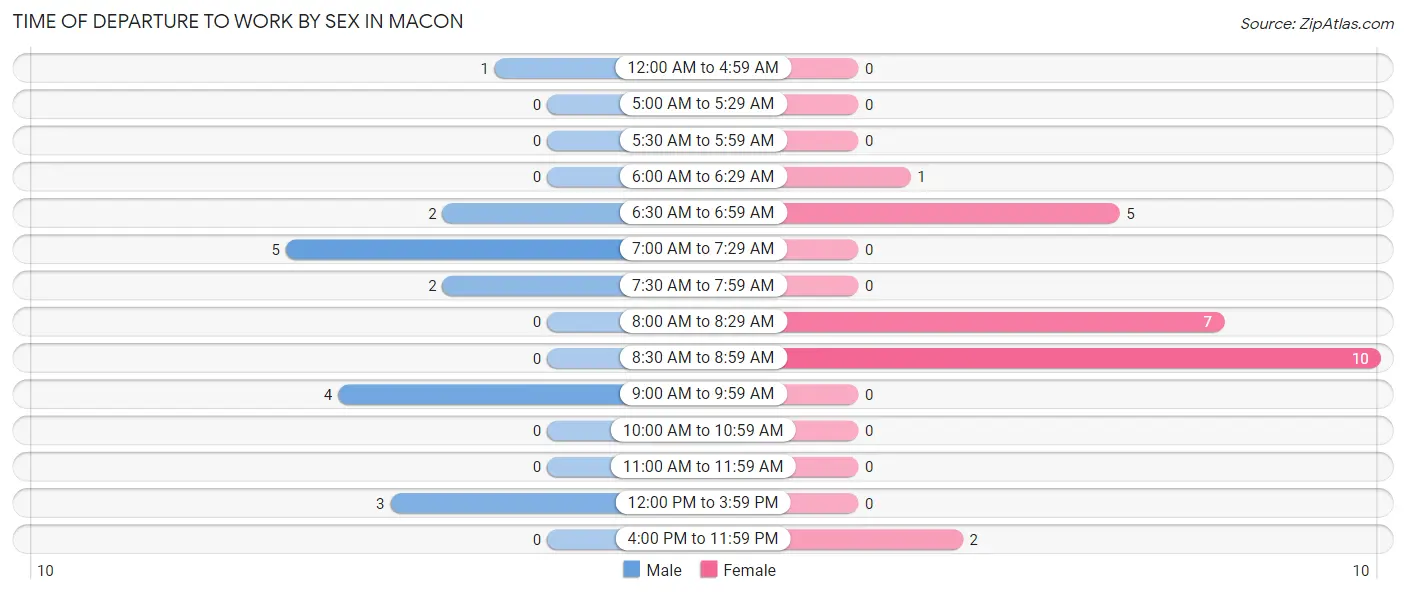
| Time of Departure | Male | Female |
| 12:00 AM to 4:59 AM | 1 (5.9%) | 0 (0.0%) |
| 5:00 AM to 5:29 AM | 0 (0.0%) | 0 (0.0%) |
| 5:30 AM to 5:59 AM | 0 (0.0%) | 0 (0.0%) |
| 6:00 AM to 6:29 AM | 0 (0.0%) | 1 (4.0%) |
| 6:30 AM to 6:59 AM | 2 (11.8%) | 5 (20.0%) |
| 7:00 AM to 7:29 AM | 5 (29.4%) | 0 (0.0%) |
| 7:30 AM to 7:59 AM | 2 (11.8%) | 0 (0.0%) |
| 8:00 AM to 8:29 AM | 0 (0.0%) | 7 (28.0%) |
| 8:30 AM to 8:59 AM | 0 (0.0%) | 10 (40.0%) |
| 9:00 AM to 9:59 AM | 4 (23.5%) | 0 (0.0%) |
| 10:00 AM to 10:59 AM | 0 (0.0%) | 0 (0.0%) |
| 11:00 AM to 11:59 AM | 0 (0.0%) | 0 (0.0%) |
| 12:00 PM to 3:59 PM | 3 (17.6%) | 0 (0.0%) |
| 4:00 PM to 11:59 PM | 0 (0.0%) | 2 (8.0%) |
| Total | 17 (100.0%) | 25 (100.0%) |
Housing Occupancy in Macon
Occupancy by Ownership in Macon
Of the total 40 dwellings in Macon, owner-occupied units account for 36 (90.0%), while renter-occupied units make up 4 (10.0%).
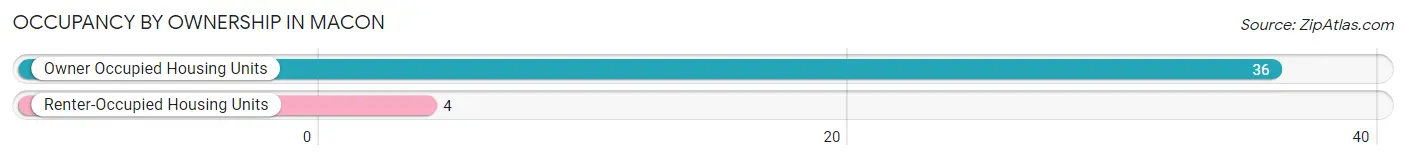
| Occupancy | # Housing Units | % Housing Units |
| Owner Occupied Housing Units | 36 | 90.0% |
| Renter-Occupied Housing Units | 4 | 10.0% |
| Total Occupied Housing Units | 40 | 100.0% |
Occupancy by Household Size in Macon
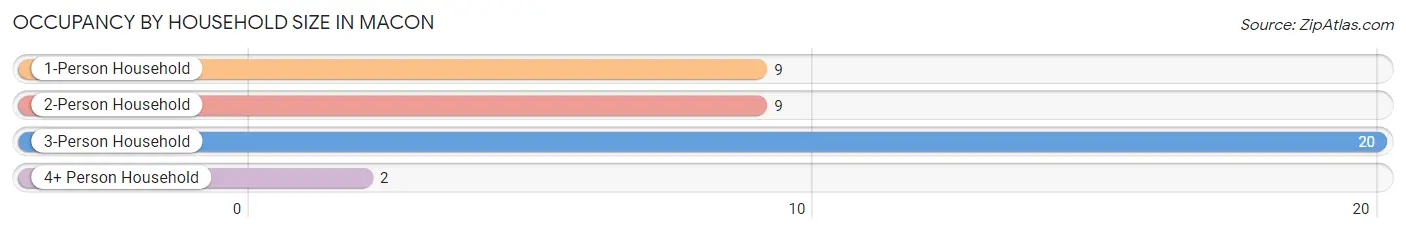
| Household Size | # Housing Units | % Housing Units |
| 1-Person Household | 9 | 22.5% |
| 2-Person Household | 9 | 22.5% |
| 3-Person Household | 20 | 50.0% |
| 4+ Person Household | 2 | 5.0% |
| Total Housing Units | 40 | 100.0% |
Occupancy by Ownership by Household Size in Macon
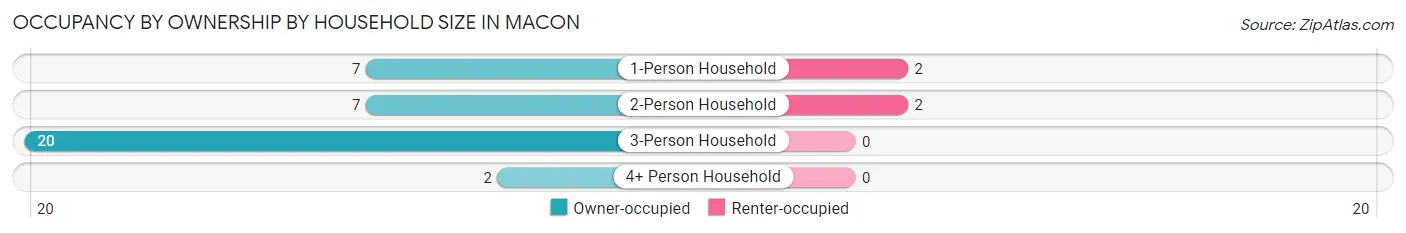
| Household Size | Owner-occupied | Renter-occupied |
| 1-Person Household | 7 (77.8%) | 2 (22.2%) |
| 2-Person Household | 7 (77.8%) | 2 (22.2%) |
| 3-Person Household | 20 (100.0%) | 0 (0.0%) |
| 4+ Person Household | 2 (100.0%) | 0 (0.0%) |
| Total Housing Units | 36 (90.0%) | 4 (10.0%) |
Occupancy by Educational Attainment in Macon
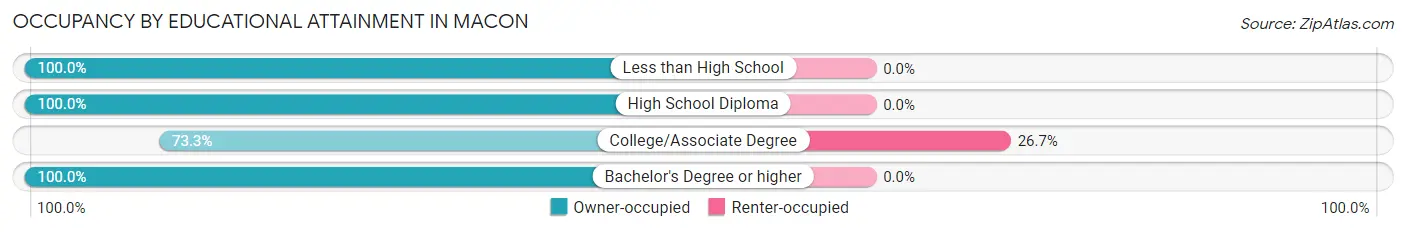
| Household Size | Owner-occupied | Renter-occupied |
| Less than High School | 1 (100.0%) | 0 (0.0%) |
| High School Diploma | 14 (100.0%) | 0 (0.0%) |
| College/Associate Degree | 11 (73.3%) | 4 (26.7%) |
| Bachelor's Degree or higher | 10 (100.0%) | 0 (0.0%) |
Occupancy by Age of Householder in Macon
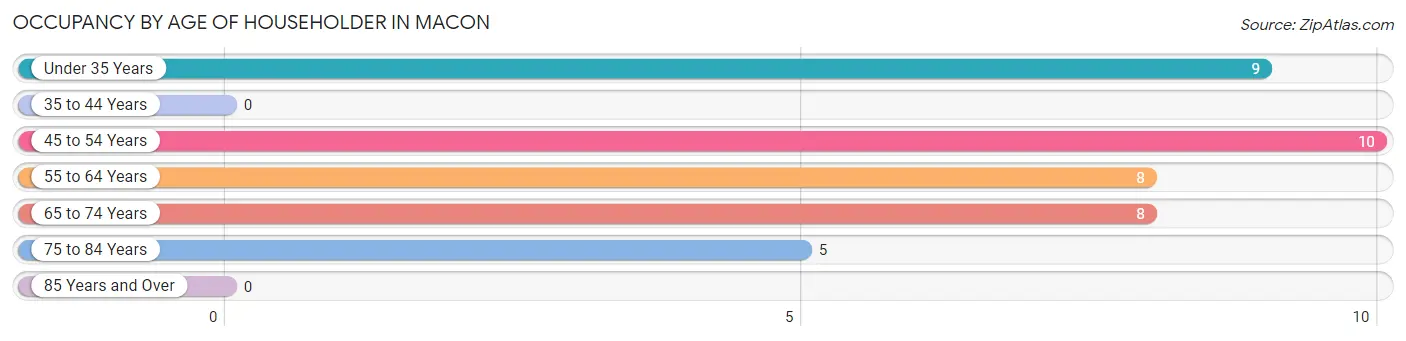
| Age Bracket | # Households | % Households |
| Under 35 Years | 9 | 22.5% |
| 35 to 44 Years | 0 | 0.0% |
| 45 to 54 Years | 10 | 25.0% |
| 55 to 64 Years | 8 | 20.0% |
| 65 to 74 Years | 8 | 20.0% |
| 75 to 84 Years | 5 | 12.5% |
| 85 Years and Over | 0 | 0.0% |
| Total | 40 | 100.0% |
Housing Finances in Macon
Median Income by Occupancy in Macon
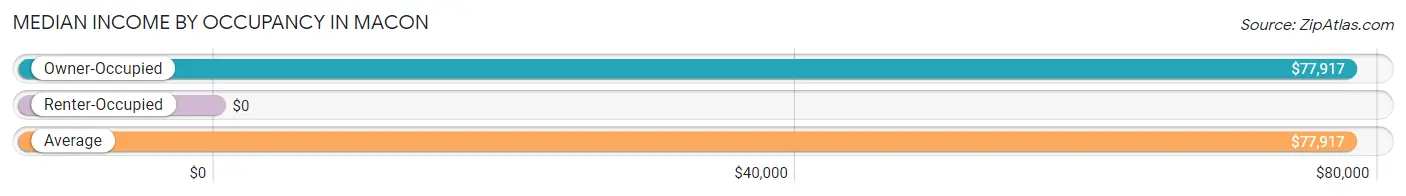
| Occupancy Type | # Households | Median Income |
| Owner-Occupied | 36 (90.0%) | $77,917 |
| Renter-Occupied | 4 (10.0%) | $0 |
| Average | 40 (100.0%) | $77,917 |
Occupancy by Householder Income Bracket in Macon
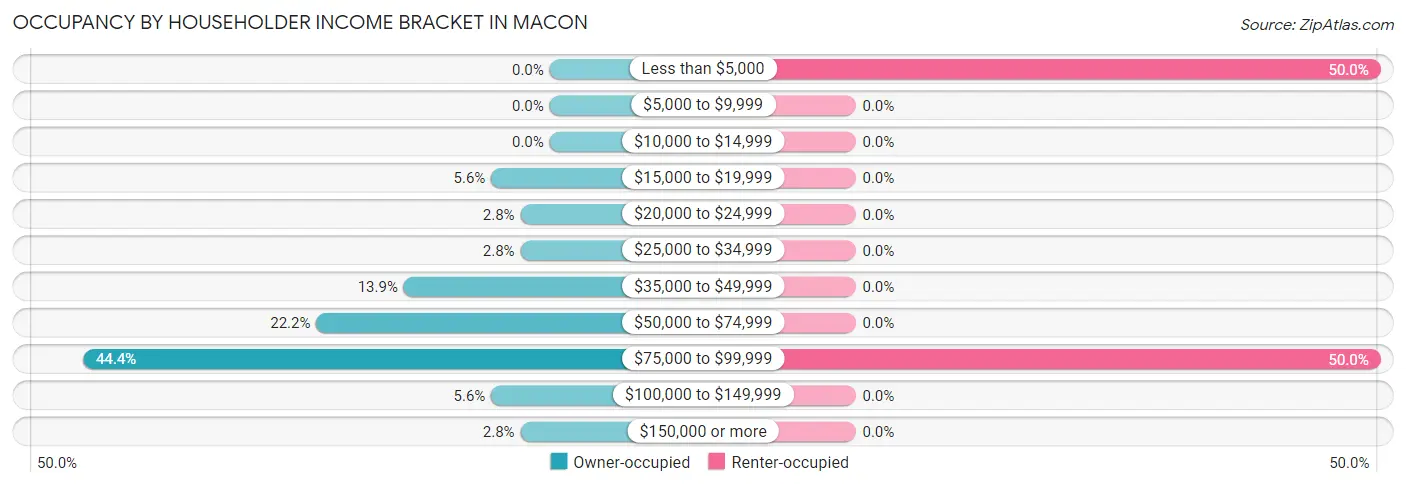
| Income Bracket | Owner-occupied | Renter-occupied |
| Less than $5,000 | 0 (0.0%) | 2 (50.0%) |
| $5,000 to $9,999 | 0 (0.0%) | 0 (0.0%) |
| $10,000 to $14,999 | 0 (0.0%) | 0 (0.0%) |
| $15,000 to $19,999 | 2 (5.6%) | 0 (0.0%) |
| $20,000 to $24,999 | 1 (2.8%) | 0 (0.0%) |
| $25,000 to $34,999 | 1 (2.8%) | 0 (0.0%) |
| $35,000 to $49,999 | 5 (13.9%) | 0 (0.0%) |
| $50,000 to $74,999 | 8 (22.2%) | 0 (0.0%) |
| $75,000 to $99,999 | 16 (44.4%) | 2 (50.0%) |
| $100,000 to $149,999 | 2 (5.6%) | 0 (0.0%) |
| $150,000 or more | 1 (2.8%) | 0 (0.0%) |
| Total | 36 (100.0%) | 4 (100.0%) |
Monthly Housing Cost Tiers in Macon
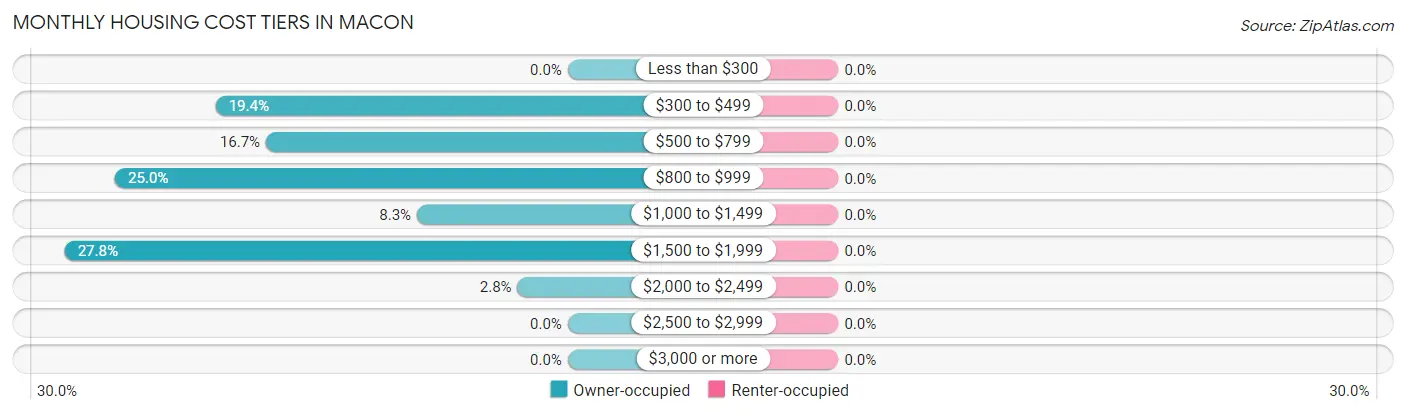
| Monthly Cost | Owner-occupied | Renter-occupied |
| Less than $300 | 0 (0.0%) | 0 (0.0%) |
| $300 to $499 | 7 (19.4%) | 0 (0.0%) |
| $500 to $799 | 6 (16.7%) | 0 (0.0%) |
| $800 to $999 | 9 (25.0%) | 0 (0.0%) |
| $1,000 to $1,499 | 3 (8.3%) | 0 (0.0%) |
| $1,500 to $1,999 | 10 (27.8%) | 0 (0.0%) |
| $2,000 to $2,499 | 1 (2.8%) | 0 (0.0%) |
| $2,500 to $2,999 | 0 (0.0%) | 0 (0.0%) |
| $3,000 or more | 0 (0.0%) | 0 (0.0%) |
| Total | 36 (100.0%) | 4 (100.0%) |
Physical Housing Characteristics in Macon
Housing Structures in Macon
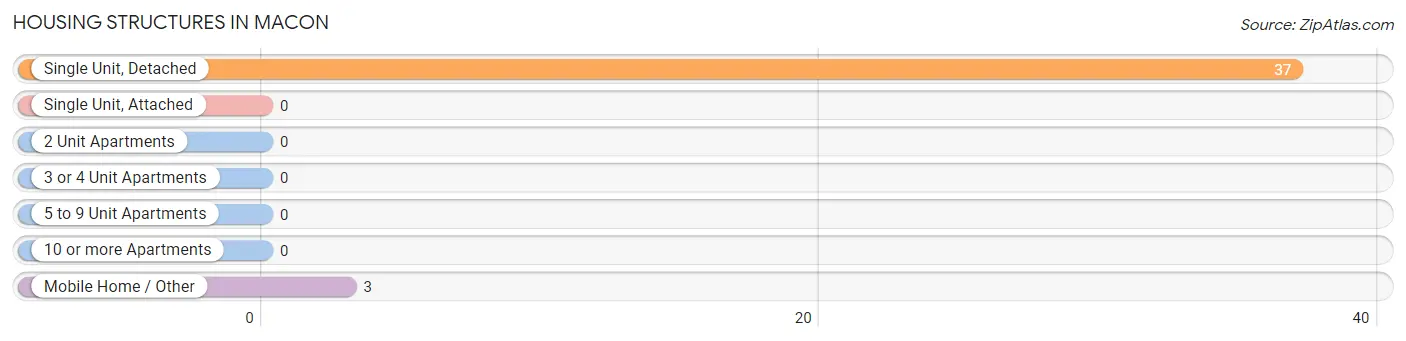
| Structure Type | # Housing Units | % Housing Units |
| Single Unit, Detached | 37 | 92.5% |
| Single Unit, Attached | 0 | 0.0% |
| 2 Unit Apartments | 0 | 0.0% |
| 3 or 4 Unit Apartments | 0 | 0.0% |
| 5 to 9 Unit Apartments | 0 | 0.0% |
| 10 or more Apartments | 0 | 0.0% |
| Mobile Home / Other | 3 | 7.5% |
| Total | 40 | 100.0% |
Housing Structures by Occupancy in Macon
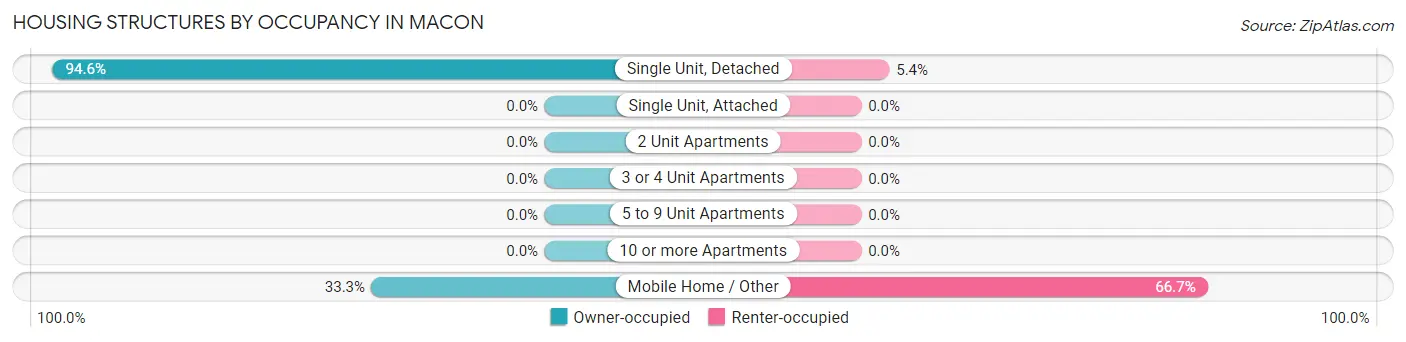
| Structure Type | Owner-occupied | Renter-occupied |
| Single Unit, Detached | 35 (94.6%) | 2 (5.4%) |
| Single Unit, Attached | 0 (0.0%) | 0 (0.0%) |
| 2 Unit Apartments | 0 (0.0%) | 0 (0.0%) |
| 3 or 4 Unit Apartments | 0 (0.0%) | 0 (0.0%) |
| 5 to 9 Unit Apartments | 0 (0.0%) | 0 (0.0%) |
| 10 or more Apartments | 0 (0.0%) | 0 (0.0%) |
| Mobile Home / Other | 1 (33.3%) | 2 (66.7%) |
| Total | 36 (90.0%) | 4 (10.0%) |
Housing Structures by Number of Rooms in Macon
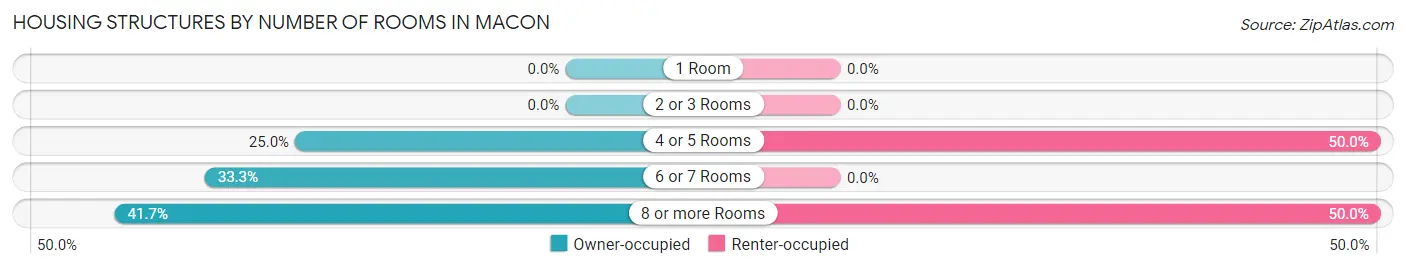
| Number of Rooms | Owner-occupied | Renter-occupied |
| 1 Room | 0 (0.0%) | 0 (0.0%) |
| 2 or 3 Rooms | 0 (0.0%) | 0 (0.0%) |
| 4 or 5 Rooms | 9 (25.0%) | 2 (50.0%) |
| 6 or 7 Rooms | 12 (33.3%) | 0 (0.0%) |
| 8 or more Rooms | 15 (41.7%) | 2 (50.0%) |
| Total | 36 (100.0%) | 4 (100.0%) |
Housing Structure by Heating Type in Macon
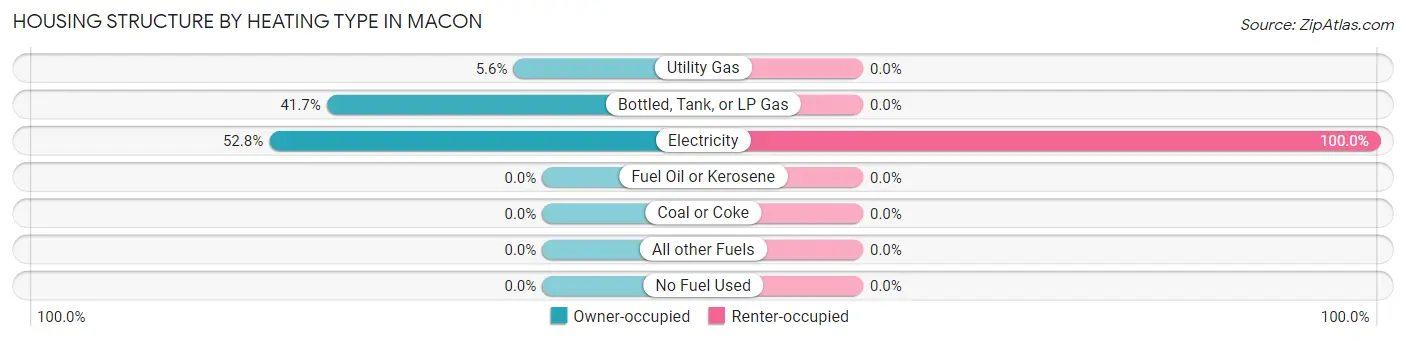
| Heating Type | Owner-occupied | Renter-occupied |
| Utility Gas | 2 (5.6%) | 0 (0.0%) |
| Bottled, Tank, or LP Gas | 15 (41.7%) | 0 (0.0%) |
| Electricity | 19 (52.8%) | 4 (100.0%) |
| Fuel Oil or Kerosene | 0 (0.0%) | 0 (0.0%) |
| Coal or Coke | 0 (0.0%) | 0 (0.0%) |
| All other Fuels | 0 (0.0%) | 0 (0.0%) |
| No Fuel Used | 0 (0.0%) | 0 (0.0%) |
| Total | 36 (100.0%) | 4 (100.0%) |
Household Vehicle Usage in Macon
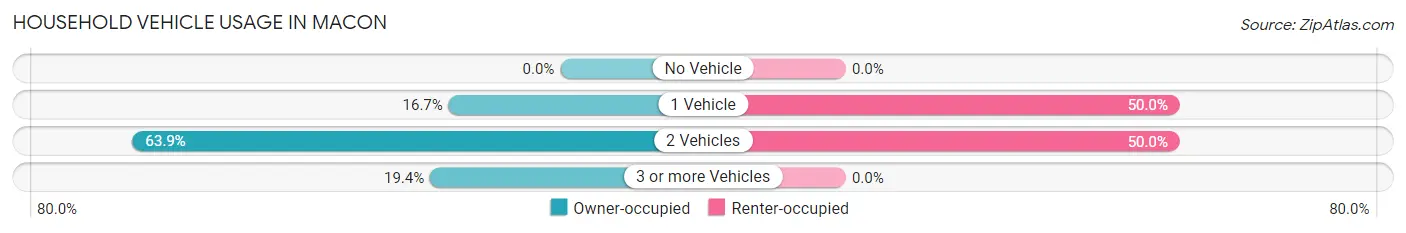
| Vehicles per Household | Owner-occupied | Renter-occupied |
| No Vehicle | 0 (0.0%) | 0 (0.0%) |
| 1 Vehicle | 6 (16.7%) | 2 (50.0%) |
| 2 Vehicles | 23 (63.9%) | 2 (50.0%) |
| 3 or more Vehicles | 7 (19.4%) | 0 (0.0%) |
| Total | 36 (100.0%) | 4 (100.0%) |
Real Estate & Mortgages in Macon
Real Estate and Mortgage Overview in Macon
| Characteristic | Without Mortgage | With Mortgage |
| Housing Units | 13 | 23 |
| Median Property Value | $167,500 | $153,400 |
| Median Household Income | $77,813 | $0 |
| Monthly Housing Costs | $483 | $0 |
| Real Estate Taxes | $967 | $0 |
Property Value by Mortgage Status in Macon
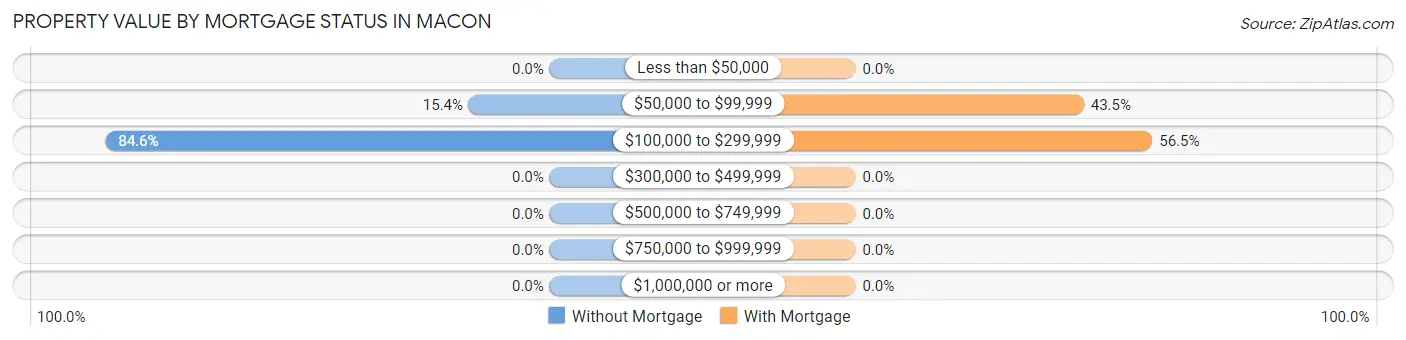
| Property Value | Without Mortgage | With Mortgage |
| Less than $50,000 | 0 (0.0%) | 0 (0.0%) |
| $50,000 to $99,999 | 2 (15.4%) | 10 (43.5%) |
| $100,000 to $299,999 | 11 (84.6%) | 13 (56.5%) |
| $300,000 to $499,999 | 0 (0.0%) | 0 (0.0%) |
| $500,000 to $749,999 | 0 (0.0%) | 0 (0.0%) |
| $750,000 to $999,999 | 0 (0.0%) | 0 (0.0%) |
| $1,000,000 or more | 0 (0.0%) | 0 (0.0%) |
| Total | 13 (100.0%) | 23 (100.0%) |
Household Income by Mortgage Status in Macon
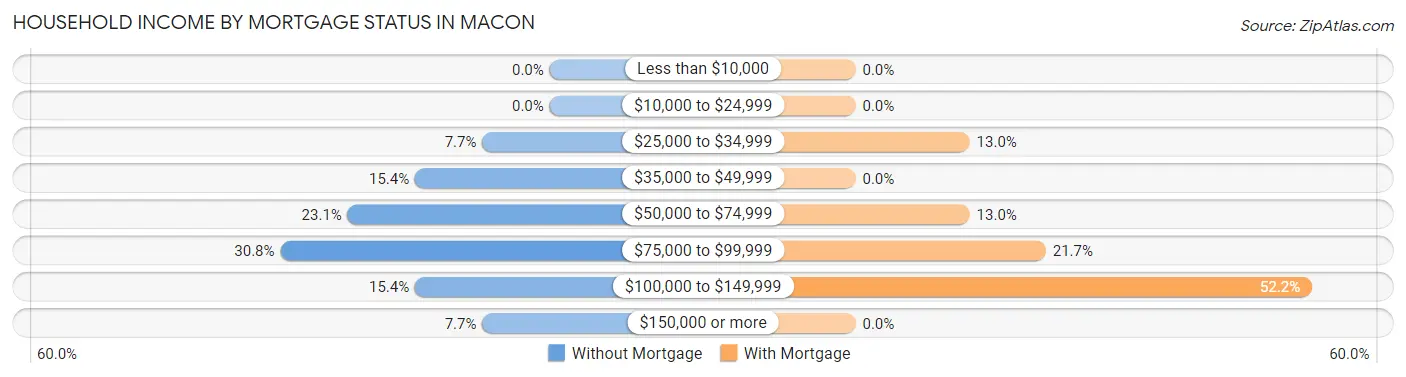
| Household Income | Without Mortgage | With Mortgage |
| Less than $10,000 | 0 (0.0%) | 0 (0.0%) |
| $10,000 to $24,999 | 0 (0.0%) | 0 (0.0%) |
| $25,000 to $34,999 | 1 (7.7%) | 3 (13.0%) |
| $35,000 to $49,999 | 2 (15.4%) | 0 (0.0%) |
| $50,000 to $74,999 | 3 (23.1%) | 3 (13.0%) |
| $75,000 to $99,999 | 4 (30.8%) | 5 (21.7%) |
| $100,000 to $149,999 | 2 (15.4%) | 12 (52.2%) |
| $150,000 or more | 1 (7.7%) | 0 (0.0%) |
| Total | 13 (100.0%) | 23 (100.0%) |
Property Value to Household Income Ratio in Macon
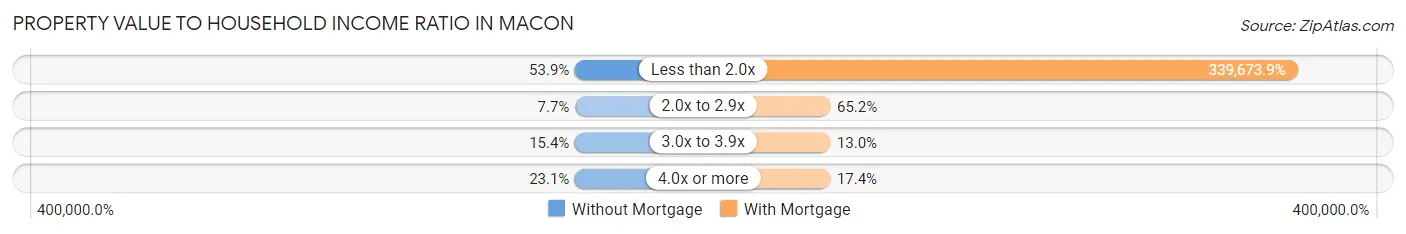
| Value-to-Income Ratio | Without Mortgage | With Mortgage |
| Less than 2.0x | 7 (53.8%) | 78,125 (339,673.9%) |
| 2.0x to 2.9x | 1 (7.7%) | 15 (65.2%) |
| 3.0x to 3.9x | 2 (15.4%) | 3 (13.0%) |
| 4.0x or more | 3 (23.1%) | 4 (17.4%) |
| Total | 13 (100.0%) | 23 (100.0%) |
Real Estate Taxes by Mortgage Status in Macon
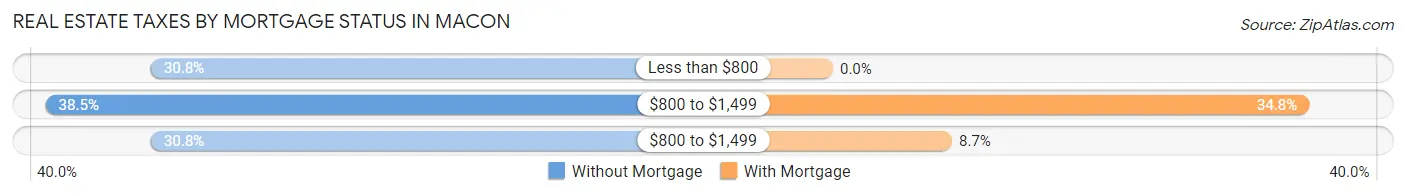
| Property Taxes | Without Mortgage | With Mortgage |
| Less than $800 | 4 (30.8%) | 0 (0.0%) |
| $800 to $1,499 | 5 (38.5%) | 8 (34.8%) |
| $800 to $1,499 | 4 (30.8%) | 2 (8.7%) |
| Total | 13 (100.0%) | 23 (100.0%) |
Health & Disability in Macon
Health Insurance Coverage by Age in Macon
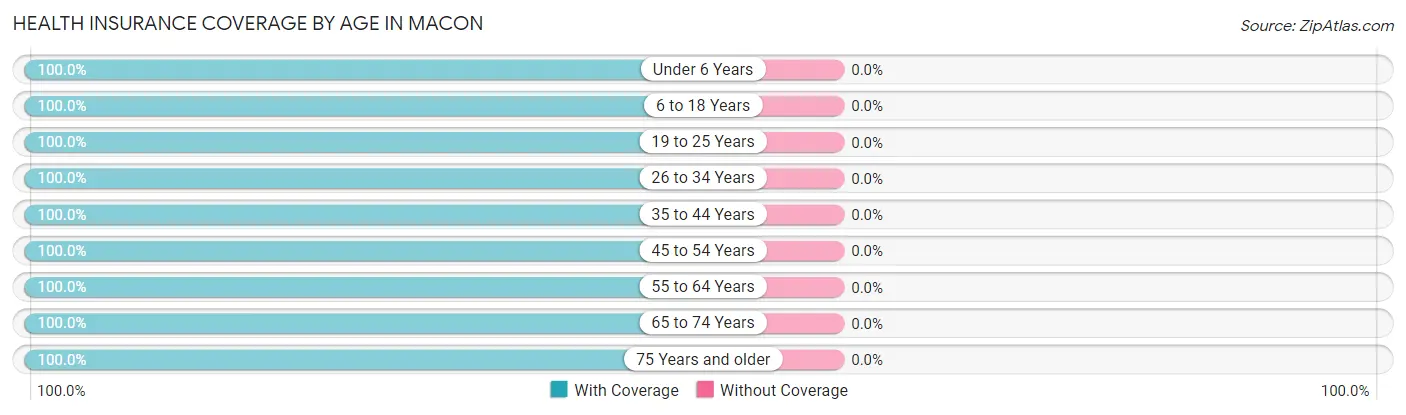
| Age Bracket | With Coverage | Without Coverage |
| Under 6 Years | 18 (100.0%) | 0 (0.0%) |
| 6 to 18 Years | 5 (100.0%) | 0 (0.0%) |
| 19 to 25 Years | 7 (100.0%) | 0 (0.0%) |
| 26 to 34 Years | 13 (100.0%) | 0 (0.0%) |
| 35 to 44 Years | 2 (100.0%) | 0 (0.0%) |
| 45 to 54 Years | 10 (100.0%) | 0 (0.0%) |
| 55 to 64 Years | 16 (100.0%) | 0 (0.0%) |
| 65 to 74 Years | 12 (100.0%) | 0 (0.0%) |
| 75 Years and older | 7 (100.0%) | 0 (0.0%) |
| Total | 90 (100.0%) | 0 (0.0%) |
Health Insurance Coverage by Citizenship Status in Macon
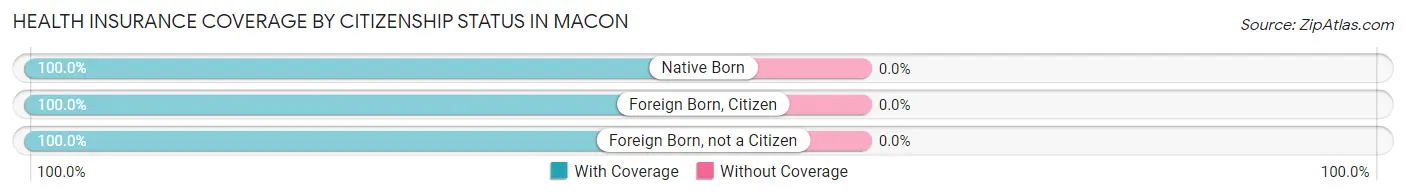
| Citizenship Status | With Coverage | Without Coverage |
| Native Born | 18 (100.0%) | 0 (0.0%) |
| Foreign Born, Citizen | 5 (100.0%) | 0 (0.0%) |
| Foreign Born, not a Citizen | 7 (100.0%) | 0 (0.0%) |
Health Insurance Coverage by Household Income in Macon
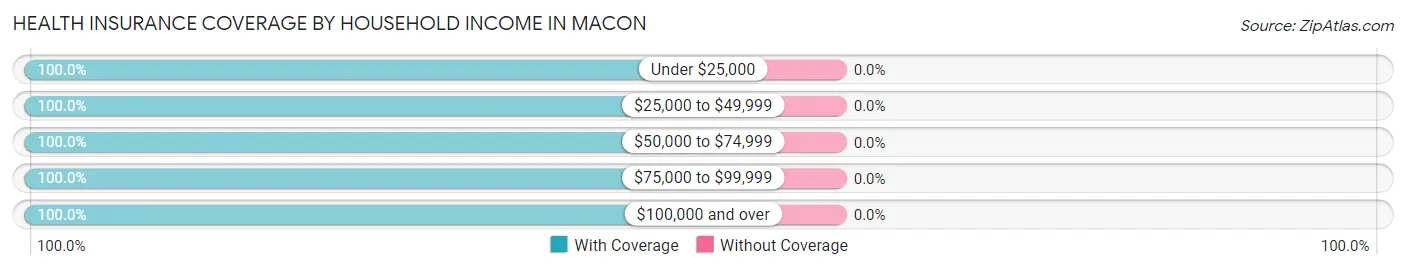
| Household Income | With Coverage | Without Coverage |
| Under $25,000 | 6 (100.0%) | 0 (0.0%) |
| $25,000 to $49,999 | 17 (100.0%) | 0 (0.0%) |
| $50,000 to $74,999 | 31 (100.0%) | 0 (0.0%) |
| $75,000 to $99,999 | 31 (100.0%) | 0 (0.0%) |
| $100,000 and over | 5 (100.0%) | 0 (0.0%) |
Public vs Private Health Insurance Coverage by Age in Macon
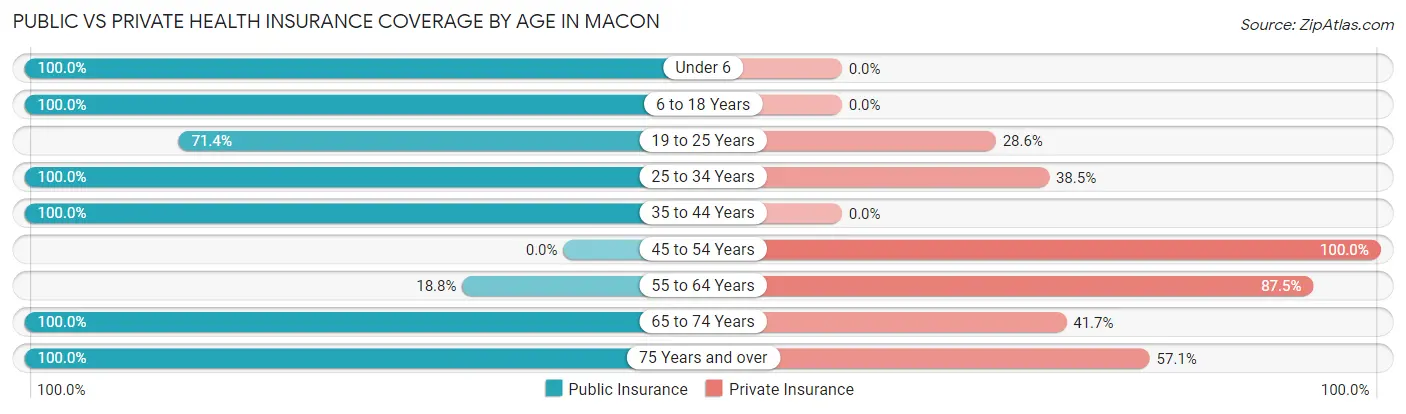
| Age Bracket | Public Insurance | Private Insurance |
| Under 6 | 18 (100.0%) | 0 (0.0%) |
| 6 to 18 Years | 5 (100.0%) | 0 (0.0%) |
| 19 to 25 Years | 5 (71.4%) | 2 (28.6%) |
| 25 to 34 Years | 13 (100.0%) | 5 (38.5%) |
| 35 to 44 Years | 2 (100.0%) | 0 (0.0%) |
| 45 to 54 Years | 0 (0.0%) | 10 (100.0%) |
| 55 to 64 Years | 3 (18.8%) | 14 (87.5%) |
| 65 to 74 Years | 12 (100.0%) | 5 (41.7%) |
| 75 Years and over | 7 (100.0%) | 4 (57.1%) |
| Total | 65 (72.2%) | 40 (44.4%) |
Disability Status by Sex by Age in Macon
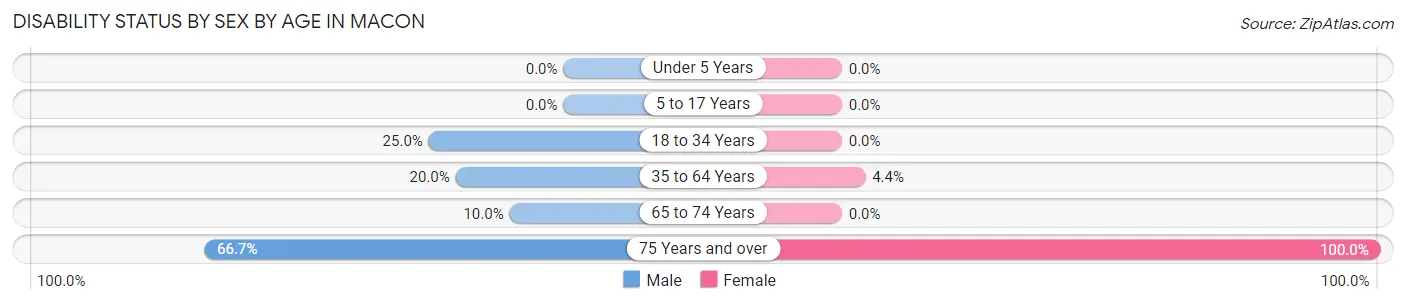
| Age Bracket | Male | Female |
| Under 5 Years | 0 (0.0%) | 0 (0.0%) |
| 5 to 17 Years | 0 (0.0%) | 0 (0.0%) |
| 18 to 34 Years | 3 (25.0%) | 0 (0.0%) |
| 35 to 64 Years | 1 (20.0%) | 1 (4.3%) |
| 65 to 74 Years | 1 (10.0%) | 0 (0.0%) |
| 75 Years and over | 2 (66.7%) | 4 (100.0%) |
Disability Class by Sex by Age in Macon
Disability Class: Hearing Difficulty
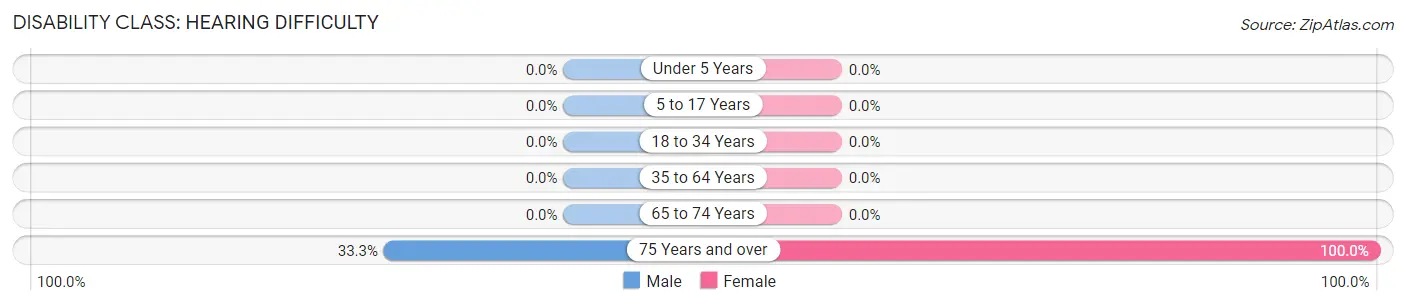
| Age Bracket | Male | Female |
| Under 5 Years | 0 (0.0%) | 0 (0.0%) |
| 5 to 17 Years | 0 (0.0%) | 0 (0.0%) |
| 18 to 34 Years | 0 (0.0%) | 0 (0.0%) |
| 35 to 64 Years | 0 (0.0%) | 0 (0.0%) |
| 65 to 74 Years | 0 (0.0%) | 0 (0.0%) |
| 75 Years and over | 1 (33.3%) | 4 (100.0%) |
Disability Class: Vision Difficulty
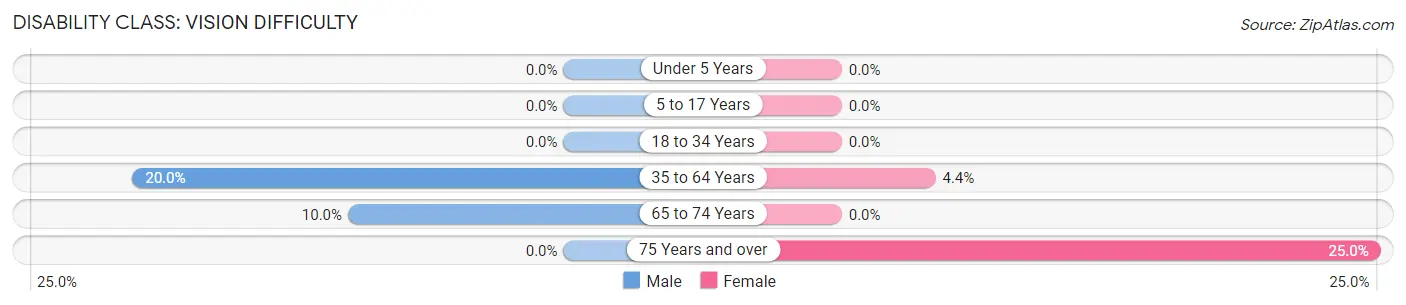
| Age Bracket | Male | Female |
| Under 5 Years | 0 (0.0%) | 0 (0.0%) |
| 5 to 17 Years | 0 (0.0%) | 0 (0.0%) |
| 18 to 34 Years | 0 (0.0%) | 0 (0.0%) |
| 35 to 64 Years | 1 (20.0%) | 1 (4.3%) |
| 65 to 74 Years | 1 (10.0%) | 0 (0.0%) |
| 75 Years and over | 0 (0.0%) | 1 (25.0%) |
Disability Class: Cognitive Difficulty
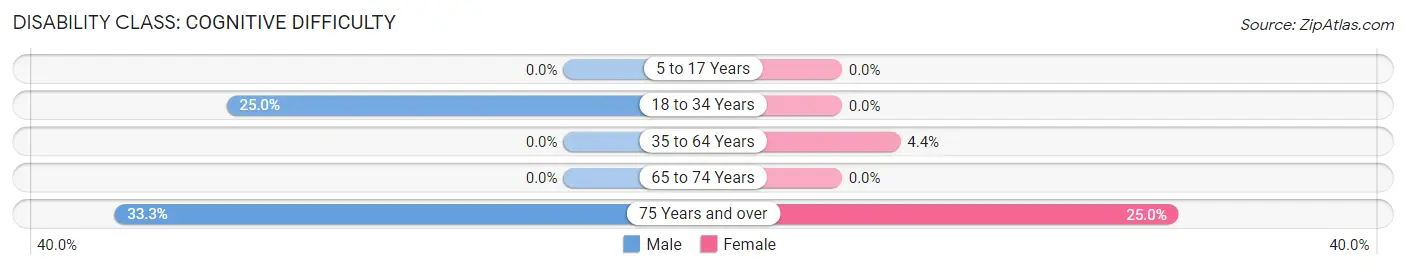
| Age Bracket | Male | Female |
| 5 to 17 Years | 0 (0.0%) | 0 (0.0%) |
| 18 to 34 Years | 3 (25.0%) | 0 (0.0%) |
| 35 to 64 Years | 0 (0.0%) | 1 (4.3%) |
| 65 to 74 Years | 0 (0.0%) | 0 (0.0%) |
| 75 Years and over | 1 (33.3%) | 1 (25.0%) |
Disability Class: Ambulatory Difficulty
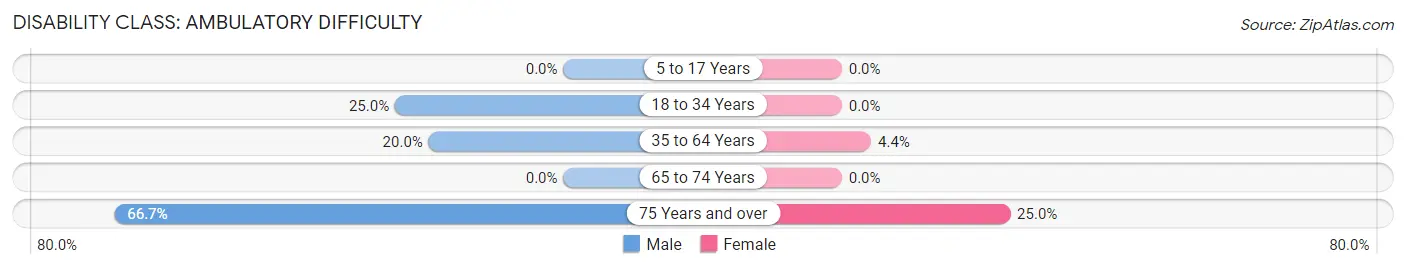
| Age Bracket | Male | Female |
| 5 to 17 Years | 0 (0.0%) | 0 (0.0%) |
| 18 to 34 Years | 3 (25.0%) | 0 (0.0%) |
| 35 to 64 Years | 1 (20.0%) | 1 (4.3%) |
| 65 to 74 Years | 0 (0.0%) | 0 (0.0%) |
| 75 Years and over | 2 (66.7%) | 1 (25.0%) |
Disability Class: Self-Care Difficulty
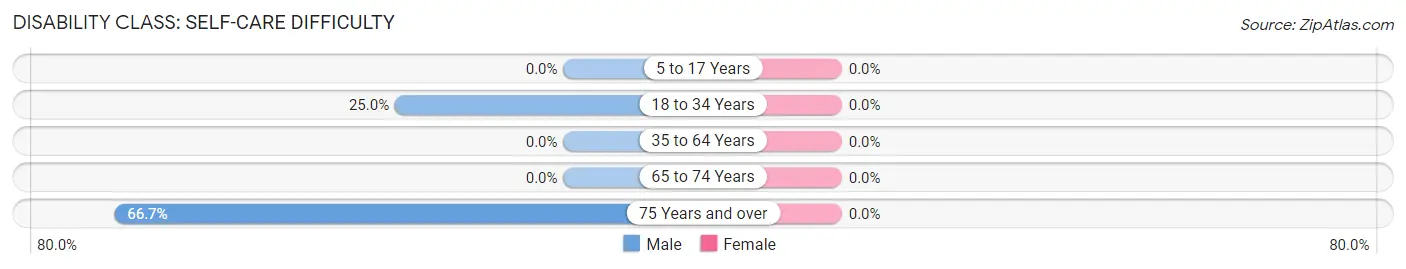
| Age Bracket | Male | Female |
| 5 to 17 Years | 0 (0.0%) | 0 (0.0%) |
| 18 to 34 Years | 3 (25.0%) | 0 (0.0%) |
| 35 to 64 Years | 0 (0.0%) | 0 (0.0%) |
| 65 to 74 Years | 0 (0.0%) | 0 (0.0%) |
| 75 Years and over | 2 (66.7%) | 0 (0.0%) |
Technology Access in Macon
Computing Device Access in Macon
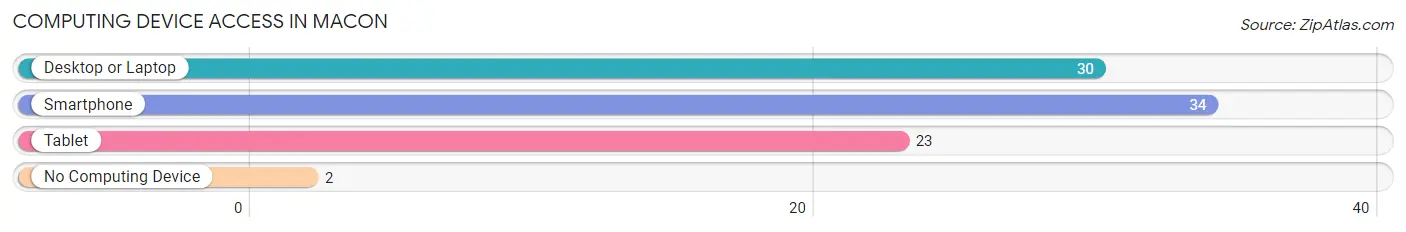
| Device Type | # Households | % Households |
| Desktop or Laptop | 30 | 75.0% |
| Smartphone | 34 | 85.0% |
| Tablet | 23 | 57.5% |
| No Computing Device | 2 | 5.0% |
| Total | 40 | 100.0% |
Internet Access in Macon
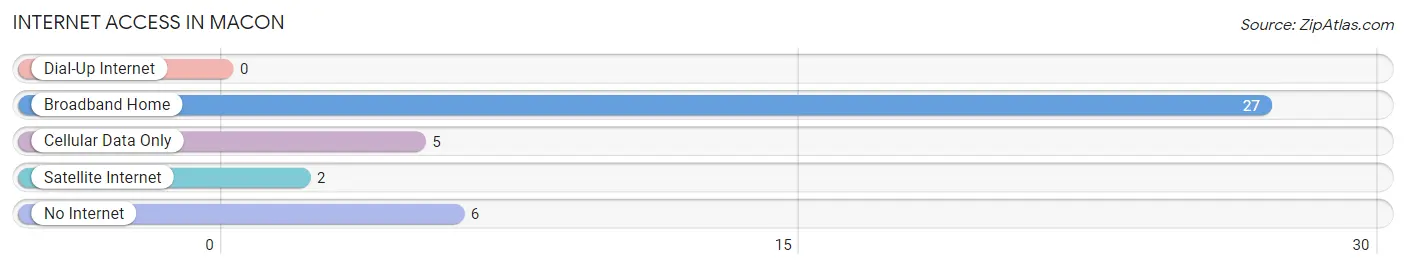
| Internet Type | # Households | % Households |
| Dial-Up Internet | 0 | 0.0% |
| Broadband Home | 27 | 67.5% |
| Cellular Data Only | 5 | 12.5% |
| Satellite Internet | 2 | 5.0% |
| No Internet | 6 | 15.0% |
| Total | 40 | 100.0% |
Macon Summary
Macon, North Carolina is a small town located in the foothills of the Blue Ridge Mountains in the western part of the state. It is situated in the county of Macon, which is part of the larger region known as the Foothills of North Carolina. The town has a population of approximately 1,500 people and is the county seat of Macon County.
Geography
Macon is located in the western part of North Carolina, in the foothills of the Blue Ridge Mountains. The town is situated in the county of Macon, which is part of the larger region known as the Foothills of North Carolina. The town is located at an elevation of 1,400 feet above sea level and is surrounded by the Nantahala National Forest. The town is located near the Appalachian Trail and is a popular destination for hikers and outdoor enthusiasts.
The town is located in a rural area and is surrounded by rolling hills and forests. The town is located near the French Broad River, which is a popular destination for fishing and other recreational activities. The town is also located near the Great Smoky Mountains National Park, which is a popular destination for tourists.
History
Macon was founded in 1837 by a group of settlers from the nearby town of Franklin. The town was named after the county of Macon, which was named after Nathaniel Macon, a prominent politician from the early 19th century. The town was originally a farming community and was known for its production of tobacco, corn, and other crops.
In the late 19th century, the town began to experience a period of growth and development. The town was connected to the outside world by the railroad, which allowed for the transportation of goods and people. The town also experienced a period of industrialization, with the establishment of several factories and mills.
Economy
Macon is a small town with a population of approximately 1,500 people. The town is primarily a rural community and is home to several small businesses. The town is also home to several farms, which produce a variety of crops, including tobacco, corn, and other vegetables.
The town is also home to several manufacturing companies, which produce a variety of products, including furniture, textiles, and other goods. The town is also home to several retail stores, which sell a variety of goods, including clothing, food, and other items.
Demographics
Macon is a small town with a population of approximately 1,500 people. The town is primarily a rural community and is home to a diverse population. The town is predominantly white, with a small percentage of African Americans, Hispanics, and other ethnicities. The town is also home to a small population of Native Americans.
The town has a median household income of $35,000 and a poverty rate of 17.5%. The town has a high school graduation rate of 85.5% and a college graduation rate of 28.5%. The town is also home to a small population of elderly residents, with a median age of 44.5 years.
Conclusion
Macon, North Carolina is a small town located in the foothills of the Blue Ridge Mountains in the western part of the state. The town has a population of approximately 1,500 people and is the county seat of Macon County. The town is primarily a rural community and is home to several small businesses, farms, and manufacturing companies. The town is predominantly white, with a small percentage of African Americans, Hispanics, and other ethnicities. The town has a median household income of $35,000 and a poverty rate of 17.5%. The town has a high school graduation rate of 85.5% and a college graduation rate of 28.5%. Macon is a small town with a rich history and a diverse population.
Common Questions
What is Per Capita Income in Macon?
Per Capita income in Macon is $25,722.
What is the Median Family Income in Macon?
Median Family Income in Macon is $79,375.
What is the Median Household income in Macon?
Median Household Income in Macon is $77,917.
What is Income or Wage Gap in Macon?
Income or Wage Gap in Macon is 25.9%.
Women in Macon earn 74.1 cents for every dollar earned by a man.
What is Inequality or Gini Index in Macon?
Inequality or Gini Index in Macon is 0.24.
What is the Total Population of Macon?
Total Population of Macon is 90.
What is the Total Male Population of Macon?
Total Male Population of Macon is 48.
What is the Total Female Population of Macon?
Total Female Population of Macon is 42.
What is the Ratio of Males per 100 Females in Macon?
There are 114.29 Males per 100 Females in Macon.
What is the Ratio of Females per 100 Males in Macon?
There are 87.50 Females per 100 Males in Macon.
What is the Median Population Age in Macon?
Median Population Age in Macon is 41.0 Years.
What is the Average Family Size in Macon
Average Family Size in Macon is 2.6 People.
What is the Average Household Size in Macon
Average Household Size in Macon is 2.2 People.
How Large is the Labor Force in Macon?
There are 50 People in the Labor Forcein in Macon.
What is the Percentage of People in the Labor Force in Macon?
74.6% of People are in the Labor Force in Macon.
What is the Unemployment Rate in Macon?
Unemployment Rate in Macon is 16.0%.