Robbins, NC Map & Demographics
Robbins Map
Robbins Overview
$18,943
PER CAPITA INCOME
$48,094
AVG FAMILY INCOME
$47,770
AVG HOUSEHOLD INCOME
47.6%
WAGE / INCOME GAP [ % ]
52.4¢/ $1
WAGE / INCOME GAP [ $ ]
0.43
INEQUALITY / GINI INDEX
1,511
TOTAL POPULATION
875
MALE POPULATION
636
FEMALE POPULATION
137.58
MALES / 100 FEMALES
72.69
FEMALES / 100 MALES
24.8
MEDIAN AGE
3.0
AVG FAMILY SIZE
2.7
AVG HOUSEHOLD SIZE
618
LABOR FORCE [ PEOPLE ]
59.7%
PERCENT IN LABOR FORCE
8.7%
UNEMPLOYMENT RATE
Robbins Zip Codes
Robbins Area Codes
Income in Robbins
Income Overview in Robbins
Per Capita Income in Robbins is $18,943, while median incomes of families and households are $48,094 and $47,770 respectively.
| Characteristic | Number | Measure |
| Per Capita Income | 1,511 | $18,943 |
| Median Family Income | 400 | $48,094 |
| Mean Family Income | 400 | $55,198 |
| Median Household Income | 548 | $47,770 |
| Mean Household Income | 548 | $56,583 |
| Income Deficit | 400 | $0 |
| Wage / Income Gap (%) | 1,511 | 47.59% |
| Wage / Income Gap ($) | 1,511 | 52.41¢ per $1 |
| Gini / Inequality Index | 1,511 | 0.43 |
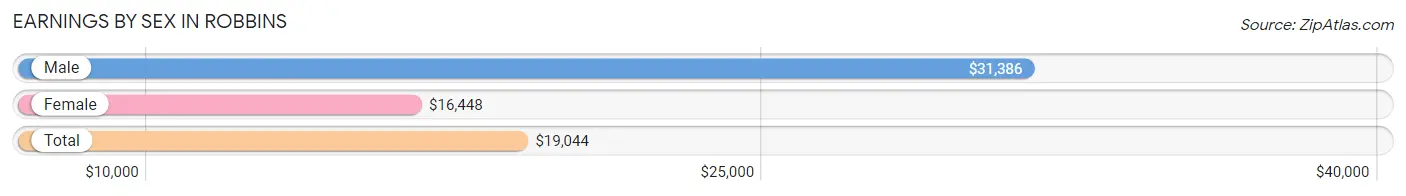
Earnings by Sex in Robbins
Average Earnings in Robbins are $19,044, $31,386 for men and $16,448 for women, a difference of 47.6%.
| Sex | Number | Average Earnings |
| Male | 355 (51.4%) | $31,386 |
| Female | 335 (48.5%) | $16,448 |
| Total | 690 (100.0%) | $19,044 |
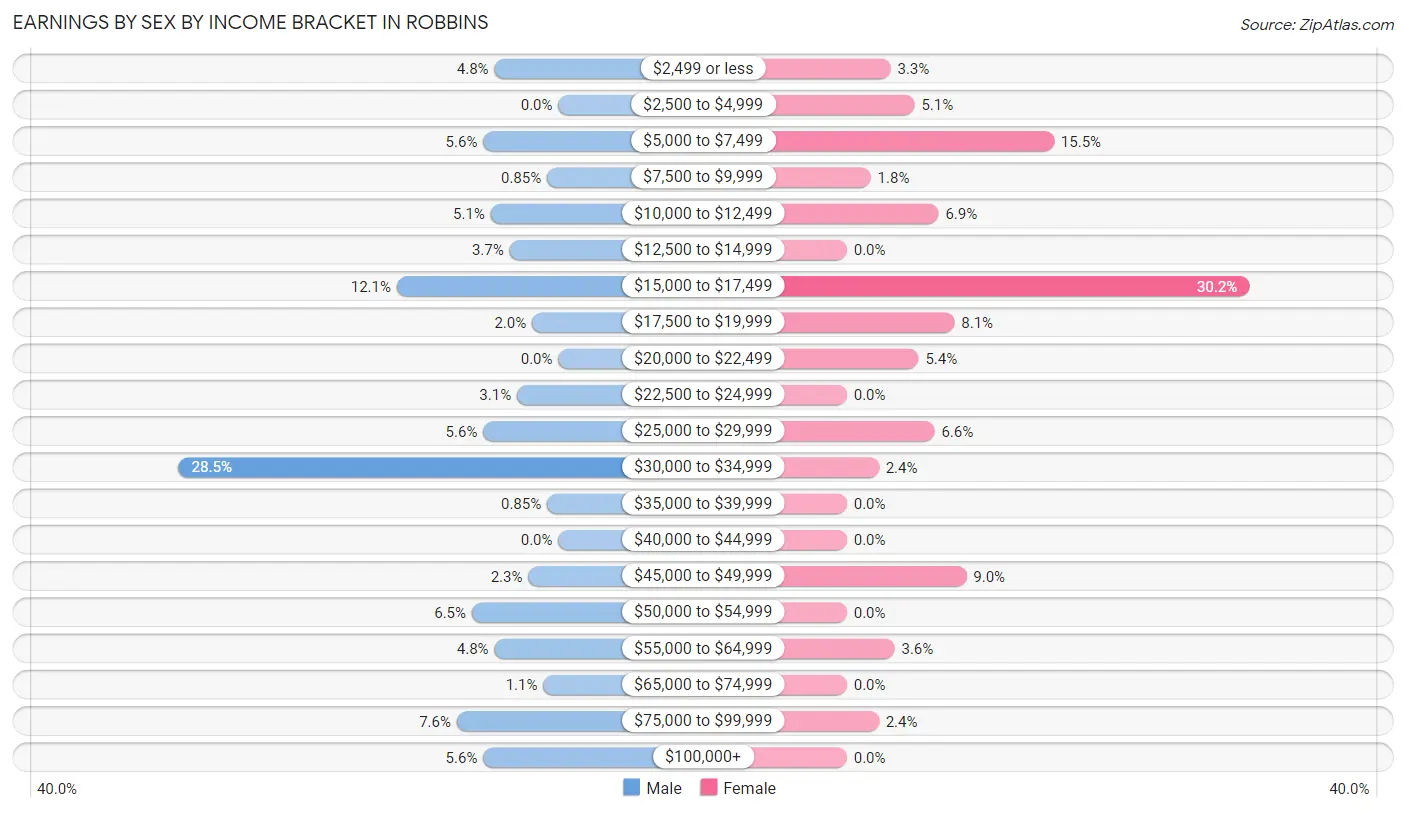
Earnings by Sex by Income Bracket in Robbins
The most common earnings brackets in Robbins are $30,000 to $34,999 for men (101 | 28.4%) and $15,000 to $17,499 for women (101 | 30.1%).
| Income | Male | Female |
| $2,499 or less | 17 (4.8%) | 11 (3.3%) |
| $2,500 to $4,999 | 0 (0.0%) | 17 (5.1%) |
| $5,000 to $7,499 | 20 (5.6%) | 52 (15.5%) |
| $7,500 to $9,999 | 3 (0.9%) | 6 (1.8%) |
| $10,000 to $12,499 | 18 (5.1%) | 23 (6.9%) |
| $12,500 to $14,999 | 13 (3.7%) | 0 (0.0%) |
| $15,000 to $17,499 | 43 (12.1%) | 101 (30.1%) |
| $17,500 to $19,999 | 7 (2.0%) | 27 (8.1%) |
| $20,000 to $22,499 | 0 (0.0%) | 18 (5.4%) |
| $22,500 to $24,999 | 11 (3.1%) | 0 (0.0%) |
| $25,000 to $29,999 | 20 (5.6%) | 22 (6.6%) |
| $30,000 to $34,999 | 101 (28.4%) | 8 (2.4%) |
| $35,000 to $39,999 | 3 (0.9%) | 0 (0.0%) |
| $40,000 to $44,999 | 0 (0.0%) | 0 (0.0%) |
| $45,000 to $49,999 | 8 (2.2%) | 30 (9.0%) |
| $50,000 to $54,999 | 23 (6.5%) | 0 (0.0%) |
| $55,000 to $64,999 | 17 (4.8%) | 12 (3.6%) |
| $65,000 to $74,999 | 4 (1.1%) | 0 (0.0%) |
| $75,000 to $99,999 | 27 (7.6%) | 8 (2.4%) |
| $100,000+ | 20 (5.6%) | 0 (0.0%) |
| Total | 355 (100.0%) | 335 (100.0%) |
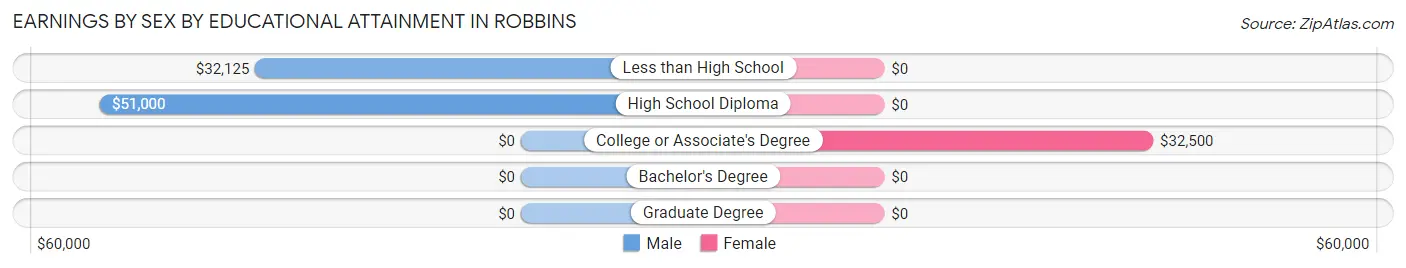
Earnings by Sex by Educational Attainment in Robbins
Average earnings in Robbins are $32,727 for men and $19,954 for women, a difference of 39.0%. Men with an educational attainment of high school diploma enjoy the highest average annual earnings of $51,000, while those with less than high school education earn the least with $32,125. Women with an educational attainment of college or associate's degree earn the most with the average annual earnings of $32,500, while those with college or associate's degree education have the smallest earnings of $32,500.
| Educational Attainment | Male Income | Female Income |
| Less than High School | $32,125 | $0 |
| High School Diploma | $51,000 | $0 |
| College or Associate's Degree | - | - |
| Bachelor's Degree | - | - |
| Graduate Degree | - | - |
| Total | $32,727 | $19,954 |
Family Income in Robbins
Family Income Brackets in Robbins
According to the Robbins family income data, there are 153 families falling into the $35,000 to $49,999 income range, which is the most common income bracket and makes up 38.3% of all families. Conversely, the $200,000+ income bracket is the least frequent group with only 2 families (0.5%) belonging to this category.
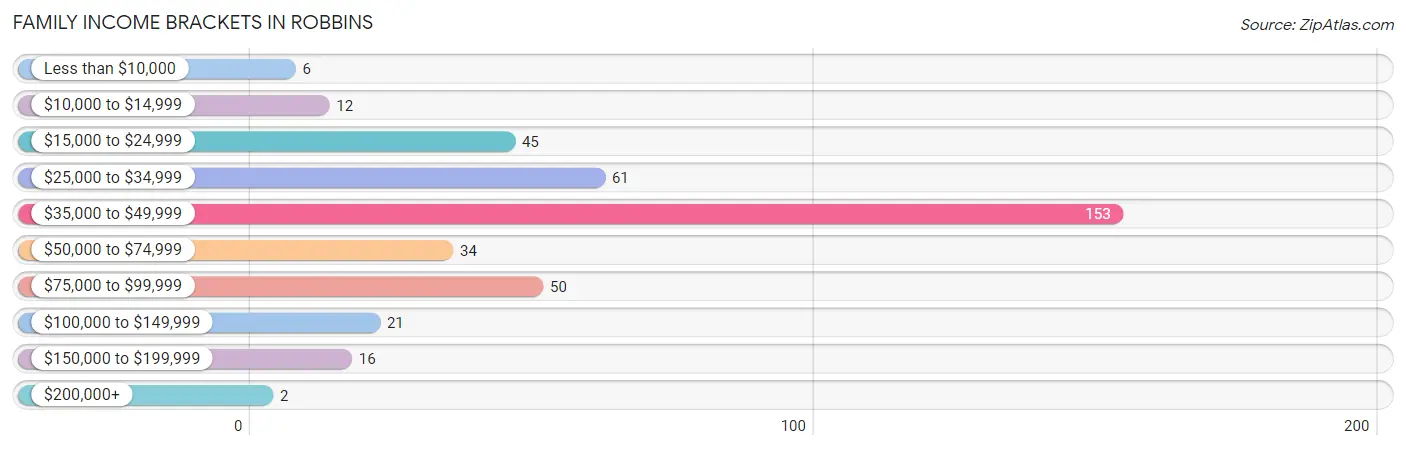
| Income Bracket | # Families | % Families |
| Less than $10,000 | 6 | 1.5% |
| $10,000 to $14,999 | 12 | 3.0% |
| $15,000 to $24,999 | 45 | 11.3% |
| $25,000 to $34,999 | 61 | 15.3% |
| $35,000 to $49,999 | 153 | 38.3% |
| $50,000 to $74,999 | 34 | 8.5% |
| $75,000 to $99,999 | 50 | 12.5% |
| $100,000 to $149,999 | 21 | 5.3% |
| $150,000 to $199,999 | 16 | 4.0% |
| $200,000+ | 2 | 0.5% |
Family Income by Famaliy Size in Robbins
3-person families (100 | 25.0%) account for the highest median family income in Robbins with $97,900 per family, while 3-person families (100 | 25.0%) have the highest median income of $32,633 per family member.
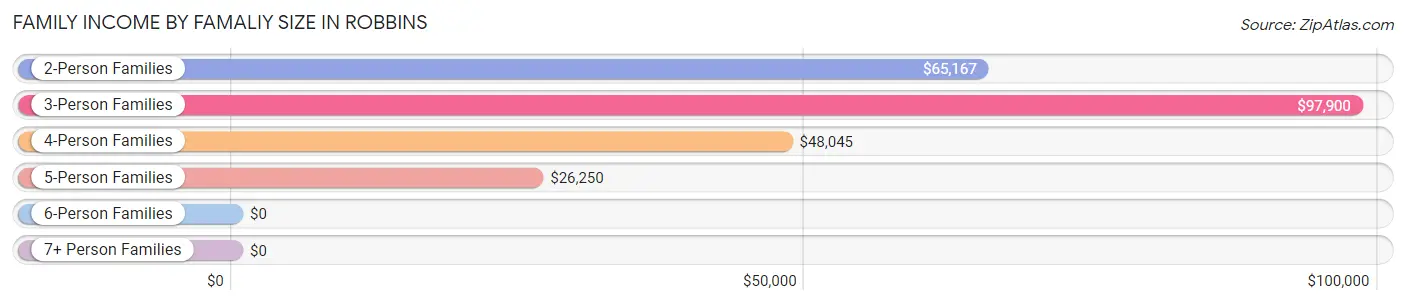
| Income Bracket | # Families | Median Income |
| 2-Person Families | 74 (18.5%) | $65,167 |
| 3-Person Families | 100 (25.0%) | $97,900 |
| 4-Person Families | 196 (49.0%) | $48,045 |
| 5-Person Families | 25 (6.2%) | $26,250 |
| 6-Person Families | 0 (0.0%) | $0 |
| 7+ Person Families | 5 (1.3%) | $0 |
| Total | 400 (100.0%) | $48,094 |
Family Income by Number of Earners in Robbins
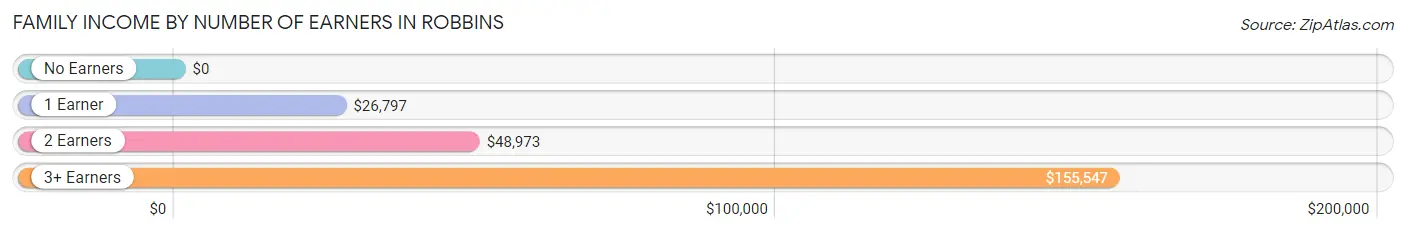
| Number of Earners | # Families | Median Income |
| No Earners | 51 (12.8%) | $0 |
| 1 Earner | 107 (26.8%) | $26,797 |
| 2 Earners | 213 (53.2%) | $48,973 |
| 3+ Earners | 29 (7.2%) | $155,547 |
| Total | 400 (100.0%) | $48,094 |
Household Income in Robbins
Household Income Brackets in Robbins
With 165 households falling in the category, the $35,000 to $49,999 income range is the most frequent in Robbins, accounting for 30.1% of all households. In contrast, only 5 households (0.9%) fall into the $200,000+ income bracket, making it the least populous group.
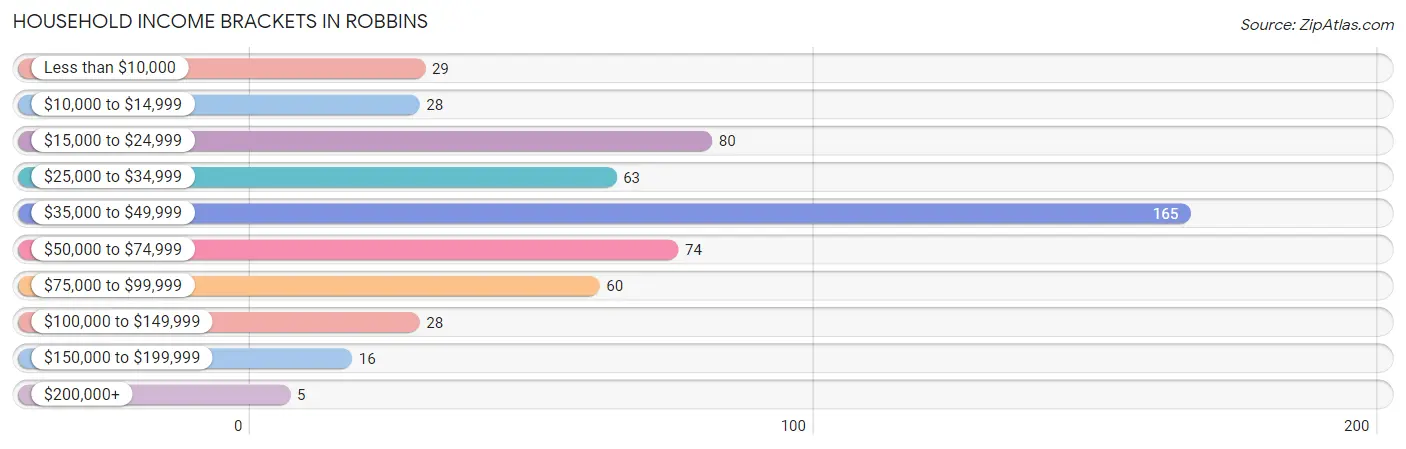
| Income Bracket | # Households | % Households |
| Less than $10,000 | 29 | 5.3% |
| $10,000 to $14,999 | 28 | 5.1% |
| $15,000 to $24,999 | 80 | 14.6% |
| $25,000 to $34,999 | 63 | 11.5% |
| $35,000 to $49,999 | 165 | 30.1% |
| $50,000 to $74,999 | 74 | 13.5% |
| $75,000 to $99,999 | 60 | 10.9% |
| $100,000 to $149,999 | 28 | 5.1% |
| $150,000 to $199,999 | 16 | 2.9% |
| $200,000+ | 5 | 0.9% |
Household Income by Householder Age in Robbins
The median household income in Robbins is $47,770, with the highest median household income of $76,500 found in the 45 to 64 years age bracket for the primary householder. A total of 140 households (25.6%) fall into this category. Meanwhile, the 15 to 24 years age bracket for the primary householder has the lowest median household income of $0, with 117 households (21.3%) in this group.
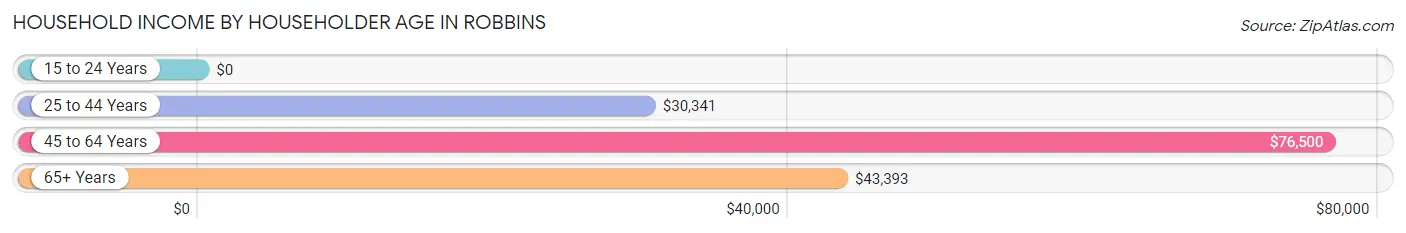
| Income Bracket | # Households | Median Income |
| 15 to 24 Years | 117 (21.3%) | $0 |
| 25 to 44 Years | 202 (36.9%) | $30,341 |
| 45 to 64 Years | 140 (25.6%) | $76,500 |
| 65+ Years | 89 (16.2%) | $43,393 |
| Total | 548 (100.0%) | $47,770 |
Poverty in Robbins
Income Below Poverty by Sex and Age in Robbins
With 32.9% poverty level for males and 32.7% for females among the residents of Robbins, 12 to 14 year old males and 15 year old females are the most vulnerable to poverty, with 41 males (100.0%) and 6 females (100.0%) in their respective age groups living below the poverty level.
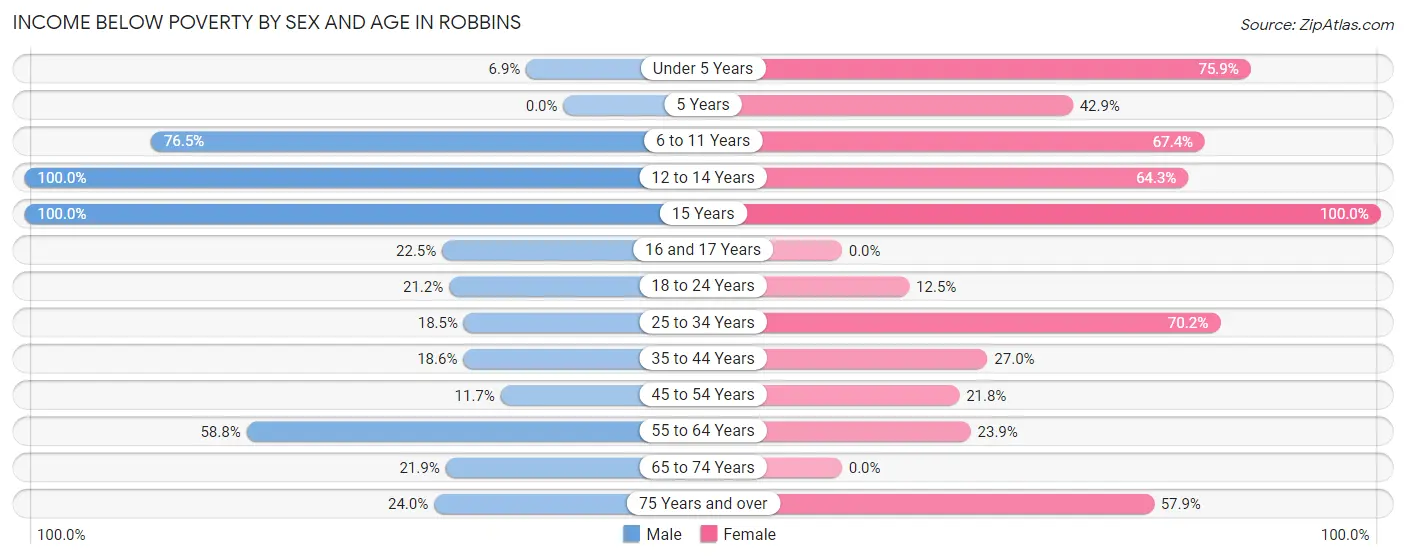
| Age Bracket | Male | Female |
| Under 5 Years | 8 (6.9%) | 22 (75.9%) |
| 5 Years | 0 (0.0%) | 6 (42.9%) |
| 6 to 11 Years | 62 (76.5%) | 31 (67.4%) |
| 12 to 14 Years | 41 (100.0%) | 18 (64.3%) |
| 15 Years | 36 (100.0%) | 6 (100.0%) |
| 16 and 17 Years | 9 (22.5%) | 0 (0.0%) |
| 18 to 24 Years | 14 (21.2%) | 22 (12.5%) |
| 25 to 34 Years | 17 (18.5%) | 33 (70.2%) |
| 35 to 44 Years | 21 (18.6%) | 20 (27.0%) |
| 45 to 54 Years | 12 (11.7%) | 17 (21.8%) |
| 55 to 64 Years | 30 (58.8%) | 11 (23.9%) |
| 65 to 74 Years | 7 (21.9%) | 0 (0.0%) |
| 75 Years and over | 6 (24.0%) | 22 (57.9%) |
| Total | 263 (32.9%) | 208 (32.7%) |
Income Above Poverty by Sex and Age in Robbins
According to the poverty statistics in Robbins, males aged 5 years and females aged 16 and 17 years are the age groups that are most secure financially, with 100.0% of males and 100.0% of females in these age groups living above the poverty line.
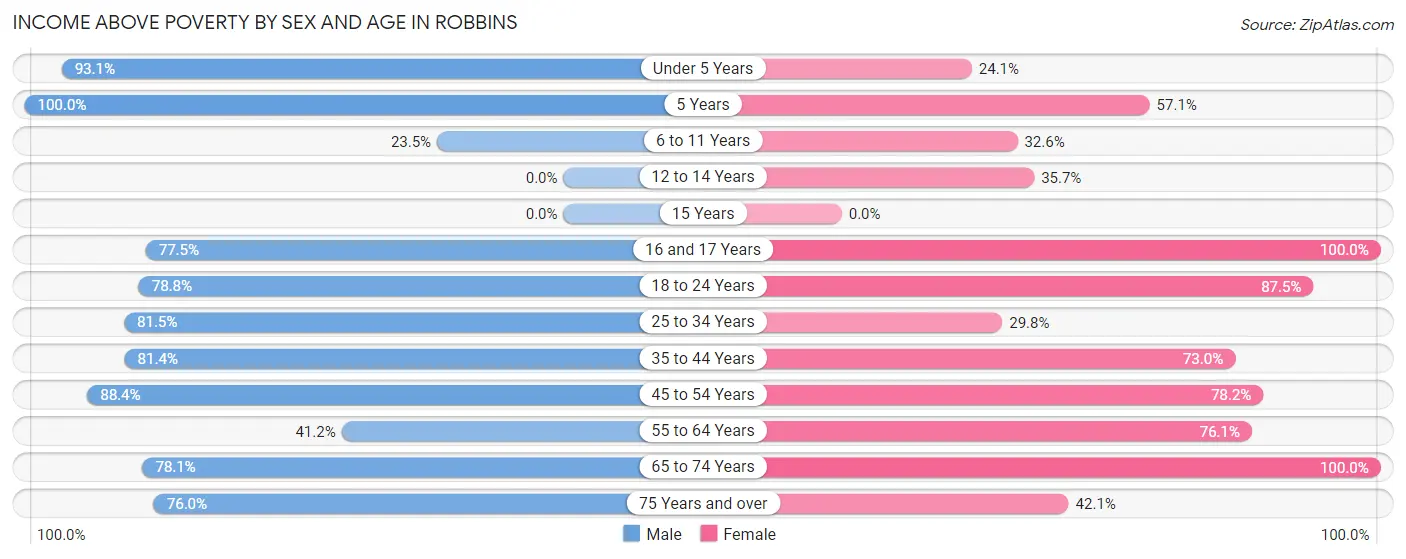
| Age Bracket | Male | Female |
| Under 5 Years | 108 (93.1%) | 7 (24.1%) |
| 5 Years | 4 (100.0%) | 8 (57.1%) |
| 6 to 11 Years | 19 (23.5%) | 15 (32.6%) |
| 12 to 14 Years | 0 (0.0%) | 10 (35.7%) |
| 15 Years | 0 (0.0%) | 0 (0.0%) |
| 16 and 17 Years | 31 (77.5%) | 23 (100.0%) |
| 18 to 24 Years | 52 (78.8%) | 154 (87.5%) |
| 25 to 34 Years | 75 (81.5%) | 14 (29.8%) |
| 35 to 44 Years | 92 (81.4%) | 54 (73.0%) |
| 45 to 54 Years | 91 (88.3%) | 61 (78.2%) |
| 55 to 64 Years | 21 (41.2%) | 35 (76.1%) |
| 65 to 74 Years | 25 (78.1%) | 31 (100.0%) |
| 75 Years and over | 19 (76.0%) | 16 (42.1%) |
| Total | 537 (67.1%) | 428 (67.3%) |
Income Below Poverty Among Married-Couple Families in Robbins
The poverty statistics for married-couple families in Robbins show that 3.6% or 11 of the total 304 families live below the poverty line. Families with 3 or 4 children have the highest poverty rate of 100.0%, comprising of 3 families. On the other hand, families with no children have the lowest poverty rate of 0.0%, which includes 0 families.
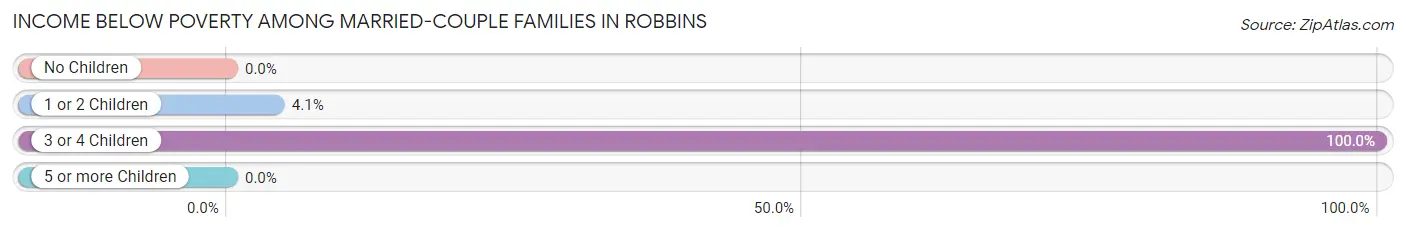
| Children | Above Poverty | Below Poverty |
| No Children | 105 (100.0%) | 0 (0.0%) |
| 1 or 2 Children | 188 (95.9%) | 8 (4.1%) |
| 3 or 4 Children | 0 (0.0%) | 3 (100.0%) |
| 5 or more Children | 0 (0.0%) | 0 (0.0%) |
| Total | 293 (96.4%) | 11 (3.6%) |
Income Below Poverty Among Single-Parent Households in Robbins
According to the poverty data in Robbins, 79.2% or 19 single-father households and 81.9% or 59 single-mother households are living below the poverty line. Among single-father households, those with 3 or 4 children have the highest poverty rate, with 19 households (100.0%) experiencing poverty. Likewise, among single-mother households, those with 3 or 4 children have the highest poverty rate, with 24 households (100.0%) falling below the poverty line.
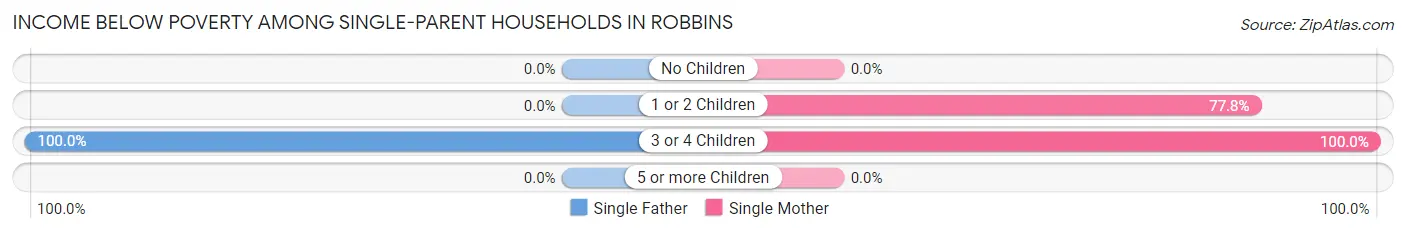
| Children | Single Father | Single Mother |
| No Children | 0 (0.0%) | 0 (0.0%) |
| 1 or 2 Children | 0 (0.0%) | 35 (77.8%) |
| 3 or 4 Children | 19 (100.0%) | 24 (100.0%) |
| 5 or more Children | 0 (0.0%) | 0 (0.0%) |
| Total | 19 (79.2%) | 59 (81.9%) |
Income Below Poverty Among Married-Couple vs Single-Parent Households in Robbins
The poverty data for Robbins shows that 11 of the married-couple family households (3.6%) and 78 of the single-parent households (81.2%) are living below the poverty level. Within the married-couple family households, those with 3 or 4 children have the highest poverty rate, with 3 households (100.0%) falling below the poverty line. Among the single-parent households, those with 3 or 4 children have the highest poverty rate, with 43 household (100.0%) living below poverty.
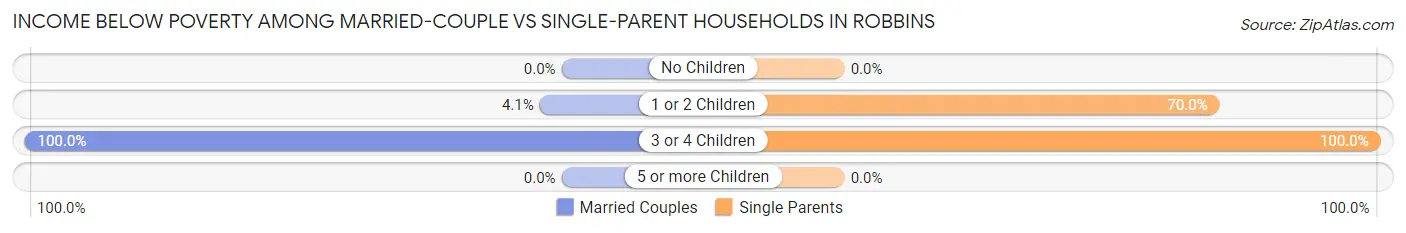
| Children | Married-Couple Families | Single-Parent Households |
| No Children | 0 (0.0%) | 0 (0.0%) |
| 1 or 2 Children | 8 (4.1%) | 35 (70.0%) |
| 3 or 4 Children | 3 (100.0%) | 43 (100.0%) |
| 5 or more Children | 0 (0.0%) | 0 (0.0%) |
| Total | 11 (3.6%) | 78 (81.2%) |
Race in Robbins
The most populous races in Robbins are White / Caucasian (829 | 54.9%), Hispanic or Latino (624 | 41.3%), and Some other Race (301 | 19.9%).
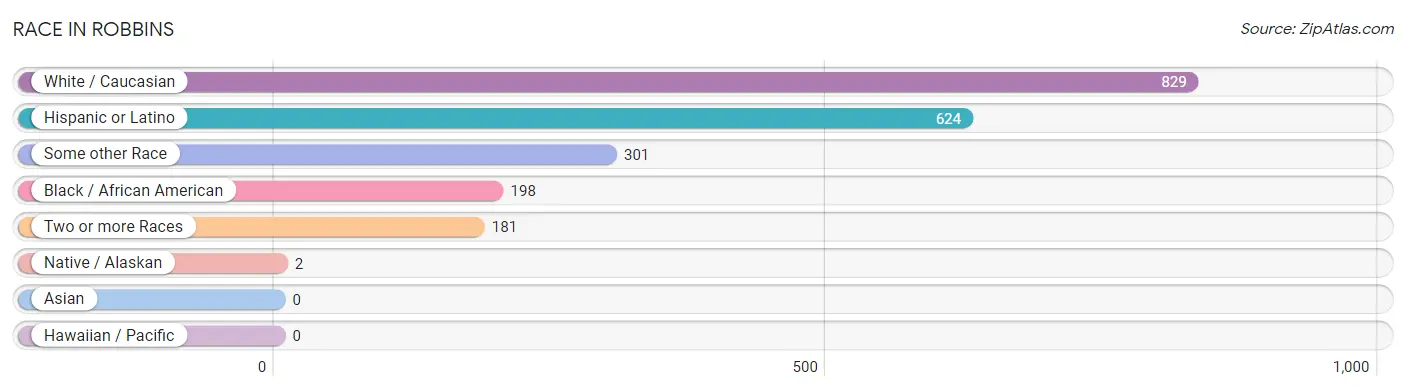
| Race | # Population | % Population |
| Asian | 0 | 0.0% |
| Black / African American | 198 | 13.1% |
| Hawaiian / Pacific | 0 | 0.0% |
| Hispanic or Latino | 624 | 41.3% |
| Native / Alaskan | 2 | 0.1% |
| White / Caucasian | 829 | 54.9% |
| Two or more Races | 181 | 12.0% |
| Some other Race | 301 | 19.9% |
| Total | 1,511 | 100.0% |
Ancestry in Robbins
The most populous ancestries reported in Robbins are Mexican (441 | 29.2%), Central American (173 | 11.5%), Honduran (124 | 8.2%), German (94 | 6.2%), and English (82 | 5.4%), together accounting for 60.5% of all Robbins residents.
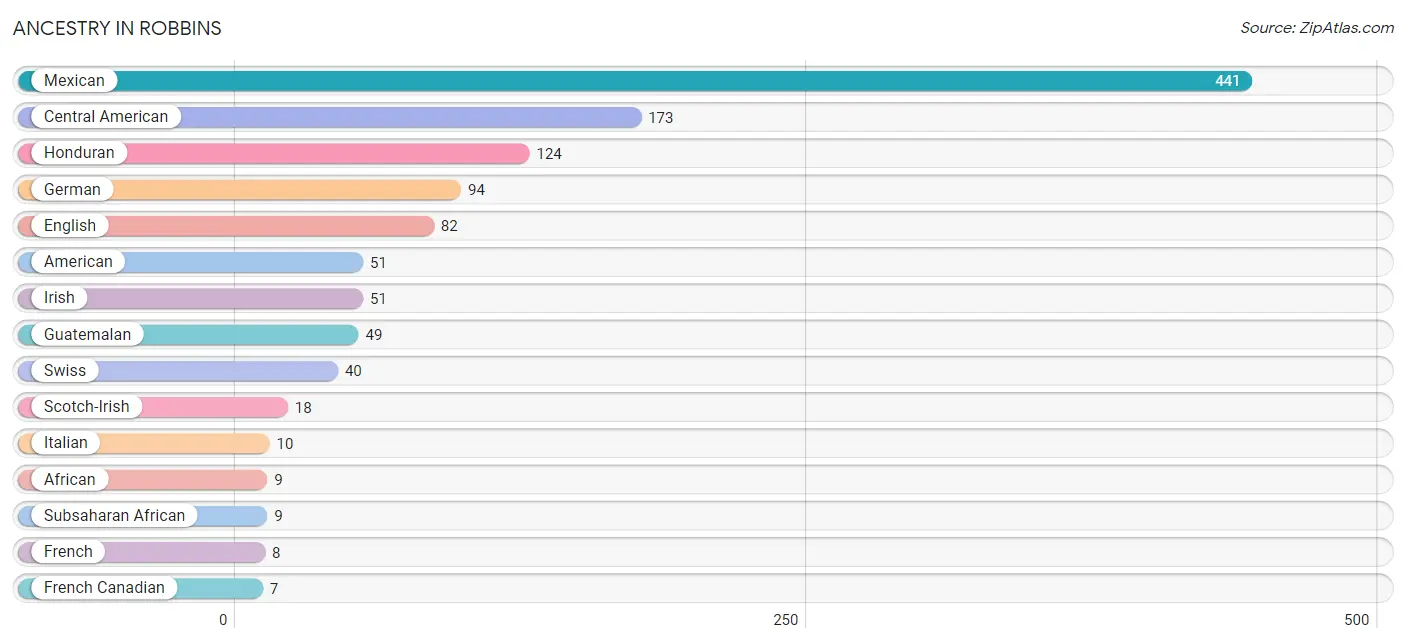
| Ancestry | # Population | % Population |
| African | 9 | 0.6% |
| American | 51 | 3.4% |
| Central American | 173 | 11.5% |
| English | 82 | 5.4% |
| French | 8 | 0.5% |
| French Canadian | 7 | 0.5% |
| German | 94 | 6.2% |
| Greek | 6 | 0.4% |
| Guatemalan | 49 | 3.2% |
| Honduran | 124 | 8.2% |
| Irish | 51 | 3.4% |
| Italian | 10 | 0.7% |
| Mexican | 441 | 29.2% |
| Peruvian | 2 | 0.1% |
| Puerto Rican | 3 | 0.2% |
| Scotch-Irish | 18 | 1.2% |
| South American | 2 | 0.1% |
| South American Indian | 2 | 0.1% |
| Subsaharan African | 9 | 0.6% |
| Swedish | 6 | 0.4% |
| Swiss | 40 | 2.6% | View All 21 Rows |
Immigrants in Robbins
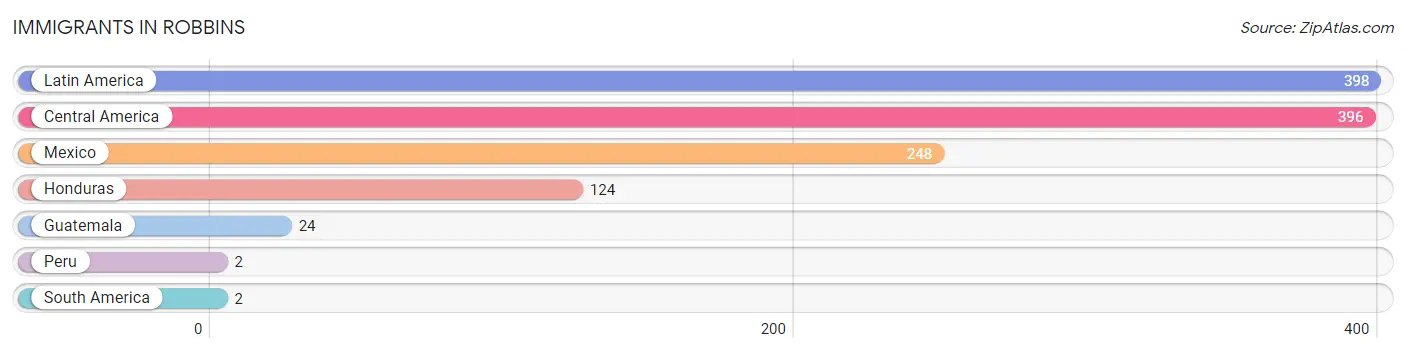
The most numerous immigrant groups reported in Robbins came from Latin America (398 | 26.3%), Central America (396 | 26.2%), Mexico (248 | 16.4%), Honduras (124 | 8.2%), and Guatemala (24 | 1.6%), together accounting for 78.8% of all Robbins residents.
| Immigration Origin | # Population | % Population |
| Central America | 396 | 26.2% |
| Guatemala | 24 | 1.6% |
| Honduras | 124 | 8.2% |
| Latin America | 398 | 26.3% |
| Mexico | 248 | 16.4% |
| Peru | 2 | 0.1% |
| South America | 2 | 0.1% | View All 7 Rows |
Sex and Age in Robbins
Sex and Age in Robbins
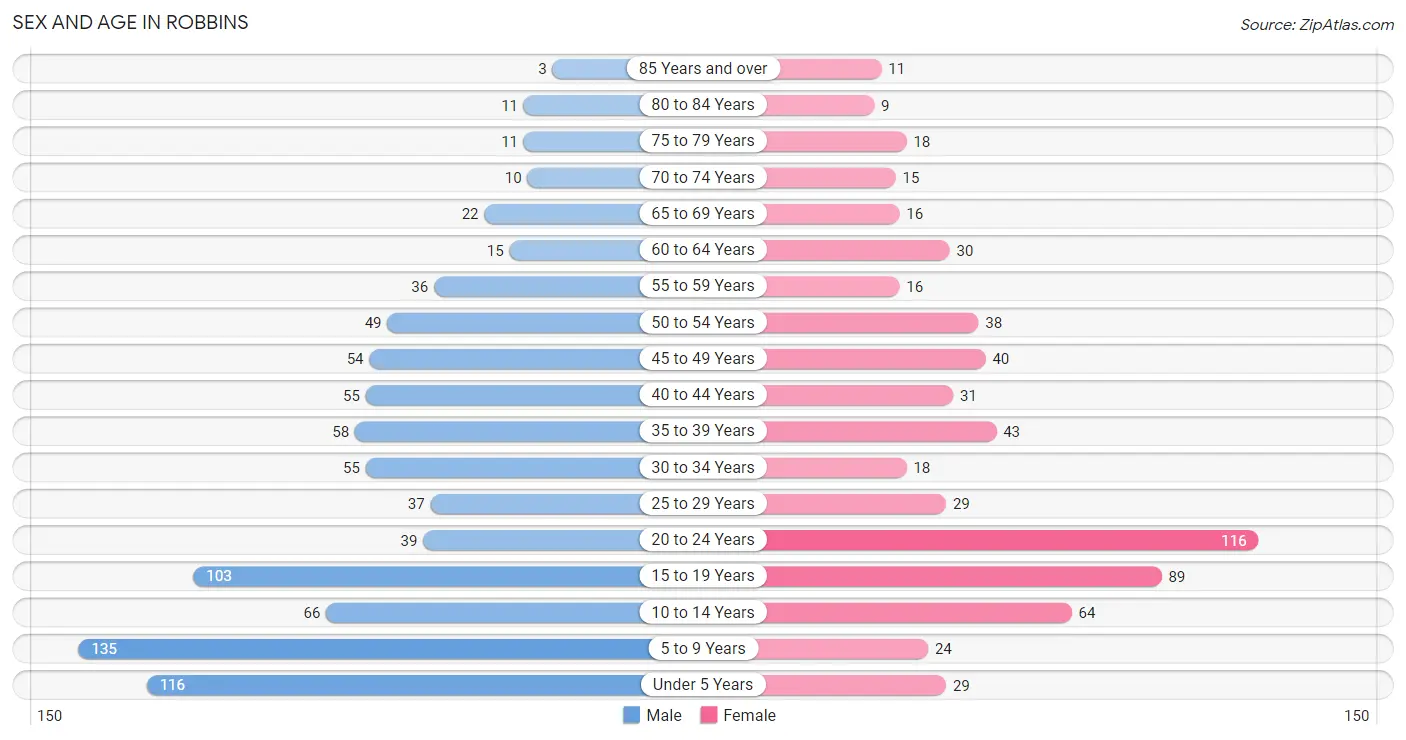
The most populous age groups in Robbins are 5 to 9 Years (135 | 15.4%) for men and 20 to 24 Years (116 | 18.2%) for women.
| Age Bracket | Male | Female |
| Under 5 Years | 116 (13.3%) | 29 (4.6%) |
| 5 to 9 Years | 135 (15.4%) | 24 (3.8%) |
| 10 to 14 Years | 66 (7.5%) | 64 (10.1%) |
| 15 to 19 Years | 103 (11.8%) | 89 (14.0%) |
| 20 to 24 Years | 39 (4.5%) | 116 (18.2%) |
| 25 to 29 Years | 37 (4.2%) | 29 (4.6%) |
| 30 to 34 Years | 55 (6.3%) | 18 (2.8%) |
| 35 to 39 Years | 58 (6.6%) | 43 (6.8%) |
| 40 to 44 Years | 55 (6.3%) | 31 (4.9%) |
| 45 to 49 Years | 54 (6.2%) | 40 (6.3%) |
| 50 to 54 Years | 49 (5.6%) | 38 (6.0%) |
| 55 to 59 Years | 36 (4.1%) | 16 (2.5%) |
| 60 to 64 Years | 15 (1.7%) | 30 (4.7%) |
| 65 to 69 Years | 22 (2.5%) | 16 (2.5%) |
| 70 to 74 Years | 10 (1.1%) | 15 (2.4%) |
| 75 to 79 Years | 11 (1.3%) | 18 (2.8%) |
| 80 to 84 Years | 11 (1.3%) | 9 (1.4%) |
| 85 Years and over | 3 (0.3%) | 11 (1.7%) |
| Total | 875 (100.0%) | 636 (100.0%) |
Families and Households in Robbins
Median Family Size in Robbins
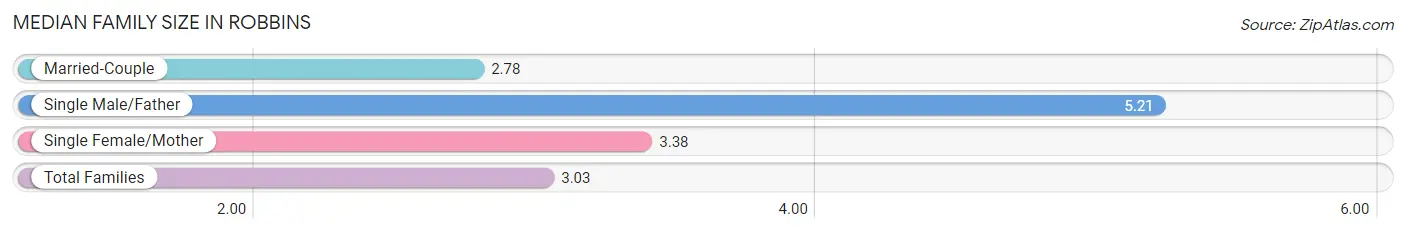
The median family size in Robbins is 3.03 persons per family, with single male/father families (24 | 6.0%) accounting for the largest median family size of 5.21 persons per family. On the other hand, married-couple families (304 | 76.0%) represent the smallest median family size with 2.78 persons per family.
| Family Type | # Families | Family Size |
| Married-Couple | 304 (76.0%) | 2.78 |
| Single Male/Father | 24 (6.0%) | 5.21 |
| Single Female/Mother | 72 (18.0%) | 3.38 |
| Total Families | 400 (100.0%) | 3.03 |
Median Household Size in Robbins
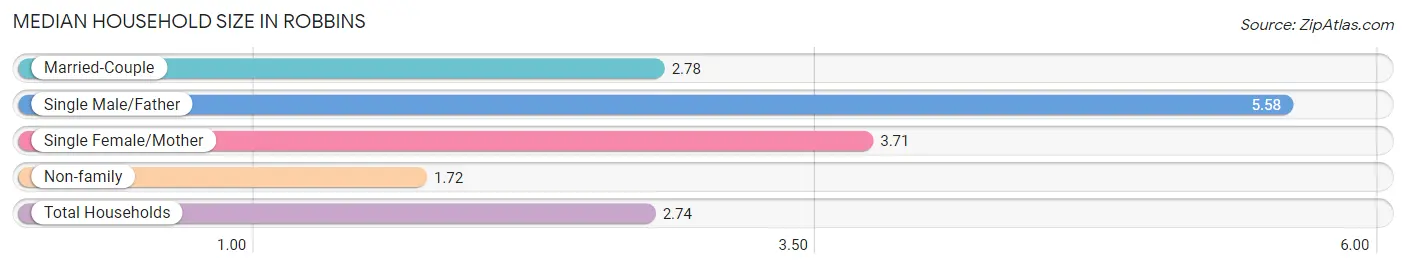
The median household size in Robbins is 2.74 persons per household, with single male/father households (24 | 4.4%) accounting for the largest median household size of 5.58 persons per household. non-family households (148 | 27.0%) represent the smallest median household size with 1.72 persons per household.
| Household Type | # Households | Household Size |
| Married-Couple | 304 (55.5%) | 2.78 |
| Single Male/Father | 24 (4.4%) | 5.58 |
| Single Female/Mother | 72 (13.1%) | 3.71 |
| Non-family | 148 (27.0%) | 1.72 |
| Total Households | 548 (100.0%) | 2.74 |
Household Size by Marriage Status in Robbins
Out of a total of 548 households in Robbins, 400 (73.0%) are family households, while 148 (27.0%) are nonfamily households. The most numerous type of family households are 4-person households, comprising 175, and the most common type of nonfamily households are 1-person households, comprising 89.
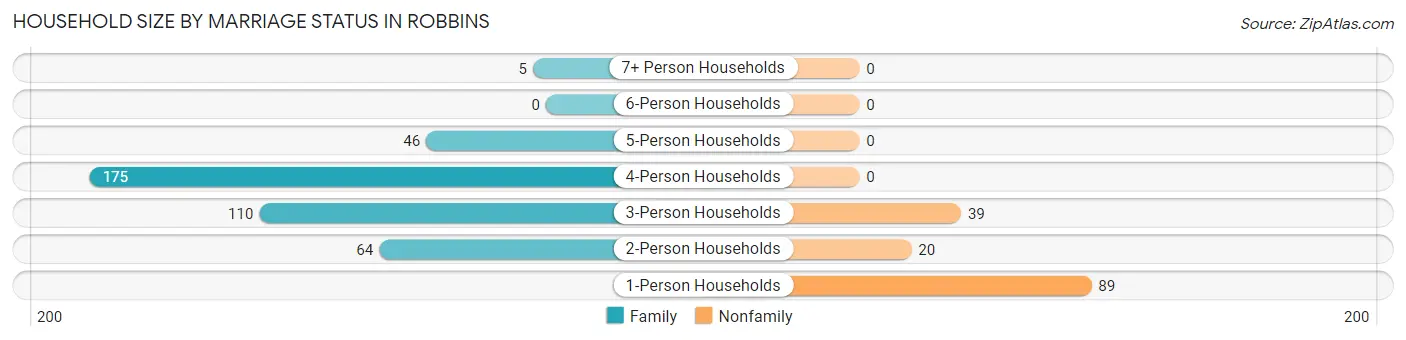
| Household Size | Family Households | Nonfamily Households |
| 1-Person Households | - | 89 (16.2%) |
| 2-Person Households | 64 (11.7%) | 20 (3.6%) |
| 3-Person Households | 110 (20.1%) | 39 (7.1%) |
| 4-Person Households | 175 (31.9%) | 0 (0.0%) |
| 5-Person Households | 46 (8.4%) | 0 (0.0%) |
| 6-Person Households | 0 (0.0%) | 0 (0.0%) |
| 7+ Person Households | 5 (0.9%) | 0 (0.0%) |
| Total | 400 (73.0%) | 148 (27.0%) |
Female Fertility in Robbins
Fertility by Age in Robbins
Average fertility rate in Robbins is 276.0 births per 1,000 women. Women in the age bracket of 20 to 34 years have the highest fertility rate with 620.0 births per 1,000 women. Women in the age bracket of 20 to 34 years acount for 100.0% of all women with births.
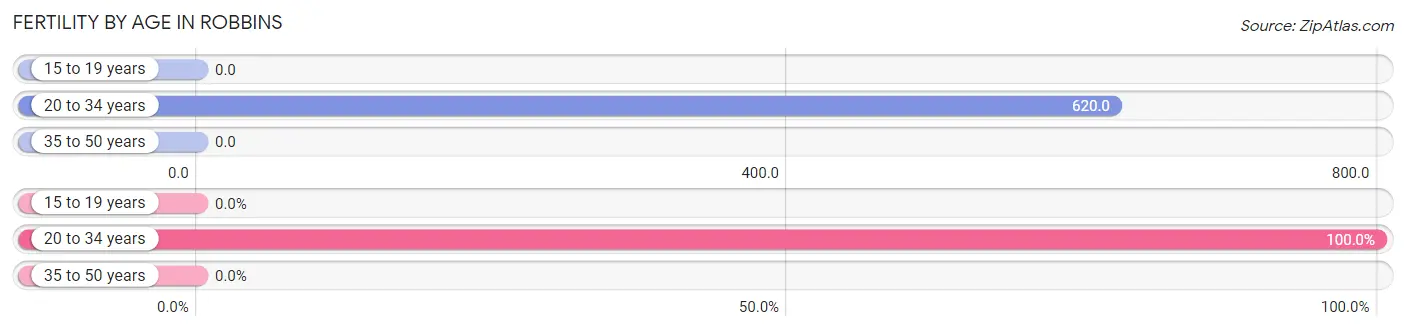
| Age Bracket | Women with Births | Births / 1,000 Women |
| 15 to 19 years | 0 (0.0%) | 0.0 |
| 20 to 34 years | 101 (100.0%) | 620.0 |
| 35 to 50 years | 0 (0.0%) | 0.0 |
| Total | 101 (100.0%) | 276.0 |
Fertility by Age by Marriage Status in Robbins
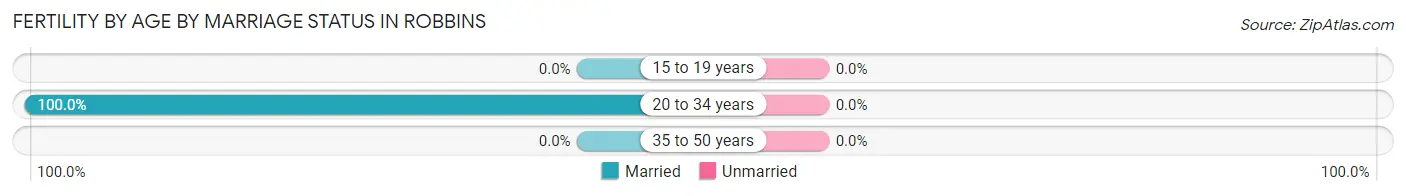
| Age Bracket | Married | Unmarried |
| 15 to 19 years | 0 (0.0%) | 0 (0.0%) |
| 20 to 34 years | 101 (100.0%) | 0 (0.0%) |
| 35 to 50 years | 0 (0.0%) | 0 (0.0%) |
| Total | 101 (100.0%) | 0 (0.0%) |
Fertility by Education in Robbins
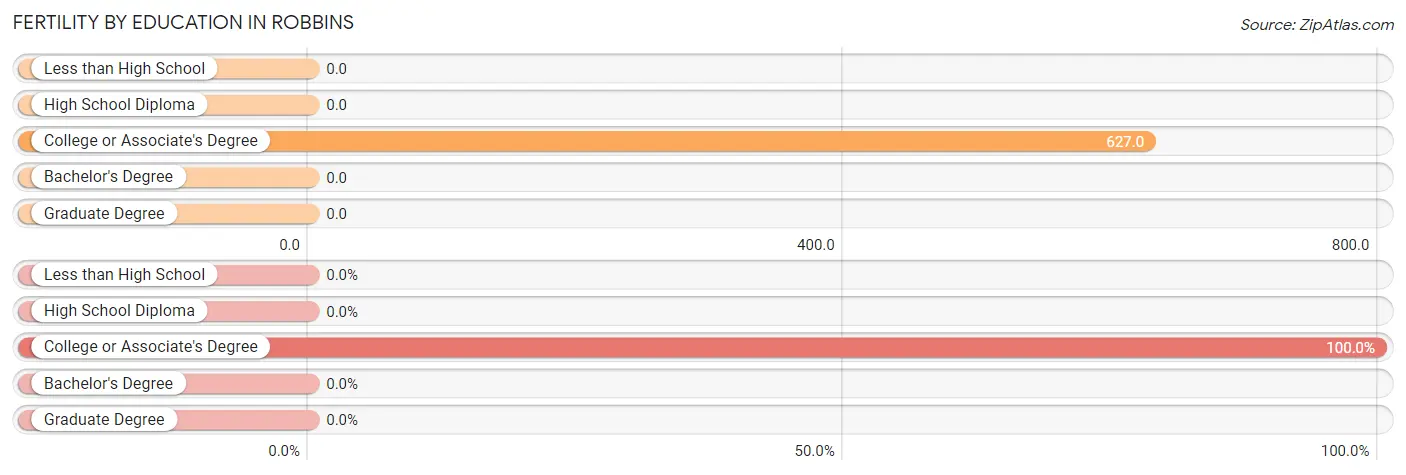
| Educational Attainment | Women with Births | Births / 1,000 Women |
| Less than High School | 0 (0.0%) | 0.0 |
| High School Diploma | 0 (0.0%) | 0.0 |
| College or Associate's Degree | 101 (100.0%) | 627.0 |
| Bachelor's Degree | 0 (0.0%) | 0.0 |
| Graduate Degree | 0 (0.0%) | 0.0 |
| Total | 101 (100.0%) | 276.0 |
Fertility by Education by Marriage Status in Robbins
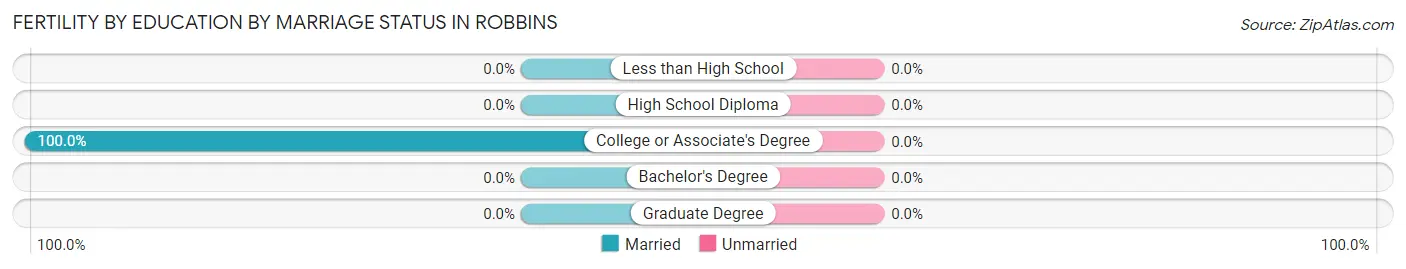
| Educational Attainment | Married | Unmarried |
| Less than High School | 0 (0.0%) | 0 (0.0%) |
| High School Diploma | 0 (0.0%) | 0 (0.0%) |
| College or Associate's Degree | 101 (100.0%) | 0 (0.0%) |
| Bachelor's Degree | 0 (0.0%) | 0 (0.0%) |
| Graduate Degree | 0 (0.0%) | 0 (0.0%) |
| Total | 101 (100.0%) | 0 (0.0%) |
Employment Characteristics in Robbins
Employment by Class of Employer in Robbins
Among the 559 employed individuals in Robbins, private company employees (476 | 85.2%), self-employed (not incorporated) (23 | 4.1%), and not-for-profit organizations (18 | 3.2%) make up the most common classes of employment.
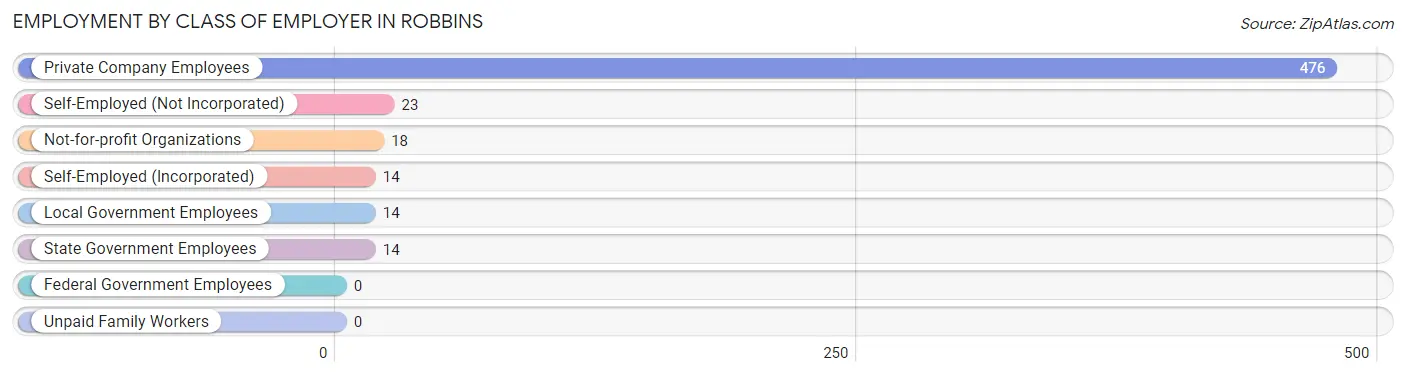
| Employer Class | # Employees | % Employees |
| Private Company Employees | 476 | 85.2% |
| Self-Employed (Incorporated) | 14 | 2.5% |
| Self-Employed (Not Incorporated) | 23 | 4.1% |
| Not-for-profit Organizations | 18 | 3.2% |
| Local Government Employees | 14 | 2.5% |
| State Government Employees | 14 | 2.5% |
| Federal Government Employees | 0 | 0.0% |
| Unpaid Family Workers | 0 | 0.0% |
| Total | 559 | 100.0% |
Employment Status by Age in Robbins
According to the labor force statistics for Robbins, out of the total population over 16 years of age (1,035), 59.7% or 618 individuals are in the labor force, with 8.7% or 54 of them unemployed. The age group with the highest labor force participation rate is 25 to 29 years, with 95.5% or 63 individuals in the labor force. Within the labor force, the 16 to 19 years age range has the highest percentage of unemployed individuals, with 30.4% or 17 of them being unemployed.
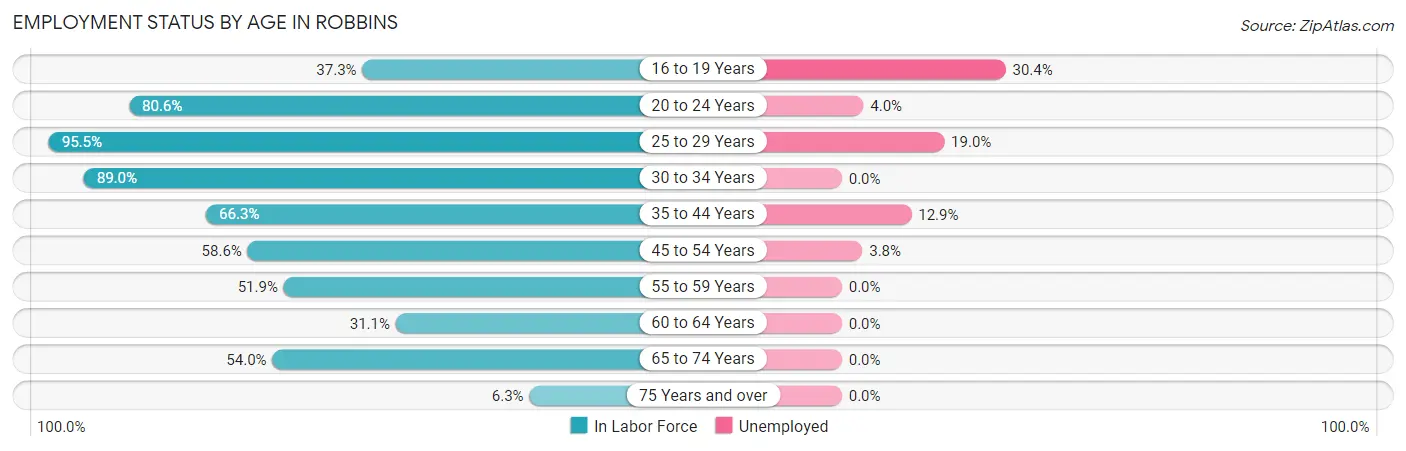
| Age Bracket | In Labor Force | Unemployed |
| 16 to 19 Years | 56 (37.3%) | 17 (30.4%) |
| 20 to 24 Years | 125 (80.6%) | 5 (4.0%) |
| 25 to 29 Years | 63 (95.5%) | 12 (19.0%) |
| 30 to 34 Years | 65 (89.0%) | 0 (0.0%) |
| 35 to 44 Years | 124 (66.3%) | 16 (12.9%) |
| 45 to 54 Years | 106 (58.6%) | 4 (3.8%) |
| 55 to 59 Years | 27 (51.9%) | 0 (0.0%) |
| 60 to 64 Years | 14 (31.1%) | 0 (0.0%) |
| 65 to 74 Years | 34 (54.0%) | 0 (0.0%) |
| 75 Years and over | 4 (6.3%) | 0 (0.0%) |
| Total | 618 (59.7%) | 54 (8.7%) |
Employment Status by Educational Attainment in Robbins
According to labor force statistics for Robbins, 66.1% of individuals (399) out of the total population between 25 and 64 years of age (604) are in the labor force, with 8.0% or 32 of them being unemployed. The group with the highest labor force participation rate are those with the educational attainment of bachelor's degree or higher, with 90.6% or 29 individuals in the labor force. Within the labor force, individuals with high school diploma education have the highest percentage of unemployment, with 21.4% or 28 of them being unemployed.
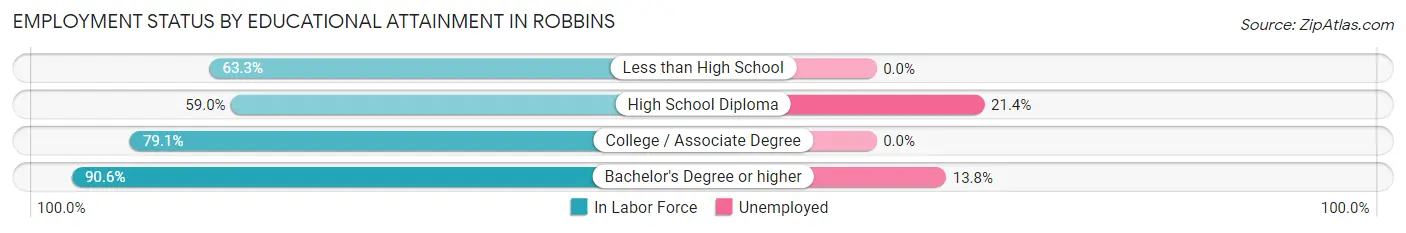
| Educational Attainment | In Labor Force | Unemployed |
| Less than High School | 152 (63.3%) | 0 (0.0%) |
| High School Diploma | 131 (59.0%) | 48 (21.4%) |
| College / Associate Degree | 87 (79.1%) | 0 (0.0%) |
| Bachelor's Degree or higher | 29 (90.6%) | 4 (13.8%) |
| Total | 399 (66.1%) | 48 (8.0%) |
Employment Occupations by Sex in Robbins
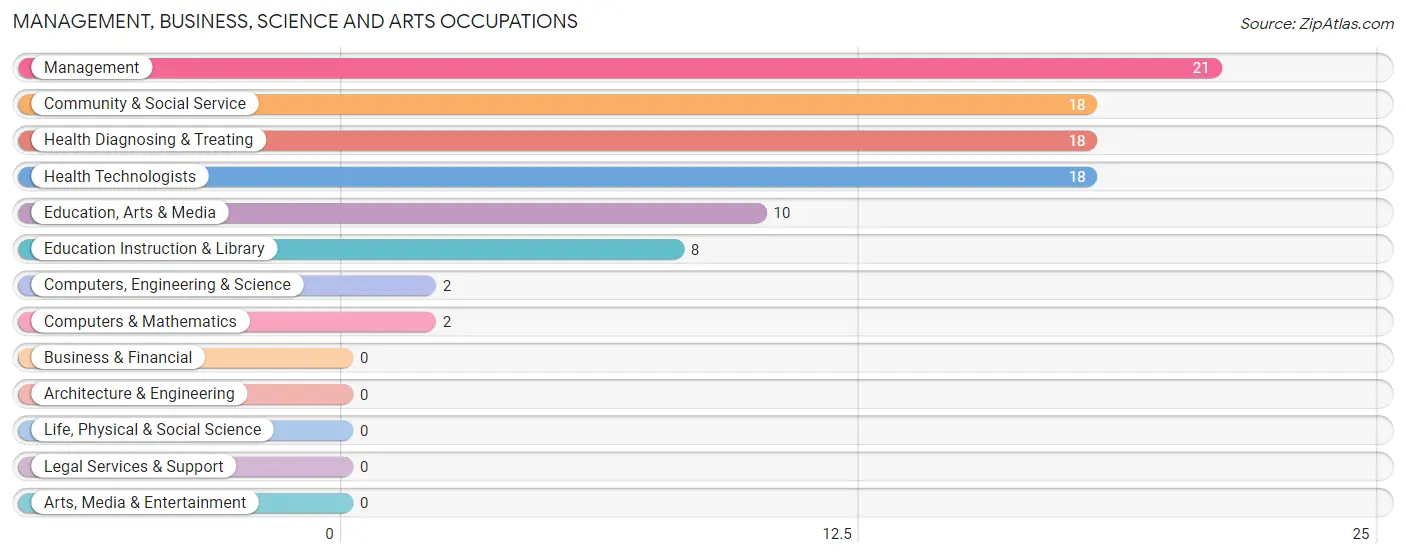
Management, Business, Science and Arts Occupations
The most common Management, Business, Science and Arts occupations in Robbins are Management (21 | 3.7%), Community & Social Service (18 | 3.2%), Health Diagnosing & Treating (18 | 3.2%), Health Technologists (18 | 3.2%), and Education, Arts & Media (10 | 1.8%).
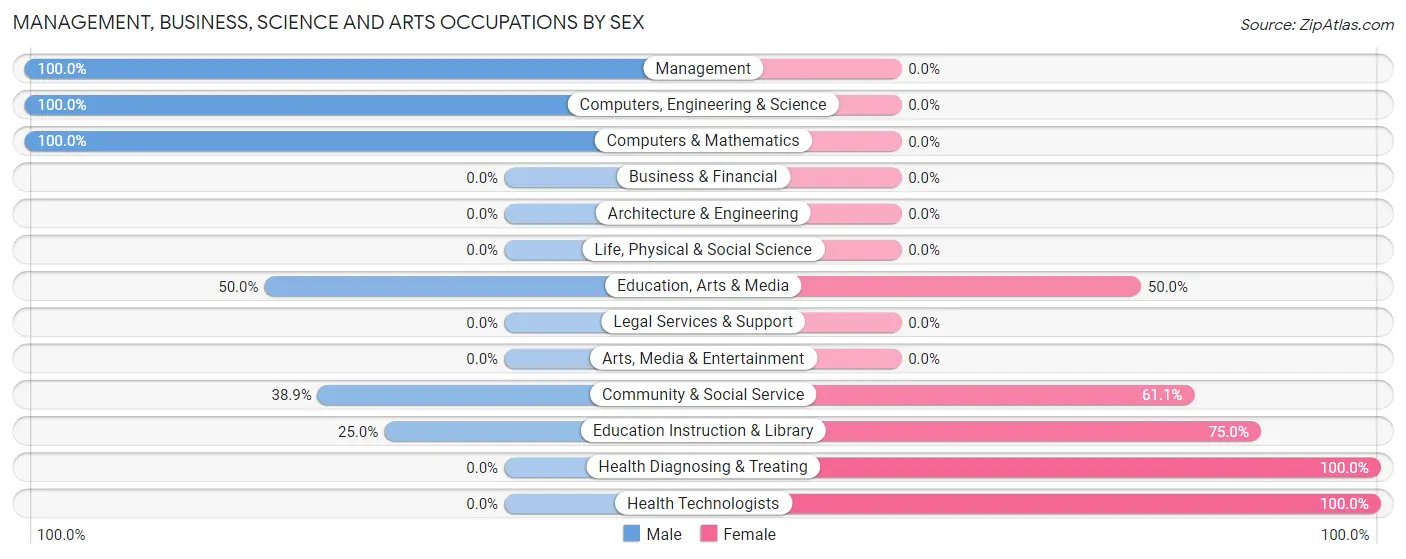
Management, Business, Science and Arts Occupations by Sex
Within the Management, Business, Science and Arts occupations in Robbins, the most male-oriented occupations are Management (100.0%), Computers, Engineering & Science (100.0%), and Computers & Mathematics (100.0%), while the most female-oriented occupations are Health Diagnosing & Treating (100.0%), Health Technologists (100.0%), and Education Instruction & Library (75.0%).
| Occupation | Male | Female |
| Management | 21 (100.0%) | 0 (0.0%) |
| Business & Financial | 0 (0.0%) | 0 (0.0%) |
| Computers, Engineering & Science | 2 (100.0%) | 0 (0.0%) |
| Computers & Mathematics | 2 (100.0%) | 0 (0.0%) |
| Architecture & Engineering | 0 (0.0%) | 0 (0.0%) |
| Life, Physical & Social Science | 0 (0.0%) | 0 (0.0%) |
| Community & Social Service | 7 (38.9%) | 11 (61.1%) |
| Education, Arts & Media | 5 (50.0%) | 5 (50.0%) |
| Legal Services & Support | 0 (0.0%) | 0 (0.0%) |
| Education Instruction & Library | 2 (25.0%) | 6 (75.0%) |
| Arts, Media & Entertainment | 0 (0.0%) | 0 (0.0%) |
| Health Diagnosing & Treating | 0 (0.0%) | 18 (100.0%) |
| Health Technologists | 0 (0.0%) | 18 (100.0%) |
| Total (Category) | 30 (50.8%) | 29 (49.1%) |
| Total (Overall) | 316 (56.0%) | 248 (44.0%) |
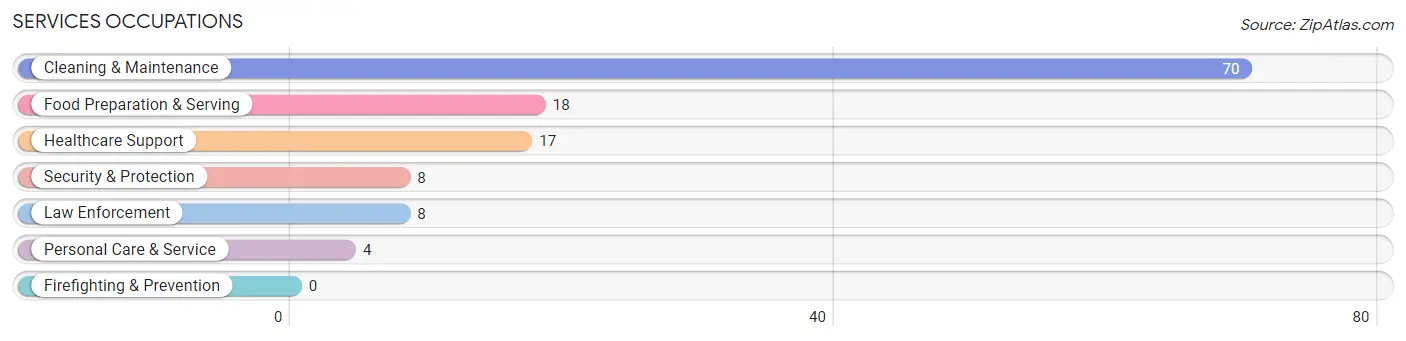
Services Occupations
The most common Services occupations in Robbins are Cleaning & Maintenance (70 | 12.4%), Food Preparation & Serving (18 | 3.2%), Healthcare Support (17 | 3.0%), Security & Protection (8 | 1.4%), and Law Enforcement (8 | 1.4%).
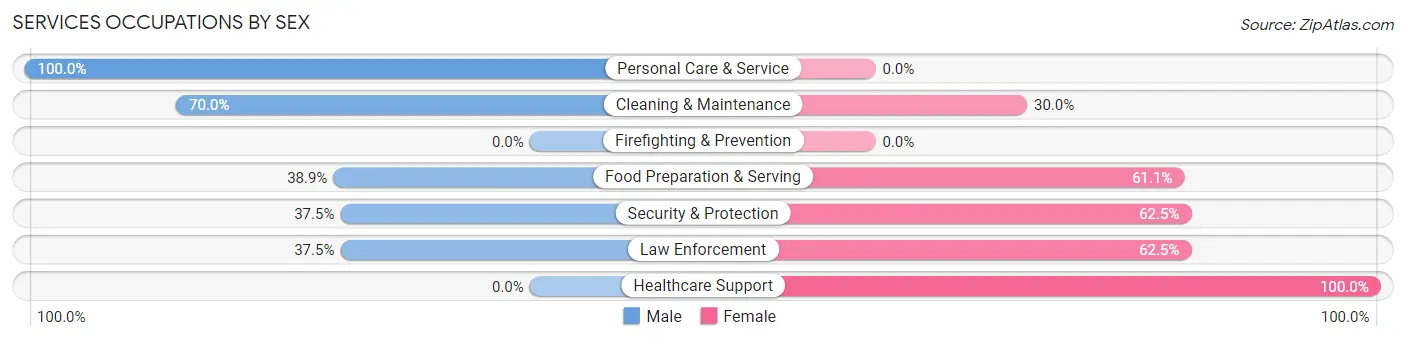
Services Occupations by Sex
Within the Services occupations in Robbins, the most male-oriented occupations are Personal Care & Service (100.0%), Cleaning & Maintenance (70.0%), and Food Preparation & Serving (38.9%), while the most female-oriented occupations are Healthcare Support (100.0%), Security & Protection (62.5%), and Law Enforcement (62.5%).
| Occupation | Male | Female |
| Healthcare Support | 0 (0.0%) | 17 (100.0%) |
| Security & Protection | 3 (37.5%) | 5 (62.5%) |
| Firefighting & Prevention | 0 (0.0%) | 0 (0.0%) |
| Law Enforcement | 3 (37.5%) | 5 (62.5%) |
| Food Preparation & Serving | 7 (38.9%) | 11 (61.1%) |
| Cleaning & Maintenance | 49 (70.0%) | 21 (30.0%) |
| Personal Care & Service | 4 (100.0%) | 0 (0.0%) |
| Total (Category) | 63 (53.8%) | 54 (46.2%) |
| Total (Overall) | 316 (56.0%) | 248 (44.0%) |
Sales and Office Occupations
The most common Sales and Office occupations in Robbins are Office & Administration (115 | 20.4%), and Sales & Related (33 | 5.9%).
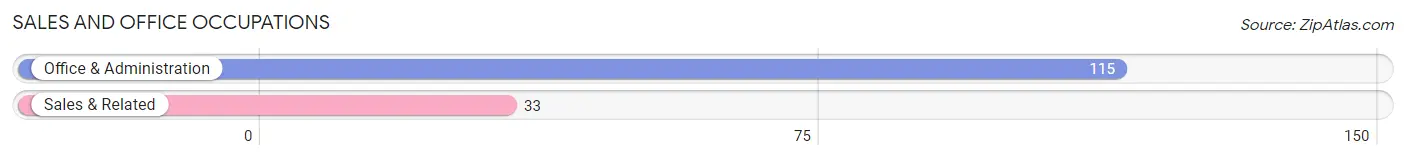
Sales and Office Occupations by Sex
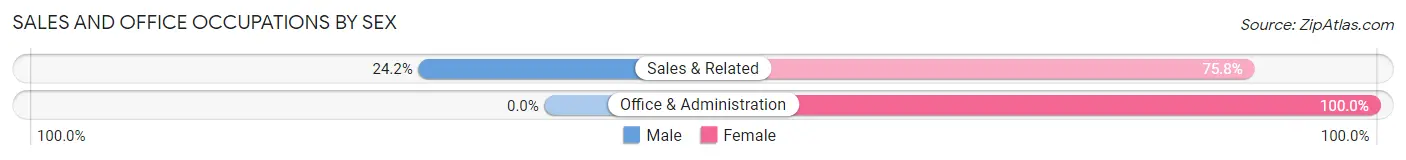
| Occupation | Male | Female |
| Sales & Related | 8 (24.2%) | 25 (75.8%) |
| Office & Administration | 0 (0.0%) | 115 (100.0%) |
| Total (Category) | 8 (5.4%) | 140 (94.6%) |
| Total (Overall) | 316 (56.0%) | 248 (44.0%) |
Natural Resources, Construction and Maintenance Occupations
The most common Natural Resources, Construction and Maintenance occupations in Robbins are Construction & Extraction (87 | 15.4%), Installation, Maintenance & Repair (29 | 5.1%), and Farming, Fishing & Forestry (15 | 2.7%).
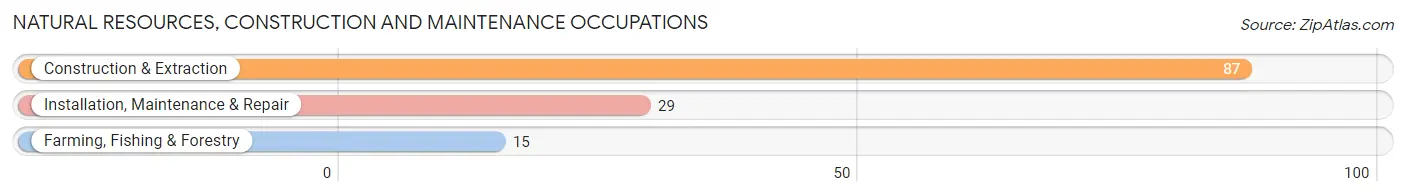
Natural Resources, Construction and Maintenance Occupations by Sex
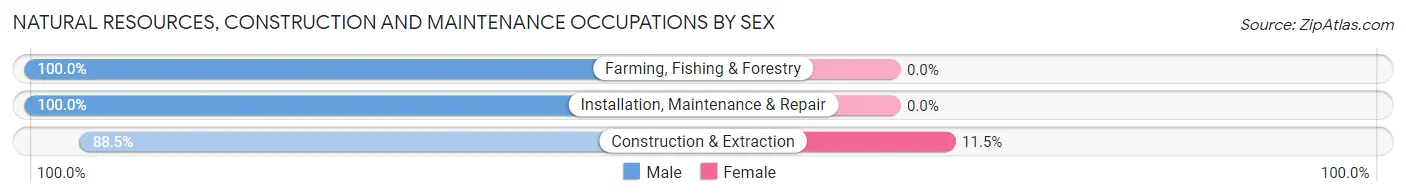
| Occupation | Male | Female |
| Farming, Fishing & Forestry | 15 (100.0%) | 0 (0.0%) |
| Construction & Extraction | 77 (88.5%) | 10 (11.5%) |
| Installation, Maintenance & Repair | 29 (100.0%) | 0 (0.0%) |
| Total (Category) | 121 (92.4%) | 10 (7.6%) |
| Total (Overall) | 316 (56.0%) | 248 (44.0%) |
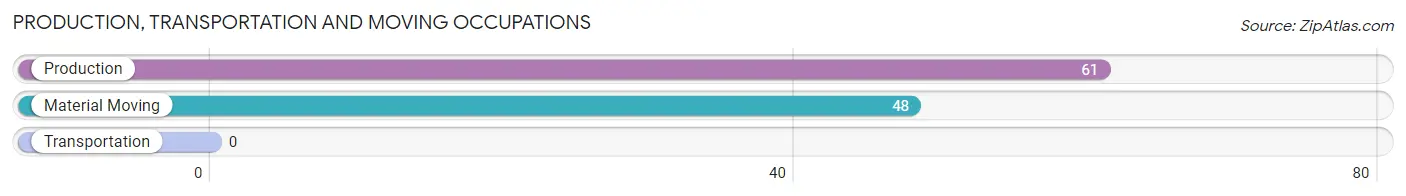
Production, Transportation and Moving Occupations
The most common Production, Transportation and Moving occupations in Robbins are Production (61 | 10.8%), and Material Moving (48 | 8.5%).
Production, Transportation and Moving Occupations by Sex
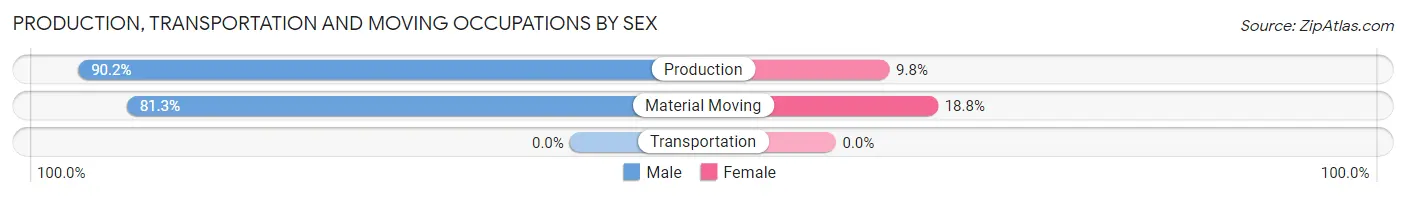
| Occupation | Male | Female |
| Production | 55 (90.2%) | 6 (9.8%) |
| Transportation | 0 (0.0%) | 0 (0.0%) |
| Material Moving | 39 (81.2%) | 9 (18.8%) |
| Total (Category) | 94 (86.2%) | 15 (13.8%) |
| Total (Overall) | 316 (56.0%) | 248 (44.0%) |
Employment Industries by Sex in Robbins
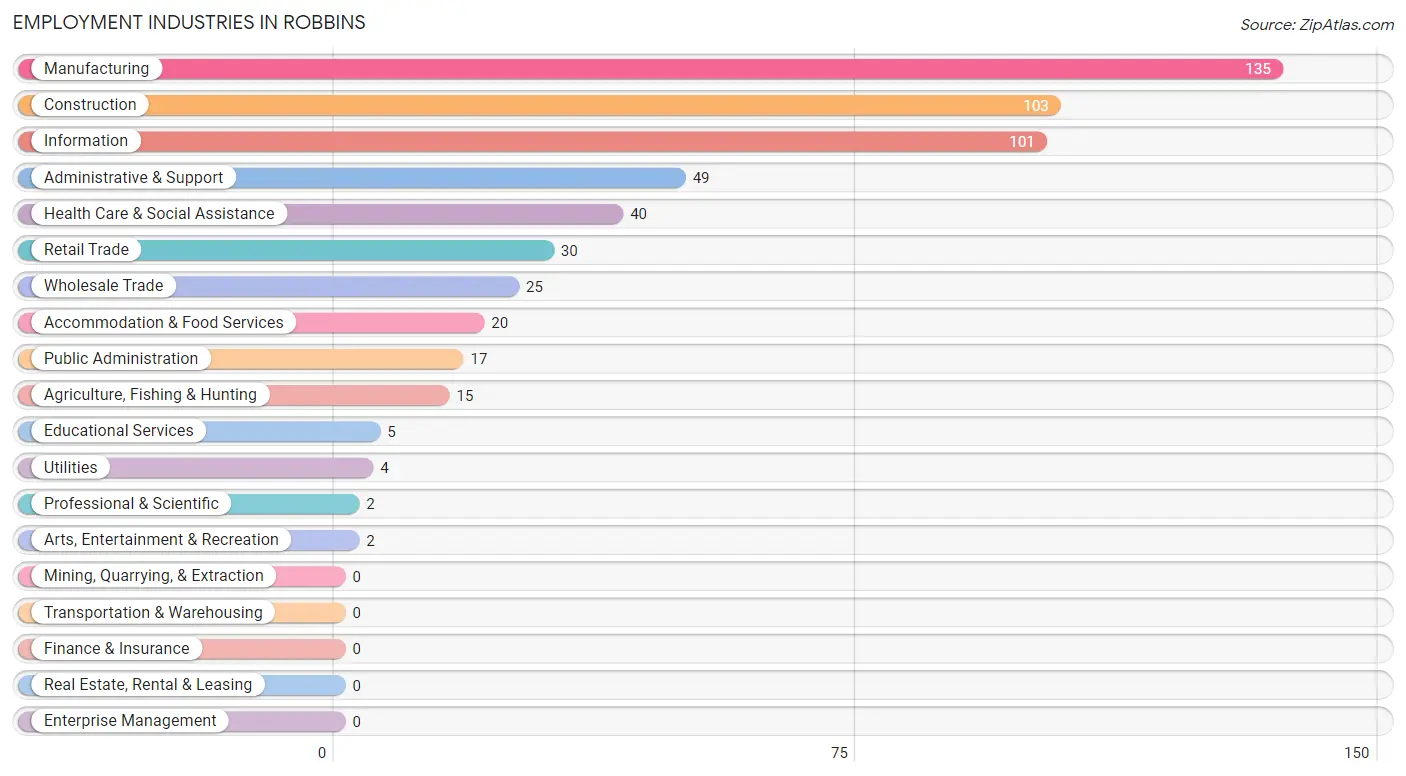
Employment Industries in Robbins
The major employment industries in Robbins include Manufacturing (135 | 23.9%), Construction (103 | 18.3%), Information (101 | 17.9%), Administrative & Support (49 | 8.7%), and Health Care & Social Assistance (40 | 7.1%).
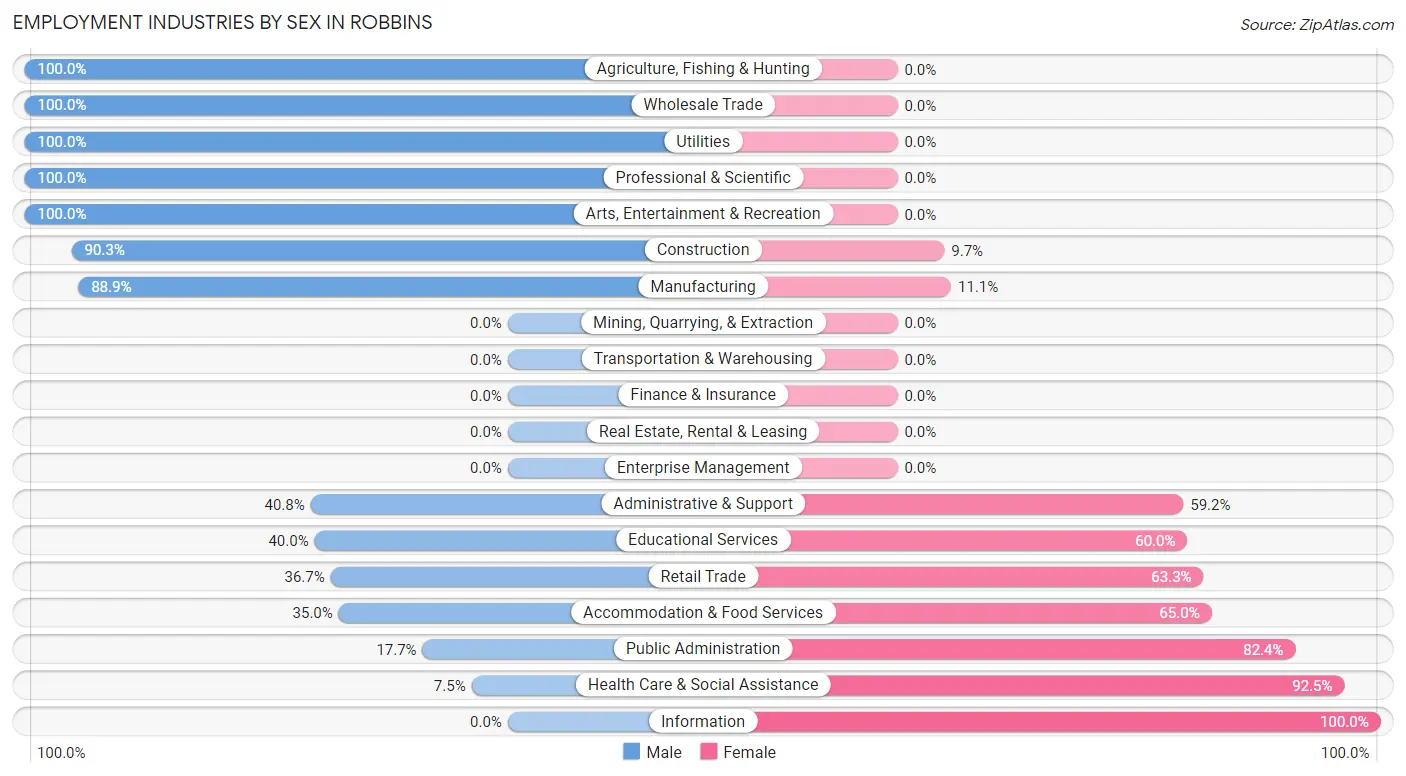
Employment Industries by Sex in Robbins
The Robbins industries that see more men than women are Agriculture, Fishing & Hunting (100.0%), Wholesale Trade (100.0%), and Utilities (100.0%), whereas the industries that tend to have a higher number of women are Information (100.0%), Health Care & Social Assistance (92.5%), and Public Administration (82.4%).
| Industry | Male | Female |
| Agriculture, Fishing & Hunting | 15 (100.0%) | 0 (0.0%) |
| Mining, Quarrying, & Extraction | 0 (0.0%) | 0 (0.0%) |
| Construction | 93 (90.3%) | 10 (9.7%) |
| Manufacturing | 120 (88.9%) | 15 (11.1%) |
| Wholesale Trade | 25 (100.0%) | 0 (0.0%) |
| Retail Trade | 11 (36.7%) | 19 (63.3%) |
| Transportation & Warehousing | 0 (0.0%) | 0 (0.0%) |
| Utilities | 4 (100.0%) | 0 (0.0%) |
| Information | 0 (0.0%) | 101 (100.0%) |
| Finance & Insurance | 0 (0.0%) | 0 (0.0%) |
| Real Estate, Rental & Leasing | 0 (0.0%) | 0 (0.0%) |
| Professional & Scientific | 2 (100.0%) | 0 (0.0%) |
| Enterprise Management | 0 (0.0%) | 0 (0.0%) |
| Administrative & Support | 20 (40.8%) | 29 (59.2%) |
| Educational Services | 2 (40.0%) | 3 (60.0%) |
| Health Care & Social Assistance | 3 (7.5%) | 37 (92.5%) |
| Arts, Entertainment & Recreation | 2 (100.0%) | 0 (0.0%) |
| Accommodation & Food Services | 7 (35.0%) | 13 (65.0%) |
| Public Administration | 3 (17.6%) | 14 (82.4%) |
| Total | 316 (56.0%) | 248 (44.0%) |
Education in Robbins
School Enrollment in Robbins
The most common levels of schooling among the 580 students in Robbins are college / undergraduate (189 | 32.6%), elementary school (145 | 25.0%), and middle school (132 | 22.8%).
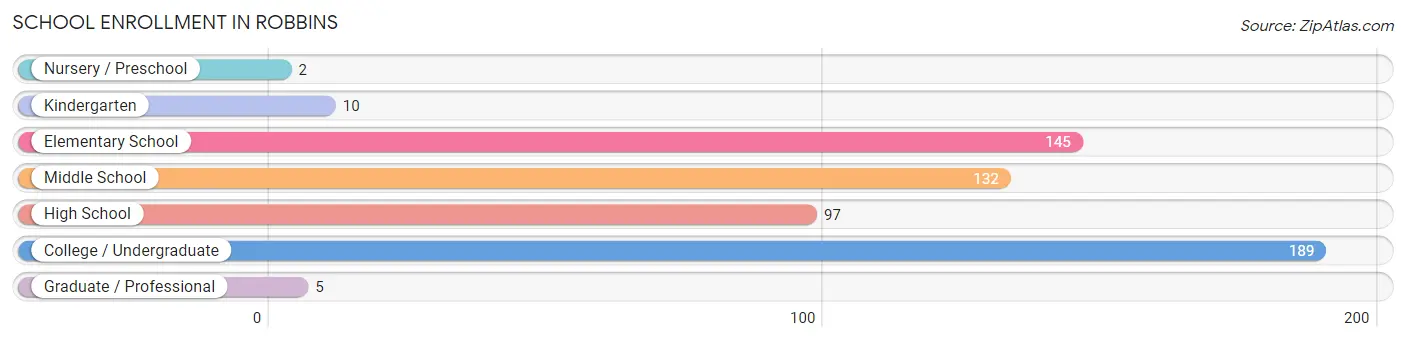
| School Level | # Students | % Students |
| Nursery / Preschool | 2 | 0.3% |
| Kindergarten | 10 | 1.7% |
| Elementary School | 145 | 25.0% |
| Middle School | 132 | 22.8% |
| High School | 97 | 16.7% |
| College / Undergraduate | 189 | 32.6% |
| Graduate / Professional | 5 | 0.9% |
| Total | 580 | 100.0% |
School Enrollment by Age by Funding Source in Robbins
Out of a total of 580 students who are enrolled in schools in Robbins, 6 (1.0%) attend a private institution, while the remaining 574 (99.0%) are enrolled in public schools. The age group of 5 to 9 year old has the highest likelihood of being enrolled in private schools, with 6 (3.8% in the age bracket) enrolled. Conversely, the age group of 10 to 14 year olds has the lowest likelihood of being enrolled in a private school, with 130 (100.0% in the age bracket) attending a public institution.
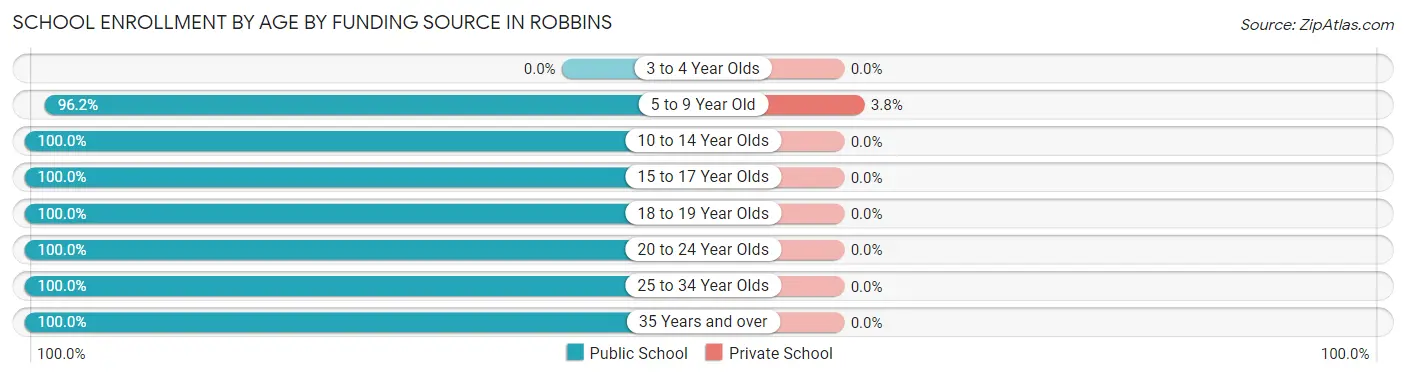
| Age Bracket | Public School | Private School |
| 3 to 4 Year Olds | 0 (0.0%) | 0 (0.0%) |
| 5 to 9 Year Old | 153 (96.2%) | 6 (3.8%) |
| 10 to 14 Year Olds | 130 (100.0%) | 0 (0.0%) |
| 15 to 17 Year Olds | 95 (100.0%) | 0 (0.0%) |
| 18 to 19 Year Olds | 71 (100.0%) | 0 (0.0%) |
| 20 to 24 Year Olds | 104 (100.0%) | 0 (0.0%) |
| 25 to 34 Year Olds | 17 (100.0%) | 0 (0.0%) |
| 35 Years and over | 4 (100.0%) | 0 (0.0%) |
| Total | 574 (99.0%) | 6 (1.0%) |
Educational Attainment by Field of Study in Robbins
Science & technology (10 | 26.3%), business (9 | 23.7%), arts & humanities (8 | 21.0%), education (7 | 18.4%), and bio, nature & agricultural (2 | 5.3%) are the most common fields of study among 38 individuals in Robbins who have obtained a bachelor's degree or higher.
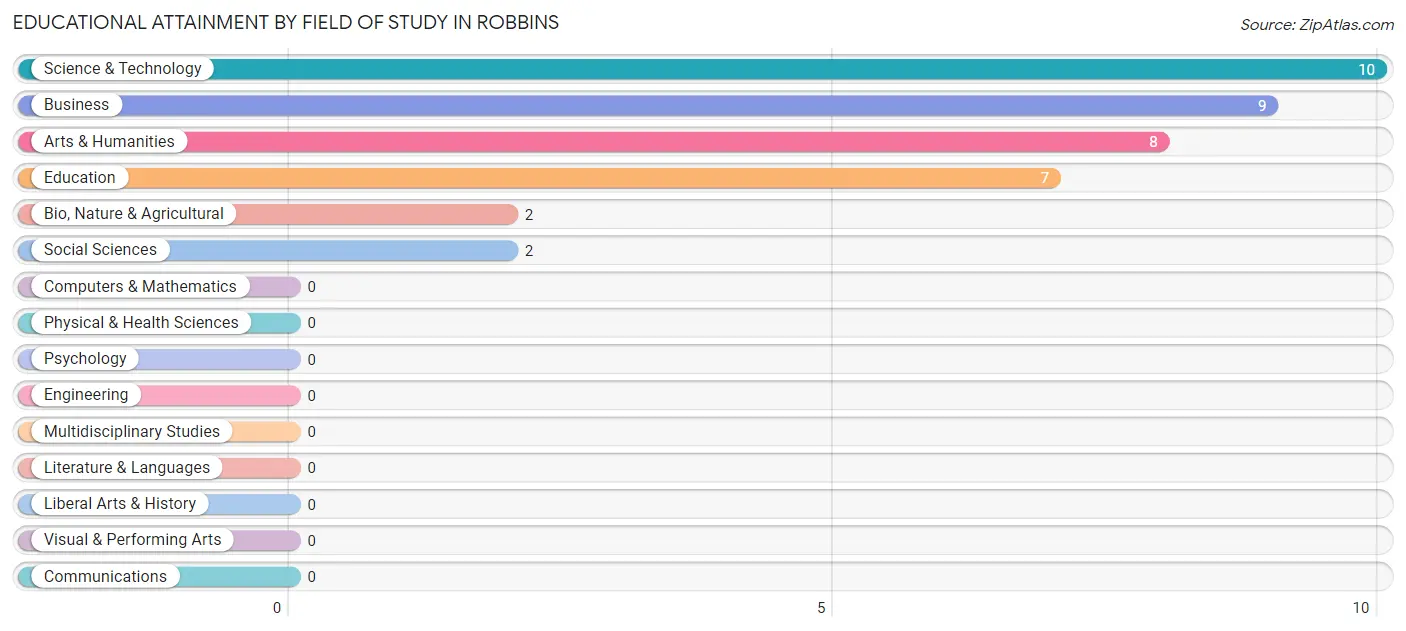
| Field of Study | # Graduates | % Graduates |
| Computers & Mathematics | 0 | 0.0% |
| Bio, Nature & Agricultural | 2 | 5.3% |
| Physical & Health Sciences | 0 | 0.0% |
| Psychology | 0 | 0.0% |
| Social Sciences | 2 | 5.3% |
| Engineering | 0 | 0.0% |
| Multidisciplinary Studies | 0 | 0.0% |
| Science & Technology | 10 | 26.3% |
| Business | 9 | 23.7% |
| Education | 7 | 18.4% |
| Literature & Languages | 0 | 0.0% |
| Liberal Arts & History | 0 | 0.0% |
| Visual & Performing Arts | 0 | 0.0% |
| Communications | 0 | 0.0% |
| Arts & Humanities | 8 | 21.0% |
| Total | 38 | 100.0% |
Transportation & Commute in Robbins
Vehicle Availability by Sex in Robbins
The most prevalent vehicle ownership categories in Robbins are males with 2 vehicles (136, accounting for 43.0%) and females with 2 vehicles (161, making up 56.0%).
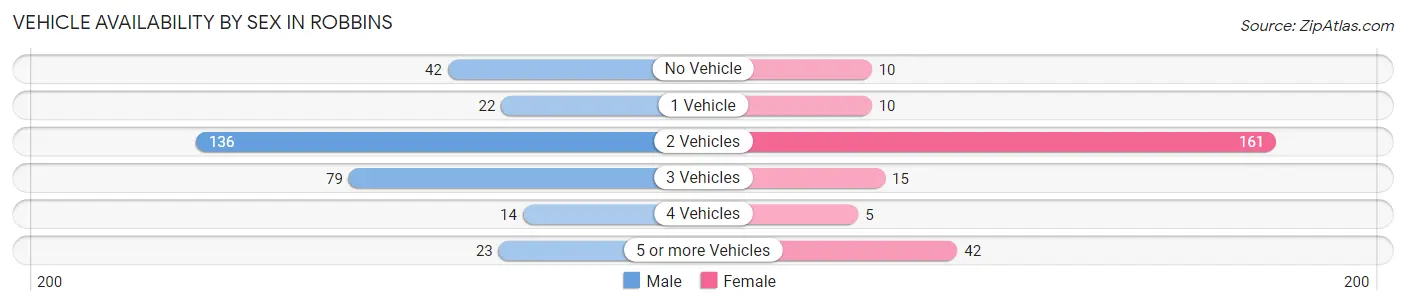
| Vehicles Available | Male | Female |
| No Vehicle | 42 (13.3%) | 10 (4.1%) |
| 1 Vehicle | 22 (7.0%) | 10 (4.1%) |
| 2 Vehicles | 136 (43.0%) | 161 (66.3%) |
| 3 Vehicles | 79 (25.0%) | 15 (6.2%) |
| 4 Vehicles | 14 (4.4%) | 5 (2.1%) |
| 5 or more Vehicles | 23 (7.3%) | 42 (17.3%) |
| Total | 316 (100.0%) | 243 (100.0%) |
Commute Time in Robbins
The most frequently occuring commute durations in Robbins are 25 to 29 minutes (127 commuters, 23.1%), 30 to 34 minutes (98 commuters, 17.8%), and 20 to 24 minutes (89 commuters, 16.2%).
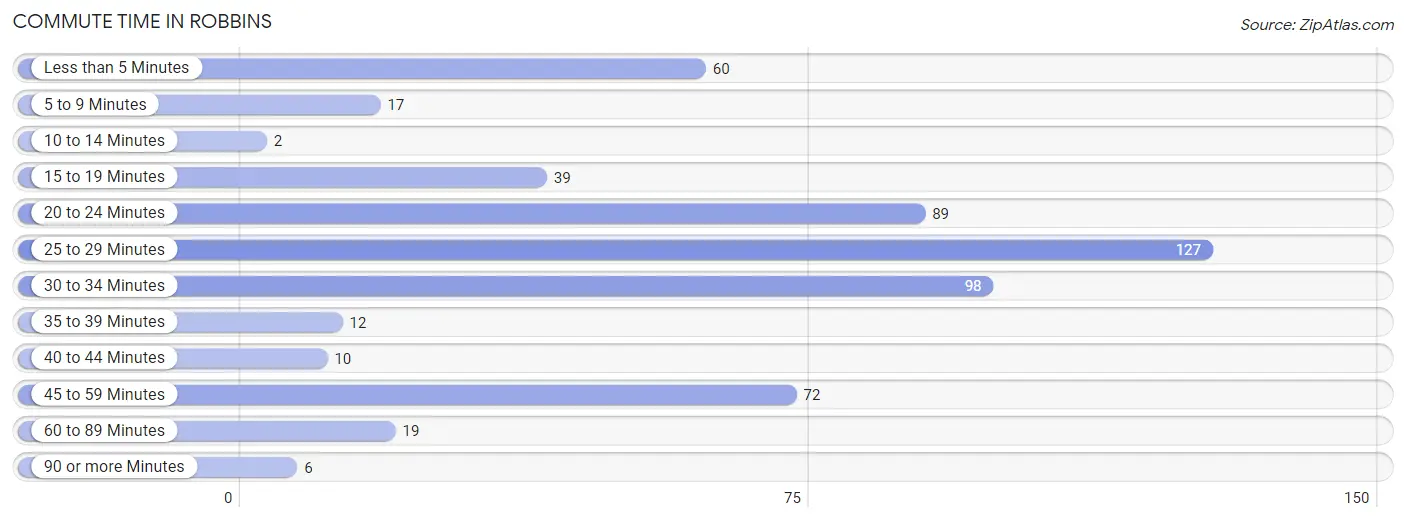
| Commute Time | # Commuters | % Commuters |
| Less than 5 Minutes | 60 | 10.9% |
| 5 to 9 Minutes | 17 | 3.1% |
| 10 to 14 Minutes | 2 | 0.4% |
| 15 to 19 Minutes | 39 | 7.1% |
| 20 to 24 Minutes | 89 | 16.2% |
| 25 to 29 Minutes | 127 | 23.1% |
| 30 to 34 Minutes | 98 | 17.8% |
| 35 to 39 Minutes | 12 | 2.2% |
| 40 to 44 Minutes | 10 | 1.8% |
| 45 to 59 Minutes | 72 | 13.1% |
| 60 to 89 Minutes | 19 | 3.5% |
| 90 or more Minutes | 6 | 1.1% |
Commute Time by Sex in Robbins
The most common commute times in Robbins are 20 to 24 minutes (64 commuters, 20.8%) for males and 25 to 29 minutes (117 commuters, 48.1%) for females.
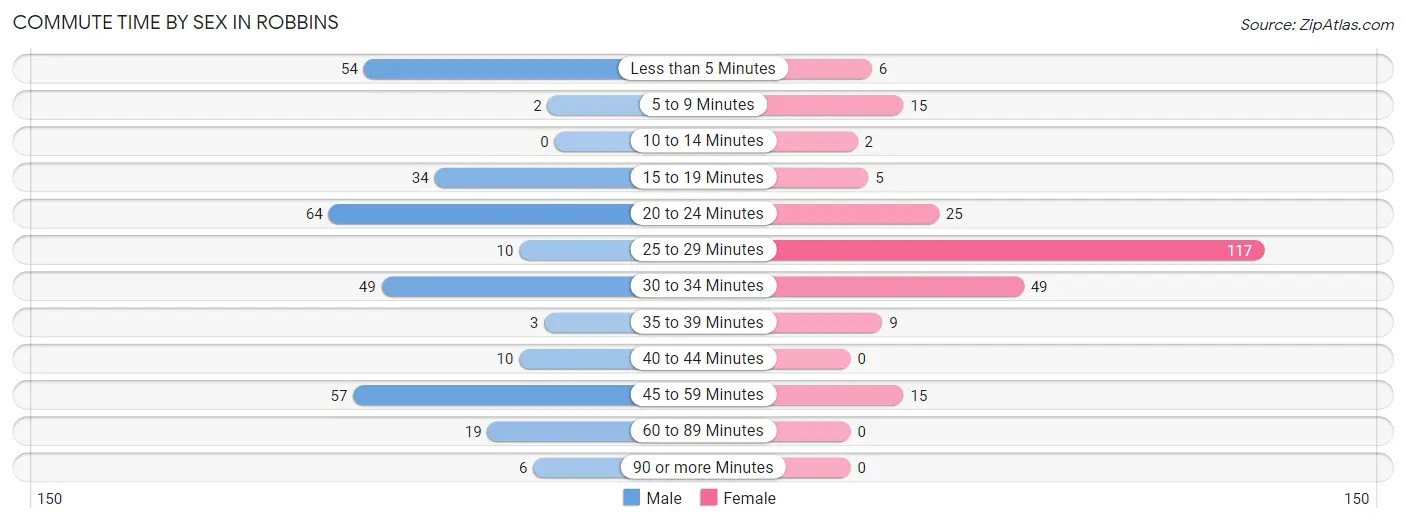
| Commute Time | Male | Female |
| Less than 5 Minutes | 54 (17.5%) | 6 (2.5%) |
| 5 to 9 Minutes | 2 (0.6%) | 15 (6.2%) |
| 10 to 14 Minutes | 0 (0.0%) | 2 (0.8%) |
| 15 to 19 Minutes | 34 (11.0%) | 5 (2.1%) |
| 20 to 24 Minutes | 64 (20.8%) | 25 (10.3%) |
| 25 to 29 Minutes | 10 (3.3%) | 117 (48.1%) |
| 30 to 34 Minutes | 49 (15.9%) | 49 (20.2%) |
| 35 to 39 Minutes | 3 (1.0%) | 9 (3.7%) |
| 40 to 44 Minutes | 10 (3.3%) | 0 (0.0%) |
| 45 to 59 Minutes | 57 (18.5%) | 15 (6.2%) |
| 60 to 89 Minutes | 19 (6.2%) | 0 (0.0%) |
| 90 or more Minutes | 6 (1.9%) | 0 (0.0%) |
Time of Departure to Work by Sex in Robbins
The most frequent times of departure to work in Robbins are 7:00 AM to 7:29 AM (68, 22.1%) for males and 5:30 AM to 5:59 AM (117, 48.1%) for females.
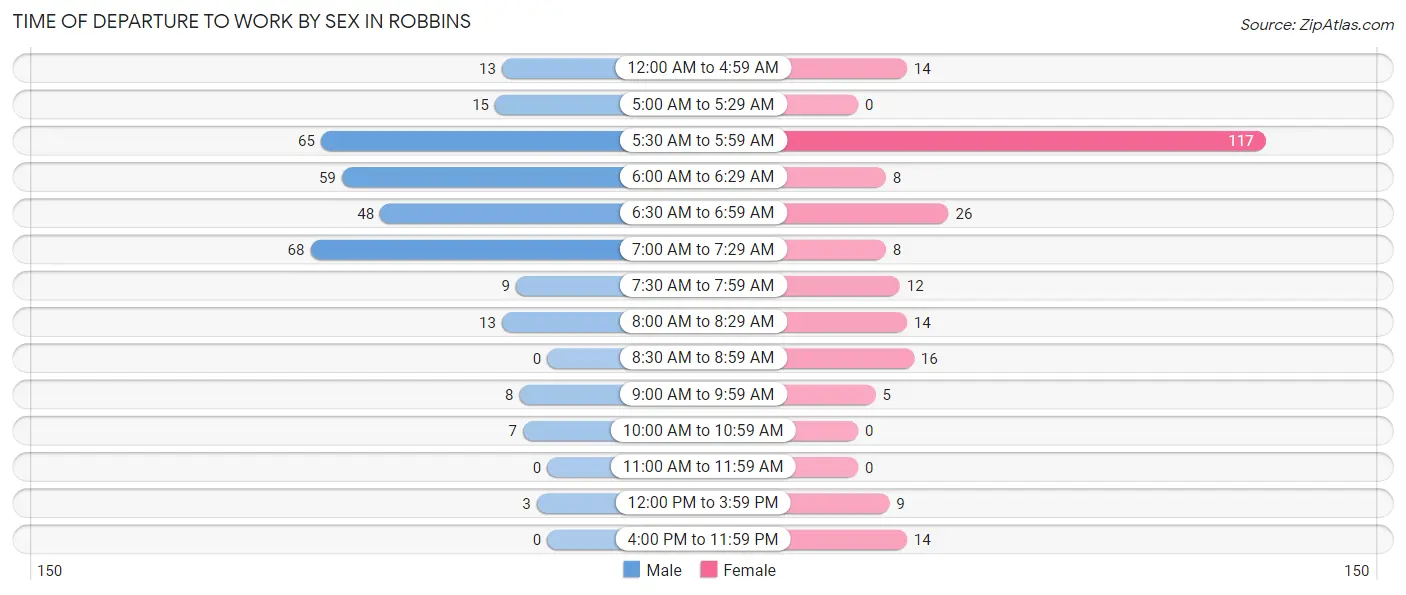
| Time of Departure | Male | Female |
| 12:00 AM to 4:59 AM | 13 (4.2%) | 14 (5.8%) |
| 5:00 AM to 5:29 AM | 15 (4.9%) | 0 (0.0%) |
| 5:30 AM to 5:59 AM | 65 (21.1%) | 117 (48.1%) |
| 6:00 AM to 6:29 AM | 59 (19.2%) | 8 (3.3%) |
| 6:30 AM to 6:59 AM | 48 (15.6%) | 26 (10.7%) |
| 7:00 AM to 7:29 AM | 68 (22.1%) | 8 (3.3%) |
| 7:30 AM to 7:59 AM | 9 (2.9%) | 12 (4.9%) |
| 8:00 AM to 8:29 AM | 13 (4.2%) | 14 (5.8%) |
| 8:30 AM to 8:59 AM | 0 (0.0%) | 16 (6.6%) |
| 9:00 AM to 9:59 AM | 8 (2.6%) | 5 (2.1%) |
| 10:00 AM to 10:59 AM | 7 (2.3%) | 0 (0.0%) |
| 11:00 AM to 11:59 AM | 0 (0.0%) | 0 (0.0%) |
| 12:00 PM to 3:59 PM | 3 (1.0%) | 9 (3.7%) |
| 4:00 PM to 11:59 PM | 0 (0.0%) | 14 (5.8%) |
| Total | 308 (100.0%) | 243 (100.0%) |
Housing Occupancy in Robbins
Occupancy by Ownership in Robbins
Of the total 548 dwellings in Robbins, owner-occupied units account for 229 (41.8%), while renter-occupied units make up 319 (58.2%).
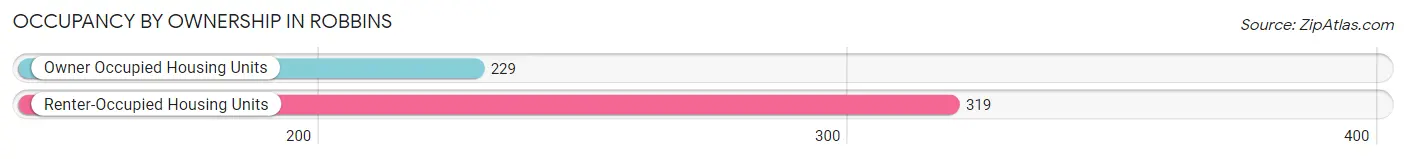
| Occupancy | # Housing Units | % Housing Units |
| Owner Occupied Housing Units | 229 | 41.8% |
| Renter-Occupied Housing Units | 319 | 58.2% |
| Total Occupied Housing Units | 548 | 100.0% |
Occupancy by Household Size in Robbins
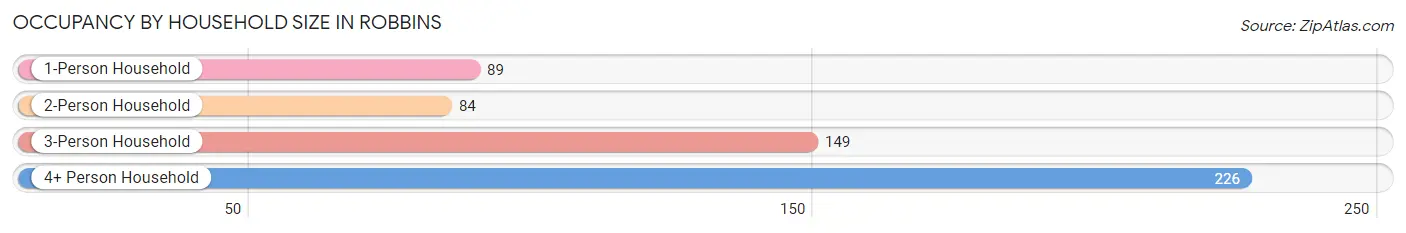
| Household Size | # Housing Units | % Housing Units |
| 1-Person Household | 89 | 16.2% |
| 2-Person Household | 84 | 15.3% |
| 3-Person Household | 149 | 27.2% |
| 4+ Person Household | 226 | 41.2% |
| Total Housing Units | 548 | 100.0% |
Occupancy by Ownership by Household Size in Robbins
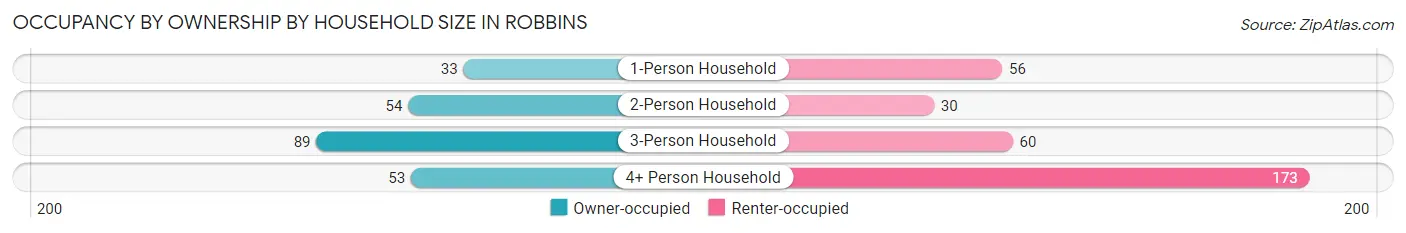
| Household Size | Owner-occupied | Renter-occupied |
| 1-Person Household | 33 (37.1%) | 56 (62.9%) |
| 2-Person Household | 54 (64.3%) | 30 (35.7%) |
| 3-Person Household | 89 (59.7%) | 60 (40.3%) |
| 4+ Person Household | 53 (23.4%) | 173 (76.5%) |
| Total Housing Units | 229 (41.8%) | 319 (58.2%) |
Occupancy by Educational Attainment in Robbins
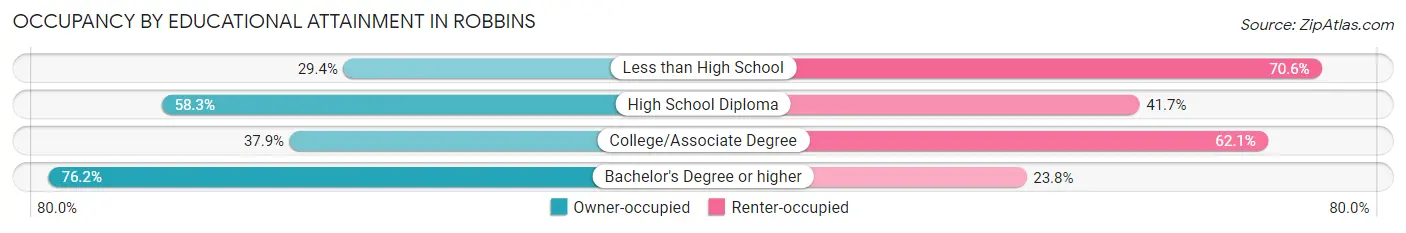
| Household Size | Owner-occupied | Renter-occupied |
| Less than High School | 52 (29.4%) | 125 (70.6%) |
| High School Diploma | 81 (58.3%) | 58 (41.7%) |
| College/Associate Degree | 80 (37.9%) | 131 (62.1%) |
| Bachelor's Degree or higher | 16 (76.2%) | 5 (23.8%) |
Occupancy by Age of Householder in Robbins
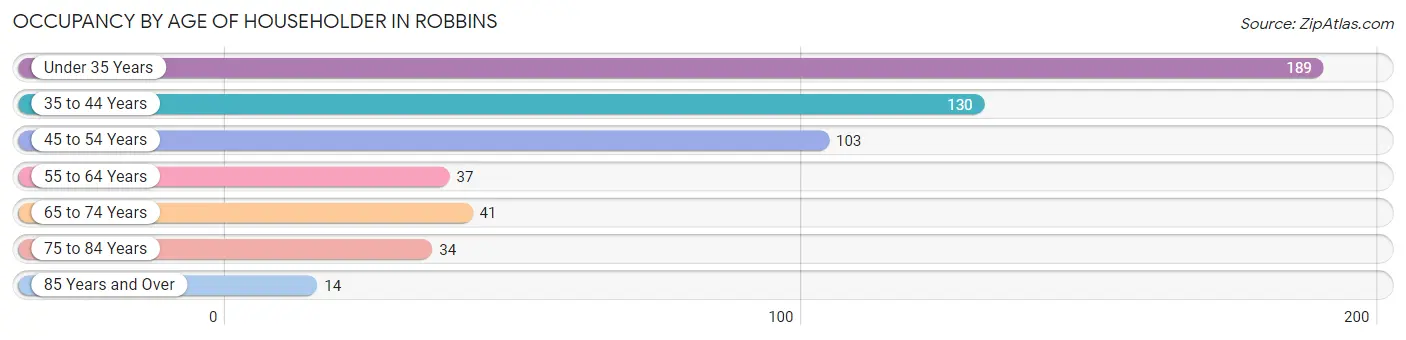
| Age Bracket | # Households | % Households |
| Under 35 Years | 189 | 34.5% |
| 35 to 44 Years | 130 | 23.7% |
| 45 to 54 Years | 103 | 18.8% |
| 55 to 64 Years | 37 | 6.8% |
| 65 to 74 Years | 41 | 7.5% |
| 75 to 84 Years | 34 | 6.2% |
| 85 Years and Over | 14 | 2.5% |
| Total | 548 | 100.0% |
Housing Finances in Robbins
Median Income by Occupancy in Robbins
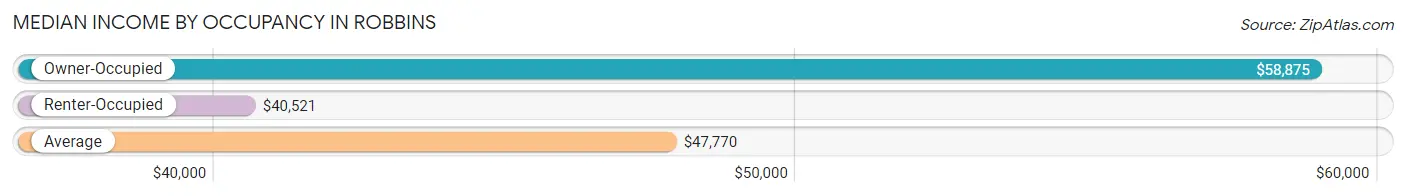
| Occupancy Type | # Households | Median Income |
| Owner-Occupied | 229 (41.8%) | $58,875 |
| Renter-Occupied | 319 (58.2%) | $40,521 |
| Average | 548 (100.0%) | $47,770 |
Occupancy by Householder Income Bracket in Robbins
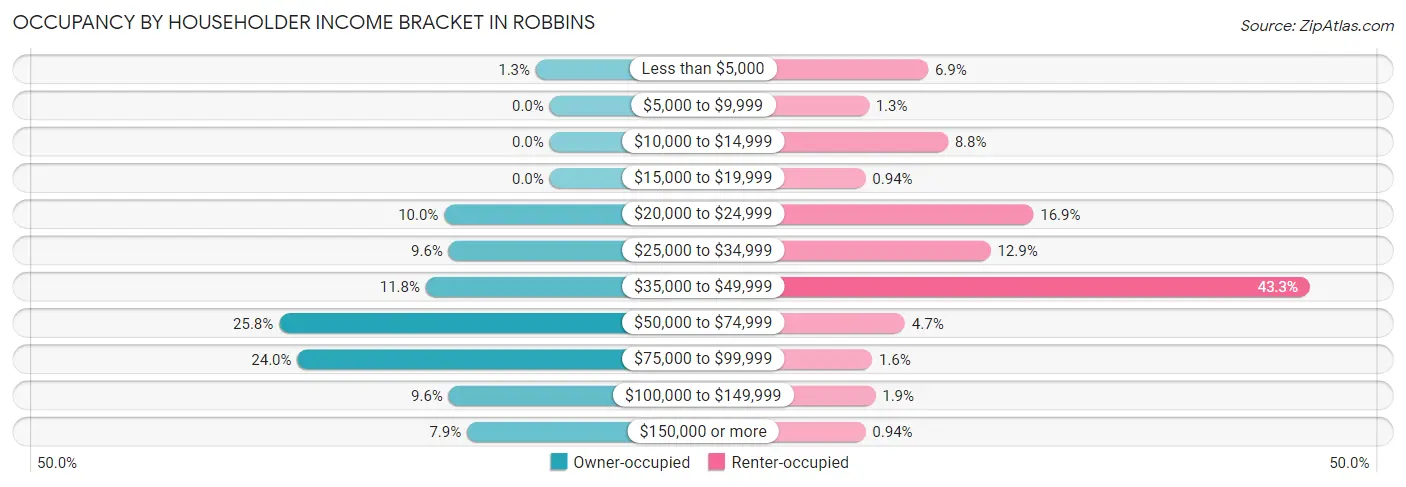
| Income Bracket | Owner-occupied | Renter-occupied |
| Less than $5,000 | 3 (1.3%) | 22 (6.9%) |
| $5,000 to $9,999 | 0 (0.0%) | 4 (1.3%) |
| $10,000 to $14,999 | 0 (0.0%) | 28 (8.8%) |
| $15,000 to $19,999 | 0 (0.0%) | 3 (0.9%) |
| $20,000 to $24,999 | 23 (10.0%) | 54 (16.9%) |
| $25,000 to $34,999 | 22 (9.6%) | 41 (12.9%) |
| $35,000 to $49,999 | 27 (11.8%) | 138 (43.3%) |
| $50,000 to $74,999 | 59 (25.8%) | 15 (4.7%) |
| $75,000 to $99,999 | 55 (24.0%) | 5 (1.6%) |
| $100,000 to $149,999 | 22 (9.6%) | 6 (1.9%) |
| $150,000 or more | 18 (7.9%) | 3 (0.9%) |
| Total | 229 (100.0%) | 319 (100.0%) |
Monthly Housing Cost Tiers in Robbins
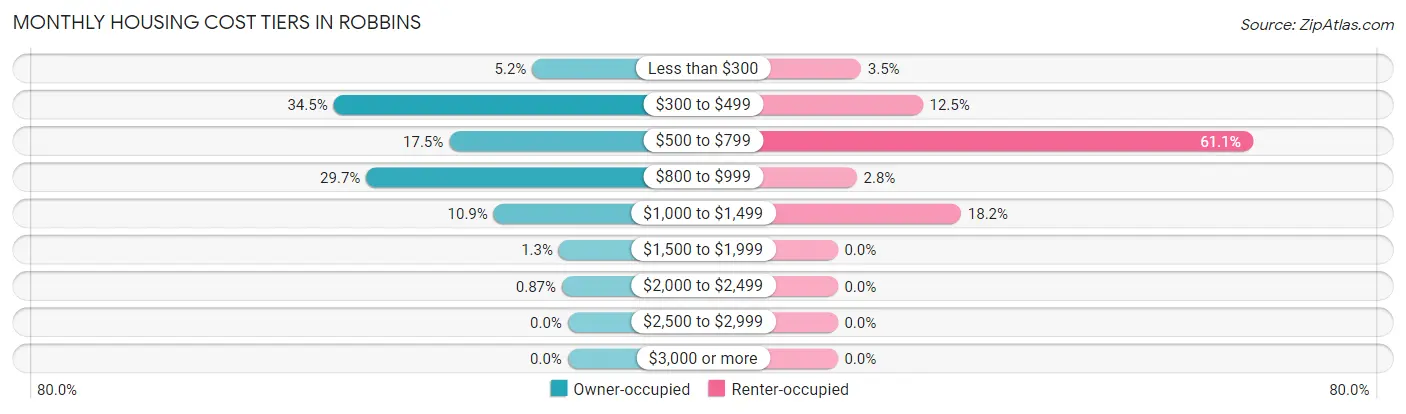
| Monthly Cost | Owner-occupied | Renter-occupied |
| Less than $300 | 12 (5.2%) | 11 (3.5%) |
| $300 to $499 | 79 (34.5%) | 40 (12.5%) |
| $500 to $799 | 40 (17.5%) | 195 (61.1%) |
| $800 to $999 | 68 (29.7%) | 9 (2.8%) |
| $1,000 to $1,499 | 25 (10.9%) | 58 (18.2%) |
| $1,500 to $1,999 | 3 (1.3%) | 0 (0.0%) |
| $2,000 to $2,499 | 2 (0.9%) | 0 (0.0%) |
| $2,500 to $2,999 | 0 (0.0%) | 0 (0.0%) |
| $3,000 or more | 0 (0.0%) | 0 (0.0%) |
| Total | 229 (100.0%) | 319 (100.0%) |
Physical Housing Characteristics in Robbins
Housing Structures in Robbins
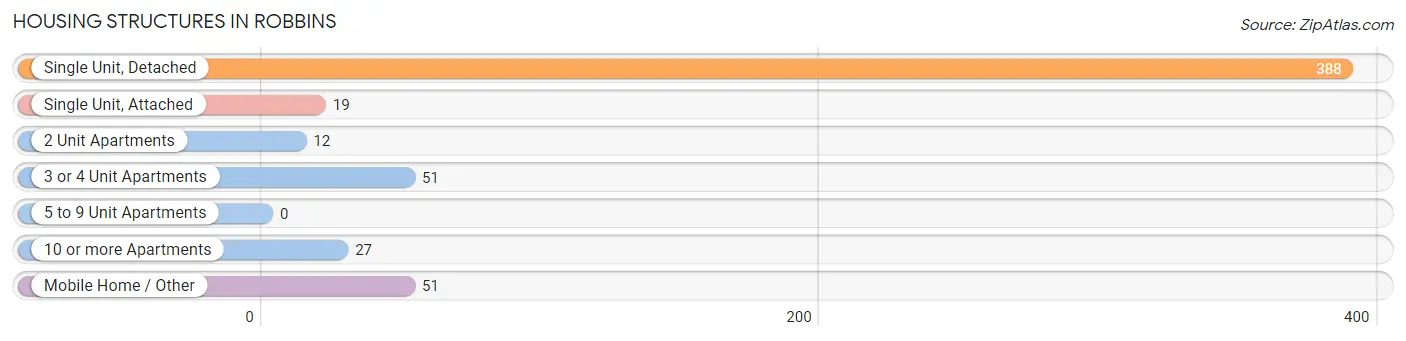
| Structure Type | # Housing Units | % Housing Units |
| Single Unit, Detached | 388 | 70.8% |
| Single Unit, Attached | 19 | 3.5% |
| 2 Unit Apartments | 12 | 2.2% |
| 3 or 4 Unit Apartments | 51 | 9.3% |
| 5 to 9 Unit Apartments | 0 | 0.0% |
| 10 or more Apartments | 27 | 4.9% |
| Mobile Home / Other | 51 | 9.3% |
| Total | 548 | 100.0% |
Housing Structures by Occupancy in Robbins
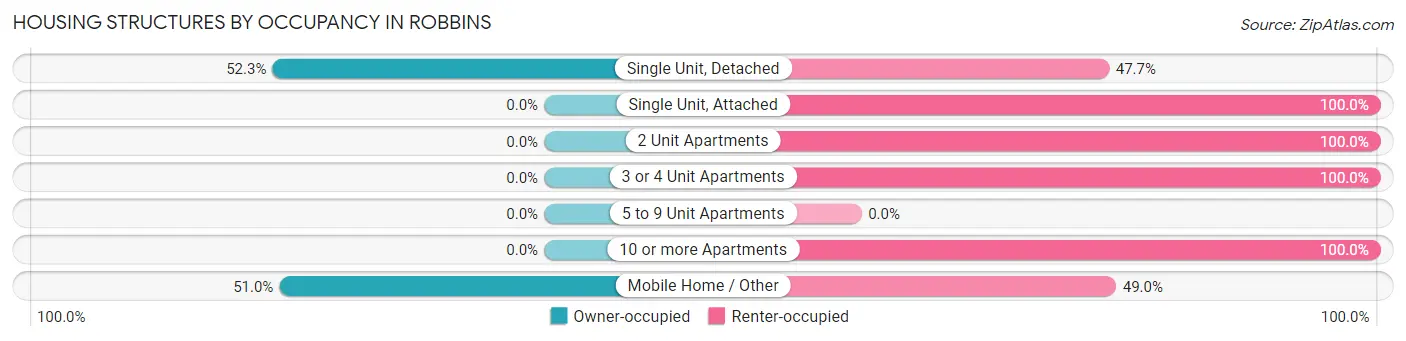
| Structure Type | Owner-occupied | Renter-occupied |
| Single Unit, Detached | 203 (52.3%) | 185 (47.7%) |
| Single Unit, Attached | 0 (0.0%) | 19 (100.0%) |
| 2 Unit Apartments | 0 (0.0%) | 12 (100.0%) |
| 3 or 4 Unit Apartments | 0 (0.0%) | 51 (100.0%) |
| 5 to 9 Unit Apartments | 0 (0.0%) | 0 (0.0%) |
| 10 or more Apartments | 0 (0.0%) | 27 (100.0%) |
| Mobile Home / Other | 26 (51.0%) | 25 (49.0%) |
| Total | 229 (41.8%) | 319 (58.2%) |
Housing Structures by Number of Rooms in Robbins
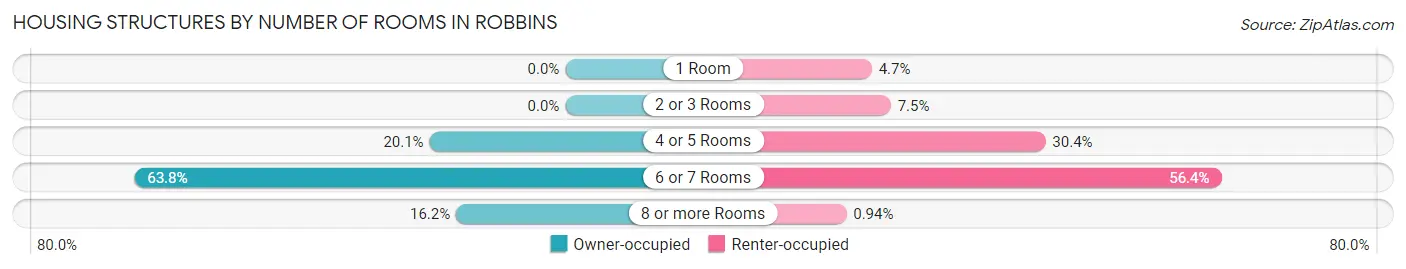
| Number of Rooms | Owner-occupied | Renter-occupied |
| 1 Room | 0 (0.0%) | 15 (4.7%) |
| 2 or 3 Rooms | 0 (0.0%) | 24 (7.5%) |
| 4 or 5 Rooms | 46 (20.1%) | 97 (30.4%) |
| 6 or 7 Rooms | 146 (63.8%) | 180 (56.4%) |
| 8 or more Rooms | 37 (16.2%) | 3 (0.9%) |
| Total | 229 (100.0%) | 319 (100.0%) |
Housing Structure by Heating Type in Robbins
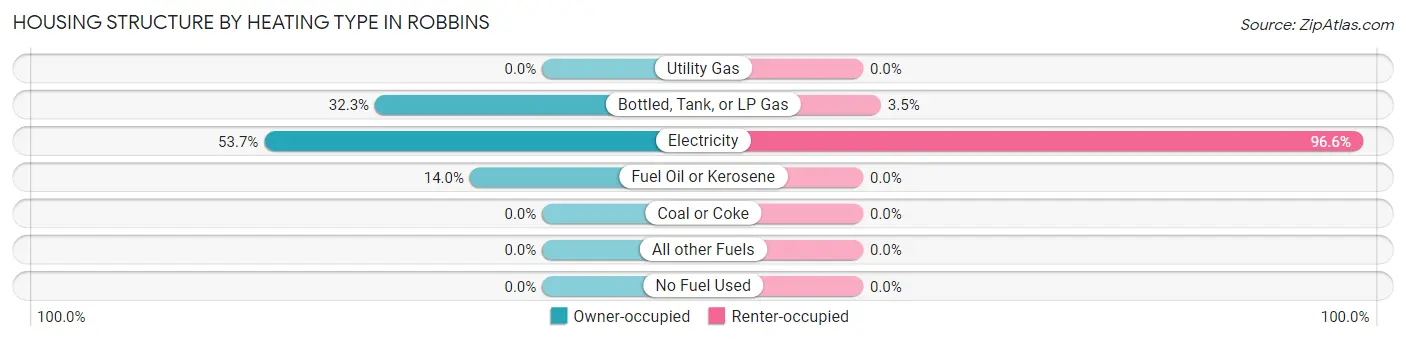
| Heating Type | Owner-occupied | Renter-occupied |
| Utility Gas | 0 (0.0%) | 0 (0.0%) |
| Bottled, Tank, or LP Gas | 74 (32.3%) | 11 (3.5%) |
| Electricity | 123 (53.7%) | 308 (96.6%) |
| Fuel Oil or Kerosene | 32 (14.0%) | 0 (0.0%) |
| Coal or Coke | 0 (0.0%) | 0 (0.0%) |
| All other Fuels | 0 (0.0%) | 0 (0.0%) |
| No Fuel Used | 0 (0.0%) | 0 (0.0%) |
| Total | 229 (100.0%) | 319 (100.0%) |
Household Vehicle Usage in Robbins
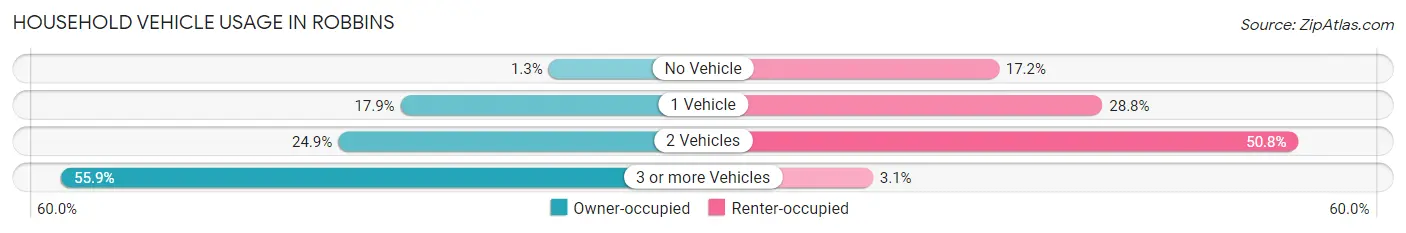
| Vehicles per Household | Owner-occupied | Renter-occupied |
| No Vehicle | 3 (1.3%) | 55 (17.2%) |
| 1 Vehicle | 41 (17.9%) | 92 (28.8%) |
| 2 Vehicles | 57 (24.9%) | 162 (50.8%) |
| 3 or more Vehicles | 128 (55.9%) | 10 (3.1%) |
| Total | 229 (100.0%) | 319 (100.0%) |
Real Estate & Mortgages in Robbins
Real Estate and Mortgage Overview in Robbins
| Characteristic | Without Mortgage | With Mortgage |
| Housing Units | 139 | 90 |
| Median Property Value | $87,800 | $99,100 |
| Median Household Income | $76,125 | $16 |
| Monthly Housing Costs | $459 | $0 |
| Real Estate Taxes | $686 | $0 |
Property Value by Mortgage Status in Robbins
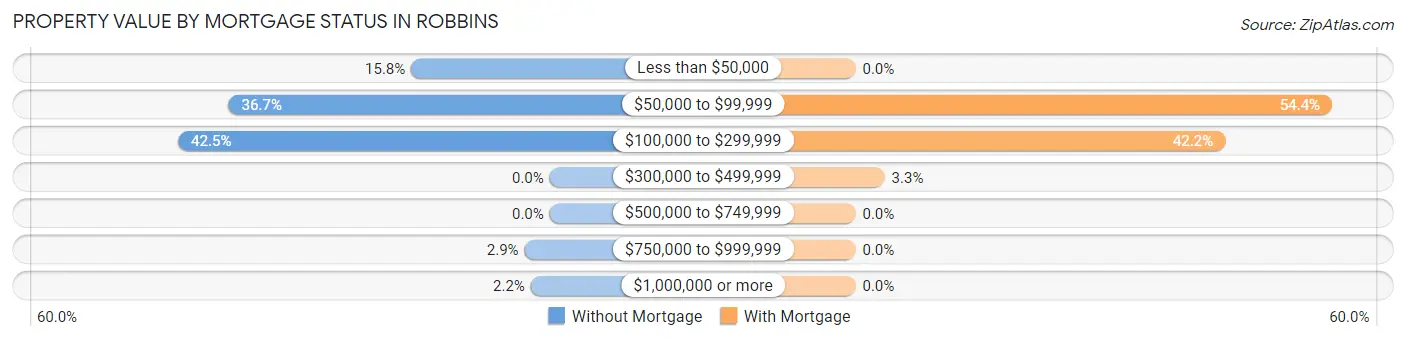
| Property Value | Without Mortgage | With Mortgage |
| Less than $50,000 | 22 (15.8%) | 0 (0.0%) |
| $50,000 to $99,999 | 51 (36.7%) | 49 (54.4%) |
| $100,000 to $299,999 | 59 (42.4%) | 38 (42.2%) |
| $300,000 to $499,999 | 0 (0.0%) | 3 (3.3%) |
| $500,000 to $749,999 | 0 (0.0%) | 0 (0.0%) |
| $750,000 to $999,999 | 4 (2.9%) | 0 (0.0%) |
| $1,000,000 or more | 3 (2.2%) | 0 (0.0%) |
| Total | 139 (100.0%) | 90 (100.0%) |
Household Income by Mortgage Status in Robbins
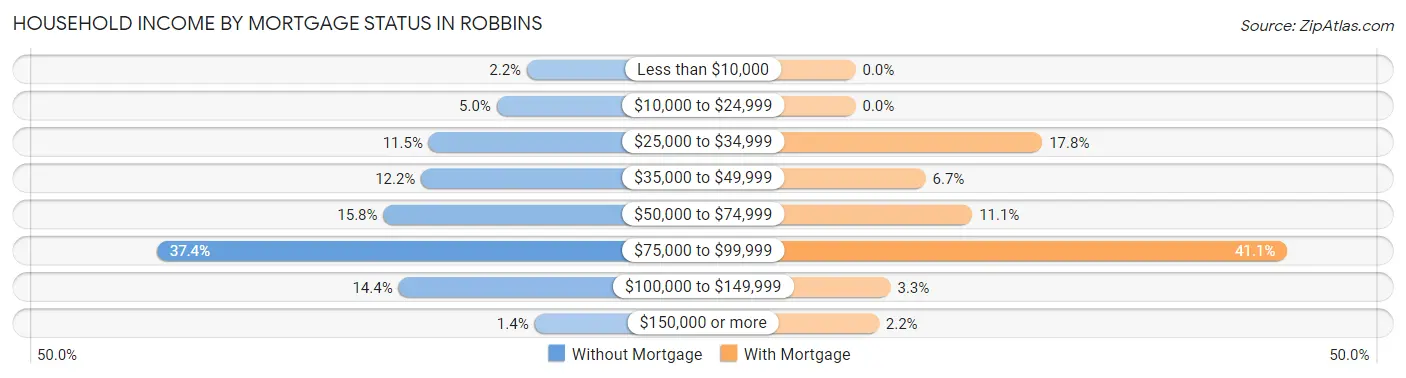
| Household Income | Without Mortgage | With Mortgage |
| Less than $10,000 | 3 (2.2%) | 0 (0.0%) |
| $10,000 to $24,999 | 7 (5.0%) | 0 (0.0%) |
| $25,000 to $34,999 | 16 (11.5%) | 16 (17.8%) |
| $35,000 to $49,999 | 17 (12.2%) | 6 (6.7%) |
| $50,000 to $74,999 | 22 (15.8%) | 10 (11.1%) |
| $75,000 to $99,999 | 52 (37.4%) | 37 (41.1%) |
| $100,000 to $149,999 | 20 (14.4%) | 3 (3.3%) |
| $150,000 or more | 2 (1.4%) | 2 (2.2%) |
| Total | 139 (100.0%) | 90 (100.0%) |
Property Value to Household Income Ratio in Robbins
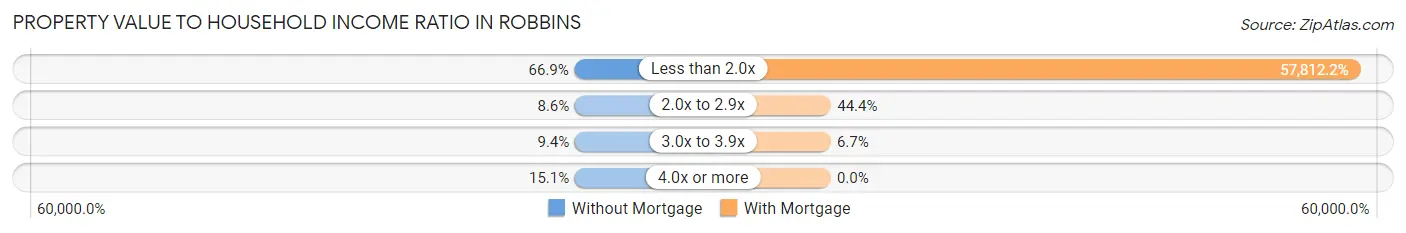
| Value-to-Income Ratio | Without Mortgage | With Mortgage |
| Less than 2.0x | 93 (66.9%) | 52,031 (57,812.2%) |
| 2.0x to 2.9x | 12 (8.6%) | 40 (44.4%) |
| 3.0x to 3.9x | 13 (9.3%) | 6 (6.7%) |
| 4.0x or more | 21 (15.1%) | 0 (0.0%) |
| Total | 139 (100.0%) | 90 (100.0%) |
Real Estate Taxes by Mortgage Status in Robbins
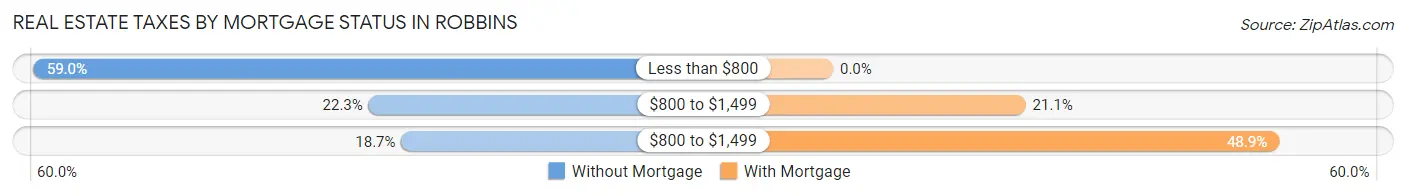
| Property Taxes | Without Mortgage | With Mortgage |
| Less than $800 | 82 (59.0%) | 0 (0.0%) |
| $800 to $1,499 | 31 (22.3%) | 19 (21.1%) |
| $800 to $1,499 | 26 (18.7%) | 44 (48.9%) |
| Total | 139 (100.0%) | 90 (100.0%) |
Health & Disability in Robbins
Health Insurance Coverage by Age in Robbins
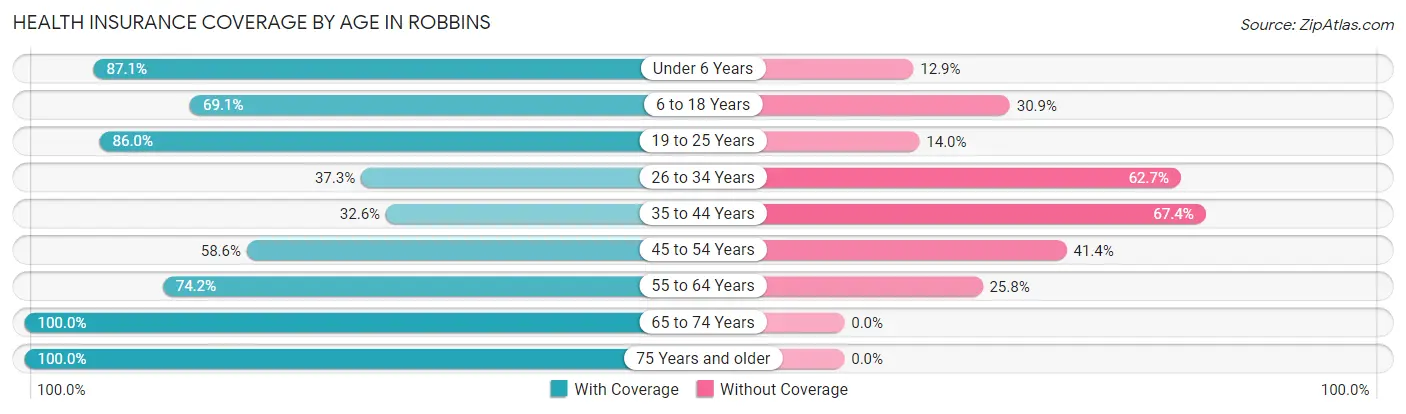
| Age Bracket | With Coverage | Without Coverage |
| Under 6 Years | 142 (87.1%) | 21 (12.9%) |
| 6 to 18 Years | 309 (69.1%) | 138 (30.9%) |
| 19 to 25 Years | 172 (86.0%) | 28 (14.0%) |
| 26 to 34 Years | 41 (37.3%) | 69 (62.7%) |
| 35 to 44 Years | 61 (32.6%) | 126 (67.4%) |
| 45 to 54 Years | 106 (58.6%) | 75 (41.4%) |
| 55 to 64 Years | 72 (74.2%) | 25 (25.8%) |
| 65 to 74 Years | 63 (100.0%) | 0 (0.0%) |
| 75 Years and older | 63 (100.0%) | 0 (0.0%) |
| Total | 1,029 (68.1%) | 482 (31.9%) |
Health Insurance Coverage by Citizenship Status in Robbins
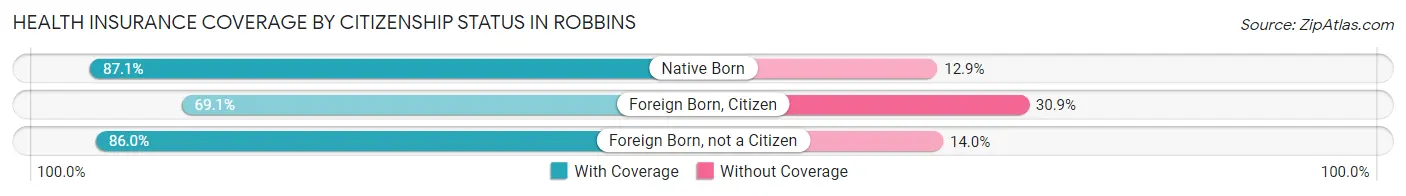
| Citizenship Status | With Coverage | Without Coverage |
| Native Born | 142 (87.1%) | 21 (12.9%) |
| Foreign Born, Citizen | 309 (69.1%) | 138 (30.9%) |
| Foreign Born, not a Citizen | 172 (86.0%) | 28 (14.0%) |
Health Insurance Coverage by Household Income in Robbins
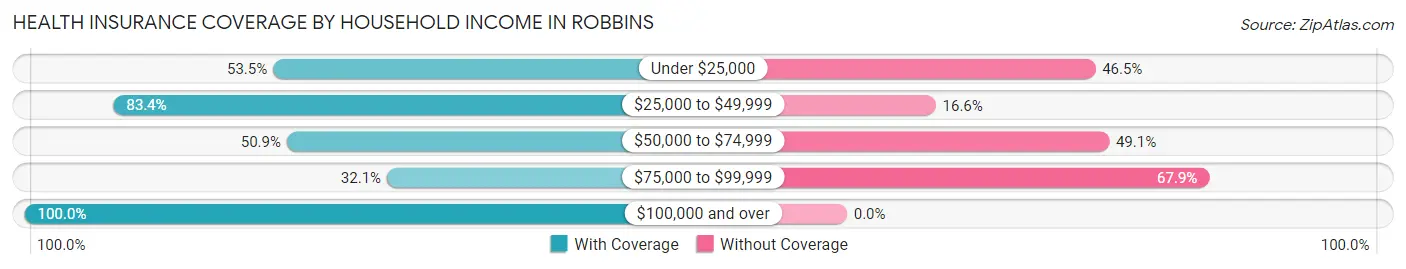
| Household Income | With Coverage | Without Coverage |
| Under $25,000 | 170 (53.5%) | 148 (46.5%) |
| $25,000 to $49,999 | 551 (83.4%) | 110 (16.6%) |
| $50,000 to $74,999 | 116 (50.9%) | 112 (49.1%) |
| $75,000 to $99,999 | 53 (32.1%) | 112 (67.9%) |
| $100,000 and over | 129 (100.0%) | 0 (0.0%) |
Public vs Private Health Insurance Coverage by Age in Robbins
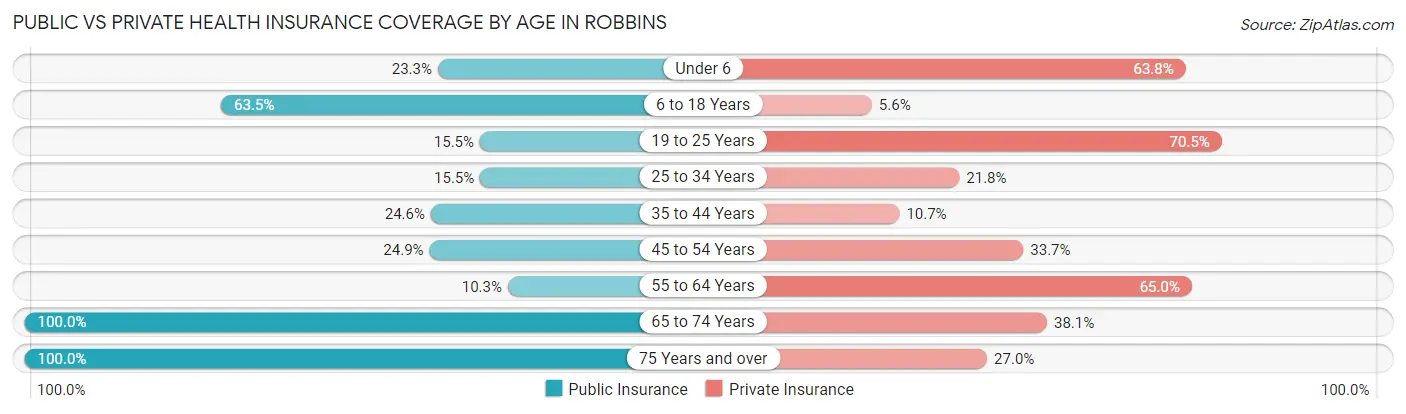
| Age Bracket | Public Insurance | Private Insurance |
| Under 6 | 38 (23.3%) | 104 (63.8%) |
| 6 to 18 Years | 284 (63.5%) | 25 (5.6%) |
| 19 to 25 Years | 31 (15.5%) | 141 (70.5%) |
| 25 to 34 Years | 17 (15.4%) | 24 (21.8%) |
| 35 to 44 Years | 46 (24.6%) | 20 (10.7%) |
| 45 to 54 Years | 45 (24.9%) | 61 (33.7%) |
| 55 to 64 Years | 10 (10.3%) | 63 (64.9%) |
| 65 to 74 Years | 63 (100.0%) | 24 (38.1%) |
| 75 Years and over | 63 (100.0%) | 17 (27.0%) |
| Total | 597 (39.5%) | 479 (31.7%) |
Disability Status by Sex by Age in Robbins
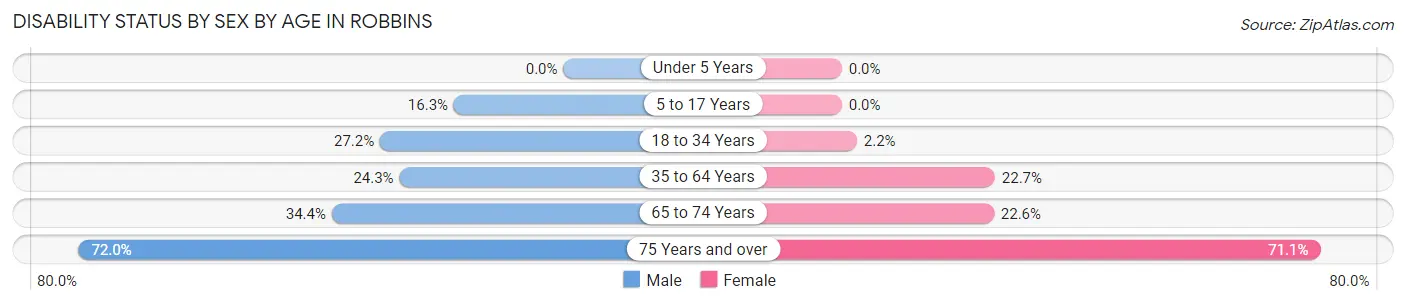
| Age Bracket | Male | Female |
| Under 5 Years | 0 (0.0%) | 0 (0.0%) |
| 5 to 17 Years | 45 (16.3%) | 0 (0.0%) |
| 18 to 34 Years | 43 (27.2%) | 5 (2.2%) |
| 35 to 64 Years | 65 (24.3%) | 45 (22.7%) |
| 65 to 74 Years | 11 (34.4%) | 7 (22.6%) |
| 75 Years and over | 18 (72.0%) | 27 (71.1%) |
Disability Class by Sex by Age in Robbins
Disability Class: Hearing Difficulty
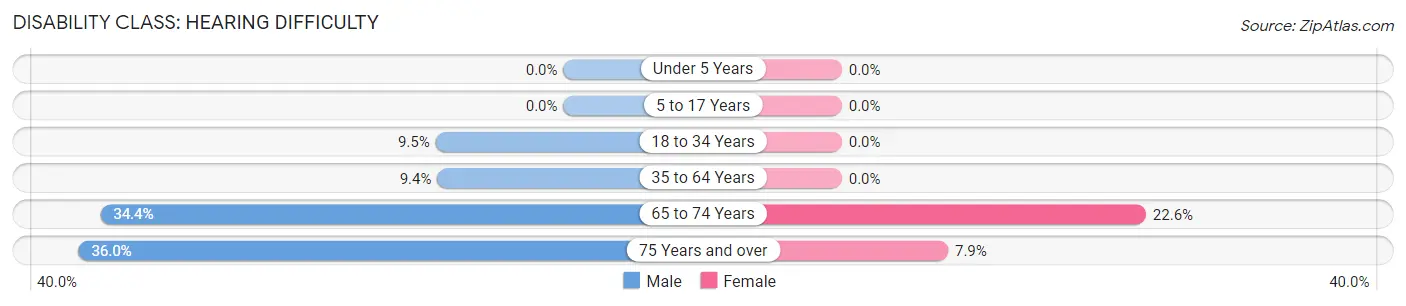
| Age Bracket | Male | Female |
| Under 5 Years | 0 (0.0%) | 0 (0.0%) |
| 5 to 17 Years | 0 (0.0%) | 0 (0.0%) |
| 18 to 34 Years | 15 (9.5%) | 0 (0.0%) |
| 35 to 64 Years | 25 (9.4%) | 0 (0.0%) |
| 65 to 74 Years | 11 (34.4%) | 7 (22.6%) |
| 75 Years and over | 9 (36.0%) | 3 (7.9%) |
Disability Class: Vision Difficulty
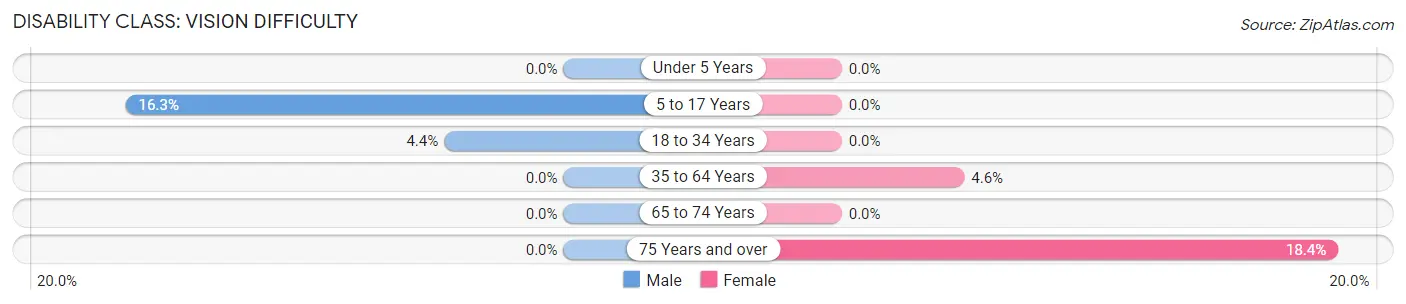
| Age Bracket | Male | Female |
| Under 5 Years | 0 (0.0%) | 0 (0.0%) |
| 5 to 17 Years | 45 (16.3%) | 0 (0.0%) |
| 18 to 34 Years | 7 (4.4%) | 0 (0.0%) |
| 35 to 64 Years | 0 (0.0%) | 9 (4.5%) |
| 65 to 74 Years | 0 (0.0%) | 0 (0.0%) |
| 75 Years and over | 0 (0.0%) | 7 (18.4%) |
Disability Class: Cognitive Difficulty
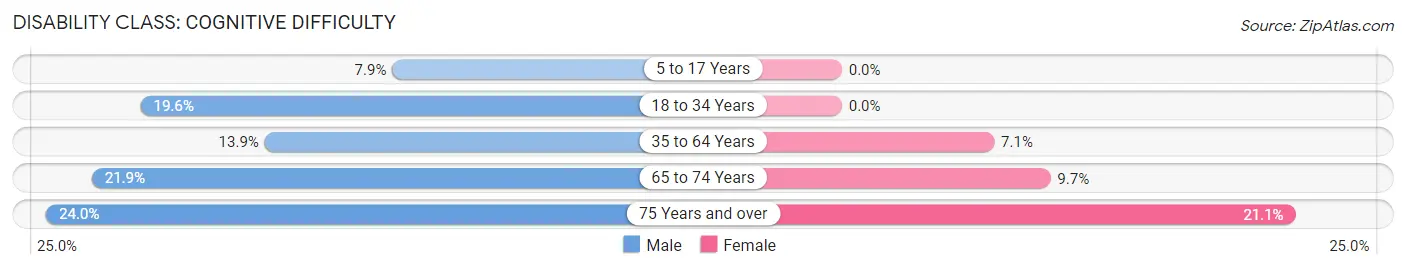
| Age Bracket | Male | Female |
| 5 to 17 Years | 22 (7.9%) | 0 (0.0%) |
| 18 to 34 Years | 31 (19.6%) | 0 (0.0%) |
| 35 to 64 Years | 37 (13.9%) | 14 (7.1%) |
| 65 to 74 Years | 7 (21.9%) | 3 (9.7%) |
| 75 Years and over | 6 (24.0%) | 8 (21.0%) |
Disability Class: Ambulatory Difficulty
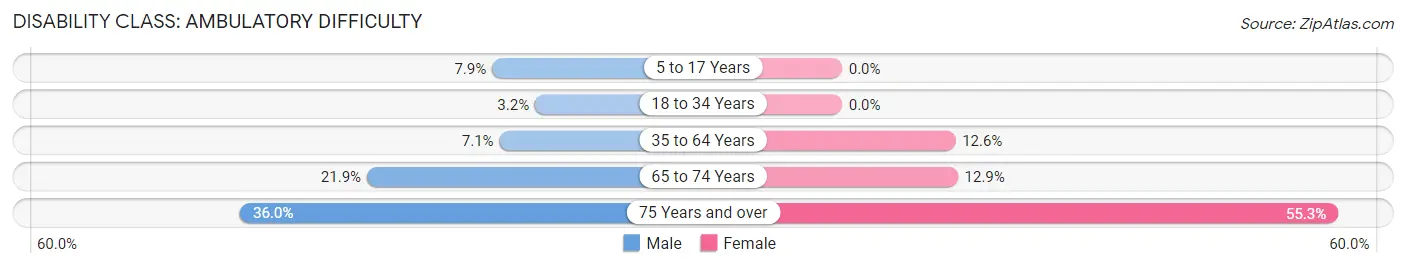
| Age Bracket | Male | Female |
| 5 to 17 Years | 22 (7.9%) | 0 (0.0%) |
| 18 to 34 Years | 5 (3.2%) | 0 (0.0%) |
| 35 to 64 Years | 19 (7.1%) | 25 (12.6%) |
| 65 to 74 Years | 7 (21.9%) | 4 (12.9%) |
| 75 Years and over | 9 (36.0%) | 21 (55.3%) |
Disability Class: Self-Care Difficulty
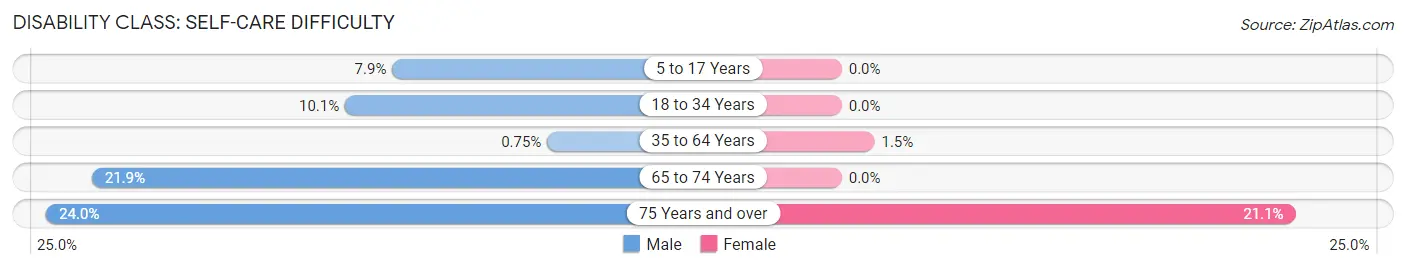
| Age Bracket | Male | Female |
| 5 to 17 Years | 22 (7.9%) | 0 (0.0%) |
| 18 to 34 Years | 16 (10.1%) | 0 (0.0%) |
| 35 to 64 Years | 2 (0.7%) | 3 (1.5%) |
| 65 to 74 Years | 7 (21.9%) | 0 (0.0%) |
| 75 Years and over | 6 (24.0%) | 8 (21.0%) |
Technology Access in Robbins
Computing Device Access in Robbins
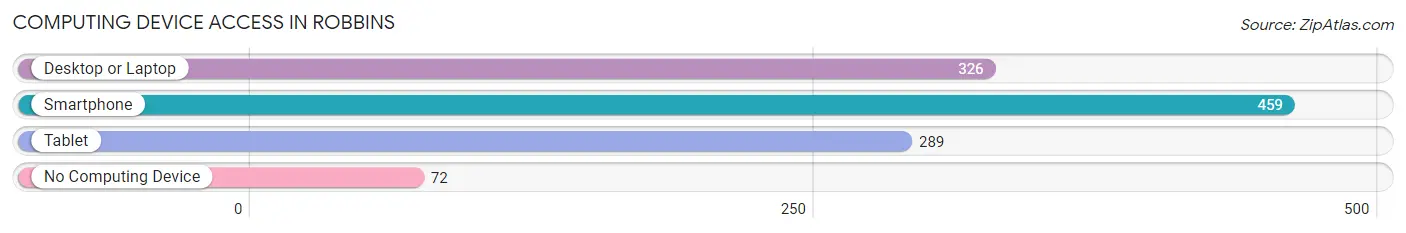
| Device Type | # Households | % Households |
| Desktop or Laptop | 326 | 59.5% |
| Smartphone | 459 | 83.8% |
| Tablet | 289 | 52.7% |
| No Computing Device | 72 | 13.1% |
| Total | 548 | 100.0% |
Internet Access in Robbins
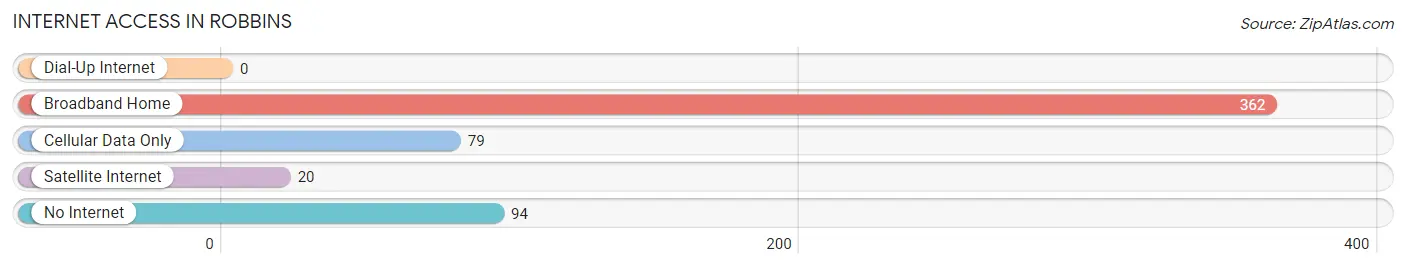
| Internet Type | # Households | % Households |
| Dial-Up Internet | 0 | 0.0% |
| Broadband Home | 362 | 66.1% |
| Cellular Data Only | 79 | 14.4% |
| Satellite Internet | 20 | 3.6% |
| No Internet | 94 | 17.2% |
| Total | 548 | 100.0% |
Robbins Summary
Robbins, North Carolina is a small town located in Moore County, North Carolina. It is situated in the Sandhills region of the state, and is part of the Fayetteville-Lumberton-Laurinburg Metropolitan Statistical Area. The town has a population of approximately 1,500 people, and is known for its rural charm and friendly atmosphere.
Geography
Robbins is located in the Sandhills region of North Carolina, which is characterized by rolling hills and sandy soils. The town is situated in the northern part of Moore County, and is bordered by the towns of Carthage, Pinehurst, and Southern Pines. The town is located approximately 25 miles south of Fayetteville, and is accessible via US Highway 1 and US Highway 15-501.
The town is situated on the banks of the Little River, which is a tributary of the Cape Fear River. The Little River is a popular destination for fishing, canoeing, and kayaking. The town is also home to several parks, including Robbins Park, which features a playground, picnic area, and walking trails.
Economy
Robbins is a small, rural town, and the economy is largely based on agriculture. The town is home to several farms, which produce a variety of crops, including corn, soybeans, and cotton. The town is also home to several small businesses, including restaurants, retail stores, and service providers.
The town is also home to several manufacturing companies, including Robbins Manufacturing, which produces a variety of products, including furniture, cabinets, and other wood products. The town is also home to several other manufacturing companies, including Robbins Textiles, which produces a variety of fabrics and textiles.
Demographics
As of the 2010 census, the population of Robbins was 1,500 people. The racial makeup of the town was 94.2% White, 2.7% African American, 0.7% Native American, 0.7% Asian, and 1.7% from other races. The median household income was $37,500, and the median family income was $45,000.
The town is home to several churches, including the First Baptist Church of Robbins, which was founded in 1887. The town is also home to several schools, including Robbins Elementary School, which serves students in grades K-5.
Conclusion
Robbins, North Carolina is a small, rural town located in Moore County, North Carolina. The town is situated in the Sandhills region of the state, and is part of the Fayetteville-Lumberton-Laurinburg Metropolitan Statistical Area. The town has a population of approximately 1,500 people, and is known for its rural charm and friendly atmosphere. The economy of the town is largely based on agriculture, and the town is home to several small businesses, manufacturing companies, and churches. The town is also home to several schools, including Robbins Elementary School, which serves students in grades K-5.
Common Questions
What is Per Capita Income in Robbins?
Per Capita income in Robbins is $18,943.
What is the Median Family Income in Robbins?
Median Family Income in Robbins is $48,094.
What is the Median Household income in Robbins?
Median Household Income in Robbins is $47,770.
What is Income or Wage Gap in Robbins?
Income or Wage Gap in Robbins is 47.6%.
Women in Robbins earn 52.4 cents for every dollar earned by a man.
What is Inequality or Gini Index in Robbins?
Inequality or Gini Index in Robbins is 0.43.
What is the Total Population of Robbins?
Total Population of Robbins is 1,511.
What is the Total Male Population of Robbins?
Total Male Population of Robbins is 875.
What is the Total Female Population of Robbins?
Total Female Population of Robbins is 636.
What is the Ratio of Males per 100 Females in Robbins?
There are 137.58 Males per 100 Females in Robbins.
What is the Ratio of Females per 100 Males in Robbins?
There are 72.69 Females per 100 Males in Robbins.
What is the Median Population Age in Robbins?
Median Population Age in Robbins is 24.8 Years.
What is the Average Family Size in Robbins
Average Family Size in Robbins is 3.0 People.
What is the Average Household Size in Robbins
Average Household Size in Robbins is 2.7 People.
How Large is the Labor Force in Robbins?
There are 618 People in the Labor Forcein in Robbins.
What is the Percentage of People in the Labor Force in Robbins?
59.7% of People are in the Labor Force in Robbins.
What is the Unemployment Rate in Robbins?
Unemployment Rate in Robbins is 8.7%.