Silver Lake, NC Map & Demographics
Silver Lake Map
Silver Lake Overview
$39,006
PER CAPITA INCOME
$87,888
AVG FAMILY INCOME
$75,123
AVG HOUSEHOLD INCOME
18.4%
WAGE / INCOME GAP [ % ]
81.6¢/ $1
WAGE / INCOME GAP [ $ ]
0.41
INEQUALITY / GINI INDEX
5,858
TOTAL POPULATION
3,353
MALE POPULATION
2,505
FEMALE POPULATION
133.85
MALES / 100 FEMALES
74.71
FEMALES / 100 MALES
43.2
MEDIAN AGE
2.9
AVG FAMILY SIZE
2.3
AVG HOUSEHOLD SIZE
3,241
LABOR FORCE [ PEOPLE ]
68.0%
PERCENT IN LABOR FORCE
3.4%
UNEMPLOYMENT RATE
Income in Silver Lake
Income Overview in Silver Lake
Per Capita Income in Silver Lake is $39,006, while median incomes of families and households are $87,888 and $75,123 respectively.
| Characteristic | Number | Measure |
| Per Capita Income | 5,858 | $39,006 |
| Median Family Income | 1,439 | $87,888 |
| Mean Family Income | 1,439 | $97,629 |
| Median Household Income | 2,543 | $75,123 |
| Mean Household Income | 2,543 | $91,495 |
| Income Deficit | 1,439 | $0 |
| Wage / Income Gap (%) | 5,858 | 18.37% |
| Wage / Income Gap ($) | 5,858 | 81.63¢ per $1 |
| Gini / Inequality Index | 5,858 | 0.41 |
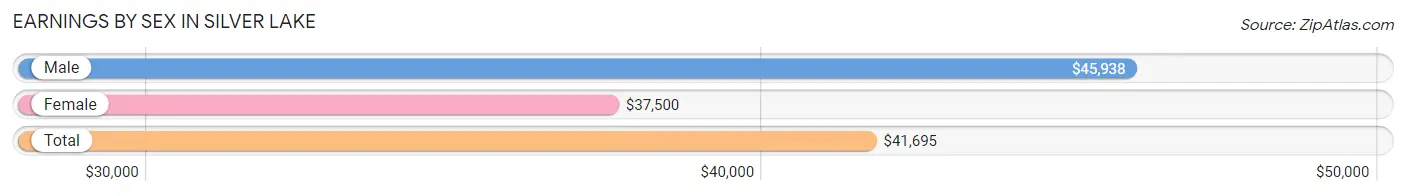
Earnings by Sex in Silver Lake
Average Earnings in Silver Lake are $41,695, $45,938 for men and $37,500 for women, a difference of 18.4%.
| Sex | Number | Average Earnings |
| Male | 2,022 (60.2%) | $45,938 |
| Female | 1,336 (39.8%) | $37,500 |
| Total | 3,358 (100.0%) | $41,695 |
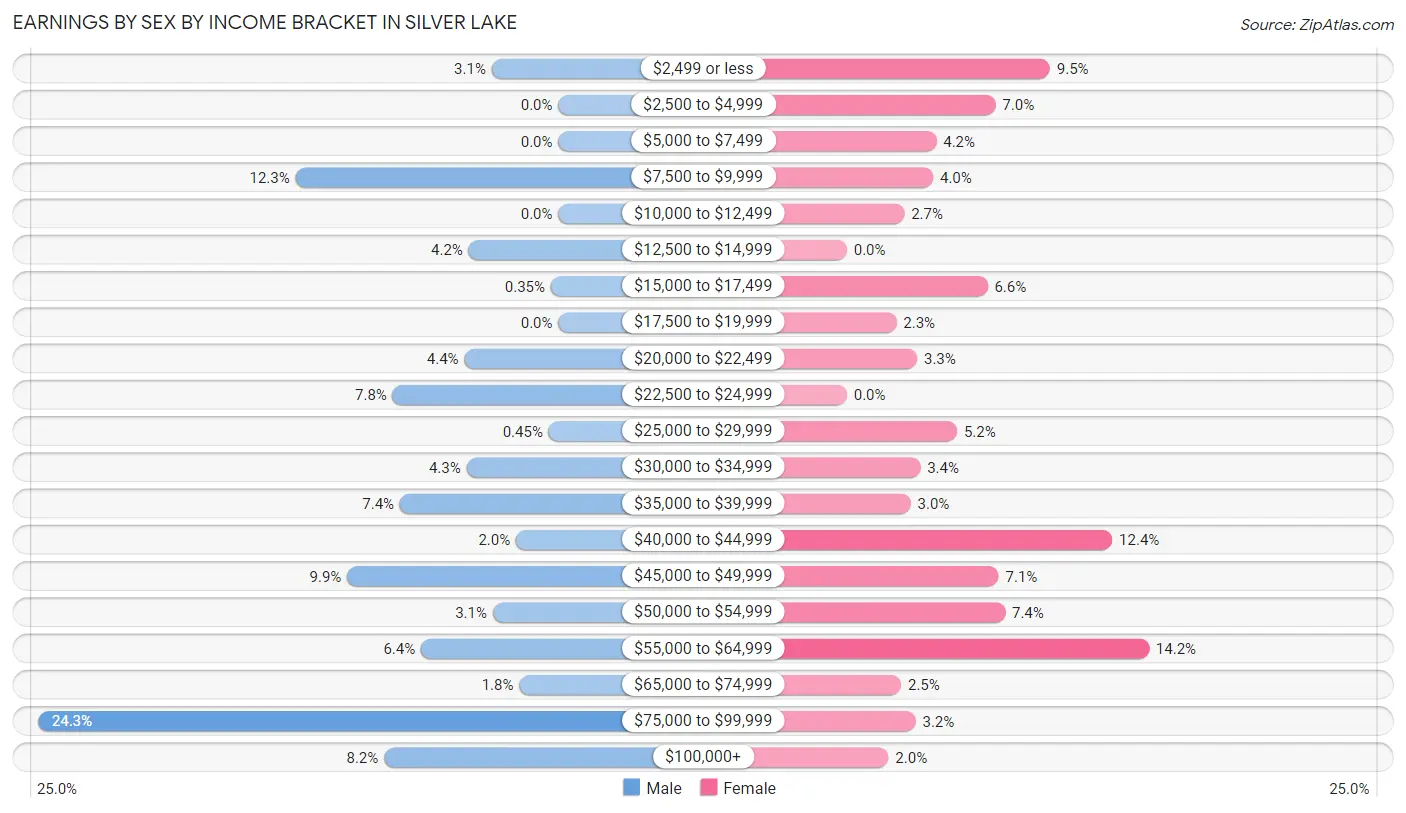
Earnings by Sex by Income Bracket in Silver Lake
The most common earnings brackets in Silver Lake are $75,000 to $99,999 for men (492 | 24.3%) and $55,000 to $64,999 for women (189 | 14.1%).
| Income | Male | Female |
| $2,499 or less | 63 (3.1%) | 127 (9.5%) |
| $2,500 to $4,999 | 0 (0.0%) | 93 (7.0%) |
| $5,000 to $7,499 | 0 (0.0%) | 56 (4.2%) |
| $7,500 to $9,999 | 249 (12.3%) | 54 (4.0%) |
| $10,000 to $12,499 | 0 (0.0%) | 36 (2.7%) |
| $12,500 to $14,999 | 85 (4.2%) | 0 (0.0%) |
| $15,000 to $17,499 | 7 (0.4%) | 88 (6.6%) |
| $17,500 to $19,999 | 0 (0.0%) | 31 (2.3%) |
| $20,000 to $22,499 | 89 (4.4%) | 44 (3.3%) |
| $22,500 to $24,999 | 157 (7.8%) | 0 (0.0%) |
| $25,000 to $29,999 | 9 (0.4%) | 69 (5.2%) |
| $30,000 to $34,999 | 87 (4.3%) | 46 (3.4%) |
| $35,000 to $39,999 | 150 (7.4%) | 40 (3.0%) |
| $40,000 to $44,999 | 40 (2.0%) | 166 (12.4%) |
| $45,000 to $49,999 | 200 (9.9%) | 95 (7.1%) |
| $50,000 to $54,999 | 62 (3.1%) | 99 (7.4%) |
| $55,000 to $64,999 | 130 (6.4%) | 189 (14.1%) |
| $65,000 to $74,999 | 37 (1.8%) | 34 (2.5%) |
| $75,000 to $99,999 | 492 (24.3%) | 43 (3.2%) |
| $100,000+ | 165 (8.2%) | 26 (1.9%) |
| Total | 2,022 (100.0%) | 1,336 (100.0%) |
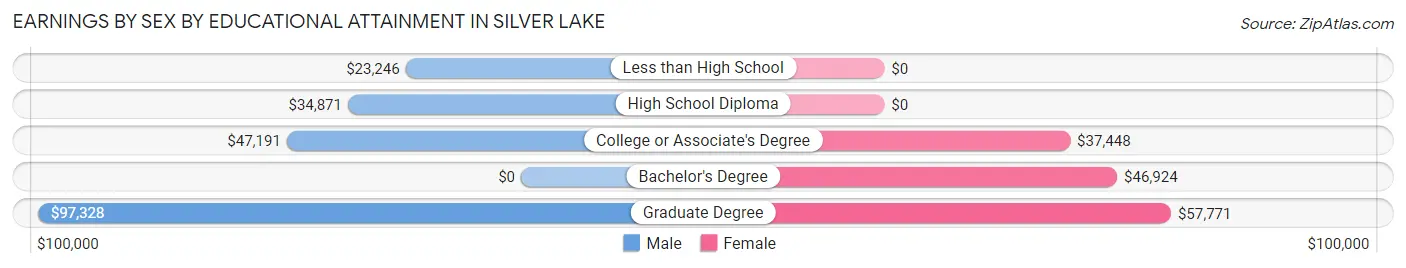
Earnings by Sex by Educational Attainment in Silver Lake
Average earnings in Silver Lake are $46,306 for men and $41,108 for women, a difference of 11.2%. Men with an educational attainment of graduate degree enjoy the highest average annual earnings of $97,328, while those with less than high school education earn the least with $23,246. Women with an educational attainment of graduate degree earn the most with the average annual earnings of $57,771, while those with college or associate's degree education have the smallest earnings of $37,448.
| Educational Attainment | Male Income | Female Income |
| Less than High School | $23,246 | $0 |
| High School Diploma | $34,871 | $0 |
| College or Associate's Degree | $47,191 | $37,448 |
| Bachelor's Degree | - | - |
| Graduate Degree | $97,328 | $57,771 |
| Total | $46,306 | $41,108 |
Family Income in Silver Lake
Family Income Brackets in Silver Lake
According to the Silver Lake family income data, there are 286 families falling into the $150,000 to $199,999 income range, which is the most common income bracket and makes up 19.9% of all families. Conversely, the $10,000 to $14,999 income bracket is the least frequent group with only 9 families (0.6%) belonging to this category.
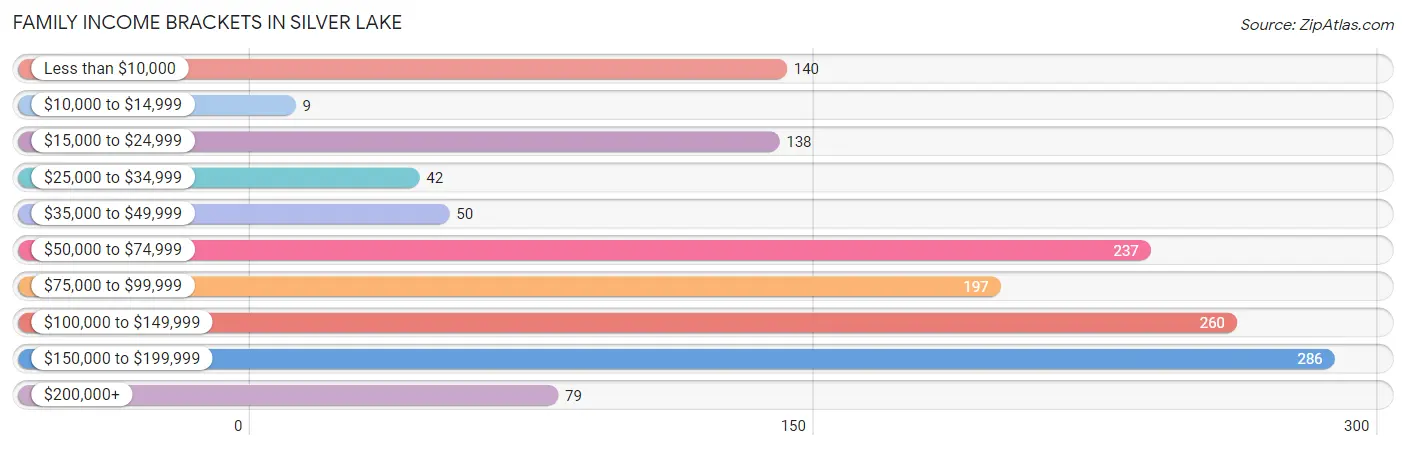
| Income Bracket | # Families | % Families |
| Less than $10,000 | 140 | 9.7% |
| $10,000 to $14,999 | 9 | 0.6% |
| $15,000 to $24,999 | 138 | 9.6% |
| $25,000 to $34,999 | 42 | 2.9% |
| $35,000 to $49,999 | 50 | 3.5% |
| $50,000 to $74,999 | 237 | 16.5% |
| $75,000 to $99,999 | 197 | 13.7% |
| $100,000 to $149,999 | 260 | 18.1% |
| $150,000 to $199,999 | 286 | 19.9% |
| $200,000+ | 79 | 5.5% |
Family Income by Famaliy Size in Silver Lake
2-person families (724 | 50.3%) account for the highest median family income in Silver Lake with $104,643 per family, while 2-person families (724 | 50.3%) have the highest median income of $52,322 per family member.
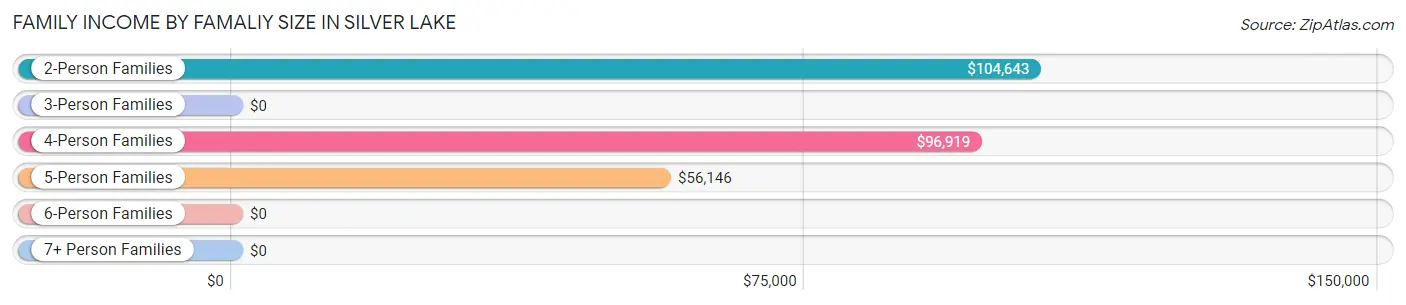
| Income Bracket | # Families | Median Income |
| 2-Person Families | 724 (50.3%) | $104,643 |
| 3-Person Families | 385 (26.8%) | $0 |
| 4-Person Families | 218 (15.1%) | $96,919 |
| 5-Person Families | 107 (7.4%) | $56,146 |
| 6-Person Families | 5 (0.4%) | $0 |
| 7+ Person Families | 0 (0.0%) | $0 |
| Total | 1,439 (100.0%) | $87,888 |
Family Income by Number of Earners in Silver Lake
The median family income in Silver Lake is $87,888, with families comprising 3+ earners (112) having the highest median family income of $187,143, while families with 1 earner (390) have the lowest median family income of $55,882, accounting for 7.8% and 27.1% of families, respectively.
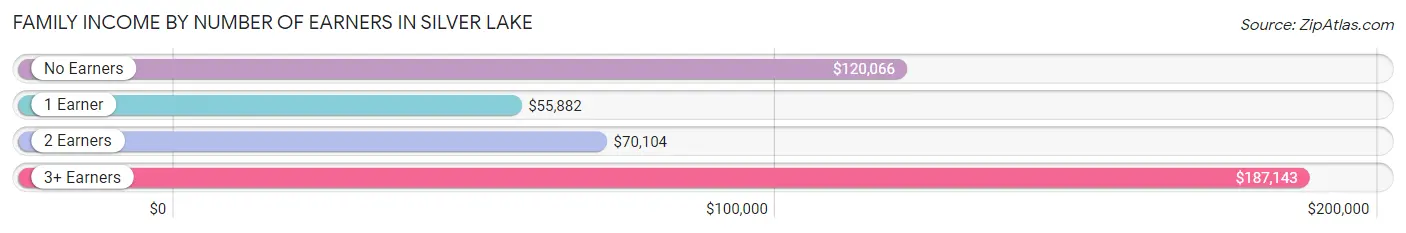
| Number of Earners | # Families | Median Income |
| No Earners | 389 (27.0%) | $120,066 |
| 1 Earner | 390 (27.1%) | $55,882 |
| 2 Earners | 548 (38.1%) | $70,104 |
| 3+ Earners | 112 (7.8%) | $187,143 |
| Total | 1,439 (100.0%) | $87,888 |
Household Income in Silver Lake
Household Income Brackets in Silver Lake
With 547 households falling in the category, the $100,000 to $149,999 income range is the most frequent in Silver Lake, accounting for 21.5% of all households. In contrast, only 71 households (2.8%) fall into the $10,000 to $14,999 income bracket, making it the least populous group.
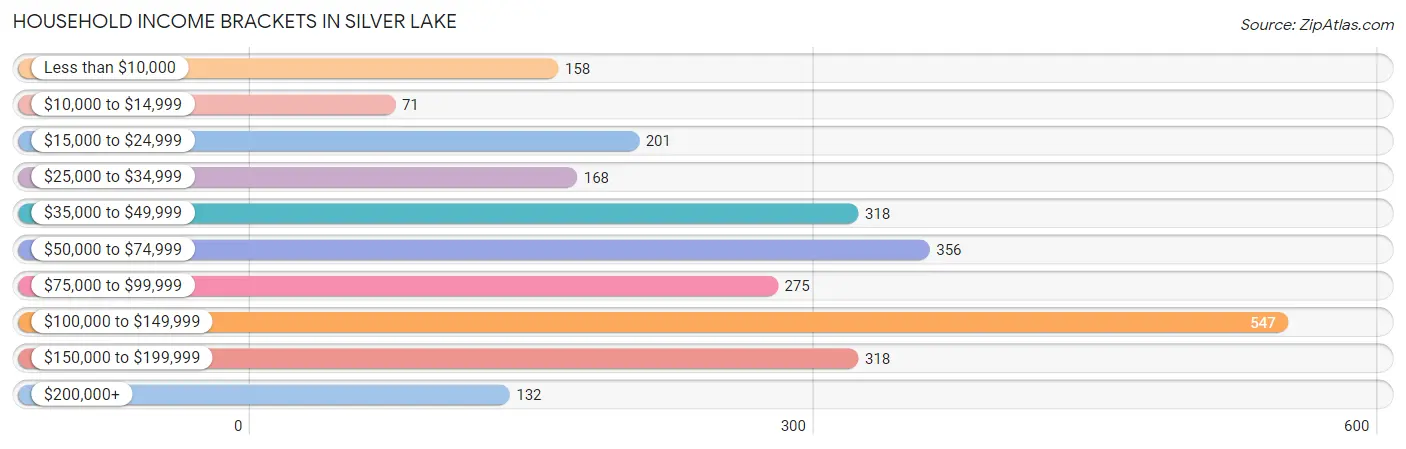
| Income Bracket | # Households | % Households |
| Less than $10,000 | 158 | 6.2% |
| $10,000 to $14,999 | 71 | 2.8% |
| $15,000 to $24,999 | 201 | 7.9% |
| $25,000 to $34,999 | 168 | 6.6% |
| $35,000 to $49,999 | 318 | 12.5% |
| $50,000 to $74,999 | 356 | 14.0% |
| $75,000 to $99,999 | 275 | 10.8% |
| $100,000 to $149,999 | 547 | 21.5% |
| $150,000 to $199,999 | 318 | 12.5% |
| $200,000+ | 132 | 5.2% |
Household Income by Householder Age in Silver Lake
The median household income in Silver Lake is $75,123, with the highest median household income of $106,101 found in the 45 to 64 years age bracket for the primary householder. A total of 739 households (29.1%) fall into this category. Meanwhile, the 15 to 24 years age bracket for the primary householder has the lowest median household income of $0, with 40 households (1.6%) in this group.
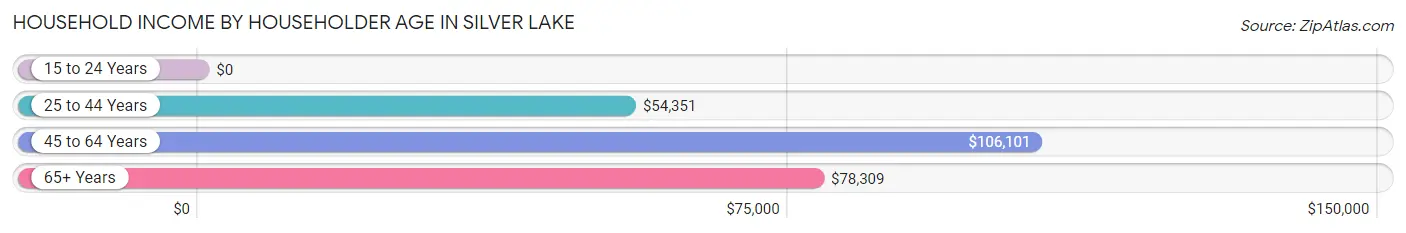
| Income Bracket | # Households | Median Income |
| 15 to 24 Years | 40 (1.6%) | $0 |
| 25 to 44 Years | 943 (37.1%) | $54,351 |
| 45 to 64 Years | 739 (29.1%) | $106,101 |
| 65+ Years | 821 (32.3%) | $78,309 |
| Total | 2,543 (100.0%) | $75,123 |
Poverty in Silver Lake
Income Below Poverty by Sex and Age in Silver Lake
With 14.5% poverty level for males and 11.3% for females among the residents of Silver Lake, 15 year old males and 6 to 11 year old females are the most vulnerable to poverty, with 23 males (100.0%) and 17 females (32.1%) in their respective age groups living below the poverty level.
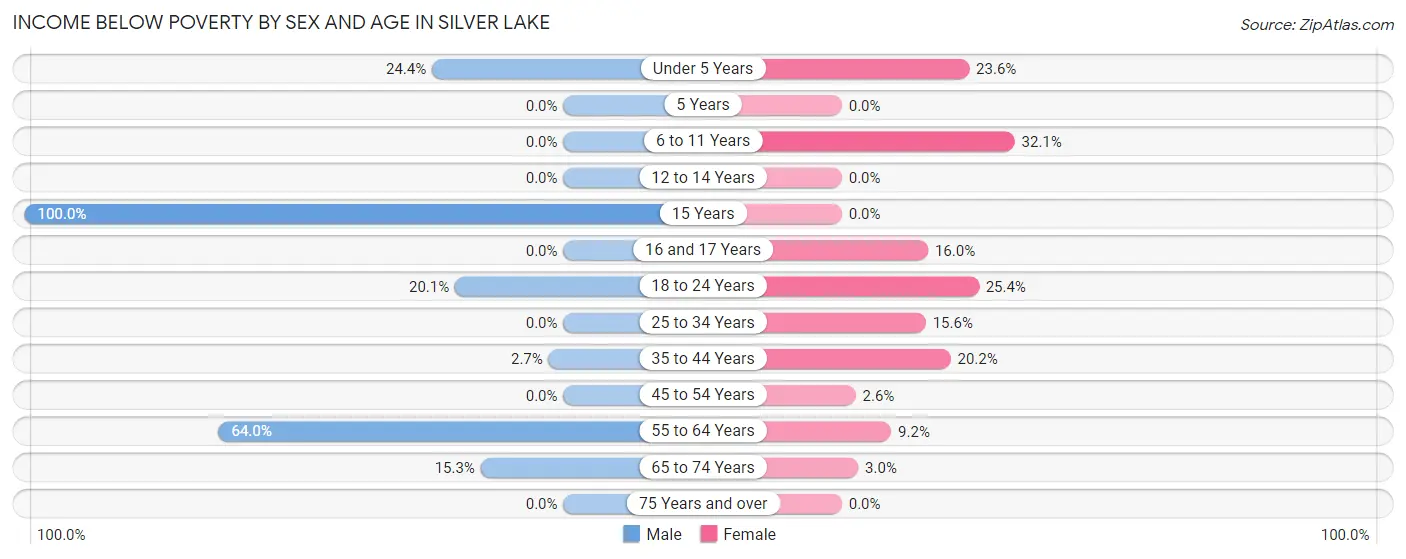
| Age Bracket | Male | Female |
| Under 5 Years | 79 (24.4%) | 61 (23.6%) |
| 5 Years | 0 (0.0%) | 0 (0.0%) |
| 6 to 11 Years | 0 (0.0%) | 17 (32.1%) |
| 12 to 14 Years | 0 (0.0%) | 0 (0.0%) |
| 15 Years | 23 (100.0%) | 0 (0.0%) |
| 16 and 17 Years | 0 (0.0%) | 8 (16.0%) |
| 18 to 24 Years | 42 (20.1%) | 47 (25.4%) |
| 25 to 34 Years | 0 (0.0%) | 55 (15.6%) |
| 35 to 44 Years | 11 (2.7%) | 43 (20.2%) |
| 45 to 54 Years | 0 (0.0%) | 9 (2.6%) |
| 55 to 64 Years | 279 (64.0%) | 25 (9.2%) |
| 65 to 74 Years | 54 (15.3%) | 18 (3.0%) |
| 75 Years and over | 0 (0.0%) | 0 (0.0%) |
| Total | 488 (14.5%) | 283 (11.3%) |
Income Above Poverty by Sex and Age in Silver Lake
According to the poverty statistics in Silver Lake, males aged 5 years and females aged 5 years are the age groups that are most secure financially, with 100.0% of males and 100.0% of females in these age groups living above the poverty line.
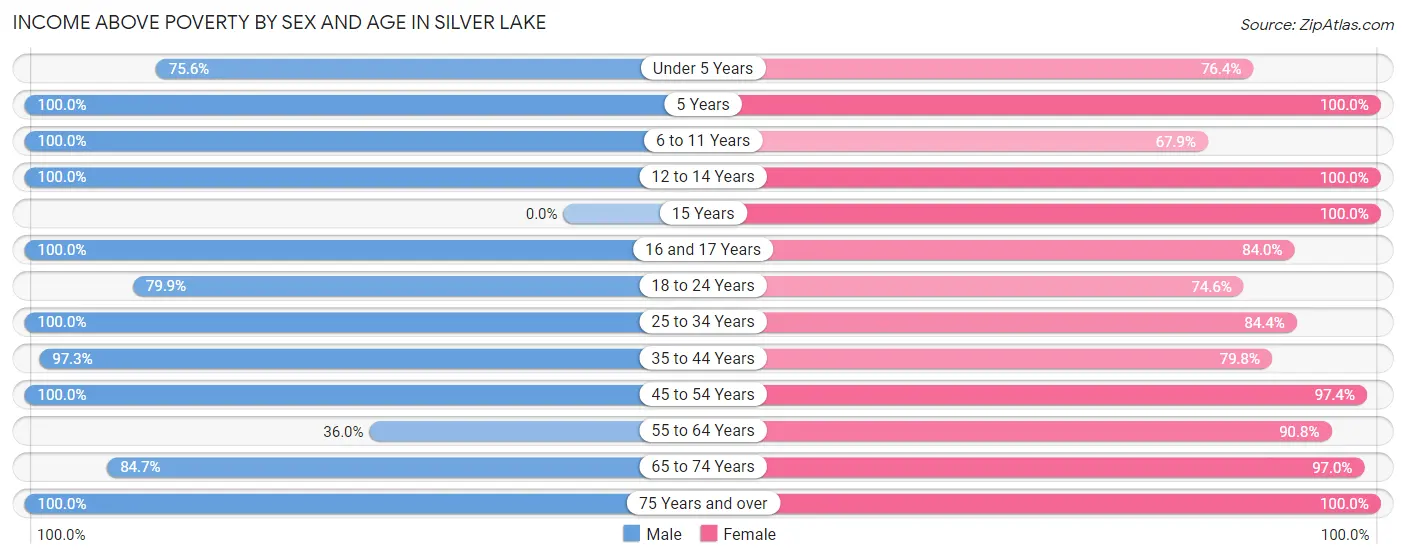
| Age Bracket | Male | Female |
| Under 5 Years | 245 (75.6%) | 197 (76.4%) |
| 5 Years | 8 (100.0%) | 9 (100.0%) |
| 6 to 11 Years | 255 (100.0%) | 36 (67.9%) |
| 12 to 14 Years | 89 (100.0%) | 19 (100.0%) |
| 15 Years | 0 (0.0%) | 54 (100.0%) |
| 16 and 17 Years | 53 (100.0%) | 42 (84.0%) |
| 18 to 24 Years | 167 (79.9%) | 138 (74.6%) |
| 25 to 34 Years | 445 (100.0%) | 298 (84.4%) |
| 35 to 44 Years | 391 (97.3%) | 170 (79.8%) |
| 45 to 54 Years | 564 (100.0%) | 342 (97.4%) |
| 55 to 64 Years | 157 (36.0%) | 248 (90.8%) |
| 65 to 74 Years | 298 (84.7%) | 574 (97.0%) |
| 75 Years and over | 193 (100.0%) | 95 (100.0%) |
| Total | 2,865 (85.5%) | 2,222 (88.7%) |
Income Below Poverty Among Married-Couple Families in Silver Lake
The poverty statistics for married-couple families in Silver Lake show that 2.1% or 26 of the total 1,232 families live below the poverty line. Families with no children have the highest poverty rate of 3.3%, comprising of 26 families. On the other hand, families with 1 or 2 children have the lowest poverty rate of 0.0%, which includes 0 families.
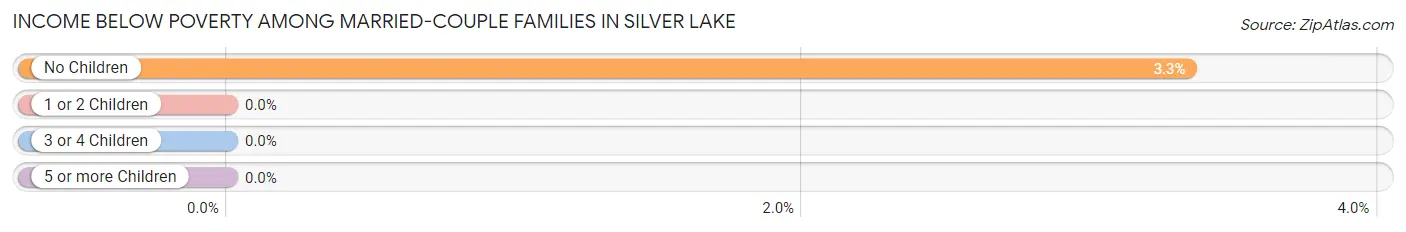
| Children | Above Poverty | Below Poverty |
| No Children | 753 (96.7%) | 26 (3.3%) |
| 1 or 2 Children | 346 (100.0%) | 0 (0.0%) |
| 3 or 4 Children | 107 (100.0%) | 0 (0.0%) |
| 5 or more Children | 0 (0.0%) | 0 (0.0%) |
| Total | 1,206 (97.9%) | 26 (2.1%) |
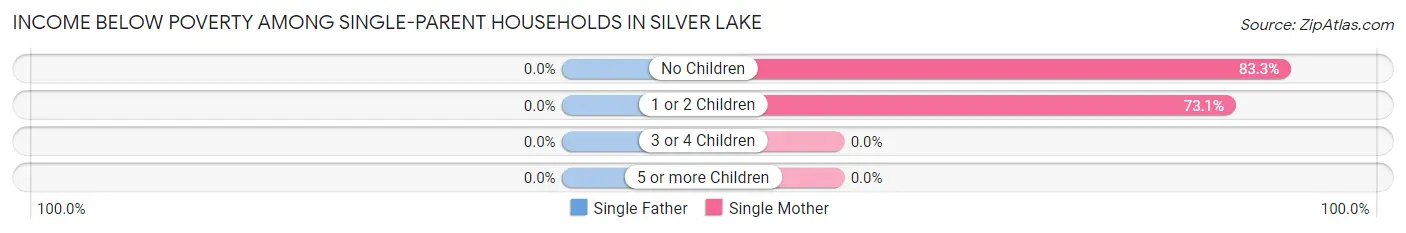
Income Below Poverty Among Single-Parent Households in Silver Lake
| Children | Single Father | Single Mother |
| No Children | 0 (0.0%) | 25 (83.3%) |
| 1 or 2 Children | 0 (0.0%) | 103 (73.1%) |
| 3 or 4 Children | 0 (0.0%) | 0 (0.0%) |
| 5 or more Children | 0 (0.0%) | 0 (0.0%) |
| Total | 0 (0.0%) | 128 (74.9%) |
Income Below Poverty Among Married-Couple vs Single-Parent Households in Silver Lake
The poverty data for Silver Lake shows that 26 of the married-couple family households (2.1%) and 128 of the single-parent households (61.8%) are living below the poverty level. Within the married-couple family households, those with no children have the highest poverty rate, with 26 households (3.3%) falling below the poverty line. Among the single-parent households, those with no children have the highest poverty rate, with 25 household (62.5%) living below poverty.
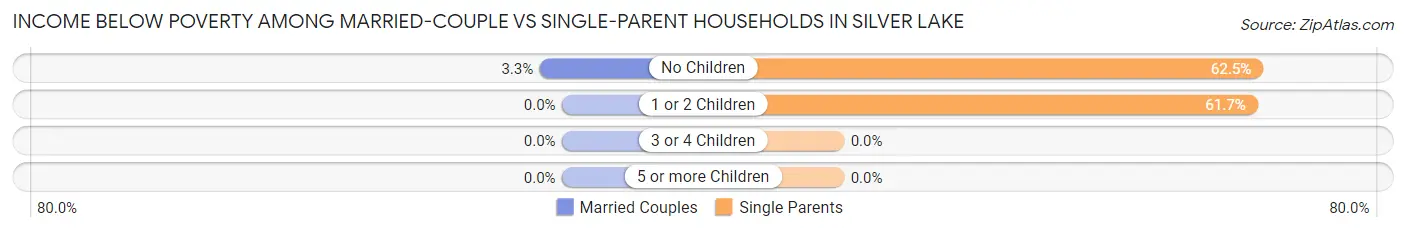
| Children | Married-Couple Families | Single-Parent Households |
| No Children | 26 (3.3%) | 25 (62.5%) |
| 1 or 2 Children | 0 (0.0%) | 103 (61.7%) |
| 3 or 4 Children | 0 (0.0%) | 0 (0.0%) |
| 5 or more Children | 0 (0.0%) | 0 (0.0%) |
| Total | 26 (2.1%) | 128 (61.8%) |
Race in Silver Lake
The most populous races in Silver Lake are White / Caucasian (4,753 | 81.1%), Hispanic or Latino (786 | 13.4%), and Some other Race (519 | 8.9%).
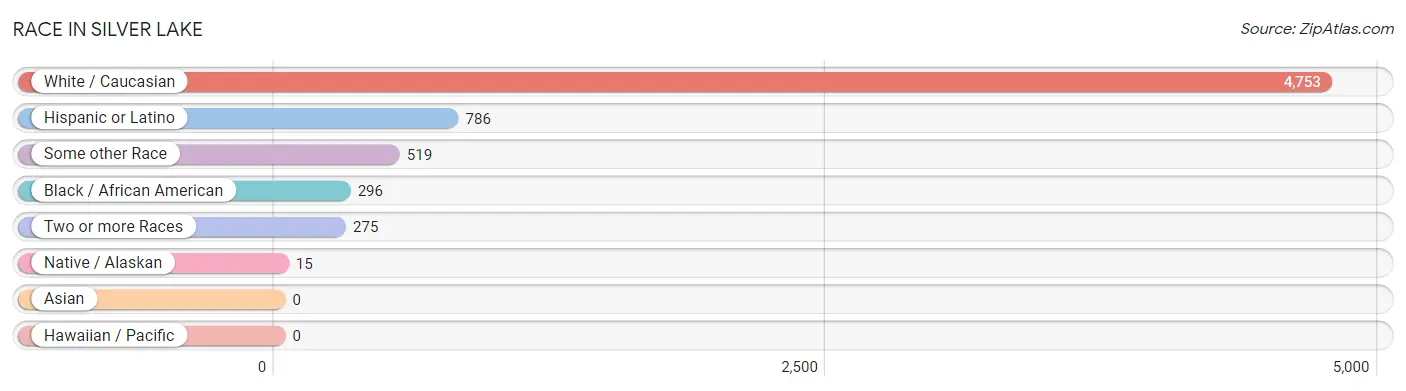
| Race | # Population | % Population |
| Asian | 0 | 0.0% |
| Black / African American | 296 | 5.1% |
| Hawaiian / Pacific | 0 | 0.0% |
| Hispanic or Latino | 786 | 13.4% |
| Native / Alaskan | 15 | 0.3% |
| White / Caucasian | 4,753 | 81.1% |
| Two or more Races | 275 | 4.7% |
| Some other Race | 519 | 8.9% |
| Total | 5,858 | 100.0% |
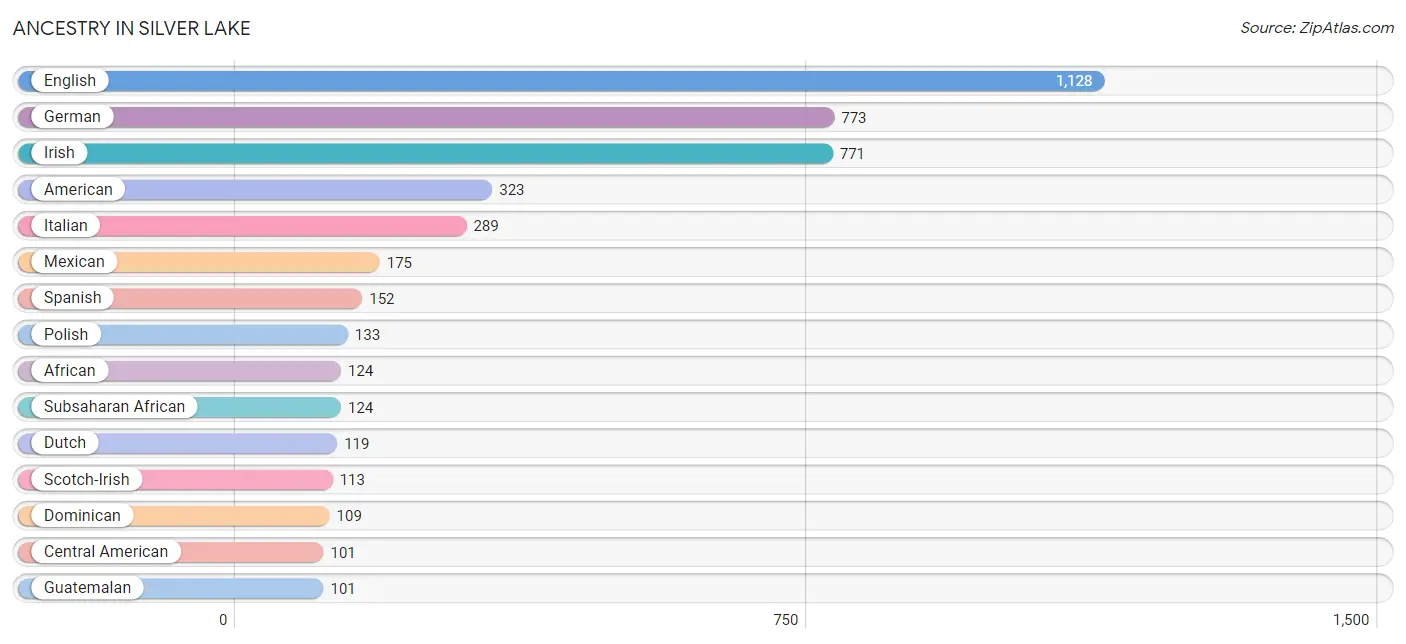
Ancestry in Silver Lake
The most populous ancestries reported in Silver Lake are English (1,128 | 19.3%), German (773 | 13.2%), Irish (771 | 13.2%), American (323 | 5.5%), and Italian (289 | 4.9%), together accounting for 56.1% of all Silver Lake residents.
| Ancestry | # Population | % Population |
| African | 124 | 2.1% |
| American | 323 | 5.5% |
| Arab | 36 | 0.6% |
| Bahamian | 11 | 0.2% |
| British | 29 | 0.5% |
| Central American | 101 | 1.7% |
| Cherokee | 15 | 0.3% |
| Cuban | 26 | 0.4% |
| Czech | 5 | 0.1% |
| Dominican | 109 | 1.9% |
| Dutch | 119 | 2.0% |
| English | 1,128 | 19.3% |
| European | 27 | 0.5% |
| French | 12 | 0.2% |
| French Canadian | 49 | 0.8% |
| German | 773 | 13.2% |
| Guatemalan | 101 | 1.7% |
| Irish | 771 | 13.2% |
| Iroquois | 17 | 0.3% |
| Italian | 289 | 4.9% |
| Korean | 22 | 0.4% |
| Lebanese | 20 | 0.3% |
| Lithuanian | 26 | 0.4% |
| Maltese | 8 | 0.1% |
| Mexican | 175 | 3.0% |
| Norwegian | 16 | 0.3% |
| Pakistani | 23 | 0.4% |
| Polish | 133 | 2.3% |
| Puerto Rican | 77 | 1.3% |
| Romanian | 18 | 0.3% |
| Russian | 13 | 0.2% |
| Scandinavian | 5 | 0.1% |
| Scotch-Irish | 113 | 1.9% |
| Scottish | 53 | 0.9% |
| Slovak | 17 | 0.3% |
| Spaniard | 17 | 0.3% |
| Spanish | 152 | 2.6% |
| Subsaharan African | 124 | 2.1% |
| Syrian | 36 | 0.6% |
| Welsh | 11 | 0.2% | View All 40 Rows |
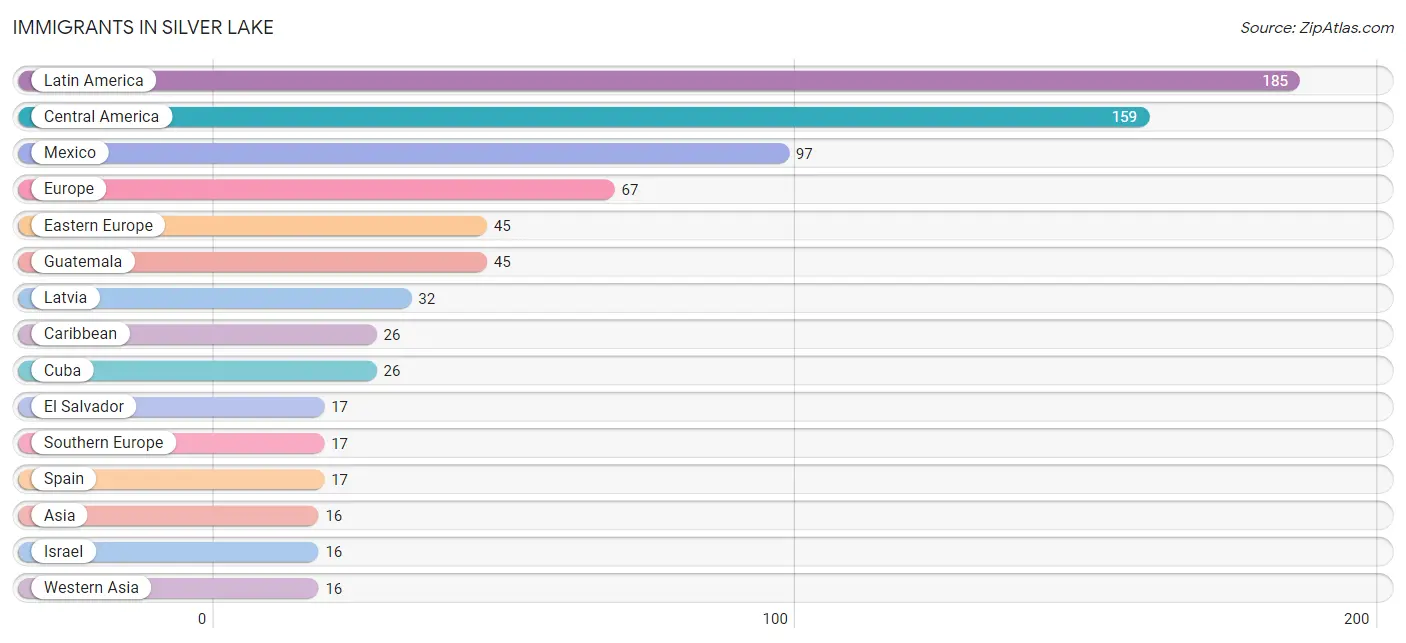
Immigrants in Silver Lake
The most numerous immigrant groups reported in Silver Lake came from Latin America (185 | 3.2%), Central America (159 | 2.7%), Mexico (97 | 1.7%), Europe (67 | 1.1%), and Eastern Europe (45 | 0.8%), together accounting for 9.4% of all Silver Lake residents.
| Immigration Origin | # Population | % Population |
| Asia | 16 | 0.3% |
| Canada | 7 | 0.1% |
| Caribbean | 26 | 0.4% |
| Central America | 159 | 2.7% |
| Cuba | 26 | 0.4% |
| Eastern Europe | 45 | 0.8% |
| El Salvador | 17 | 0.3% |
| Europe | 67 | 1.1% |
| Guatemala | 45 | 0.8% |
| Israel | 16 | 0.3% |
| Latin America | 185 | 3.2% |
| Latvia | 32 | 0.5% |
| Mexico | 97 | 1.7% |
| Netherlands | 5 | 0.1% |
| Russia | 13 | 0.2% |
| Southern Europe | 17 | 0.3% |
| Spain | 17 | 0.3% |
| Western Asia | 16 | 0.3% |
| Western Europe | 5 | 0.1% | View All 19 Rows |
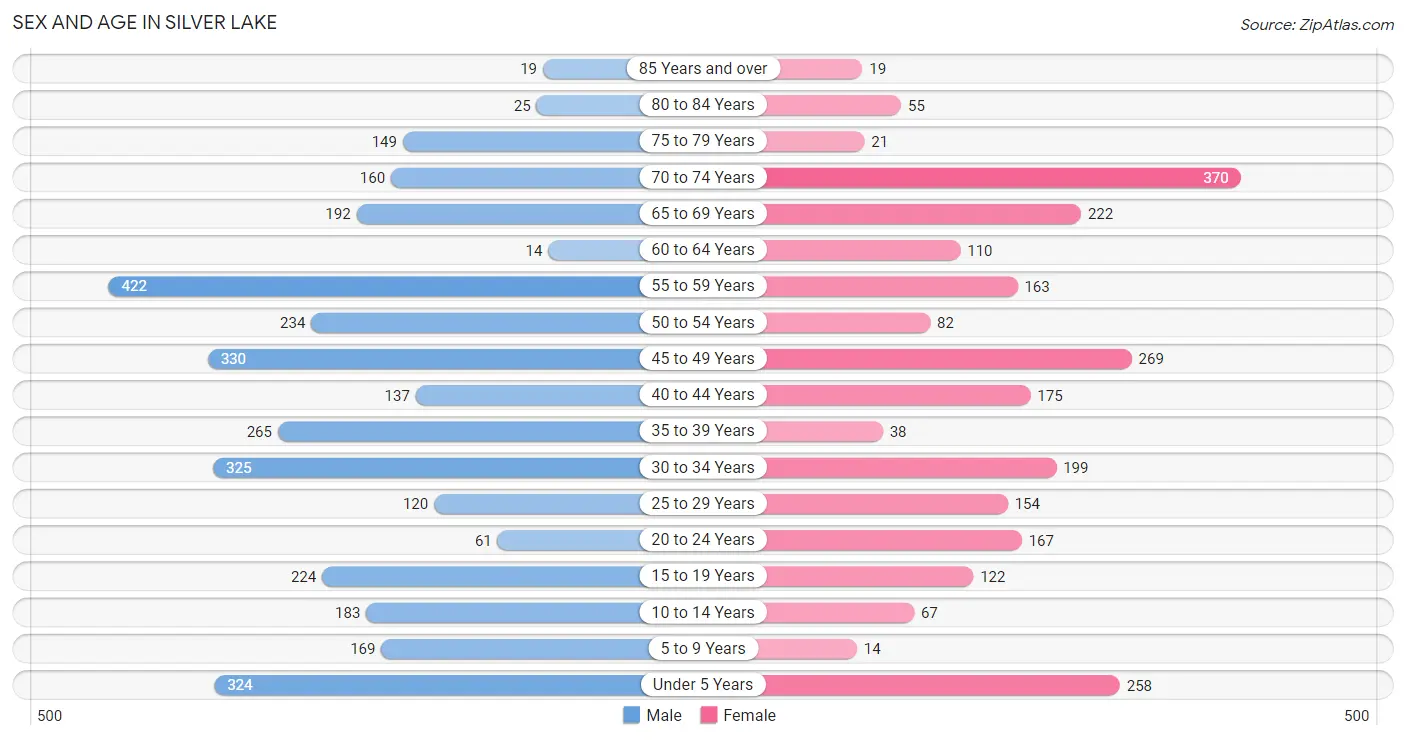
Sex and Age in Silver Lake
Sex and Age in Silver Lake
The most populous age groups in Silver Lake are 55 to 59 Years (422 | 12.6%) for men and 70 to 74 Years (370 | 14.8%) for women.
| Age Bracket | Male | Female |
| Under 5 Years | 324 (9.7%) | 258 (10.3%) |
| 5 to 9 Years | 169 (5.0%) | 14 (0.6%) |
| 10 to 14 Years | 183 (5.5%) | 67 (2.7%) |
| 15 to 19 Years | 224 (6.7%) | 122 (4.9%) |
| 20 to 24 Years | 61 (1.8%) | 167 (6.7%) |
| 25 to 29 Years | 120 (3.6%) | 154 (6.1%) |
| 30 to 34 Years | 325 (9.7%) | 199 (7.9%) |
| 35 to 39 Years | 265 (7.9%) | 38 (1.5%) |
| 40 to 44 Years | 137 (4.1%) | 175 (7.0%) |
| 45 to 49 Years | 330 (9.8%) | 269 (10.7%) |
| 50 to 54 Years | 234 (7.0%) | 82 (3.3%) |
| 55 to 59 Years | 422 (12.6%) | 163 (6.5%) |
| 60 to 64 Years | 14 (0.4%) | 110 (4.4%) |
| 65 to 69 Years | 192 (5.7%) | 222 (8.9%) |
| 70 to 74 Years | 160 (4.8%) | 370 (14.8%) |
| 75 to 79 Years | 149 (4.4%) | 21 (0.8%) |
| 80 to 84 Years | 25 (0.7%) | 55 (2.2%) |
| 85 Years and over | 19 (0.6%) | 19 (0.8%) |
| Total | 3,353 (100.0%) | 2,505 (100.0%) |
Families and Households in Silver Lake
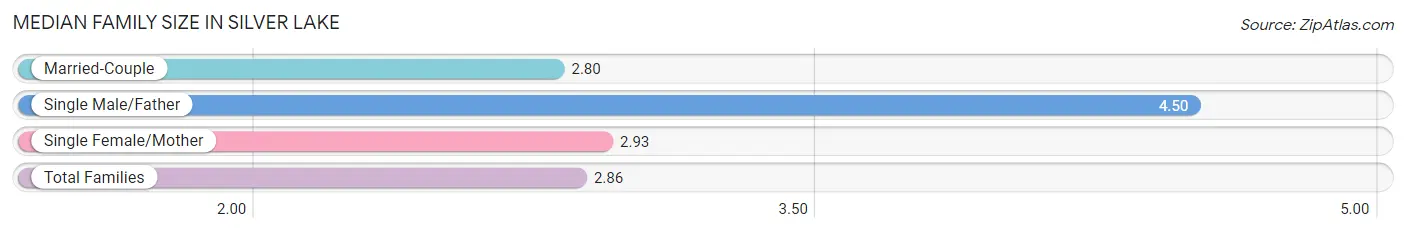
Median Family Size in Silver Lake
The median family size in Silver Lake is 2.86 persons per family, with single male/father families (36 | 2.5%) accounting for the largest median family size of 4.5 persons per family. On the other hand, married-couple families (1,232 | 85.6%) represent the smallest median family size with 2.80 persons per family.
| Family Type | # Families | Family Size |
| Married-Couple | 1,232 (85.6%) | 2.80 |
| Single Male/Father | 36 (2.5%) | 4.50 |
| Single Female/Mother | 171 (11.9%) | 2.93 |
| Total Families | 1,439 (100.0%) | 2.86 |
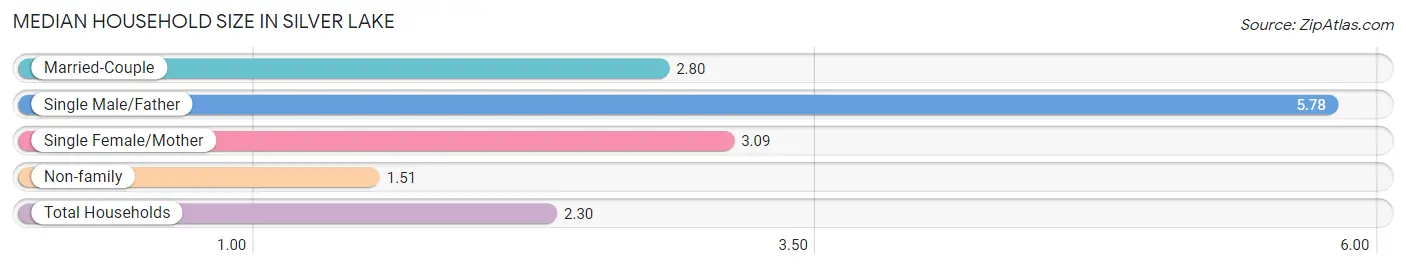
Median Household Size in Silver Lake
The median household size in Silver Lake is 2.30 persons per household, with single male/father households (36 | 1.4%) accounting for the largest median household size of 5.78 persons per household. non-family households (1,104 | 43.4%) represent the smallest median household size with 1.51 persons per household.
| Household Type | # Households | Household Size |
| Married-Couple | 1,232 (48.4%) | 2.80 |
| Single Male/Father | 36 (1.4%) | 5.78 |
| Single Female/Mother | 171 (6.7%) | 3.09 |
| Non-family | 1,104 (43.4%) | 1.51 |
| Total Households | 2,543 (100.0%) | 2.30 |
Household Size by Marriage Status in Silver Lake
Out of a total of 2,543 households in Silver Lake, 1,439 (56.6%) are family households, while 1,104 (43.4%) are nonfamily households. The most numerous type of family households are 2-person households, comprising 724, and the most common type of nonfamily households are 1-person households, comprising 738.
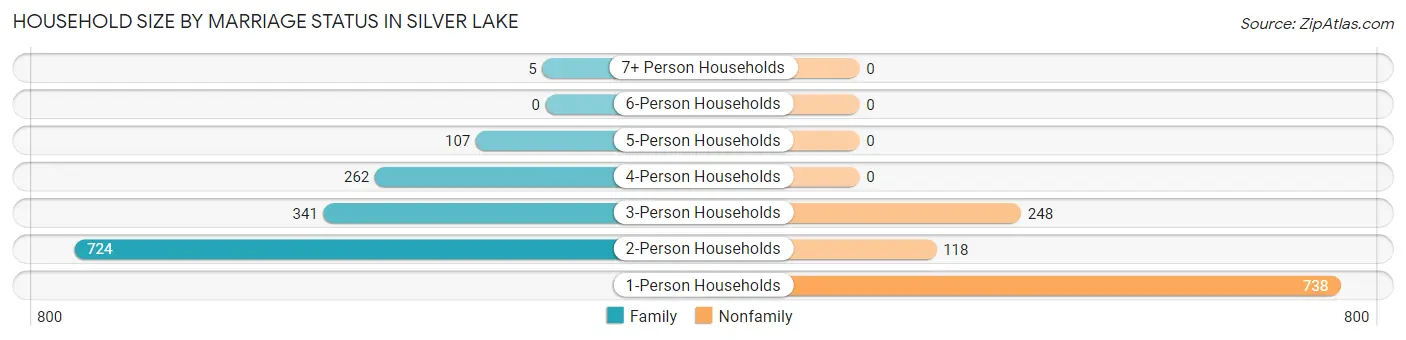
| Household Size | Family Households | Nonfamily Households |
| 1-Person Households | - | 738 (29.0%) |
| 2-Person Households | 724 (28.5%) | 118 (4.6%) |
| 3-Person Households | 341 (13.4%) | 248 (9.8%) |
| 4-Person Households | 262 (10.3%) | 0 (0.0%) |
| 5-Person Households | 107 (4.2%) | 0 (0.0%) |
| 6-Person Households | 0 (0.0%) | 0 (0.0%) |
| 7+ Person Households | 5 (0.2%) | 0 (0.0%) |
| Total | 1,439 (56.6%) | 1,104 (43.4%) |
Female Fertility in Silver Lake
Fertility by Age in Silver Lake
Average fertility rate in Silver Lake is 99.0 births per 1,000 women. Women in the age bracket of 20 to 34 years have the highest fertility rate with 219.0 births per 1,000 women. Women in the age bracket of 20 to 34 years acount for 100.0% of all women with births.
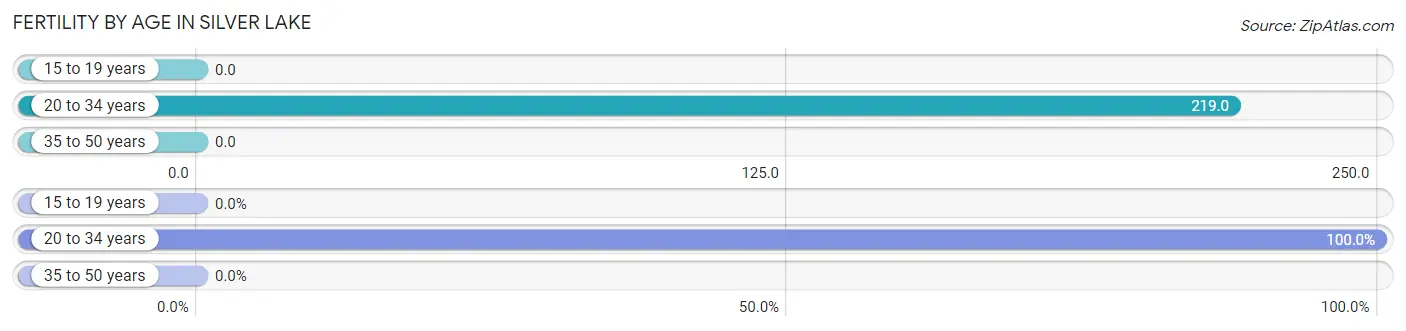
| Age Bracket | Women with Births | Births / 1,000 Women |
| 15 to 19 years | 0 (0.0%) | 0.0 |
| 20 to 34 years | 114 (100.0%) | 219.0 |
| 35 to 50 years | 0 (0.0%) | 0.0 |
| Total | 114 (100.0%) | 99.0 |
Fertility by Age by Marriage Status in Silver Lake
66.7% of women with births (114) in Silver Lake are married. The highest percentage of unmarried women with births falls into 20 to 34 years age bracket with 33.3% of them unmarried at the time of birth, while the lowest percentage of unmarried women with births belong to 20 to 34 years age bracket with 33.3% of them unmarried.
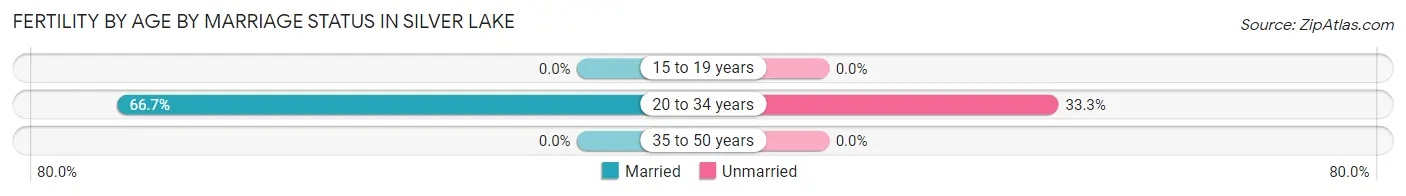
| Age Bracket | Married | Unmarried |
| 15 to 19 years | 0 (0.0%) | 0 (0.0%) |
| 20 to 34 years | 76 (66.7%) | 38 (33.3%) |
| 35 to 50 years | 0 (0.0%) | 0 (0.0%) |
| Total | 76 (66.7%) | 38 (33.3%) |
Fertility by Education in Silver Lake
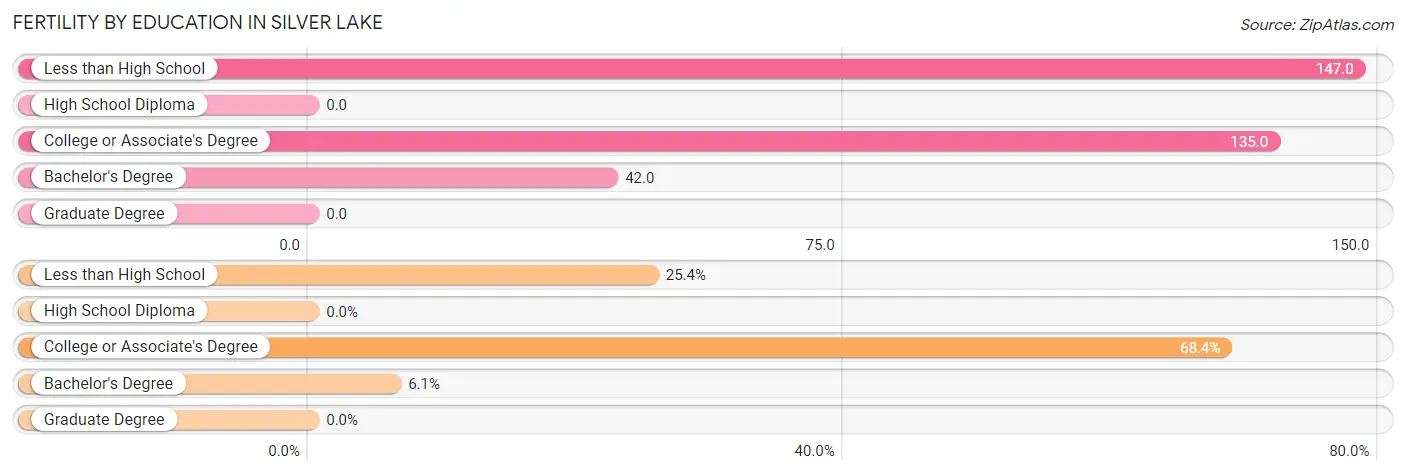
| Educational Attainment | Women with Births | Births / 1,000 Women |
| Less than High School | 29 (25.4%) | 147.0 |
| High School Diploma | 0 (0.0%) | 0.0 |
| College or Associate's Degree | 78 (68.4%) | 135.0 |
| Bachelor's Degree | 7 (6.1%) | 42.0 |
| Graduate Degree | 0 (0.0%) | 0.0 |
| Total | 114 (100.0%) | 99.0 |
Fertility by Education by Marriage Status in Silver Lake
33.3% of women with births in Silver Lake are unmarried. Women with the educational attainment of bachelor's degree are most likely to be married with 100.0% of them married at childbirth, while women with the educational attainment of less than high school are least likely to be married with 100.0% of them unmarried at childbirth.
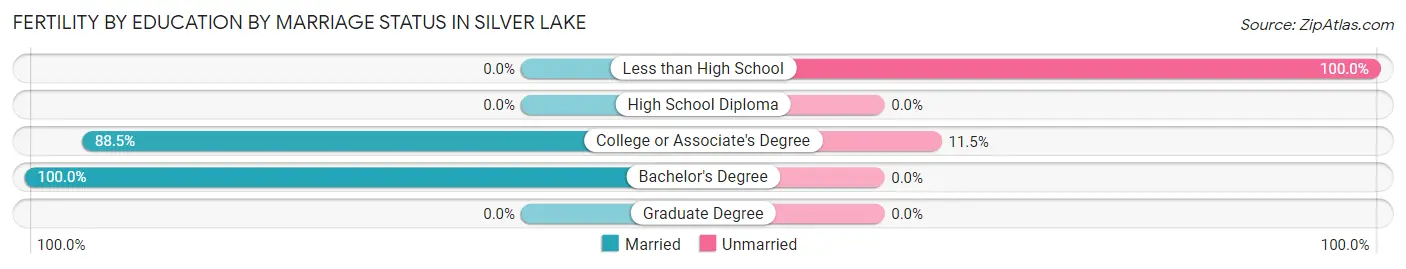
| Educational Attainment | Married | Unmarried |
| Less than High School | 0 (0.0%) | 29 (100.0%) |
| High School Diploma | 0 (0.0%) | 0 (0.0%) |
| College or Associate's Degree | 69 (88.5%) | 9 (11.5%) |
| Bachelor's Degree | 7 (100.0%) | 0 (0.0%) |
| Graduate Degree | 0 (0.0%) | 0 (0.0%) |
| Total | 76 (66.7%) | 38 (33.3%) |
Employment Characteristics in Silver Lake
Employment by Class of Employer in Silver Lake
Among the 3,131 employed individuals in Silver Lake, private company employees (1,950 | 62.3%), self-employed (incorporated) (288 | 9.2%), and local government employees (275 | 8.8%) make up the most common classes of employment.
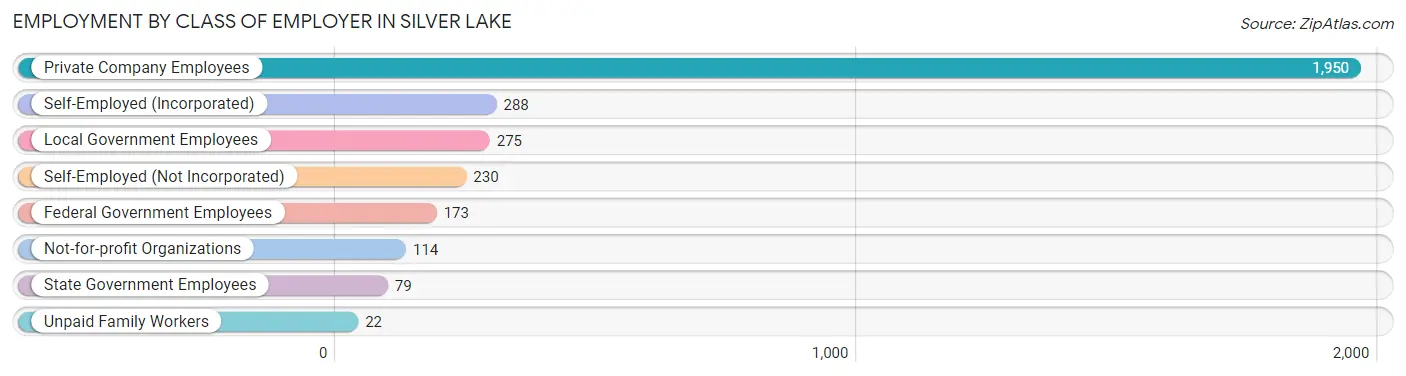
| Employer Class | # Employees | % Employees |
| Private Company Employees | 1,950 | 62.3% |
| Self-Employed (Incorporated) | 288 | 9.2% |
| Self-Employed (Not Incorporated) | 230 | 7.3% |
| Not-for-profit Organizations | 114 | 3.6% |
| Local Government Employees | 275 | 8.8% |
| State Government Employees | 79 | 2.5% |
| Federal Government Employees | 173 | 5.5% |
| Unpaid Family Workers | 22 | 0.7% |
| Total | 3,131 | 100.0% |
Employment Status by Age in Silver Lake
According to the labor force statistics for Silver Lake, out of the total population over 16 years of age (4,766), 68.0% or 3,241 individuals are in the labor force, with 3.4% or 110 of them unemployed. The age group with the highest labor force participation rate is 45 to 54 years, with 97.8% or 895 individuals in the labor force. Within the labor force, the 16 to 19 years age range has the highest percentage of unemployed individuals, with 30.6% or 30 of them being unemployed.
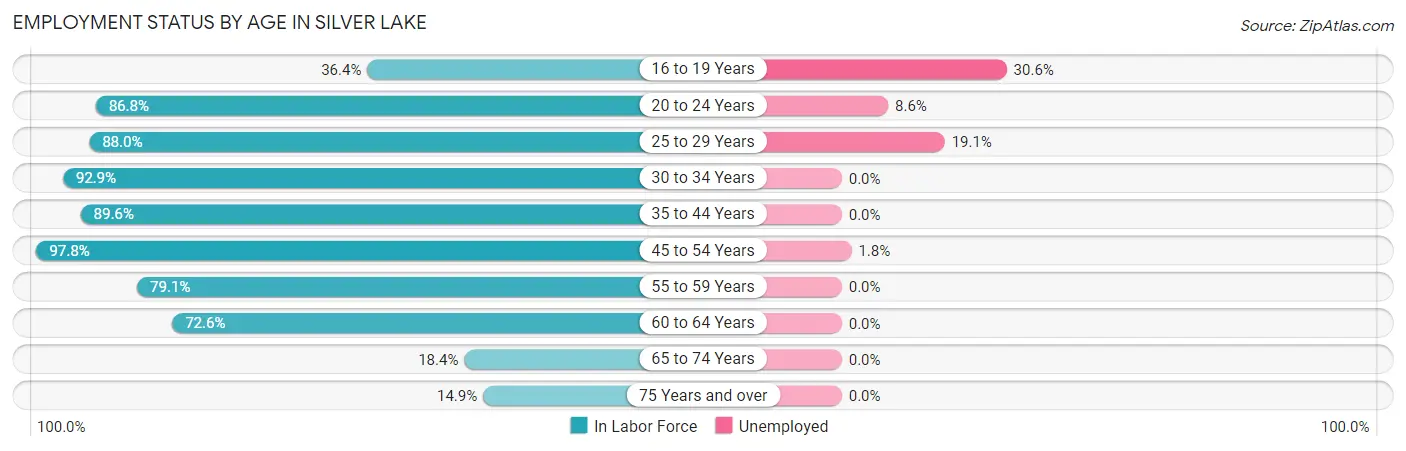
| Age Bracket | In Labor Force | Unemployed |
| 16 to 19 Years | 98 (36.4%) | 30 (30.6%) |
| 20 to 24 Years | 198 (86.8%) | 17 (8.6%) |
| 25 to 29 Years | 241 (88.0%) | 46 (19.1%) |
| 30 to 34 Years | 487 (92.9%) | 0 (0.0%) |
| 35 to 44 Years | 551 (89.6%) | 0 (0.0%) |
| 45 to 54 Years | 895 (97.8%) | 16 (1.8%) |
| 55 to 59 Years | 463 (79.1%) | 0 (0.0%) |
| 60 to 64 Years | 90 (72.6%) | 0 (0.0%) |
| 65 to 74 Years | 174 (18.4%) | 0 (0.0%) |
| 75 Years and over | 43 (14.9%) | 0 (0.0%) |
| Total | 3,241 (68.0%) | 110 (3.4%) |
Employment Status by Educational Attainment in Silver Lake
According to labor force statistics for Silver Lake, 89.8% of individuals (2,727) out of the total population between 25 and 64 years of age (3,037) are in the labor force, with 2.3% or 63 of them being unemployed. The group with the highest labor force participation rate are those with the educational attainment of bachelor's degree or higher, with 91.6% or 940 individuals in the labor force. Within the labor force, individuals with high school diploma education have the highest percentage of unemployment, with 16.5% or 46 of them being unemployed.
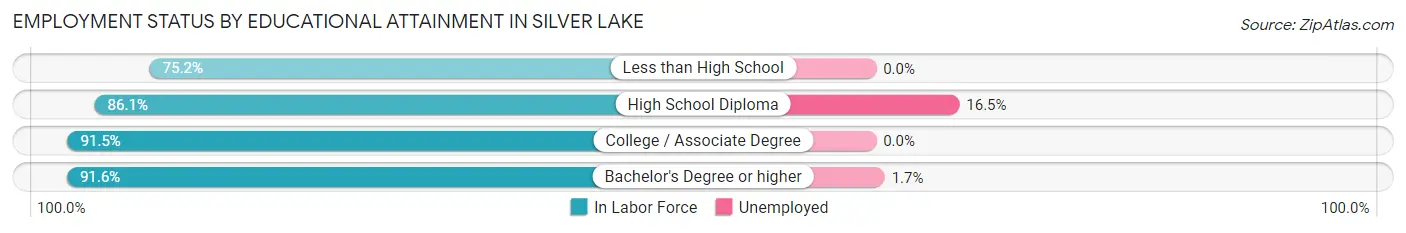
| Educational Attainment | In Labor Force | Unemployed |
| Less than High School | 167 (75.2%) | 0 (0.0%) |
| High School Diploma | 279 (86.1%) | 53 (16.5%) |
| College / Associate Degree | 1,340 (91.5%) | 0 (0.0%) |
| Bachelor's Degree or higher | 940 (91.6%) | 17 (1.7%) |
| Total | 2,727 (89.8%) | 70 (2.3%) |
Employment Occupations by Sex in Silver Lake
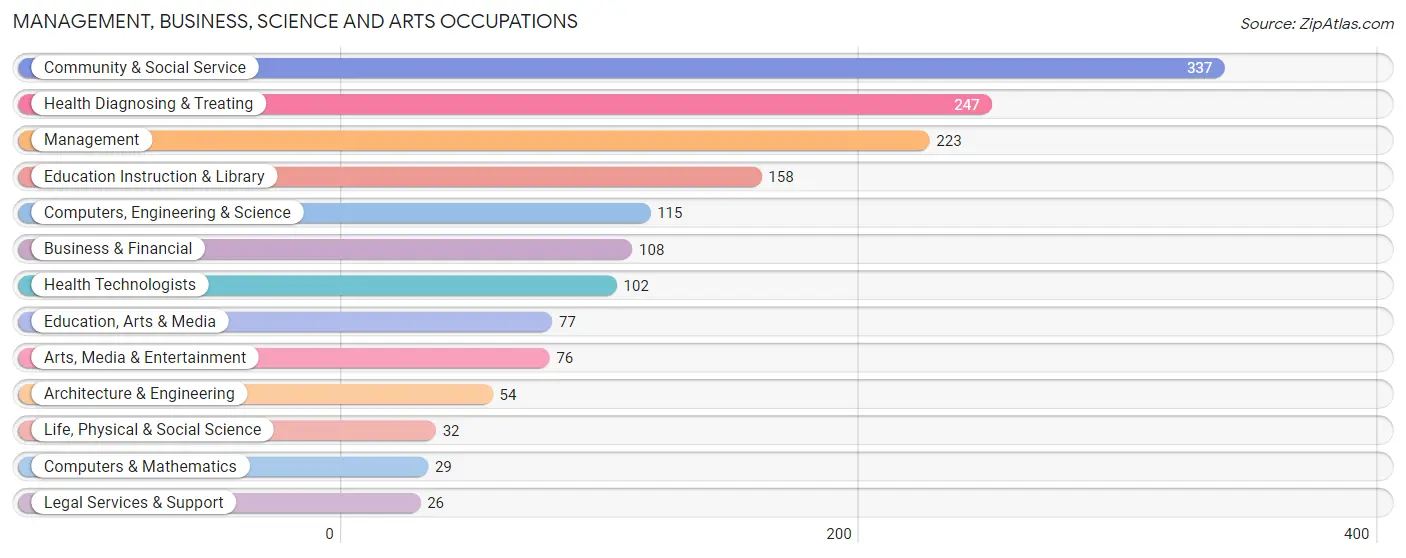
Management, Business, Science and Arts Occupations
The most common Management, Business, Science and Arts occupations in Silver Lake are Community & Social Service (337 | 10.8%), Health Diagnosing & Treating (247 | 7.9%), Management (223 | 7.1%), Education Instruction & Library (158 | 5.1%), and Computers, Engineering & Science (115 | 3.7%).
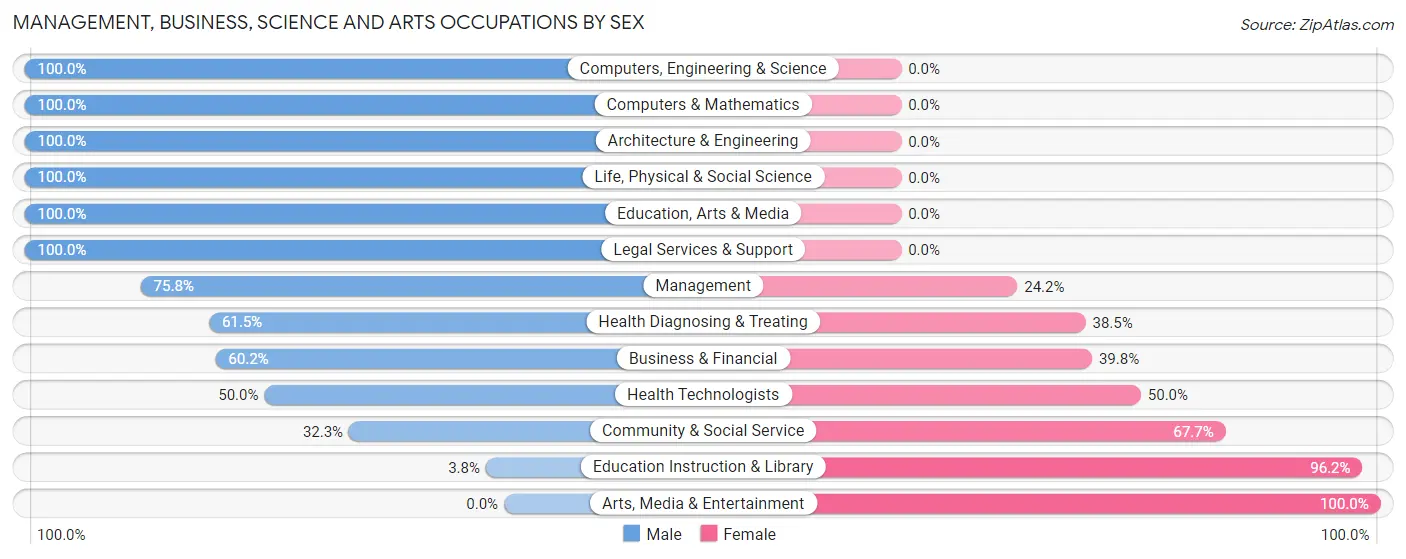
Management, Business, Science and Arts Occupations by Sex
Within the Management, Business, Science and Arts occupations in Silver Lake, the most male-oriented occupations are Computers, Engineering & Science (100.0%), Computers & Mathematics (100.0%), and Architecture & Engineering (100.0%), while the most female-oriented occupations are Arts, Media & Entertainment (100.0%), Education Instruction & Library (96.2%), and Community & Social Service (67.7%).
| Occupation | Male | Female |
| Management | 169 (75.8%) | 54 (24.2%) |
| Business & Financial | 65 (60.2%) | 43 (39.8%) |
| Computers, Engineering & Science | 115 (100.0%) | 0 (0.0%) |
| Computers & Mathematics | 29 (100.0%) | 0 (0.0%) |
| Architecture & Engineering | 54 (100.0%) | 0 (0.0%) |
| Life, Physical & Social Science | 32 (100.0%) | 0 (0.0%) |
| Community & Social Service | 109 (32.3%) | 228 (67.7%) |
| Education, Arts & Media | 77 (100.0%) | 0 (0.0%) |
| Legal Services & Support | 26 (100.0%) | 0 (0.0%) |
| Education Instruction & Library | 6 (3.8%) | 152 (96.2%) |
| Arts, Media & Entertainment | 0 (0.0%) | 76 (100.0%) |
| Health Diagnosing & Treating | 152 (61.5%) | 95 (38.5%) |
| Health Technologists | 51 (50.0%) | 51 (50.0%) |
| Total (Category) | 610 (59.2%) | 420 (40.8%) |
| Total (Overall) | 1,968 (62.9%) | 1,163 (37.1%) |
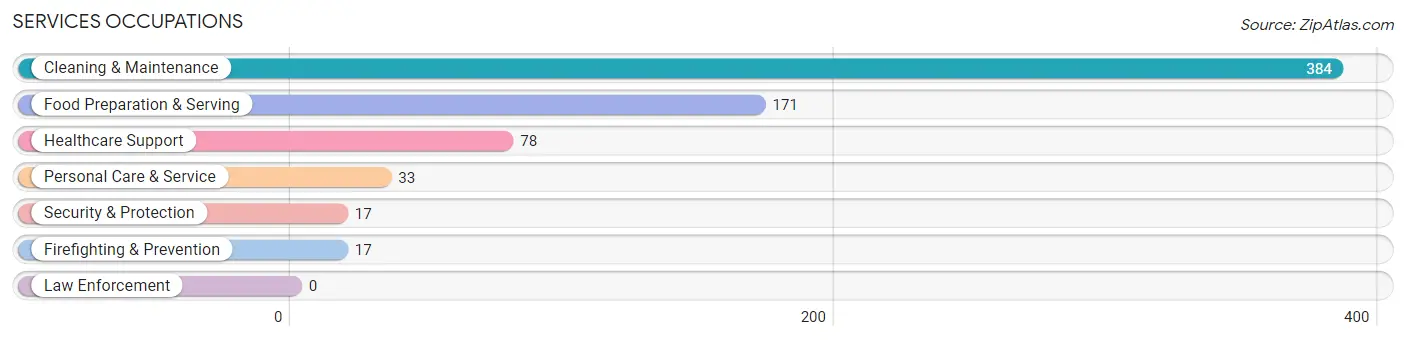
Services Occupations
The most common Services occupations in Silver Lake are Cleaning & Maintenance (384 | 12.3%), Food Preparation & Serving (171 | 5.5%), Healthcare Support (78 | 2.5%), Personal Care & Service (33 | 1.1%), and Security & Protection (17 | 0.5%).
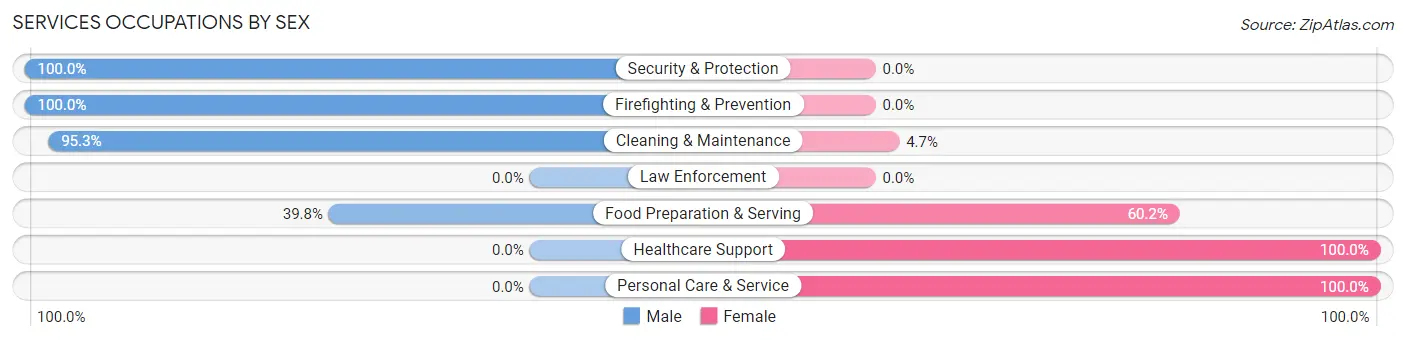
Services Occupations by Sex
Within the Services occupations in Silver Lake, the most male-oriented occupations are Security & Protection (100.0%), Firefighting & Prevention (100.0%), and Cleaning & Maintenance (95.3%), while the most female-oriented occupations are Healthcare Support (100.0%), Personal Care & Service (100.0%), and Food Preparation & Serving (60.2%).
| Occupation | Male | Female |
| Healthcare Support | 0 (0.0%) | 78 (100.0%) |
| Security & Protection | 17 (100.0%) | 0 (0.0%) |
| Firefighting & Prevention | 17 (100.0%) | 0 (0.0%) |
| Law Enforcement | 0 (0.0%) | 0 (0.0%) |
| Food Preparation & Serving | 68 (39.8%) | 103 (60.2%) |
| Cleaning & Maintenance | 366 (95.3%) | 18 (4.7%) |
| Personal Care & Service | 0 (0.0%) | 33 (100.0%) |
| Total (Category) | 451 (66.0%) | 232 (34.0%) |
| Total (Overall) | 1,968 (62.9%) | 1,163 (37.1%) |
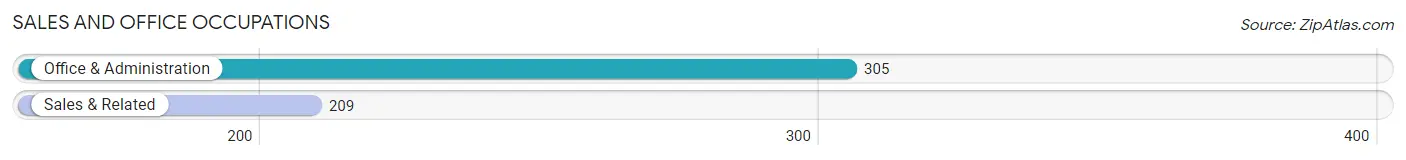
Sales and Office Occupations
The most common Sales and Office occupations in Silver Lake are Office & Administration (305 | 9.7%), and Sales & Related (209 | 6.7%).
Sales and Office Occupations by Sex
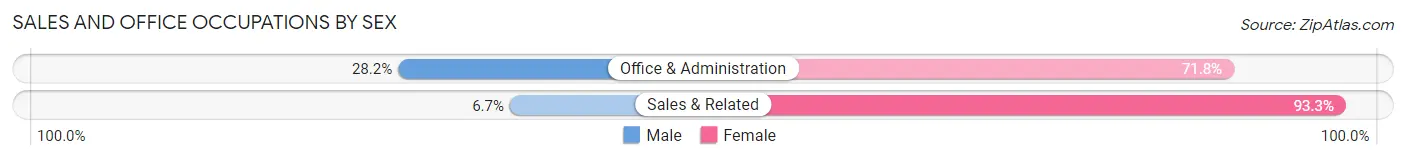
| Occupation | Male | Female |
| Sales & Related | 14 (6.7%) | 195 (93.3%) |
| Office & Administration | 86 (28.2%) | 219 (71.8%) |
| Total (Category) | 100 (19.5%) | 414 (80.5%) |
| Total (Overall) | 1,968 (62.9%) | 1,163 (37.1%) |
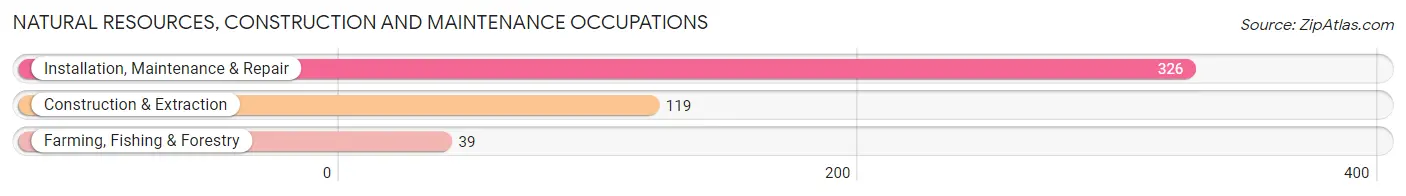
Natural Resources, Construction and Maintenance Occupations
The most common Natural Resources, Construction and Maintenance occupations in Silver Lake are Installation, Maintenance & Repair (326 | 10.4%), Construction & Extraction (119 | 3.8%), and Farming, Fishing & Forestry (39 | 1.3%).
Natural Resources, Construction and Maintenance Occupations by Sex
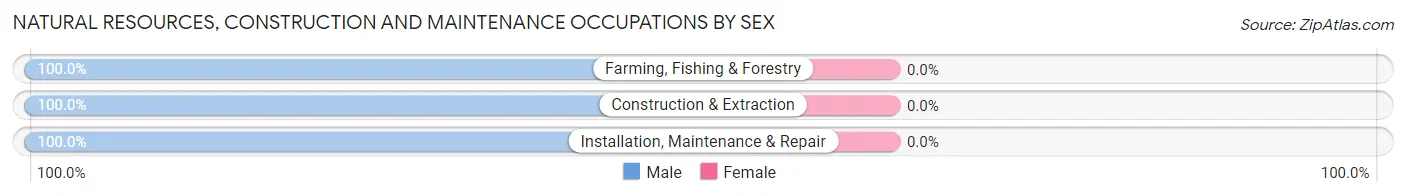
| Occupation | Male | Female |
| Farming, Fishing & Forestry | 39 (100.0%) | 0 (0.0%) |
| Construction & Extraction | 119 (100.0%) | 0 (0.0%) |
| Installation, Maintenance & Repair | 326 (100.0%) | 0 (0.0%) |
| Total (Category) | 484 (100.0%) | 0 (0.0%) |
| Total (Overall) | 1,968 (62.9%) | 1,163 (37.1%) |
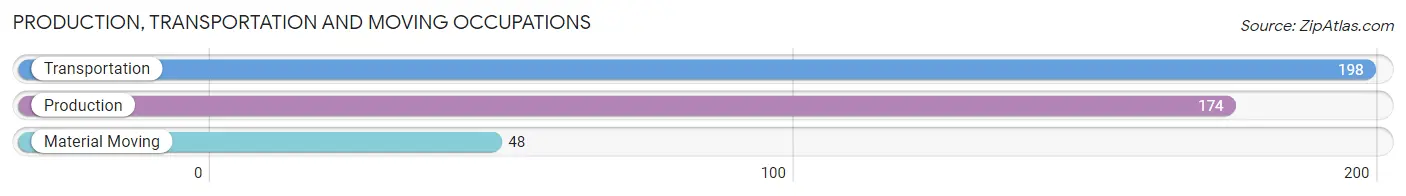
Production, Transportation and Moving Occupations
The most common Production, Transportation and Moving occupations in Silver Lake are Transportation (198 | 6.3%), Production (174 | 5.6%), and Material Moving (48 | 1.5%).
Production, Transportation and Moving Occupations by Sex
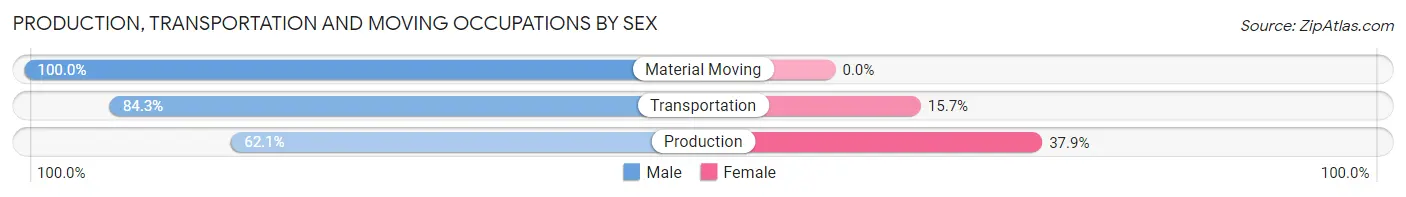
| Occupation | Male | Female |
| Production | 108 (62.1%) | 66 (37.9%) |
| Transportation | 167 (84.3%) | 31 (15.7%) |
| Material Moving | 48 (100.0%) | 0 (0.0%) |
| Total (Category) | 323 (76.9%) | 97 (23.1%) |
| Total (Overall) | 1,968 (62.9%) | 1,163 (37.1%) |
Employment Industries by Sex in Silver Lake
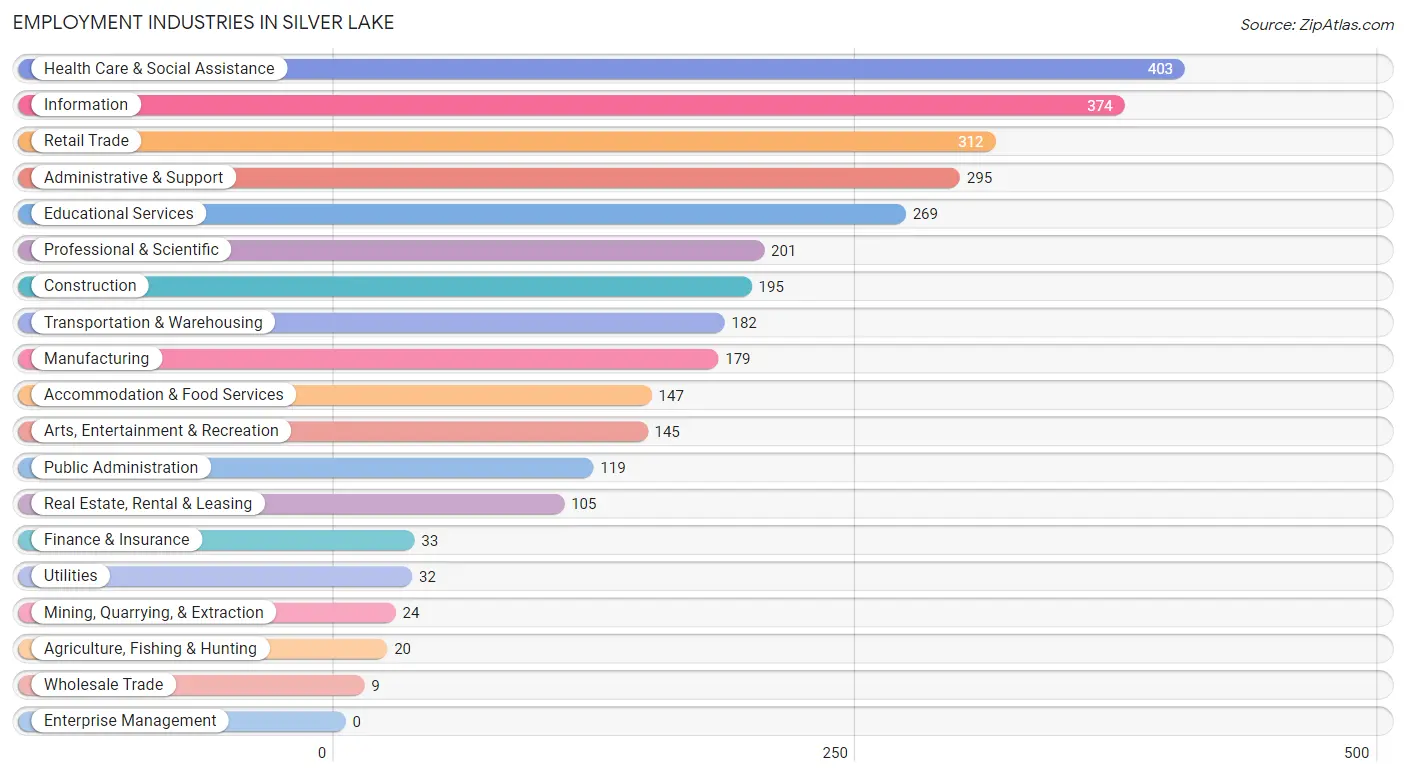
Employment Industries in Silver Lake
The major employment industries in Silver Lake include Health Care & Social Assistance (403 | 12.9%), Information (374 | 11.9%), Retail Trade (312 | 10.0%), Administrative & Support (295 | 9.4%), and Educational Services (269 | 8.6%).
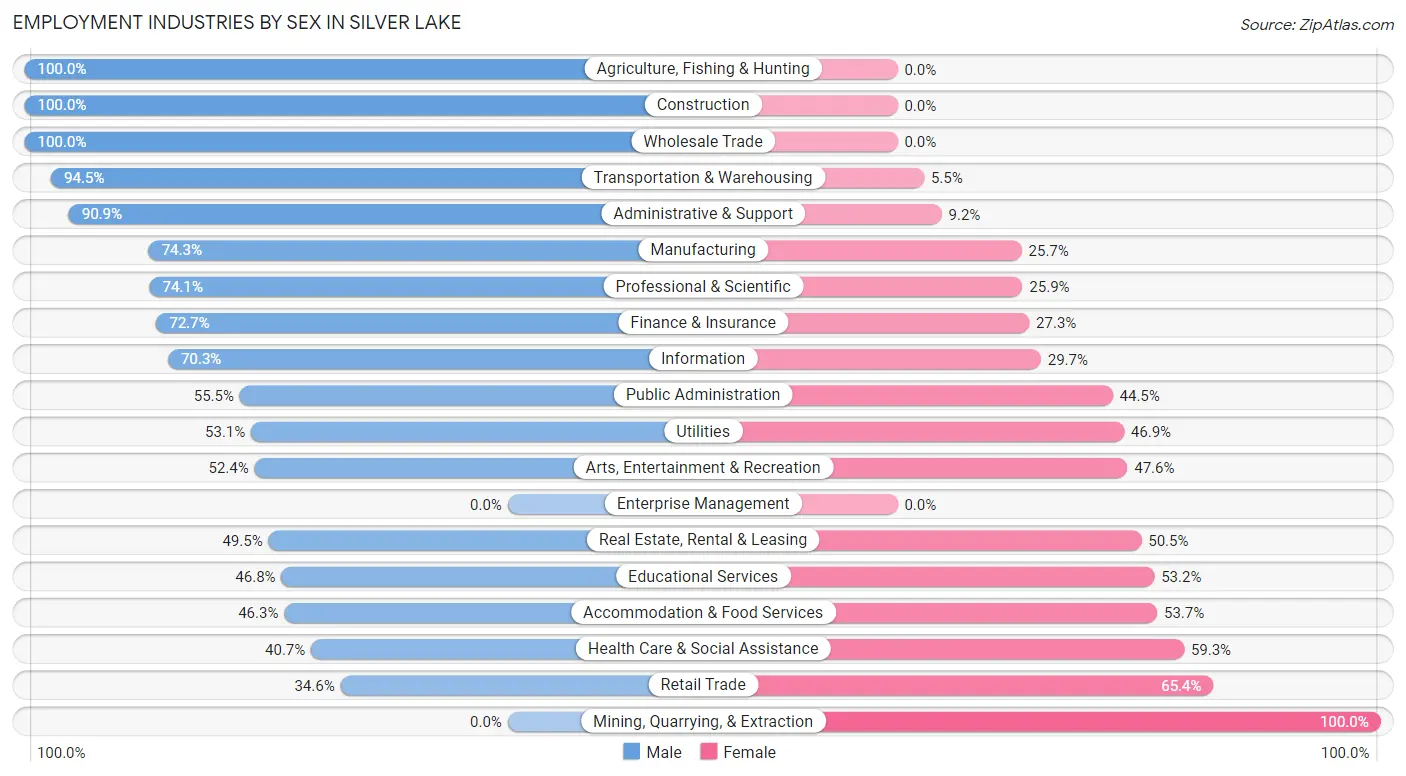
Employment Industries by Sex in Silver Lake
The Silver Lake industries that see more men than women are Agriculture, Fishing & Hunting (100.0%), Construction (100.0%), and Wholesale Trade (100.0%), whereas the industries that tend to have a higher number of women are Mining, Quarrying, & Extraction (100.0%), Retail Trade (65.4%), and Health Care & Social Assistance (59.3%).
| Industry | Male | Female |
| Agriculture, Fishing & Hunting | 20 (100.0%) | 0 (0.0%) |
| Mining, Quarrying, & Extraction | 0 (0.0%) | 24 (100.0%) |
| Construction | 195 (100.0%) | 0 (0.0%) |
| Manufacturing | 133 (74.3%) | 46 (25.7%) |
| Wholesale Trade | 9 (100.0%) | 0 (0.0%) |
| Retail Trade | 108 (34.6%) | 204 (65.4%) |
| Transportation & Warehousing | 172 (94.5%) | 10 (5.5%) |
| Utilities | 17 (53.1%) | 15 (46.9%) |
| Information | 263 (70.3%) | 111 (29.7%) |
| Finance & Insurance | 24 (72.7%) | 9 (27.3%) |
| Real Estate, Rental & Leasing | 52 (49.5%) | 53 (50.5%) |
| Professional & Scientific | 149 (74.1%) | 52 (25.9%) |
| Enterprise Management | 0 (0.0%) | 0 (0.0%) |
| Administrative & Support | 268 (90.8%) | 27 (9.1%) |
| Educational Services | 126 (46.8%) | 143 (53.2%) |
| Health Care & Social Assistance | 164 (40.7%) | 239 (59.3%) |
| Arts, Entertainment & Recreation | 76 (52.4%) | 69 (47.6%) |
| Accommodation & Food Services | 68 (46.3%) | 79 (53.7%) |
| Public Administration | 66 (55.5%) | 53 (44.5%) |
| Total | 1,968 (62.9%) | 1,163 (37.1%) |
Education in Silver Lake
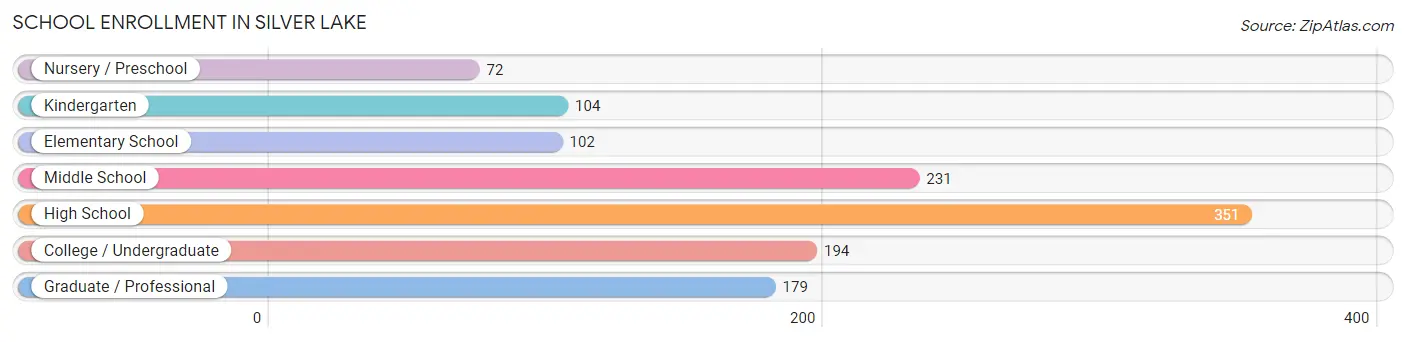
School Enrollment in Silver Lake
The most common levels of schooling among the 1,233 students in Silver Lake are high school (351 | 28.5%), middle school (231 | 18.7%), and college / undergraduate (194 | 15.7%).
| School Level | # Students | % Students |
| Nursery / Preschool | 72 | 5.8% |
| Kindergarten | 104 | 8.4% |
| Elementary School | 102 | 8.3% |
| Middle School | 231 | 18.7% |
| High School | 351 | 28.5% |
| College / Undergraduate | 194 | 15.7% |
| Graduate / Professional | 179 | 14.5% |
| Total | 1,233 | 100.0% |
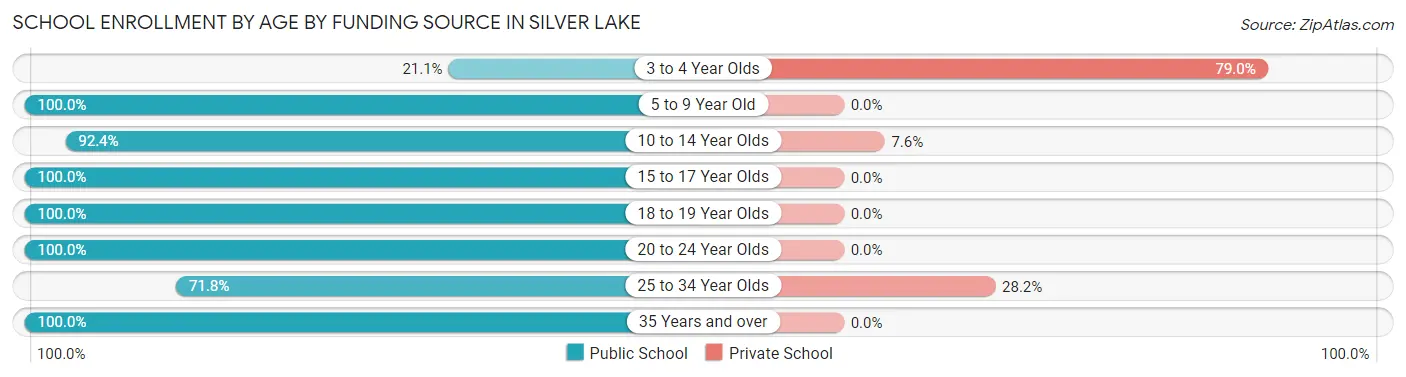
School Enrollment by Age by Funding Source in Silver Lake
Out of a total of 1,233 students who are enrolled in schools in Silver Lake, 116 (9.4%) attend a private institution, while the remaining 1,117 (90.6%) are enrolled in public schools. The age group of 3 to 4 year olds has the highest likelihood of being enrolled in private schools, with 75 (78.9% in the age bracket) enrolled. Conversely, the age group of 5 to 9 year old has the lowest likelihood of being enrolled in a private school, with 183 (100.0% in the age bracket) attending a public institution.
| Age Bracket | Public School | Private School |
| 3 to 4 Year Olds | 20 (21.0%) | 75 (78.9%) |
| 5 to 9 Year Old | 183 (100.0%) | 0 (0.0%) |
| 10 to 14 Year Olds | 231 (92.4%) | 19 (7.6%) |
| 15 to 17 Year Olds | 180 (100.0%) | 0 (0.0%) |
| 18 to 19 Year Olds | 152 (100.0%) | 0 (0.0%) |
| 20 to 24 Year Olds | 149 (100.0%) | 0 (0.0%) |
| 25 to 34 Year Olds | 56 (71.8%) | 22 (28.2%) |
| 35 Years and over | 146 (100.0%) | 0 (0.0%) |
| Total | 1,117 (90.6%) | 116 (9.4%) |
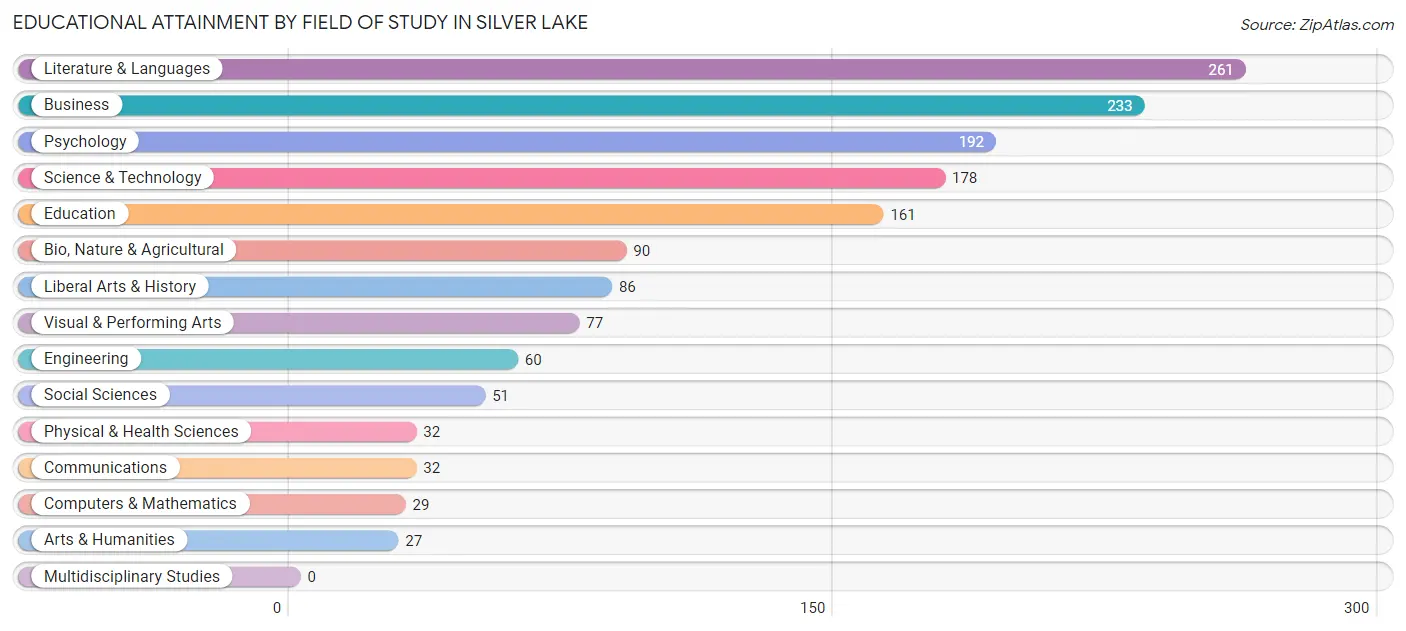
Educational Attainment by Field of Study in Silver Lake
Literature & languages (261 | 17.3%), business (233 | 15.4%), psychology (192 | 12.7%), science & technology (178 | 11.8%), and education (161 | 10.7%) are the most common fields of study among 1,509 individuals in Silver Lake who have obtained a bachelor's degree or higher.
| Field of Study | # Graduates | % Graduates |
| Computers & Mathematics | 29 | 1.9% |
| Bio, Nature & Agricultural | 90 | 6.0% |
| Physical & Health Sciences | 32 | 2.1% |
| Psychology | 192 | 12.7% |
| Social Sciences | 51 | 3.4% |
| Engineering | 60 | 4.0% |
| Multidisciplinary Studies | 0 | 0.0% |
| Science & Technology | 178 | 11.8% |
| Business | 233 | 15.4% |
| Education | 161 | 10.7% |
| Literature & Languages | 261 | 17.3% |
| Liberal Arts & History | 86 | 5.7% |
| Visual & Performing Arts | 77 | 5.1% |
| Communications | 32 | 2.1% |
| Arts & Humanities | 27 | 1.8% |
| Total | 1,509 | 100.0% |
Transportation & Commute in Silver Lake
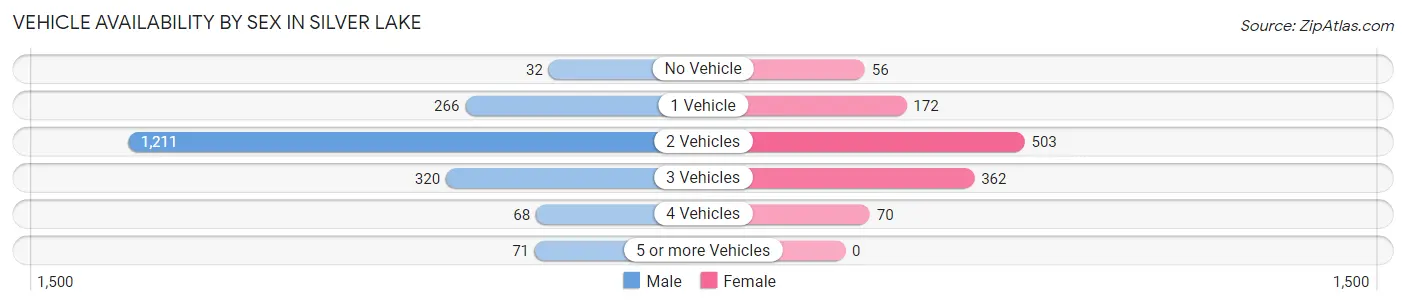
Vehicle Availability by Sex in Silver Lake
The most prevalent vehicle ownership categories in Silver Lake are males with 2 vehicles (1,211, accounting for 61.5%) and females with 2 vehicles (503, making up 104.1%).
| Vehicles Available | Male | Female |
| No Vehicle | 32 (1.6%) | 56 (4.8%) |
| 1 Vehicle | 266 (13.5%) | 172 (14.8%) |
| 2 Vehicles | 1,211 (61.5%) | 503 (43.2%) |
| 3 Vehicles | 320 (16.3%) | 362 (31.1%) |
| 4 Vehicles | 68 (3.5%) | 70 (6.0%) |
| 5 or more Vehicles | 71 (3.6%) | 0 (0.0%) |
| Total | 1,968 (100.0%) | 1,163 (100.0%) |
Commute Time in Silver Lake
The most frequently occuring commute durations in Silver Lake are 15 to 19 minutes (731 commuters, 25.2%), 20 to 24 minutes (539 commuters, 18.6%), and 30 to 34 minutes (475 commuters, 16.4%).
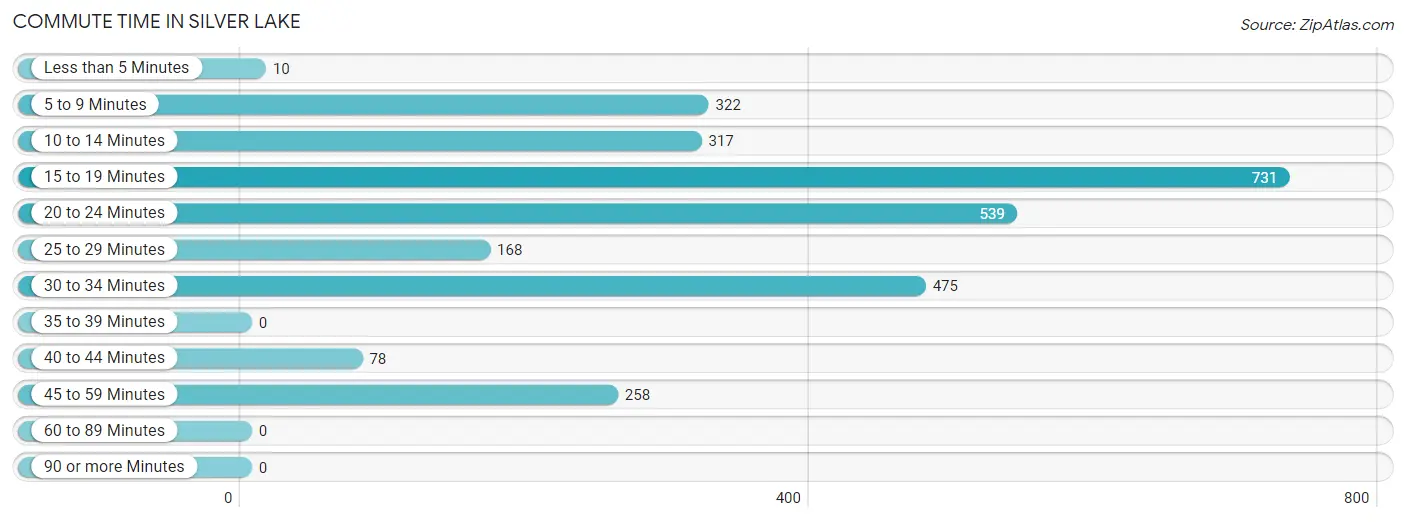
| Commute Time | # Commuters | % Commuters |
| Less than 5 Minutes | 10 | 0.4% |
| 5 to 9 Minutes | 322 | 11.1% |
| 10 to 14 Minutes | 317 | 10.9% |
| 15 to 19 Minutes | 731 | 25.2% |
| 20 to 24 Minutes | 539 | 18.6% |
| 25 to 29 Minutes | 168 | 5.8% |
| 30 to 34 Minutes | 475 | 16.4% |
| 35 to 39 Minutes | 0 | 0.0% |
| 40 to 44 Minutes | 78 | 2.7% |
| 45 to 59 Minutes | 258 | 8.9% |
| 60 to 89 Minutes | 0 | 0.0% |
| 90 or more Minutes | 0 | 0.0% |
Commute Time by Sex in Silver Lake
The most common commute times in Silver Lake are 15 to 19 minutes (401 commuters, 21.7%) for males and 15 to 19 minutes (330 commuters, 31.4%) for females.
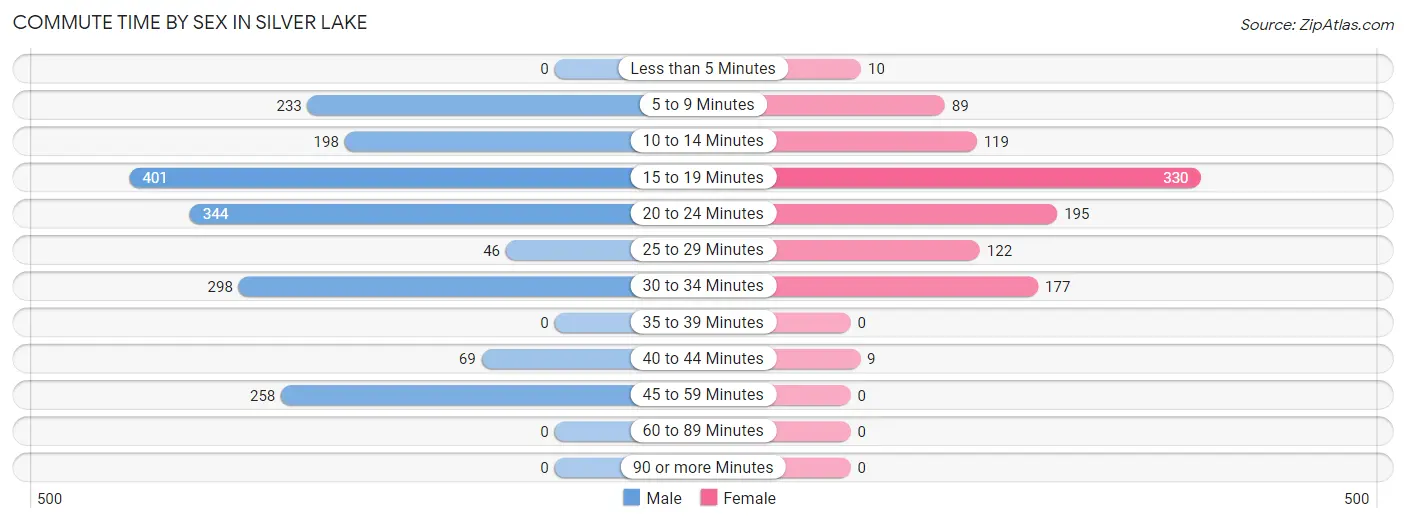
| Commute Time | Male | Female |
| Less than 5 Minutes | 0 (0.0%) | 10 (0.9%) |
| 5 to 9 Minutes | 233 (12.6%) | 89 (8.5%) |
| 10 to 14 Minutes | 198 (10.7%) | 119 (11.3%) |
| 15 to 19 Minutes | 401 (21.7%) | 330 (31.4%) |
| 20 to 24 Minutes | 344 (18.6%) | 195 (18.5%) |
| 25 to 29 Minutes | 46 (2.5%) | 122 (11.6%) |
| 30 to 34 Minutes | 298 (16.1%) | 177 (16.8%) |
| 35 to 39 Minutes | 0 (0.0%) | 0 (0.0%) |
| 40 to 44 Minutes | 69 (3.7%) | 9 (0.9%) |
| 45 to 59 Minutes | 258 (14.0%) | 0 (0.0%) |
| 60 to 89 Minutes | 0 (0.0%) | 0 (0.0%) |
| 90 or more Minutes | 0 (0.0%) | 0 (0.0%) |
Time of Departure to Work by Sex in Silver Lake
The most frequent times of departure to work in Silver Lake are 7:30 AM to 7:59 AM (925, 50.1%) for males and 12:00 PM to 3:59 PM (207, 19.7%) for females.
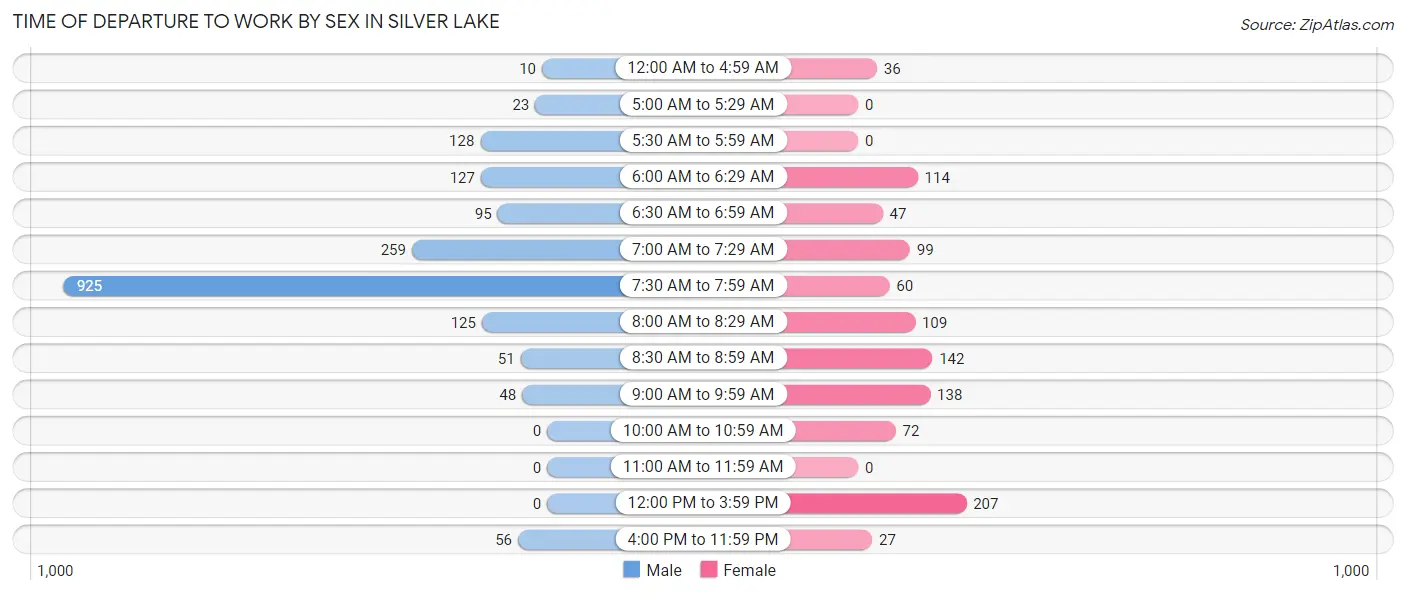
| Time of Departure | Male | Female |
| 12:00 AM to 4:59 AM | 10 (0.5%) | 36 (3.4%) |
| 5:00 AM to 5:29 AM | 23 (1.3%) | 0 (0.0%) |
| 5:30 AM to 5:59 AM | 128 (6.9%) | 0 (0.0%) |
| 6:00 AM to 6:29 AM | 127 (6.9%) | 114 (10.8%) |
| 6:30 AM to 6:59 AM | 95 (5.1%) | 47 (4.5%) |
| 7:00 AM to 7:29 AM | 259 (14.0%) | 99 (9.4%) |
| 7:30 AM to 7:59 AM | 925 (50.1%) | 60 (5.7%) |
| 8:00 AM to 8:29 AM | 125 (6.8%) | 109 (10.4%) |
| 8:30 AM to 8:59 AM | 51 (2.8%) | 142 (13.5%) |
| 9:00 AM to 9:59 AM | 48 (2.6%) | 138 (13.1%) |
| 10:00 AM to 10:59 AM | 0 (0.0%) | 72 (6.9%) |
| 11:00 AM to 11:59 AM | 0 (0.0%) | 0 (0.0%) |
| 12:00 PM to 3:59 PM | 0 (0.0%) | 207 (19.7%) |
| 4:00 PM to 11:59 PM | 56 (3.0%) | 27 (2.6%) |
| Total | 1,847 (100.0%) | 1,051 (100.0%) |
Housing Occupancy in Silver Lake
Occupancy by Ownership in Silver Lake
Of the total 2,543 dwellings in Silver Lake, owner-occupied units account for 2,091 (82.2%), while renter-occupied units make up 452 (17.8%).
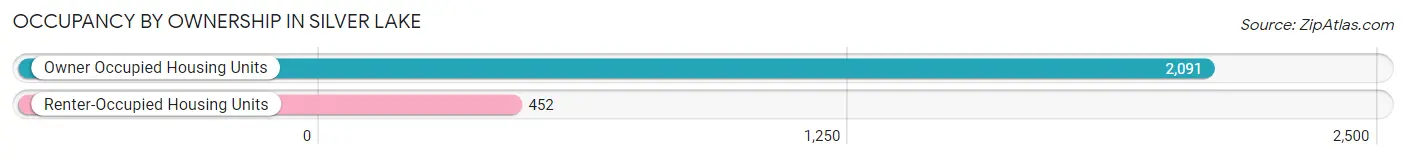
| Occupancy | # Housing Units | % Housing Units |
| Owner Occupied Housing Units | 2,091 | 82.2% |
| Renter-Occupied Housing Units | 452 | 17.8% |
| Total Occupied Housing Units | 2,543 | 100.0% |
Occupancy by Household Size in Silver Lake
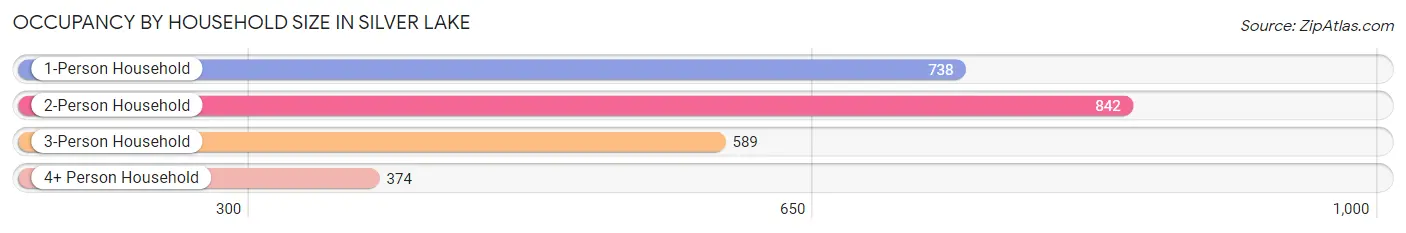
| Household Size | # Housing Units | % Housing Units |
| 1-Person Household | 738 | 29.0% |
| 2-Person Household | 842 | 33.1% |
| 3-Person Household | 589 | 23.2% |
| 4+ Person Household | 374 | 14.7% |
| Total Housing Units | 2,543 | 100.0% |
Occupancy by Ownership by Household Size in Silver Lake
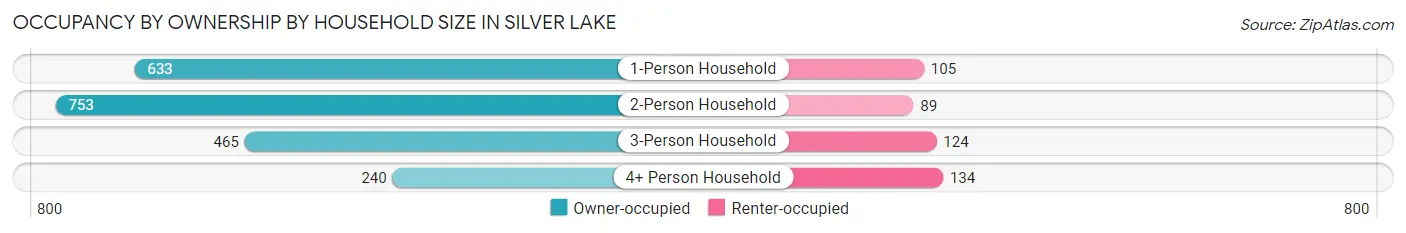
| Household Size | Owner-occupied | Renter-occupied |
| 1-Person Household | 633 (85.8%) | 105 (14.2%) |
| 2-Person Household | 753 (89.4%) | 89 (10.6%) |
| 3-Person Household | 465 (78.9%) | 124 (21.0%) |
| 4+ Person Household | 240 (64.2%) | 134 (35.8%) |
| Total Housing Units | 2,091 (82.2%) | 452 (17.8%) |
Occupancy by Educational Attainment in Silver Lake
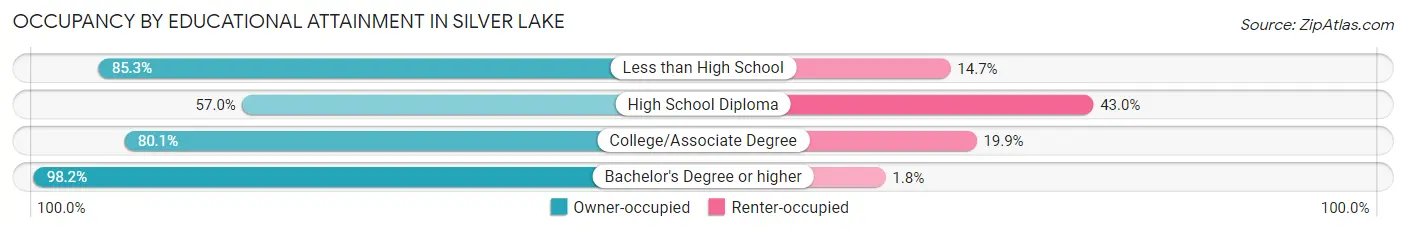
| Household Size | Owner-occupied | Renter-occupied |
| Less than High School | 168 (85.3%) | 29 (14.7%) |
| High School Diploma | 233 (57.0%) | 176 (43.0%) |
| College/Associate Degree | 939 (80.1%) | 233 (19.9%) |
| Bachelor's Degree or higher | 751 (98.2%) | 14 (1.8%) |
Occupancy by Age of Householder in Silver Lake
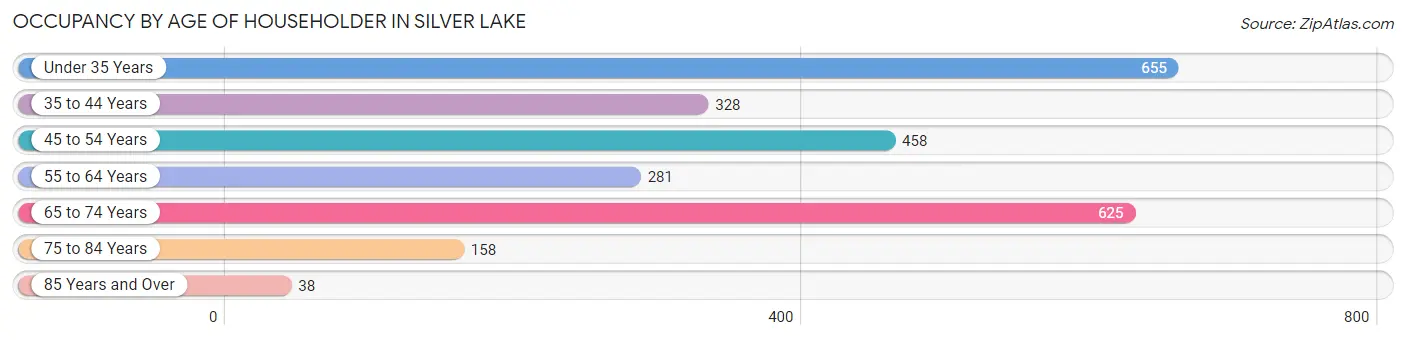
| Age Bracket | # Households | % Households |
| Under 35 Years | 655 | 25.8% |
| 35 to 44 Years | 328 | 12.9% |
| 45 to 54 Years | 458 | 18.0% |
| 55 to 64 Years | 281 | 11.1% |
| 65 to 74 Years | 625 | 24.6% |
| 75 to 84 Years | 158 | 6.2% |
| 85 Years and Over | 38 | 1.5% |
| Total | 2,543 | 100.0% |
Housing Finances in Silver Lake
Median Income by Occupancy in Silver Lake
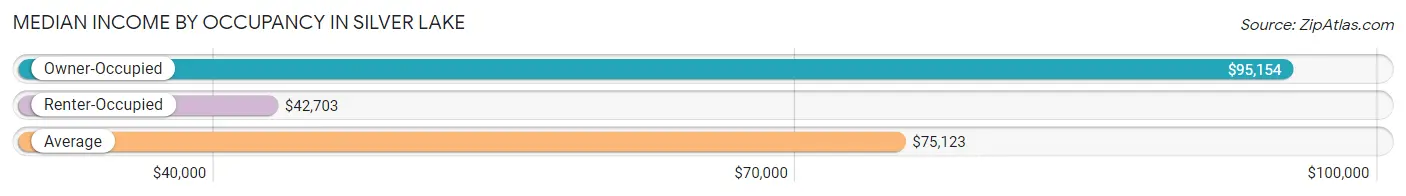
| Occupancy Type | # Households | Median Income |
| Owner-Occupied | 2,091 (82.2%) | $95,154 |
| Renter-Occupied | 452 (17.8%) | $42,703 |
| Average | 2,543 (100.0%) | $75,123 |
Occupancy by Householder Income Bracket in Silver Lake
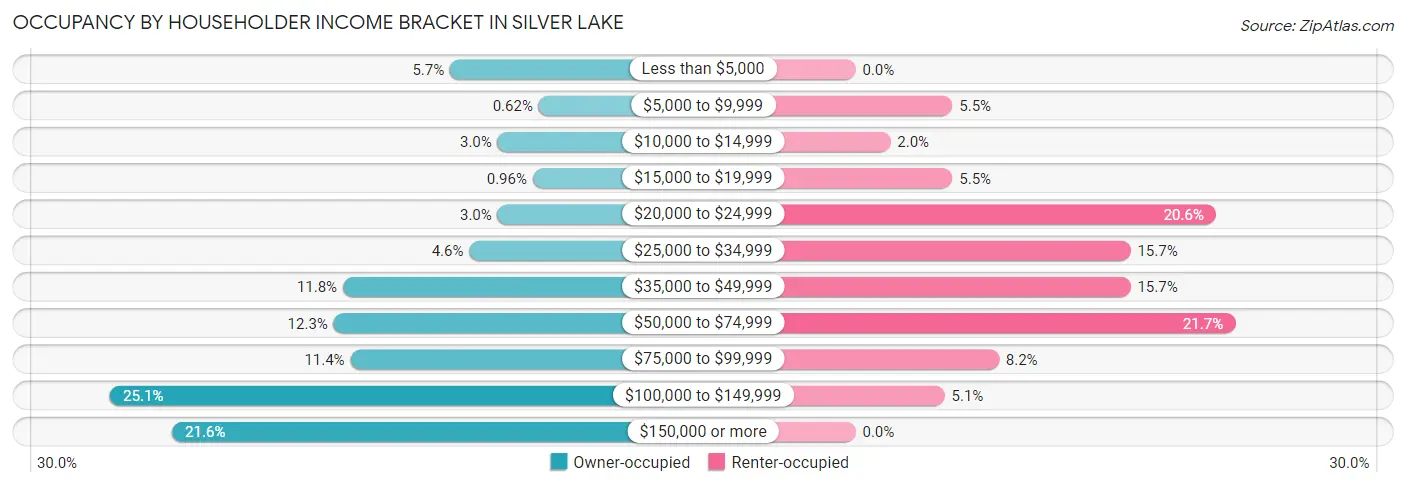
| Income Bracket | Owner-occupied | Renter-occupied |
| Less than $5,000 | 119 (5.7%) | 0 (0.0%) |
| $5,000 to $9,999 | 13 (0.6%) | 25 (5.5%) |
| $10,000 to $14,999 | 62 (3.0%) | 9 (2.0%) |
| $15,000 to $19,999 | 20 (1.0%) | 25 (5.5%) |
| $20,000 to $24,999 | 62 (3.0%) | 93 (20.6%) |
| $25,000 to $34,999 | 96 (4.6%) | 71 (15.7%) |
| $35,000 to $49,999 | 247 (11.8%) | 71 (15.7%) |
| $50,000 to $74,999 | 258 (12.3%) | 98 (21.7%) |
| $75,000 to $99,999 | 238 (11.4%) | 37 (8.2%) |
| $100,000 to $149,999 | 525 (25.1%) | 23 (5.1%) |
| $150,000 or more | 451 (21.6%) | 0 (0.0%) |
| Total | 2,091 (100.0%) | 452 (100.0%) |
Monthly Housing Cost Tiers in Silver Lake
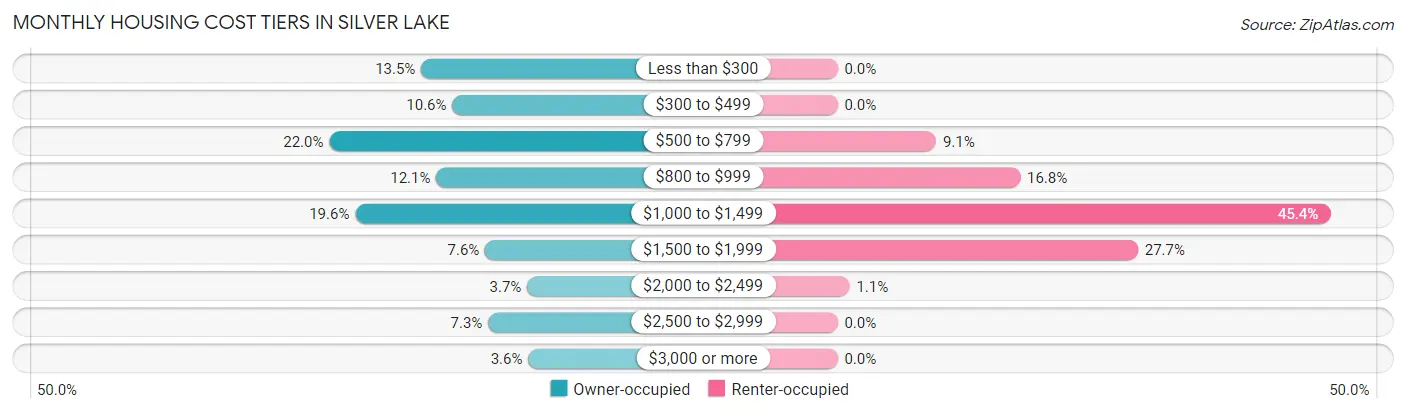
| Monthly Cost | Owner-occupied | Renter-occupied |
| Less than $300 | 282 (13.5%) | 0 (0.0%) |
| $300 to $499 | 222 (10.6%) | 0 (0.0%) |
| $500 to $799 | 459 (22.0%) | 41 (9.1%) |
| $800 to $999 | 253 (12.1%) | 76 (16.8%) |
| $1,000 to $1,499 | 409 (19.6%) | 205 (45.4%) |
| $1,500 to $1,999 | 159 (7.6%) | 125 (27.7%) |
| $2,000 to $2,499 | 78 (3.7%) | 5 (1.1%) |
| $2,500 to $2,999 | 153 (7.3%) | 0 (0.0%) |
| $3,000 or more | 76 (3.6%) | 0 (0.0%) |
| Total | 2,091 (100.0%) | 452 (100.0%) |
Physical Housing Characteristics in Silver Lake
Housing Structures in Silver Lake
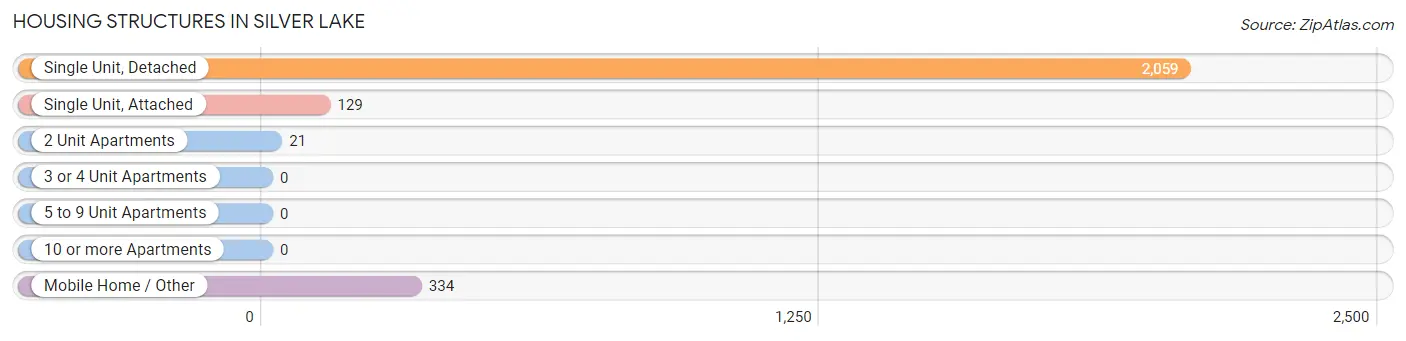
| Structure Type | # Housing Units | % Housing Units |
| Single Unit, Detached | 2,059 | 81.0% |
| Single Unit, Attached | 129 | 5.1% |
| 2 Unit Apartments | 21 | 0.8% |
| 3 or 4 Unit Apartments | 0 | 0.0% |
| 5 to 9 Unit Apartments | 0 | 0.0% |
| 10 or more Apartments | 0 | 0.0% |
| Mobile Home / Other | 334 | 13.1% |
| Total | 2,543 | 100.0% |
Housing Structures by Occupancy in Silver Lake
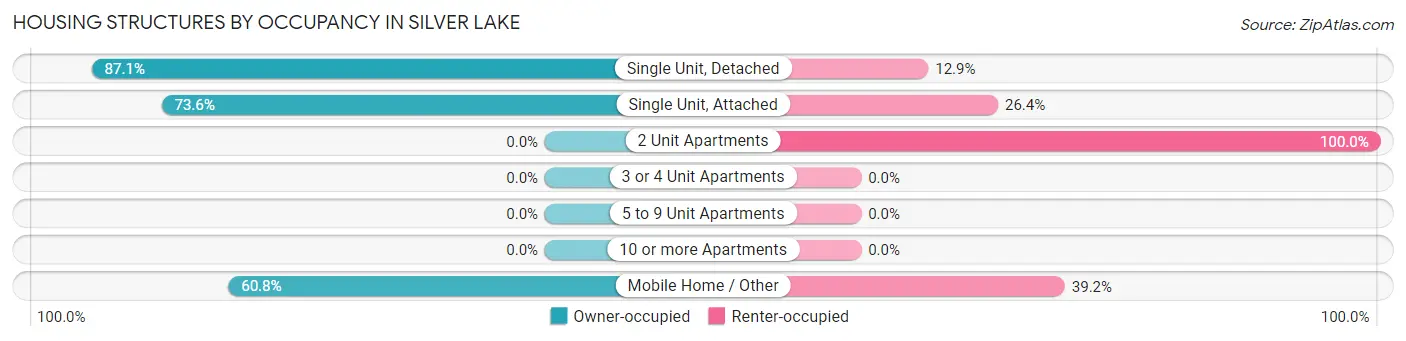
| Structure Type | Owner-occupied | Renter-occupied |
| Single Unit, Detached | 1,793 (87.1%) | 266 (12.9%) |
| Single Unit, Attached | 95 (73.6%) | 34 (26.4%) |
| 2 Unit Apartments | 0 (0.0%) | 21 (100.0%) |
| 3 or 4 Unit Apartments | 0 (0.0%) | 0 (0.0%) |
| 5 to 9 Unit Apartments | 0 (0.0%) | 0 (0.0%) |
| 10 or more Apartments | 0 (0.0%) | 0 (0.0%) |
| Mobile Home / Other | 203 (60.8%) | 131 (39.2%) |
| Total | 2,091 (82.2%) | 452 (17.8%) |
Housing Structures by Number of Rooms in Silver Lake
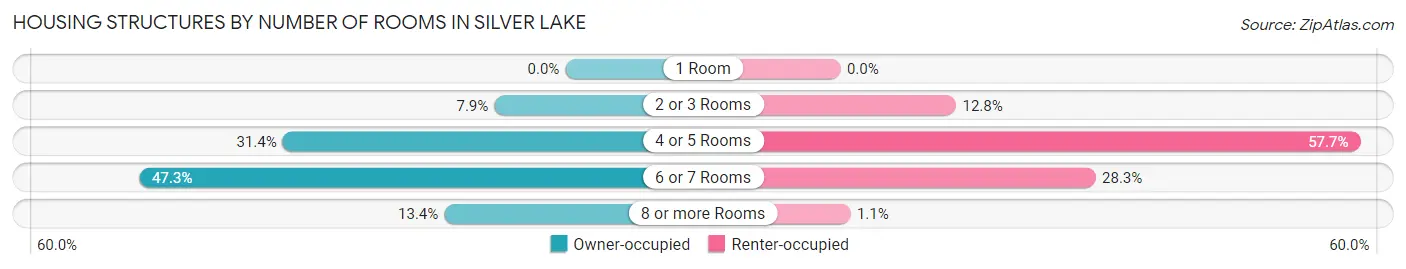
| Number of Rooms | Owner-occupied | Renter-occupied |
| 1 Room | 0 (0.0%) | 0 (0.0%) |
| 2 or 3 Rooms | 165 (7.9%) | 58 (12.8%) |
| 4 or 5 Rooms | 656 (31.4%) | 261 (57.7%) |
| 6 or 7 Rooms | 989 (47.3%) | 128 (28.3%) |
| 8 or more Rooms | 281 (13.4%) | 5 (1.1%) |
| Total | 2,091 (100.0%) | 452 (100.0%) |
Housing Structure by Heating Type in Silver Lake
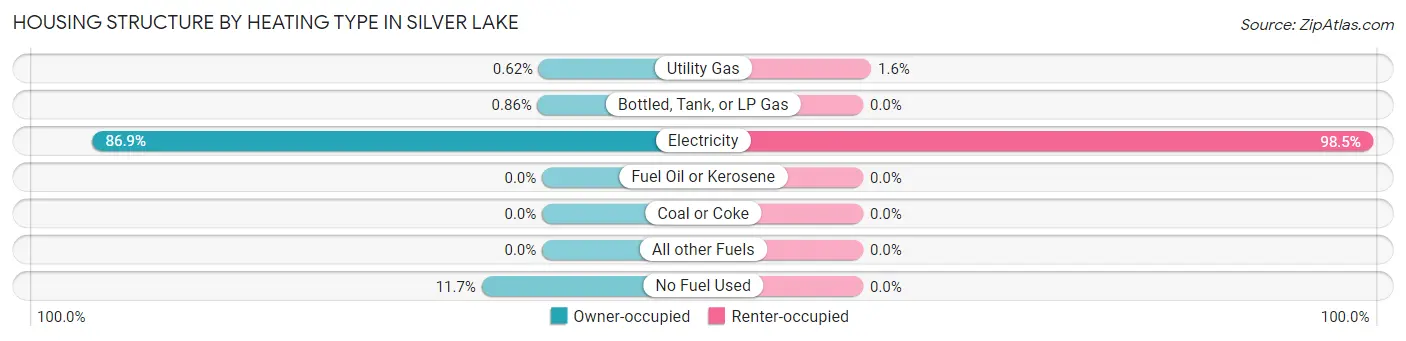
| Heating Type | Owner-occupied | Renter-occupied |
| Utility Gas | 13 (0.6%) | 7 (1.5%) |
| Bottled, Tank, or LP Gas | 18 (0.9%) | 0 (0.0%) |
| Electricity | 1,816 (86.9%) | 445 (98.5%) |
| Fuel Oil or Kerosene | 0 (0.0%) | 0 (0.0%) |
| Coal or Coke | 0 (0.0%) | 0 (0.0%) |
| All other Fuels | 0 (0.0%) | 0 (0.0%) |
| No Fuel Used | 244 (11.7%) | 0 (0.0%) |
| Total | 2,091 (100.0%) | 452 (100.0%) |
Household Vehicle Usage in Silver Lake
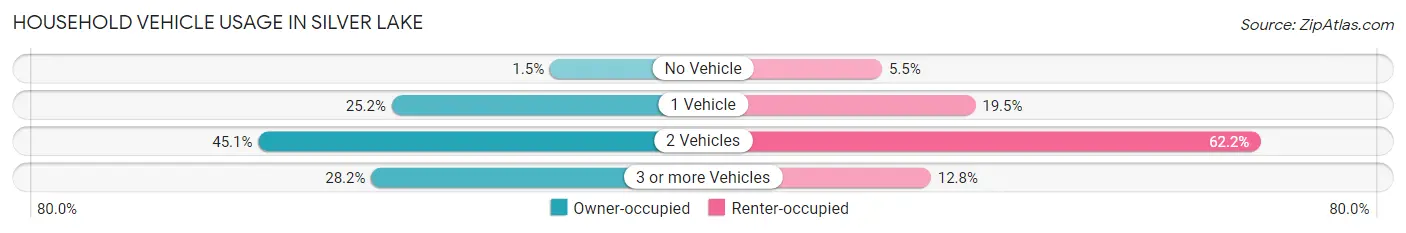
| Vehicles per Household | Owner-occupied | Renter-occupied |
| No Vehicle | 32 (1.5%) | 25 (5.5%) |
| 1 Vehicle | 526 (25.2%) | 88 (19.5%) |
| 2 Vehicles | 943 (45.1%) | 281 (62.2%) |
| 3 or more Vehicles | 590 (28.2%) | 58 (12.8%) |
| Total | 2,091 (100.0%) | 452 (100.0%) |
Real Estate & Mortgages in Silver Lake
Real Estate and Mortgage Overview in Silver Lake
| Characteristic | Without Mortgage | With Mortgage |
| Housing Units | 723 | 1,368 |
| Median Property Value | $228,800 | $261,300 |
| Median Household Income | $50,030 | $344 |
| Monthly Housing Costs | $568 | $76 |
| Real Estate Taxes | $1,705 | $0 |
Property Value by Mortgage Status in Silver Lake
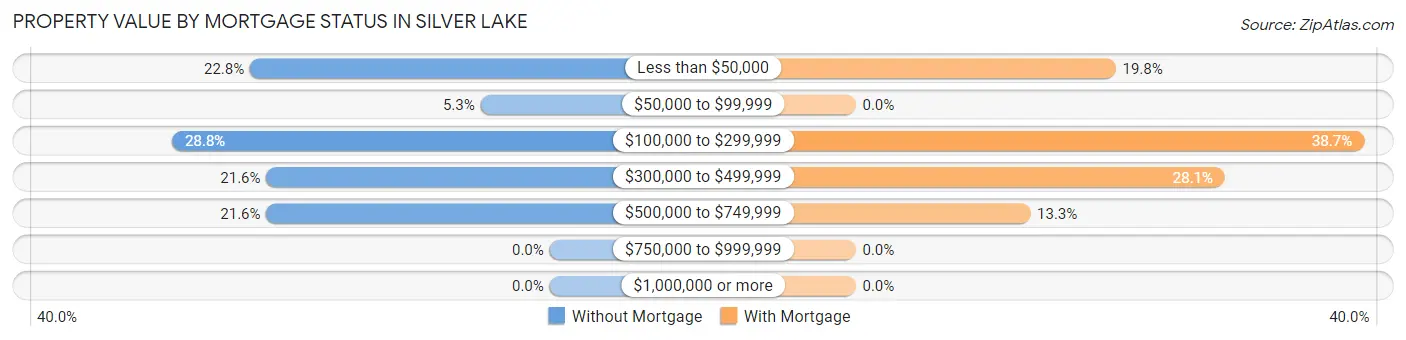
| Property Value | Without Mortgage | With Mortgage |
| Less than $50,000 | 165 (22.8%) | 271 (19.8%) |
| $50,000 to $99,999 | 38 (5.3%) | 0 (0.0%) |
| $100,000 to $299,999 | 208 (28.8%) | 530 (38.7%) |
| $300,000 to $499,999 | 156 (21.6%) | 385 (28.1%) |
| $500,000 to $749,999 | 156 (21.6%) | 182 (13.3%) |
| $750,000 to $999,999 | 0 (0.0%) | 0 (0.0%) |
| $1,000,000 or more | 0 (0.0%) | 0 (0.0%) |
| Total | 723 (100.0%) | 1,368 (100.0%) |
Household Income by Mortgage Status in Silver Lake
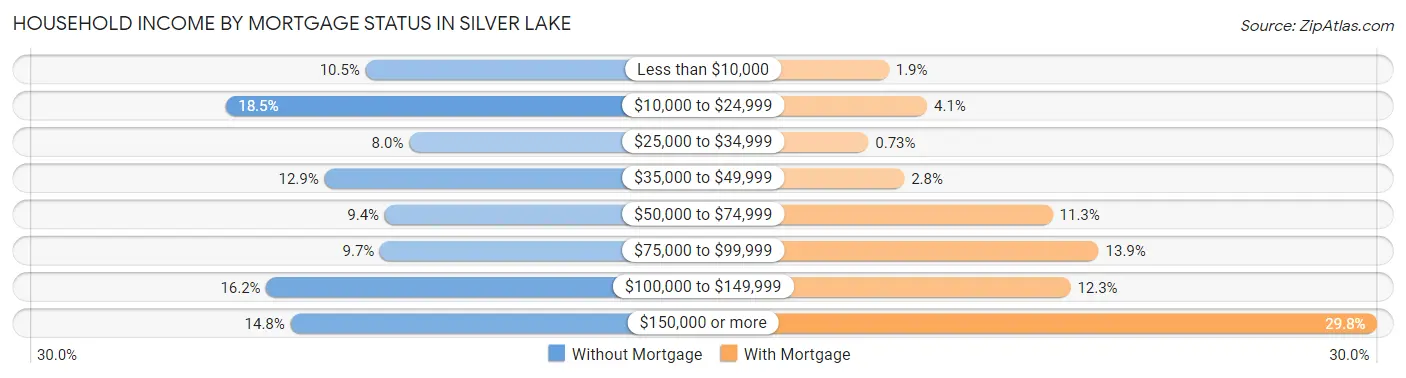
| Household Income | Without Mortgage | With Mortgage |
| Less than $10,000 | 76 (10.5%) | 26 (1.9%) |
| $10,000 to $24,999 | 134 (18.5%) | 56 (4.1%) |
| $25,000 to $34,999 | 58 (8.0%) | 10 (0.7%) |
| $35,000 to $49,999 | 93 (12.9%) | 38 (2.8%) |
| $50,000 to $74,999 | 68 (9.4%) | 154 (11.3%) |
| $75,000 to $99,999 | 70 (9.7%) | 190 (13.9%) |
| $100,000 to $149,999 | 117 (16.2%) | 168 (12.3%) |
| $150,000 or more | 107 (14.8%) | 408 (29.8%) |
| Total | 723 (100.0%) | 1,368 (100.0%) |
Property Value to Household Income Ratio in Silver Lake
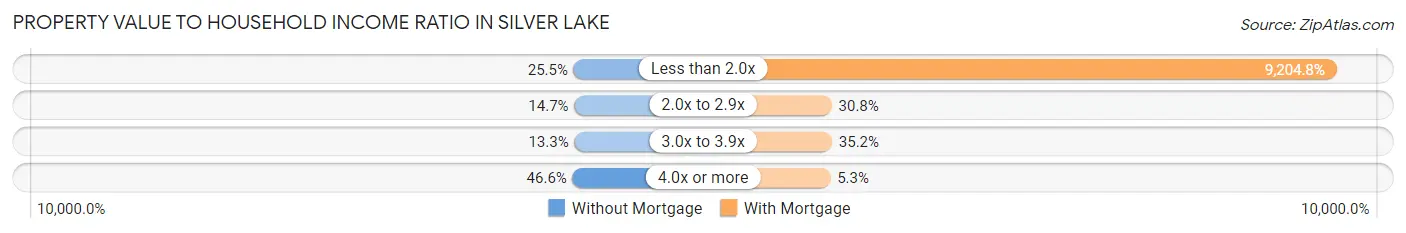
| Value-to-Income Ratio | Without Mortgage | With Mortgage |
| Less than 2.0x | 184 (25.5%) | 125,921 (9,204.7%) |
| 2.0x to 2.9x | 106 (14.7%) | 421 (30.8%) |
| 3.0x to 3.9x | 96 (13.3%) | 482 (35.2%) |
| 4.0x or more | 337 (46.6%) | 73 (5.3%) |
| Total | 723 (100.0%) | 1,368 (100.0%) |
Real Estate Taxes by Mortgage Status in Silver Lake
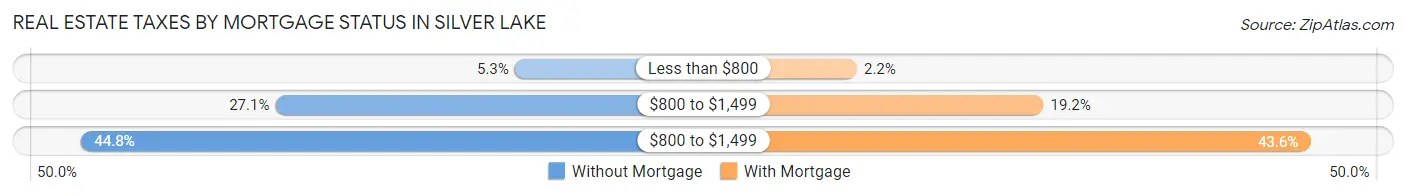
| Property Taxes | Without Mortgage | With Mortgage |
| Less than $800 | 38 (5.3%) | 30 (2.2%) |
| $800 to $1,499 | 196 (27.1%) | 263 (19.2%) |
| $800 to $1,499 | 324 (44.8%) | 596 (43.6%) |
| Total | 723 (100.0%) | 1,368 (100.0%) |
Health & Disability in Silver Lake
Health Insurance Coverage by Age in Silver Lake
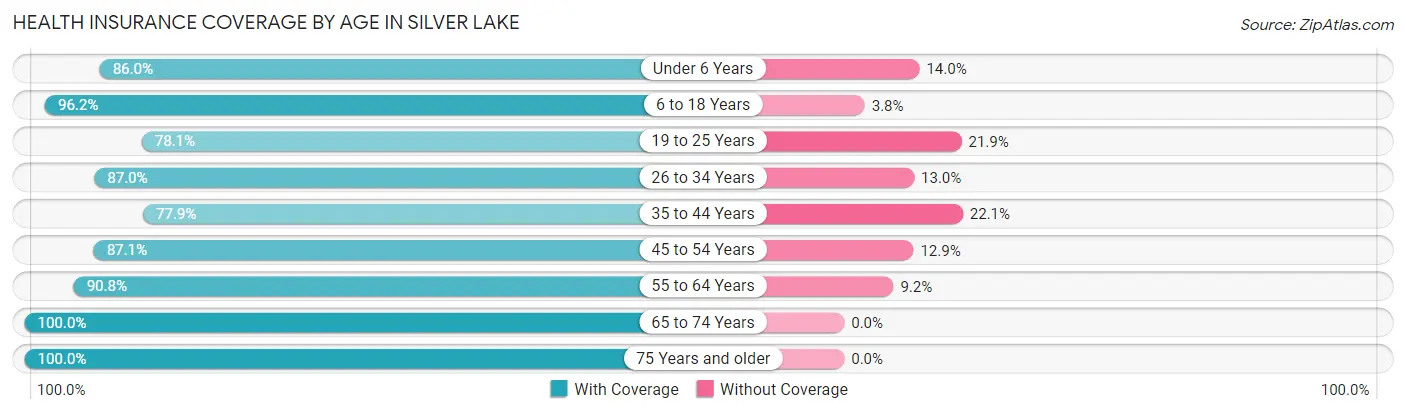
| Age Bracket | With Coverage | Without Coverage |
| Under 6 Years | 515 (86.0%) | 84 (14.0%) |
| 6 to 18 Years | 705 (96.2%) | 28 (3.8%) |
| 19 to 25 Years | 218 (78.1%) | 61 (21.9%) |
| 26 to 34 Years | 675 (87.0%) | 101 (13.0%) |
| 35 to 44 Years | 479 (77.9%) | 136 (22.1%) |
| 45 to 54 Years | 797 (87.1%) | 118 (12.9%) |
| 55 to 64 Years | 644 (90.8%) | 65 (9.2%) |
| 65 to 74 Years | 944 (100.0%) | 0 (0.0%) |
| 75 Years and older | 288 (100.0%) | 0 (0.0%) |
| Total | 5,265 (89.9%) | 593 (10.1%) |
Health Insurance Coverage by Citizenship Status in Silver Lake
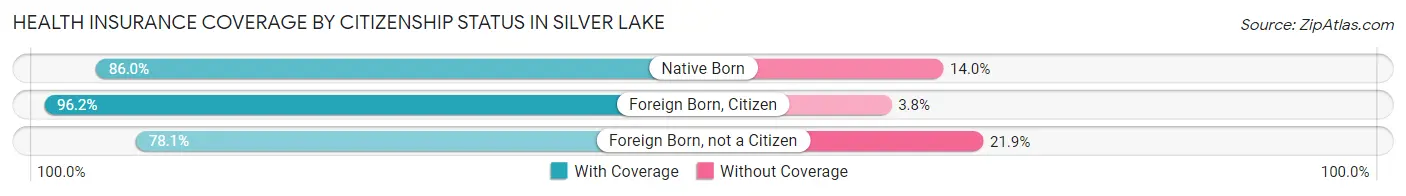
| Citizenship Status | With Coverage | Without Coverage |
| Native Born | 515 (86.0%) | 84 (14.0%) |
| Foreign Born, Citizen | 705 (96.2%) | 28 (3.8%) |
| Foreign Born, not a Citizen | 218 (78.1%) | 61 (21.9%) |
Health Insurance Coverage by Household Income in Silver Lake
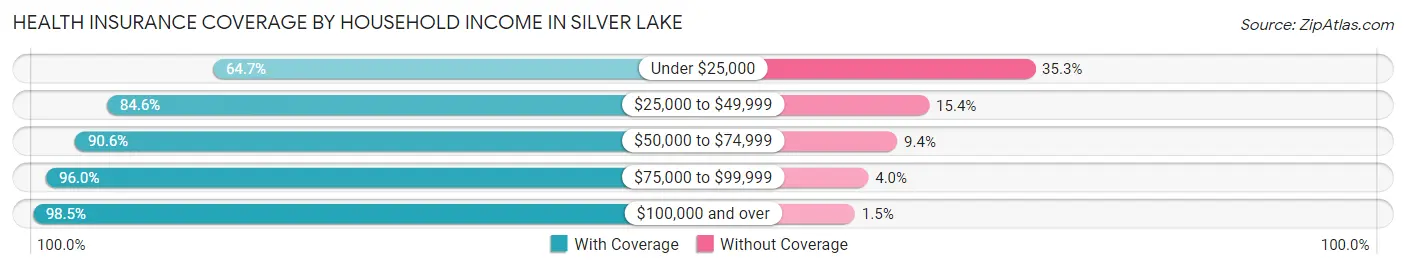
| Household Income | With Coverage | Without Coverage |
| Under $25,000 | 552 (64.7%) | 301 (35.3%) |
| $25,000 to $49,999 | 729 (84.6%) | 133 (15.4%) |
| $50,000 to $74,999 | 911 (90.6%) | 95 (9.4%) |
| $75,000 to $99,999 | 619 (96.0%) | 26 (4.0%) |
| $100,000 and over | 2,454 (98.5%) | 38 (1.5%) |
Public vs Private Health Insurance Coverage by Age in Silver Lake
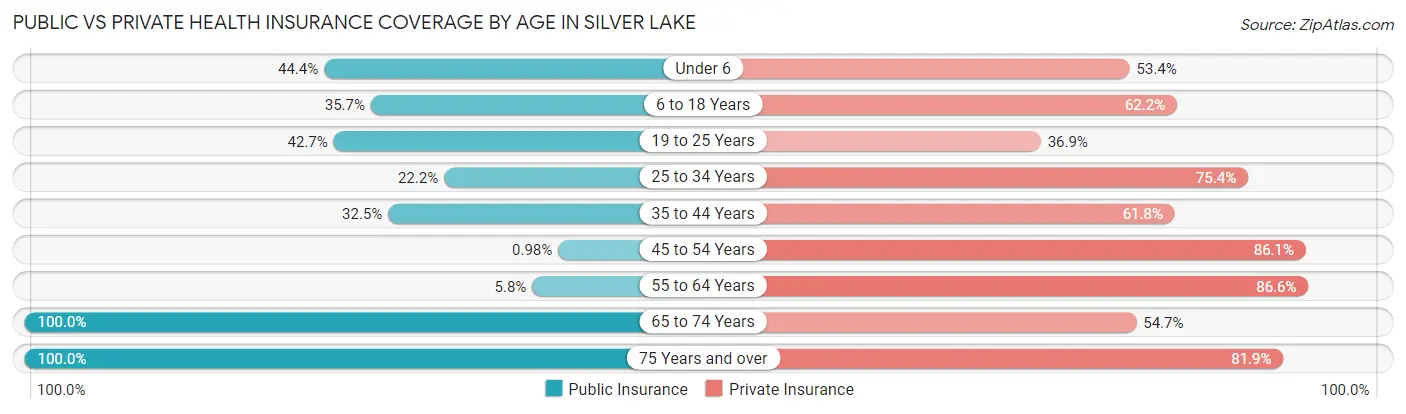
| Age Bracket | Public Insurance | Private Insurance |
| Under 6 | 266 (44.4%) | 320 (53.4%) |
| 6 to 18 Years | 262 (35.7%) | 456 (62.2%) |
| 19 to 25 Years | 119 (42.6%) | 103 (36.9%) |
| 25 to 34 Years | 172 (22.2%) | 585 (75.4%) |
| 35 to 44 Years | 200 (32.5%) | 380 (61.8%) |
| 45 to 54 Years | 9 (1.0%) | 788 (86.1%) |
| 55 to 64 Years | 41 (5.8%) | 614 (86.6%) |
| 65 to 74 Years | 944 (100.0%) | 516 (54.7%) |
| 75 Years and over | 288 (100.0%) | 236 (81.9%) |
| Total | 2,301 (39.3%) | 3,998 (68.2%) |
Disability Status by Sex by Age in Silver Lake
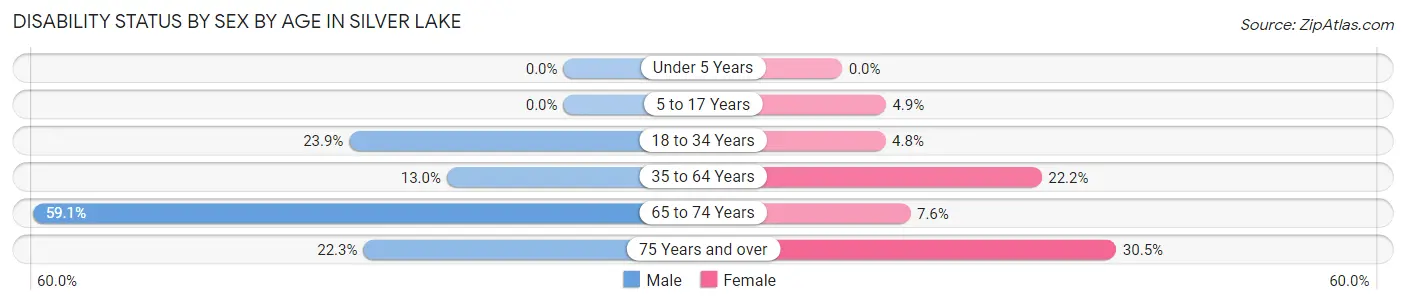
| Age Bracket | Male | Female |
| Under 5 Years | 0 (0.0%) | 0 (0.0%) |
| 5 to 17 Years | 0 (0.0%) | 9 (4.9%) |
| 18 to 34 Years | 156 (23.8%) | 26 (4.8%) |
| 35 to 64 Years | 182 (13.0%) | 186 (22.2%) |
| 65 to 74 Years | 208 (59.1%) | 45 (7.6%) |
| 75 Years and over | 43 (22.3%) | 29 (30.5%) |
Disability Class by Sex by Age in Silver Lake
Disability Class: Hearing Difficulty
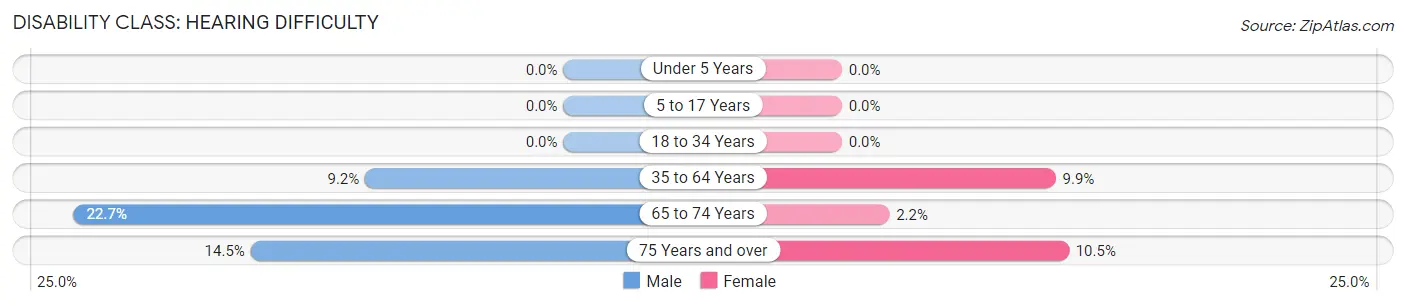
| Age Bracket | Male | Female |
| Under 5 Years | 0 (0.0%) | 0 (0.0%) |
| 5 to 17 Years | 0 (0.0%) | 0 (0.0%) |
| 18 to 34 Years | 0 (0.0%) | 0 (0.0%) |
| 35 to 64 Years | 129 (9.2%) | 83 (9.9%) |
| 65 to 74 Years | 80 (22.7%) | 13 (2.2%) |
| 75 Years and over | 28 (14.5%) | 10 (10.5%) |
Disability Class: Vision Difficulty
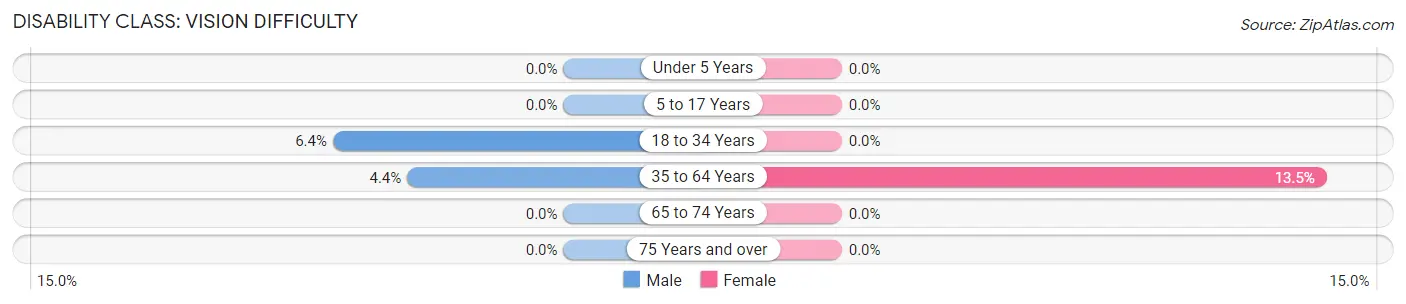
| Age Bracket | Male | Female |
| Under 5 Years | 0 (0.0%) | 0 (0.0%) |
| 5 to 17 Years | 0 (0.0%) | 0 (0.0%) |
| 18 to 34 Years | 42 (6.4%) | 0 (0.0%) |
| 35 to 64 Years | 61 (4.3%) | 113 (13.5%) |
| 65 to 74 Years | 0 (0.0%) | 0 (0.0%) |
| 75 Years and over | 0 (0.0%) | 0 (0.0%) |
Disability Class: Cognitive Difficulty
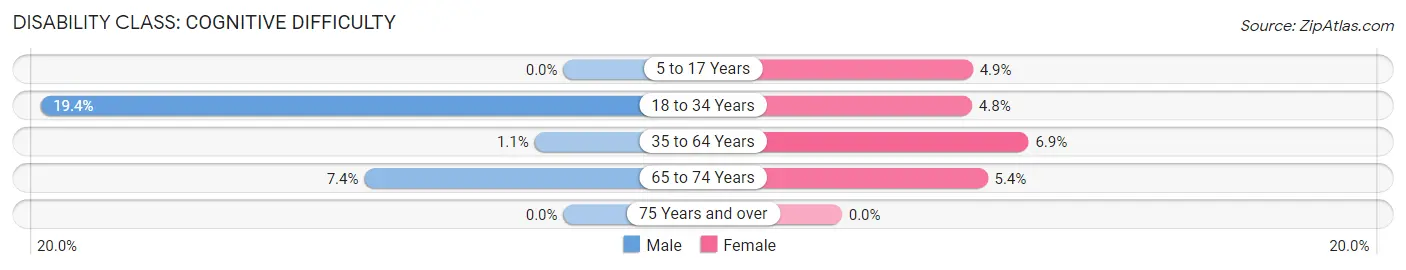
| Age Bracket | Male | Female |
| 5 to 17 Years | 0 (0.0%) | 9 (4.9%) |
| 18 to 34 Years | 127 (19.4%) | 26 (4.8%) |
| 35 to 64 Years | 15 (1.1%) | 58 (6.9%) |
| 65 to 74 Years | 26 (7.4%) | 32 (5.4%) |
| 75 Years and over | 0 (0.0%) | 0 (0.0%) |
Disability Class: Ambulatory Difficulty
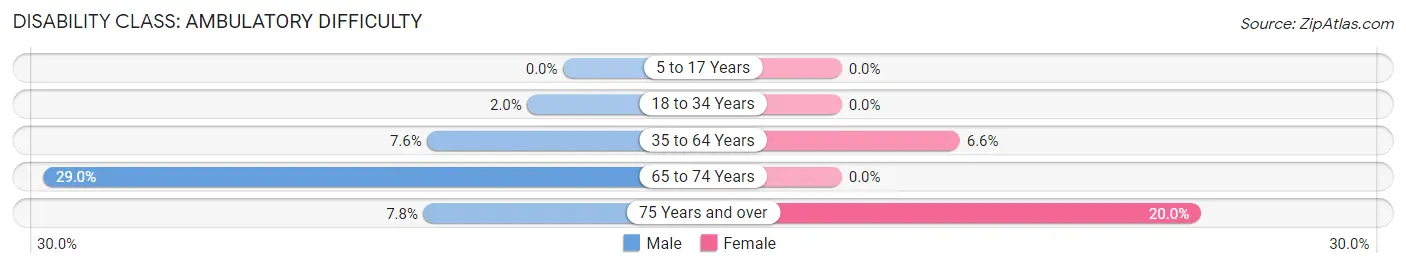
| Age Bracket | Male | Female |
| 5 to 17 Years | 0 (0.0%) | 0 (0.0%) |
| 18 to 34 Years | 13 (2.0%) | 0 (0.0%) |
| 35 to 64 Years | 106 (7.6%) | 55 (6.6%) |
| 65 to 74 Years | 102 (29.0%) | 0 (0.0%) |
| 75 Years and over | 15 (7.8%) | 19 (20.0%) |
Disability Class: Self-Care Difficulty
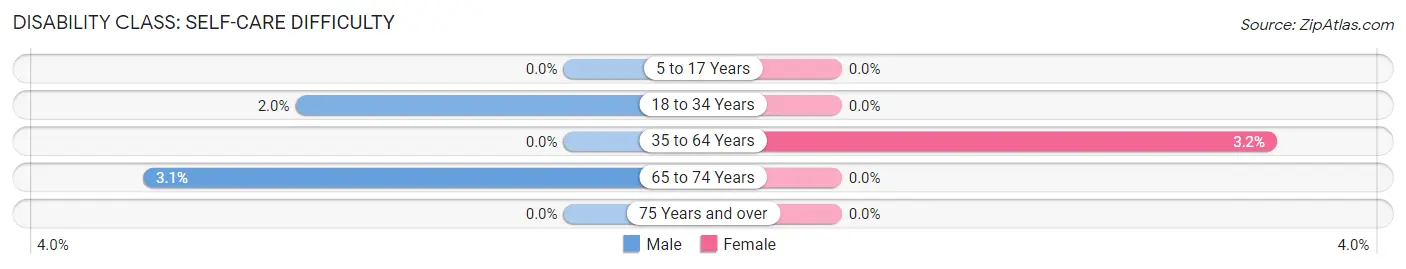
| Age Bracket | Male | Female |
| 5 to 17 Years | 0 (0.0%) | 0 (0.0%) |
| 18 to 34 Years | 13 (2.0%) | 0 (0.0%) |
| 35 to 64 Years | 0 (0.0%) | 27 (3.2%) |
| 65 to 74 Years | 11 (3.1%) | 0 (0.0%) |
| 75 Years and over | 0 (0.0%) | 0 (0.0%) |
Technology Access in Silver Lake
Computing Device Access in Silver Lake
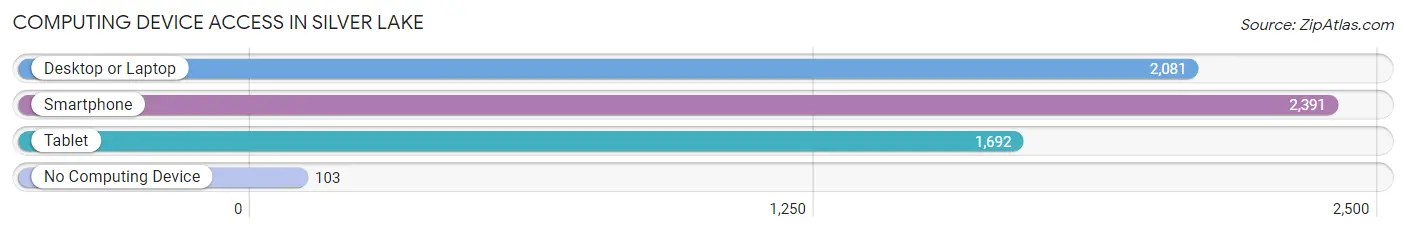
| Device Type | # Households | % Households |
| Desktop or Laptop | 2,081 | 81.8% |
| Smartphone | 2,391 | 94.0% |
| Tablet | 1,692 | 66.5% |
| No Computing Device | 103 | 4.1% |
| Total | 2,543 | 100.0% |
Internet Access in Silver Lake
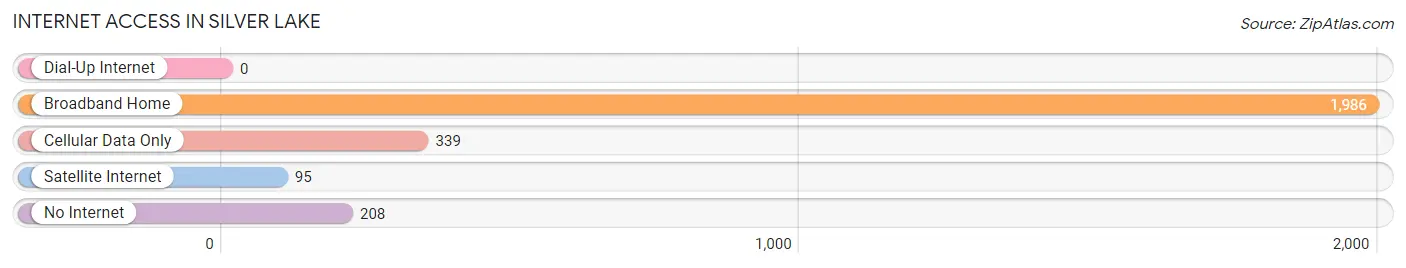
| Internet Type | # Households | % Households |
| Dial-Up Internet | 0 | 0.0% |
| Broadband Home | 1,986 | 78.1% |
| Cellular Data Only | 339 | 13.3% |
| Satellite Internet | 95 | 3.7% |
| No Internet | 208 | 8.2% |
| Total | 2,543 | 100.0% |
Silver Lake Summary
Introduction
Located in the foothills of the Blue Ridge Mountains in North Carolina, Silver Lake is a small town with a population of just over 1,000 people. The town is situated in the heart of the Yadkin Valley, a region known for its rolling hills, lush forests, and abundant wildlife. Silver Lake is a rural community with a rich history and a vibrant culture.
History
Silver Lake was first settled in the early 1800s by a group of settlers from Pennsylvania. The town was originally known as “Silver Springs” and was named after the nearby lake. The town was officially incorporated in 1891 and was named after the lake.
The town was a popular destination for tourists in the early 1900s, and the town’s economy was largely based on tourism. The town was home to several hotels, restaurants, and other businesses that catered to tourists.
In the 1950s, the town began to experience a decline in tourism due to the increasing popularity of air travel. The town’s economy shifted to focus on agriculture and manufacturing. The town is still home to several small businesses, including a winery, a brewery, and a distillery.
Geography
Silver Lake is located in the foothills of the Blue Ridge Mountains in North Carolina. The town is situated in the heart of the Yadkin Valley, a region known for its rolling hills, lush forests, and abundant wildlife. The town is located approximately 30 miles from Winston-Salem and is accessible via US Highway 421.
The town is situated on the banks of Silver Lake, a small lake that is fed by several creeks and streams. The lake is a popular destination for fishing, swimming, and boating. The town is also home to several parks, including Silver Lake Park, which features a playground, picnic areas, and a walking trail.
Economy
The economy of Silver Lake is largely based on agriculture and manufacturing. The town is home to several small businesses, including a winery, a brewery, and a distillery. The town is also home to several farms, which produce a variety of crops, including corn, soybeans, and tobacco.
The town is also home to several manufacturing companies, including a furniture manufacturer and a plastics manufacturer. The town is also home to several retail stores, including a grocery store, a hardware store, and a clothing store.
Demographics
As of the 2010 census, the population of Silver Lake was 1,072. The town is predominantly white, with a population that is 97.3% white and 2.7% African American. The median household income in the town is $37,500, and the median age is 44.
Conclusion
Silver Lake is a small town located in the foothills of the Blue Ridge Mountains in North Carolina. The town has a rich history and a vibrant culture, and its economy is largely based on agriculture and manufacturing. The town is predominantly white, with a population that is 97.3% white and 2.7% African American. Silver Lake is a rural community with a unique history and culture, and it is a great place to live and work.
Common Questions
What is Per Capita Income in Silver Lake?
Per Capita income in Silver Lake is $39,006.
What is the Median Family Income in Silver Lake?
Median Family Income in Silver Lake is $87,888.
What is the Median Household income in Silver Lake?
Median Household Income in Silver Lake is $75,123.
What is Income or Wage Gap in Silver Lake?
Income or Wage Gap in Silver Lake is 18.4%.
Women in Silver Lake earn 81.6 cents for every dollar earned by a man.
What is Inequality or Gini Index in Silver Lake?
Inequality or Gini Index in Silver Lake is 0.41.
What is the Total Population of Silver Lake?
Total Population of Silver Lake is 5,858.
What is the Total Male Population of Silver Lake?
Total Male Population of Silver Lake is 3,353.
What is the Total Female Population of Silver Lake?
Total Female Population of Silver Lake is 2,505.
What is the Ratio of Males per 100 Females in Silver Lake?
There are 133.85 Males per 100 Females in Silver Lake.
What is the Ratio of Females per 100 Males in Silver Lake?
There are 74.71 Females per 100 Males in Silver Lake.
What is the Median Population Age in Silver Lake?
Median Population Age in Silver Lake is 43.2 Years.
What is the Average Family Size in Silver Lake
Average Family Size in Silver Lake is 2.9 People.
What is the Average Household Size in Silver Lake
Average Household Size in Silver Lake is 2.3 People.
How Large is the Labor Force in Silver Lake?
There are 3,241 People in the Labor Forcein in Silver Lake.
What is the Percentage of People in the Labor Force in Silver Lake?
68.0% of People are in the Labor Force in Silver Lake.
What is the Unemployment Rate in Silver Lake?
Unemployment Rate in Silver Lake is 3.4%.