Zip Codes with the Highest Percentage of Population Employed in Life, Physical & Social Science in Independence, MO
RELATED REPORTS & OPTIONS
Life, Physical & Social Science
Independence
Compare Zip Codes
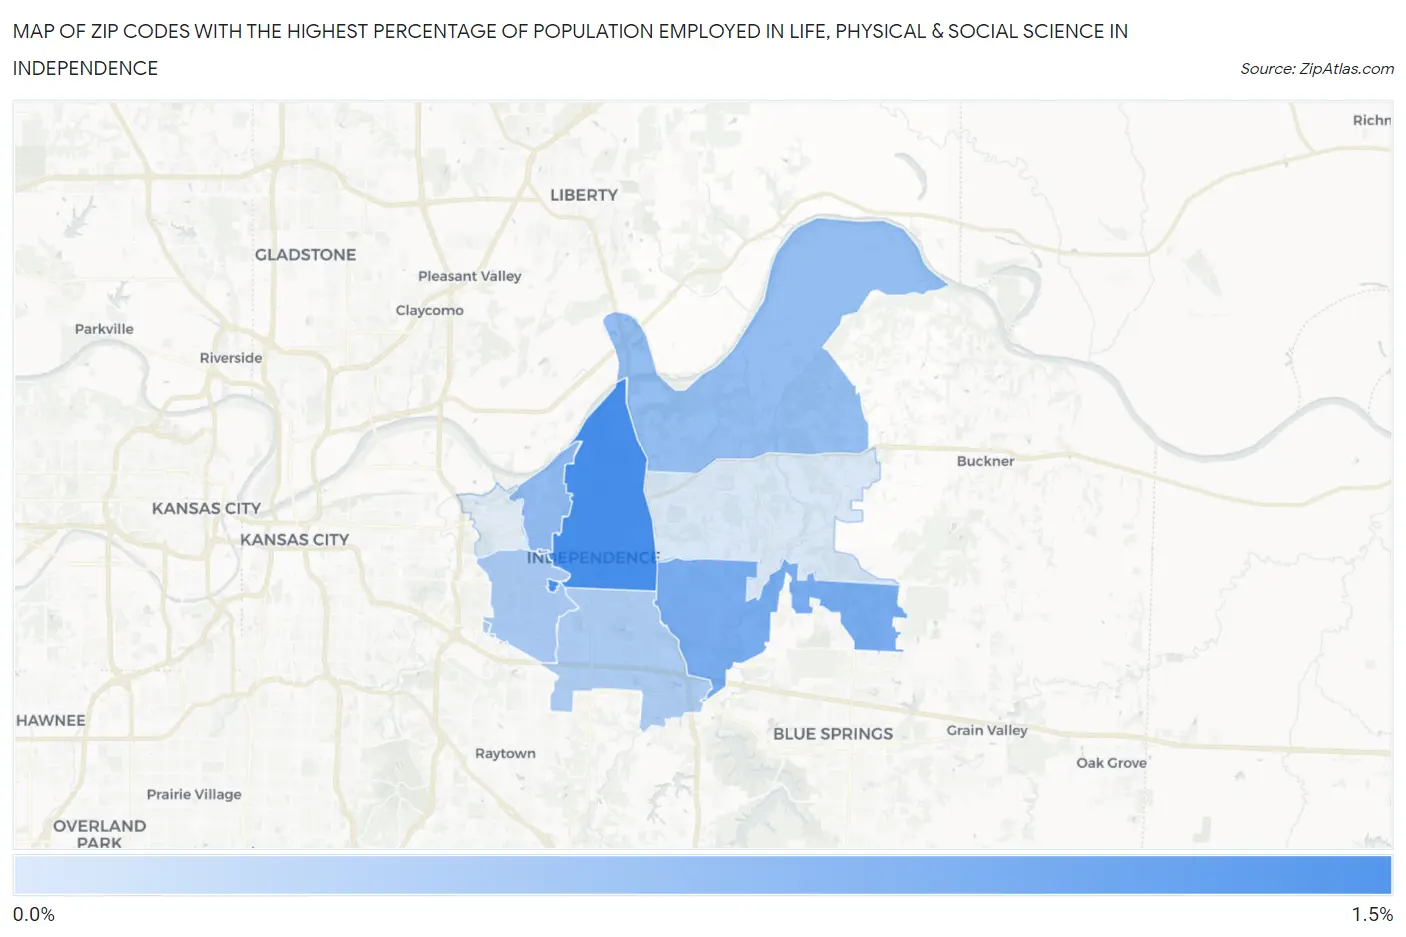
Map of Zip Codes with the Highest Percentage of Population Employed in Life, Physical & Social Science in Independence
0.12%
1.3%
Zip Codes with the Highest Percentage of Population Employed in Life, Physical & Social Science in Independence, MO
| Zip Code | % Employed | vs State | vs National | |
| 1. | 64050 | 1.3% | 0.98%(+0.367)#137 | 1.1%(+0.258)#6,478 |
| 2. | 64057 | 0.93% | 0.98%(-0.048)#214 | 1.1%(-0.157)#9,626 |
| 3. | 64054 | 0.72% | 0.98%(-0.264)#253 | 1.1%(-0.373)#11,838 |
| 4. | 64058 | 0.71% | 0.98%(-0.273)#254 | 1.1%(-0.382)#11,919 |
| 5. | 64052 | 0.52% | 0.98%(-0.460)#317 | 1.1%(-0.569)#14,242 |
| 6. | 64055 | 0.48% | 0.98%(-0.501)#330 | 1.1%(-0.610)#14,747 |
| 7. | 64056 | 0.12% | 0.98%(-0.863)#446 | 1.1%(-0.972)#18,953 |
1
Common Questions
What are the Top 5 Zip Codes with the Highest Percentage of Population Employed in Life, Physical & Social Science in Independence, MO?
Top 5 Zip Codes with the Highest Percentage of Population Employed in Life, Physical & Social Science in Independence, MO are:
What zip code has the Highest Percentage of Population Employed in Life, Physical & Social Science in Independence, MO?
64050 has the Highest Percentage of Population Employed in Life, Physical & Social Science in Independence, MO with 1.3%.
What is the Percentage of Population Employed in Life, Physical & Social Science in Independence, MO?
Percentage of Population Employed in Life, Physical & Social Science in Independence is 0.60%.
What is the Percentage of Population Employed in Life, Physical & Social Science in Missouri?
Percentage of Population Employed in Life, Physical & Social Science in Missouri is 0.98%.
What is the Percentage of Population Employed in Life, Physical & Social Science in the United States?
Percentage of Population Employed in Life, Physical & Social Science in the United States is 1.1%.