Gordonville, MO Map & Demographics
Gordonville Map
Gordonville Overview
$42,861
PER CAPITA INCOME
$96,250
AVG FAMILY INCOME
$86,250
AVG HOUSEHOLD INCOME
42.6%
WAGE / INCOME GAP [ % ]
57.4¢/ $1
WAGE / INCOME GAP [ $ ]
0.37
INEQUALITY / GINI INDEX
533
TOTAL POPULATION
271
MALE POPULATION
262
FEMALE POPULATION
103.44
MALES / 100 FEMALES
96.68
FEMALES / 100 MALES
40.9
MEDIAN AGE
2.7
AVG FAMILY SIZE
2.6
AVG HOUSEHOLD SIZE
306
LABOR FORCE [ PEOPLE ]
70.0%
PERCENT IN LABOR FORCE
1.0%
UNEMPLOYMENT RATE
Gordonville Area Codes
Income in Gordonville
Income Overview in Gordonville
Per Capita Income in Gordonville is $42,861, while median incomes of families and households are $96,250 and $86,250 respectively.
| Characteristic | Number | Measure |
| Per Capita Income | 533 | $42,861 |
| Median Family Income | 168 | $96,250 |
| Mean Family Income | 168 | $119,036 |
| Median Household Income | 201 | $86,250 |
| Mean Household Income | 201 | $113,172 |
| Income Deficit | 168 | $0 |
| Wage / Income Gap (%) | 533 | 42.57% |
| Wage / Income Gap ($) | 533 | 57.43¢ per $1 |
| Gini / Inequality Index | 533 | 0.37 |
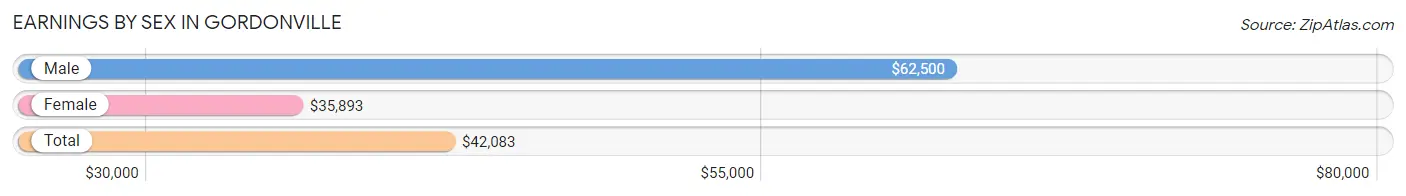
Earnings by Sex in Gordonville
Average Earnings in Gordonville are $42,083, $62,500 for men and $35,893 for women, a difference of 42.6%.
| Sex | Number | Average Earnings |
| Male | 160 (50.5%) | $62,500 |
| Female | 157 (49.5%) | $35,893 |
| Total | 317 (100.0%) | $42,083 |
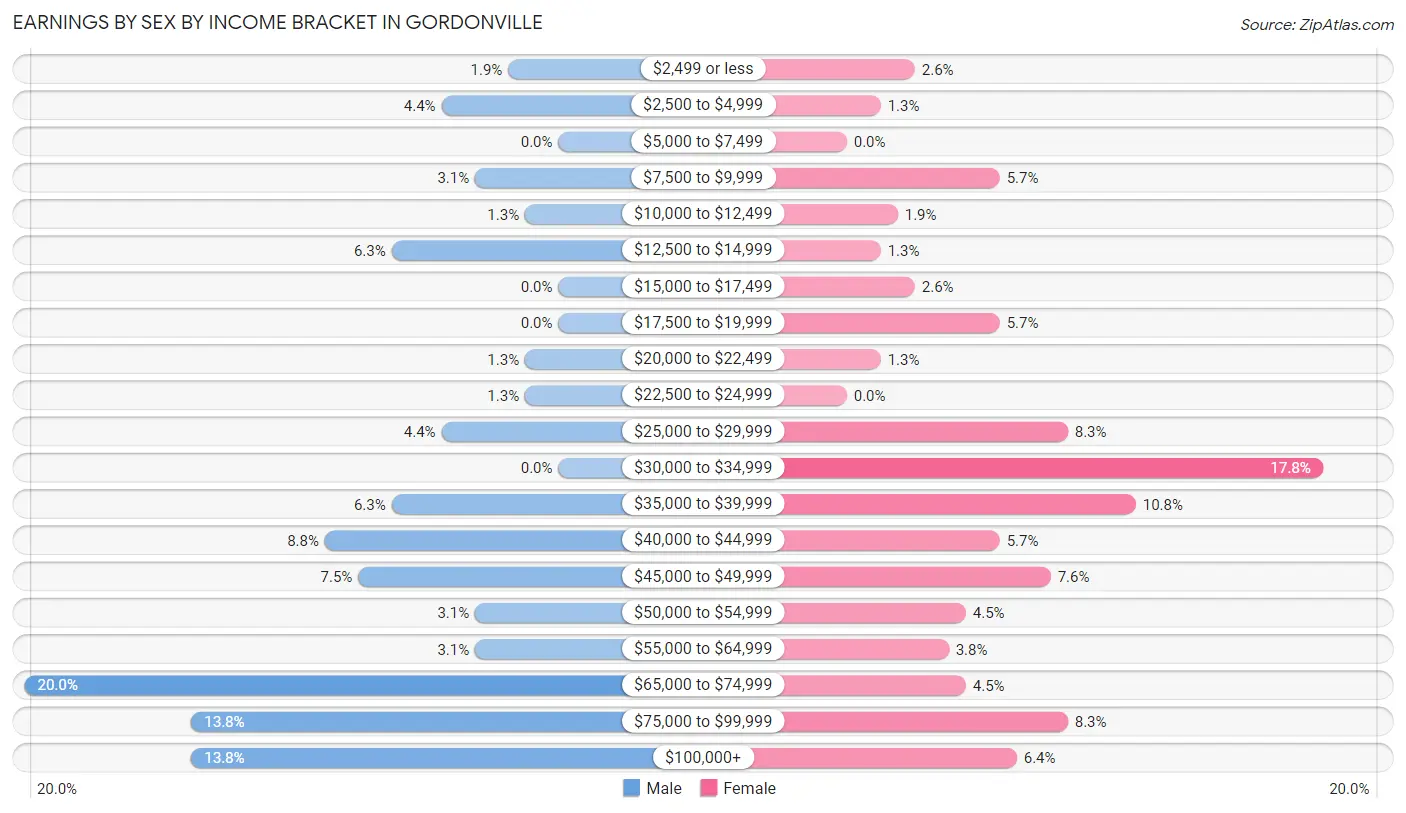
Earnings by Sex by Income Bracket in Gordonville
The most common earnings brackets in Gordonville are $65,000 to $74,999 for men (32 | 20.0%) and $30,000 to $34,999 for women (28 | 17.8%).
| Income | Male | Female |
| $2,499 or less | 3 (1.9%) | 4 (2.5%) |
| $2,500 to $4,999 | 7 (4.4%) | 2 (1.3%) |
| $5,000 to $7,499 | 0 (0.0%) | 0 (0.0%) |
| $7,500 to $9,999 | 5 (3.1%) | 9 (5.7%) |
| $10,000 to $12,499 | 2 (1.3%) | 3 (1.9%) |
| $12,500 to $14,999 | 10 (6.2%) | 2 (1.3%) |
| $15,000 to $17,499 | 0 (0.0%) | 4 (2.5%) |
| $17,500 to $19,999 | 0 (0.0%) | 9 (5.7%) |
| $20,000 to $22,499 | 2 (1.3%) | 2 (1.3%) |
| $22,500 to $24,999 | 2 (1.3%) | 0 (0.0%) |
| $25,000 to $29,999 | 7 (4.4%) | 13 (8.3%) |
| $30,000 to $34,999 | 0 (0.0%) | 28 (17.8%) |
| $35,000 to $39,999 | 10 (6.2%) | 17 (10.8%) |
| $40,000 to $44,999 | 14 (8.7%) | 9 (5.7%) |
| $45,000 to $49,999 | 12 (7.5%) | 12 (7.6%) |
| $50,000 to $54,999 | 5 (3.1%) | 7 (4.5%) |
| $55,000 to $64,999 | 5 (3.1%) | 6 (3.8%) |
| $65,000 to $74,999 | 32 (20.0%) | 7 (4.5%) |
| $75,000 to $99,999 | 22 (13.8%) | 13 (8.3%) |
| $100,000+ | 22 (13.8%) | 10 (6.4%) |
| Total | 160 (100.0%) | 157 (100.0%) |
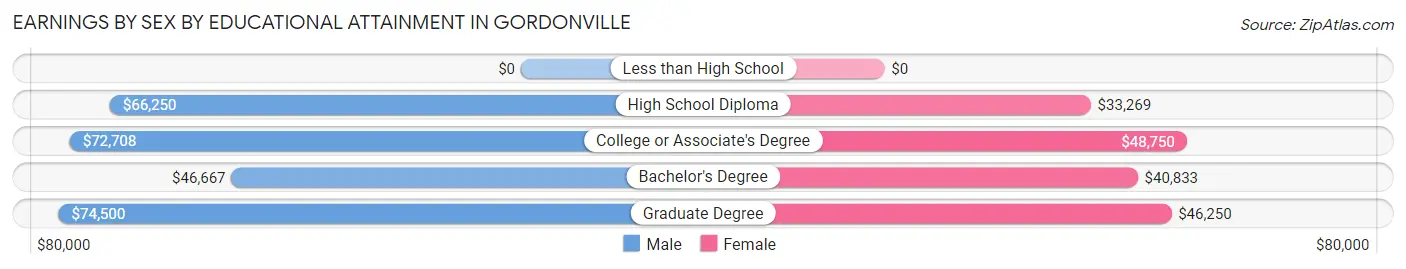
Earnings by Sex by Educational Attainment in Gordonville
Average earnings in Gordonville are $66,875 for men and $37,917 for women, a difference of 43.3%. Men with an educational attainment of graduate degree enjoy the highest average annual earnings of $74,500, while those with bachelor's degree education earn the least with $46,667. Women with an educational attainment of college or associate's degree earn the most with the average annual earnings of $48,750, while those with high school diploma education have the smallest earnings of $33,269.
| Educational Attainment | Male Income | Female Income |
| Less than High School | - | - |
| High School Diploma | $66,250 | $33,269 |
| College or Associate's Degree | $72,708 | $48,750 |
| Bachelor's Degree | $46,667 | $40,833 |
| Graduate Degree | $74,500 | $46,250 |
| Total | $66,875 | $37,917 |
Family Income in Gordonville
Family Income Brackets in Gordonville
According to the Gordonville family income data, there are 59 families falling into the $100,000 to $149,999 income range, which is the most common income bracket and makes up 35.1% of all families.
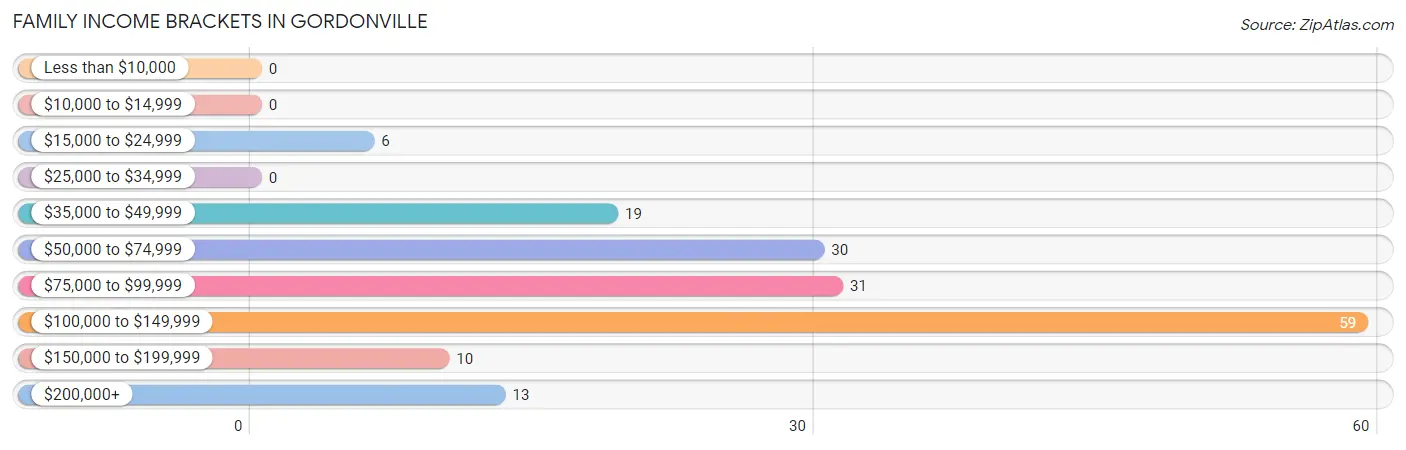
| Income Bracket | # Families | % Families |
| Less than $10,000 | 0 | 0.0% |
| $10,000 to $14,999 | 0 | 0.0% |
| $15,000 to $24,999 | 6 | 3.6% |
| $25,000 to $34,999 | 0 | 0.0% |
| $35,000 to $49,999 | 19 | 11.3% |
| $50,000 to $74,999 | 30 | 17.9% |
| $75,000 to $99,999 | 31 | 18.5% |
| $100,000 to $149,999 | 59 | 35.1% |
| $150,000 to $199,999 | 10 | 6.0% |
| $200,000+ | 13 | 7.7% |
Family Income by Famaliy Size in Gordonville
4-person families (29 | 17.3%) account for the highest median family income in Gordonville with $124,792 per family, while 2-person families (91 | 54.2%) have the highest median income of $40,090 per family member.
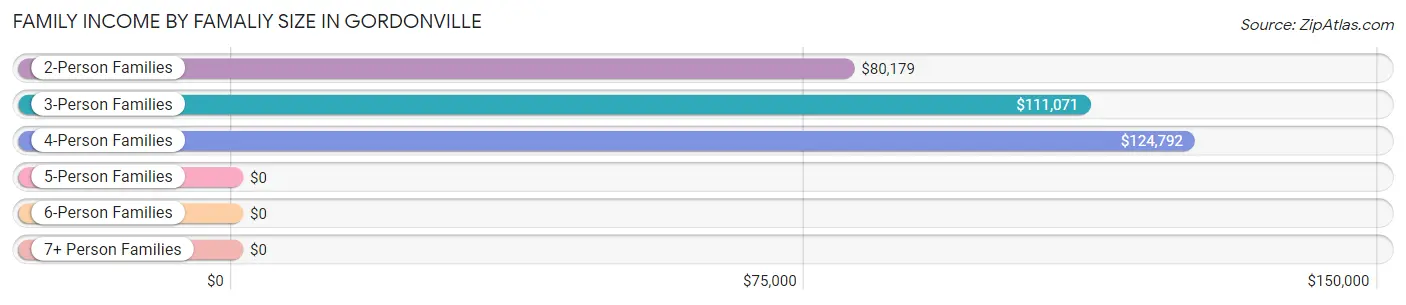
| Income Bracket | # Families | Median Income |
| 2-Person Families | 91 (54.2%) | $80,179 |
| 3-Person Families | 46 (27.4%) | $111,071 |
| 4-Person Families | 29 (17.3%) | $124,792 |
| 5-Person Families | 2 (1.2%) | $0 |
| 6-Person Families | 0 (0.0%) | $0 |
| 7+ Person Families | 0 (0.0%) | $0 |
| Total | 168 (100.0%) | $96,250 |
Family Income by Number of Earners in Gordonville
The median family income in Gordonville is $96,250, with families comprising 3+ earners (16) having the highest median family income of $124,063, while families with no earners (31) have the lowest median family income of $58,125, accounting for 9.5% and 18.4% of families, respectively.
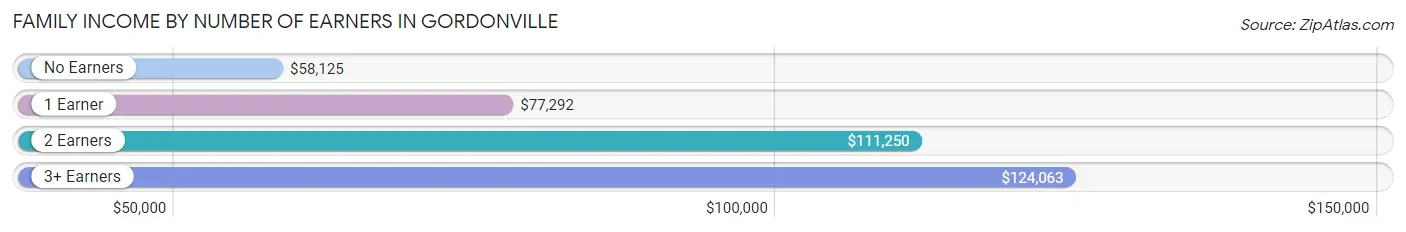
| Number of Earners | # Families | Median Income |
| No Earners | 31 (18.4%) | $58,125 |
| 1 Earner | 33 (19.6%) | $77,292 |
| 2 Earners | 88 (52.4%) | $111,250 |
| 3+ Earners | 16 (9.5%) | $124,063 |
| Total | 168 (100.0%) | $96,250 |
Household Income in Gordonville
Household Income Brackets in Gordonville
With 65 households falling in the category, the $100,000 to $149,999 income range is the most frequent in Gordonville, accounting for 32.3% of all households.
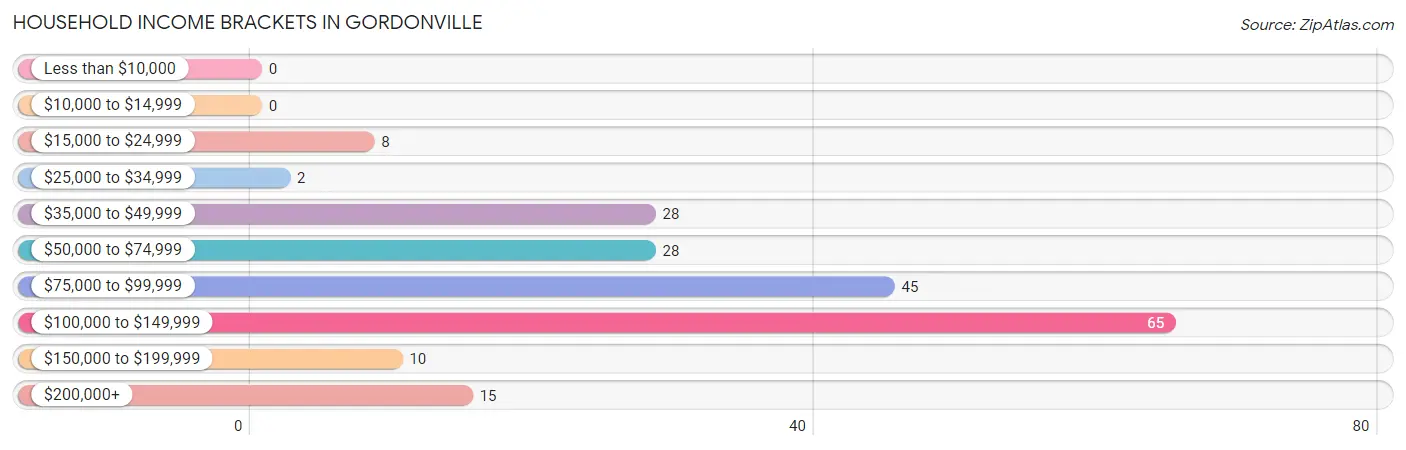
| Income Bracket | # Households | % Households |
| Less than $10,000 | 0 | 0.0% |
| $10,000 to $14,999 | 0 | 0.0% |
| $15,000 to $24,999 | 8 | 4.0% |
| $25,000 to $34,999 | 2 | 1.0% |
| $35,000 to $49,999 | 28 | 13.9% |
| $50,000 to $74,999 | 28 | 13.9% |
| $75,000 to $99,999 | 45 | 22.4% |
| $100,000 to $149,999 | 65 | 32.3% |
| $150,000 to $199,999 | 10 | 5.0% |
| $200,000+ | 15 | 7.5% |
Household Income by Householder Age in Gordonville
The median household income in Gordonville is $86,250, with the highest median household income of $116,563 found in the 45 to 64 years age bracket for the primary householder. A total of 75 households (37.3%) fall into this category. Meanwhile, the 15 to 24 years age bracket for the primary householder has the lowest median household income of $0, with 11 households (5.5%) in this group.
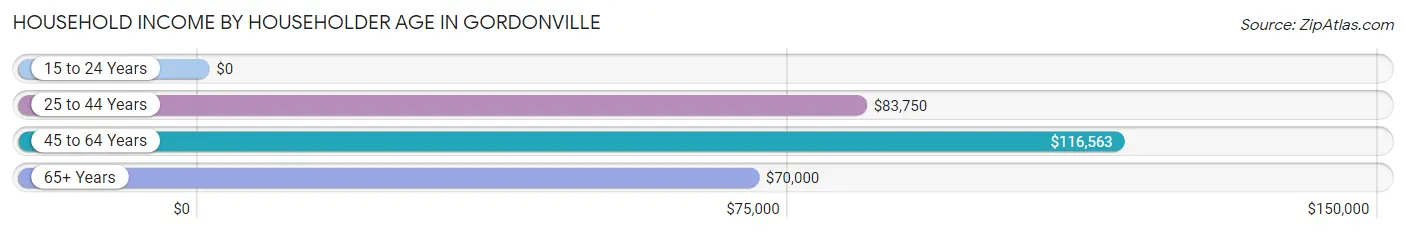
| Income Bracket | # Households | Median Income |
| 15 to 24 Years | 11 (5.5%) | $0 |
| 25 to 44 Years | 65 (32.3%) | $83,750 |
| 45 to 64 Years | 75 (37.3%) | $116,563 |
| 65+ Years | 50 (24.9%) | $70,000 |
| Total | 201 (100.0%) | $86,250 |
Poverty in Gordonville
Income Below Poverty by Sex and Age in Gordonville
With 3.0% poverty level for males and 6.9% for females among the residents of Gordonville, 18 to 24 year old males and 15 year old females are the most vulnerable to poverty, with 4 males (23.5%) and 1 females (100.0%) in their respective age groups living below the poverty level.
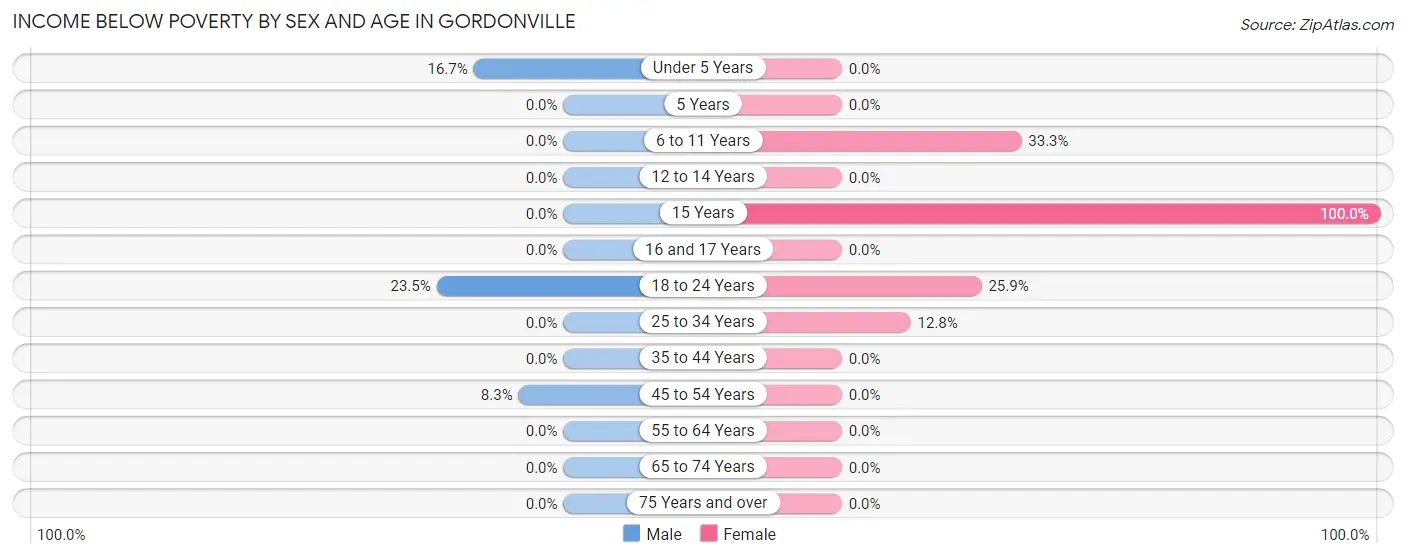
| Age Bracket | Male | Female |
| Under 5 Years | 2 (16.7%) | 0 (0.0%) |
| 5 Years | 0 (0.0%) | 0 (0.0%) |
| 6 to 11 Years | 0 (0.0%) | 4 (33.3%) |
| 12 to 14 Years | 0 (0.0%) | 0 (0.0%) |
| 15 Years | 0 (0.0%) | 1 (100.0%) |
| 16 and 17 Years | 0 (0.0%) | 0 (0.0%) |
| 18 to 24 Years | 4 (23.5%) | 7 (25.9%) |
| 25 to 34 Years | 0 (0.0%) | 6 (12.8%) |
| 35 to 44 Years | 0 (0.0%) | 0 (0.0%) |
| 45 to 54 Years | 2 (8.3%) | 0 (0.0%) |
| 55 to 64 Years | 0 (0.0%) | 0 (0.0%) |
| 65 to 74 Years | 0 (0.0%) | 0 (0.0%) |
| 75 Years and over | 0 (0.0%) | 0 (0.0%) |
| Total | 8 (3.0%) | 18 (6.9%) |
Income Above Poverty by Sex and Age in Gordonville
According to the poverty statistics in Gordonville, males aged 6 to 11 years and females aged under 5 years are the age groups that are most secure financially, with 100.0% of males and 100.0% of females in these age groups living above the poverty line.
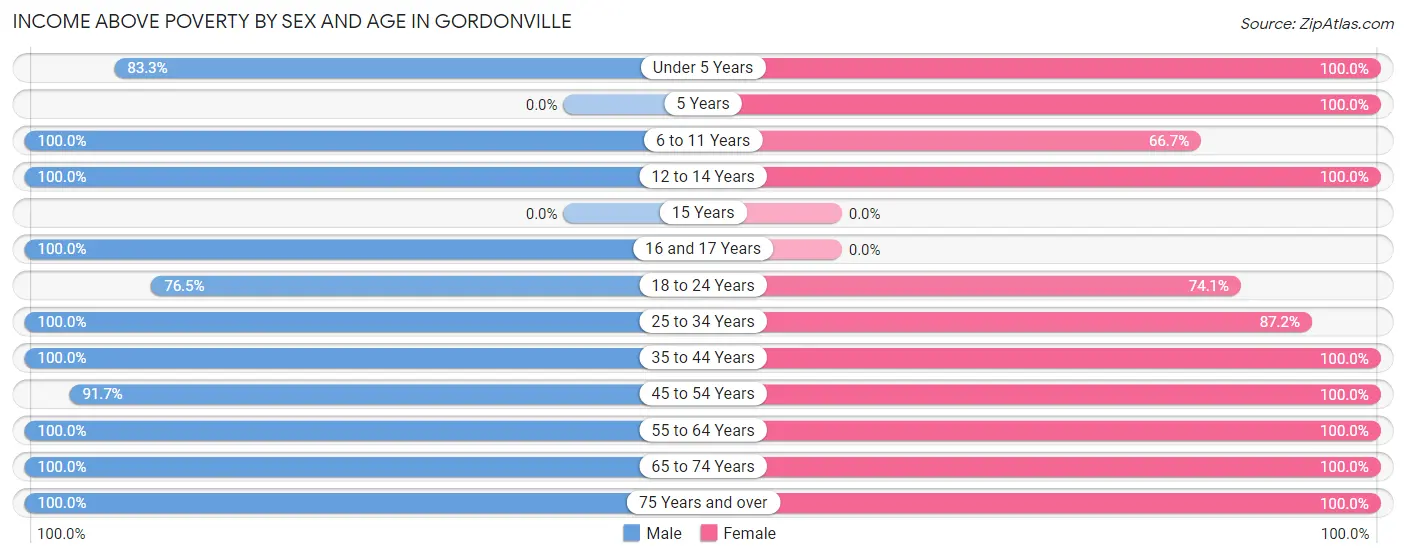
| Age Bracket | Male | Female |
| Under 5 Years | 10 (83.3%) | 12 (100.0%) |
| 5 Years | 0 (0.0%) | 6 (100.0%) |
| 6 to 11 Years | 24 (100.0%) | 8 (66.7%) |
| 12 to 14 Years | 19 (100.0%) | 2 (100.0%) |
| 15 Years | 0 (0.0%) | 0 (0.0%) |
| 16 and 17 Years | 2 (100.0%) | 0 (0.0%) |
| 18 to 24 Years | 13 (76.5%) | 20 (74.1%) |
| 25 to 34 Years | 38 (100.0%) | 41 (87.2%) |
| 35 to 44 Years | 36 (100.0%) | 30 (100.0%) |
| 45 to 54 Years | 22 (91.7%) | 24 (100.0%) |
| 55 to 64 Years | 50 (100.0%) | 52 (100.0%) |
| 65 to 74 Years | 29 (100.0%) | 23 (100.0%) |
| 75 Years and over | 14 (100.0%) | 24 (100.0%) |
| Total | 257 (97.0%) | 242 (93.1%) |
Income Below Poverty Among Married-Couple Families in Gordonville
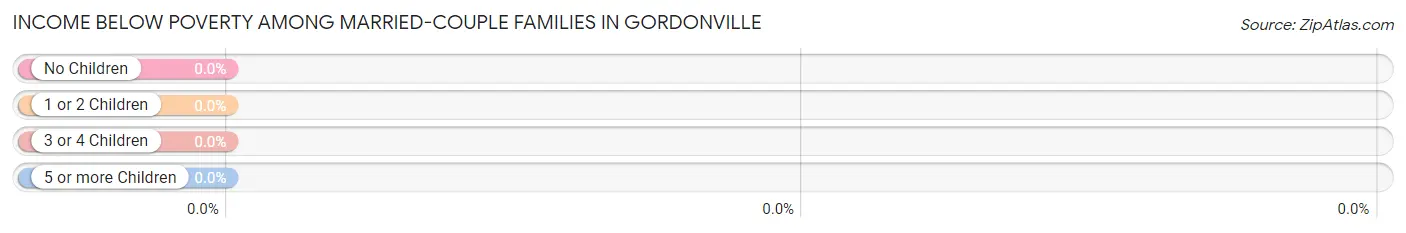
| Children | Above Poverty | Below Poverty |
| No Children | 107 (100.0%) | 0 (0.0%) |
| 1 or 2 Children | 51 (100.0%) | 0 (0.0%) |
| 3 or 4 Children | 0 (0.0%) | 0 (0.0%) |
| 5 or more Children | 0 (0.0%) | 0 (0.0%) |
| Total | 158 (100.0%) | 0 (0.0%) |
Income Below Poverty Among Single-Parent Households in Gordonville
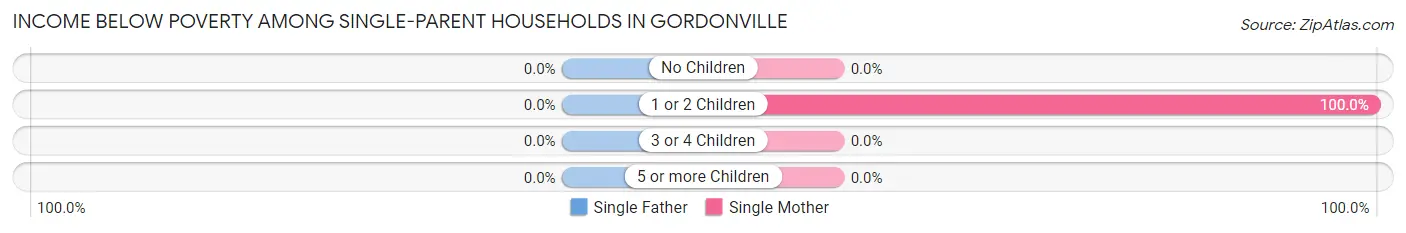
| Children | Single Father | Single Mother |
| No Children | 0 (0.0%) | 0 (0.0%) |
| 1 or 2 Children | 0 (0.0%) | 4 (100.0%) |
| 3 or 4 Children | 0 (0.0%) | 0 (0.0%) |
| 5 or more Children | 0 (0.0%) | 0 (0.0%) |
| Total | 0 (0.0%) | 4 (57.1%) |
Income Below Poverty Among Married-Couple vs Single-Parent Households in Gordonville
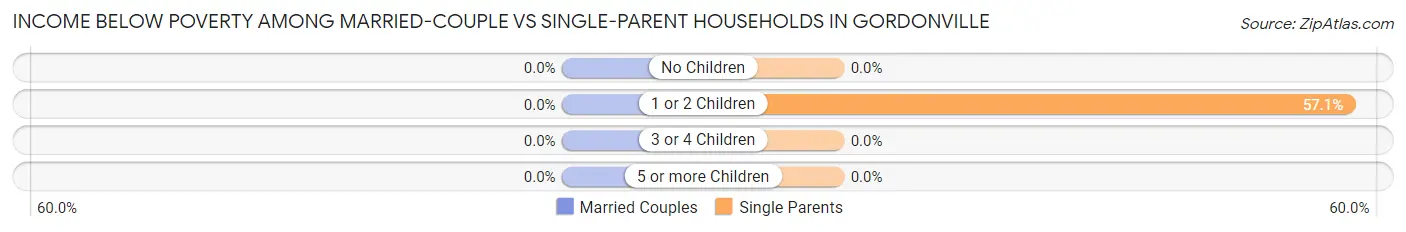
| Children | Married-Couple Families | Single-Parent Households |
| No Children | 0 (0.0%) | 0 (0.0%) |
| 1 or 2 Children | 0 (0.0%) | 4 (57.1%) |
| 3 or 4 Children | 0 (0.0%) | 0 (0.0%) |
| 5 or more Children | 0 (0.0%) | 0 (0.0%) |
| Total | 0 (0.0%) | 4 (40.0%) |
Race in Gordonville
The most populous races in Gordonville are White / Caucasian (523 | 98.1%), and Two or more Races (10 | 1.9%).
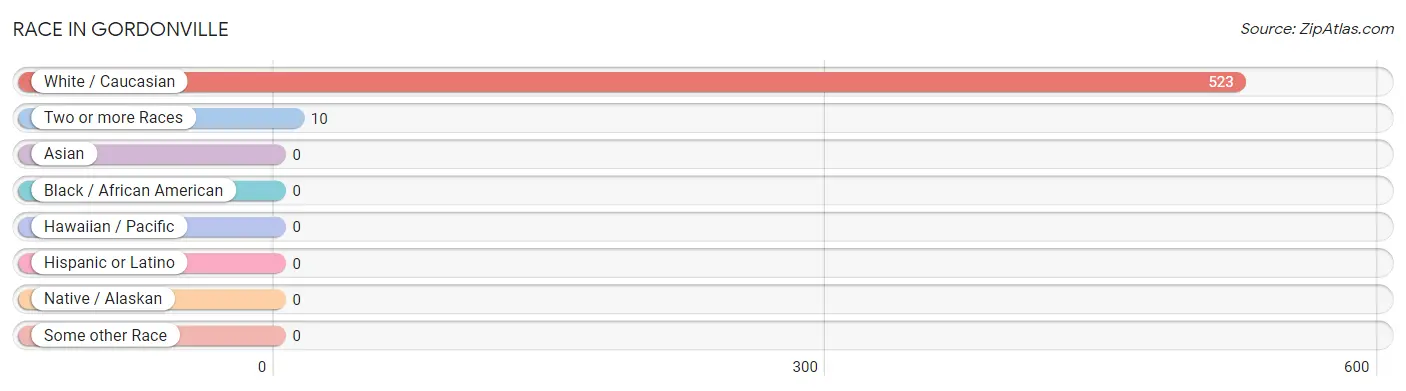
| Race | # Population | % Population |
| Asian | 0 | 0.0% |
| Black / African American | 0 | 0.0% |
| Hawaiian / Pacific | 0 | 0.0% |
| Hispanic or Latino | 0 | 0.0% |
| Native / Alaskan | 0 | 0.0% |
| White / Caucasian | 523 | 98.1% |
| Two or more Races | 10 | 1.9% |
| Some other Race | 0 | 0.0% |
| Total | 533 | 100.0% |
Ancestry in Gordonville
The most populous ancestries reported in Gordonville are German (208 | 39.0%), Irish (91 | 17.1%), English (67 | 12.6%), American (54 | 10.1%), and French (19 | 3.6%), together accounting for 82.4% of all Gordonville residents.
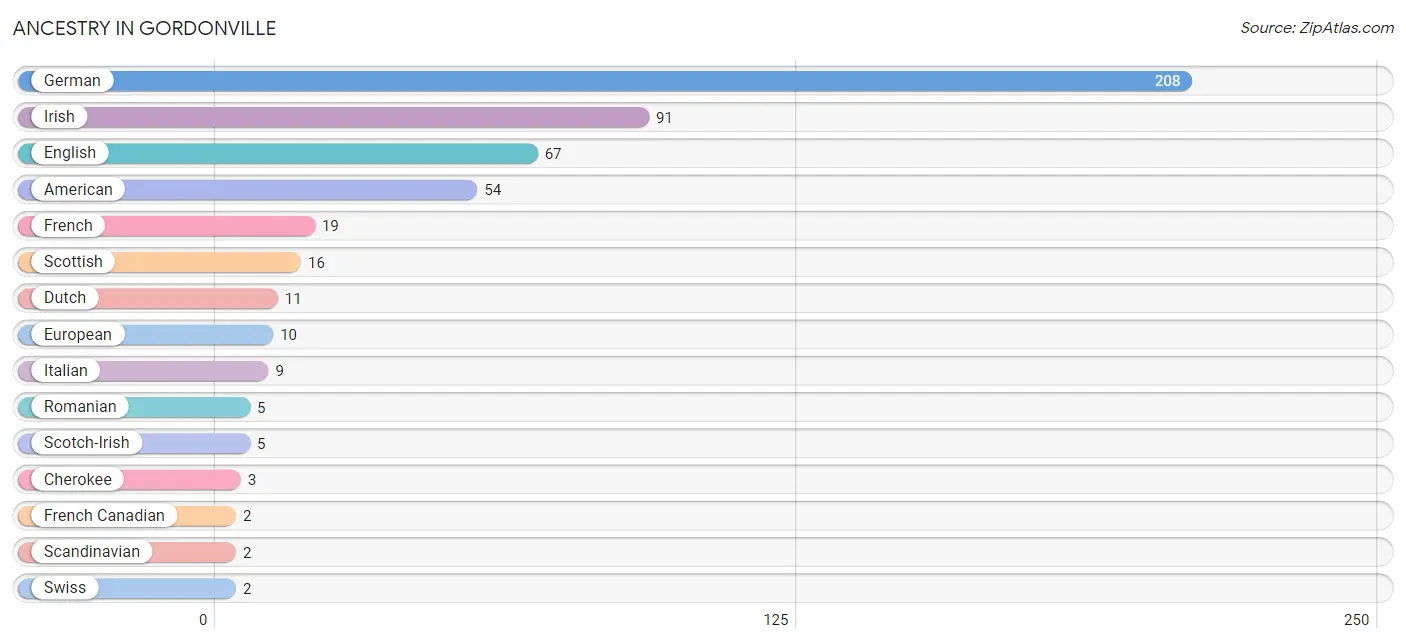
| Ancestry | # Population | % Population |
| American | 54 | 10.1% |
| Cherokee | 3 | 0.6% |
| Choctaw | 1 | 0.2% |
| Dutch | 11 | 2.1% |
| English | 67 | 12.6% |
| European | 10 | 1.9% |
| French | 19 | 3.6% |
| French Canadian | 2 | 0.4% |
| German | 208 | 39.0% |
| Irish | 91 | 17.1% |
| Italian | 9 | 1.7% |
| Romanian | 5 | 0.9% |
| Scandinavian | 2 | 0.4% |
| Scotch-Irish | 5 | 0.9% |
| Scottish | 16 | 3.0% |
| Swiss | 2 | 0.4% | View All 16 Rows |
Immigrants in Gordonville

| Immigration Origin | # Population | % Population | View All 0 Rows |
Sex and Age in Gordonville
Sex and Age in Gordonville
The most populous age groups in Gordonville are 60 to 64 Years (28 | 10.3%) for men and 55 to 59 Years (34 | 13.0%) for women.
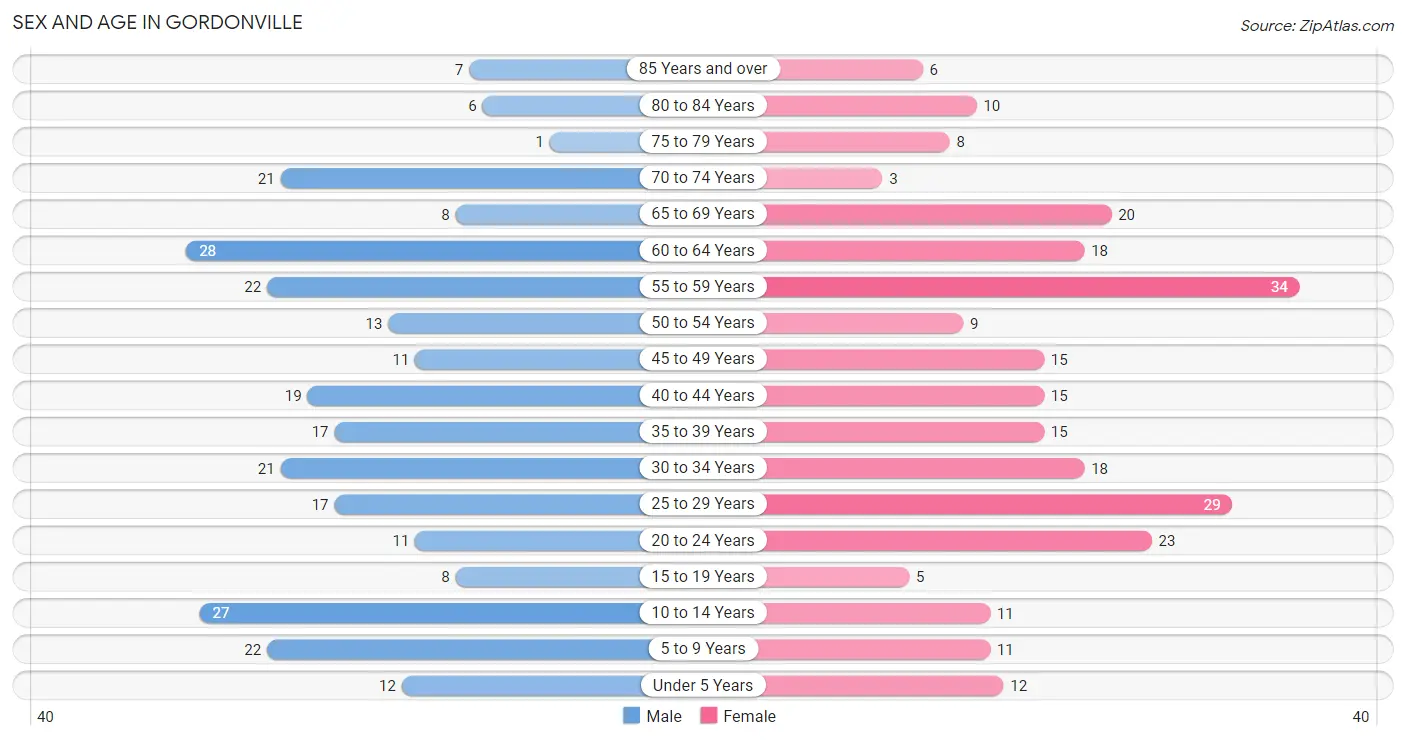
| Age Bracket | Male | Female |
| Under 5 Years | 12 (4.4%) | 12 (4.6%) |
| 5 to 9 Years | 22 (8.1%) | 11 (4.2%) |
| 10 to 14 Years | 27 (10.0%) | 11 (4.2%) |
| 15 to 19 Years | 8 (2.9%) | 5 (1.9%) |
| 20 to 24 Years | 11 (4.1%) | 23 (8.8%) |
| 25 to 29 Years | 17 (6.3%) | 29 (11.1%) |
| 30 to 34 Years | 21 (7.7%) | 18 (6.9%) |
| 35 to 39 Years | 17 (6.3%) | 15 (5.7%) |
| 40 to 44 Years | 19 (7.0%) | 15 (5.7%) |
| 45 to 49 Years | 11 (4.1%) | 15 (5.7%) |
| 50 to 54 Years | 13 (4.8%) | 9 (3.4%) |
| 55 to 59 Years | 22 (8.1%) | 34 (13.0%) |
| 60 to 64 Years | 28 (10.3%) | 18 (6.9%) |
| 65 to 69 Years | 8 (2.9%) | 20 (7.6%) |
| 70 to 74 Years | 21 (7.7%) | 3 (1.1%) |
| 75 to 79 Years | 1 (0.4%) | 8 (3.0%) |
| 80 to 84 Years | 6 (2.2%) | 10 (3.8%) |
| 85 Years and over | 7 (2.6%) | 6 (2.3%) |
| Total | 271 (100.0%) | 262 (100.0%) |
Families and Households in Gordonville
Median Family Size in Gordonville
The median family size in Gordonville is 2.73 persons per family, with single male/father families (3 | 1.8%) accounting for the largest median family size of 3.33 persons per family. On the other hand, single female/mother families (7 | 4.2%) represent the smallest median family size with 2.14 persons per family.
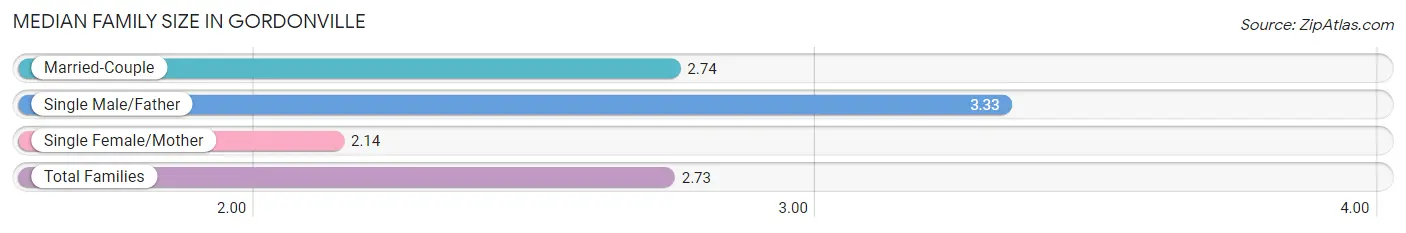
| Family Type | # Families | Family Size |
| Married-Couple | 158 (94.1%) | 2.74 |
| Single Male/Father | 3 (1.8%) | 3.33 |
| Single Female/Mother | 7 (4.2%) | 2.14 |
| Total Families | 168 (100.0%) | 2.73 |
Median Household Size in Gordonville
The median household size in Gordonville is 2.65 persons per household, with single male/father households (3 | 1.5%) accounting for the largest median household size of 5.67 persons per household. non-family households (33 | 16.4%) represent the smallest median household size with 1.64 persons per household.
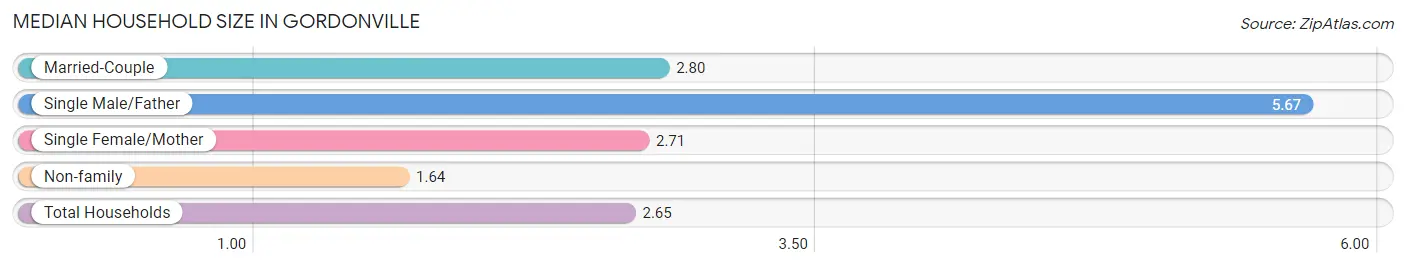
| Household Type | # Households | Household Size |
| Married-Couple | 158 (78.6%) | 2.80 |
| Single Male/Father | 3 (1.5%) | 5.67 |
| Single Female/Mother | 7 (3.5%) | 2.71 |
| Non-family | 33 (16.4%) | 1.64 |
| Total Households | 201 (100.0%) | 2.65 |
Household Size by Marriage Status in Gordonville
Out of a total of 201 households in Gordonville, 168 (83.6%) are family households, while 33 (16.4%) are nonfamily households. The most numerous type of family households are 2-person households, comprising 89, and the most common type of nonfamily households are 2-person households, comprising 18.
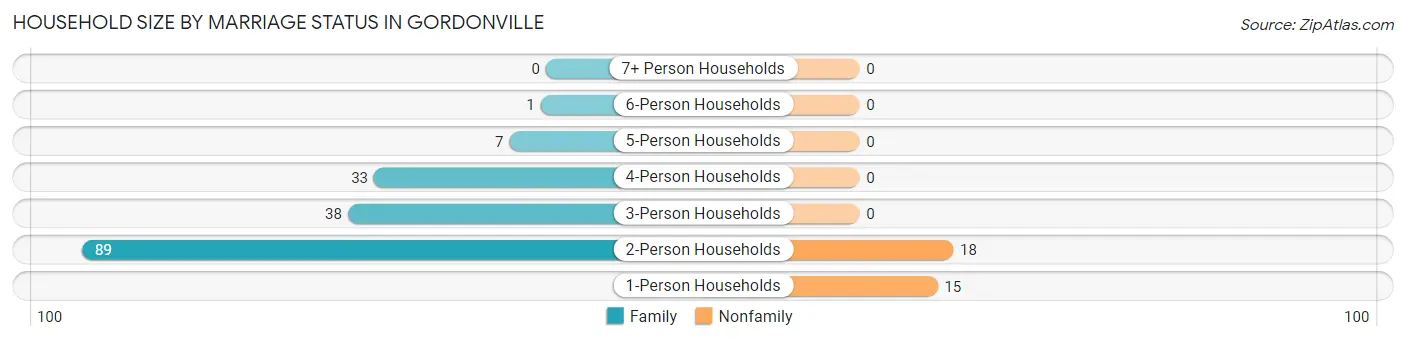
| Household Size | Family Households | Nonfamily Households |
| 1-Person Households | - | 15 (7.5%) |
| 2-Person Households | 89 (44.3%) | 18 (9.0%) |
| 3-Person Households | 38 (18.9%) | 0 (0.0%) |
| 4-Person Households | 33 (16.4%) | 0 (0.0%) |
| 5-Person Households | 7 (3.5%) | 0 (0.0%) |
| 6-Person Households | 1 (0.5%) | 0 (0.0%) |
| 7+ Person Households | 0 (0.0%) | 0 (0.0%) |
| Total | 168 (83.6%) | 33 (16.4%) |
Female Fertility in Gordonville
Fertility by Age in Gordonville
Average fertility rate in Gordonville is 65.0 births per 1,000 women. Women in the age bracket of 20 to 34 years have the highest fertility rate with 114.0 births per 1,000 women. Women in the age bracket of 20 to 34 years acount for 100.0% of all women with births.
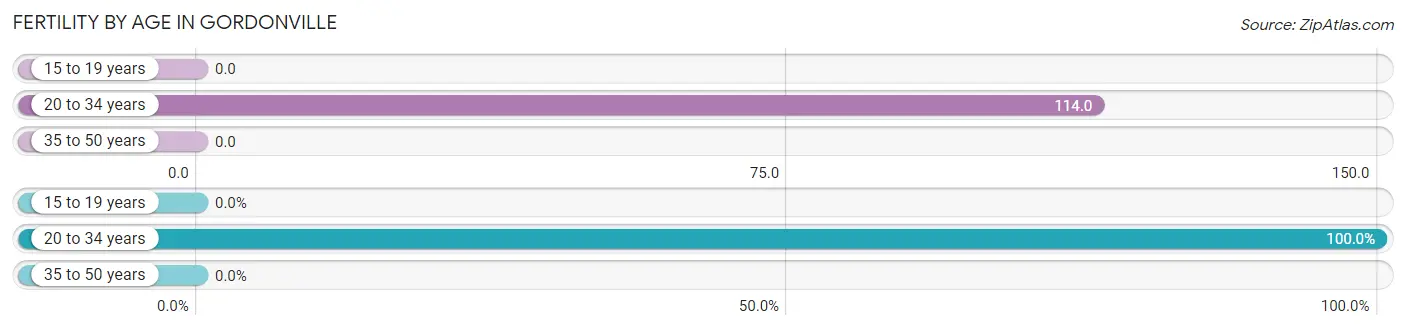
| Age Bracket | Women with Births | Births / 1,000 Women |
| 15 to 19 years | 0 (0.0%) | 0.0 |
| 20 to 34 years | 8 (100.0%) | 114.0 |
| 35 to 50 years | 0 (0.0%) | 0.0 |
| Total | 8 (100.0%) | 65.0 |
Fertility by Age by Marriage Status in Gordonville
75.0% of women with births (8) in Gordonville are married. The highest percentage of unmarried women with births falls into 20 to 34 years age bracket with 25.0% of them unmarried at the time of birth, while the lowest percentage of unmarried women with births belong to 20 to 34 years age bracket with 25.0% of them unmarried.
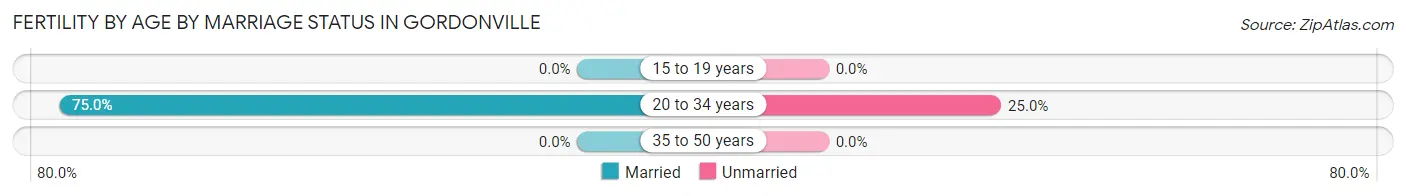
| Age Bracket | Married | Unmarried |
| 15 to 19 years | 0 (0.0%) | 0 (0.0%) |
| 20 to 34 years | 6 (75.0%) | 2 (25.0%) |
| 35 to 50 years | 0 (0.0%) | 0 (0.0%) |
| Total | 6 (75.0%) | 2 (25.0%) |
Fertility by Education in Gordonville
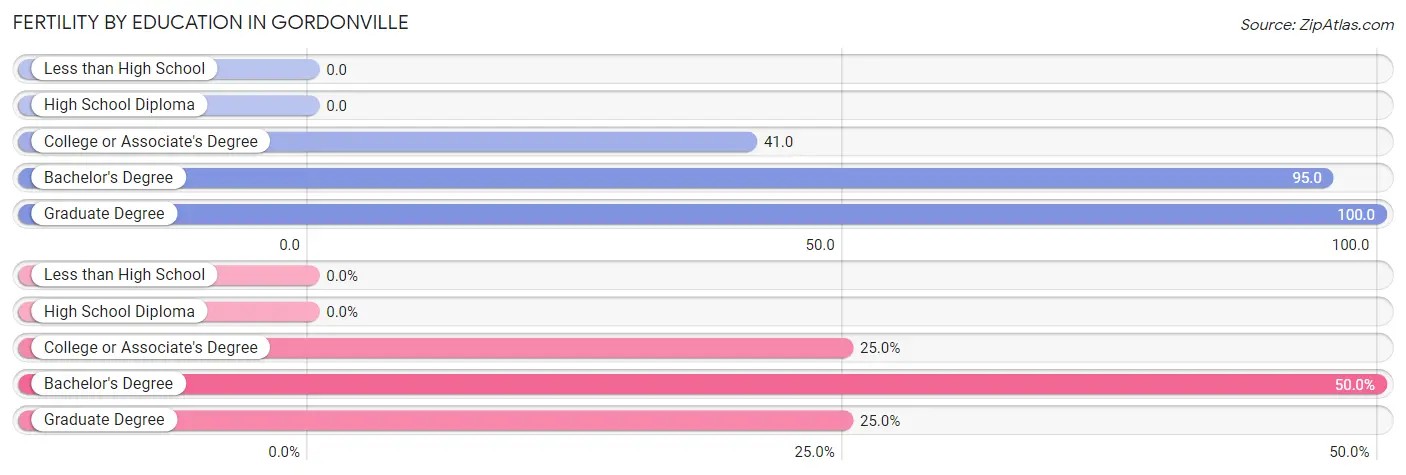
| Educational Attainment | Women with Births | Births / 1,000 Women |
| Less than High School | 0 (0.0%) | 0.0 |
| High School Diploma | 0 (0.0%) | 0.0 |
| College or Associate's Degree | 2 (25.0%) | 41.0 |
| Bachelor's Degree | 4 (50.0%) | 95.0 |
| Graduate Degree | 2 (25.0%) | 100.0 |
| Total | 8 (100.0%) | 65.0 |
Fertility by Education by Marriage Status in Gordonville
25.0% of women with births in Gordonville are unmarried. Women with the educational attainment of bachelor's degree are most likely to be married with 100.0% of them married at childbirth, while women with the educational attainment of college or associate's degree are least likely to be married with 100.0% of them unmarried at childbirth.
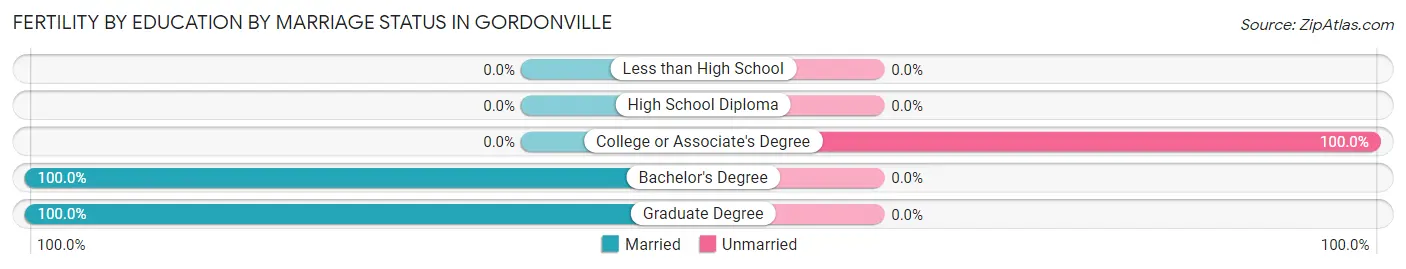
| Educational Attainment | Married | Unmarried |
| Less than High School | 0 (0.0%) | 0 (0.0%) |
| High School Diploma | 0 (0.0%) | 0 (0.0%) |
| College or Associate's Degree | 0 (0.0%) | 2 (100.0%) |
| Bachelor's Degree | 4 (100.0%) | 0 (0.0%) |
| Graduate Degree | 2 (100.0%) | 0 (0.0%) |
| Total | 6 (75.0%) | 2 (25.0%) |
Employment Characteristics in Gordonville
Employment by Class of Employer in Gordonville
Among the 296 employed individuals in Gordonville, private company employees (154 | 52.0%), not-for-profit organizations (44 | 14.9%), and self-employed (not incorporated) (36 | 12.2%) make up the most common classes of employment.
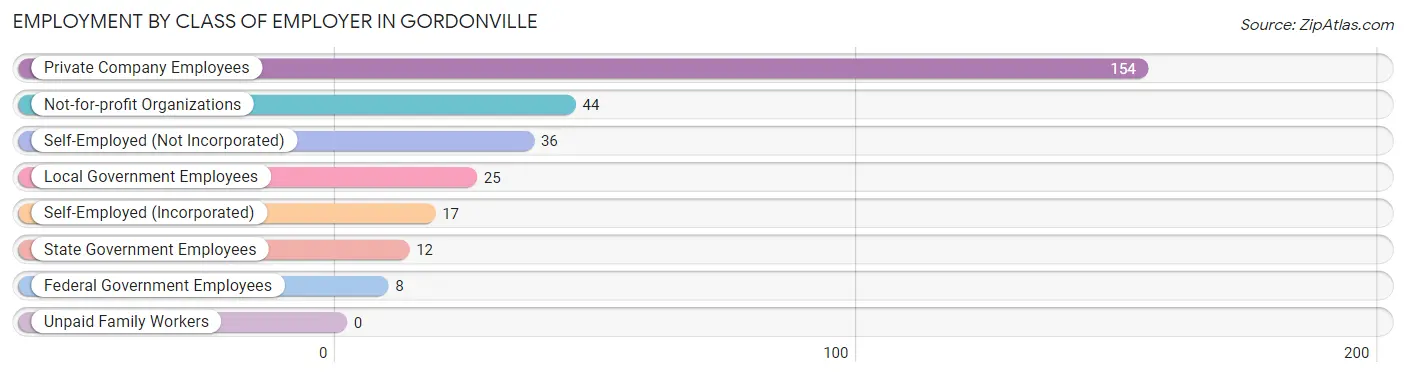
| Employer Class | # Employees | % Employees |
| Private Company Employees | 154 | 52.0% |
| Self-Employed (Incorporated) | 17 | 5.7% |
| Self-Employed (Not Incorporated) | 36 | 12.2% |
| Not-for-profit Organizations | 44 | 14.9% |
| Local Government Employees | 25 | 8.5% |
| State Government Employees | 12 | 4.1% |
| Federal Government Employees | 8 | 2.7% |
| Unpaid Family Workers | 0 | 0.0% |
| Total | 296 | 100.0% |
Employment Status by Age in Gordonville
According to the labor force statistics for Gordonville, out of the total population over 16 years of age (437), 70.0% or 306 individuals are in the labor force, with 1.0% or 3 of them unemployed. The age group with the highest labor force participation rate is 35 to 44 years, with 97.0% or 64 individuals in the labor force. Within the labor force, the 30 to 34 years age range has the highest percentage of unemployed individuals, with 5.6% or 2 of them being unemployed.
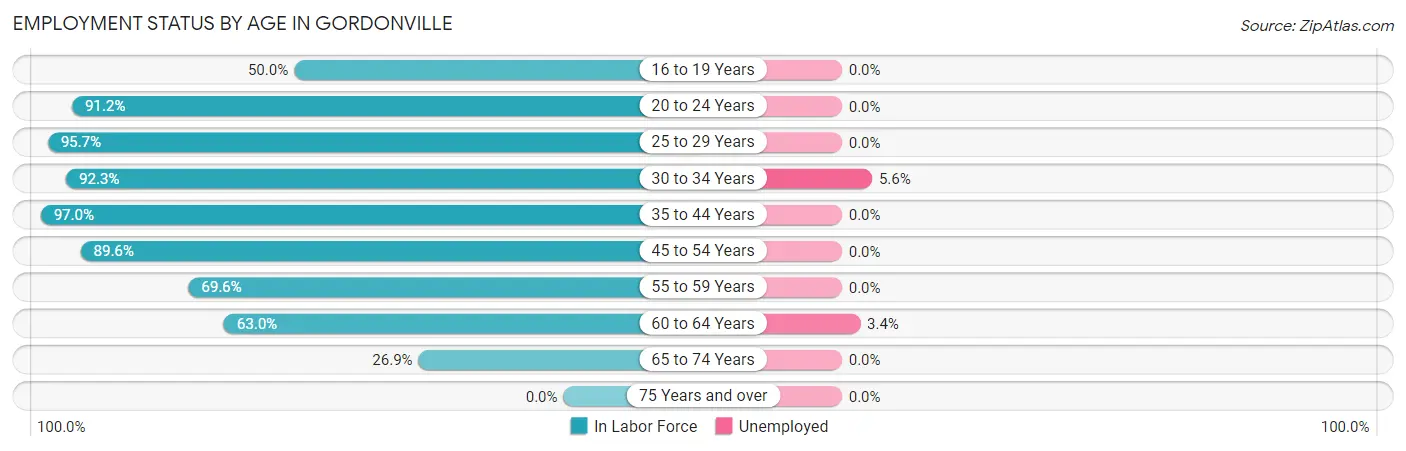
| Age Bracket | In Labor Force | Unemployed |
| 16 to 19 Years | 6 (50.0%) | 0 (0.0%) |
| 20 to 24 Years | 31 (91.2%) | 0 (0.0%) |
| 25 to 29 Years | 44 (95.7%) | 0 (0.0%) |
| 30 to 34 Years | 36 (92.3%) | 2 (5.6%) |
| 35 to 44 Years | 64 (97.0%) | 0 (0.0%) |
| 45 to 54 Years | 43 (89.6%) | 0 (0.0%) |
| 55 to 59 Years | 39 (69.6%) | 0 (0.0%) |
| 60 to 64 Years | 29 (63.0%) | 1 (3.4%) |
| 65 to 74 Years | 14 (26.9%) | 0 (0.0%) |
| 75 Years and over | 0 (0.0%) | 0 (0.0%) |
| Total | 306 (70.0%) | 3 (1.0%) |
Employment Status by Educational Attainment in Gordonville
According to labor force statistics for Gordonville, 84.7% of individuals (255) out of the total population between 25 and 64 years of age (301) are in the labor force, with 1.2% or 3 of them being unemployed. The group with the highest labor force participation rate are those with the educational attainment of bachelor's degree or higher, with 89.7% or 113 individuals in the labor force. Within the labor force, individuals with college / associate degree education have the highest percentage of unemployment, with 2.2% or 2 of them being unemployed.
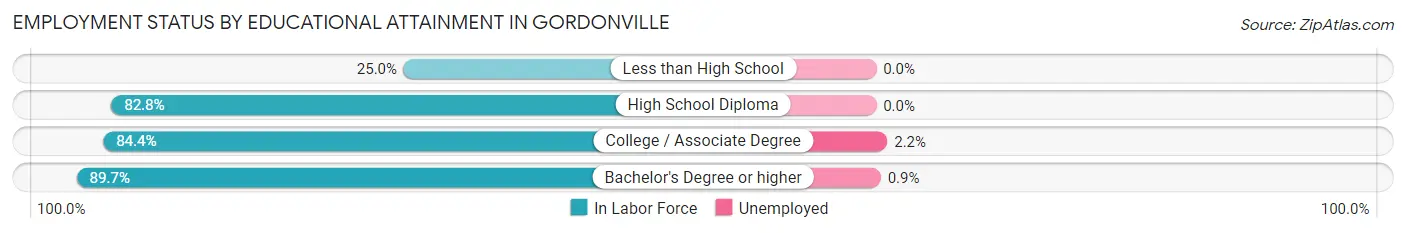
| Educational Attainment | In Labor Force | Unemployed |
| Less than High School | 2 (25.0%) | 0 (0.0%) |
| High School Diploma | 48 (82.8%) | 0 (0.0%) |
| College / Associate Degree | 92 (84.4%) | 2 (2.2%) |
| Bachelor's Degree or higher | 113 (89.7%) | 1 (0.9%) |
| Total | 255 (84.7%) | 4 (1.2%) |
Employment Occupations by Sex in Gordonville
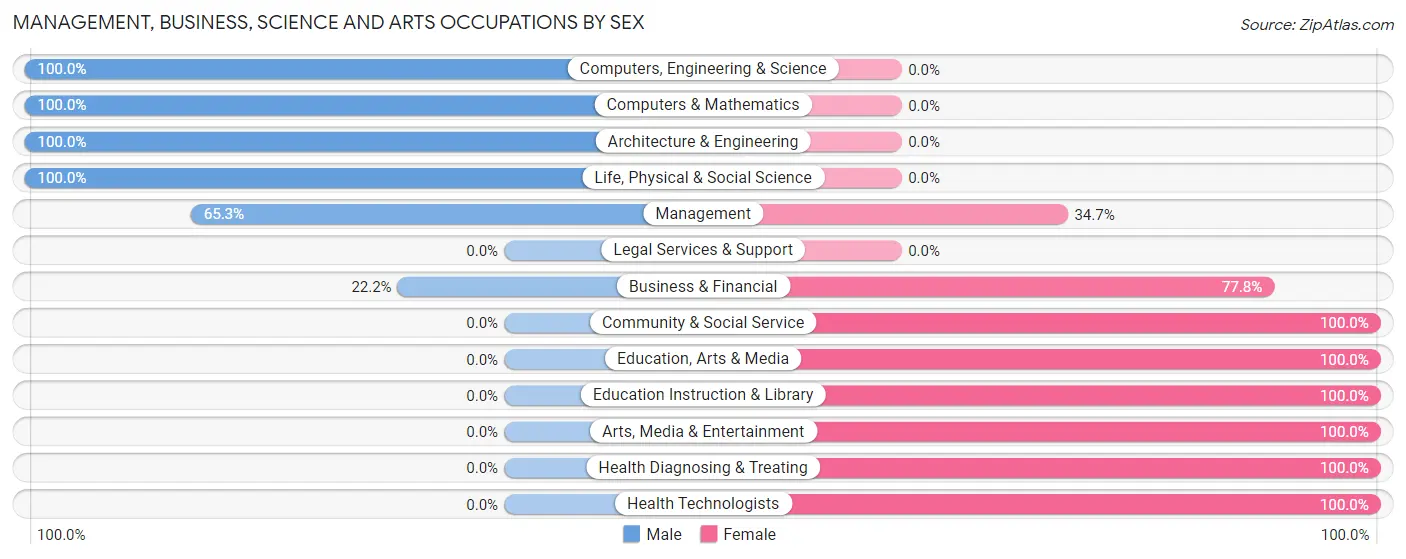
Management, Business, Science and Arts Occupations
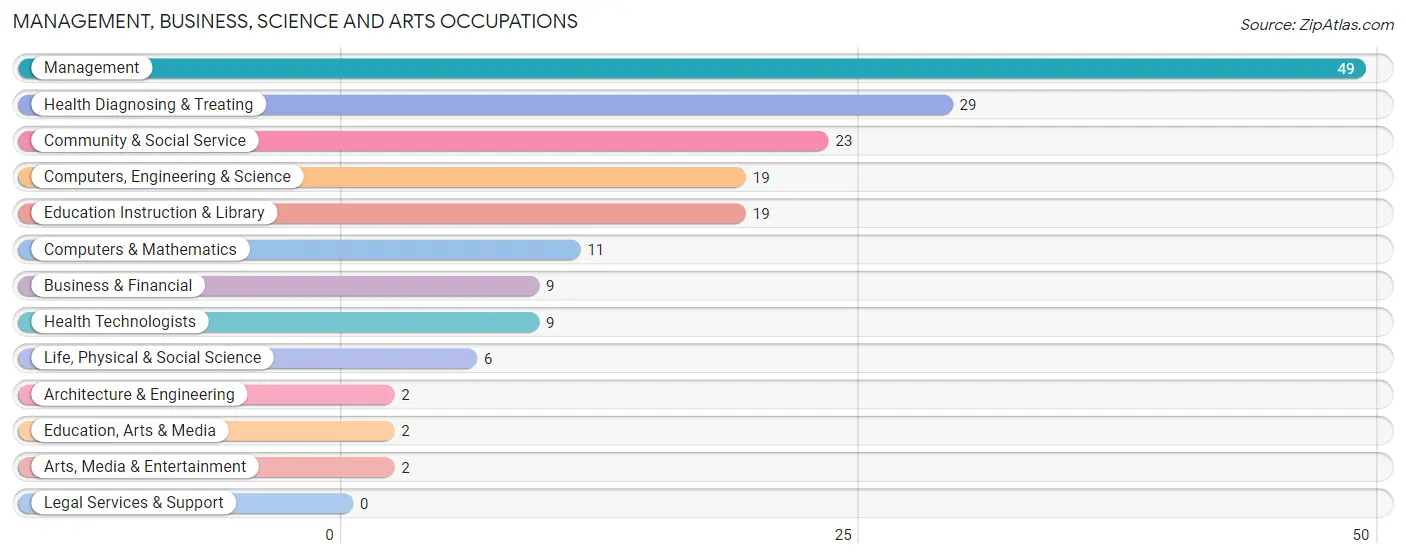
The most common Management, Business, Science and Arts occupations in Gordonville are Management (49 | 16.3%), Health Diagnosing & Treating (29 | 9.7%), Community & Social Service (23 | 7.7%), Computers, Engineering & Science (19 | 6.3%), and Education Instruction & Library (19 | 6.3%).
Management, Business, Science and Arts Occupations by Sex
Within the Management, Business, Science and Arts occupations in Gordonville, the most male-oriented occupations are Computers, Engineering & Science (100.0%), Computers & Mathematics (100.0%), and Architecture & Engineering (100.0%), while the most female-oriented occupations are Community & Social Service (100.0%), Education, Arts & Media (100.0%), and Education Instruction & Library (100.0%).
| Occupation | Male | Female |
| Management | 32 (65.3%) | 17 (34.7%) |
| Business & Financial | 2 (22.2%) | 7 (77.8%) |
| Computers, Engineering & Science | 19 (100.0%) | 0 (0.0%) |
| Computers & Mathematics | 11 (100.0%) | 0 (0.0%) |
| Architecture & Engineering | 2 (100.0%) | 0 (0.0%) |
| Life, Physical & Social Science | 6 (100.0%) | 0 (0.0%) |
| Community & Social Service | 0 (0.0%) | 23 (100.0%) |
| Education, Arts & Media | 0 (0.0%) | 2 (100.0%) |
| Legal Services & Support | 0 (0.0%) | 0 (0.0%) |
| Education Instruction & Library | 0 (0.0%) | 19 (100.0%) |
| Arts, Media & Entertainment | 0 (0.0%) | 2 (100.0%) |
| Health Diagnosing & Treating | 0 (0.0%) | 29 (100.0%) |
| Health Technologists | 0 (0.0%) | 9 (100.0%) |
| Total (Category) | 53 (41.1%) | 76 (58.9%) |
| Total (Overall) | 148 (49.3%) | 152 (50.7%) |
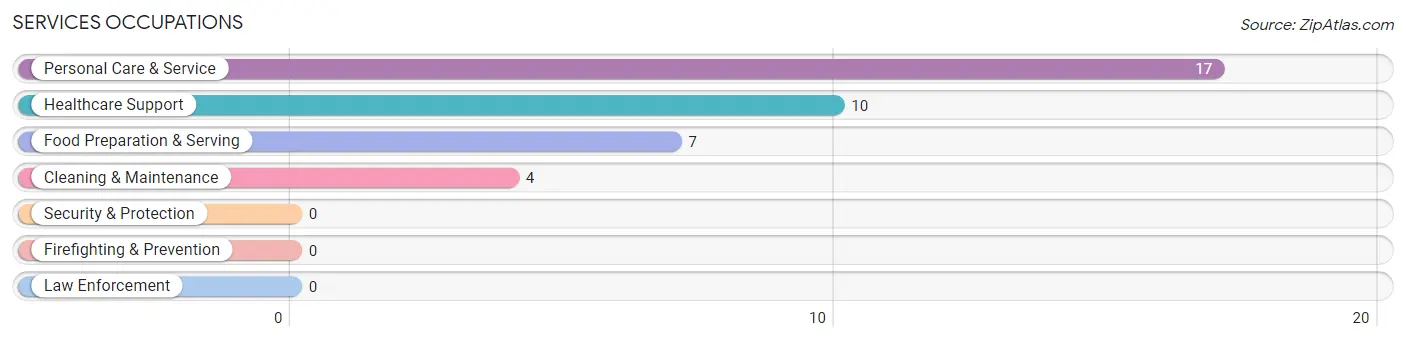
Services Occupations
The most common Services occupations in Gordonville are Personal Care & Service (17 | 5.7%), Healthcare Support (10 | 3.3%), Food Preparation & Serving (7 | 2.3%), and Cleaning & Maintenance (4 | 1.3%).
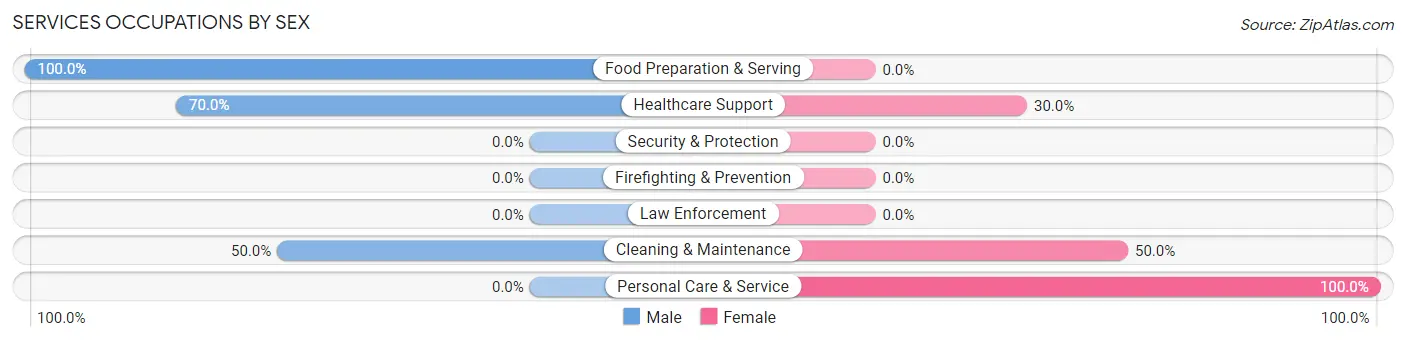
Services Occupations by Sex
Within the Services occupations in Gordonville, the most male-oriented occupations are Food Preparation & Serving (100.0%), Healthcare Support (70.0%), and Cleaning & Maintenance (50.0%), while the most female-oriented occupations are Personal Care & Service (100.0%), Cleaning & Maintenance (50.0%), and Healthcare Support (30.0%).
| Occupation | Male | Female |
| Healthcare Support | 7 (70.0%) | 3 (30.0%) |
| Security & Protection | 0 (0.0%) | 0 (0.0%) |
| Firefighting & Prevention | 0 (0.0%) | 0 (0.0%) |
| Law Enforcement | 0 (0.0%) | 0 (0.0%) |
| Food Preparation & Serving | 7 (100.0%) | 0 (0.0%) |
| Cleaning & Maintenance | 2 (50.0%) | 2 (50.0%) |
| Personal Care & Service | 0 (0.0%) | 17 (100.0%) |
| Total (Category) | 16 (42.1%) | 22 (57.9%) |
| Total (Overall) | 148 (49.3%) | 152 (50.7%) |
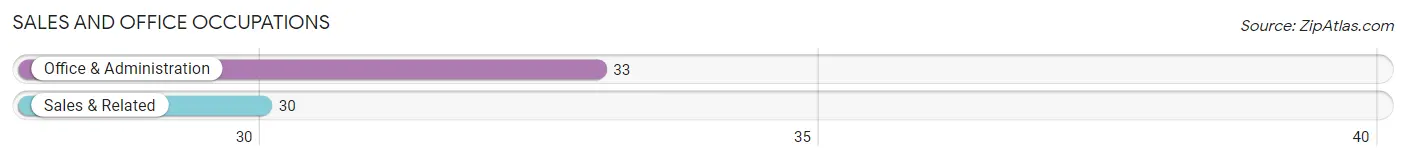
Sales and Office Occupations
The most common Sales and Office occupations in Gordonville are Office & Administration (33 | 11.0%), and Sales & Related (30 | 10.0%).
Sales and Office Occupations by Sex
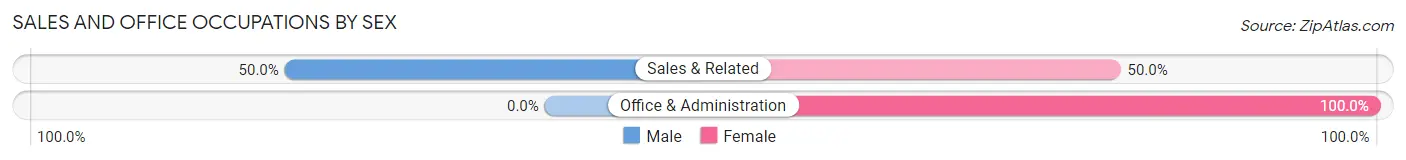
| Occupation | Male | Female |
| Sales & Related | 15 (50.0%) | 15 (50.0%) |
| Office & Administration | 0 (0.0%) | 33 (100.0%) |
| Total (Category) | 15 (23.8%) | 48 (76.2%) |
| Total (Overall) | 148 (49.3%) | 152 (50.7%) |
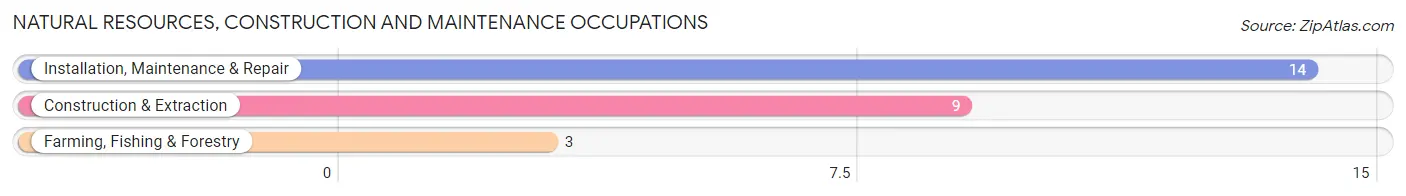
Natural Resources, Construction and Maintenance Occupations
The most common Natural Resources, Construction and Maintenance occupations in Gordonville are Installation, Maintenance & Repair (14 | 4.7%), Construction & Extraction (9 | 3.0%), and Farming, Fishing & Forestry (3 | 1.0%).
Natural Resources, Construction and Maintenance Occupations by Sex
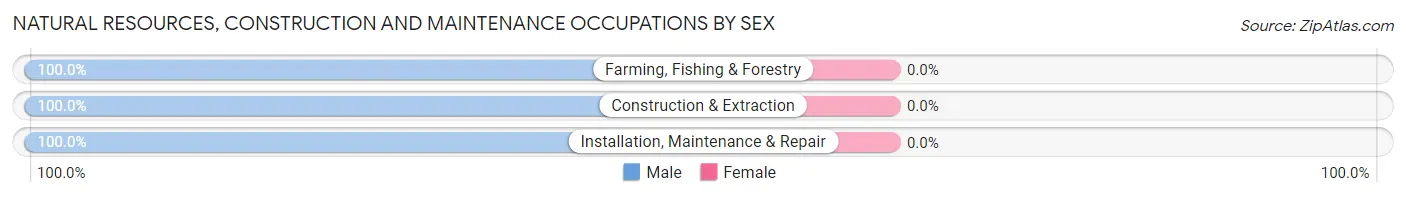
| Occupation | Male | Female |
| Farming, Fishing & Forestry | 3 (100.0%) | 0 (0.0%) |
| Construction & Extraction | 9 (100.0%) | 0 (0.0%) |
| Installation, Maintenance & Repair | 14 (100.0%) | 0 (0.0%) |
| Total (Category) | 26 (100.0%) | 0 (0.0%) |
| Total (Overall) | 148 (49.3%) | 152 (50.7%) |
Production, Transportation and Moving Occupations
The most common Production, Transportation and Moving occupations in Gordonville are Production (23 | 7.7%), Transportation (18 | 6.0%), and Material Moving (3 | 1.0%).
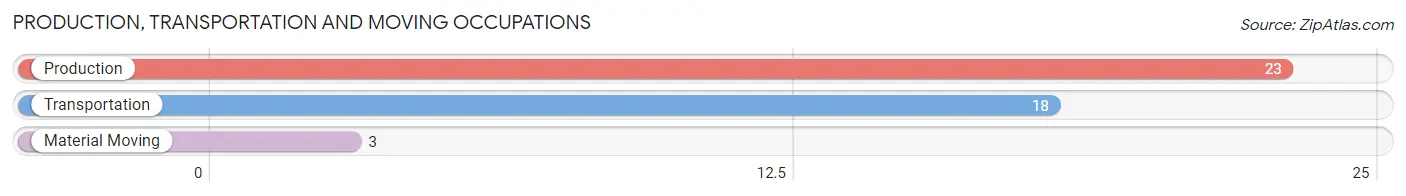
Production, Transportation and Moving Occupations by Sex
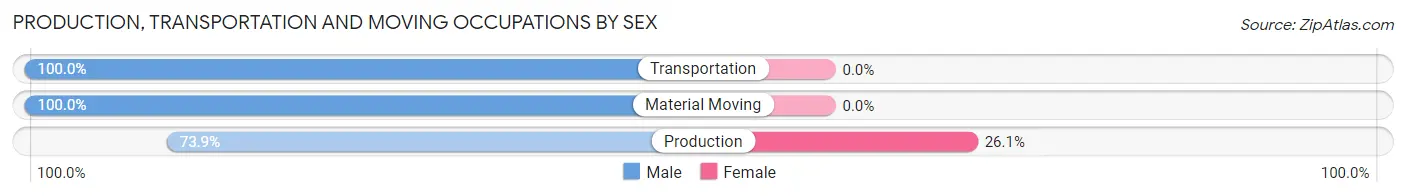
| Occupation | Male | Female |
| Production | 17 (73.9%) | 6 (26.1%) |
| Transportation | 18 (100.0%) | 0 (0.0%) |
| Material Moving | 3 (100.0%) | 0 (0.0%) |
| Total (Category) | 38 (86.4%) | 6 (13.6%) |
| Total (Overall) | 148 (49.3%) | 152 (50.7%) |
Employment Industries by Sex in Gordonville
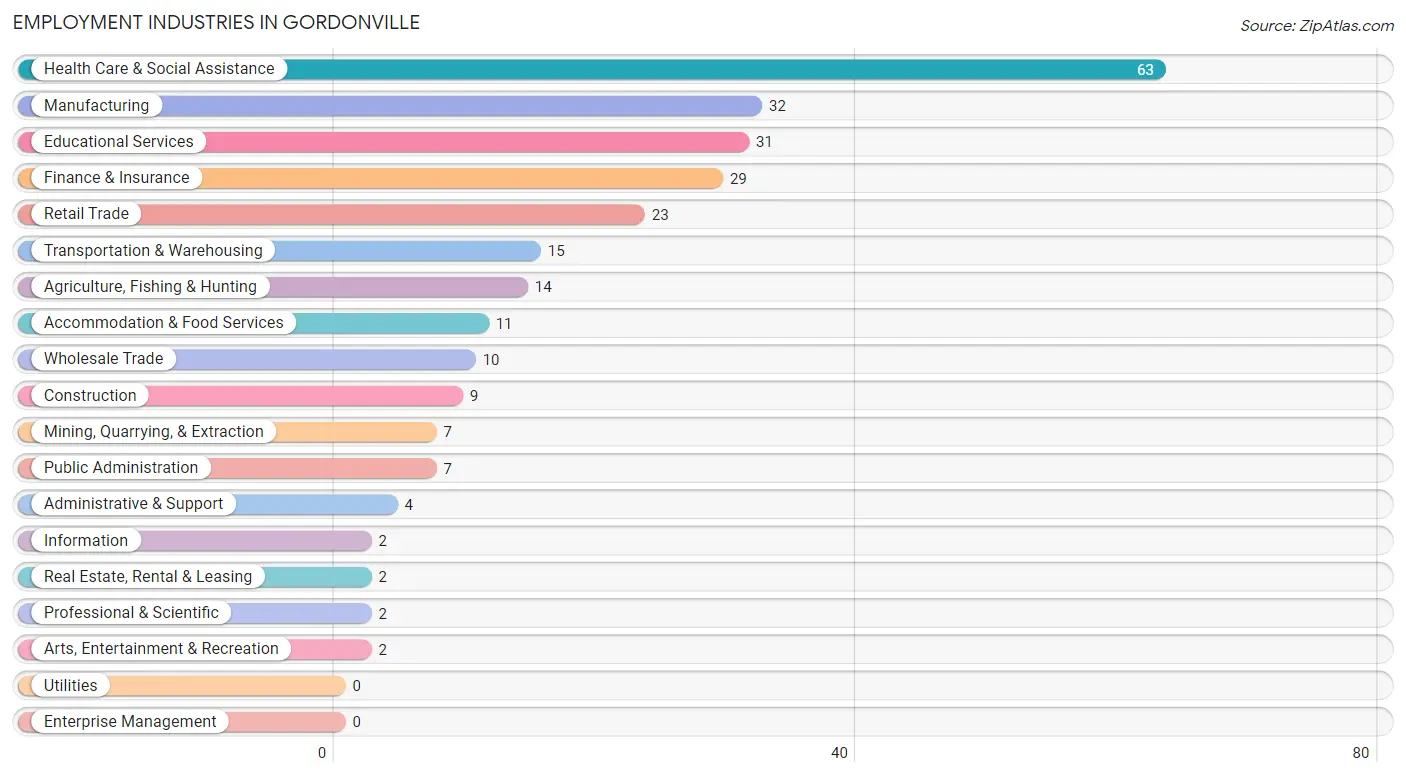
Employment Industries in Gordonville
The major employment industries in Gordonville include Health Care & Social Assistance (63 | 21.0%), Manufacturing (32 | 10.7%), Educational Services (31 | 10.3%), Finance & Insurance (29 | 9.7%), and Retail Trade (23 | 7.7%).
Employment Industries by Sex in Gordonville
The Gordonville industries that see more men than women are Agriculture, Fishing & Hunting (100.0%), Mining, Quarrying, & Extraction (100.0%), and Construction (100.0%), whereas the industries that tend to have a higher number of women are Arts, Entertainment & Recreation (100.0%), Finance & Insurance (82.8%), and Health Care & Social Assistance (82.5%).
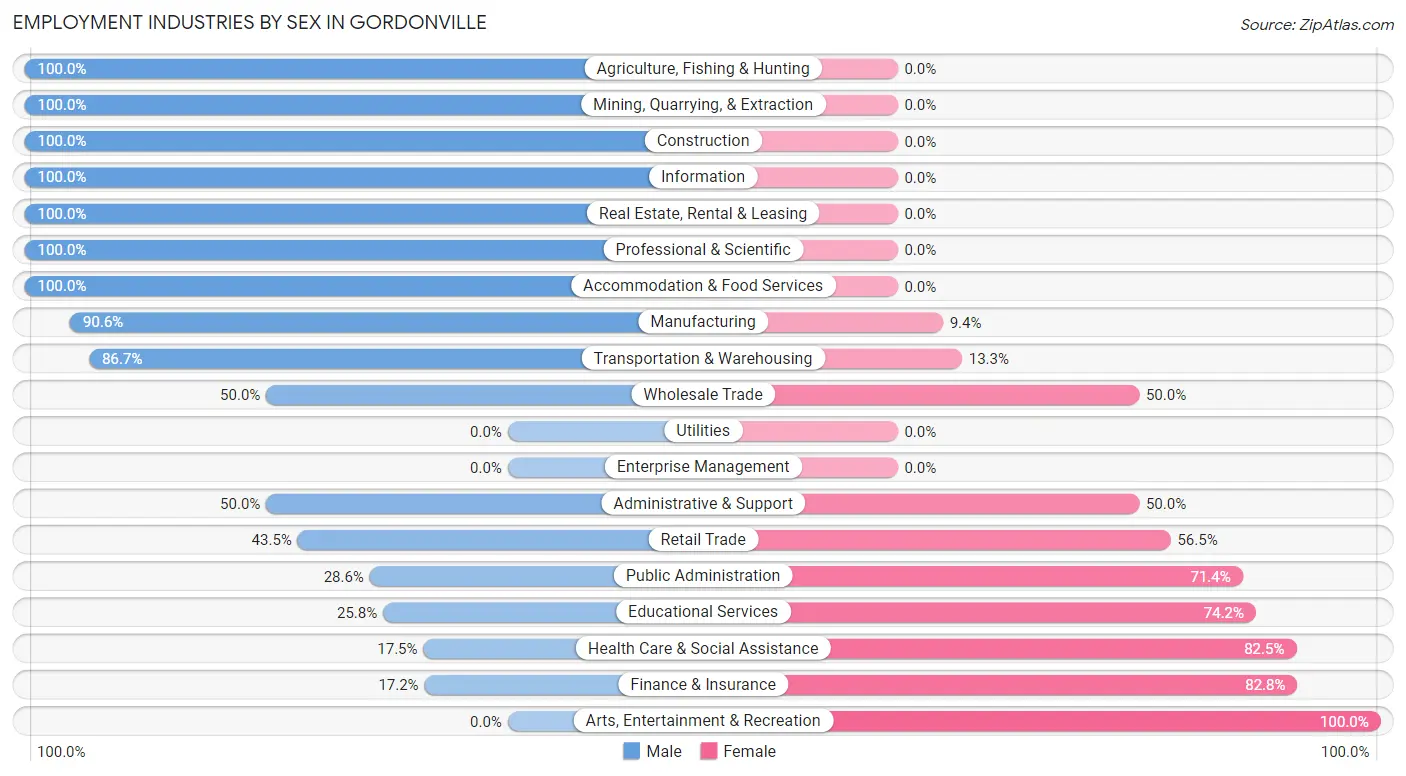
| Industry | Male | Female |
| Agriculture, Fishing & Hunting | 14 (100.0%) | 0 (0.0%) |
| Mining, Quarrying, & Extraction | 7 (100.0%) | 0 (0.0%) |
| Construction | 9 (100.0%) | 0 (0.0%) |
| Manufacturing | 29 (90.6%) | 3 (9.4%) |
| Wholesale Trade | 5 (50.0%) | 5 (50.0%) |
| Retail Trade | 10 (43.5%) | 13 (56.5%) |
| Transportation & Warehousing | 13 (86.7%) | 2 (13.3%) |
| Utilities | 0 (0.0%) | 0 (0.0%) |
| Information | 2 (100.0%) | 0 (0.0%) |
| Finance & Insurance | 5 (17.2%) | 24 (82.8%) |
| Real Estate, Rental & Leasing | 2 (100.0%) | 0 (0.0%) |
| Professional & Scientific | 2 (100.0%) | 0 (0.0%) |
| Enterprise Management | 0 (0.0%) | 0 (0.0%) |
| Administrative & Support | 2 (50.0%) | 2 (50.0%) |
| Educational Services | 8 (25.8%) | 23 (74.2%) |
| Health Care & Social Assistance | 11 (17.5%) | 52 (82.5%) |
| Arts, Entertainment & Recreation | 0 (0.0%) | 2 (100.0%) |
| Accommodation & Food Services | 11 (100.0%) | 0 (0.0%) |
| Public Administration | 2 (28.6%) | 5 (71.4%) |
| Total | 148 (49.3%) | 152 (50.7%) |
Education in Gordonville
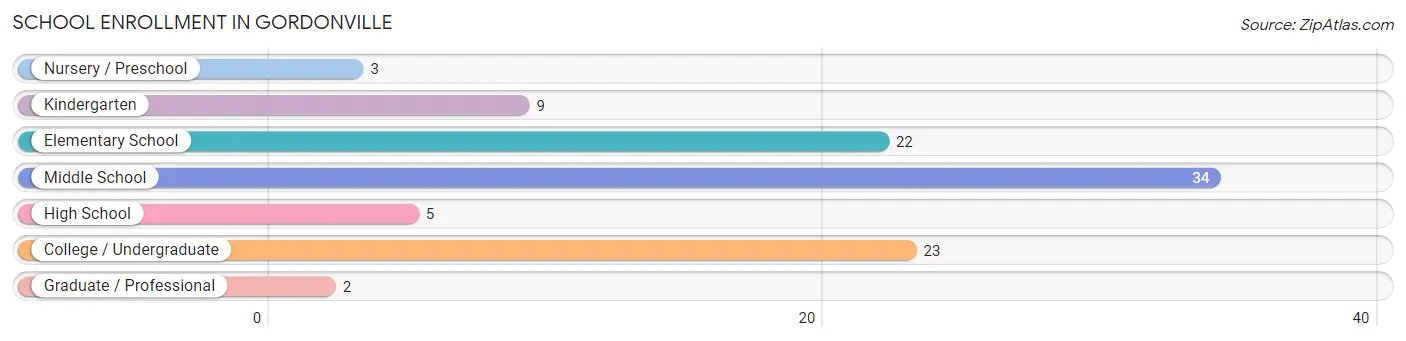
School Enrollment in Gordonville
The most common levels of schooling among the 98 students in Gordonville are middle school (34 | 34.7%), college / undergraduate (23 | 23.5%), and elementary school (22 | 22.5%).
| School Level | # Students | % Students |
| Nursery / Preschool | 3 | 3.1% |
| Kindergarten | 9 | 9.2% |
| Elementary School | 22 | 22.5% |
| Middle School | 34 | 34.7% |
| High School | 5 | 5.1% |
| College / Undergraduate | 23 | 23.5% |
| Graduate / Professional | 2 | 2.0% |
| Total | 98 | 100.0% |
School Enrollment by Age by Funding Source in Gordonville
Out of a total of 98 students who are enrolled in schools in Gordonville, 18 (18.4%) attend a private institution, while the remaining 80 (81.6%) are enrolled in public schools. The age group of 3 to 4 year olds has the highest likelihood of being enrolled in private schools, with 3 (100.0% in the age bracket) enrolled. Conversely, the age group of 15 to 17 year olds has the lowest likelihood of being enrolled in a private school, with 3 (100.0% in the age bracket) attending a public institution.
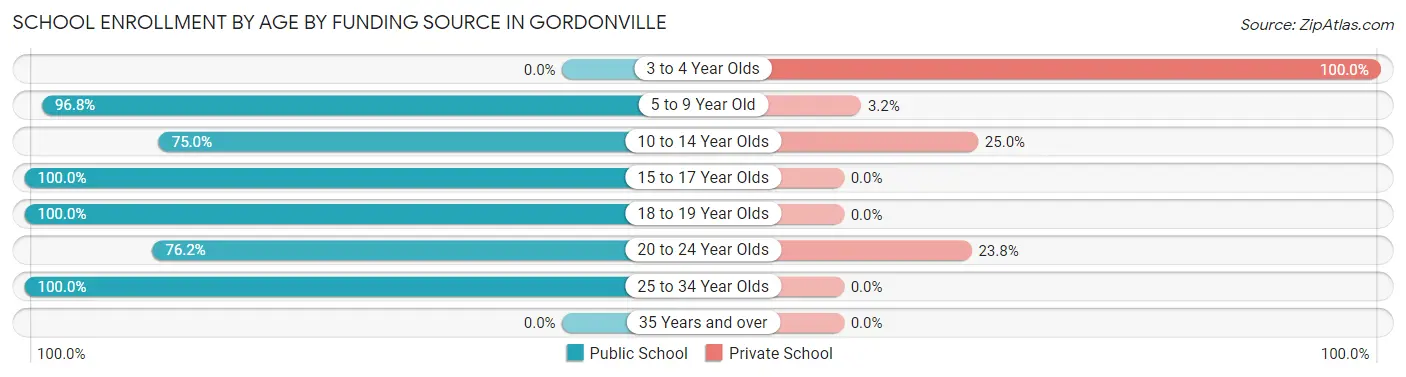
| Age Bracket | Public School | Private School |
| 3 to 4 Year Olds | 0 (0.0%) | 3 (100.0%) |
| 5 to 9 Year Old | 30 (96.8%) | 1 (3.2%) |
| 10 to 14 Year Olds | 27 (75.0%) | 9 (25.0%) |
| 15 to 17 Year Olds | 3 (100.0%) | 0 (0.0%) |
| 18 to 19 Year Olds | 2 (100.0%) | 0 (0.0%) |
| 20 to 24 Year Olds | 16 (76.2%) | 5 (23.8%) |
| 25 to 34 Year Olds | 2 (100.0%) | 0 (0.0%) |
| 35 Years and over | 0 (0.0%) | 0 (0.0%) |
| Total | 80 (81.6%) | 18 (18.4%) |
Educational Attainment by Field of Study in Gordonville
Education (58 | 35.6%), business (24 | 14.7%), bio, nature & agricultural (23 | 14.1%), liberal arts & history (13 | 8.0%), and science & technology (10 | 6.1%) are the most common fields of study among 163 individuals in Gordonville who have obtained a bachelor's degree or higher.
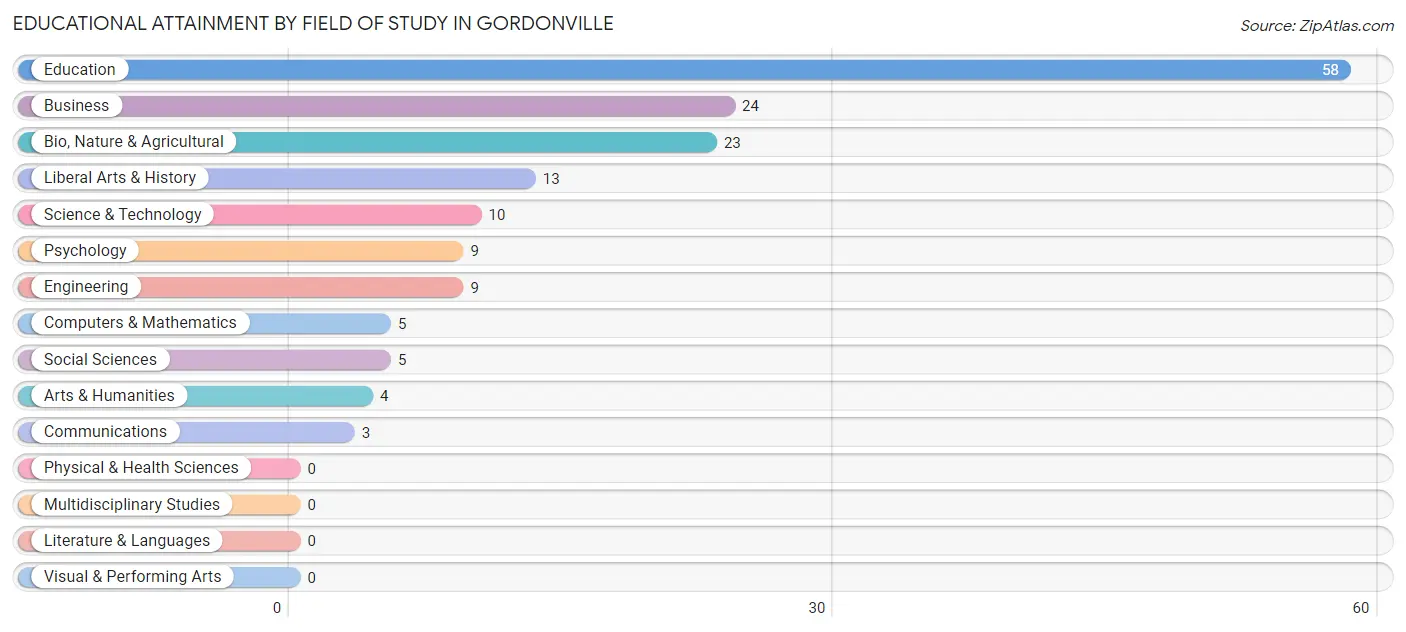
| Field of Study | # Graduates | % Graduates |
| Computers & Mathematics | 5 | 3.1% |
| Bio, Nature & Agricultural | 23 | 14.1% |
| Physical & Health Sciences | 0 | 0.0% |
| Psychology | 9 | 5.5% |
| Social Sciences | 5 | 3.1% |
| Engineering | 9 | 5.5% |
| Multidisciplinary Studies | 0 | 0.0% |
| Science & Technology | 10 | 6.1% |
| Business | 24 | 14.7% |
| Education | 58 | 35.6% |
| Literature & Languages | 0 | 0.0% |
| Liberal Arts & History | 13 | 8.0% |
| Visual & Performing Arts | 0 | 0.0% |
| Communications | 3 | 1.8% |
| Arts & Humanities | 4 | 2.5% |
| Total | 163 | 100.0% |
Transportation & Commute in Gordonville
Vehicle Availability by Sex in Gordonville
The most prevalent vehicle ownership categories in Gordonville are males with 2 vehicles (68, accounting for 46.0%) and females with 2 vehicles (78, making up 46.0%).
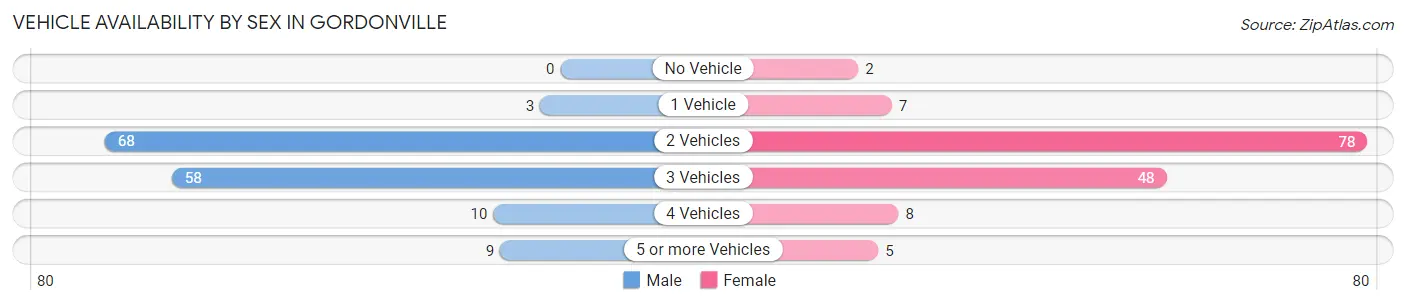
| Vehicles Available | Male | Female |
| No Vehicle | 0 (0.0%) | 2 (1.3%) |
| 1 Vehicle | 3 (2.0%) | 7 (4.7%) |
| 2 Vehicles | 68 (46.0%) | 78 (52.7%) |
| 3 Vehicles | 58 (39.2%) | 48 (32.4%) |
| 4 Vehicles | 10 (6.8%) | 8 (5.4%) |
| 5 or more Vehicles | 9 (6.1%) | 5 (3.4%) |
| Total | 148 (100.0%) | 148 (100.0%) |
Commute Time in Gordonville
The most frequently occuring commute durations in Gordonville are 15 to 19 minutes (83 commuters, 29.4%), 20 to 24 minutes (72 commuters, 25.5%), and 10 to 14 minutes (71 commuters, 25.2%).
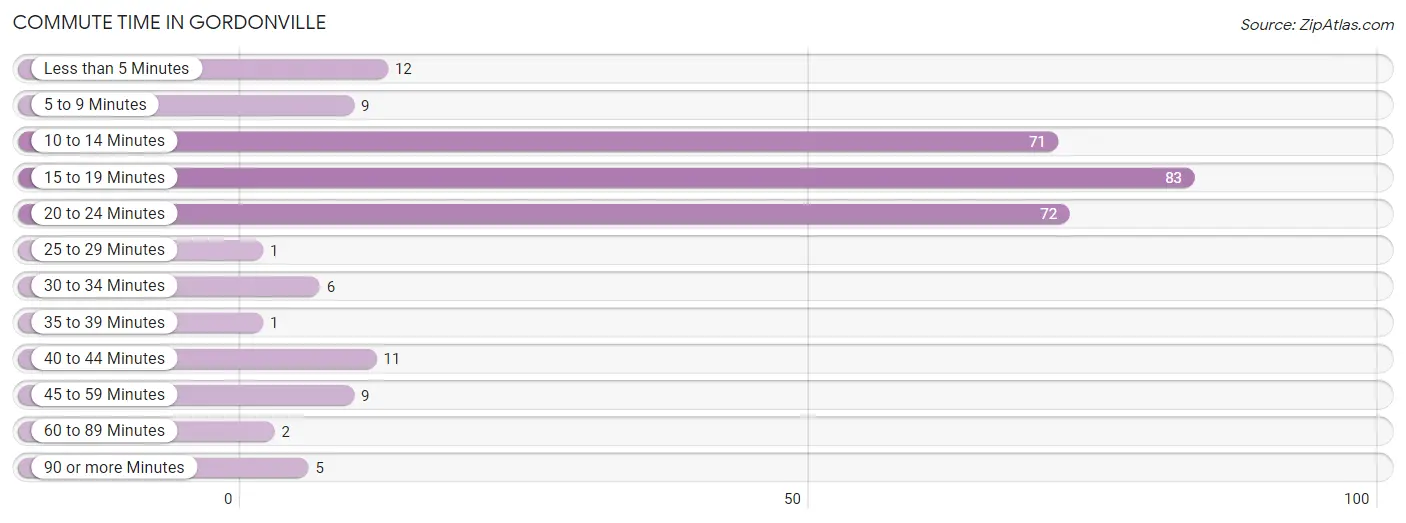
| Commute Time | # Commuters | % Commuters |
| Less than 5 Minutes | 12 | 4.3% |
| 5 to 9 Minutes | 9 | 3.2% |
| 10 to 14 Minutes | 71 | 25.2% |
| 15 to 19 Minutes | 83 | 29.4% |
| 20 to 24 Minutes | 72 | 25.5% |
| 25 to 29 Minutes | 1 | 0.4% |
| 30 to 34 Minutes | 6 | 2.1% |
| 35 to 39 Minutes | 1 | 0.4% |
| 40 to 44 Minutes | 11 | 3.9% |
| 45 to 59 Minutes | 9 | 3.2% |
| 60 to 89 Minutes | 2 | 0.7% |
| 90 or more Minutes | 5 | 1.8% |
Commute Time by Sex in Gordonville
The most common commute times in Gordonville are 20 to 24 minutes (43 commuters, 30.9%) for males and 15 to 19 minutes (42 commuters, 29.4%) for females.
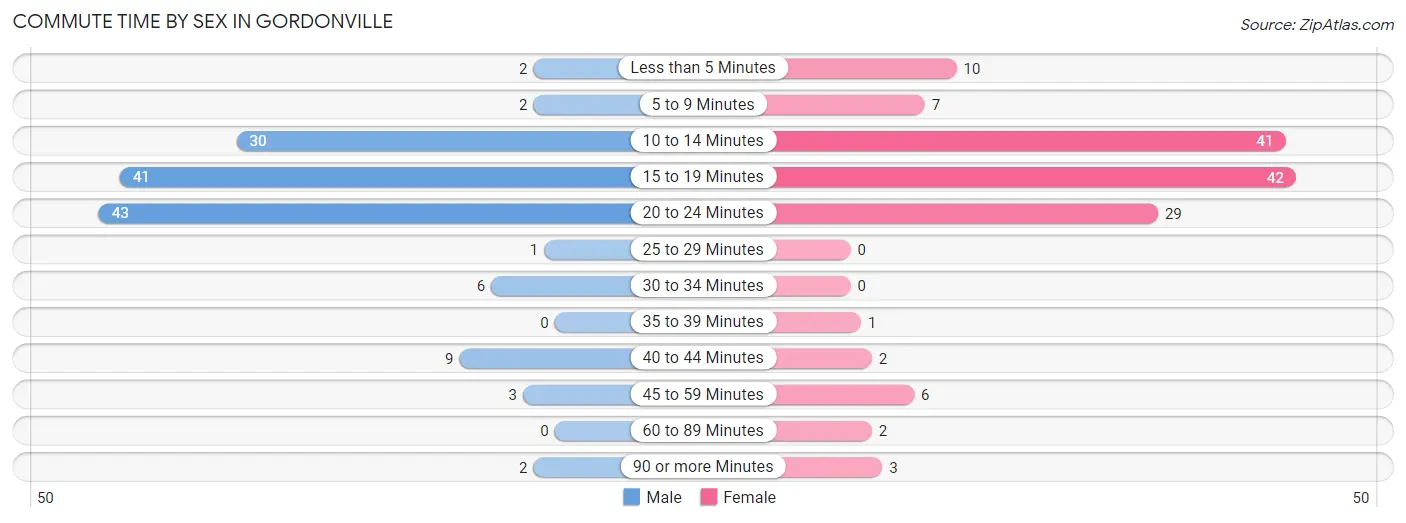
| Commute Time | Male | Female |
| Less than 5 Minutes | 2 (1.4%) | 10 (7.0%) |
| 5 to 9 Minutes | 2 (1.4%) | 7 (4.9%) |
| 10 to 14 Minutes | 30 (21.6%) | 41 (28.7%) |
| 15 to 19 Minutes | 41 (29.5%) | 42 (29.4%) |
| 20 to 24 Minutes | 43 (30.9%) | 29 (20.3%) |
| 25 to 29 Minutes | 1 (0.7%) | 0 (0.0%) |
| 30 to 34 Minutes | 6 (4.3%) | 0 (0.0%) |
| 35 to 39 Minutes | 0 (0.0%) | 1 (0.7%) |
| 40 to 44 Minutes | 9 (6.5%) | 2 (1.4%) |
| 45 to 59 Minutes | 3 (2.2%) | 6 (4.2%) |
| 60 to 89 Minutes | 0 (0.0%) | 2 (1.4%) |
| 90 or more Minutes | 2 (1.4%) | 3 (2.1%) |
Time of Departure to Work by Sex in Gordonville
The most frequent times of departure to work in Gordonville are 6:30 AM to 6:59 AM (25, 18.0%) for males and 7:00 AM to 7:29 AM (56, 39.2%) for females.
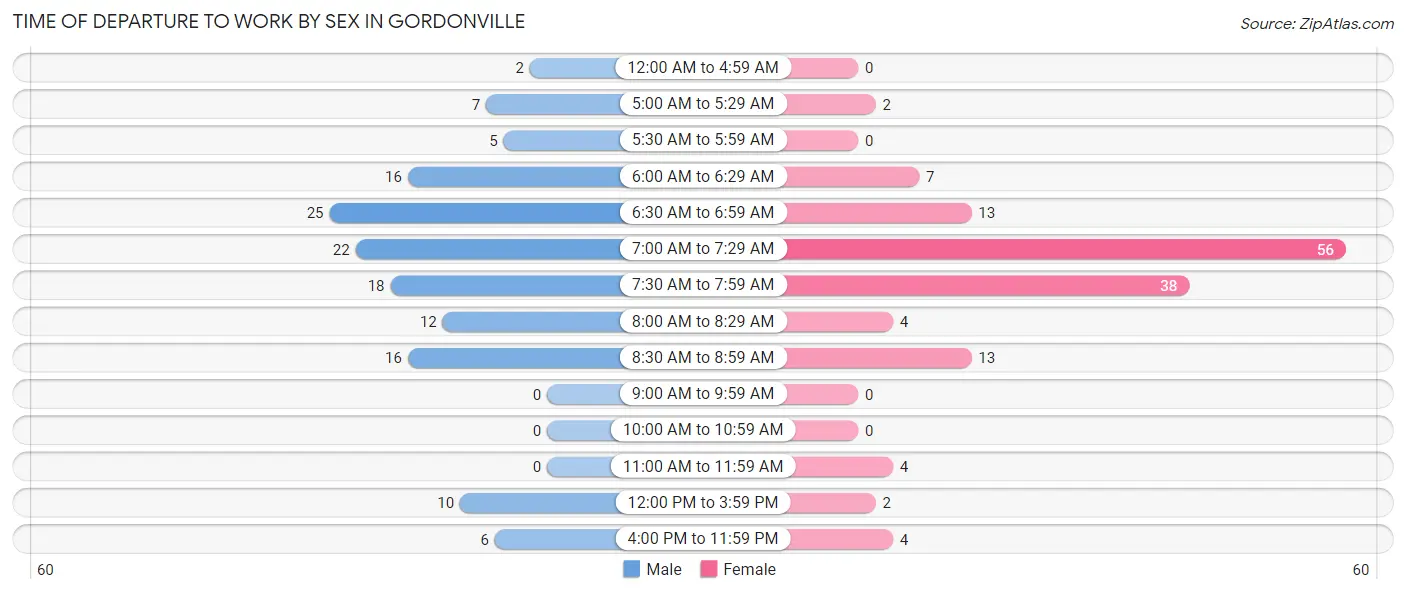
| Time of Departure | Male | Female |
| 12:00 AM to 4:59 AM | 2 (1.4%) | 0 (0.0%) |
| 5:00 AM to 5:29 AM | 7 (5.0%) | 2 (1.4%) |
| 5:30 AM to 5:59 AM | 5 (3.6%) | 0 (0.0%) |
| 6:00 AM to 6:29 AM | 16 (11.5%) | 7 (4.9%) |
| 6:30 AM to 6:59 AM | 25 (18.0%) | 13 (9.1%) |
| 7:00 AM to 7:29 AM | 22 (15.8%) | 56 (39.2%) |
| 7:30 AM to 7:59 AM | 18 (13.0%) | 38 (26.6%) |
| 8:00 AM to 8:29 AM | 12 (8.6%) | 4 (2.8%) |
| 8:30 AM to 8:59 AM | 16 (11.5%) | 13 (9.1%) |
| 9:00 AM to 9:59 AM | 0 (0.0%) | 0 (0.0%) |
| 10:00 AM to 10:59 AM | 0 (0.0%) | 0 (0.0%) |
| 11:00 AM to 11:59 AM | 0 (0.0%) | 4 (2.8%) |
| 12:00 PM to 3:59 PM | 10 (7.2%) | 2 (1.4%) |
| 4:00 PM to 11:59 PM | 6 (4.3%) | 4 (2.8%) |
| Total | 139 (100.0%) | 143 (100.0%) |
Housing Occupancy in Gordonville
Occupancy by Ownership in Gordonville
Of the total 201 dwellings in Gordonville, owner-occupied units account for 170 (84.6%), while renter-occupied units make up 31 (15.4%).
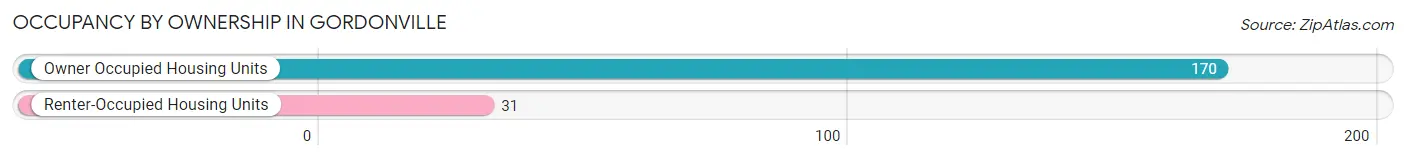
| Occupancy | # Housing Units | % Housing Units |
| Owner Occupied Housing Units | 170 | 84.6% |
| Renter-Occupied Housing Units | 31 | 15.4% |
| Total Occupied Housing Units | 201 | 100.0% |
Occupancy by Household Size in Gordonville
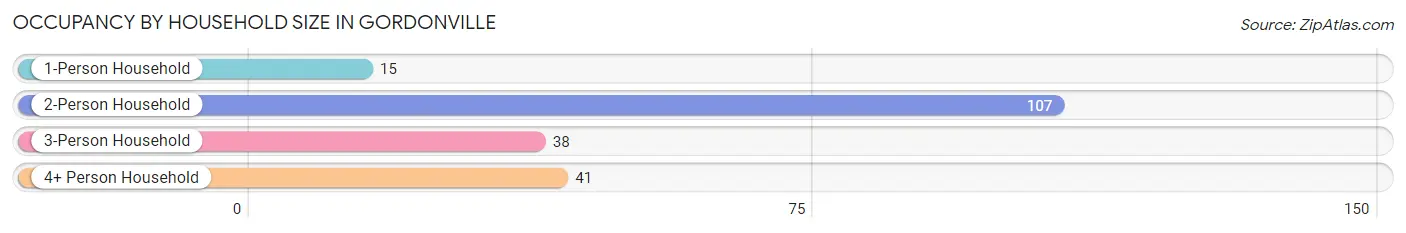
| Household Size | # Housing Units | % Housing Units |
| 1-Person Household | 15 | 7.5% |
| 2-Person Household | 107 | 53.2% |
| 3-Person Household | 38 | 18.9% |
| 4+ Person Household | 41 | 20.4% |
| Total Housing Units | 201 | 100.0% |
Occupancy by Ownership by Household Size in Gordonville
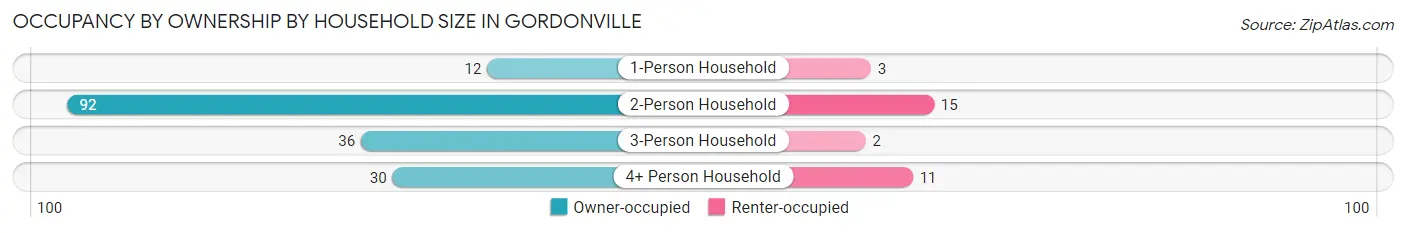
| Household Size | Owner-occupied | Renter-occupied |
| 1-Person Household | 12 (80.0%) | 3 (20.0%) |
| 2-Person Household | 92 (86.0%) | 15 (14.0%) |
| 3-Person Household | 36 (94.7%) | 2 (5.3%) |
| 4+ Person Household | 30 (73.2%) | 11 (26.8%) |
| Total Housing Units | 170 (84.6%) | 31 (15.4%) |
Occupancy by Educational Attainment in Gordonville
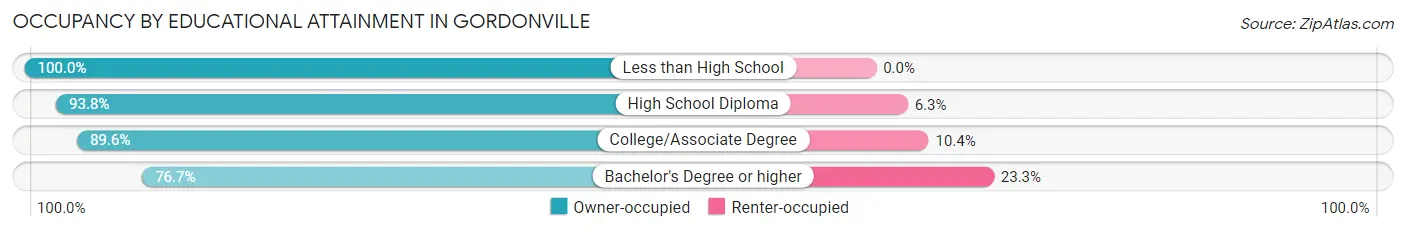
| Household Size | Owner-occupied | Renter-occupied |
| Less than High School | 2 (100.0%) | 0 (0.0%) |
| High School Diploma | 30 (93.8%) | 2 (6.2%) |
| College/Associate Degree | 69 (89.6%) | 8 (10.4%) |
| Bachelor's Degree or higher | 69 (76.7%) | 21 (23.3%) |
Occupancy by Age of Householder in Gordonville
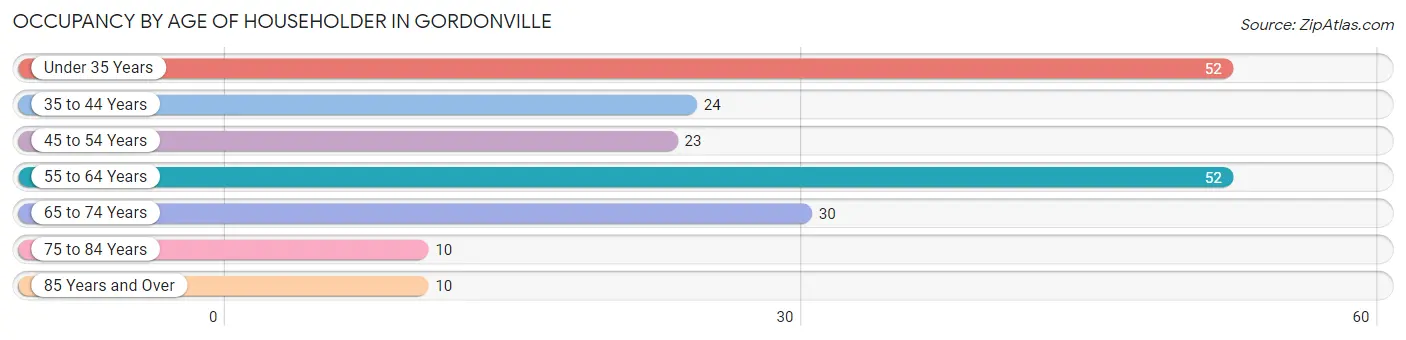
| Age Bracket | # Households | % Households |
| Under 35 Years | 52 | 25.9% |
| 35 to 44 Years | 24 | 11.9% |
| 45 to 54 Years | 23 | 11.4% |
| 55 to 64 Years | 52 | 25.9% |
| 65 to 74 Years | 30 | 14.9% |
| 75 to 84 Years | 10 | 5.0% |
| 85 Years and Over | 10 | 5.0% |
| Total | 201 | 100.0% |
Housing Finances in Gordonville
Median Income by Occupancy in Gordonville
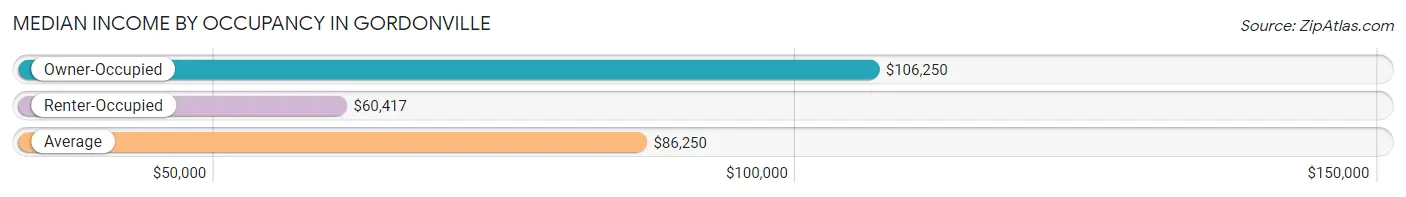
| Occupancy Type | # Households | Median Income |
| Owner-Occupied | 170 (84.6%) | $106,250 |
| Renter-Occupied | 31 (15.4%) | $60,417 |
| Average | 201 (100.0%) | $86,250 |
Occupancy by Householder Income Bracket in Gordonville
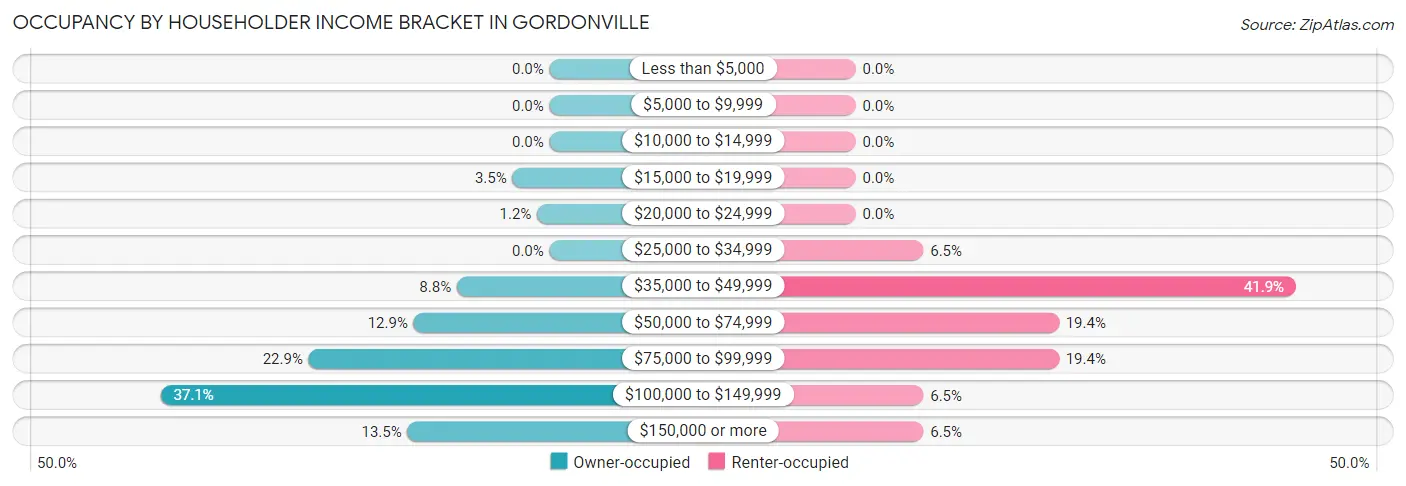
| Income Bracket | Owner-occupied | Renter-occupied |
| Less than $5,000 | 0 (0.0%) | 0 (0.0%) |
| $5,000 to $9,999 | 0 (0.0%) | 0 (0.0%) |
| $10,000 to $14,999 | 0 (0.0%) | 0 (0.0%) |
| $15,000 to $19,999 | 6 (3.5%) | 0 (0.0%) |
| $20,000 to $24,999 | 2 (1.2%) | 0 (0.0%) |
| $25,000 to $34,999 | 0 (0.0%) | 2 (6.5%) |
| $35,000 to $49,999 | 15 (8.8%) | 13 (41.9%) |
| $50,000 to $74,999 | 22 (12.9%) | 6 (19.4%) |
| $75,000 to $99,999 | 39 (22.9%) | 6 (19.4%) |
| $100,000 to $149,999 | 63 (37.1%) | 2 (6.5%) |
| $150,000 or more | 23 (13.5%) | 2 (6.5%) |
| Total | 170 (100.0%) | 31 (100.0%) |
Monthly Housing Cost Tiers in Gordonville
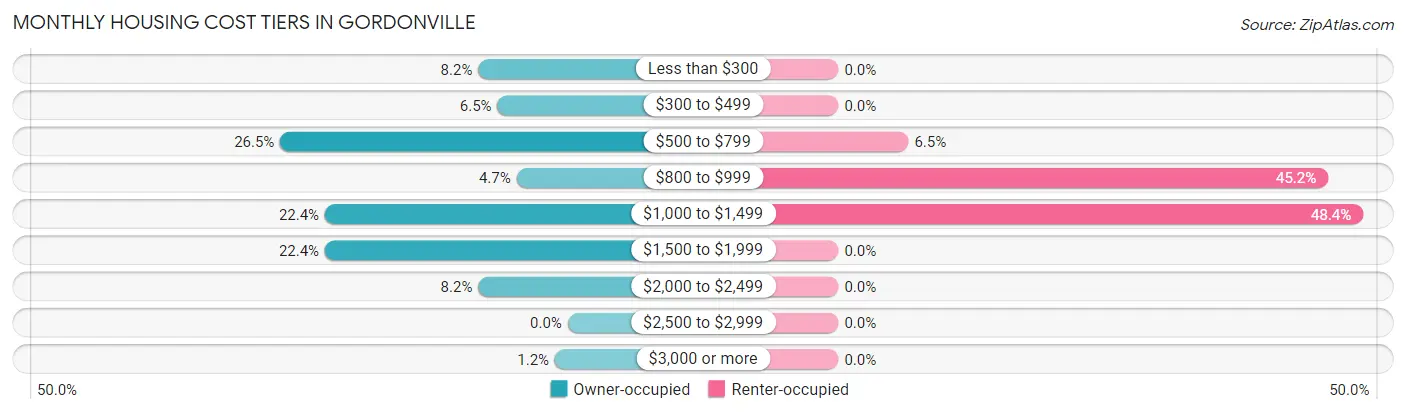
| Monthly Cost | Owner-occupied | Renter-occupied |
| Less than $300 | 14 (8.2%) | 0 (0.0%) |
| $300 to $499 | 11 (6.5%) | 0 (0.0%) |
| $500 to $799 | 45 (26.5%) | 2 (6.5%) |
| $800 to $999 | 8 (4.7%) | 14 (45.2%) |
| $1,000 to $1,499 | 38 (22.4%) | 15 (48.4%) |
| $1,500 to $1,999 | 38 (22.4%) | 0 (0.0%) |
| $2,000 to $2,499 | 14 (8.2%) | 0 (0.0%) |
| $2,500 to $2,999 | 0 (0.0%) | 0 (0.0%) |
| $3,000 or more | 2 (1.2%) | 0 (0.0%) |
| Total | 170 (100.0%) | 31 (100.0%) |
Physical Housing Characteristics in Gordonville
Housing Structures in Gordonville
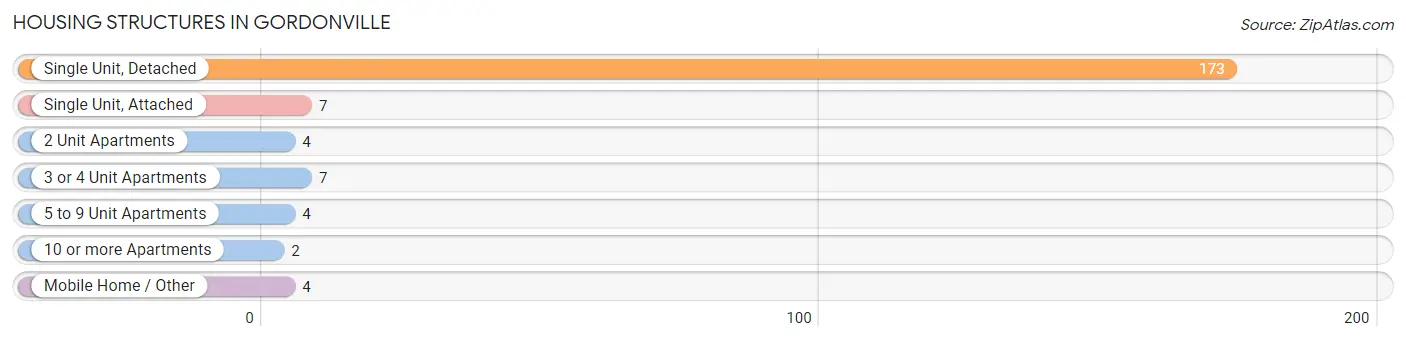
| Structure Type | # Housing Units | % Housing Units |
| Single Unit, Detached | 173 | 86.1% |
| Single Unit, Attached | 7 | 3.5% |
| 2 Unit Apartments | 4 | 2.0% |
| 3 or 4 Unit Apartments | 7 | 3.5% |
| 5 to 9 Unit Apartments | 4 | 2.0% |
| 10 or more Apartments | 2 | 1.0% |
| Mobile Home / Other | 4 | 2.0% |
| Total | 201 | 100.0% |
Housing Structures by Occupancy in Gordonville
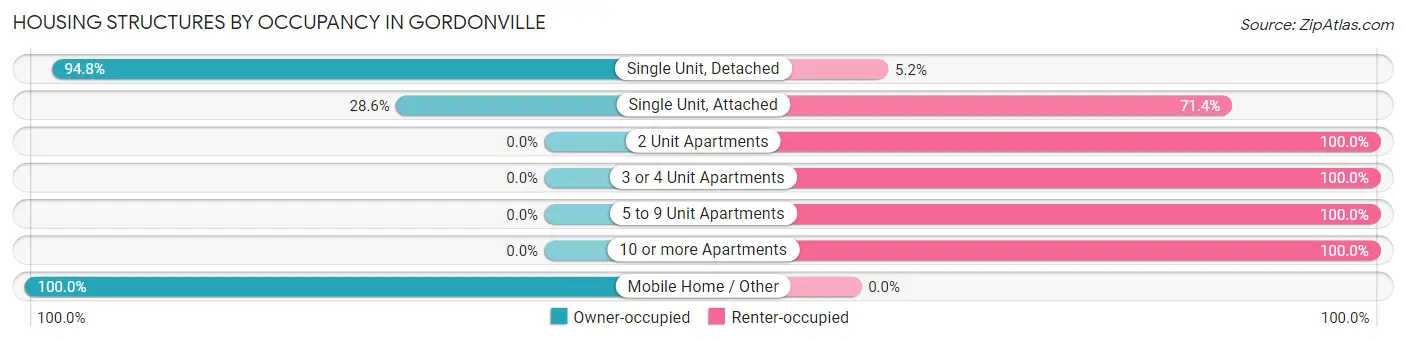
| Structure Type | Owner-occupied | Renter-occupied |
| Single Unit, Detached | 164 (94.8%) | 9 (5.2%) |
| Single Unit, Attached | 2 (28.6%) | 5 (71.4%) |
| 2 Unit Apartments | 0 (0.0%) | 4 (100.0%) |
| 3 or 4 Unit Apartments | 0 (0.0%) | 7 (100.0%) |
| 5 to 9 Unit Apartments | 0 (0.0%) | 4 (100.0%) |
| 10 or more Apartments | 0 (0.0%) | 2 (100.0%) |
| Mobile Home / Other | 4 (100.0%) | 0 (0.0%) |
| Total | 170 (84.6%) | 31 (15.4%) |
Housing Structures by Number of Rooms in Gordonville
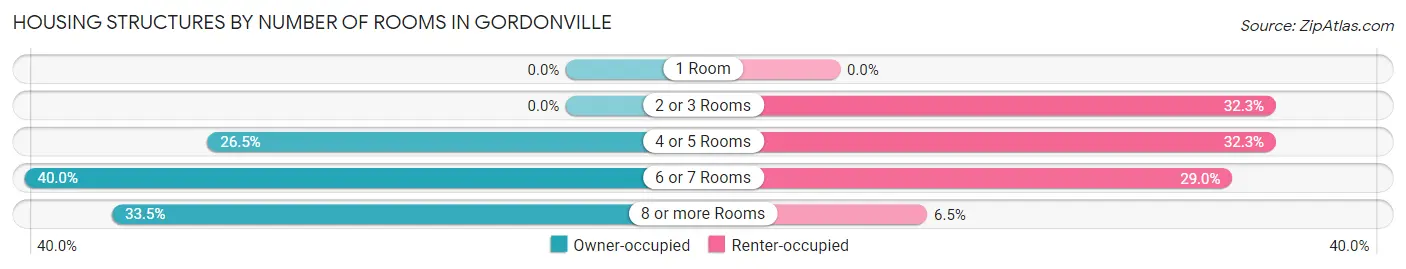
| Number of Rooms | Owner-occupied | Renter-occupied |
| 1 Room | 0 (0.0%) | 0 (0.0%) |
| 2 or 3 Rooms | 0 (0.0%) | 10 (32.3%) |
| 4 or 5 Rooms | 45 (26.5%) | 10 (32.3%) |
| 6 or 7 Rooms | 68 (40.0%) | 9 (29.0%) |
| 8 or more Rooms | 57 (33.5%) | 2 (6.5%) |
| Total | 170 (100.0%) | 31 (100.0%) |
Housing Structure by Heating Type in Gordonville
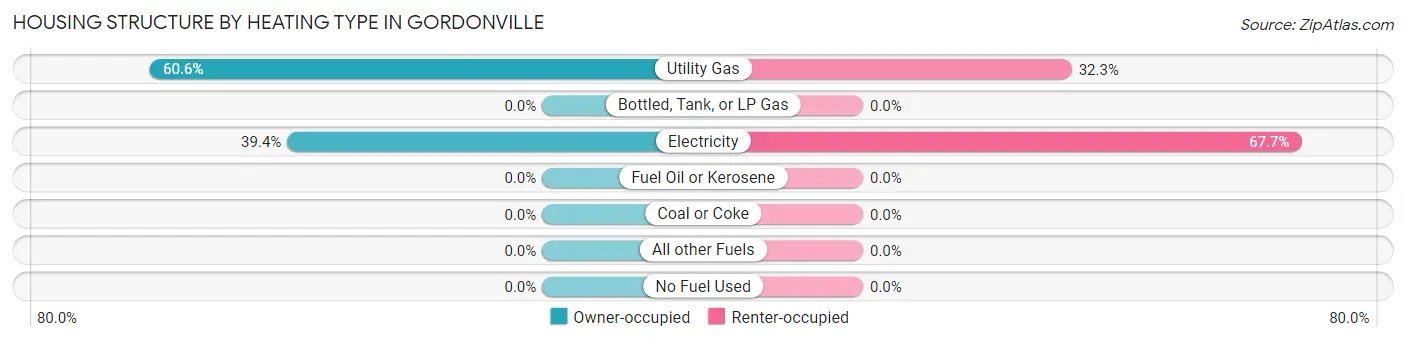
| Heating Type | Owner-occupied | Renter-occupied |
| Utility Gas | 103 (60.6%) | 10 (32.3%) |
| Bottled, Tank, or LP Gas | 0 (0.0%) | 0 (0.0%) |
| Electricity | 67 (39.4%) | 21 (67.7%) |
| Fuel Oil or Kerosene | 0 (0.0%) | 0 (0.0%) |
| Coal or Coke | 0 (0.0%) | 0 (0.0%) |
| All other Fuels | 0 (0.0%) | 0 (0.0%) |
| No Fuel Used | 0 (0.0%) | 0 (0.0%) |
| Total | 170 (100.0%) | 31 (100.0%) |
Household Vehicle Usage in Gordonville
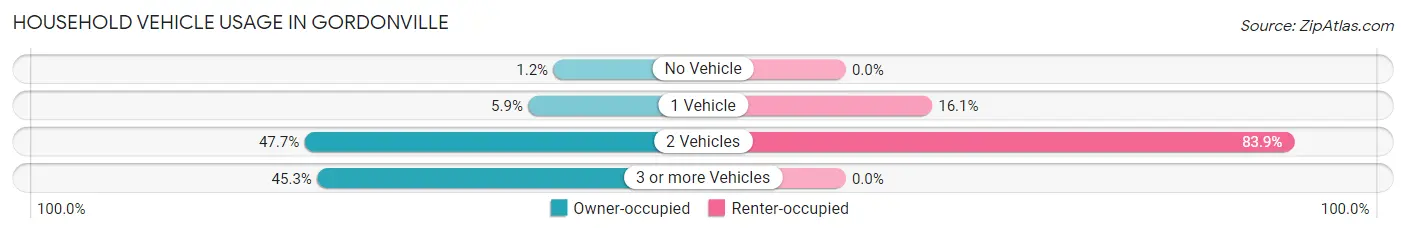
| Vehicles per Household | Owner-occupied | Renter-occupied |
| No Vehicle | 2 (1.2%) | 0 (0.0%) |
| 1 Vehicle | 10 (5.9%) | 5 (16.1%) |
| 2 Vehicles | 81 (47.6%) | 26 (83.9%) |
| 3 or more Vehicles | 77 (45.3%) | 0 (0.0%) |
| Total | 170 (100.0%) | 31 (100.0%) |
Real Estate & Mortgages in Gordonville
Real Estate and Mortgage Overview in Gordonville
| Characteristic | Without Mortgage | With Mortgage |
| Housing Units | 64 | 106 |
| Median Property Value | $235,700 | $225,700 |
| Median Household Income | $81,429 | $21 |
| Monthly Housing Costs | $536 | $2 |
| Real Estate Taxes | $1,667 | $0 |
Property Value by Mortgage Status in Gordonville
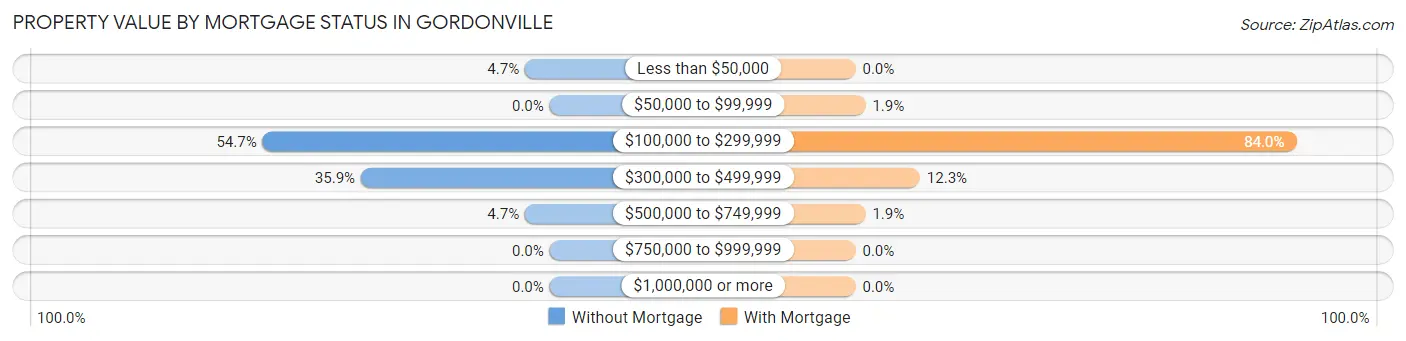
| Property Value | Without Mortgage | With Mortgage |
| Less than $50,000 | 3 (4.7%) | 0 (0.0%) |
| $50,000 to $99,999 | 0 (0.0%) | 2 (1.9%) |
| $100,000 to $299,999 | 35 (54.7%) | 89 (84.0%) |
| $300,000 to $499,999 | 23 (35.9%) | 13 (12.3%) |
| $500,000 to $749,999 | 3 (4.7%) | 2 (1.9%) |
| $750,000 to $999,999 | 0 (0.0%) | 0 (0.0%) |
| $1,000,000 or more | 0 (0.0%) | 0 (0.0%) |
| Total | 64 (100.0%) | 106 (100.0%) |
Household Income by Mortgage Status in Gordonville
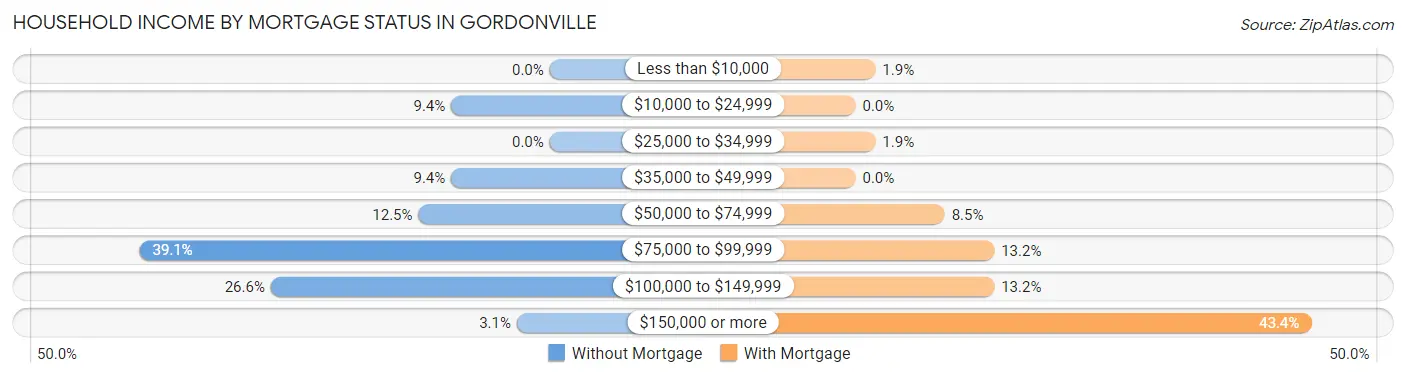
| Household Income | Without Mortgage | With Mortgage |
| Less than $10,000 | 0 (0.0%) | 2 (1.9%) |
| $10,000 to $24,999 | 6 (9.4%) | 0 (0.0%) |
| $25,000 to $34,999 | 0 (0.0%) | 2 (1.9%) |
| $35,000 to $49,999 | 6 (9.4%) | 0 (0.0%) |
| $50,000 to $74,999 | 8 (12.5%) | 9 (8.5%) |
| $75,000 to $99,999 | 25 (39.1%) | 14 (13.2%) |
| $100,000 to $149,999 | 17 (26.6%) | 14 (13.2%) |
| $150,000 or more | 2 (3.1%) | 46 (43.4%) |
| Total | 64 (100.0%) | 106 (100.0%) |
Property Value to Household Income Ratio in Gordonville
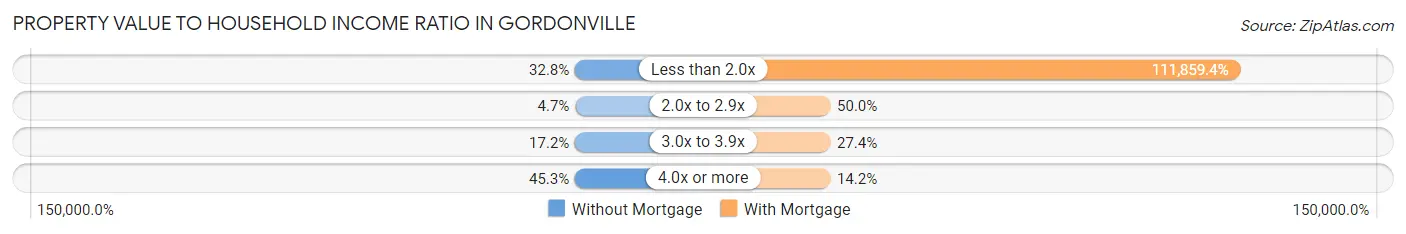
| Value-to-Income Ratio | Without Mortgage | With Mortgage |
| Less than 2.0x | 21 (32.8%) | 118,571 (111,859.4%) |
| 2.0x to 2.9x | 3 (4.7%) | 53 (50.0%) |
| 3.0x to 3.9x | 11 (17.2%) | 29 (27.4%) |
| 4.0x or more | 29 (45.3%) | 15 (14.1%) |
| Total | 64 (100.0%) | 106 (100.0%) |
Real Estate Taxes by Mortgage Status in Gordonville
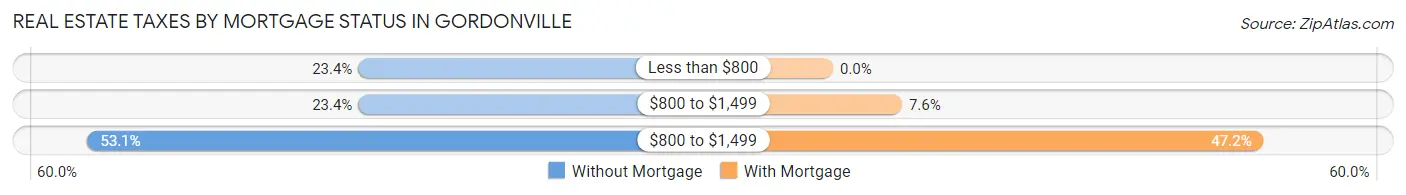
| Property Taxes | Without Mortgage | With Mortgage |
| Less than $800 | 15 (23.4%) | 0 (0.0%) |
| $800 to $1,499 | 15 (23.4%) | 8 (7.5%) |
| $800 to $1,499 | 34 (53.1%) | 50 (47.2%) |
| Total | 64 (100.0%) | 106 (100.0%) |
Health & Disability in Gordonville
Health Insurance Coverage by Age in Gordonville
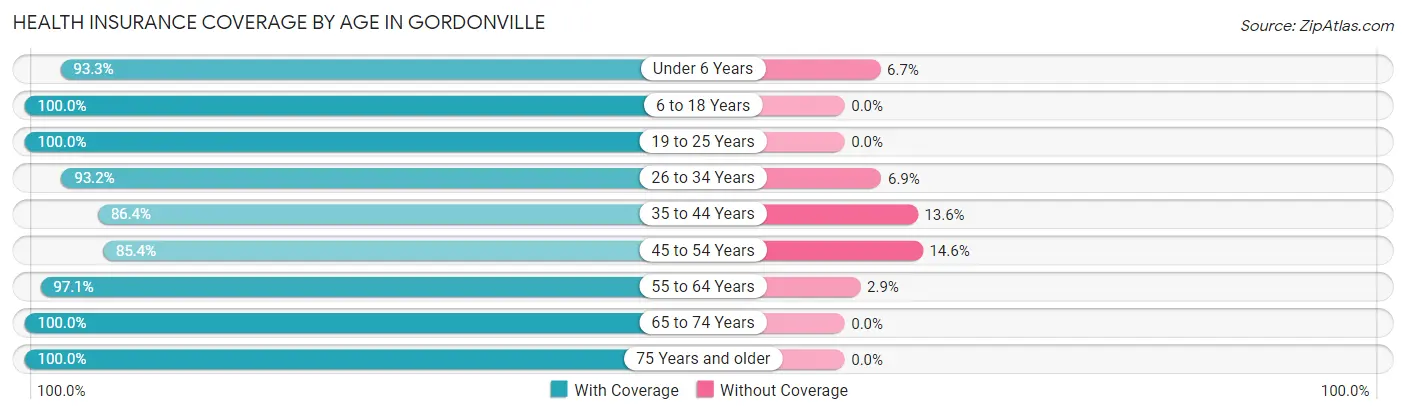
| Age Bracket | With Coverage | Without Coverage |
| Under 6 Years | 28 (93.3%) | 2 (6.7%) |
| 6 to 18 Years | 70 (100.0%) | 0 (0.0%) |
| 19 to 25 Years | 51 (100.0%) | 0 (0.0%) |
| 26 to 34 Years | 68 (93.1%) | 5 (6.9%) |
| 35 to 44 Years | 57 (86.4%) | 9 (13.6%) |
| 45 to 54 Years | 41 (85.4%) | 7 (14.6%) |
| 55 to 64 Years | 99 (97.1%) | 3 (2.9%) |
| 65 to 74 Years | 52 (100.0%) | 0 (0.0%) |
| 75 Years and older | 38 (100.0%) | 0 (0.0%) |
| Total | 504 (95.1%) | 26 (4.9%) |
Health Insurance Coverage by Citizenship Status in Gordonville
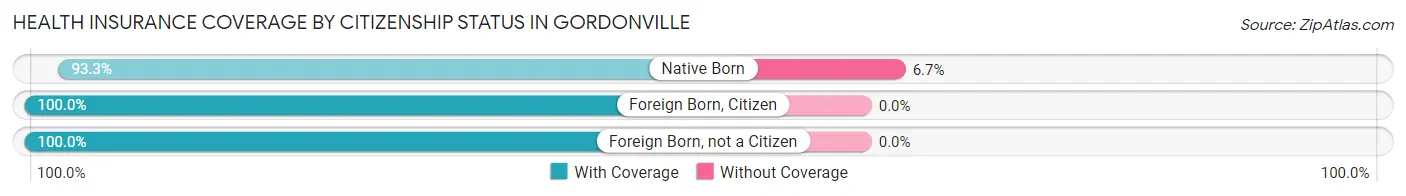
| Citizenship Status | With Coverage | Without Coverage |
| Native Born | 28 (93.3%) | 2 (6.7%) |
| Foreign Born, Citizen | 70 (100.0%) | 0 (0.0%) |
| Foreign Born, not a Citizen | 51 (100.0%) | 0 (0.0%) |
Health Insurance Coverage by Household Income in Gordonville
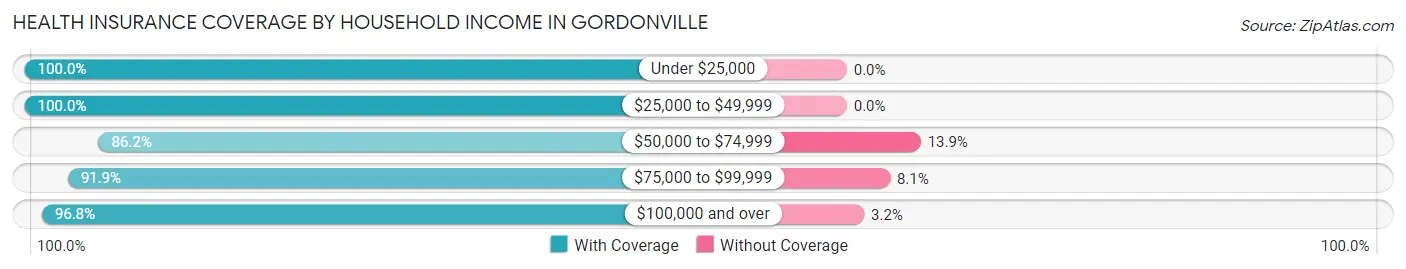
| Household Income | With Coverage | Without Coverage |
| Under $25,000 | 17 (100.0%) | 0 (0.0%) |
| $25,000 to $49,999 | 71 (100.0%) | 0 (0.0%) |
| $50,000 to $74,999 | 56 (86.2%) | 9 (13.9%) |
| $75,000 to $99,999 | 91 (91.9%) | 8 (8.1%) |
| $100,000 and over | 269 (96.8%) | 9 (3.2%) |
Public vs Private Health Insurance Coverage by Age in Gordonville
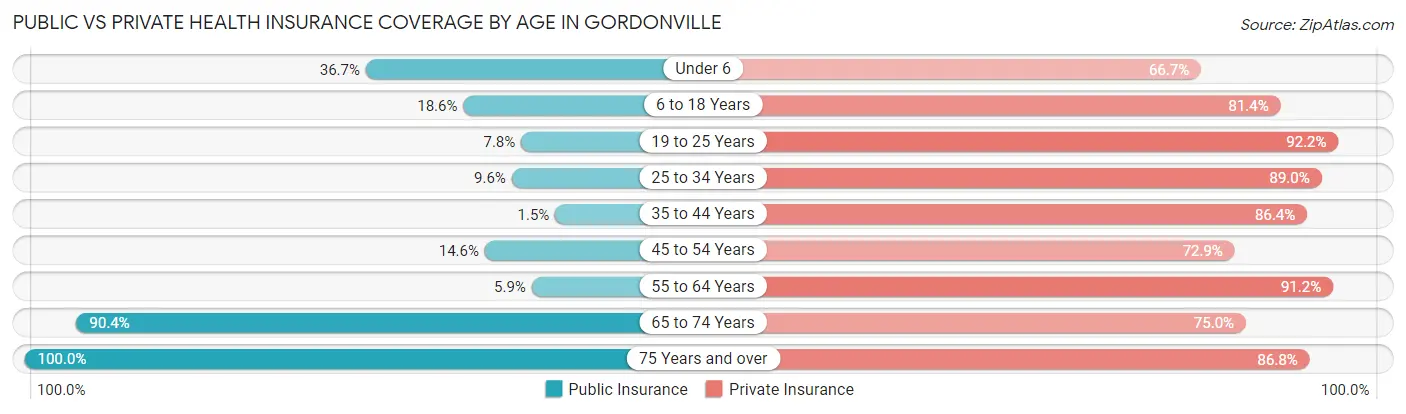
| Age Bracket | Public Insurance | Private Insurance |
| Under 6 | 11 (36.7%) | 20 (66.7%) |
| 6 to 18 Years | 13 (18.6%) | 57 (81.4%) |
| 19 to 25 Years | 4 (7.8%) | 47 (92.2%) |
| 25 to 34 Years | 7 (9.6%) | 65 (89.0%) |
| 35 to 44 Years | 1 (1.5%) | 57 (86.4%) |
| 45 to 54 Years | 7 (14.6%) | 35 (72.9%) |
| 55 to 64 Years | 6 (5.9%) | 93 (91.2%) |
| 65 to 74 Years | 47 (90.4%) | 39 (75.0%) |
| 75 Years and over | 38 (100.0%) | 33 (86.8%) |
| Total | 134 (25.3%) | 446 (84.2%) |
Disability Status by Sex by Age in Gordonville
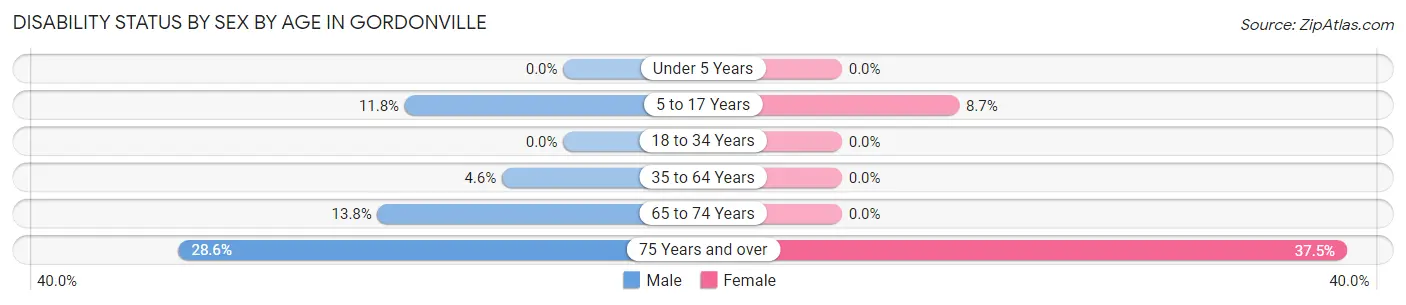
| Age Bracket | Male | Female |
| Under 5 Years | 0 (0.0%) | 0 (0.0%) |
| 5 to 17 Years | 6 (11.8%) | 2 (8.7%) |
| 18 to 34 Years | 0 (0.0%) | 0 (0.0%) |
| 35 to 64 Years | 5 (4.5%) | 0 (0.0%) |
| 65 to 74 Years | 4 (13.8%) | 0 (0.0%) |
| 75 Years and over | 4 (28.6%) | 9 (37.5%) |
Disability Class by Sex by Age in Gordonville
Disability Class: Hearing Difficulty
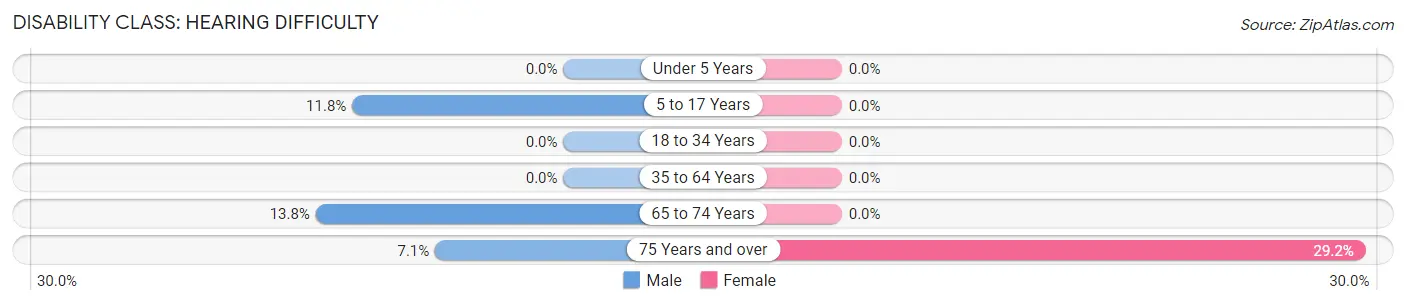
| Age Bracket | Male | Female |
| Under 5 Years | 0 (0.0%) | 0 (0.0%) |
| 5 to 17 Years | 6 (11.8%) | 0 (0.0%) |
| 18 to 34 Years | 0 (0.0%) | 0 (0.0%) |
| 35 to 64 Years | 0 (0.0%) | 0 (0.0%) |
| 65 to 74 Years | 4 (13.8%) | 0 (0.0%) |
| 75 Years and over | 1 (7.1%) | 7 (29.2%) |
Disability Class: Vision Difficulty
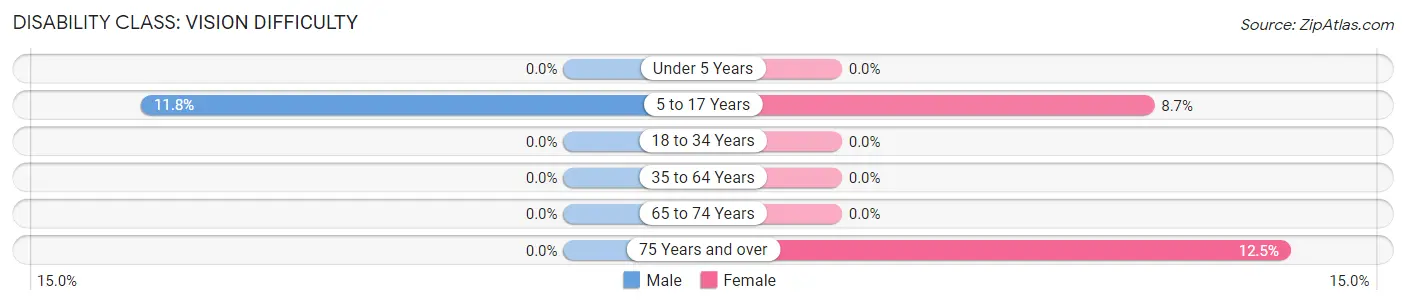
| Age Bracket | Male | Female |
| Under 5 Years | 0 (0.0%) | 0 (0.0%) |
| 5 to 17 Years | 6 (11.8%) | 2 (8.7%) |
| 18 to 34 Years | 0 (0.0%) | 0 (0.0%) |
| 35 to 64 Years | 0 (0.0%) | 0 (0.0%) |
| 65 to 74 Years | 0 (0.0%) | 0 (0.0%) |
| 75 Years and over | 0 (0.0%) | 3 (12.5%) |
Disability Class: Cognitive Difficulty
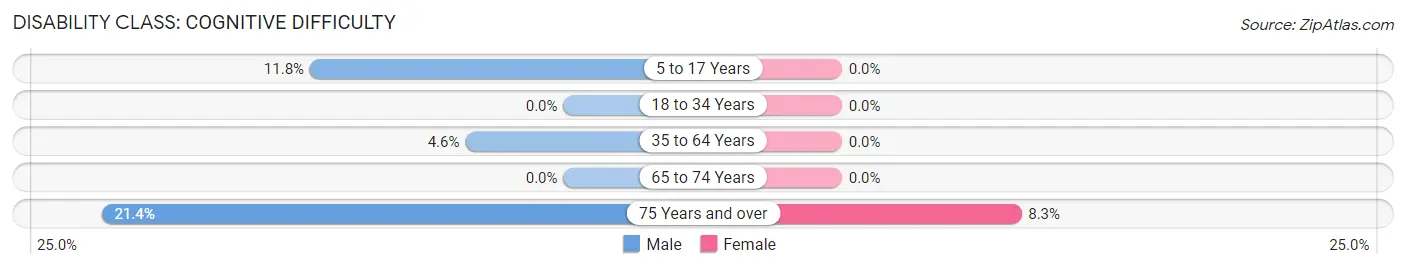
| Age Bracket | Male | Female |
| 5 to 17 Years | 6 (11.8%) | 0 (0.0%) |
| 18 to 34 Years | 0 (0.0%) | 0 (0.0%) |
| 35 to 64 Years | 5 (4.5%) | 0 (0.0%) |
| 65 to 74 Years | 0 (0.0%) | 0 (0.0%) |
| 75 Years and over | 3 (21.4%) | 2 (8.3%) |
Disability Class: Ambulatory Difficulty
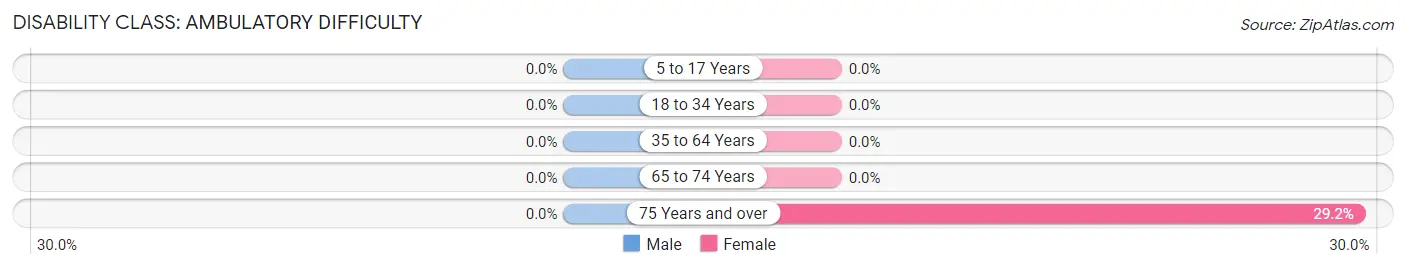
| Age Bracket | Male | Female |
| 5 to 17 Years | 0 (0.0%) | 0 (0.0%) |
| 18 to 34 Years | 0 (0.0%) | 0 (0.0%) |
| 35 to 64 Years | 0 (0.0%) | 0 (0.0%) |
| 65 to 74 Years | 0 (0.0%) | 0 (0.0%) |
| 75 Years and over | 0 (0.0%) | 7 (29.2%) |
Disability Class: Self-Care Difficulty
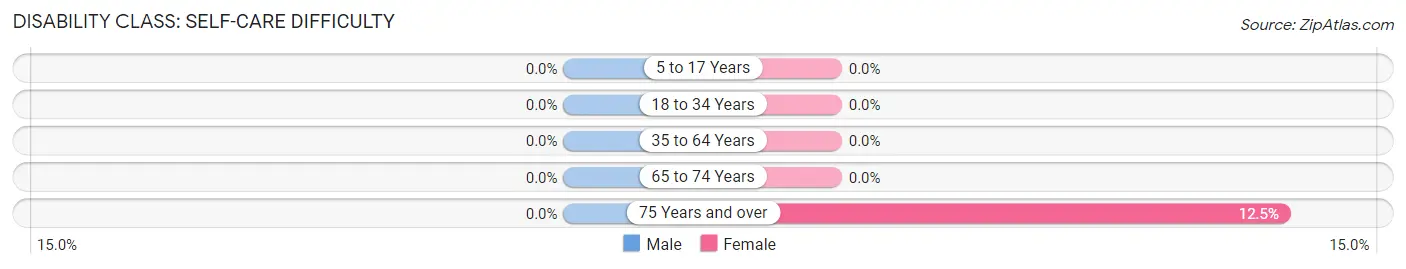
| Age Bracket | Male | Female |
| 5 to 17 Years | 0 (0.0%) | 0 (0.0%) |
| 18 to 34 Years | 0 (0.0%) | 0 (0.0%) |
| 35 to 64 Years | 0 (0.0%) | 0 (0.0%) |
| 65 to 74 Years | 0 (0.0%) | 0 (0.0%) |
| 75 Years and over | 0 (0.0%) | 3 (12.5%) |
Technology Access in Gordonville
Computing Device Access in Gordonville
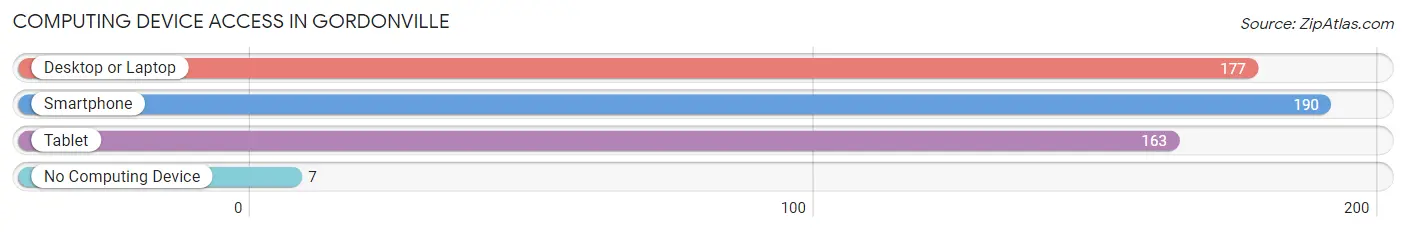
| Device Type | # Households | % Households |
| Desktop or Laptop | 177 | 88.1% |
| Smartphone | 190 | 94.5% |
| Tablet | 163 | 81.1% |
| No Computing Device | 7 | 3.5% |
| Total | 201 | 100.0% |
Internet Access in Gordonville
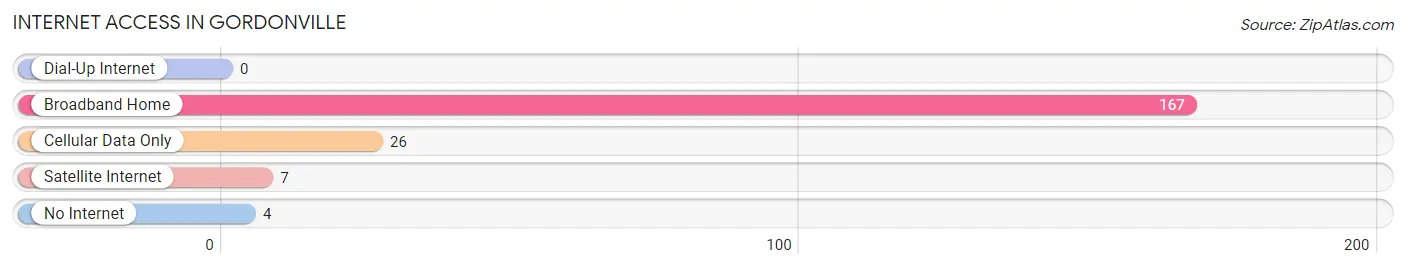
| Internet Type | # Households | % Households |
| Dial-Up Internet | 0 | 0.0% |
| Broadband Home | 167 | 83.1% |
| Cellular Data Only | 26 | 12.9% |
| Satellite Internet | 7 | 3.5% |
| No Internet | 4 | 2.0% |
| Total | 201 | 100.0% |
Gordonville Summary
History
The small town of Gordonville, Missouri is located in Cape Girardeau County, in the southeastern corner of the state. It is situated on the banks of the Mississippi River, and is part of the Cape Girardeau-Jackson Metropolitan Statistical Area. The town was founded in 1837 by William Gordon, a local farmer and landowner. Gordonville was originally known as Gordon’s Landing, and was a popular stop for steamboats traveling up and down the Mississippi River.
In the late 19th century, Gordonville was a thriving river port town, with a population of over 1,000 people. The town was home to several businesses, including a sawmill, a grist mill, a blacksmith shop, and a general store. The town also had a post office, a school, and several churches.
In the early 20th century, Gordonville began to decline as the river traffic decreased and the railroad bypassed the town. By the 1950s, the population had dropped to just over 500 people.
Geography
Gordonville is located in the southeastern corner of Missouri, in Cape Girardeau County. It is situated on the banks of the Mississippi River, and is part of the Cape Girardeau-Jackson Metropolitan Statistical Area. The town is located about 10 miles south of Cape Girardeau, and about 25 miles north of Cairo, Illinois.
The town is situated on a bluff overlooking the Mississippi River, and is surrounded by rolling hills and farmland. The climate in Gordonville is humid subtropical, with hot, humid summers and mild winters.
Economy
The economy of Gordonville is largely based on agriculture and tourism. The town is home to several farms, which produce a variety of crops, including corn, soybeans, and wheat. The town is also home to several wineries, which produce a variety of wines.
Tourism is an important part of the local economy, as the town is a popular destination for visitors from all over the world. The town is home to several historic sites, including the Gordonville Historic District, which is listed on the National Register of Historic Places. The town also hosts several festivals and events throughout the year, including the Gordonville Days Festival and the Gordonville Wine Festival.
Demographics
As of the 2010 census, the population of Gordonville was 1,092. The racial makeup of the town was 97.3% White, 0.7% African American, 0.3% Native American, 0.2% Asian, 0.1% Pacific Islander, and 1.4% from other races. The median household income was $37,917, and the median family income was $45,000. The per capita income was $19,945.
Conclusion
Gordonville, Missouri is a small town located in Cape Girardeau County, in the southeastern corner of the state. It is situated on the banks of the Mississippi River, and is part of the Cape Girardeau-Jackson Metropolitan Statistical Area. The town was founded in 1837 by William Gordon, and was once a thriving river port town. Today, the economy of Gordonville is largely based on agriculture and tourism, and the town is home to several historic sites and festivals. As of the 2010 census, the population of Gordonville was 1,092.
Common Questions
What is Per Capita Income in Gordonville?
Per Capita income in Gordonville is $42,861.
What is the Median Family Income in Gordonville?
Median Family Income in Gordonville is $96,250.
What is the Median Household income in Gordonville?
Median Household Income in Gordonville is $86,250.
What is Income or Wage Gap in Gordonville?
Income or Wage Gap in Gordonville is 42.6%.
Women in Gordonville earn 57.4 cents for every dollar earned by a man.
What is Inequality or Gini Index in Gordonville?
Inequality or Gini Index in Gordonville is 0.37.
What is the Total Population of Gordonville?
Total Population of Gordonville is 533.
What is the Total Male Population of Gordonville?
Total Male Population of Gordonville is 271.
What is the Total Female Population of Gordonville?
Total Female Population of Gordonville is 262.
What is the Ratio of Males per 100 Females in Gordonville?
There are 103.44 Males per 100 Females in Gordonville.
What is the Ratio of Females per 100 Males in Gordonville?
There are 96.68 Females per 100 Males in Gordonville.
What is the Median Population Age in Gordonville?
Median Population Age in Gordonville is 40.9 Years.
What is the Average Family Size in Gordonville
Average Family Size in Gordonville is 2.7 People.
What is the Average Household Size in Gordonville
Average Household Size in Gordonville is 2.6 People.
How Large is the Labor Force in Gordonville?
There are 306 People in the Labor Forcein in Gordonville.
What is the Percentage of People in the Labor Force in Gordonville?
70.0% of People are in the Labor Force in Gordonville.
What is the Unemployment Rate in Gordonville?
Unemployment Rate in Gordonville is 1.0%.