Zip Codes with the Highest Percentage of Population Employed in Life, Physical & Social Science in Florissant, MO
RELATED REPORTS & OPTIONS
Life, Physical & Social Science
Florissant
Compare Zip Codes
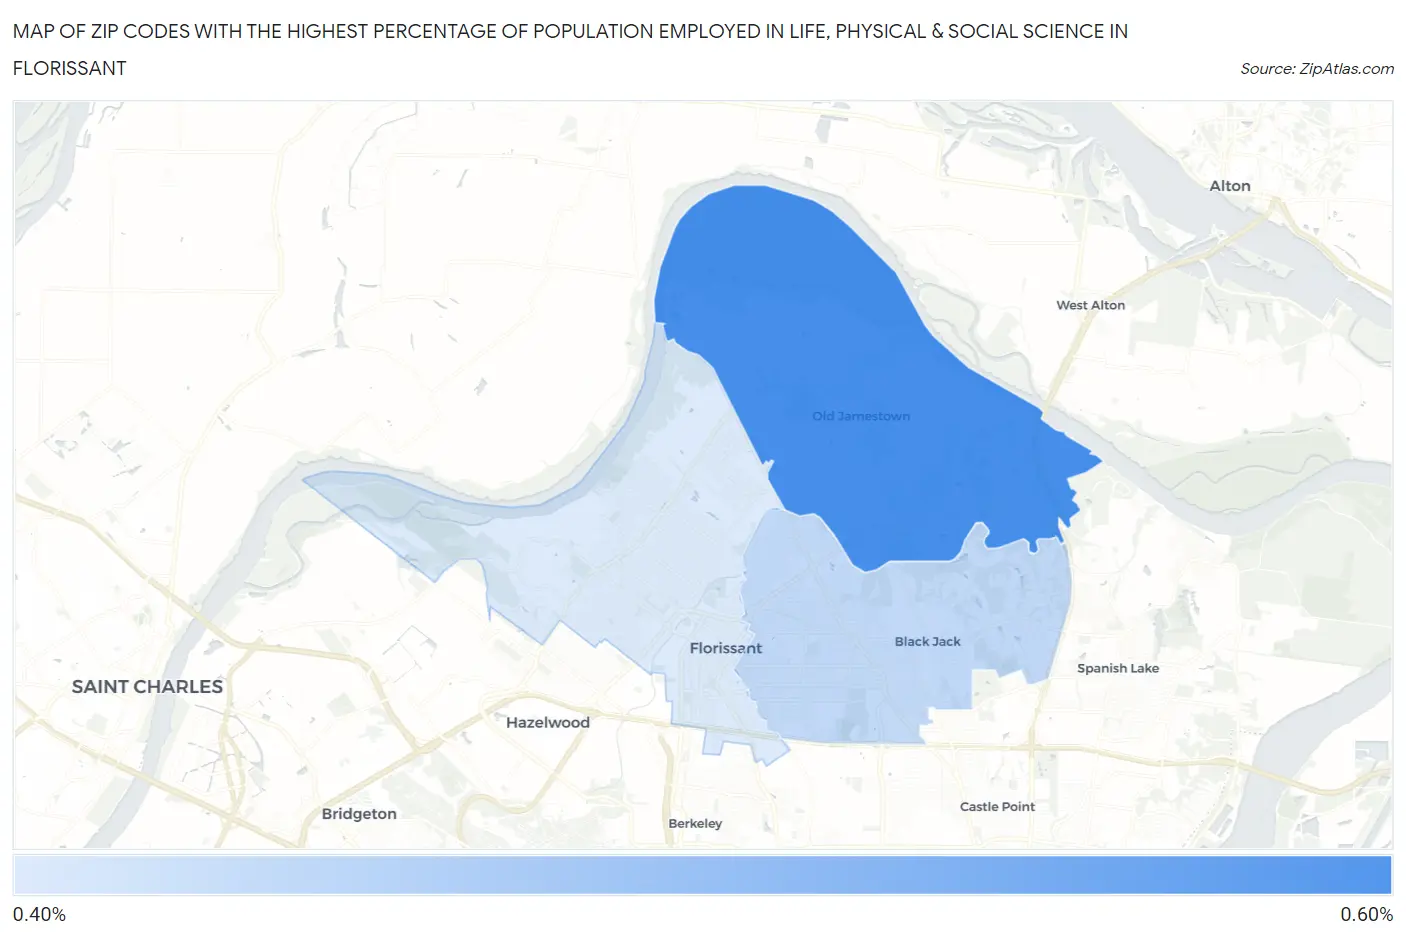
Map of Zip Codes with the Highest Percentage of Population Employed in Life, Physical & Social Science in Florissant
0.47%
0.59%
Zip Codes with the Highest Percentage of Population Employed in Life, Physical & Social Science in Florissant, MO
| Zip Code | % Employed | vs State | vs National | |
| 1. | 63034 | 0.59% | 0.98%(-0.392)#298 | 1.1%(-0.501)#13,412 |
| 2. | 63033 | 0.49% | 0.98%(-0.488)#323 | 1.1%(-0.596)#14,575 |
| 3. | 63031 | 0.47% | 0.98%(-0.510)#332 | 1.1%(-0.619)#14,875 |
1
Common Questions
What are the Top Zip Codes with the Highest Percentage of Population Employed in Life, Physical & Social Science in Florissant, MO?
Top Zip Codes with the Highest Percentage of Population Employed in Life, Physical & Social Science in Florissant, MO are:
What zip code has the Highest Percentage of Population Employed in Life, Physical & Social Science in Florissant, MO?
63034 has the Highest Percentage of Population Employed in Life, Physical & Social Science in Florissant, MO with 0.59%.
What is the Percentage of Population Employed in Life, Physical & Social Science in Florissant, MO?
Percentage of Population Employed in Life, Physical & Social Science in Florissant is 0.60%.
What is the Percentage of Population Employed in Life, Physical & Social Science in Missouri?
Percentage of Population Employed in Life, Physical & Social Science in Missouri is 0.98%.
What is the Percentage of Population Employed in Life, Physical & Social Science in the United States?
Percentage of Population Employed in Life, Physical & Social Science in the United States is 1.1%.