Zip Codes with the Highest Percentage of Population Employed in Life, Physical & Social Science in O Fallon, MO
RELATED REPORTS & OPTIONS
Life, Physical & Social Science
O Fallon
Compare Zip Codes
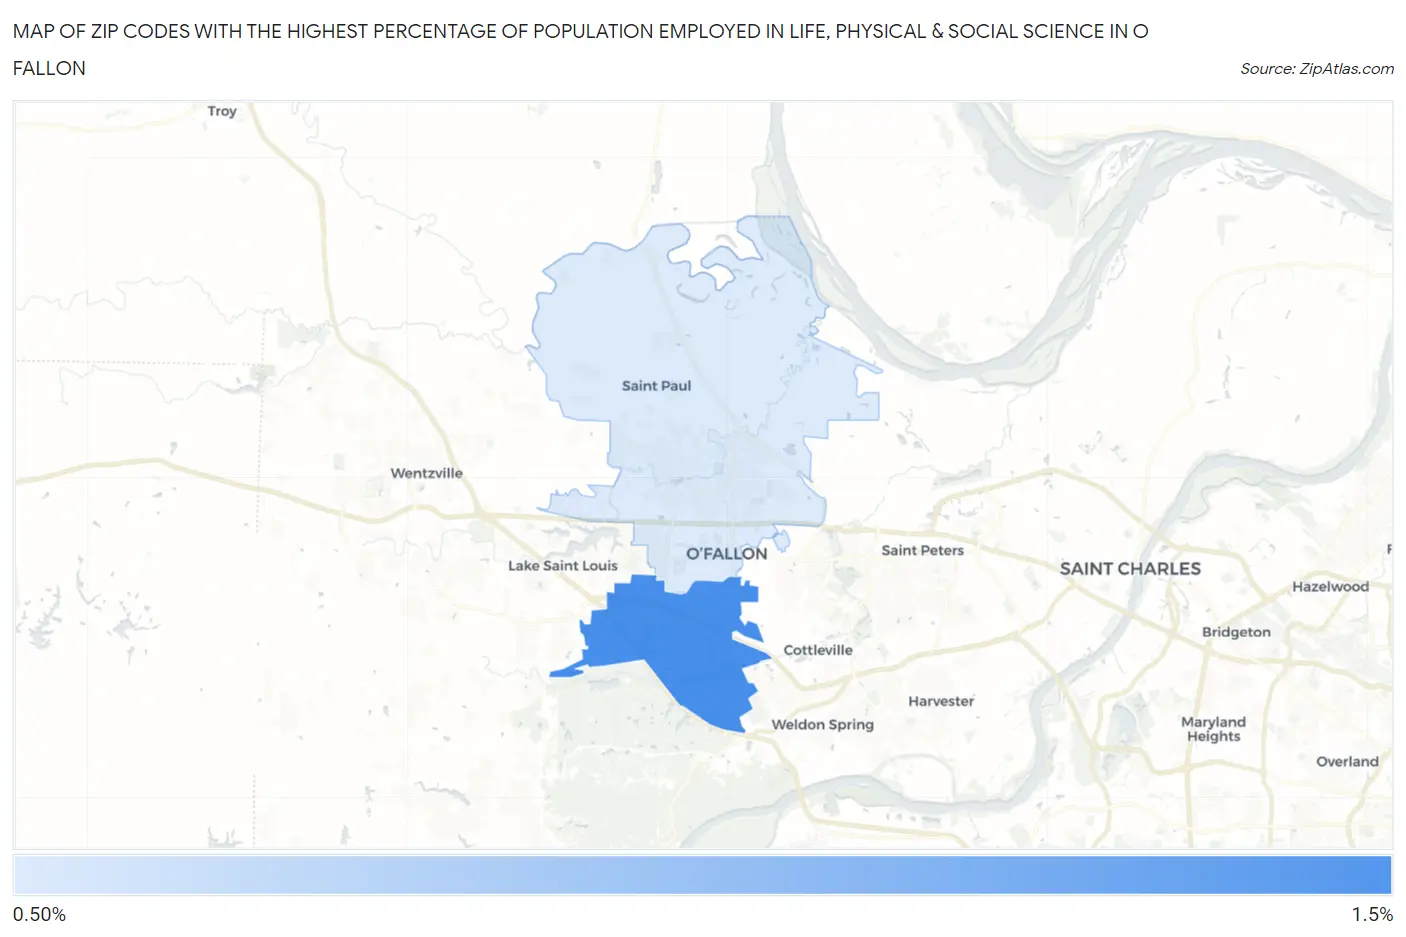
Map of Zip Codes with the Highest Percentage of Population Employed in Life, Physical & Social Science in O Fallon
0.61%
1.1%
Zip Codes with the Highest Percentage of Population Employed in Life, Physical & Social Science in O Fallon, MO
| Zip Code | % Employed | vs State | vs National | |
| 1. | 63368 | 1.1% | 0.98%(+0.070)#194 | 1.1%(-0.039)#8,614 |
| 2. | 63366 | 0.61% | 0.98%(-0.369)#289 | 1.1%(-0.478)#13,132 |
1
Common Questions
What are the Top Zip Codes with the Highest Percentage of Population Employed in Life, Physical & Social Science in O Fallon, MO?
Top Zip Codes with the Highest Percentage of Population Employed in Life, Physical & Social Science in O Fallon, MO are:
What zip code has the Highest Percentage of Population Employed in Life, Physical & Social Science in O Fallon, MO?
63368 has the Highest Percentage of Population Employed in Life, Physical & Social Science in O Fallon, MO with 1.1%.
What is the Percentage of Population Employed in Life, Physical & Social Science in O Fallon, MO?
Percentage of Population Employed in Life, Physical & Social Science in O Fallon is 0.90%.
What is the Percentage of Population Employed in Life, Physical & Social Science in Missouri?
Percentage of Population Employed in Life, Physical & Social Science in Missouri is 0.98%.
What is the Percentage of Population Employed in Life, Physical & Social Science in the United States?
Percentage of Population Employed in Life, Physical & Social Science in the United States is 1.1%.