Zip Codes with the Highest Percentage of Population Employed in Food Preparation & Serving in Saint Louis, MO
RELATED REPORTS & OPTIONS
Food Preparation & Serving
Saint Louis
Compare Zip Codes
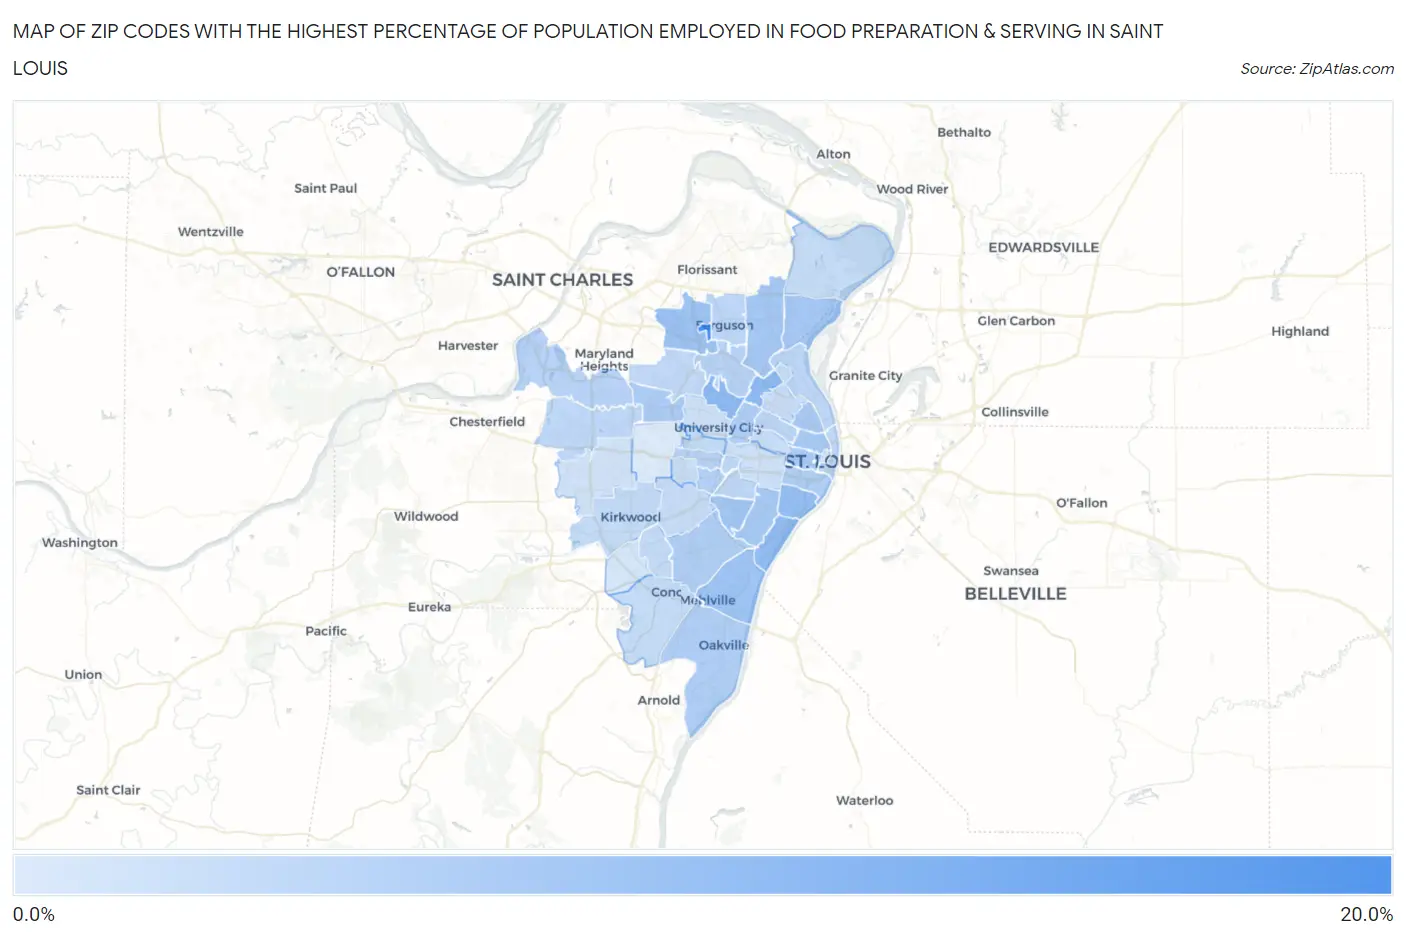
Map of Zip Codes with the Highest Percentage of Population Employed in Food Preparation & Serving in Saint Louis
0.76%
19.4%
Zip Codes with the Highest Percentage of Population Employed in Food Preparation & Serving in Saint Louis, MO
| Zip Code | % Employed | vs State | vs National | |
| 1. | 63140 | 19.4% | 5.2%(+14.2)#23 | 5.3%(+14.1)#537 |
| 2. | 63133 | 10.2% | 5.2%(+4.93)#82 | 5.3%(+4.88)#2,510 |
| 3. | 63120 | 10.0% | 5.2%(+4.76)#91 | 5.3%(+4.70)#2,643 |
| 4. | 63111 | 9.7% | 5.2%(+4.44)#96 | 5.3%(+4.39)#2,907 |
| 5. | 63118 | 9.2% | 5.2%(+3.95)#110 | 5.3%(+3.90)#3,333 |
| 6. | 63134 | 8.3% | 5.2%(+3.03)#145 | 5.3%(+2.98)#4,358 |
| 7. | 63125 | 8.0% | 5.2%(+2.77)#152 | 5.3%(+2.72)#4,722 |
| 8. | 63109 | 7.5% | 5.2%(+2.28)#178 | 5.3%(+2.23)#5,528 |
| 9. | 63136 | 7.2% | 5.2%(+1.96)#202 | 5.3%(+1.91)#6,151 |
| 10. | 63137 | 7.2% | 5.2%(+1.95)#203 | 5.3%(+1.90)#6,158 |
| 11. | 63116 | 7.0% | 5.2%(+1.77)#219 | 5.3%(+1.72)#6,548 |
| 12. | 63106 | 7.0% | 5.2%(+1.77)#220 | 5.3%(+1.72)#6,555 |
| 13. | 63107 | 6.6% | 5.2%(+1.37)#243 | 5.3%(+1.32)#7,578 |
| 14. | 63103 | 6.5% | 5.2%(+1.31)#245 | 5.3%(+1.26)#7,735 |
| 15. | 63132 | 6.5% | 5.2%(+1.29)#252 | 5.3%(+1.24)#7,821 |
| 16. | 63129 | 6.2% | 5.2%(+1.01)#272 | 5.3%(+0.962)#8,599 |
| 17. | 63104 | 6.0% | 5.2%(+0.788)#292 | 5.3%(+0.738)#9,268 |
| 18. | 63112 | 5.9% | 5.2%(+0.713)#298 | 5.3%(+0.662)#9,510 |
| 19. | 63123 | 5.8% | 5.2%(+0.611)#305 | 5.3%(+0.561)#9,880 |
| 20. | 63143 | 5.3% | 5.2%(+0.059)#350 | 5.3%(+0.009)#11,784 |
| 21. | 63117 | 5.1% | 5.2%(-0.113)#373 | 5.3%(-0.164)#12,459 |
| 22. | 63121 | 5.1% | 5.2%(-0.161)#379 | 5.3%(-0.212)#12,634 |
| 23. | 63146 | 5.0% | 5.2%(-0.236)#386 | 5.3%(-0.286)#12,942 |
| 24. | 63147 | 4.4% | 5.2%(-0.820)#449 | 5.3%(-0.870)#15,347 |
| 25. | 63113 | 4.4% | 5.2%(-0.849)#454 | 5.3%(-0.900)#15,477 |
| 26. | 63135 | 4.4% | 5.2%(-0.852)#455 | 5.3%(-0.903)#15,494 |
| 27. | 63139 | 4.3% | 5.2%(-0.922)#462 | 5.3%(-0.972)#15,822 |
| 28. | 63102 | 4.3% | 5.2%(-0.946)#466 | 5.3%(-0.996)#15,927 |
| 29. | 63141 | 4.2% | 5.2%(-1.01)#475 | 5.3%(-1.06)#16,208 |
| 30. | 63114 | 4.1% | 5.2%(-1.14)#493 | 5.3%(-1.19)#16,729 |
| 31. | 63126 | 3.6% | 5.2%(-1.61)#545 | 5.3%(-1.66)#18,647 |
| 32. | 63122 | 3.6% | 5.2%(-1.61)#546 | 5.3%(-1.66)#18,658 |
| 33. | 63128 | 3.6% | 5.2%(-1.68)#559 | 5.3%(-1.73)#18,963 |
| 34. | 63138 | 3.3% | 5.2%(-1.89)#583 | 5.3%(-1.94)#19,860 |
| 35. | 63105 | 3.3% | 5.2%(-1.91)#589 | 5.3%(-1.96)#19,977 |
| 36. | 63108 | 3.1% | 5.2%(-2.09)#615 | 5.3%(-2.14)#20,665 |
| 37. | 63119 | 3.1% | 5.2%(-2.11)#619 | 5.3%(-2.16)#20,762 |
| 38. | 63144 | 3.0% | 5.2%(-2.19)#630 | 5.3%(-2.24)#21,067 |
| 39. | 63115 | 2.9% | 5.2%(-2.38)#649 | 5.3%(-2.43)#21,817 |
| 40. | 63130 | 2.5% | 5.2%(-2.77)#688 | 5.3%(-2.82)#23,270 |
| 41. | 63110 | 2.4% | 5.2%(-2.85)#697 | 5.3%(-2.90)#23,498 |
| 42. | 63131 | 2.2% | 5.2%(-3.04)#713 | 5.3%(-3.09)#24,110 |
| 43. | 63127 | 1.6% | 5.2%(-3.59)#761 | 5.3%(-3.64)#25,669 |
| 44. | 63101 | 0.91% | 5.2%(-4.32)#803 | 5.3%(-4.37)#27,127 |
| 45. | 63124 | 0.76% | 5.2%(-4.48)#817 | 5.3%(-4.53)#27,369 |
1
Common Questions
What are the Top 10 Zip Codes with the Highest Percentage of Population Employed in Food Preparation & Serving in Saint Louis, MO?
Top 10 Zip Codes with the Highest Percentage of Population Employed in Food Preparation & Serving in Saint Louis, MO are:
What zip code has the Highest Percentage of Population Employed in Food Preparation & Serving in Saint Louis, MO?
63140 has the Highest Percentage of Population Employed in Food Preparation & Serving in Saint Louis, MO with 19.4%.
What is the Percentage of Population Employed in Food Preparation & Serving in Missouri?
Percentage of Population Employed in Food Preparation & Serving in Missouri is 5.2%.
What is the Percentage of Population Employed in Food Preparation & Serving in the United States?
Percentage of Population Employed in Food Preparation & Serving in the United States is 5.3%.