Riverview, MO Map & Demographics
Riverview Map
Riverview Overview
$22,395
PER CAPITA INCOME
$54,904
AVG FAMILY INCOME
$48,194
AVG HOUSEHOLD INCOME
40.3%
WAGE / INCOME GAP [ % ]
59.7¢/ $1
WAGE / INCOME GAP [ $ ]
0.40
INEQUALITY / GINI INDEX
2,912
TOTAL POPULATION
1,132
MALE POPULATION
1,780
FEMALE POPULATION
63.60
MALES / 100 FEMALES
157.24
FEMALES / 100 MALES
33.8
MEDIAN AGE
3.0
AVG FAMILY SIZE
2.2
AVG HOUSEHOLD SIZE
1,520
LABOR FORCE [ PEOPLE ]
64.0%
PERCENT IN LABOR FORCE
7.3%
UNEMPLOYMENT RATE
Income in Riverview
Income Overview in Riverview
Per Capita Income in Riverview is $22,395, while median incomes of families and households are $54,904 and $48,194 respectively.
| Characteristic | Number | Measure |
| Per Capita Income | 2,912 | $22,395 |
| Median Family Income | 741 | $54,904 |
| Mean Family Income | 741 | $67,990 |
| Median Household Income | 1,315 | $48,194 |
| Mean Household Income | 1,315 | $51,427 |
| Income Deficit | 741 | $0 |
| Wage / Income Gap (%) | 2,912 | 40.33% |
| Wage / Income Gap ($) | 2,912 | 59.67¢ per $1 |
| Gini / Inequality Index | 2,912 | 0.40 |
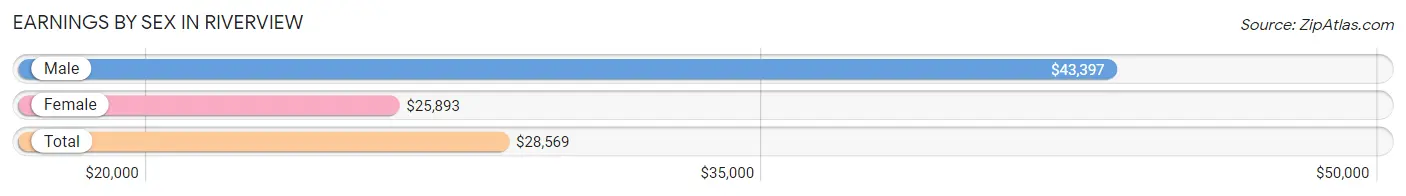
Earnings by Sex in Riverview
Average Earnings in Riverview are $28,569, $43,397 for men and $25,893 for women, a difference of 40.3%.
| Sex | Number | Average Earnings |
| Male | 473 (30.2%) | $43,397 |
| Female | 1,091 (69.8%) | $25,893 |
| Total | 1,564 (100.0%) | $28,569 |
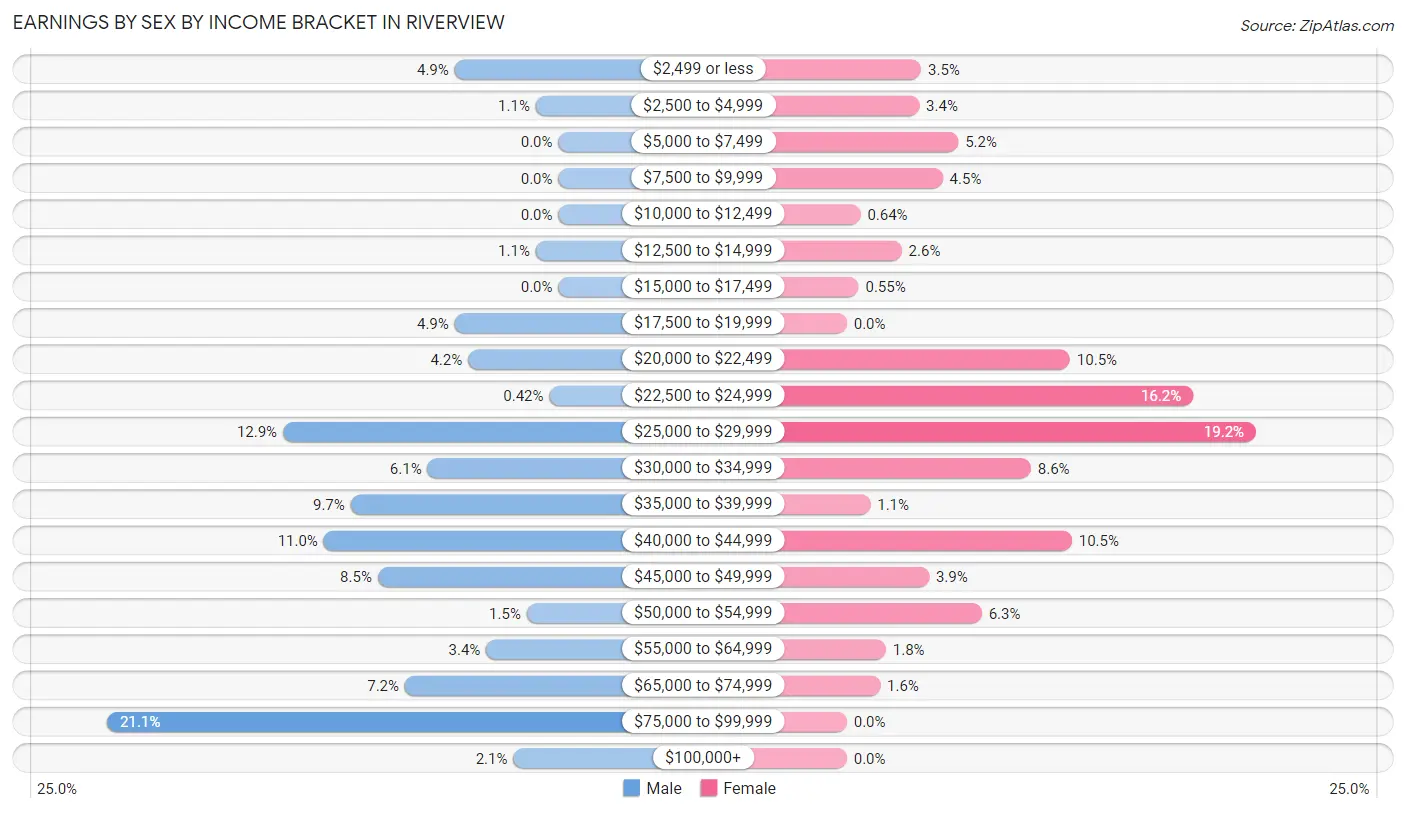
Earnings by Sex by Income Bracket in Riverview
The most common earnings brackets in Riverview are $75,000 to $99,999 for men (100 | 21.1%) and $25,000 to $29,999 for women (209 | 19.2%).
| Income | Male | Female |
| $2,499 or less | 23 (4.9%) | 38 (3.5%) |
| $2,500 to $4,999 | 5 (1.1%) | 37 (3.4%) |
| $5,000 to $7,499 | 0 (0.0%) | 57 (5.2%) |
| $7,500 to $9,999 | 0 (0.0%) | 49 (4.5%) |
| $10,000 to $12,499 | 0 (0.0%) | 7 (0.6%) |
| $12,500 to $14,999 | 5 (1.1%) | 28 (2.6%) |
| $15,000 to $17,499 | 0 (0.0%) | 6 (0.5%) |
| $17,500 to $19,999 | 23 (4.9%) | 0 (0.0%) |
| $20,000 to $22,499 | 20 (4.2%) | 114 (10.4%) |
| $22,500 to $24,999 | 2 (0.4%) | 177 (16.2%) |
| $25,000 to $29,999 | 61 (12.9%) | 209 (19.2%) |
| $30,000 to $34,999 | 29 (6.1%) | 94 (8.6%) |
| $35,000 to $39,999 | 46 (9.7%) | 12 (1.1%) |
| $40,000 to $44,999 | 52 (11.0%) | 115 (10.5%) |
| $45,000 to $49,999 | 40 (8.5%) | 42 (3.8%) |
| $50,000 to $54,999 | 7 (1.5%) | 69 (6.3%) |
| $55,000 to $64,999 | 16 (3.4%) | 20 (1.8%) |
| $65,000 to $74,999 | 34 (7.2%) | 17 (1.6%) |
| $75,000 to $99,999 | 100 (21.1%) | 0 (0.0%) |
| $100,000+ | 10 (2.1%) | 0 (0.0%) |
| Total | 473 (100.0%) | 1,091 (100.0%) |
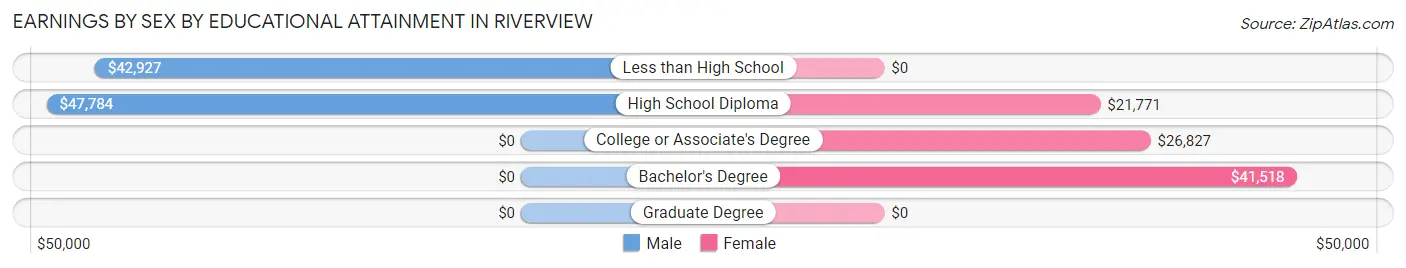
Earnings by Sex by Educational Attainment in Riverview
Average earnings in Riverview are $44,511 for men and $26,896 for women, a difference of 39.6%. Men with an educational attainment of high school diploma enjoy the highest average annual earnings of $47,784, while those with less than high school education earn the least with $42,927. Women with an educational attainment of bachelor's degree earn the most with the average annual earnings of $41,518, while those with high school diploma education have the smallest earnings of $21,771.
| Educational Attainment | Male Income | Female Income |
| Less than High School | $42,927 | $0 |
| High School Diploma | $47,784 | $21,771 |
| College or Associate's Degree | - | - |
| Bachelor's Degree | - | - |
| Graduate Degree | - | - |
| Total | $44,511 | $26,896 |
Family Income in Riverview
Family Income Brackets in Riverview
According to the Riverview family income data, there are 212 families falling into the $50,000 to $74,999 income range, which is the most common income bracket and makes up 28.6% of all families.
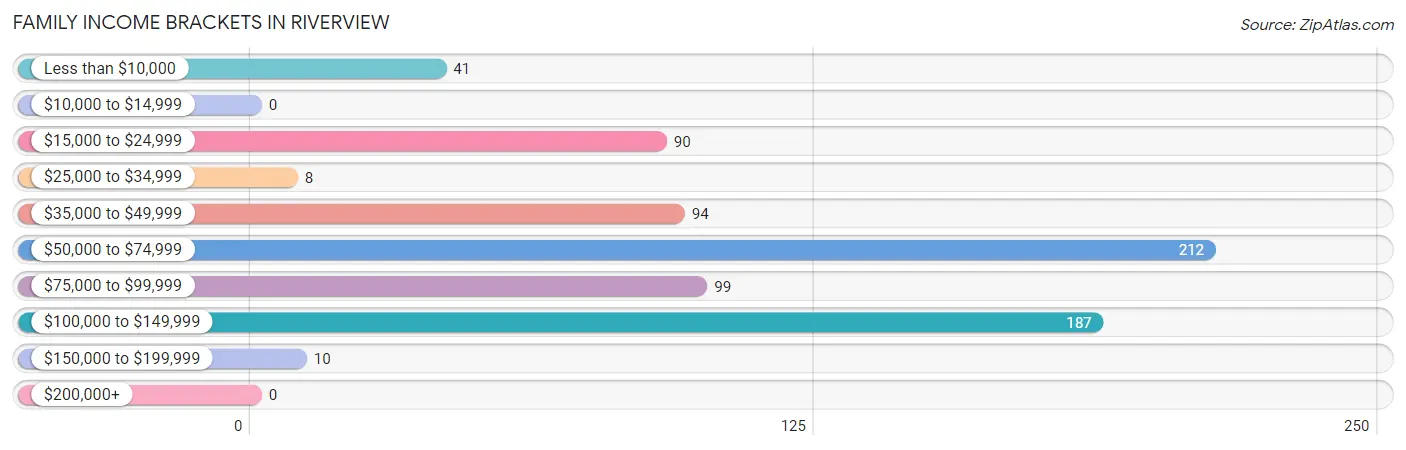
| Income Bracket | # Families | % Families |
| Less than $10,000 | 41 | 5.5% |
| $10,000 to $14,999 | 0 | 0.0% |
| $15,000 to $24,999 | 90 | 12.1% |
| $25,000 to $34,999 | 8 | 1.1% |
| $35,000 to $49,999 | 94 | 12.7% |
| $50,000 to $74,999 | 212 | 28.6% |
| $75,000 to $99,999 | 99 | 13.4% |
| $100,000 to $149,999 | 187 | 25.2% |
| $150,000 to $199,999 | 10 | 1.3% |
| $200,000+ | 0 | 0.0% |
Family Income by Famaliy Size in Riverview
4-person families (53 | 7.1%) account for the highest median family income in Riverview with $100,913 per family, while 2-person families (417 | 56.3%) have the highest median income of $27,022 per family member.
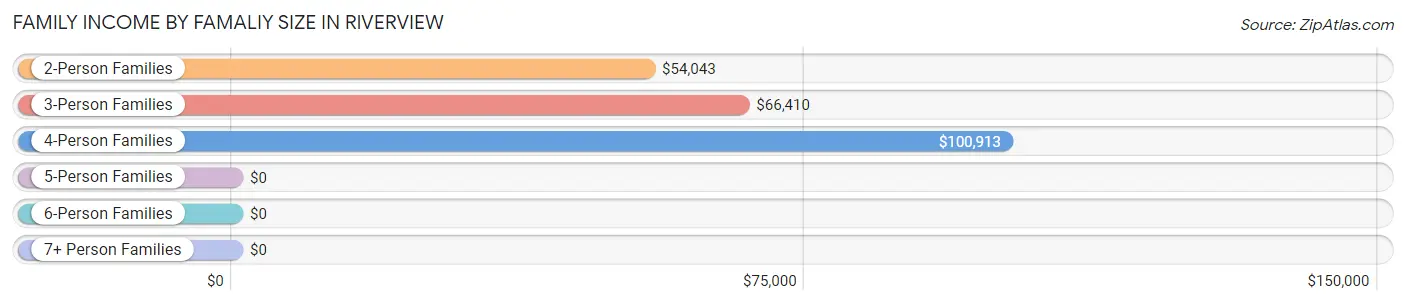
| Income Bracket | # Families | Median Income |
| 2-Person Families | 417 (56.3%) | $54,043 |
| 3-Person Families | 182 (24.6%) | $66,410 |
| 4-Person Families | 53 (7.1%) | $100,913 |
| 5-Person Families | 40 (5.4%) | $0 |
| 6-Person Families | 13 (1.8%) | $0 |
| 7+ Person Families | 36 (4.9%) | $0 |
| Total | 741 (100.0%) | $54,904 |
Family Income by Number of Earners in Riverview
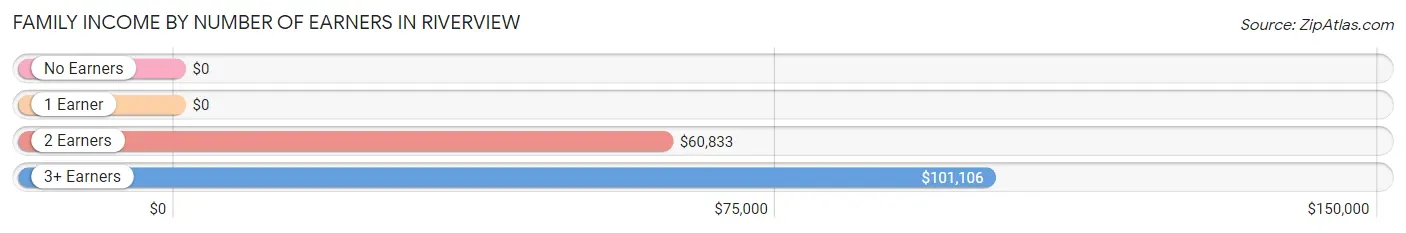
| Number of Earners | # Families | Median Income |
| No Earners | 63 (8.5%) | $0 |
| 1 Earner | 357 (48.2%) | $0 |
| 2 Earners | 244 (32.9%) | $60,833 |
| 3+ Earners | 77 (10.4%) | $101,106 |
| Total | 741 (100.0%) | $54,904 |
Household Income in Riverview
Household Income Brackets in Riverview
With 337 households falling in the category, the $50,000 to $74,999 income range is the most frequent in Riverview, accounting for 25.6% of all households.
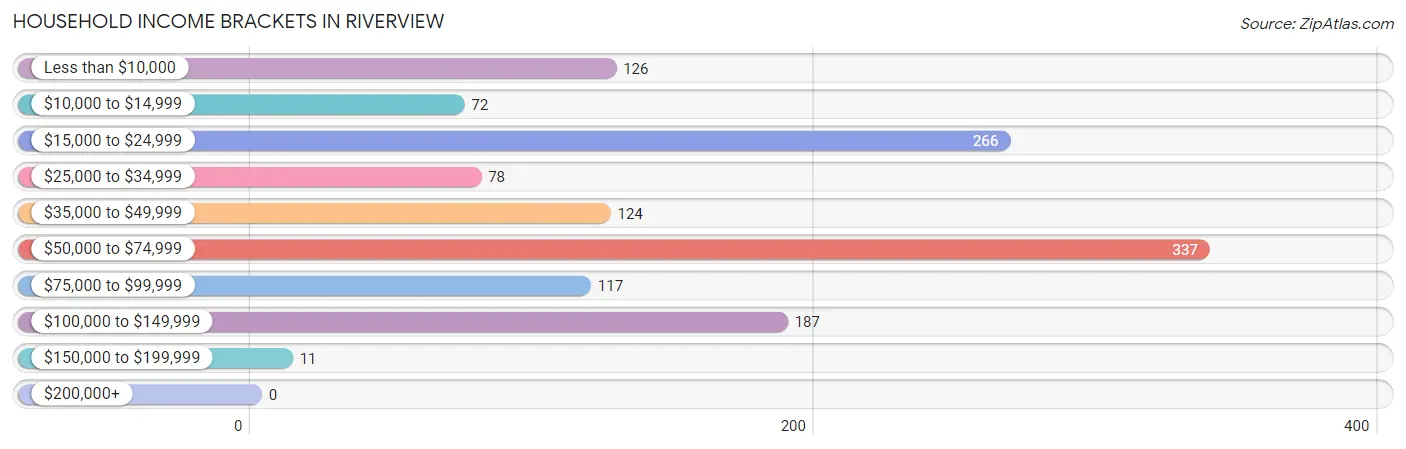
| Income Bracket | # Households | % Households |
| Less than $10,000 | 126 | 9.6% |
| $10,000 to $14,999 | 72 | 5.5% |
| $15,000 to $24,999 | 266 | 20.2% |
| $25,000 to $34,999 | 78 | 5.9% |
| $35,000 to $49,999 | 124 | 9.4% |
| $50,000 to $74,999 | 337 | 25.6% |
| $75,000 to $99,999 | 117 | 8.9% |
| $100,000 to $149,999 | 187 | 14.2% |
| $150,000 to $199,999 | 11 | 0.8% |
| $200,000+ | 0 | 0.0% |
Household Income by Householder Age in Riverview
The median household income in Riverview is $48,194, with the highest median household income of $54,181 found in the 45 to 64 years age bracket for the primary householder. A total of 528 households (40.2%) fall into this category. Meanwhile, the 15 to 24 years age bracket for the primary householder has the lowest median household income of $0, with 325 households (24.7%) in this group.
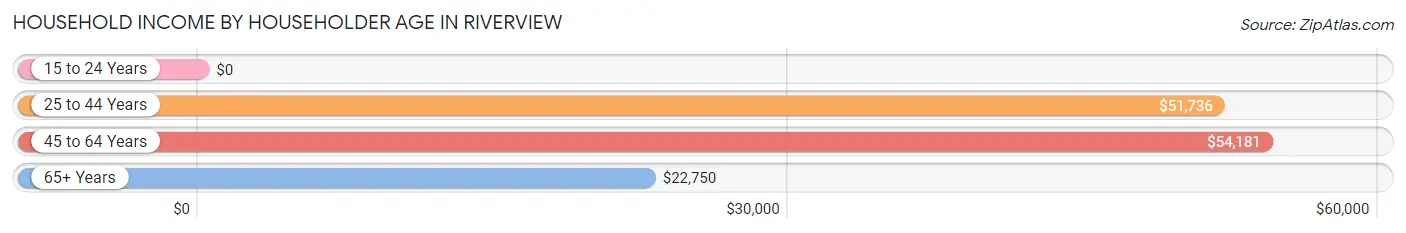
| Income Bracket | # Households | Median Income |
| 15 to 24 Years | 325 (24.7%) | $0 |
| 25 to 44 Years | 269 (20.5%) | $51,736 |
| 45 to 64 Years | 528 (40.2%) | $54,181 |
| 65+ Years | 193 (14.7%) | $22,750 |
| Total | 1,315 (100.0%) | $48,194 |
Poverty in Riverview
Income Below Poverty by Sex and Age in Riverview
With 26.6% poverty level for males and 17.2% for females among the residents of Riverview, 12 to 14 year old males and 12 to 14 year old females are the most vulnerable to poverty, with 38 males (69.1%) and 7 females (100.0%) in their respective age groups living below the poverty level.
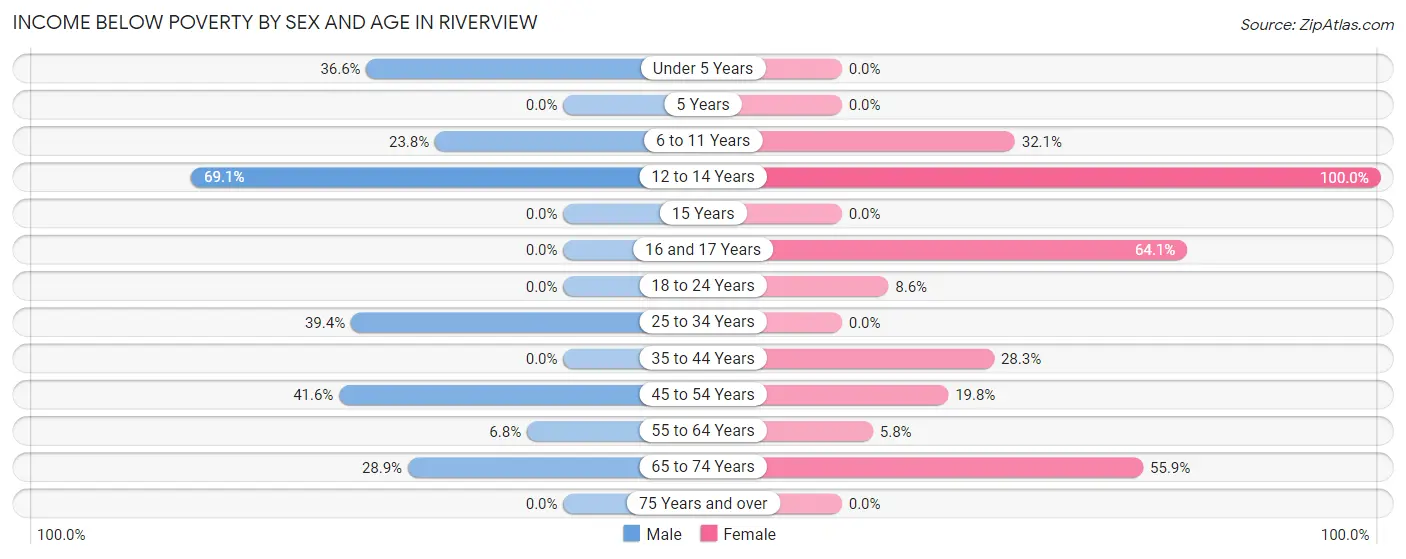
| Age Bracket | Male | Female |
| Under 5 Years | 53 (36.5%) | 0 (0.0%) |
| 5 Years | 0 (0.0%) | 0 (0.0%) |
| 6 to 11 Years | 20 (23.8%) | 35 (32.1%) |
| 12 to 14 Years | 38 (69.1%) | 7 (100.0%) |
| 15 Years | 0 (0.0%) | 0 (0.0%) |
| 16 and 17 Years | 0 (0.0%) | 50 (64.1%) |
| 18 to 24 Years | 0 (0.0%) | 37 (8.6%) |
| 25 to 34 Years | 95 (39.4%) | 0 (0.0%) |
| 35 to 44 Years | 0 (0.0%) | 63 (28.2%) |
| 45 to 54 Years | 62 (41.6%) | 31 (19.8%) |
| 55 to 64 Years | 17 (6.8%) | 18 (5.8%) |
| 65 to 74 Years | 15 (28.8%) | 66 (55.9%) |
| 75 Years and over | 0 (0.0%) | 0 (0.0%) |
| Total | 300 (26.6%) | 307 (17.2%) |
Income Above Poverty by Sex and Age in Riverview
According to the poverty statistics in Riverview, males aged 5 years and females aged under 5 years are the age groups that are most secure financially, with 100.0% of males and 100.0% of females in these age groups living above the poverty line.
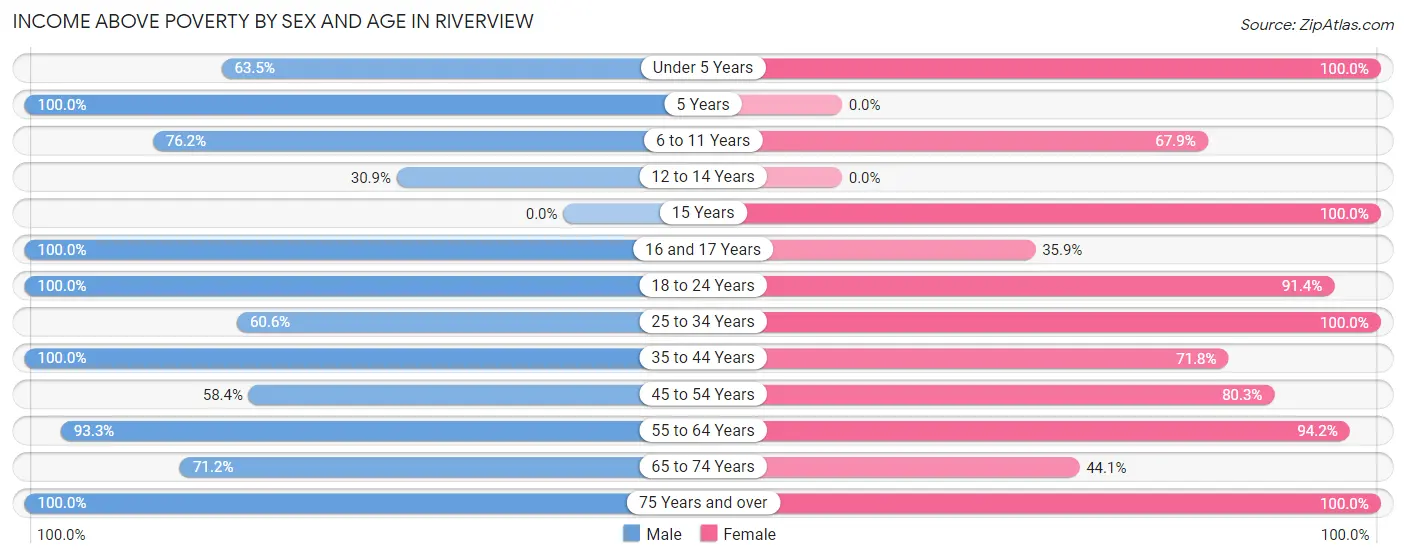
| Age Bracket | Male | Female |
| Under 5 Years | 92 (63.4%) | 94 (100.0%) |
| 5 Years | 9 (100.0%) | 0 (0.0%) |
| 6 to 11 Years | 64 (76.2%) | 74 (67.9%) |
| 12 to 14 Years | 17 (30.9%) | 0 (0.0%) |
| 15 Years | 0 (0.0%) | 34 (100.0%) |
| 16 and 17 Years | 10 (100.0%) | 28 (35.9%) |
| 18 to 24 Years | 51 (100.0%) | 391 (91.4%) |
| 25 to 34 Years | 146 (60.6%) | 171 (100.0%) |
| 35 to 44 Years | 58 (100.0%) | 160 (71.8%) |
| 45 to 54 Years | 87 (58.4%) | 126 (80.2%) |
| 55 to 64 Years | 235 (93.2%) | 294 (94.2%) |
| 65 to 74 Years | 37 (71.2%) | 52 (44.1%) |
| 75 Years and over | 24 (100.0%) | 49 (100.0%) |
| Total | 830 (73.5%) | 1,473 (82.8%) |
Income Below Poverty Among Married-Couple Families in Riverview
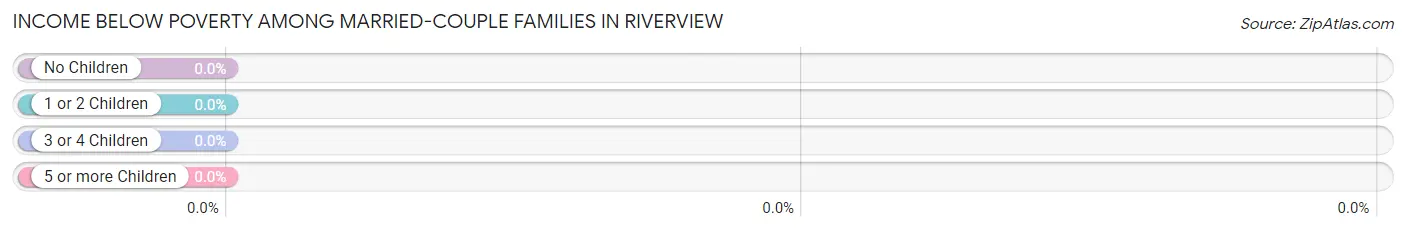
| Children | Above Poverty | Below Poverty |
| No Children | 252 (100.0%) | 0 (0.0%) |
| 1 or 2 Children | 49 (100.0%) | 0 (0.0%) |
| 3 or 4 Children | 0 (0.0%) | 0 (0.0%) |
| 5 or more Children | 36 (100.0%) | 0 (0.0%) |
| Total | 337 (100.0%) | 0 (0.0%) |
Income Below Poverty Among Single-Parent Households in Riverview
According to the poverty data in Riverview, 14.3% or 8 single-father households and 25.0% or 87 single-mother households are living below the poverty line. Among single-father households, those with 1 or 2 children have the highest poverty rate, with 8 households (16.3%) experiencing poverty. Likewise, among single-mother households, those with 3 or 4 children have the highest poverty rate, with 25 households (78.1%) falling below the poverty line.
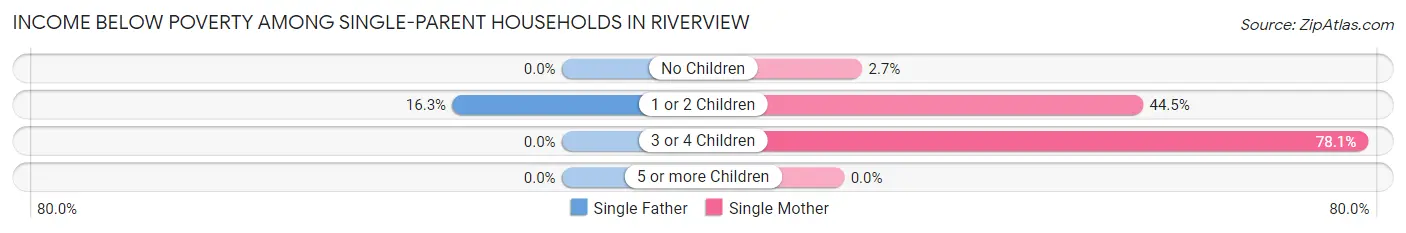
| Children | Single Father | Single Mother |
| No Children | 0 (0.0%) | 5 (2.7%) |
| 1 or 2 Children | 8 (16.3%) | 57 (44.5%) |
| 3 or 4 Children | 0 (0.0%) | 25 (78.1%) |
| 5 or more Children | 0 (0.0%) | 0 (0.0%) |
| Total | 8 (14.3%) | 87 (25.0%) |
Income Below Poverty Among Married-Couple vs Single-Parent Households in Riverview
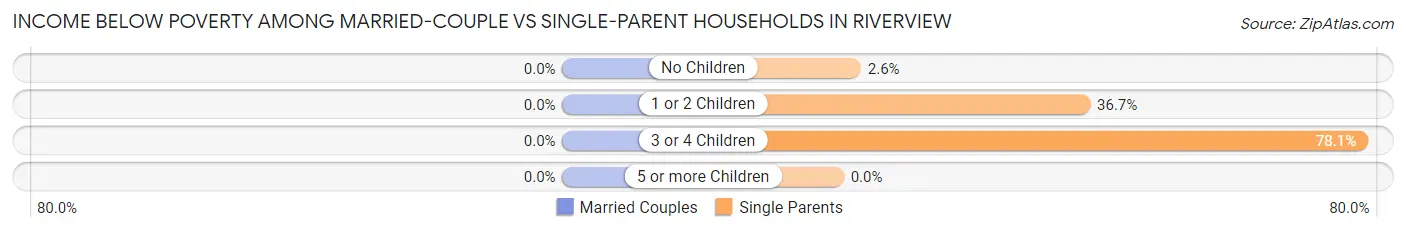
| Children | Married-Couple Families | Single-Parent Households |
| No Children | 0 (0.0%) | 5 (2.6%) |
| 1 or 2 Children | 0 (0.0%) | 65 (36.7%) |
| 3 or 4 Children | 0 (0.0%) | 25 (78.1%) |
| 5 or more Children | 0 (0.0%) | 0 (0.0%) |
| Total | 0 (0.0%) | 95 (23.5%) |
Race in Riverview
The most populous races in Riverview are Black / African American (2,171 | 74.6%), White / Caucasian (599 | 20.6%), and Some other Race (74 | 2.5%).
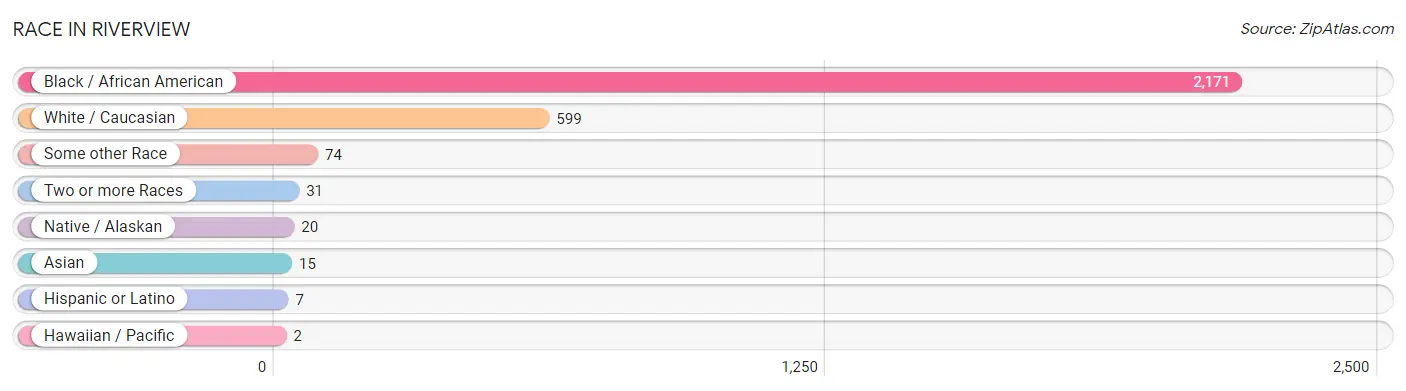
| Race | # Population | % Population |
| Asian | 15 | 0.5% |
| Black / African American | 2,171 | 74.6% |
| Hawaiian / Pacific | 2 | 0.1% |
| Hispanic or Latino | 7 | 0.2% |
| Native / Alaskan | 20 | 0.7% |
| White / Caucasian | 599 | 20.6% |
| Two or more Races | 31 | 1.1% |
| Some other Race | 74 | 2.5% |
| Total | 2,912 | 100.0% |
Ancestry in Riverview
The most populous ancestries reported in Riverview are German (132 | 4.5%), Irish (127 | 4.4%), French (46 | 1.6%), Subsaharan African (36 | 1.2%), and Italian (32 | 1.1%), together accounting for 12.8% of all Riverview residents.
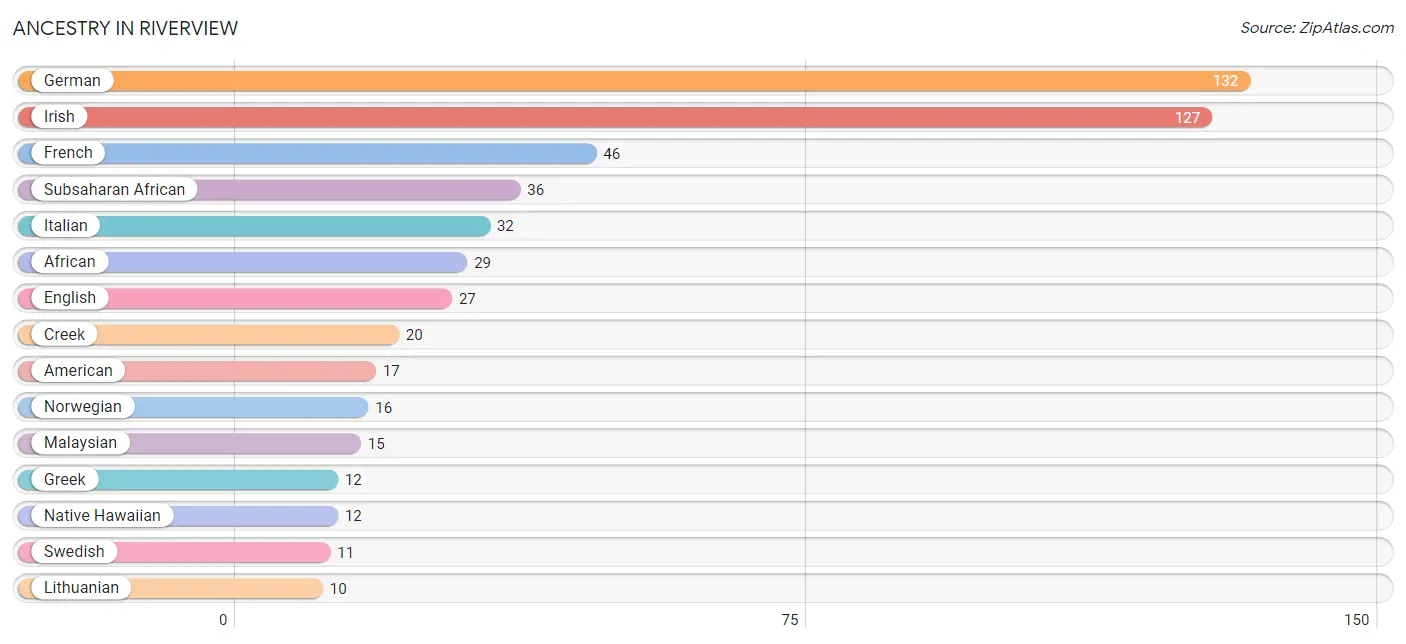
| Ancestry | # Population | % Population |
| African | 29 | 1.0% |
| American | 17 | 0.6% |
| Creek | 20 | 0.7% |
| Dutch | 6 | 0.2% |
| English | 27 | 0.9% |
| French | 46 | 1.6% |
| German | 132 | 4.5% |
| Greek | 12 | 0.4% |
| Irish | 127 | 4.4% |
| Italian | 32 | 1.1% |
| Lithuanian | 10 | 0.3% |
| Malaysian | 15 | 0.5% |
| Native Hawaiian | 12 | 0.4% |
| Norwegian | 16 | 0.5% |
| Puerto Rican | 5 | 0.2% |
| Slovak | 7 | 0.2% |
| Subsaharan African | 36 | 1.2% |
| Swedish | 11 | 0.4% | View All 18 Rows |
Immigrants in Riverview
The most numerous immigrant groups reported in Riverview came from Africa (44 | 1.5%), Congo (44 | 1.5%), Middle Africa (44 | 1.5%), Asia (15 | 0.5%), and Laos (15 | 0.5%), together accounting for 5.6% of all Riverview residents.
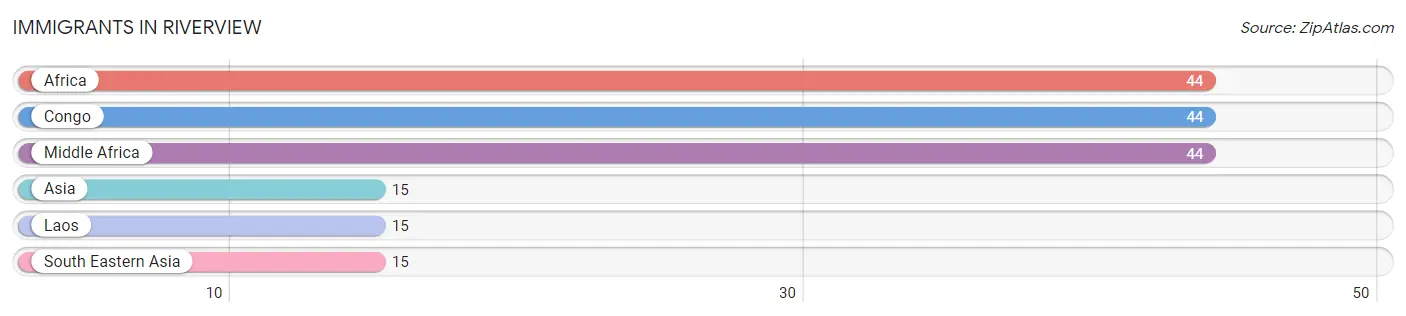
| Immigration Origin | # Population | % Population |
| Africa | 44 | 1.5% |
| Asia | 15 | 0.5% |
| Congo | 44 | 1.5% |
| Laos | 15 | 0.5% |
| Middle Africa | 44 | 1.5% |
| South Eastern Asia | 15 | 0.5% | View All 6 Rows |
Sex and Age in Riverview
Sex and Age in Riverview
The most populous age groups in Riverview are 30 to 34 Years (181 | 16.0%) for men and 20 to 24 Years (402 | 22.6%) for women.
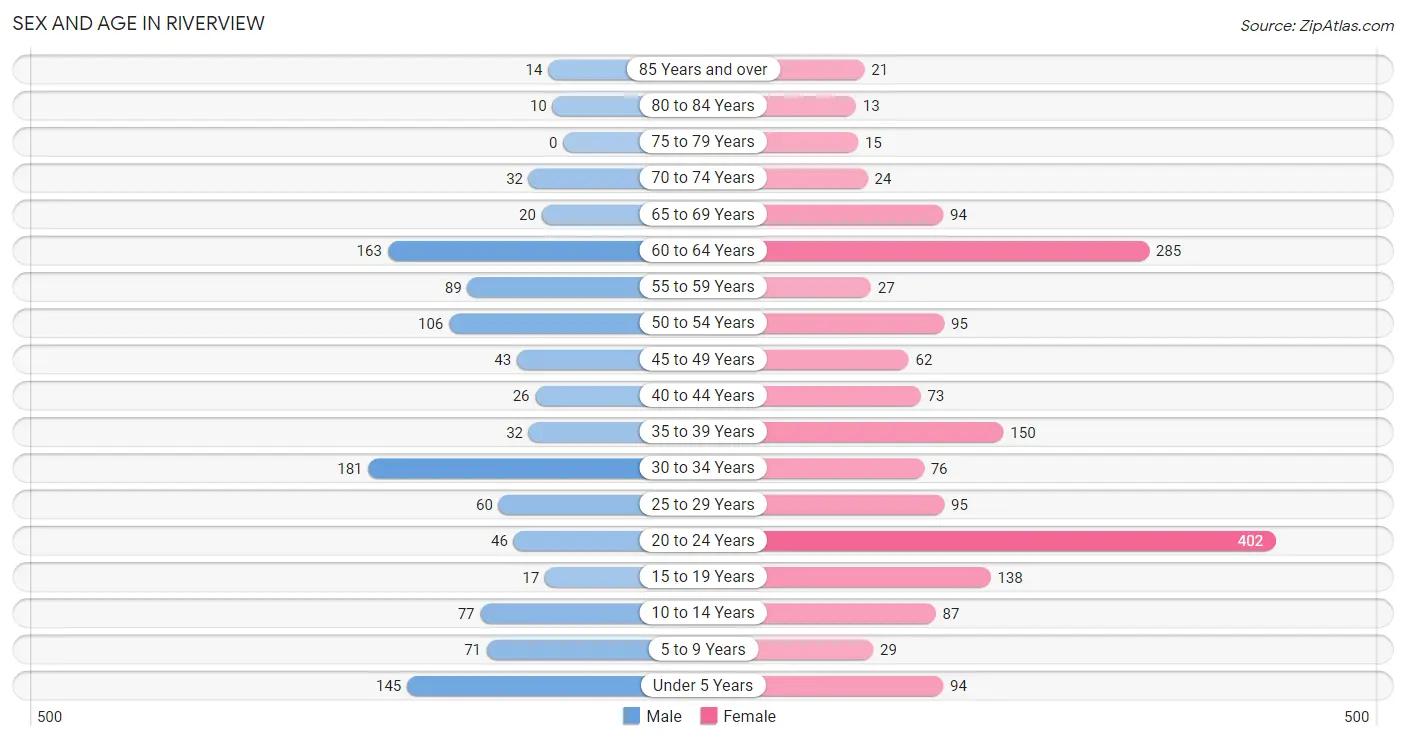
| Age Bracket | Male | Female |
| Under 5 Years | 145 (12.8%) | 94 (5.3%) |
| 5 to 9 Years | 71 (6.3%) | 29 (1.6%) |
| 10 to 14 Years | 77 (6.8%) | 87 (4.9%) |
| 15 to 19 Years | 17 (1.5%) | 138 (7.7%) |
| 20 to 24 Years | 46 (4.1%) | 402 (22.6%) |
| 25 to 29 Years | 60 (5.3%) | 95 (5.3%) |
| 30 to 34 Years | 181 (16.0%) | 76 (4.3%) |
| 35 to 39 Years | 32 (2.8%) | 150 (8.4%) |
| 40 to 44 Years | 26 (2.3%) | 73 (4.1%) |
| 45 to 49 Years | 43 (3.8%) | 62 (3.5%) |
| 50 to 54 Years | 106 (9.4%) | 95 (5.3%) |
| 55 to 59 Years | 89 (7.9%) | 27 (1.5%) |
| 60 to 64 Years | 163 (14.4%) | 285 (16.0%) |
| 65 to 69 Years | 20 (1.8%) | 94 (5.3%) |
| 70 to 74 Years | 32 (2.8%) | 24 (1.3%) |
| 75 to 79 Years | 0 (0.0%) | 15 (0.8%) |
| 80 to 84 Years | 10 (0.9%) | 13 (0.7%) |
| 85 Years and over | 14 (1.2%) | 21 (1.2%) |
| Total | 1,132 (100.0%) | 1,780 (100.0%) |
Families and Households in Riverview
Median Family Size in Riverview
The median family size in Riverview is 2.96 persons per family, with single male/father families (56 | 7.6%) accounting for the largest median family size of 3.07 persons per family. On the other hand, single female/mother families (348 | 47.0%) represent the smallest median family size with 2.95 persons per family.
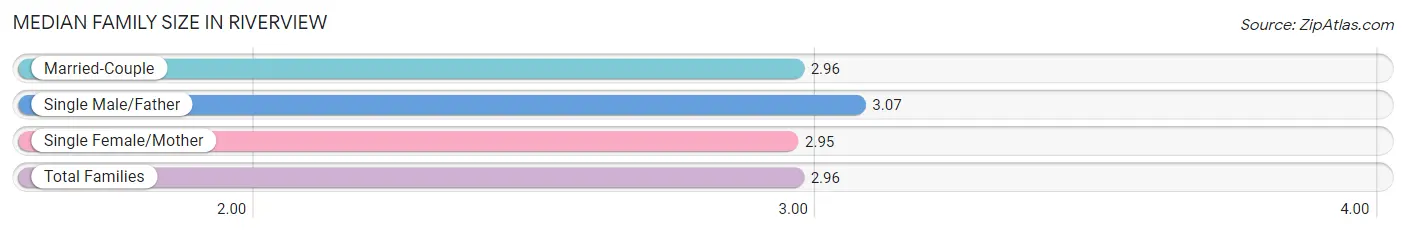
| Family Type | # Families | Family Size |
| Married-Couple | 337 (45.5%) | 2.96 |
| Single Male/Father | 56 (7.6%) | 3.07 |
| Single Female/Mother | 348 (47.0%) | 2.95 |
| Total Families | 741 (100.0%) | 2.96 |
Median Household Size in Riverview
The median household size in Riverview is 2.21 persons per household, with single male/father households (56 | 4.3%) accounting for the largest median household size of 3.07 persons per household. non-family households (574 | 43.6%) represent the smallest median household size with 1.23 persons per household.
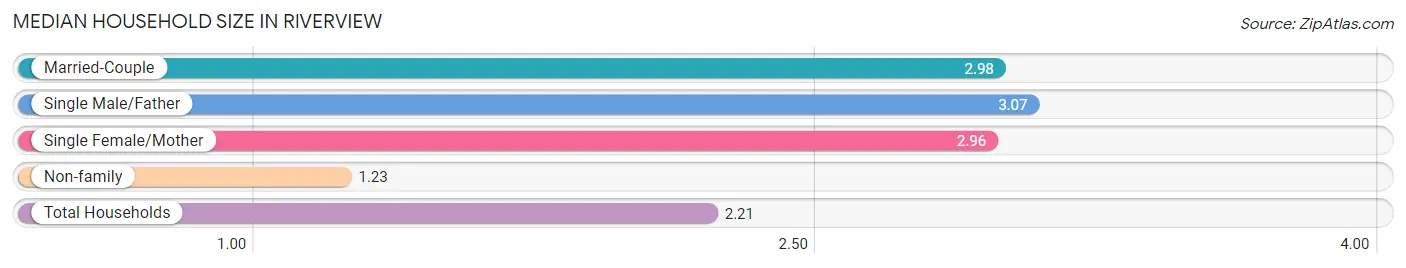
| Household Type | # Households | Household Size |
| Married-Couple | 337 (25.6%) | 2.98 |
| Single Male/Father | 56 (4.3%) | 3.07 |
| Single Female/Mother | 348 (26.5%) | 2.96 |
| Non-family | 574 (43.6%) | 1.23 |
| Total Households | 1,315 (100.0%) | 2.21 |
Household Size by Marriage Status in Riverview
Out of a total of 1,315 households in Riverview, 741 (56.4%) are family households, while 574 (43.6%) are nonfamily households. The most numerous type of family households are 2-person households, comprising 405, and the most common type of nonfamily households are 1-person households, comprising 395.
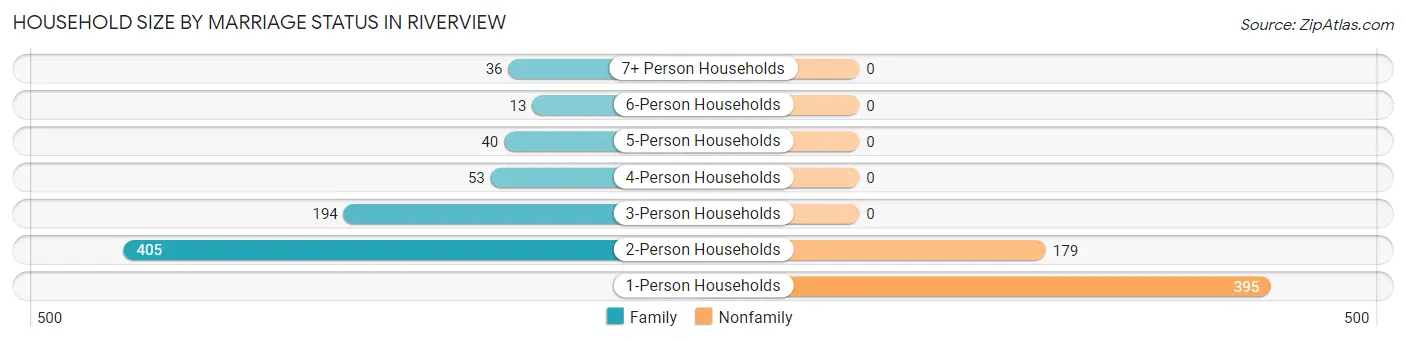
| Household Size | Family Households | Nonfamily Households |
| 1-Person Households | - | 395 (30.0%) |
| 2-Person Households | 405 (30.8%) | 179 (13.6%) |
| 3-Person Households | 194 (14.7%) | 0 (0.0%) |
| 4-Person Households | 53 (4.0%) | 0 (0.0%) |
| 5-Person Households | 40 (3.0%) | 0 (0.0%) |
| 6-Person Households | 13 (1.0%) | 0 (0.0%) |
| 7+ Person Households | 36 (2.7%) | 0 (0.0%) |
| Total | 741 (56.4%) | 574 (43.6%) |
Female Fertility in Riverview
Fertility by Age in Riverview
Average fertility rate in Riverview is 22.0 births per 1,000 women. Women in the age bracket of 20 to 34 years have the highest fertility rate with 26.0 births per 1,000 women. Women in the age bracket of 20 to 34 years acount for 68.2% of all women with births.
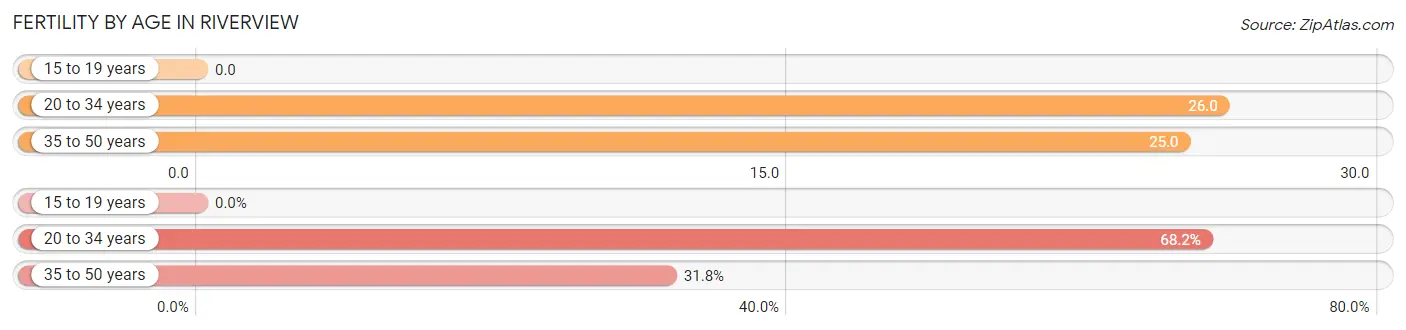
| Age Bracket | Women with Births | Births / 1,000 Women |
| 15 to 19 years | 0 (0.0%) | 0.0 |
| 20 to 34 years | 15 (68.2%) | 26.0 |
| 35 to 50 years | 7 (31.8%) | 25.0 |
| Total | 22 (100.0%) | 22.0 |
Fertility by Age by Marriage Status in Riverview
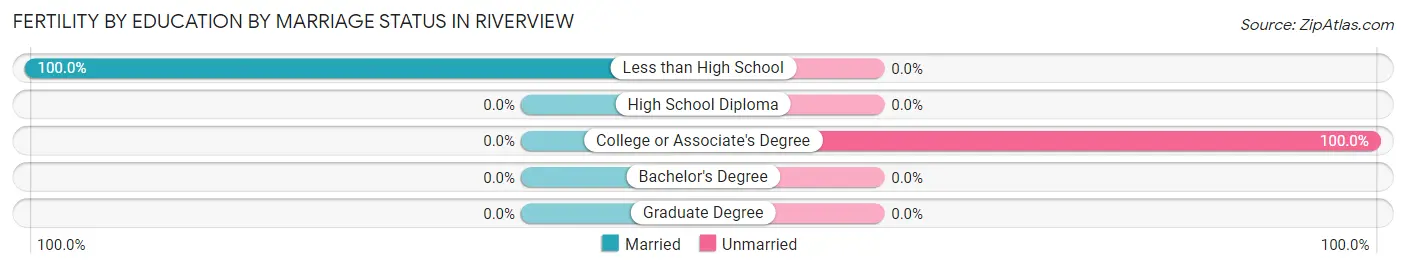
31.8% of women with births (22) in Riverview are married. The highest percentage of unmarried women with births falls into 20 to 34 years age bracket with 100.0% of them unmarried at the time of birth, while the lowest percentage of unmarried women with births belong to 35 to 50 years age bracket with 0.0% of them unmarried.
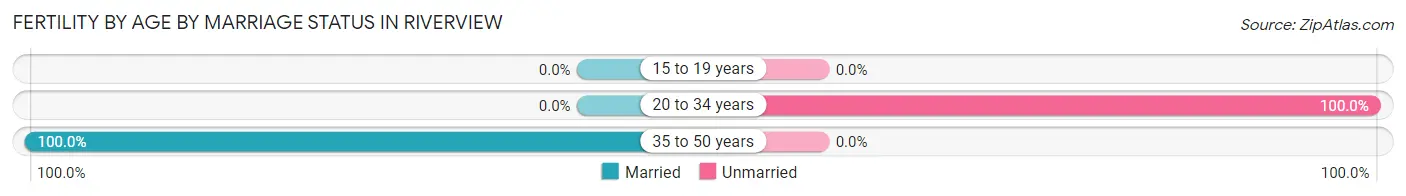
| Age Bracket | Married | Unmarried |
| 15 to 19 years | 0 (0.0%) | 0 (0.0%) |
| 20 to 34 years | 0 (0.0%) | 15 (100.0%) |
| 35 to 50 years | 7 (100.0%) | 0 (0.0%) |
| Total | 7 (31.8%) | 15 (68.2%) |
Fertility by Education in Riverview
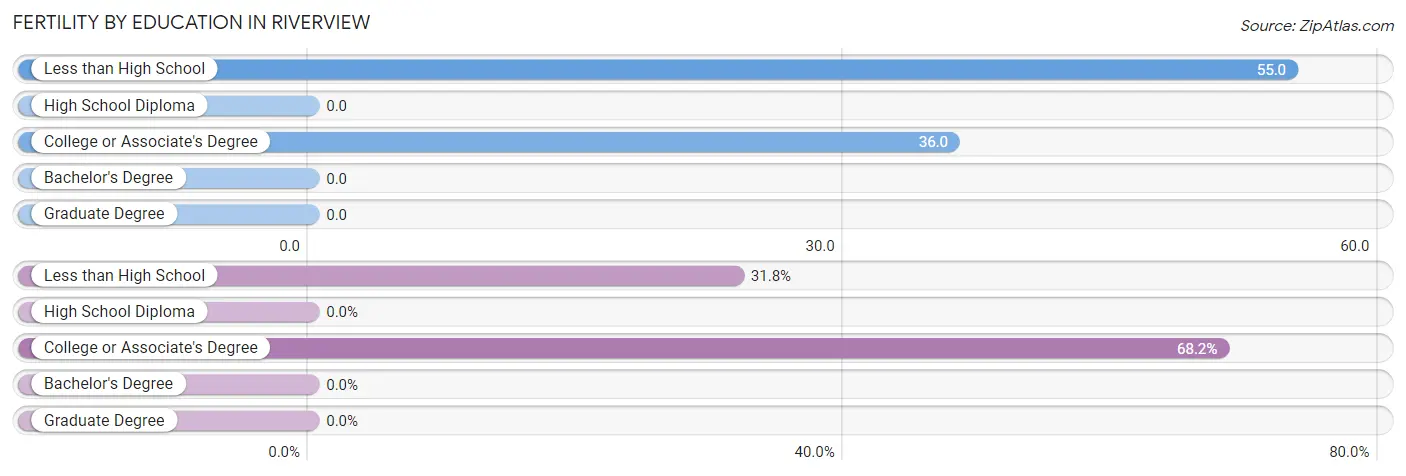
| Educational Attainment | Women with Births | Births / 1,000 Women |
| Less than High School | 7 (31.8%) | 55.0 |
| High School Diploma | 0 (0.0%) | 0.0 |
| College or Associate's Degree | 15 (68.2%) | 36.0 |
| Bachelor's Degree | 0 (0.0%) | 0.0 |
| Graduate Degree | 0 (0.0%) | 0.0 |
| Total | 22 (100.0%) | 22.0 |
Fertility by Education by Marriage Status in Riverview
68.2% of women with births in Riverview are unmarried. Women with the educational attainment of less than high school are most likely to be married with 100.0% of them married at childbirth, while women with the educational attainment of college or associate's degree are least likely to be married with 100.0% of them unmarried at childbirth.
| Educational Attainment | Married | Unmarried |
| Less than High School | 7 (100.0%) | 0 (0.0%) |
| High School Diploma | 0 (0.0%) | 0 (0.0%) |
| College or Associate's Degree | 0 (0.0%) | 15 (100.0%) |
| Bachelor's Degree | 0 (0.0%) | 0 (0.0%) |
| Graduate Degree | 0 (0.0%) | 0 (0.0%) |
| Total | 7 (31.8%) | 15 (68.2%) |
Employment Characteristics in Riverview
Employment by Class of Employer in Riverview
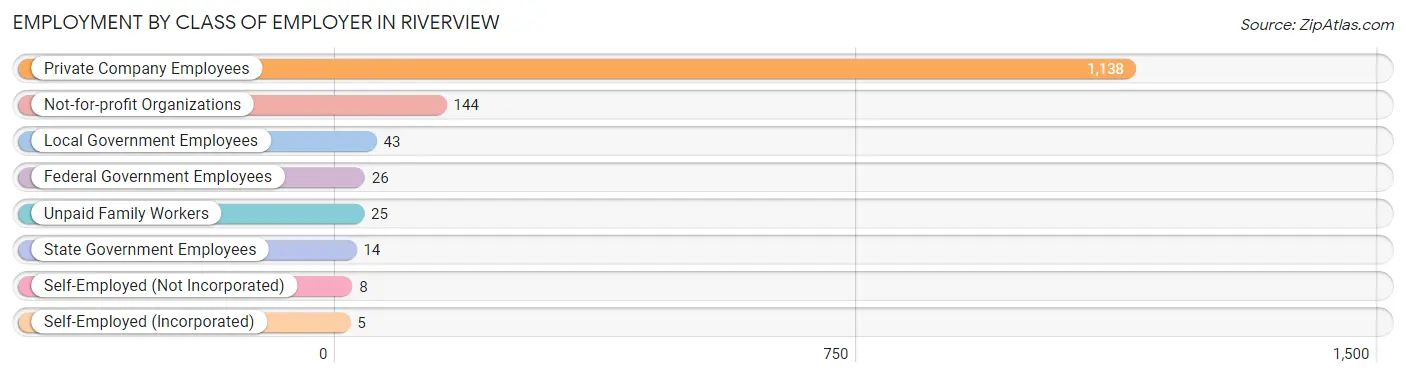
Among the 1,403 employed individuals in Riverview, private company employees (1,138 | 81.1%), not-for-profit organizations (144 | 10.3%), and local government employees (43 | 3.1%) make up the most common classes of employment.
| Employer Class | # Employees | % Employees |
| Private Company Employees | 1,138 | 81.1% |
| Self-Employed (Incorporated) | 5 | 0.4% |
| Self-Employed (Not Incorporated) | 8 | 0.6% |
| Not-for-profit Organizations | 144 | 10.3% |
| Local Government Employees | 43 | 3.1% |
| State Government Employees | 14 | 1.0% |
| Federal Government Employees | 26 | 1.8% |
| Unpaid Family Workers | 25 | 1.8% |
| Total | 1,403 | 100.0% |
Employment Status by Age in Riverview
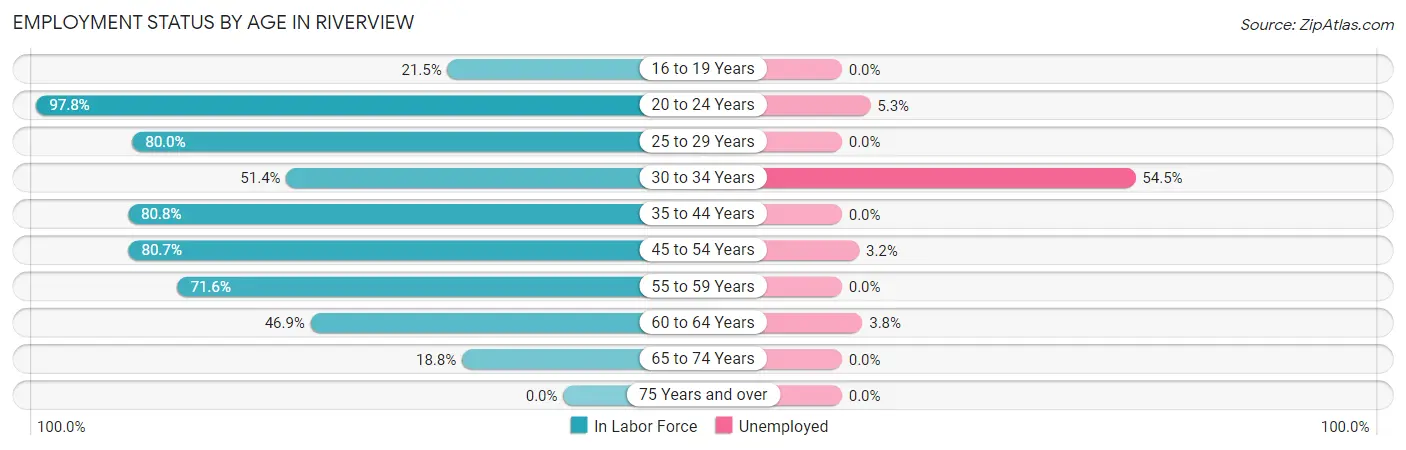
According to the labor force statistics for Riverview, out of the total population over 16 years of age (2,375), 64.0% or 1,520 individuals are in the labor force, with 7.3% or 111 of them unemployed. The age group with the highest labor force participation rate is 20 to 24 years, with 97.8% or 438 individuals in the labor force. Within the labor force, the 30 to 34 years age range has the highest percentage of unemployed individuals, with 54.5% or 72 of them being unemployed.
| Age Bracket | In Labor Force | Unemployed |
| 16 to 19 Years | 26 (21.5%) | 0 (0.0%) |
| 20 to 24 Years | 438 (97.8%) | 23 (5.3%) |
| 25 to 29 Years | 124 (80.0%) | 0 (0.0%) |
| 30 to 34 Years | 132 (51.4%) | 72 (54.5%) |
| 35 to 44 Years | 227 (80.8%) | 0 (0.0%) |
| 45 to 54 Years | 247 (80.7%) | 8 (3.2%) |
| 55 to 59 Years | 83 (71.6%) | 0 (0.0%) |
| 60 to 64 Years | 210 (46.9%) | 8 (3.8%) |
| 65 to 74 Years | 32 (18.8%) | 0 (0.0%) |
| 75 Years and over | 0 (0.0%) | 0 (0.0%) |
| Total | 1,520 (64.0%) | 111 (7.3%) |
Employment Status by Educational Attainment in Riverview
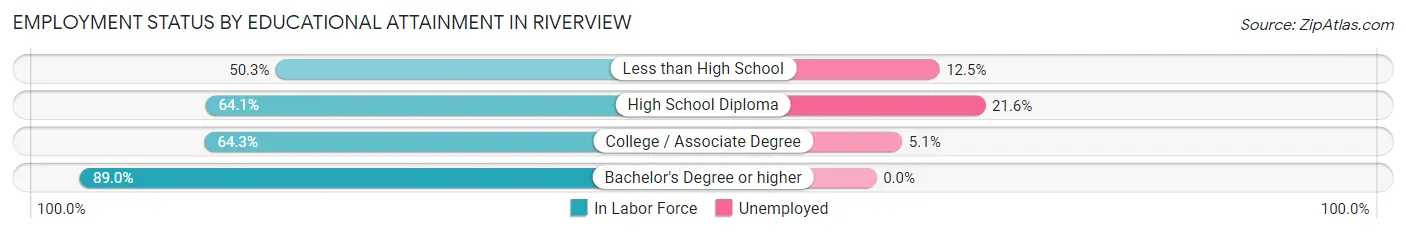
According to labor force statistics for Riverview, 65.5% of individuals (1,024) out of the total population between 25 and 64 years of age (1,563) are in the labor force, with 8.6% or 88 of them being unemployed. The group with the highest labor force participation rate are those with the educational attainment of bachelor's degree or higher, with 89.0% or 154 individuals in the labor force. Within the labor force, individuals with high school diploma education have the highest percentage of unemployment, with 21.6% or 49 of them being unemployed.
| Educational Attainment | In Labor Force | Unemployed |
| Less than High School | 88 (50.3%) | 22 (12.5%) |
| High School Diploma | 227 (64.1%) | 76 (21.6%) |
| College / Associate Degree | 554 (64.3%) | 44 (5.1%) |
| Bachelor's Degree or higher | 154 (89.0%) | 0 (0.0%) |
| Total | 1,024 (65.5%) | 134 (8.6%) |
Employment Occupations by Sex in Riverview
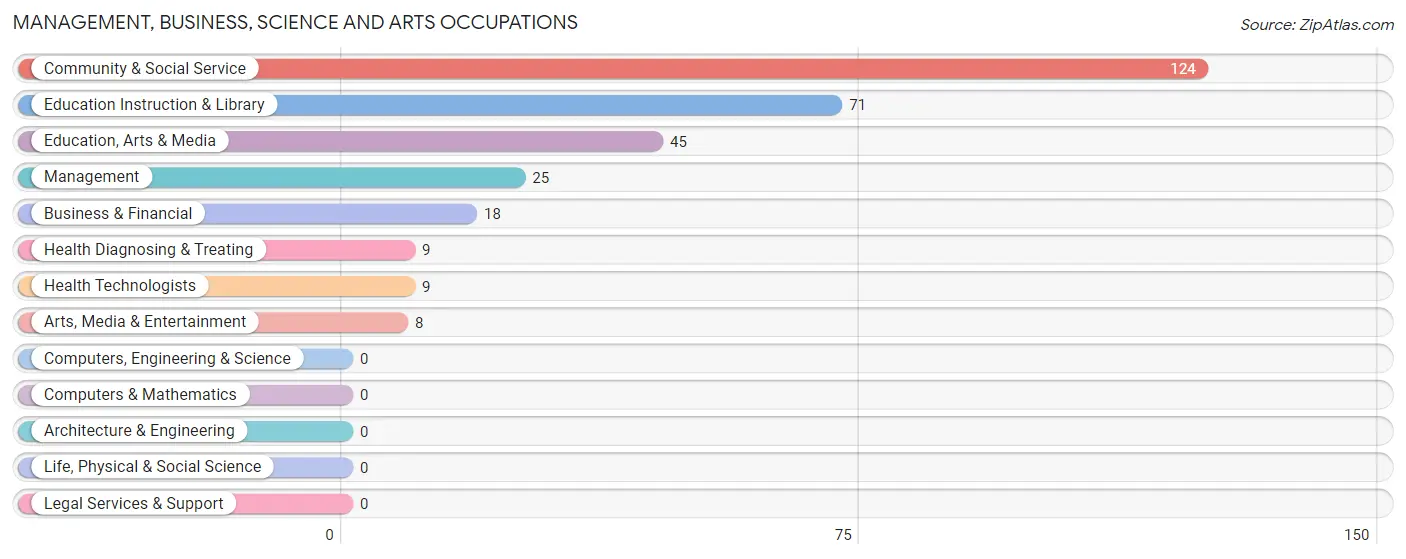
Management, Business, Science and Arts Occupations
The most common Management, Business, Science and Arts occupations in Riverview are Community & Social Service (124 | 8.8%), Education Instruction & Library (71 | 5.0%), Education, Arts & Media (45 | 3.2%), Management (25 | 1.8%), and Business & Financial (18 | 1.3%).
Management, Business, Science and Arts Occupations by Sex
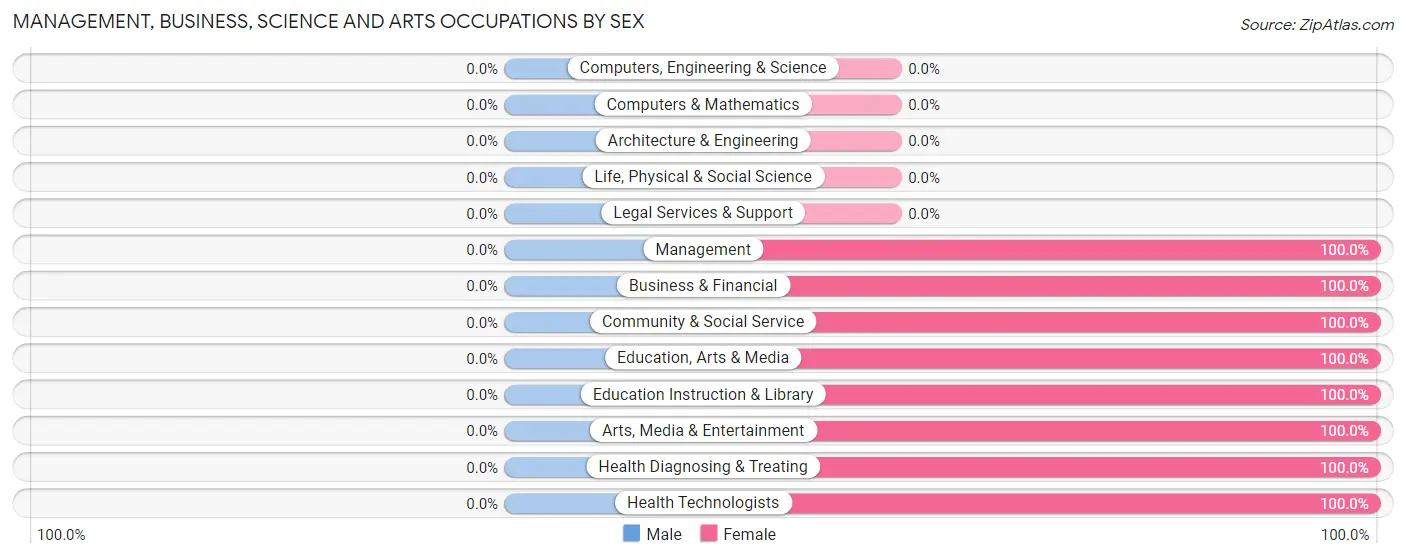
| Occupation | Male | Female |
| Management | 0 (0.0%) | 25 (100.0%) |
| Business & Financial | 0 (0.0%) | 18 (100.0%) |
| Computers, Engineering & Science | 0 (0.0%) | 0 (0.0%) |
| Computers & Mathematics | 0 (0.0%) | 0 (0.0%) |
| Architecture & Engineering | 0 (0.0%) | 0 (0.0%) |
| Life, Physical & Social Science | 0 (0.0%) | 0 (0.0%) |
| Community & Social Service | 0 (0.0%) | 124 (100.0%) |
| Education, Arts & Media | 0 (0.0%) | 45 (100.0%) |
| Legal Services & Support | 0 (0.0%) | 0 (0.0%) |
| Education Instruction & Library | 0 (0.0%) | 71 (100.0%) |
| Arts, Media & Entertainment | 0 (0.0%) | 8 (100.0%) |
| Health Diagnosing & Treating | 0 (0.0%) | 9 (100.0%) |
| Health Technologists | 0 (0.0%) | 9 (100.0%) |
| Total (Category) | 0 (0.0%) | 176 (100.0%) |
| Total (Overall) | 445 (31.6%) | 963 (68.4%) |
Services Occupations
The most common Services occupations in Riverview are Food Preparation & Serving (268 | 19.0%), Healthcare Support (258 | 18.3%), Personal Care & Service (54 | 3.8%), Cleaning & Maintenance (25 | 1.8%), and Security & Protection (22 | 1.6%).
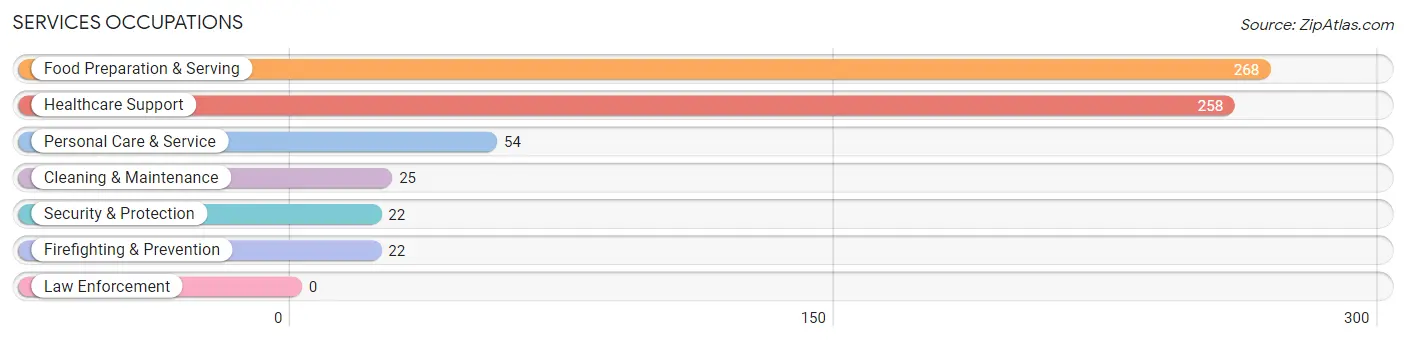
Services Occupations by Sex
Within the Services occupations in Riverview, the most male-oriented occupations are Security & Protection (72.7%), Firefighting & Prevention (72.7%), and Cleaning & Maintenance (72.0%), while the most female-oriented occupations are Healthcare Support (100.0%), Food Preparation & Serving (93.3%), and Personal Care & Service (51.8%).
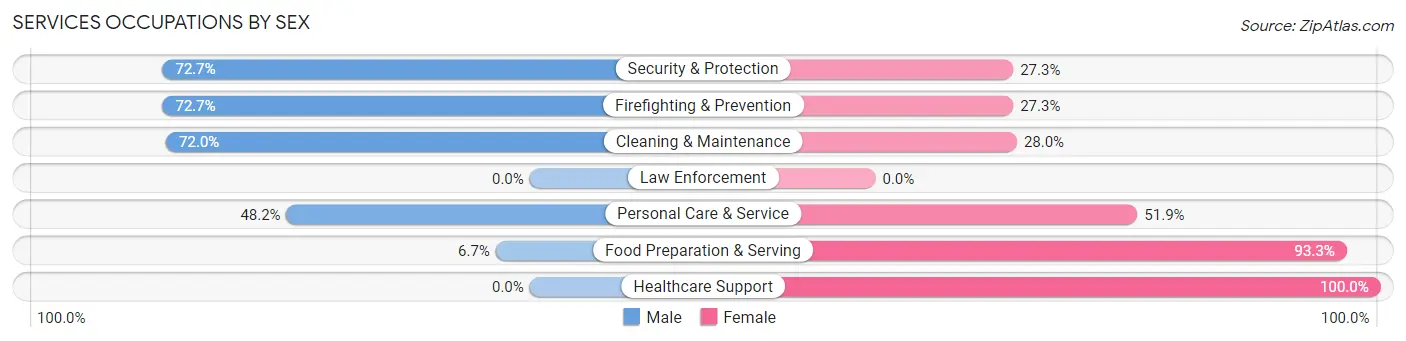
| Occupation | Male | Female |
| Healthcare Support | 0 (0.0%) | 258 (100.0%) |
| Security & Protection | 16 (72.7%) | 6 (27.3%) |
| Firefighting & Prevention | 16 (72.7%) | 6 (27.3%) |
| Law Enforcement | 0 (0.0%) | 0 (0.0%) |
| Food Preparation & Serving | 18 (6.7%) | 250 (93.3%) |
| Cleaning & Maintenance | 18 (72.0%) | 7 (28.0%) |
| Personal Care & Service | 26 (48.1%) | 28 (51.8%) |
| Total (Category) | 78 (12.4%) | 549 (87.6%) |
| Total (Overall) | 445 (31.6%) | 963 (68.4%) |
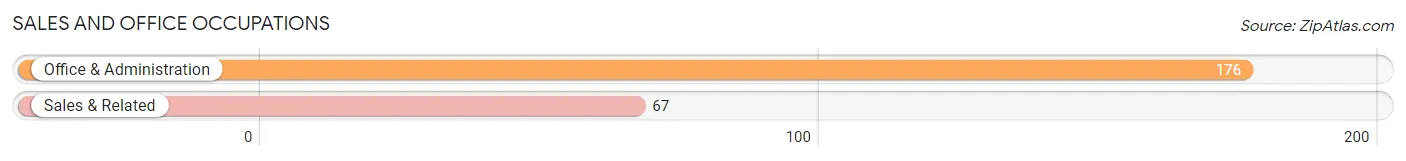
Sales and Office Occupations
The most common Sales and Office occupations in Riverview are Office & Administration (176 | 12.5%), and Sales & Related (67 | 4.8%).
Sales and Office Occupations by Sex

| Occupation | Male | Female |
| Sales & Related | 18 (26.9%) | 49 (73.1%) |
| Office & Administration | 14 (8.0%) | 162 (92.0%) |
| Total (Category) | 32 (13.2%) | 211 (86.8%) |
| Total (Overall) | 445 (31.6%) | 963 (68.4%) |
Natural Resources, Construction and Maintenance Occupations
The most common Natural Resources, Construction and Maintenance occupations in Riverview are Installation, Maintenance & Repair (33 | 2.3%), and Construction & Extraction (22 | 1.6%).

Natural Resources, Construction and Maintenance Occupations by Sex

| Occupation | Male | Female |
| Farming, Fishing & Forestry | 0 (0.0%) | 0 (0.0%) |
| Construction & Extraction | 22 (100.0%) | 0 (0.0%) |
| Installation, Maintenance & Repair | 33 (100.0%) | 0 (0.0%) |
| Total (Category) | 55 (100.0%) | 0 (0.0%) |
| Total (Overall) | 445 (31.6%) | 963 (68.4%) |
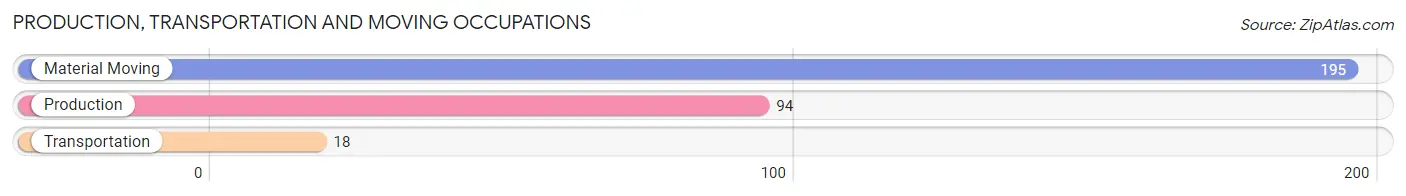
Production, Transportation and Moving Occupations
The most common Production, Transportation and Moving occupations in Riverview are Material Moving (195 | 13.9%), Production (94 | 6.7%), and Transportation (18 | 1.3%).
Production, Transportation and Moving Occupations by Sex
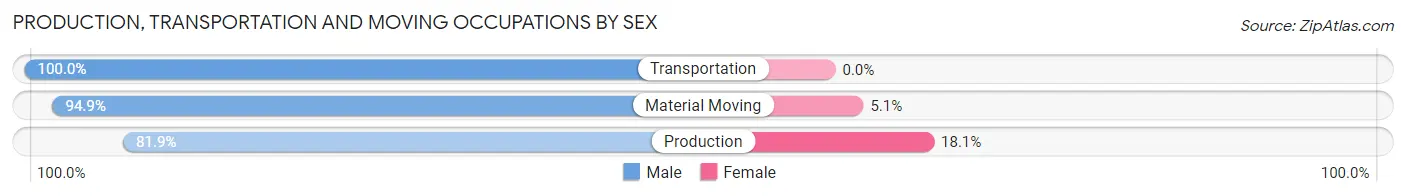
| Occupation | Male | Female |
| Production | 77 (81.9%) | 17 (18.1%) |
| Transportation | 18 (100.0%) | 0 (0.0%) |
| Material Moving | 185 (94.9%) | 10 (5.1%) |
| Total (Category) | 280 (91.2%) | 27 (8.8%) |
| Total (Overall) | 445 (31.6%) | 963 (68.4%) |
Employment Industries by Sex in Riverview
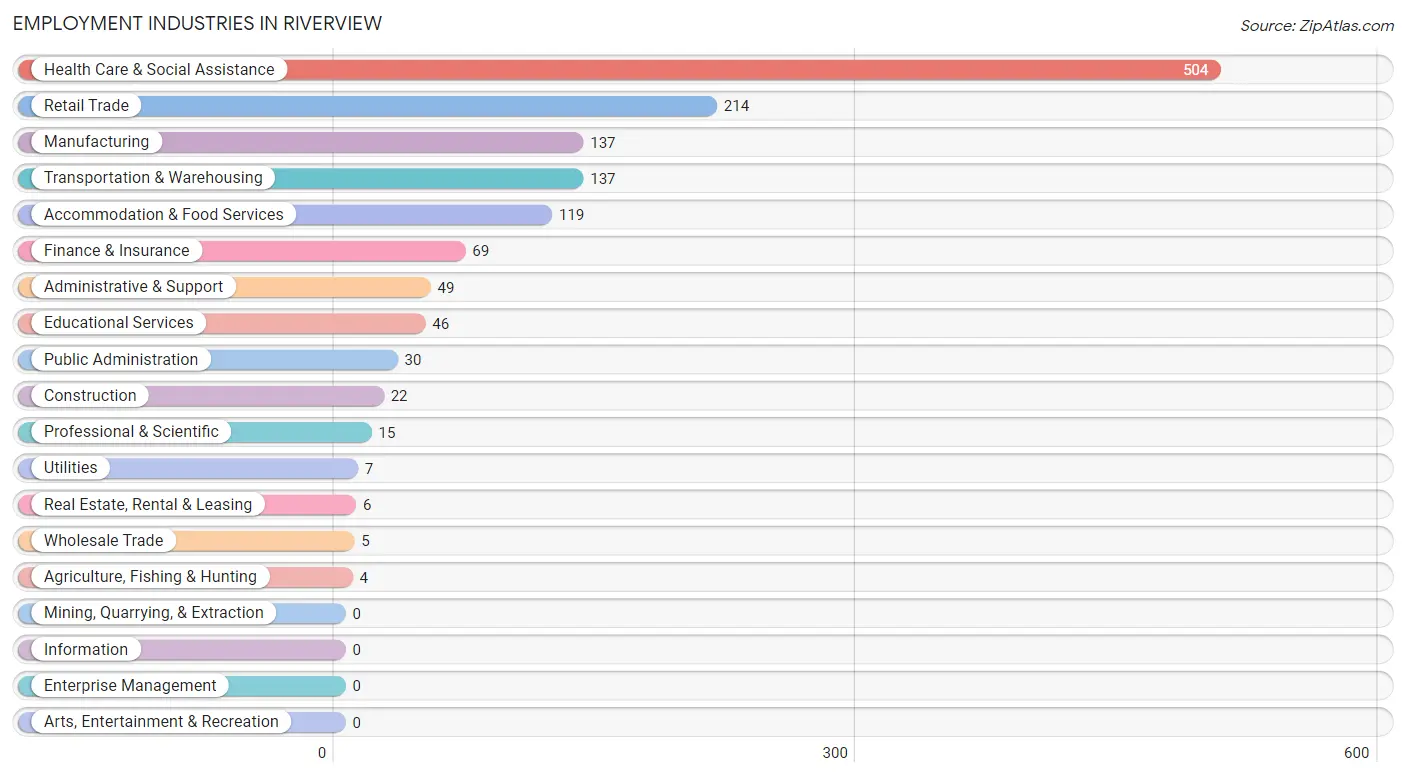
Employment Industries in Riverview
The major employment industries in Riverview include Health Care & Social Assistance (504 | 35.8%), Retail Trade (214 | 15.2%), Manufacturing (137 | 9.7%), Transportation & Warehousing (137 | 9.7%), and Accommodation & Food Services (119 | 8.5%).
Employment Industries by Sex in Riverview
The Riverview industries that see more men than women are Agriculture, Fishing & Hunting (100.0%), Construction (100.0%), and Utilities (100.0%), whereas the industries that tend to have a higher number of women are Wholesale Trade (100.0%), Real Estate, Rental & Leasing (100.0%), and Professional & Scientific (100.0%).
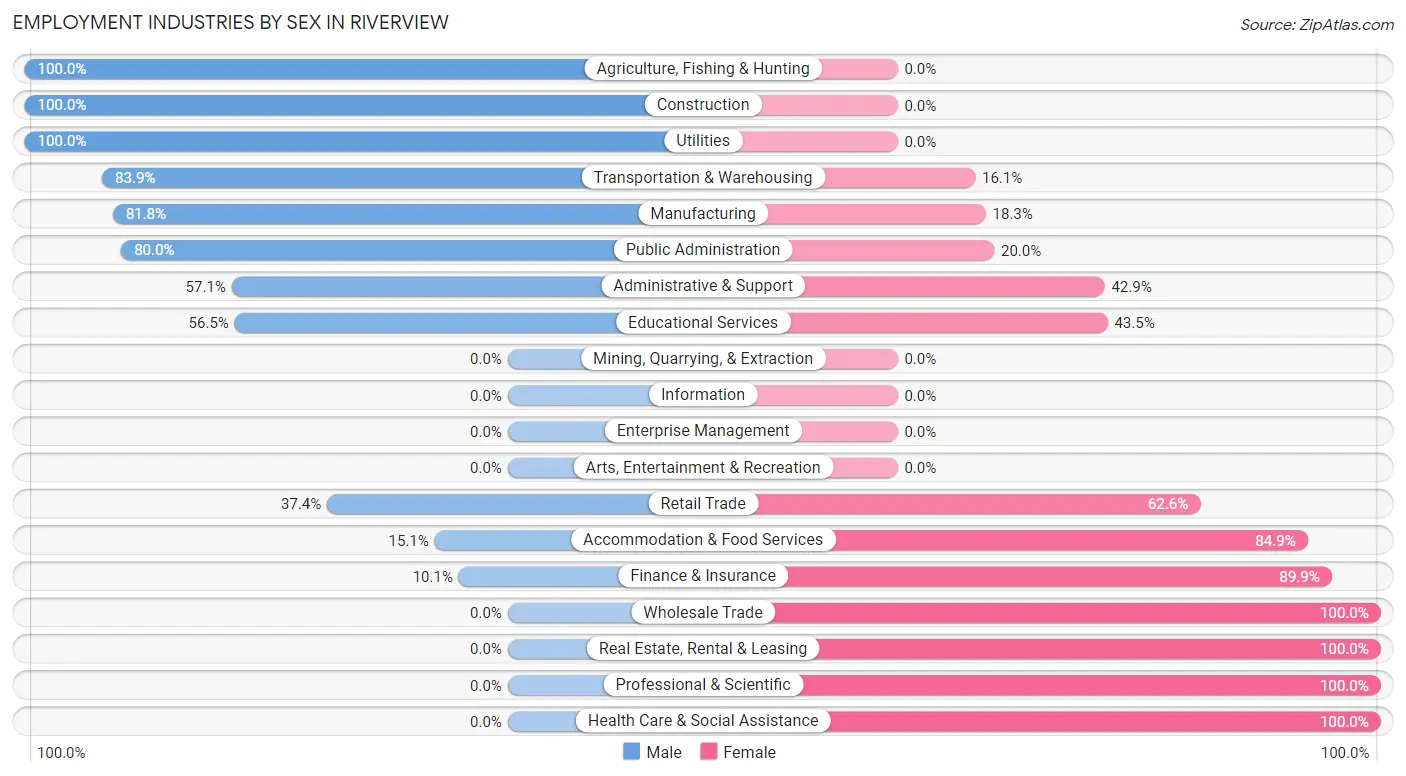
| Industry | Male | Female |
| Agriculture, Fishing & Hunting | 4 (100.0%) | 0 (0.0%) |
| Mining, Quarrying, & Extraction | 0 (0.0%) | 0 (0.0%) |
| Construction | 22 (100.0%) | 0 (0.0%) |
| Manufacturing | 112 (81.8%) | 25 (18.2%) |
| Wholesale Trade | 0 (0.0%) | 5 (100.0%) |
| Retail Trade | 80 (37.4%) | 134 (62.6%) |
| Transportation & Warehousing | 115 (83.9%) | 22 (16.1%) |
| Utilities | 7 (100.0%) | 0 (0.0%) |
| Information | 0 (0.0%) | 0 (0.0%) |
| Finance & Insurance | 7 (10.1%) | 62 (89.9%) |
| Real Estate, Rental & Leasing | 0 (0.0%) | 6 (100.0%) |
| Professional & Scientific | 0 (0.0%) | 15 (100.0%) |
| Enterprise Management | 0 (0.0%) | 0 (0.0%) |
| Administrative & Support | 28 (57.1%) | 21 (42.9%) |
| Educational Services | 26 (56.5%) | 20 (43.5%) |
| Health Care & Social Assistance | 0 (0.0%) | 504 (100.0%) |
| Arts, Entertainment & Recreation | 0 (0.0%) | 0 (0.0%) |
| Accommodation & Food Services | 18 (15.1%) | 101 (84.9%) |
| Public Administration | 24 (80.0%) | 6 (20.0%) |
| Total | 445 (31.6%) | 963 (68.4%) |
Education in Riverview
School Enrollment in Riverview
The most common levels of schooling among the 534 students in Riverview are high school (156 | 29.2%), elementary school (117 | 21.9%), and middle school (91 | 17.0%).
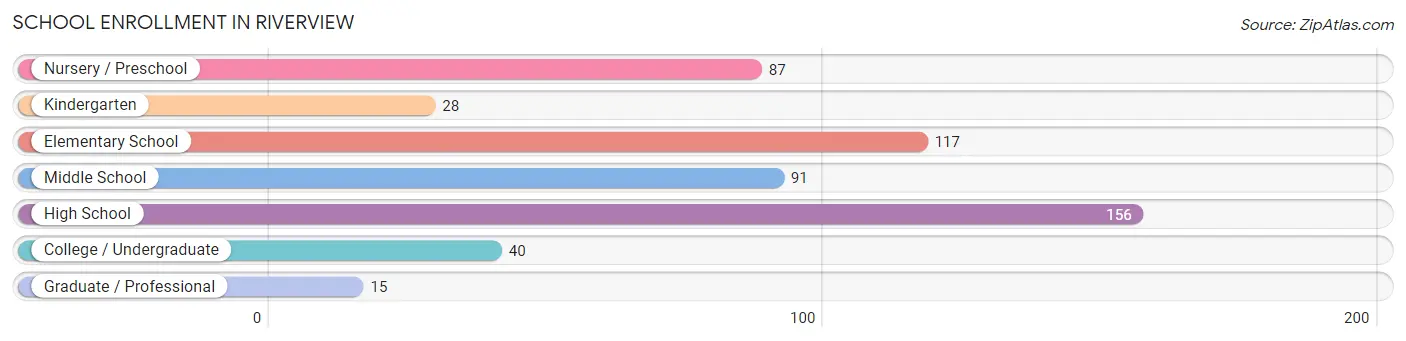
| School Level | # Students | % Students |
| Nursery / Preschool | 87 | 16.3% |
| Kindergarten | 28 | 5.2% |
| Elementary School | 117 | 21.9% |
| Middle School | 91 | 17.0% |
| High School | 156 | 29.2% |
| College / Undergraduate | 40 | 7.5% |
| Graduate / Professional | 15 | 2.8% |
| Total | 534 | 100.0% |
School Enrollment by Age by Funding Source in Riverview
Out of a total of 534 students who are enrolled in schools in Riverview, 211 (39.5%) attend a private institution, while the remaining 323 (60.5%) are enrolled in public schools. The age group of 35 years and over has the highest likelihood of being enrolled in private schools, with 28 (96.6% in the age bracket) enrolled. Conversely, the age group of 3 to 4 year olds has the lowest likelihood of being enrolled in a private school, with 77 (88.5% in the age bracket) attending a public institution.
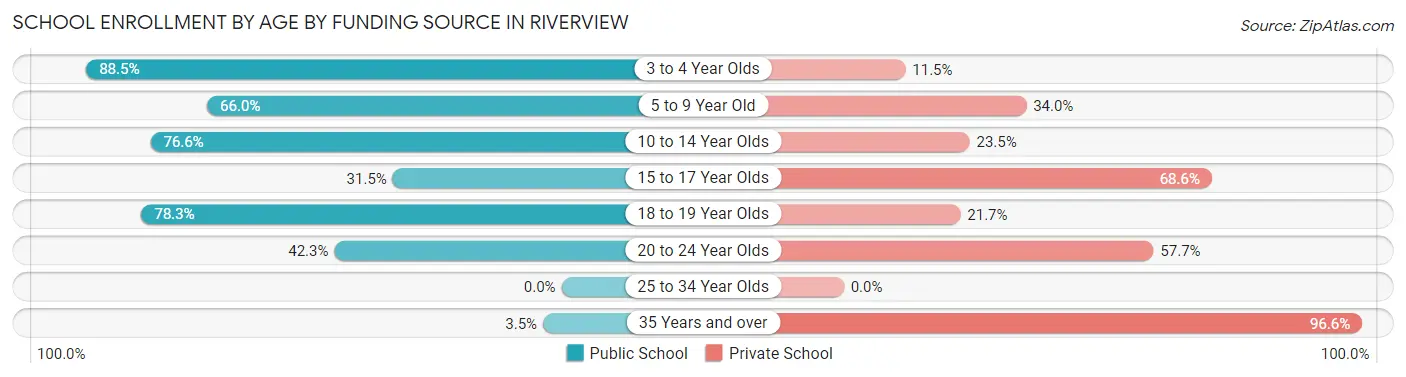
| Age Bracket | Public School | Private School |
| 3 to 4 Year Olds | 77 (88.5%) | 10 (11.5%) |
| 5 to 9 Year Old | 66 (66.0%) | 34 (34.0%) |
| 10 to 14 Year Olds | 111 (76.5%) | 34 (23.4%) |
| 15 to 17 Year Olds | 39 (31.5%) | 85 (68.5%) |
| 18 to 19 Year Olds | 18 (78.3%) | 5 (21.7%) |
| 20 to 24 Year Olds | 11 (42.3%) | 15 (57.7%) |
| 25 to 34 Year Olds | 0 (0.0%) | 0 (0.0%) |
| 35 Years and over | 1 (3.5%) | 28 (96.6%) |
| Total | 323 (60.5%) | 211 (39.5%) |
Educational Attainment by Field of Study in Riverview
Computers & mathematics (48 | 24.7%), education (45 | 23.2%), communications (39 | 20.1%), physical & health sciences (19 | 9.8%), and arts & humanities (16 | 8.3%) are the most common fields of study among 194 individuals in Riverview who have obtained a bachelor's degree or higher.
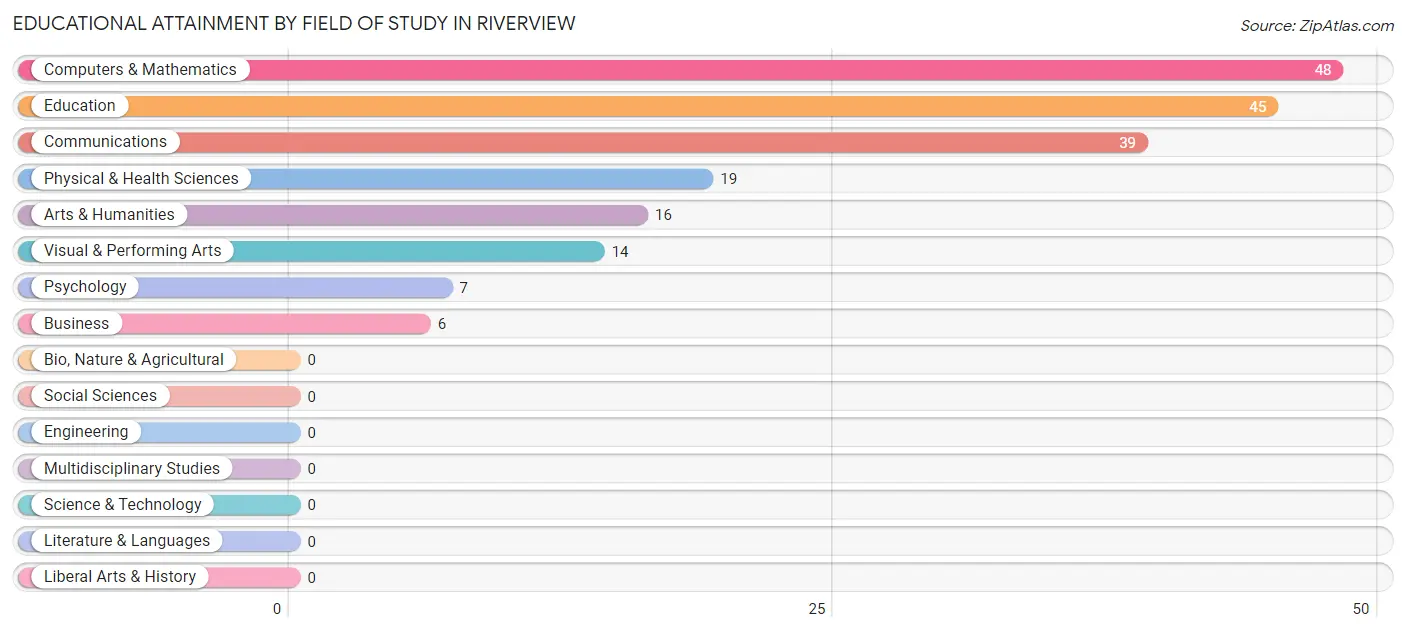
| Field of Study | # Graduates | % Graduates |
| Computers & Mathematics | 48 | 24.7% |
| Bio, Nature & Agricultural | 0 | 0.0% |
| Physical & Health Sciences | 19 | 9.8% |
| Psychology | 7 | 3.6% |
| Social Sciences | 0 | 0.0% |
| Engineering | 0 | 0.0% |
| Multidisciplinary Studies | 0 | 0.0% |
| Science & Technology | 0 | 0.0% |
| Business | 6 | 3.1% |
| Education | 45 | 23.2% |
| Literature & Languages | 0 | 0.0% |
| Liberal Arts & History | 0 | 0.0% |
| Visual & Performing Arts | 14 | 7.2% |
| Communications | 39 | 20.1% |
| Arts & Humanities | 16 | 8.3% |
| Total | 194 | 100.0% |
Transportation & Commute in Riverview
Vehicle Availability by Sex in Riverview
The most prevalent vehicle ownership categories in Riverview are males with 3 vehicles (153, accounting for 34.8%) and females with 3 vehicles (59, making up 15.9%).
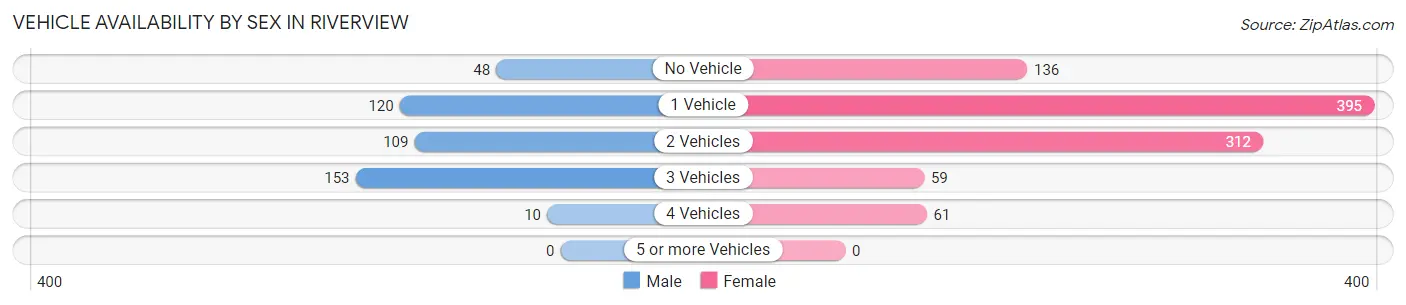
| Vehicles Available | Male | Female |
| No Vehicle | 48 (10.9%) | 136 (14.1%) |
| 1 Vehicle | 120 (27.3%) | 395 (41.0%) |
| 2 Vehicles | 109 (24.8%) | 312 (32.4%) |
| 3 Vehicles | 153 (34.8%) | 59 (6.1%) |
| 4 Vehicles | 10 (2.3%) | 61 (6.3%) |
| 5 or more Vehicles | 0 (0.0%) | 0 (0.0%) |
| Total | 440 (100.0%) | 963 (100.0%) |
Commute Time in Riverview
The most frequently occuring commute durations in Riverview are 10 to 14 minutes (323 commuters, 25.2%), 15 to 19 minutes (261 commuters, 20.4%), and 20 to 24 minutes (215 commuters, 16.8%).
| Commute Time | # Commuters | % Commuters |
| Less than 5 Minutes | 0 | 0.0% |
| 5 to 9 Minutes | 92 | 7.2% |
| 10 to 14 Minutes | 323 | 25.2% |
| 15 to 19 Minutes | 261 | 20.4% |
| 20 to 24 Minutes | 215 | 16.8% |
| 25 to 29 Minutes | 118 | 9.2% |
| 30 to 34 Minutes | 128 | 10.0% |
| 35 to 39 Minutes | 8 | 0.6% |
| 40 to 44 Minutes | 30 | 2.3% |
| 45 to 59 Minutes | 17 | 1.3% |
| 60 to 89 Minutes | 56 | 4.4% |
| 90 or more Minutes | 32 | 2.5% |
Commute Time by Sex in Riverview
The most common commute times in Riverview are 20 to 24 minutes (105 commuters, 25.6%) for males and 10 to 14 minutes (241 commuters, 27.7%) for females.
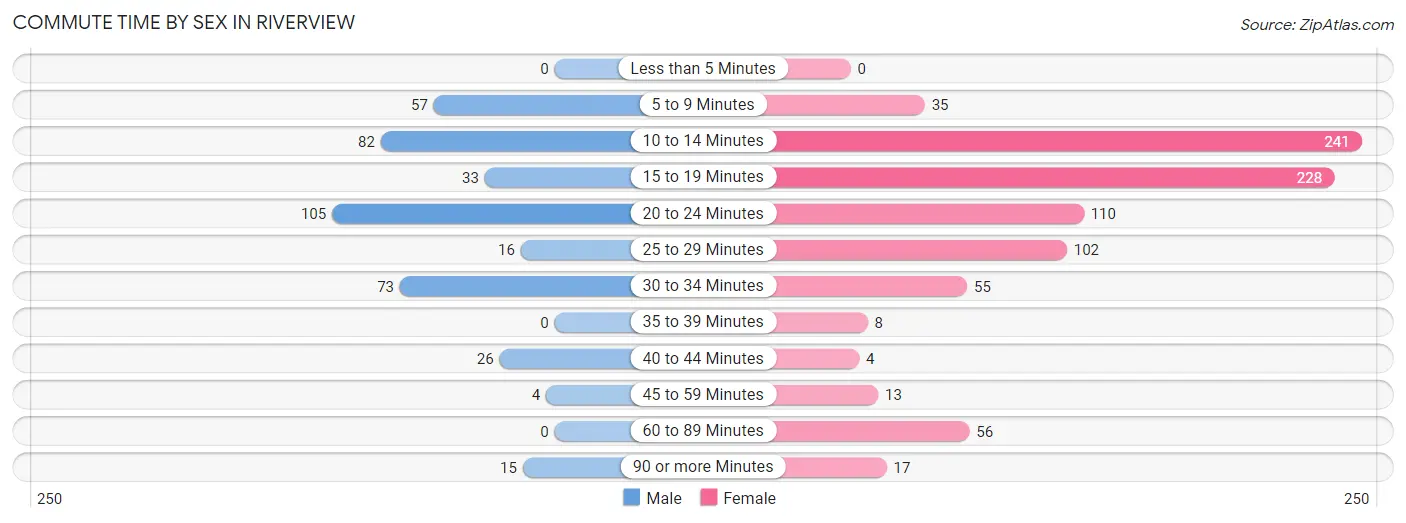
| Commute Time | Male | Female |
| Less than 5 Minutes | 0 (0.0%) | 0 (0.0%) |
| 5 to 9 Minutes | 57 (13.9%) | 35 (4.0%) |
| 10 to 14 Minutes | 82 (20.0%) | 241 (27.7%) |
| 15 to 19 Minutes | 33 (8.0%) | 228 (26.2%) |
| 20 to 24 Minutes | 105 (25.6%) | 110 (12.7%) |
| 25 to 29 Minutes | 16 (3.9%) | 102 (11.7%) |
| 30 to 34 Minutes | 73 (17.8%) | 55 (6.3%) |
| 35 to 39 Minutes | 0 (0.0%) | 8 (0.9%) |
| 40 to 44 Minutes | 26 (6.3%) | 4 (0.5%) |
| 45 to 59 Minutes | 4 (1.0%) | 13 (1.5%) |
| 60 to 89 Minutes | 0 (0.0%) | 56 (6.4%) |
| 90 or more Minutes | 15 (3.6%) | 17 (2.0%) |
Time of Departure to Work by Sex in Riverview
The most frequent times of departure to work in Riverview are 12:00 PM to 3:59 PM (122, 29.7%) for males and 7:00 AM to 7:29 AM (209, 24.0%) for females.
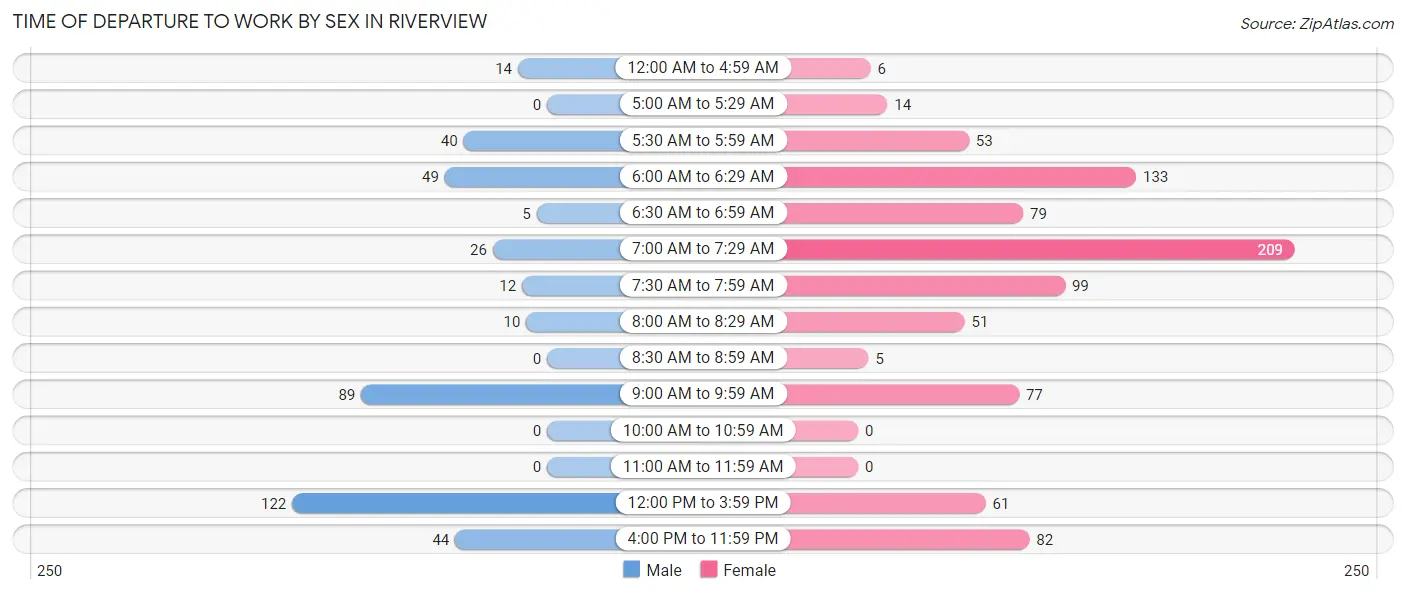
| Time of Departure | Male | Female |
| 12:00 AM to 4:59 AM | 14 (3.4%) | 6 (0.7%) |
| 5:00 AM to 5:29 AM | 0 (0.0%) | 14 (1.6%) |
| 5:30 AM to 5:59 AM | 40 (9.7%) | 53 (6.1%) |
| 6:00 AM to 6:29 AM | 49 (11.9%) | 133 (15.3%) |
| 6:30 AM to 6:59 AM | 5 (1.2%) | 79 (9.1%) |
| 7:00 AM to 7:29 AM | 26 (6.3%) | 209 (24.0%) |
| 7:30 AM to 7:59 AM | 12 (2.9%) | 99 (11.4%) |
| 8:00 AM to 8:29 AM | 10 (2.4%) | 51 (5.9%) |
| 8:30 AM to 8:59 AM | 0 (0.0%) | 5 (0.6%) |
| 9:00 AM to 9:59 AM | 89 (21.6%) | 77 (8.9%) |
| 10:00 AM to 10:59 AM | 0 (0.0%) | 0 (0.0%) |
| 11:00 AM to 11:59 AM | 0 (0.0%) | 0 (0.0%) |
| 12:00 PM to 3:59 PM | 122 (29.7%) | 61 (7.0%) |
| 4:00 PM to 11:59 PM | 44 (10.7%) | 82 (9.4%) |
| Total | 411 (100.0%) | 869 (100.0%) |
Housing Occupancy in Riverview
Occupancy by Ownership in Riverview
Of the total 1,315 dwellings in Riverview, owner-occupied units account for 523 (39.8%), while renter-occupied units make up 792 (60.2%).
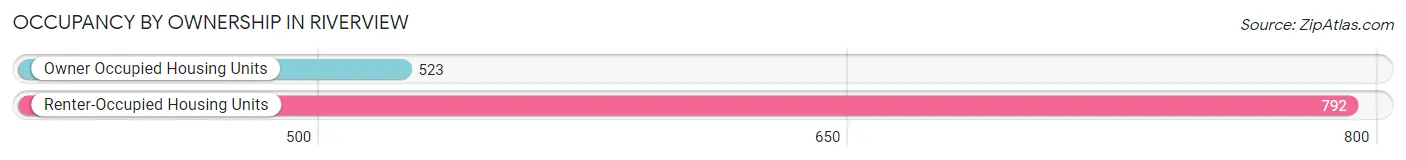
| Occupancy | # Housing Units | % Housing Units |
| Owner Occupied Housing Units | 523 | 39.8% |
| Renter-Occupied Housing Units | 792 | 60.2% |
| Total Occupied Housing Units | 1,315 | 100.0% |
Occupancy by Household Size in Riverview
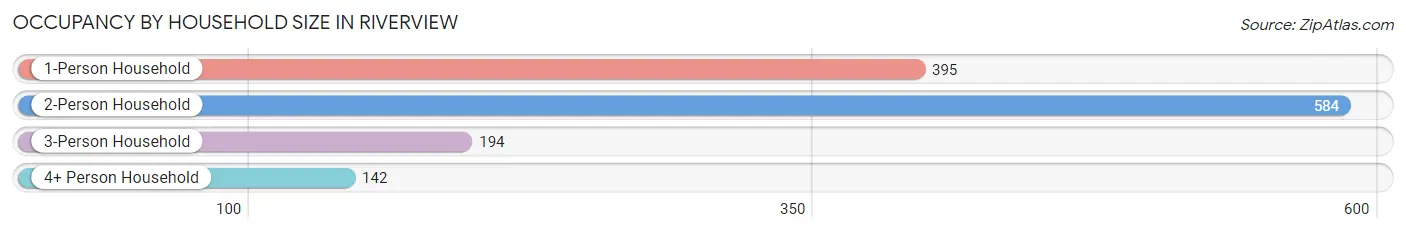
| Household Size | # Housing Units | % Housing Units |
| 1-Person Household | 395 | 30.0% |
| 2-Person Household | 584 | 44.4% |
| 3-Person Household | 194 | 14.7% |
| 4+ Person Household | 142 | 10.8% |
| Total Housing Units | 1,315 | 100.0% |
Occupancy by Ownership by Household Size in Riverview
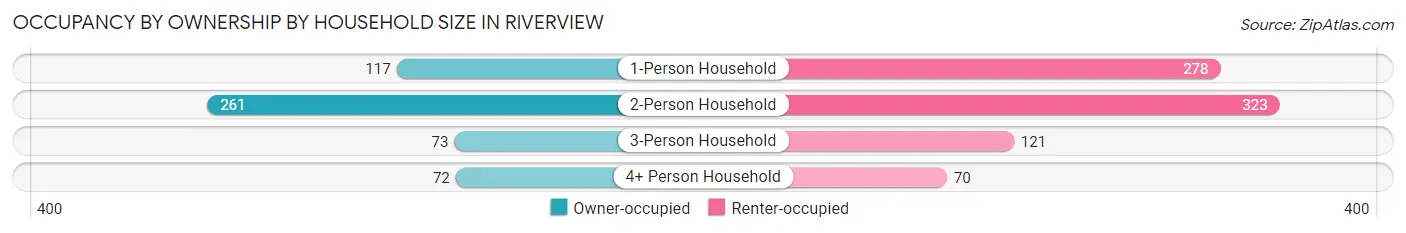
| Household Size | Owner-occupied | Renter-occupied |
| 1-Person Household | 117 (29.6%) | 278 (70.4%) |
| 2-Person Household | 261 (44.7%) | 323 (55.3%) |
| 3-Person Household | 73 (37.6%) | 121 (62.4%) |
| 4+ Person Household | 72 (50.7%) | 70 (49.3%) |
| Total Housing Units | 523 (39.8%) | 792 (60.2%) |
Occupancy by Educational Attainment in Riverview
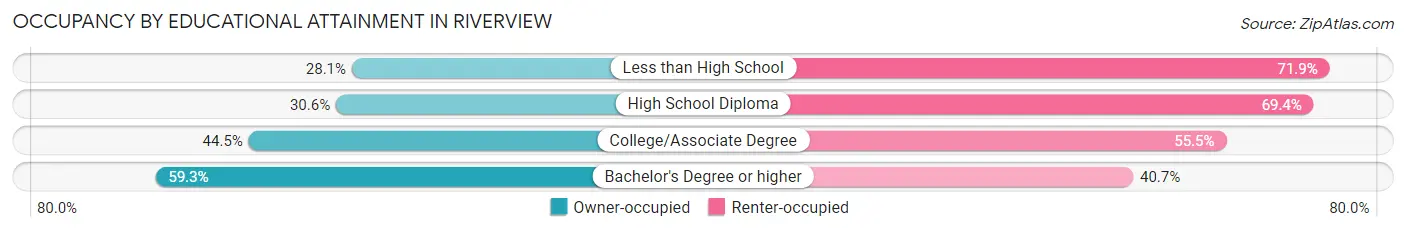
| Household Size | Owner-occupied | Renter-occupied |
| Less than High School | 50 (28.1%) | 128 (71.9%) |
| High School Diploma | 116 (30.6%) | 263 (69.4%) |
| College/Associate Degree | 277 (44.5%) | 346 (55.5%) |
| Bachelor's Degree or higher | 80 (59.3%) | 55 (40.7%) |
Occupancy by Age of Householder in Riverview
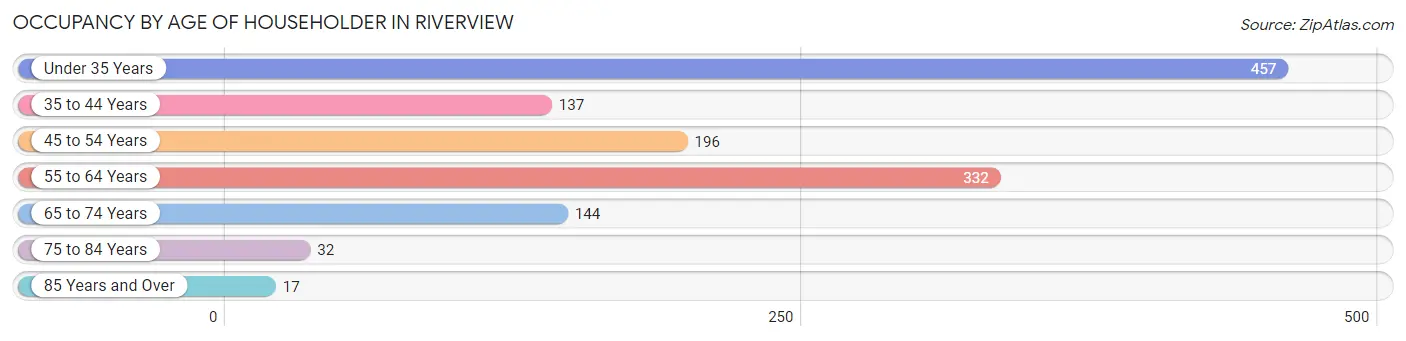
| Age Bracket | # Households | % Households |
| Under 35 Years | 457 | 34.7% |
| 35 to 44 Years | 137 | 10.4% |
| 45 to 54 Years | 196 | 14.9% |
| 55 to 64 Years | 332 | 25.3% |
| 65 to 74 Years | 144 | 11.0% |
| 75 to 84 Years | 32 | 2.4% |
| 85 Years and Over | 17 | 1.3% |
| Total | 1,315 | 100.0% |
Housing Finances in Riverview
Median Income by Occupancy in Riverview
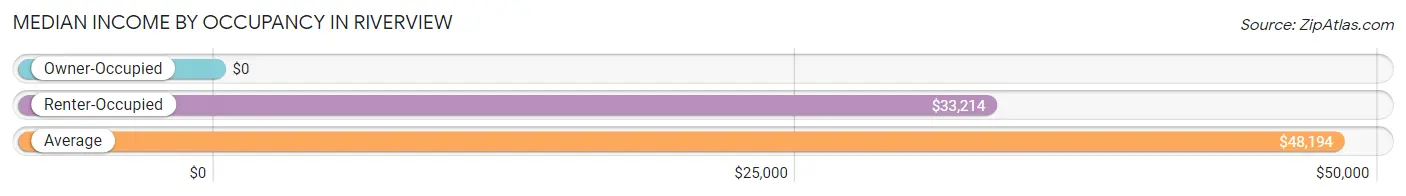
| Occupancy Type | # Households | Median Income |
| Owner-Occupied | 523 (39.8%) | $0 |
| Renter-Occupied | 792 (60.2%) | $33,214 |
| Average | 1,315 (100.0%) | $48,194 |
Occupancy by Householder Income Bracket in Riverview
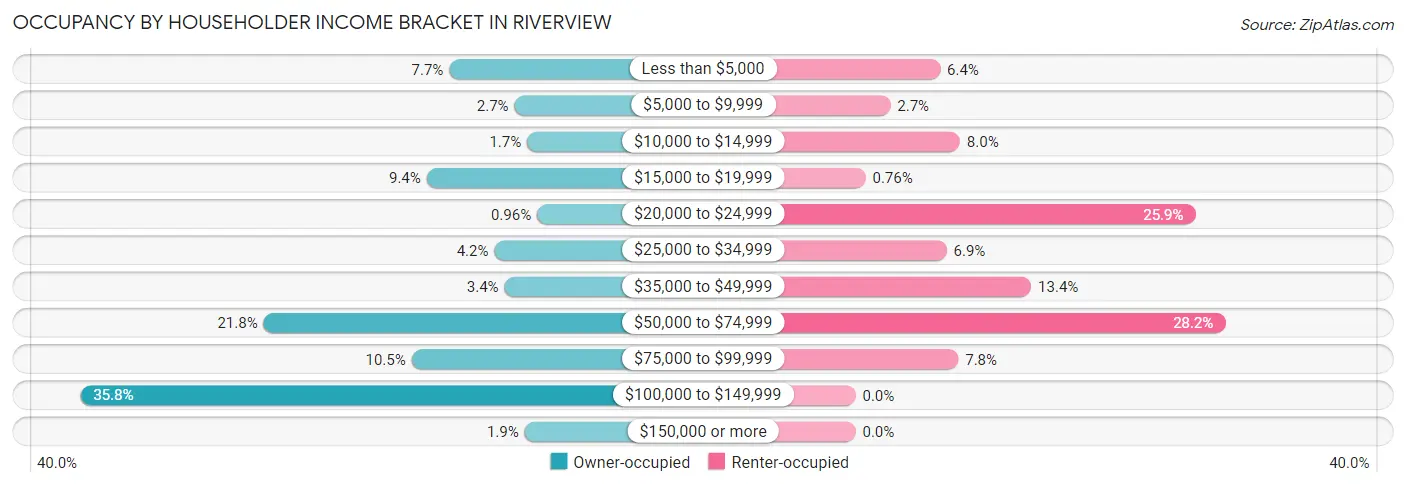
| Income Bracket | Owner-occupied | Renter-occupied |
| Less than $5,000 | 40 (7.6%) | 51 (6.4%) |
| $5,000 to $9,999 | 14 (2.7%) | 21 (2.6%) |
| $10,000 to $14,999 | 9 (1.7%) | 63 (8.0%) |
| $15,000 to $19,999 | 49 (9.4%) | 6 (0.8%) |
| $20,000 to $24,999 | 5 (1.0%) | 205 (25.9%) |
| $25,000 to $34,999 | 22 (4.2%) | 55 (6.9%) |
| $35,000 to $49,999 | 18 (3.4%) | 106 (13.4%) |
| $50,000 to $74,999 | 114 (21.8%) | 223 (28.2%) |
| $75,000 to $99,999 | 55 (10.5%) | 62 (7.8%) |
| $100,000 to $149,999 | 187 (35.8%) | 0 (0.0%) |
| $150,000 or more | 10 (1.9%) | 0 (0.0%) |
| Total | 523 (100.0%) | 792 (100.0%) |
Monthly Housing Cost Tiers in Riverview
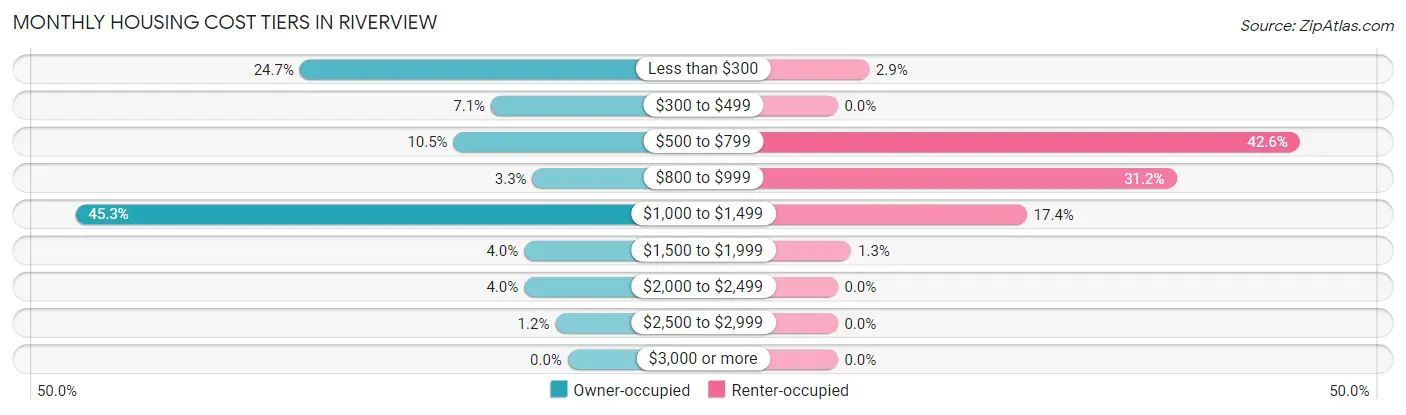
| Monthly Cost | Owner-occupied | Renter-occupied |
| Less than $300 | 129 (24.7%) | 23 (2.9%) |
| $300 to $499 | 37 (7.1%) | 0 (0.0%) |
| $500 to $799 | 55 (10.5%) | 337 (42.5%) |
| $800 to $999 | 17 (3.3%) | 247 (31.2%) |
| $1,000 to $1,499 | 237 (45.3%) | 138 (17.4%) |
| $1,500 to $1,999 | 21 (4.0%) | 10 (1.3%) |
| $2,000 to $2,499 | 21 (4.0%) | 0 (0.0%) |
| $2,500 to $2,999 | 6 (1.1%) | 0 (0.0%) |
| $3,000 or more | 0 (0.0%) | 0 (0.0%) |
| Total | 523 (100.0%) | 792 (100.0%) |
Physical Housing Characteristics in Riverview
Housing Structures in Riverview
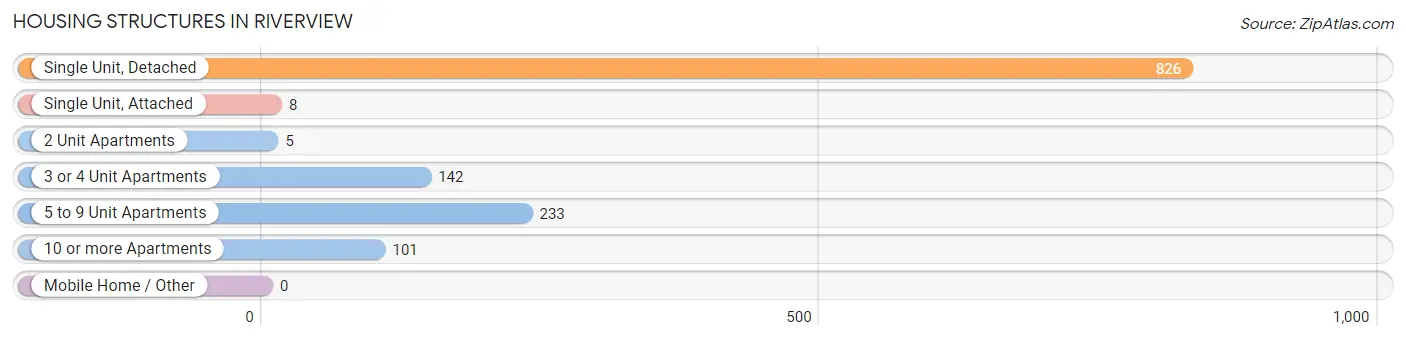
| Structure Type | # Housing Units | % Housing Units |
| Single Unit, Detached | 826 | 62.8% |
| Single Unit, Attached | 8 | 0.6% |
| 2 Unit Apartments | 5 | 0.4% |
| 3 or 4 Unit Apartments | 142 | 10.8% |
| 5 to 9 Unit Apartments | 233 | 17.7% |
| 10 or more Apartments | 101 | 7.7% |
| Mobile Home / Other | 0 | 0.0% |
| Total | 1,315 | 100.0% |
Housing Structures by Occupancy in Riverview

| Structure Type | Owner-occupied | Renter-occupied |
| Single Unit, Detached | 511 (61.9%) | 315 (38.1%) |
| Single Unit, Attached | 0 (0.0%) | 8 (100.0%) |
| 2 Unit Apartments | 5 (100.0%) | 0 (0.0%) |
| 3 or 4 Unit Apartments | 7 (4.9%) | 135 (95.1%) |
| 5 to 9 Unit Apartments | 0 (0.0%) | 233 (100.0%) |
| 10 or more Apartments | 0 (0.0%) | 101 (100.0%) |
| Mobile Home / Other | 0 (0.0%) | 0 (0.0%) |
| Total | 523 (39.8%) | 792 (60.2%) |
Housing Structures by Number of Rooms in Riverview
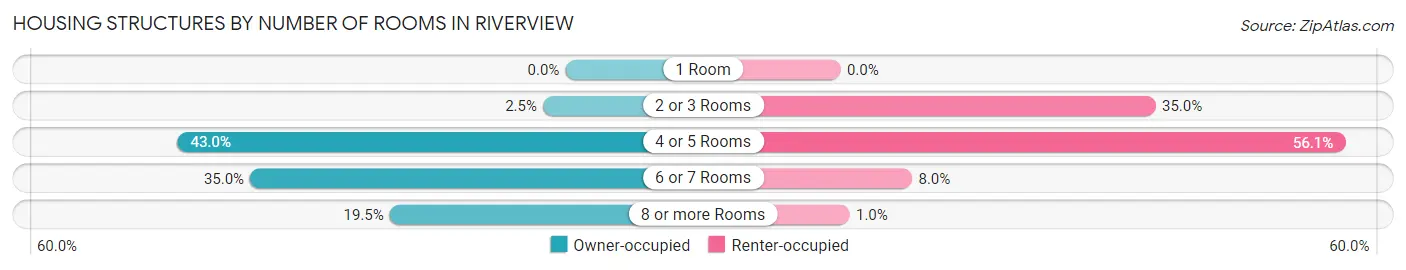
| Number of Rooms | Owner-occupied | Renter-occupied |
| 1 Room | 0 (0.0%) | 0 (0.0%) |
| 2 or 3 Rooms | 13 (2.5%) | 277 (35.0%) |
| 4 or 5 Rooms | 225 (43.0%) | 444 (56.1%) |
| 6 or 7 Rooms | 183 (35.0%) | 63 (8.0%) |
| 8 or more Rooms | 102 (19.5%) | 8 (1.0%) |
| Total | 523 (100.0%) | 792 (100.0%) |
Housing Structure by Heating Type in Riverview
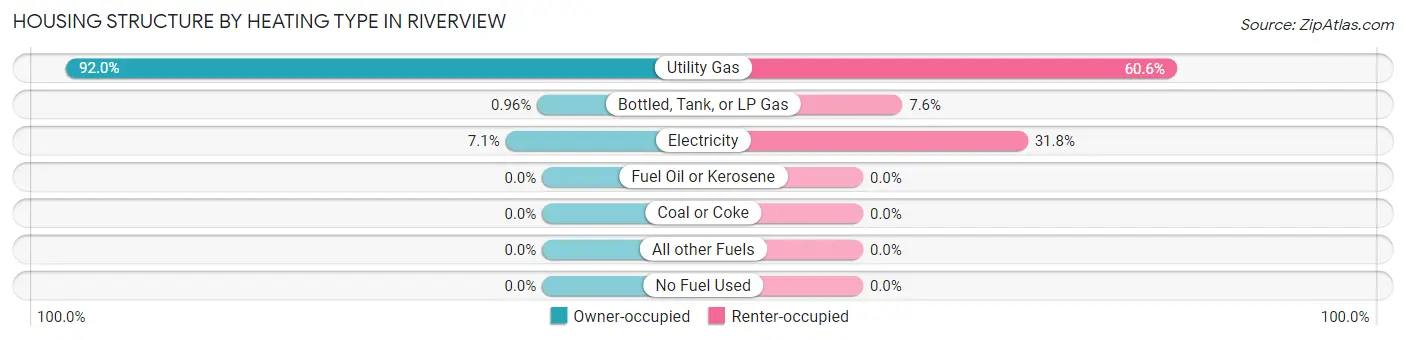
| Heating Type | Owner-occupied | Renter-occupied |
| Utility Gas | 481 (92.0%) | 480 (60.6%) |
| Bottled, Tank, or LP Gas | 5 (1.0%) | 60 (7.6%) |
| Electricity | 37 (7.1%) | 252 (31.8%) |
| Fuel Oil or Kerosene | 0 (0.0%) | 0 (0.0%) |
| Coal or Coke | 0 (0.0%) | 0 (0.0%) |
| All other Fuels | 0 (0.0%) | 0 (0.0%) |
| No Fuel Used | 0 (0.0%) | 0 (0.0%) |
| Total | 523 (100.0%) | 792 (100.0%) |
Household Vehicle Usage in Riverview
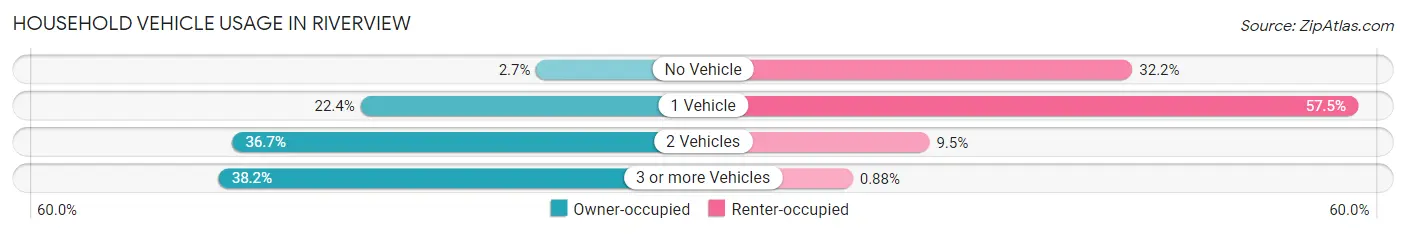
| Vehicles per Household | Owner-occupied | Renter-occupied |
| No Vehicle | 14 (2.7%) | 255 (32.2%) |
| 1 Vehicle | 117 (22.4%) | 455 (57.5%) |
| 2 Vehicles | 192 (36.7%) | 75 (9.5%) |
| 3 or more Vehicles | 200 (38.2%) | 7 (0.9%) |
| Total | 523 (100.0%) | 792 (100.0%) |
Real Estate & Mortgages in Riverview
Real Estate and Mortgage Overview in Riverview
| Characteristic | Without Mortgage | With Mortgage |
| Housing Units | 195 | 328 |
| Median Property Value | $39,100 | $67,100 |
| Median Household Income | $44,250 | $10 |
| Monthly Housing Costs | $287 | $0 |
| Real Estate Taxes | $887 | $0 |
Property Value by Mortgage Status in Riverview
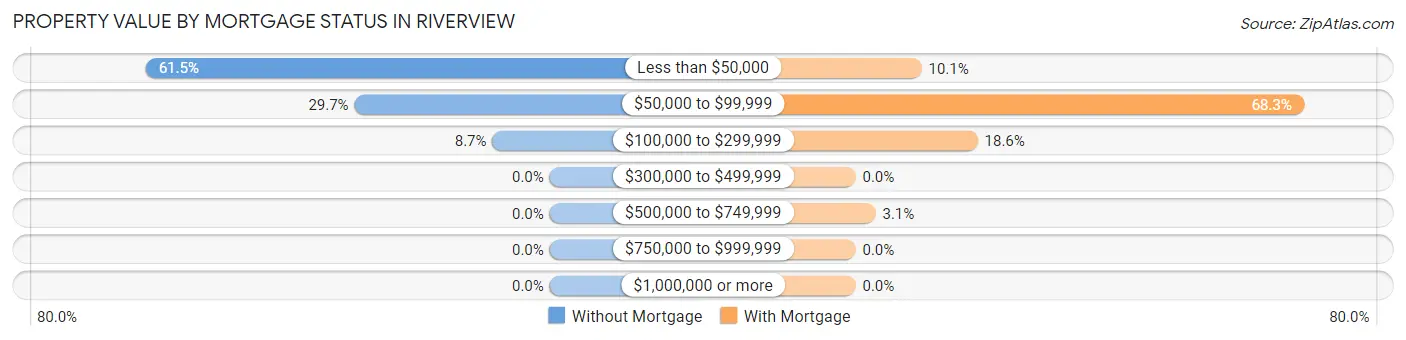
| Property Value | Without Mortgage | With Mortgage |
| Less than $50,000 | 120 (61.5%) | 33 (10.1%) |
| $50,000 to $99,999 | 58 (29.7%) | 224 (68.3%) |
| $100,000 to $299,999 | 17 (8.7%) | 61 (18.6%) |
| $300,000 to $499,999 | 0 (0.0%) | 0 (0.0%) |
| $500,000 to $749,999 | 0 (0.0%) | 10 (3.0%) |
| $750,000 to $999,999 | 0 (0.0%) | 0 (0.0%) |
| $1,000,000 or more | 0 (0.0%) | 0 (0.0%) |
| Total | 195 (100.0%) | 328 (100.0%) |
Household Income by Mortgage Status in Riverview
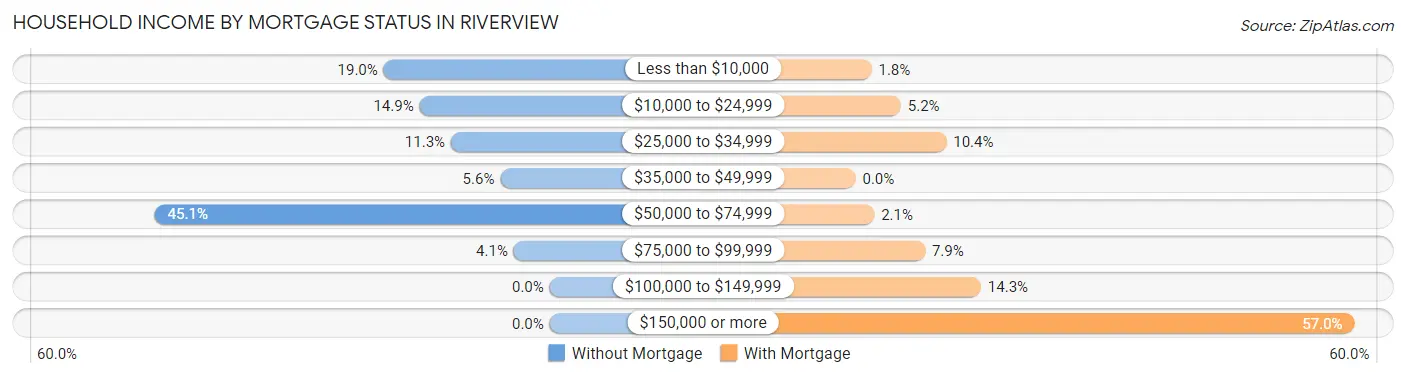
| Household Income | Without Mortgage | With Mortgage |
| Less than $10,000 | 37 (19.0%) | 6 (1.8%) |
| $10,000 to $24,999 | 29 (14.9%) | 17 (5.2%) |
| $25,000 to $34,999 | 22 (11.3%) | 34 (10.4%) |
| $35,000 to $49,999 | 11 (5.6%) | 0 (0.0%) |
| $50,000 to $74,999 | 88 (45.1%) | 7 (2.1%) |
| $75,000 to $99,999 | 8 (4.1%) | 26 (7.9%) |
| $100,000 to $149,999 | 0 (0.0%) | 47 (14.3%) |
| $150,000 or more | 0 (0.0%) | 187 (57.0%) |
| Total | 195 (100.0%) | 328 (100.0%) |
Property Value to Household Income Ratio in Riverview
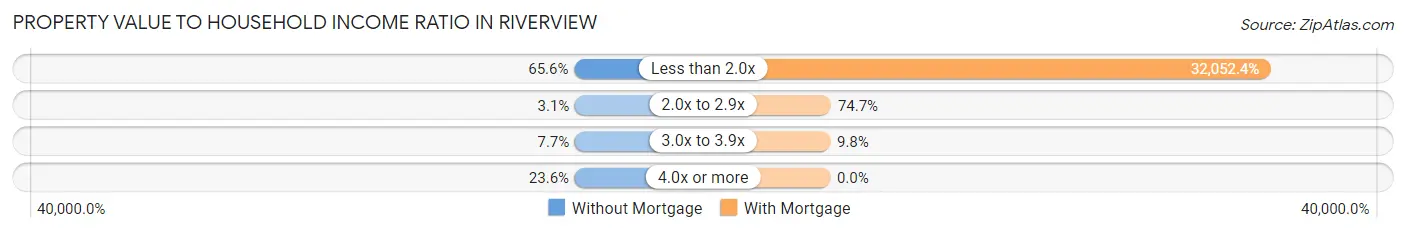
| Value-to-Income Ratio | Without Mortgage | With Mortgage |
| Less than 2.0x | 128 (65.6%) | 105,132 (32,052.4%) |
| 2.0x to 2.9x | 6 (3.1%) | 245 (74.7%) |
| 3.0x to 3.9x | 15 (7.7%) | 32 (9.8%) |
| 4.0x or more | 46 (23.6%) | 0 (0.0%) |
| Total | 195 (100.0%) | 328 (100.0%) |
Real Estate Taxes by Mortgage Status in Riverview
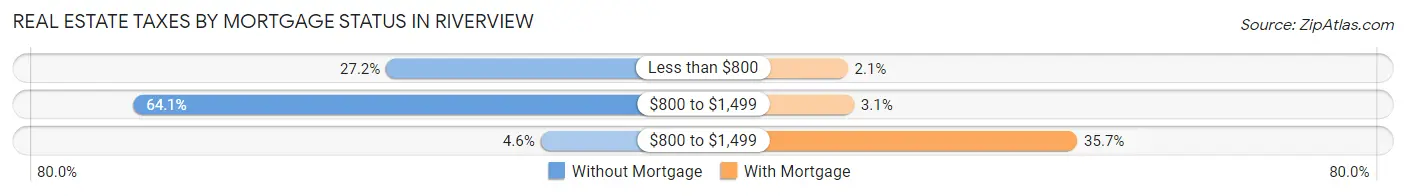
| Property Taxes | Without Mortgage | With Mortgage |
| Less than $800 | 53 (27.2%) | 7 (2.1%) |
| $800 to $1,499 | 125 (64.1%) | 10 (3.0%) |
| $800 to $1,499 | 9 (4.6%) | 117 (35.7%) |
| Total | 195 (100.0%) | 328 (100.0%) |
Health & Disability in Riverview
Health Insurance Coverage by Age in Riverview
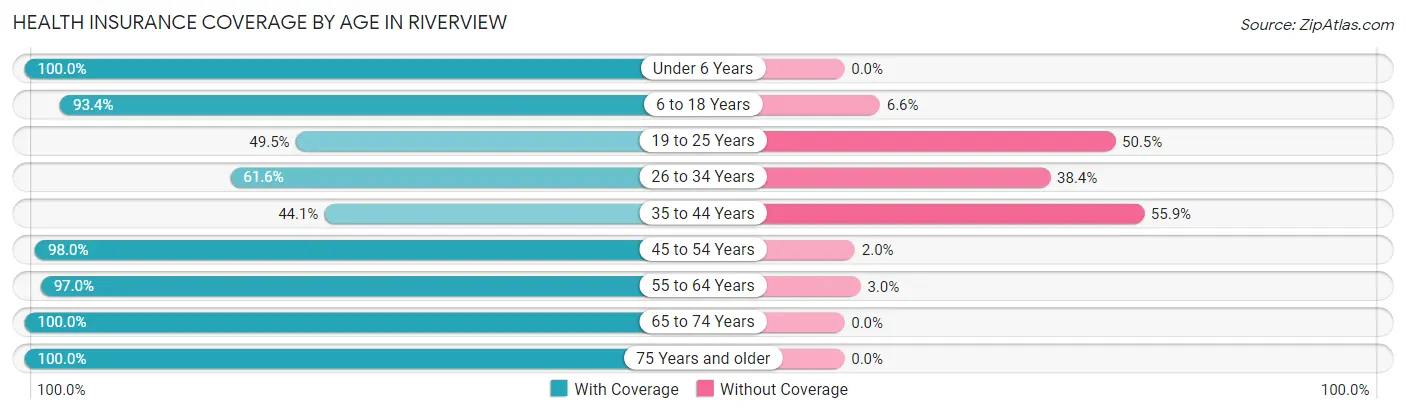
| Age Bracket | With Coverage | Without Coverage |
| Under 6 Years | 248 (100.0%) | 0 (0.0%) |
| 6 to 18 Years | 381 (93.4%) | 27 (6.6%) |
| 19 to 25 Years | 249 (49.5%) | 254 (50.5%) |
| 26 to 34 Years | 220 (61.6%) | 137 (38.4%) |
| 35 to 44 Years | 124 (44.1%) | 157 (55.9%) |
| 45 to 54 Years | 300 (98.0%) | 6 (2.0%) |
| 55 to 64 Years | 547 (97.0%) | 17 (3.0%) |
| 65 to 74 Years | 170 (100.0%) | 0 (0.0%) |
| 75 Years and older | 73 (100.0%) | 0 (0.0%) |
| Total | 2,312 (79.4%) | 598 (20.5%) |
Health Insurance Coverage by Citizenship Status in Riverview
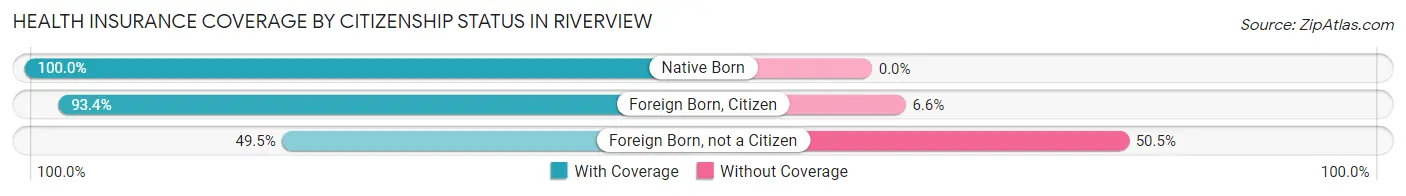
| Citizenship Status | With Coverage | Without Coverage |
| Native Born | 248 (100.0%) | 0 (0.0%) |
| Foreign Born, Citizen | 381 (93.4%) | 27 (6.6%) |
| Foreign Born, not a Citizen | 249 (49.5%) | 254 (50.5%) |
Health Insurance Coverage by Household Income in Riverview
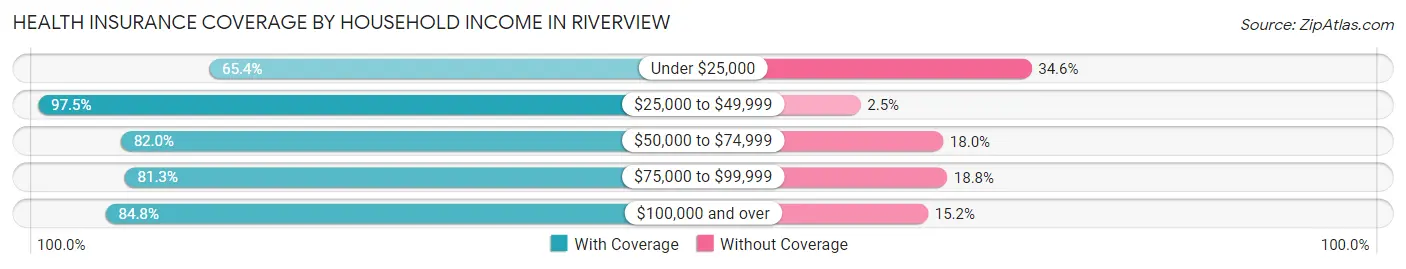
| Household Income | With Coverage | Without Coverage |
| Under $25,000 | 528 (65.4%) | 279 (34.6%) |
| $25,000 to $49,999 | 307 (97.5%) | 8 (2.5%) |
| $50,000 to $74,999 | 783 (82.0%) | 172 (18.0%) |
| $75,000 to $99,999 | 286 (81.2%) | 66 (18.8%) |
| $100,000 and over | 408 (84.8%) | 73 (15.2%) |
Public vs Private Health Insurance Coverage by Age in Riverview
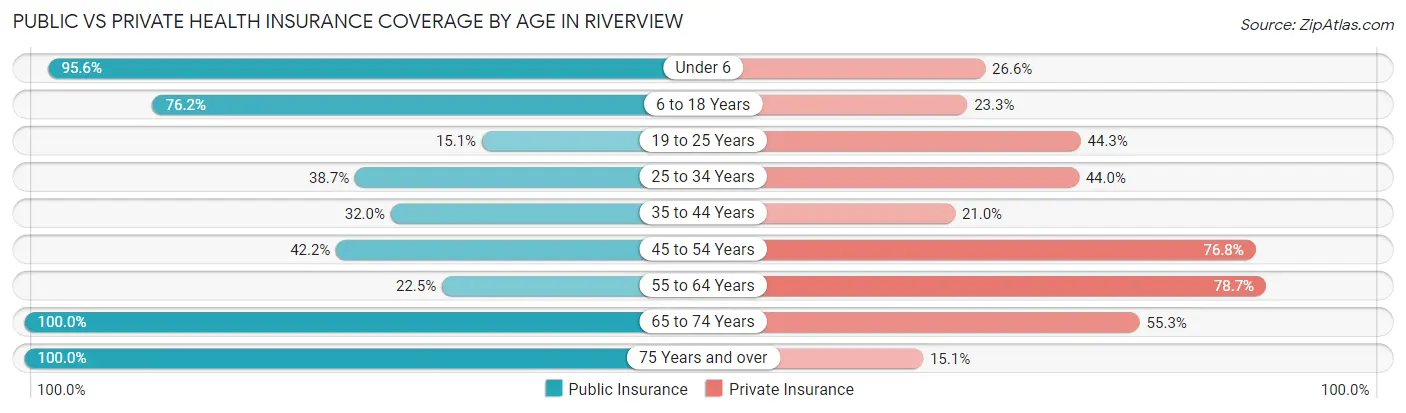
| Age Bracket | Public Insurance | Private Insurance |
| Under 6 | 237 (95.6%) | 66 (26.6%) |
| 6 to 18 Years | 311 (76.2%) | 95 (23.3%) |
| 19 to 25 Years | 76 (15.1%) | 223 (44.3%) |
| 25 to 34 Years | 138 (38.7%) | 157 (44.0%) |
| 35 to 44 Years | 90 (32.0%) | 59 (21.0%) |
| 45 to 54 Years | 129 (42.2%) | 235 (76.8%) |
| 55 to 64 Years | 127 (22.5%) | 444 (78.7%) |
| 65 to 74 Years | 170 (100.0%) | 94 (55.3%) |
| 75 Years and over | 73 (100.0%) | 11 (15.1%) |
| Total | 1,351 (46.4%) | 1,384 (47.6%) |
Disability Status by Sex by Age in Riverview
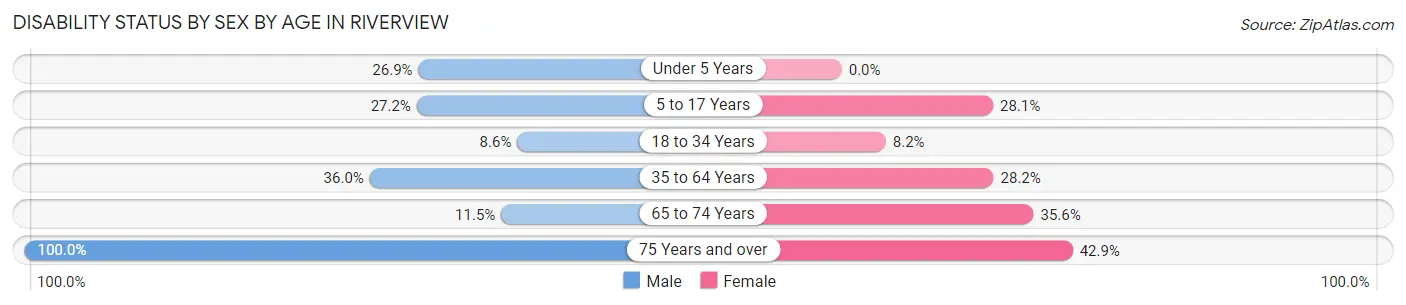
| Age Bracket | Male | Female |
| Under 5 Years | 39 (26.9%) | 0 (0.0%) |
| 5 to 17 Years | 43 (27.2%) | 64 (28.1%) |
| 18 to 34 Years | 25 (8.6%) | 49 (8.2%) |
| 35 to 64 Years | 165 (35.9%) | 195 (28.2%) |
| 65 to 74 Years | 6 (11.5%) | 42 (35.6%) |
| 75 Years and over | 24 (100.0%) | 21 (42.9%) |
Disability Class by Sex by Age in Riverview
Disability Class: Hearing Difficulty
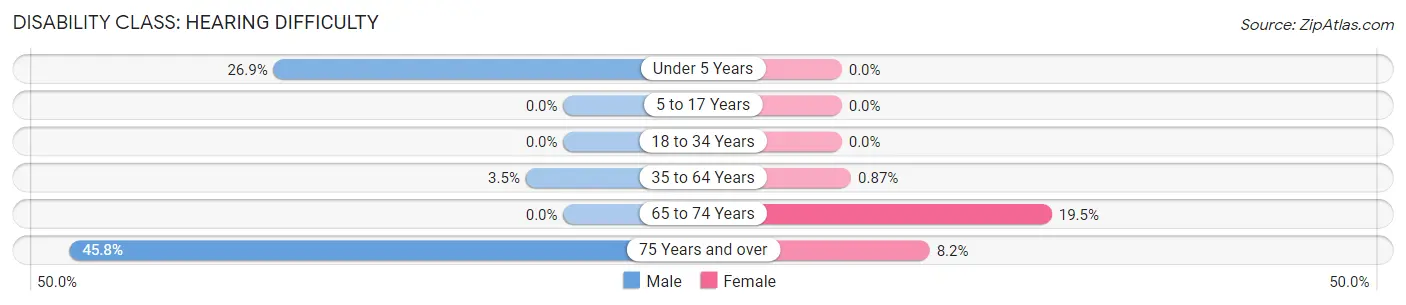
| Age Bracket | Male | Female |
| Under 5 Years | 39 (26.9%) | 0 (0.0%) |
| 5 to 17 Years | 0 (0.0%) | 0 (0.0%) |
| 18 to 34 Years | 0 (0.0%) | 0 (0.0%) |
| 35 to 64 Years | 16 (3.5%) | 6 (0.9%) |
| 65 to 74 Years | 0 (0.0%) | 23 (19.5%) |
| 75 Years and over | 11 (45.8%) | 4 (8.2%) |
Disability Class: Vision Difficulty
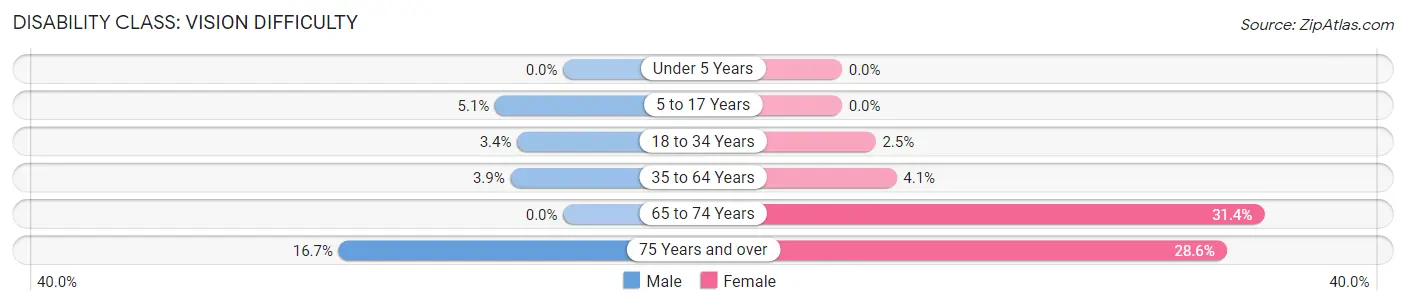
| Age Bracket | Male | Female |
| Under 5 Years | 0 (0.0%) | 0 (0.0%) |
| 5 to 17 Years | 8 (5.1%) | 0 (0.0%) |
| 18 to 34 Years | 10 (3.4%) | 15 (2.5%) |
| 35 to 64 Years | 18 (3.9%) | 28 (4.1%) |
| 65 to 74 Years | 0 (0.0%) | 37 (31.4%) |
| 75 Years and over | 4 (16.7%) | 14 (28.6%) |
Disability Class: Cognitive Difficulty
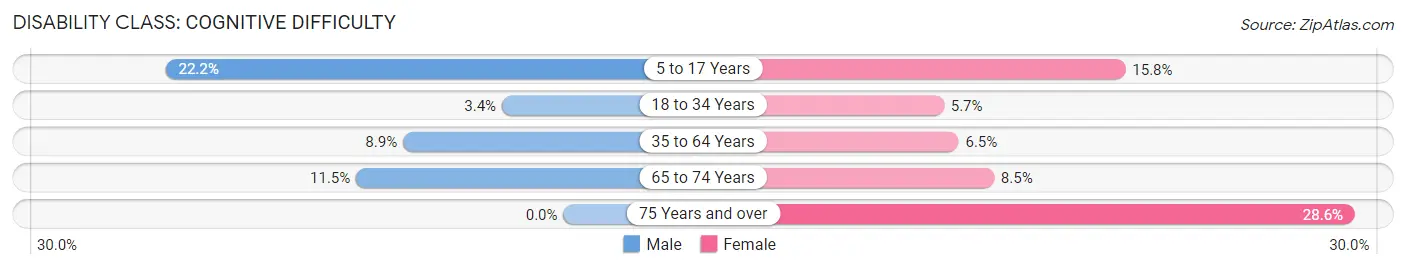
| Age Bracket | Male | Female |
| 5 to 17 Years | 35 (22.2%) | 36 (15.8%) |
| 18 to 34 Years | 10 (3.4%) | 34 (5.7%) |
| 35 to 64 Years | 41 (8.9%) | 45 (6.5%) |
| 65 to 74 Years | 6 (11.5%) | 10 (8.5%) |
| 75 Years and over | 0 (0.0%) | 14 (28.6%) |
Disability Class: Ambulatory Difficulty
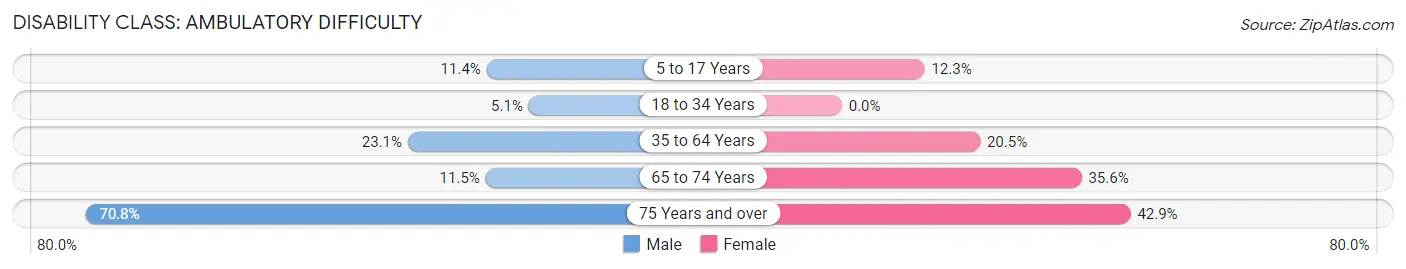
| Age Bracket | Male | Female |
| 5 to 17 Years | 18 (11.4%) | 28 (12.3%) |
| 18 to 34 Years | 15 (5.1%) | 0 (0.0%) |
| 35 to 64 Years | 106 (23.1%) | 142 (20.5%) |
| 65 to 74 Years | 6 (11.5%) | 42 (35.6%) |
| 75 Years and over | 17 (70.8%) | 21 (42.9%) |
Disability Class: Self-Care Difficulty
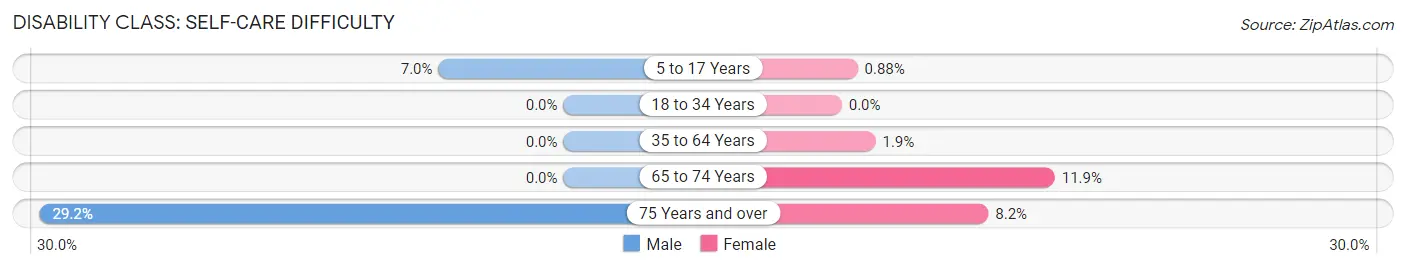
| Age Bracket | Male | Female |
| 5 to 17 Years | 11 (7.0%) | 2 (0.9%) |
| 18 to 34 Years | 0 (0.0%) | 0 (0.0%) |
| 35 to 64 Years | 0 (0.0%) | 13 (1.9%) |
| 65 to 74 Years | 0 (0.0%) | 14 (11.9%) |
| 75 Years and over | 7 (29.2%) | 4 (8.2%) |
Technology Access in Riverview
Computing Device Access in Riverview
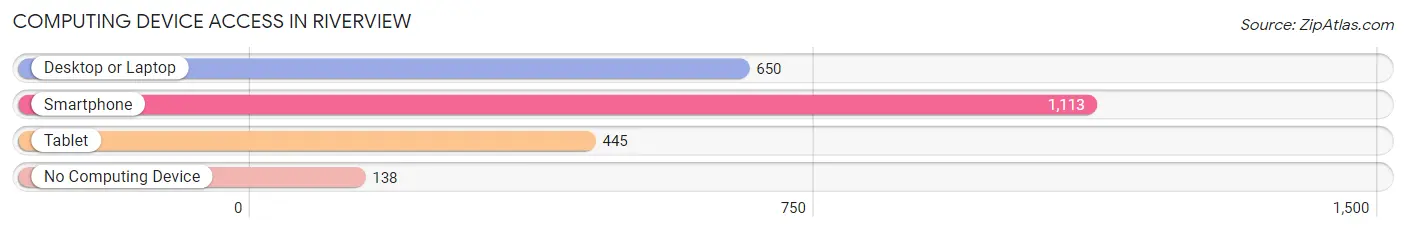
| Device Type | # Households | % Households |
| Desktop or Laptop | 650 | 49.4% |
| Smartphone | 1,113 | 84.6% |
| Tablet | 445 | 33.8% |
| No Computing Device | 138 | 10.5% |
| Total | 1,315 | 100.0% |
Internet Access in Riverview
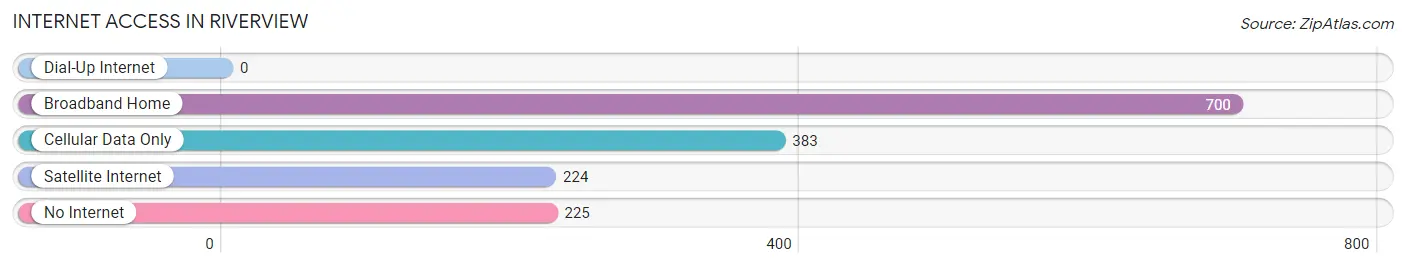
| Internet Type | # Households | % Households |
| Dial-Up Internet | 0 | 0.0% |
| Broadband Home | 700 | 53.2% |
| Cellular Data Only | 383 | 29.1% |
| Satellite Internet | 224 | 17.0% |
| No Internet | 225 | 17.1% |
| Total | 1,315 | 100.0% |
Riverview Summary
Riverview, Missouri is a small town located in St. Louis County, Missouri. It is situated on the banks of the Mississippi River, just south of St. Louis. The town was founded in 1876 and has a population of approximately 1,500 people.
History
Riverview was founded in 1876 by a group of German immigrants who had settled in the area. The town was originally called “Rheinview”, which means “view of the Rhine” in German. The name was later changed to Riverview. The town was incorporated in 1883 and was home to a variety of businesses, including a brewery, a flour mill, a sawmill, and a brickyard.
In the early 1900s, Riverview was a popular destination for tourists. The town was known for its scenic views of the Mississippi River and its many attractions, such as the Riverview Amusement Park. The park was opened in 1906 and featured a roller coaster, a carousel, and a ferris wheel. The park closed in the 1950s, but the carousel and ferris wheel are still in operation today.
Geography
Riverview is located in St. Louis County, Missouri. It is situated on the banks of the Mississippi River, just south of St. Louis. The town is bordered by the towns of St. Charles and St. Peters to the north, and by the towns of Florissant and Hazelwood to the south. The town is located in the Missouri River Valley, which is a major agricultural region.
The town has a total area of 1.2 square miles, all of which is land. The town is located at an elevation of 545 feet above sea level. The climate in Riverview is humid continental, with hot summers and cold winters.
Economy
The economy of Riverview is largely based on agriculture. The town is home to several farms, which produce a variety of crops, including corn, soybeans, and wheat. The town is also home to several small businesses, including restaurants, retail stores, and auto repair shops.
Demographics
As of the 2010 census, the population of Riverview was 1,500. The racial makeup of the town was 95.3% White, 1.3% African American, 0.7% Native American, 0.3% Asian, 0.3% from other races, and 2.3% from two or more races. Hispanic or Latino of any race were 1.3% of the population.
The median income for a household in Riverview was $45,000, and the median income for a family was $50,000. The per capita income for the town was $20,000. About 8.3% of families and 10.3% of the population were below the poverty line, including 14.3% of those under age 18 and 6.7% of those age 65 or over.
Common Questions
What is Per Capita Income in Riverview?
Per Capita income in Riverview is $22,395.
What is the Median Family Income in Riverview?
Median Family Income in Riverview is $54,904.
What is the Median Household income in Riverview?
Median Household Income in Riverview is $48,194.
What is Income or Wage Gap in Riverview?
Income or Wage Gap in Riverview is 40.3%.
Women in Riverview earn 59.7 cents for every dollar earned by a man.
What is Inequality or Gini Index in Riverview?
Inequality or Gini Index in Riverview is 0.40.
What is the Total Population of Riverview?
Total Population of Riverview is 2,912.
What is the Total Male Population of Riverview?
Total Male Population of Riverview is 1,132.
What is the Total Female Population of Riverview?
Total Female Population of Riverview is 1,780.
What is the Ratio of Males per 100 Females in Riverview?
There are 63.60 Males per 100 Females in Riverview.
What is the Ratio of Females per 100 Males in Riverview?
There are 157.24 Females per 100 Males in Riverview.
What is the Median Population Age in Riverview?
Median Population Age in Riverview is 33.8 Years.
What is the Average Family Size in Riverview
Average Family Size in Riverview is 3.0 People.
What is the Average Household Size in Riverview
Average Household Size in Riverview is 2.2 People.
How Large is the Labor Force in Riverview?
There are 1,520 People in the Labor Forcein in Riverview.
What is the Percentage of People in the Labor Force in Riverview?
64.0% of People are in the Labor Force in Riverview.
What is the Unemployment Rate in Riverview?
Unemployment Rate in Riverview is 7.3%.