Avilla, MO Map & Demographics
Avilla Map
Avilla Overview
$15,714
PER CAPITA INCOME
$61,250
AVG FAMILY INCOME
$55,000
AVG HOUSEHOLD INCOME
0.29
INEQUALITY / GINI INDEX
65
TOTAL POPULATION
28
MALE POPULATION
37
FEMALE POPULATION
75.68
MALES / 100 FEMALES
132.14
FEMALES / 100 MALES
33.5
MEDIAN AGE
4.0
AVG FAMILY SIZE
4.1
AVG HOUSEHOLD SIZE
30
LABOR FORCE [ PEOPLE ]
75.0%
PERCENT IN LABOR FORCE
13.3%
UNEMPLOYMENT RATE
Avilla Zip Codes
Avilla Area Codes
Income in Avilla
Income Overview in Avilla
Per Capita Income in Avilla is $15,714, while median incomes of families and households are $61,250 and $55,000 respectively.
| Characteristic | Number | Measure |
| Per Capita Income | 65 | $15,714 |
| Median Family Income | 15 | $61,250 |
| Mean Family Income | 15 | $62,367 |
| Median Household Income | 16 | $55,000 |
| Mean Household Income | 16 | $58,863 |
| Income Deficit | 15 | $0 |
| Wage / Income Gap (%) | 65 | 0.00% |
| Wage / Income Gap ($) | 65 | 100.00¢ per $1 |
| Gini / Inequality Index | 65 | 0.29 |
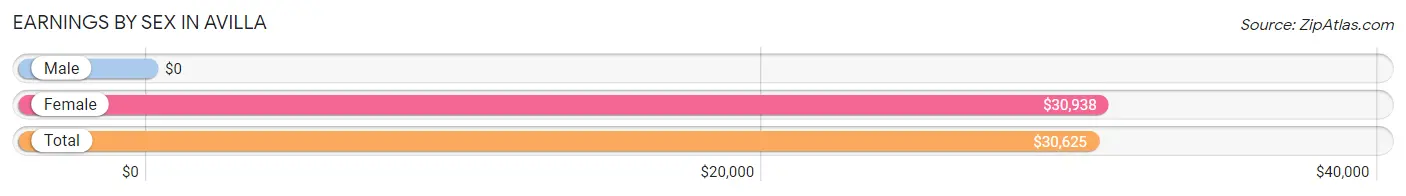
Earnings by Sex in Avilla
| Sex | Number | Average Earnings |
| Male | 17 (53.1%) | $0 |
| Female | 15 (46.9%) | $30,938 |
| Total | 32 (100.0%) | $30,625 |
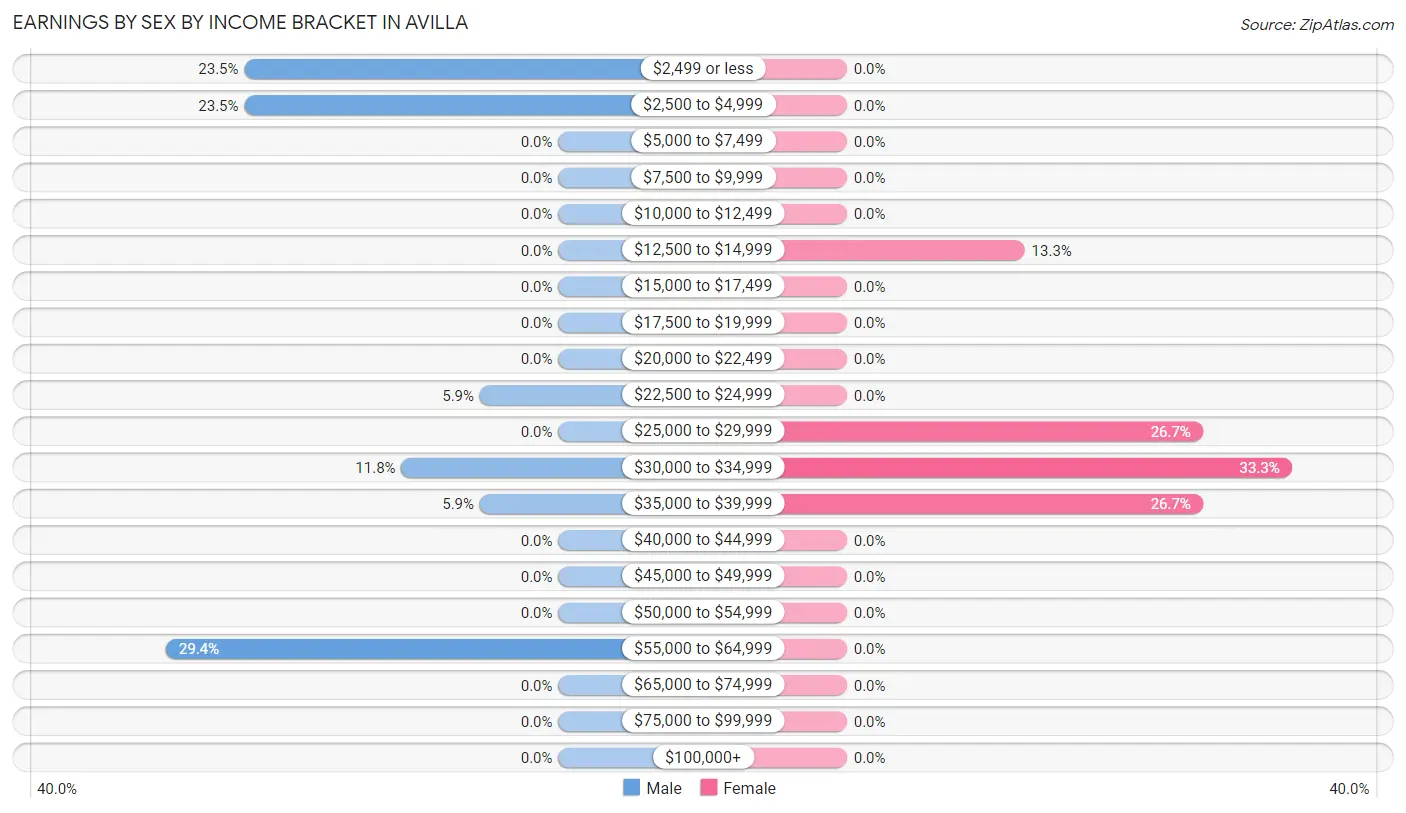
Earnings by Sex by Income Bracket in Avilla
The most common earnings brackets in Avilla are $55,000 to $64,999 for men (5 | 29.4%) and $30,000 to $34,999 for women (5 | 33.3%).
| Income | Male | Female |
| $2,499 or less | 4 (23.5%) | 0 (0.0%) |
| $2,500 to $4,999 | 4 (23.5%) | 0 (0.0%) |
| $5,000 to $7,499 | 0 (0.0%) | 0 (0.0%) |
| $7,500 to $9,999 | 0 (0.0%) | 0 (0.0%) |
| $10,000 to $12,499 | 0 (0.0%) | 0 (0.0%) |
| $12,500 to $14,999 | 0 (0.0%) | 2 (13.3%) |
| $15,000 to $17,499 | 0 (0.0%) | 0 (0.0%) |
| $17,500 to $19,999 | 0 (0.0%) | 0 (0.0%) |
| $20,000 to $22,499 | 0 (0.0%) | 0 (0.0%) |
| $22,500 to $24,999 | 1 (5.9%) | 0 (0.0%) |
| $25,000 to $29,999 | 0 (0.0%) | 4 (26.7%) |
| $30,000 to $34,999 | 2 (11.8%) | 5 (33.3%) |
| $35,000 to $39,999 | 1 (5.9%) | 4 (26.7%) |
| $40,000 to $44,999 | 0 (0.0%) | 0 (0.0%) |
| $45,000 to $49,999 | 0 (0.0%) | 0 (0.0%) |
| $50,000 to $54,999 | 0 (0.0%) | 0 (0.0%) |
| $55,000 to $64,999 | 5 (29.4%) | 0 (0.0%) |
| $65,000 to $74,999 | 0 (0.0%) | 0 (0.0%) |
| $75,000 to $99,999 | 0 (0.0%) | 0 (0.0%) |
| $100,000+ | 0 (0.0%) | 0 (0.0%) |
| Total | 17 (100.0%) | 15 (100.0%) |
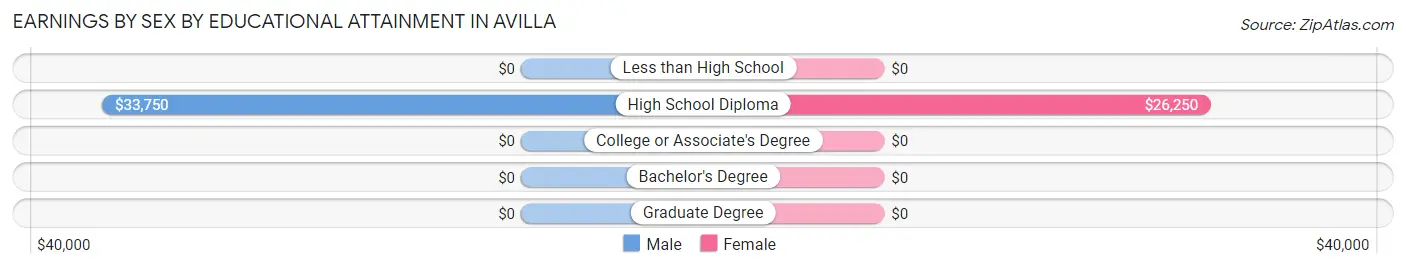
Earnings by Sex by Educational Attainment in Avilla
Average earnings in Avilla are $34,375 for men and $30,938 for women, a difference of 10.0%. Men with an educational attainment of high school diploma enjoy the highest average annual earnings of $33,750, while those with high school diploma education earn the least with $33,750. Women with an educational attainment of high school diploma earn the most with the average annual earnings of $26,250, while those with high school diploma education have the smallest earnings of $26,250.
| Educational Attainment | Male Income | Female Income |
| Less than High School | - | - |
| High School Diploma | $33,750 | $26,250 |
| College or Associate's Degree | - | - |
| Bachelor's Degree | - | - |
| Graduate Degree | - | - |
| Total | $34,375 | $30,938 |
Family Income in Avilla
Family Income Brackets in Avilla
According to the Avilla family income data, there are 6 families falling into the $75,000 to $99,999 income range, which is the most common income bracket and makes up 40.0% of all families.
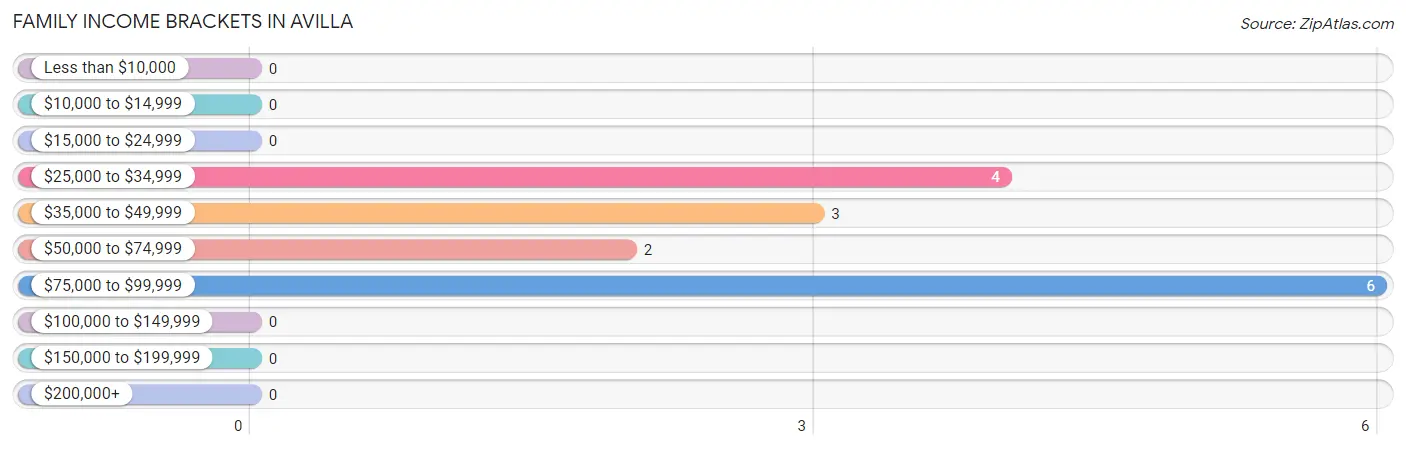
| Income Bracket | # Families | % Families |
| Less than $10,000 | 0 | 0.0% |
| $10,000 to $14,999 | 0 | 0.0% |
| $15,000 to $24,999 | 0 | 0.0% |
| $25,000 to $34,999 | 4 | 26.7% |
| $35,000 to $49,999 | 3 | 20.0% |
| $50,000 to $74,999 | 2 | 13.3% |
| $75,000 to $99,999 | 6 | 40.0% |
| $100,000 to $149,999 | 0 | 0.0% |
| $150,000 to $199,999 | 0 | 0.0% |
| $200,000+ | 0 | 0.0% |
Family Income by Famaliy Size in Avilla
5-person families (7 | 46.7%) account for the highest median family income in Avilla with $97,813 per family, while 2-person families (3 | 20.0%) have the highest median income of $24,375 per family member.
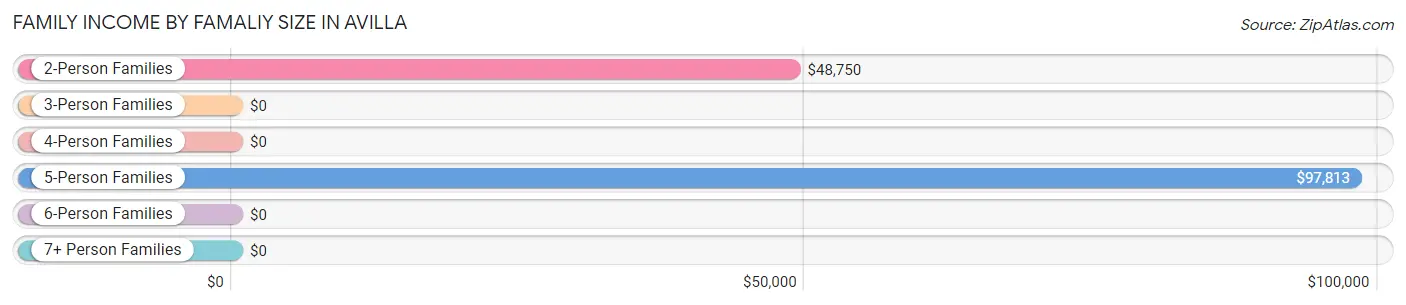
| Income Bracket | # Families | Median Income |
| 2-Person Families | 3 (20.0%) | $48,750 |
| 3-Person Families | 5 (33.3%) | $0 |
| 4-Person Families | 0 (0.0%) | $0 |
| 5-Person Families | 7 (46.7%) | $97,813 |
| 6-Person Families | 0 (0.0%) | $0 |
| 7+ Person Families | 0 (0.0%) | $0 |
| Total | 15 (100.0%) | $61,250 |
Family Income by Number of Earners in Avilla
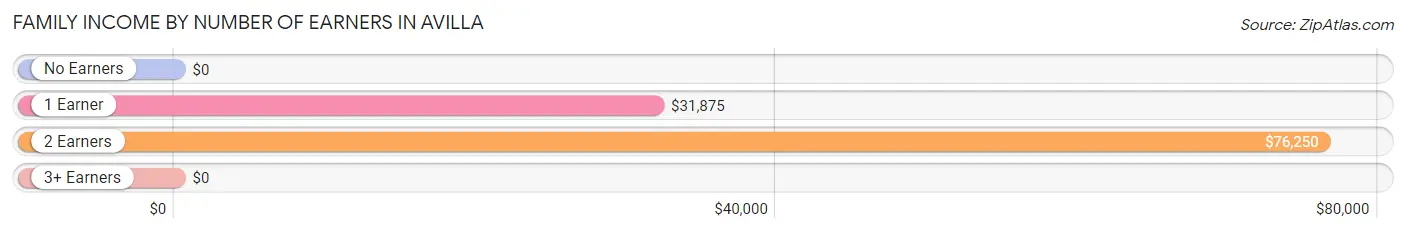
| Number of Earners | # Families | Median Income |
| No Earners | 1 (6.7%) | $0 |
| 1 Earner | 6 (40.0%) | $31,875 |
| 2 Earners | 4 (26.7%) | $76,250 |
| 3+ Earners | 4 (26.7%) | $0 |
| Total | 15 (100.0%) | $61,250 |
Household Income in Avilla
Household Income Brackets in Avilla
With 6 households falling in the category, the $75,000 to $99,999 income range is the most frequent in Avilla, accounting for 37.5% of all households.
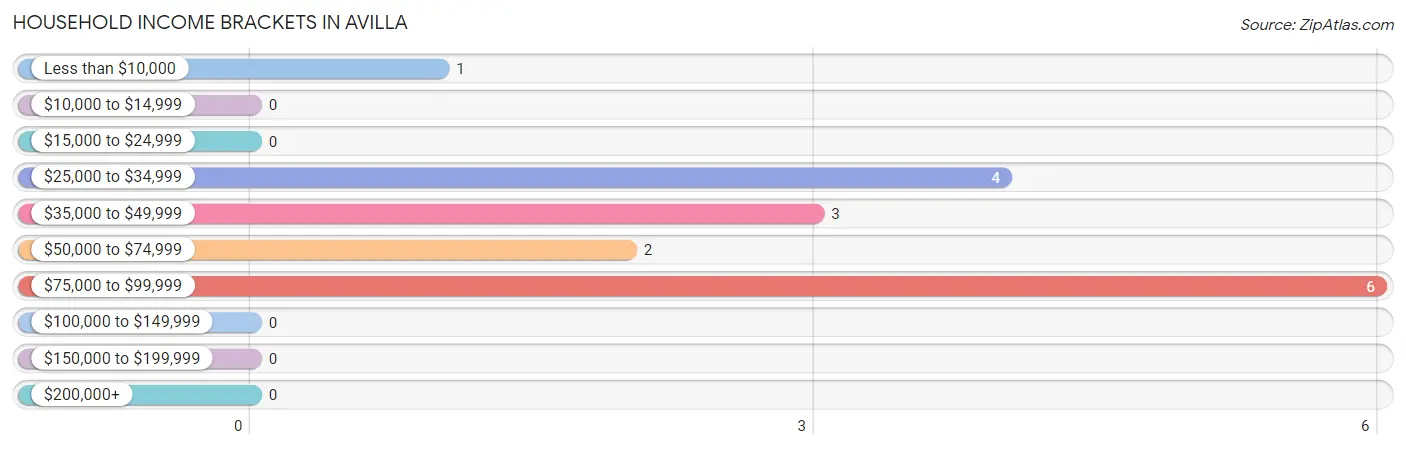
| Income Bracket | # Households | % Households |
| Less than $10,000 | 1 | 6.3% |
| $10,000 to $14,999 | 0 | 0.0% |
| $15,000 to $24,999 | 0 | 0.0% |
| $25,000 to $34,999 | 4 | 25.0% |
| $35,000 to $49,999 | 3 | 18.8% |
| $50,000 to $74,999 | 2 | 12.5% |
| $75,000 to $99,999 | 6 | 37.5% |
| $100,000 to $149,999 | 0 | 0.0% |
| $150,000 to $199,999 | 0 | 0.0% |
| $200,000+ | 0 | 0.0% |
Household Income by Householder Age in Avilla
The median household income in Avilla is $55,000, with the highest median household income of $61,250 found in the 45 to 64 years age bracket for the primary householder. A total of 3 households (18.8%) fall into this category.
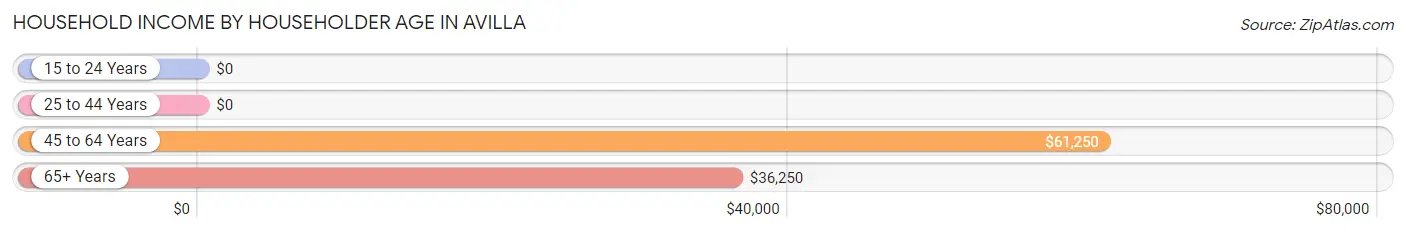
| Income Bracket | # Households | Median Income |
| 15 to 24 Years | 0 (0.0%) | $0 |
| 25 to 44 Years | 10 (62.5%) | $0 |
| 45 to 64 Years | 3 (18.8%) | $61,250 |
| 65+ Years | 3 (18.8%) | $36,250 |
| Total | 16 (100.0%) | $55,000 |
Poverty in Avilla
Income Below Poverty by Sex and Age in Avilla
With 14.3% poverty level for males and 2.7% for females among the residents of Avilla, 35 to 44 year old males and 65 to 74 year old females are the most vulnerable to poverty, with 4 males (50.0%) and 1 females (33.3%) in their respective age groups living below the poverty level.
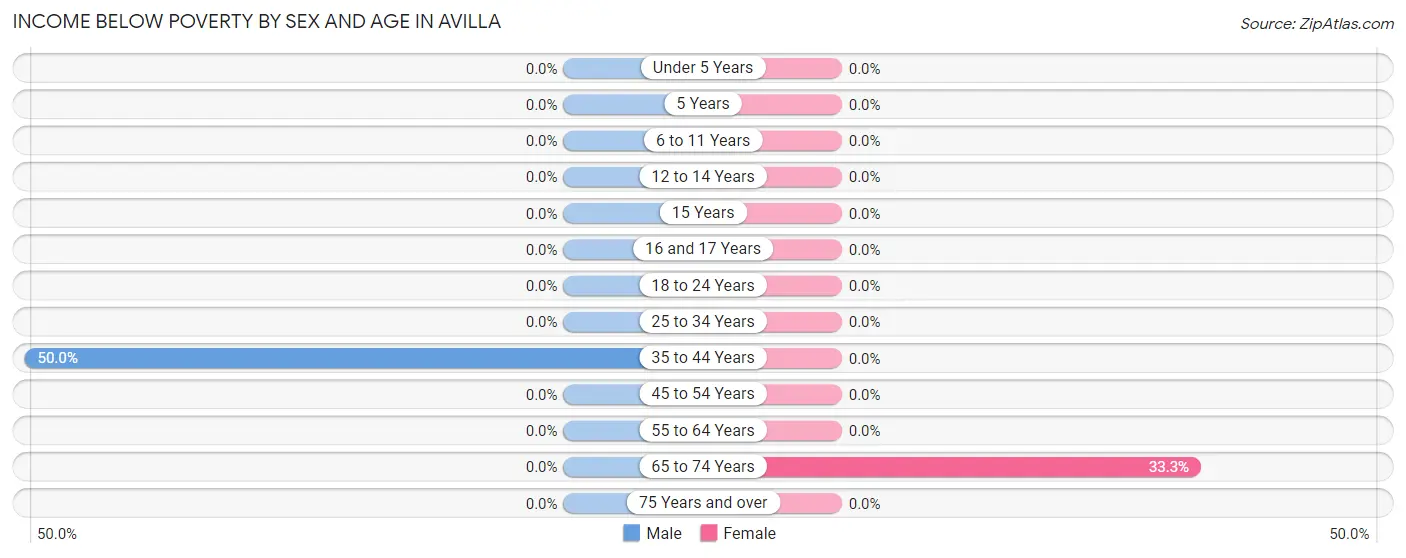
| Age Bracket | Male | Female |
| Under 5 Years | 0 (0.0%) | 0 (0.0%) |
| 5 Years | 0 (0.0%) | 0 (0.0%) |
| 6 to 11 Years | 0 (0.0%) | 0 (0.0%) |
| 12 to 14 Years | 0 (0.0%) | 0 (0.0%) |
| 15 Years | 0 (0.0%) | 0 (0.0%) |
| 16 and 17 Years | 0 (0.0%) | 0 (0.0%) |
| 18 to 24 Years | 0 (0.0%) | 0 (0.0%) |
| 25 to 34 Years | 0 (0.0%) | 0 (0.0%) |
| 35 to 44 Years | 4 (50.0%) | 0 (0.0%) |
| 45 to 54 Years | 0 (0.0%) | 0 (0.0%) |
| 55 to 64 Years | 0 (0.0%) | 0 (0.0%) |
| 65 to 74 Years | 0 (0.0%) | 1 (33.3%) |
| 75 Years and over | 0 (0.0%) | 0 (0.0%) |
| Total | 4 (14.3%) | 1 (2.7%) |
Income Above Poverty by Sex and Age in Avilla
According to the poverty statistics in Avilla, males aged 6 to 11 years and females aged 6 to 11 years are the age groups that are most secure financially, with 100.0% of males and 100.0% of females in these age groups living above the poverty line.
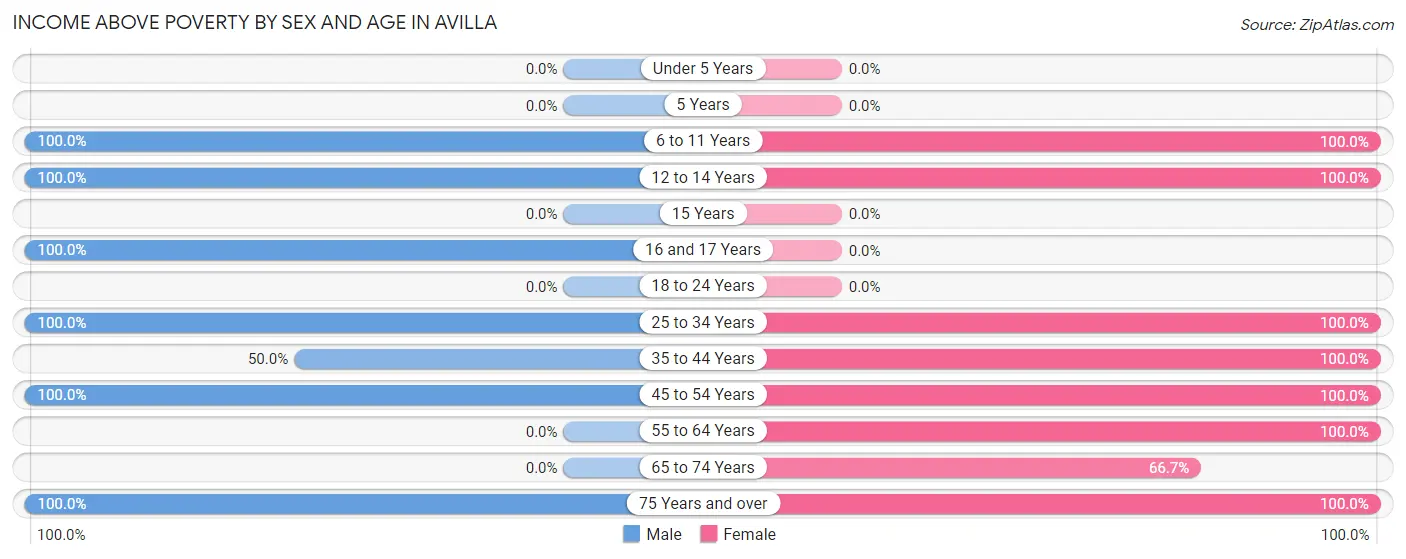
| Age Bracket | Male | Female |
| Under 5 Years | 0 (0.0%) | 0 (0.0%) |
| 5 Years | 0 (0.0%) | 0 (0.0%) |
| 6 to 11 Years | 7 (100.0%) | 7 (100.0%) |
| 12 to 14 Years | 2 (100.0%) | 9 (100.0%) |
| 15 Years | 0 (0.0%) | 0 (0.0%) |
| 16 and 17 Years | 4 (100.0%) | 0 (0.0%) |
| 18 to 24 Years | 0 (0.0%) | 0 (0.0%) |
| 25 to 34 Years | 2 (100.0%) | 6 (100.0%) |
| 35 to 44 Years | 4 (50.0%) | 5 (100.0%) |
| 45 to 54 Years | 3 (100.0%) | 2 (100.0%) |
| 55 to 64 Years | 0 (0.0%) | 3 (100.0%) |
| 65 to 74 Years | 0 (0.0%) | 2 (66.7%) |
| 75 Years and over | 2 (100.0%) | 2 (100.0%) |
| Total | 24 (85.7%) | 36 (97.3%) |
Income Below Poverty Among Married-Couple Families in Avilla
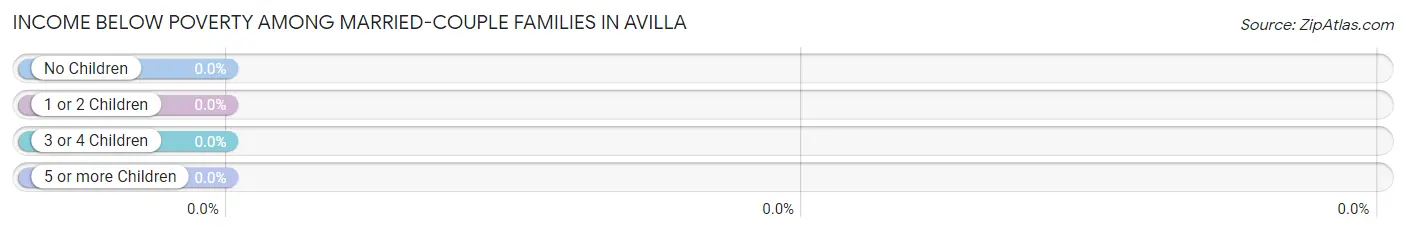
| Children | Above Poverty | Below Poverty |
| No Children | 2 (100.0%) | 0 (0.0%) |
| 1 or 2 Children | 0 (0.0%) | 0 (0.0%) |
| 3 or 4 Children | 6 (100.0%) | 0 (0.0%) |
| 5 or more Children | 0 (0.0%) | 0 (0.0%) |
| Total | 8 (100.0%) | 0 (0.0%) |
Income Below Poverty Among Single-Parent Households in Avilla
| Children | Single Father | Single Mother |
| No Children | 0 (0.0%) | 0 (0.0%) |
| 1 or 2 Children | 0 (0.0%) | 0 (0.0%) |
| 3 or 4 Children | 0 (0.0%) | 0 (0.0%) |
| 5 or more Children | 0 (0.0%) | 0 (0.0%) |
| Total | 0 (0.0%) | 0 (0.0%) |
Income Below Poverty Among Married-Couple vs Single-Parent Households in Avilla
| Children | Married-Couple Families | Single-Parent Households |
| No Children | 0 (0.0%) | 0 (0.0%) |
| 1 or 2 Children | 0 (0.0%) | 0 (0.0%) |
| 3 or 4 Children | 0 (0.0%) | 0 (0.0%) |
| 5 or more Children | 0 (0.0%) | 0 (0.0%) |
| Total | 0 (0.0%) | 0 (0.0%) |
Race in Avilla
The most populous races in Avilla are , and White / Caucasian (65 | 100.0%).
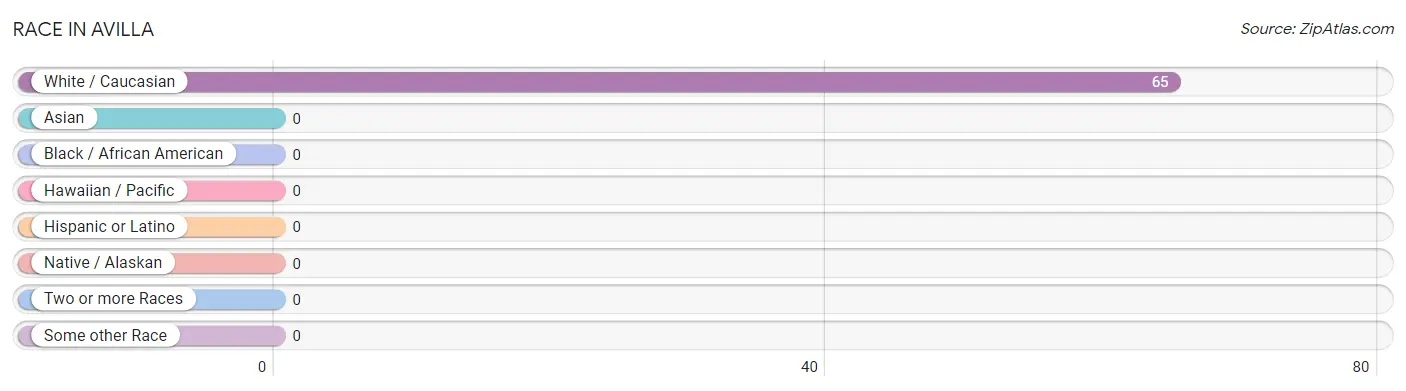
| Race | # Population | % Population |
| Asian | 0 | 0.0% |
| Black / African American | 0 | 0.0% |
| Hawaiian / Pacific | 0 | 0.0% |
| Hispanic or Latino | 0 | 0.0% |
| Native / Alaskan | 0 | 0.0% |
| White / Caucasian | 65 | 100.0% |
| Two or more Races | 0 | 0.0% |
| Some other Race | 0 | 0.0% |
| Total | 65 | 100.0% |
Ancestry in Avilla
The most populous ancestries reported in Avilla are German (5 | 7.7%), and American (2 | 3.1%), together accounting for 10.8% of all Avilla residents.
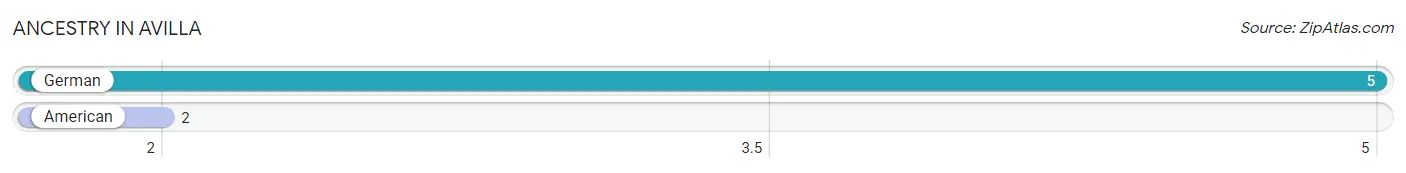
| Ancestry | # Population | % Population |
| American | 2 | 3.1% |
| German | 5 | 7.7% | View All 2 Rows |
Immigrants in Avilla

| Immigration Origin | # Population | % Population | View All 0 Rows |
Sex and Age in Avilla
Sex and Age in Avilla
The most populous age groups in Avilla are 35 to 39 Years (8 | 28.6%) for men and 10 to 14 Years (15 | 40.5%) for women.
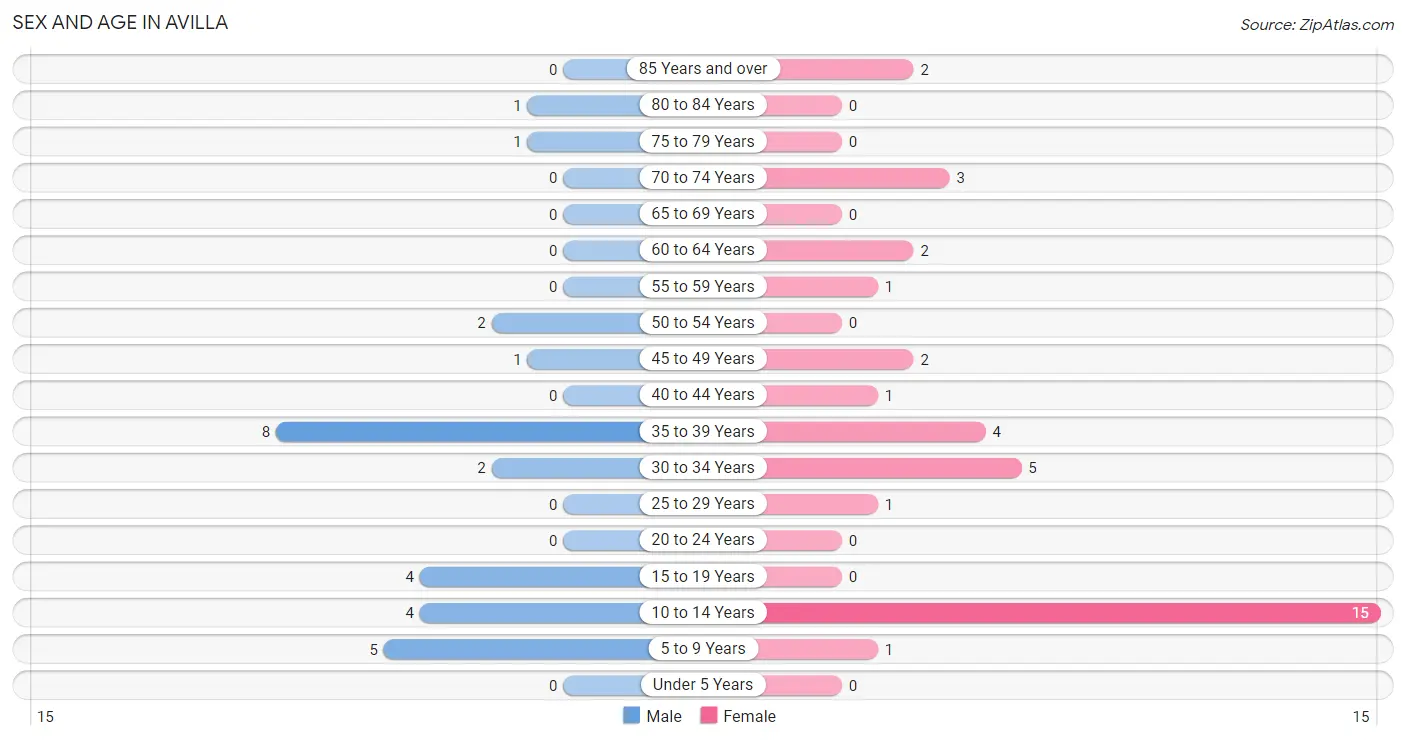
| Age Bracket | Male | Female |
| Under 5 Years | 0 (0.0%) | 0 (0.0%) |
| 5 to 9 Years | 5 (17.9%) | 1 (2.7%) |
| 10 to 14 Years | 4 (14.3%) | 15 (40.5%) |
| 15 to 19 Years | 4 (14.3%) | 0 (0.0%) |
| 20 to 24 Years | 0 (0.0%) | 0 (0.0%) |
| 25 to 29 Years | 0 (0.0%) | 1 (2.7%) |
| 30 to 34 Years | 2 (7.1%) | 5 (13.5%) |
| 35 to 39 Years | 8 (28.6%) | 4 (10.8%) |
| 40 to 44 Years | 0 (0.0%) | 1 (2.7%) |
| 45 to 49 Years | 1 (3.6%) | 2 (5.4%) |
| 50 to 54 Years | 2 (7.1%) | 0 (0.0%) |
| 55 to 59 Years | 0 (0.0%) | 1 (2.7%) |
| 60 to 64 Years | 0 (0.0%) | 2 (5.4%) |
| 65 to 69 Years | 0 (0.0%) | 0 (0.0%) |
| 70 to 74 Years | 0 (0.0%) | 3 (8.1%) |
| 75 to 79 Years | 1 (3.6%) | 0 (0.0%) |
| 80 to 84 Years | 1 (3.6%) | 0 (0.0%) |
| 85 Years and over | 0 (0.0%) | 2 (5.4%) |
| Total | 28 (100.0%) | 37 (100.0%) |
Families and Households in Avilla
Median Family Size in Avilla
The median family size in Avilla is 4.00 persons per family, with married-couple families (8 | 53.3%) accounting for the largest median family size of 4.5 persons per family. On the other hand, single female/mother families (5 | 33.3%) represent the smallest median family size with 3.40 persons per family.

| Family Type | # Families | Family Size |
| Married-Couple | 8 (53.3%) | 4.50 |
| Single Male/Father | 2 (13.3%) | 3.50 |
| Single Female/Mother | 5 (33.3%) | 3.40 |
| Total Families | 15 (100.0%) | 4.00 |
Median Household Size in Avilla
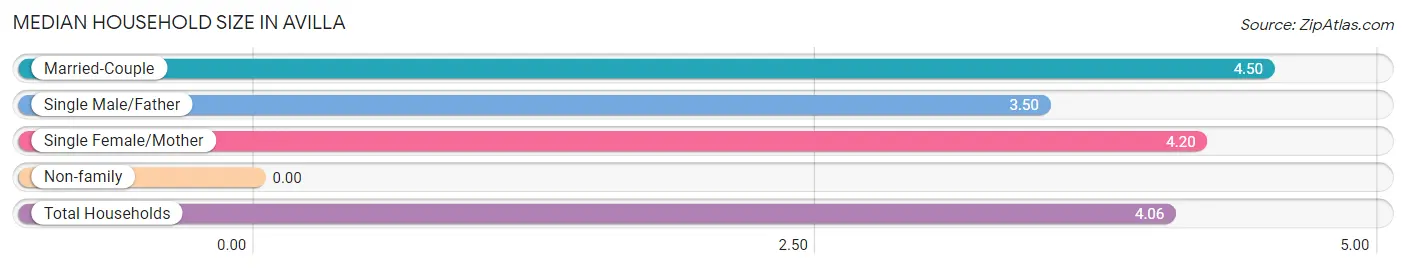
| Household Type | # Households | Household Size |
| Married-Couple | 8 (50.0%) | 4.50 |
| Single Male/Father | 2 (12.5%) | 3.50 |
| Single Female/Mother | 5 (31.2%) | 4.20 |
| Non-family | 1 (6.2%) | - |
| Total Households | 16 (100.0%) | 4.06 |
Household Size by Marriage Status in Avilla
Out of a total of 16 households in Avilla, 15 (93.8%) are family households, while 1 (6.2%) are nonfamily households. The most numerous type of family households are 5-person households, comprising 7, and the most common type of nonfamily households are 1-person households, comprising 1.
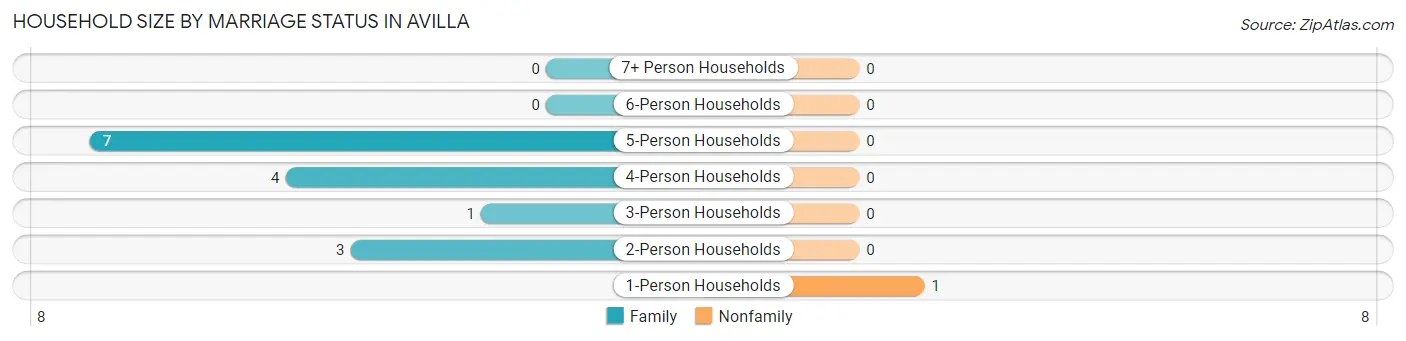
| Household Size | Family Households | Nonfamily Households |
| 1-Person Households | - | 1 (6.2%) |
| 2-Person Households | 3 (18.8%) | 0 (0.0%) |
| 3-Person Households | 1 (6.2%) | 0 (0.0%) |
| 4-Person Households | 4 (25.0%) | 0 (0.0%) |
| 5-Person Households | 7 (43.8%) | 0 (0.0%) |
| 6-Person Households | 0 (0.0%) | 0 (0.0%) |
| 7+ Person Households | 0 (0.0%) | 0 (0.0%) |
| Total | 15 (93.8%) | 1 (6.2%) |
Female Fertility in Avilla
Fertility by Age in Avilla
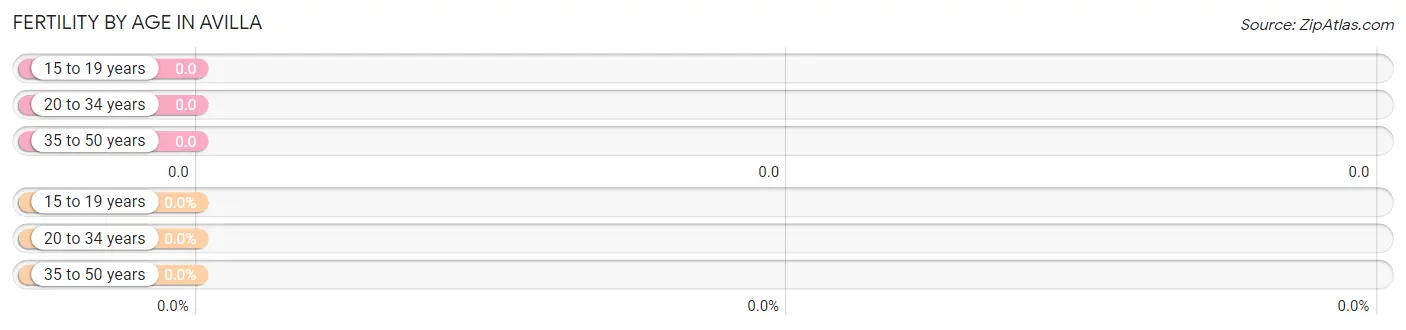
| Age Bracket | Women with Births | Births / 1,000 Women |
| 15 to 19 years | 0 (0.0%) | 0.0 |
| 20 to 34 years | 0 (0.0%) | 0.0 |
| 35 to 50 years | 0 (0.0%) | 0.0 |
| Total | 0 (0.0%) | 0.0 |
Fertility by Age by Marriage Status in Avilla
| Age Bracket | Married | Unmarried |
| 15 to 19 years | 0 (0.0%) | 0 (0.0%) |
| 20 to 34 years | 0 (0.0%) | 0 (0.0%) |
| 35 to 50 years | 0 (0.0%) | 0 (0.0%) |
| Total | 0 (0.0%) | 0 (0.0%) |
Fertility by Education in Avilla
| Educational Attainment | Women with Births | Births / 1,000 Women |
| Less than High School | 0 (0.0%) | 0.0 |
| High School Diploma | 0 (0.0%) | 0.0 |
| College or Associate's Degree | 0 (0.0%) | 0.0 |
| Bachelor's Degree | 0 (0.0%) | 0.0 |
| Graduate Degree | 0 (0.0%) | 0.0 |
| Total | 0 (0.0%) | 0.0 |
Fertility by Education by Marriage Status in Avilla
| Educational Attainment | Married | Unmarried |
| Less than High School | 0 (0.0%) | 0 (0.0%) |
| High School Diploma | 0 (0.0%) | 0 (0.0%) |
| College or Associate's Degree | 0 (0.0%) | 0 (0.0%) |
| Bachelor's Degree | 0 (0.0%) | 0 (0.0%) |
| Graduate Degree | 0 (0.0%) | 0 (0.0%) |
| Total | 0 (0.0%) | 0 (0.0%) |
Employment Characteristics in Avilla
Employment by Class of Employer in Avilla
Among the 26 employed individuals in Avilla, private company employees (18 | 69.2%), not-for-profit organizations (4 | 15.4%), and self-employed (incorporated) (2 | 7.7%) make up the most common classes of employment.
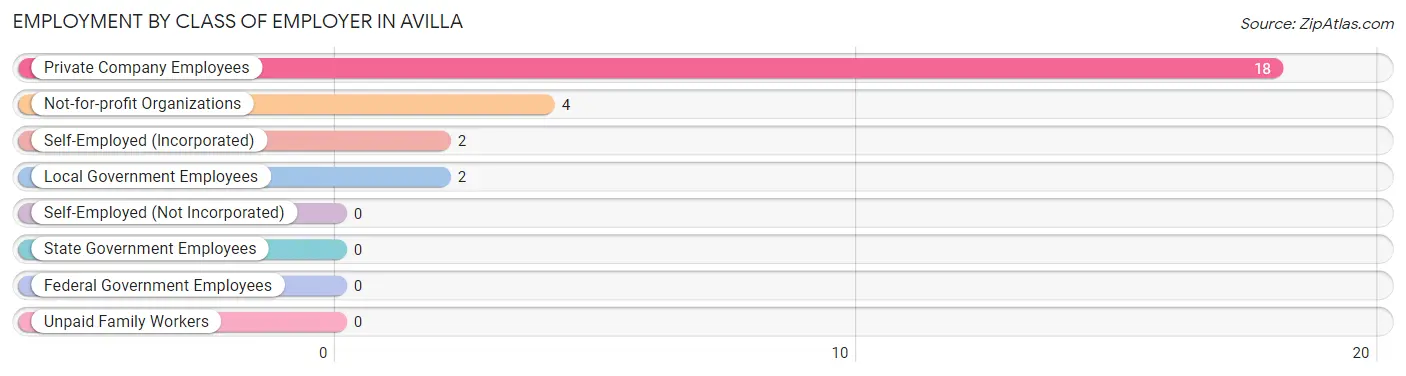
| Employer Class | # Employees | % Employees |
| Private Company Employees | 18 | 69.2% |
| Self-Employed (Incorporated) | 2 | 7.7% |
| Self-Employed (Not Incorporated) | 0 | 0.0% |
| Not-for-profit Organizations | 4 | 15.4% |
| Local Government Employees | 2 | 7.7% |
| State Government Employees | 0 | 0.0% |
| Federal Government Employees | 0 | 0.0% |
| Unpaid Family Workers | 0 | 0.0% |
| Total | 26 | 100.0% |
Employment Status by Age in Avilla
According to the labor force statistics for Avilla, out of the total population over 16 years of age (40), 75.0% or 30 individuals are in the labor force, with 13.3% or 4 of them unemployed. The age group with the highest labor force participation rate is 16 to 19 years, with 100.0% or 4 individuals in the labor force. Within the labor force, the 35 to 44 years age range has the highest percentage of unemployed individuals, with 30.8% or 4 of them being unemployed.
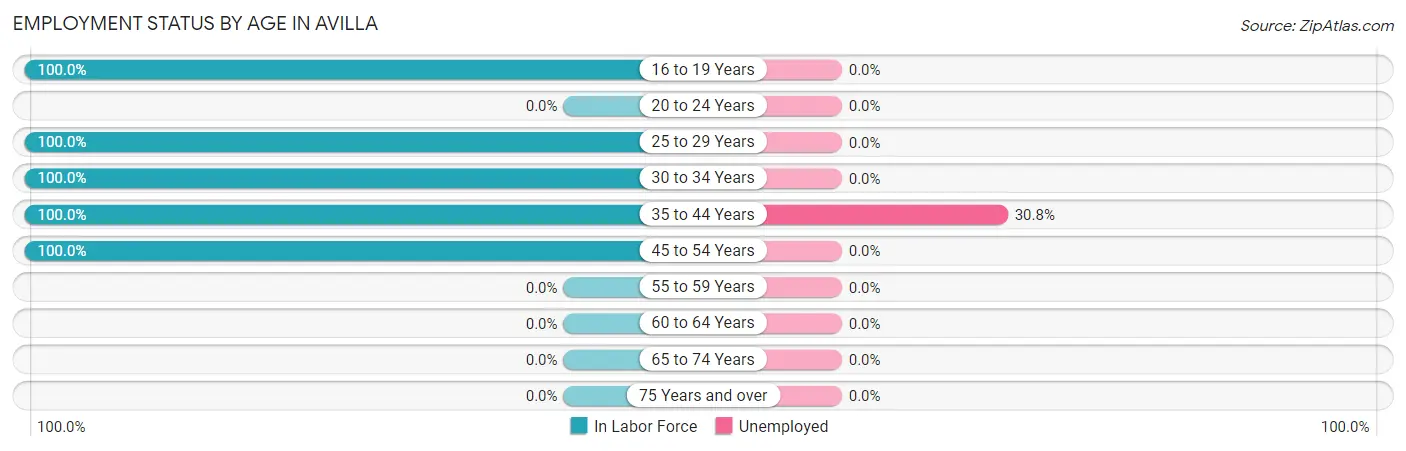
| Age Bracket | In Labor Force | Unemployed |
| 16 to 19 Years | 4 (100.0%) | 0 (0.0%) |
| 20 to 24 Years | 0 (0.0%) | 0 (0.0%) |
| 25 to 29 Years | 1 (100.0%) | 0 (0.0%) |
| 30 to 34 Years | 7 (100.0%) | 0 (0.0%) |
| 35 to 44 Years | 13 (100.0%) | 4 (30.8%) |
| 45 to 54 Years | 5 (100.0%) | 0 (0.0%) |
| 55 to 59 Years | 0 (0.0%) | 0 (0.0%) |
| 60 to 64 Years | 0 (0.0%) | 0 (0.0%) |
| 65 to 74 Years | 0 (0.0%) | 0 (0.0%) |
| 75 Years and over | 0 (0.0%) | 0 (0.0%) |
| Total | 30 (75.0%) | 4 (13.3%) |
Employment Status by Educational Attainment in Avilla
According to labor force statistics for Avilla, 89.7% of individuals (26) out of the total population between 25 and 64 years of age (29) are in the labor force, with 15.4% or 4 of them being unemployed. The group with the highest labor force participation rate are those with the educational attainment of less than high school, with 100.0% or 9 individuals in the labor force. Within the labor force, individuals with less than high school education have the highest percentage of unemployment, with 44.4% or 4 of them being unemployed.
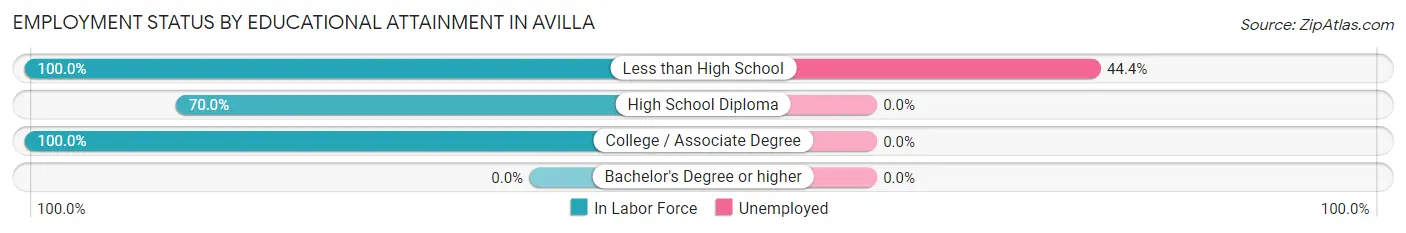
| Educational Attainment | In Labor Force | Unemployed |
| Less than High School | 9 (100.0%) | 4 (44.4%) |
| High School Diploma | 7 (70.0%) | 0 (0.0%) |
| College / Associate Degree | 10 (100.0%) | 0 (0.0%) |
| Bachelor's Degree or higher | 0 (0.0%) | 0 (0.0%) |
| Total | 26 (89.7%) | 4 (15.4%) |
Employment Occupations by Sex in Avilla
Management, Business, Science and Arts Occupations
Management, Business, Science and Arts Occupations by Sex
| Occupation | Male | Female |
| Management | 0 (0.0%) | 0 (0.0%) |
| Business & Financial | 0 (0.0%) | 0 (0.0%) |
| Computers, Engineering & Science | 0 (0.0%) | 0 (0.0%) |
| Computers & Mathematics | 0 (0.0%) | 0 (0.0%) |
| Architecture & Engineering | 0 (0.0%) | 0 (0.0%) |
| Life, Physical & Social Science | 0 (0.0%) | 0 (0.0%) |
| Community & Social Service | 0 (0.0%) | 0 (0.0%) |
| Education, Arts & Media | 0 (0.0%) | 0 (0.0%) |
| Legal Services & Support | 0 (0.0%) | 0 (0.0%) |
| Education Instruction & Library | 0 (0.0%) | 0 (0.0%) |
| Arts, Media & Entertainment | 0 (0.0%) | 0 (0.0%) |
| Health Diagnosing & Treating | 0 (0.0%) | 0 (0.0%) |
| Health Technologists | 0 (0.0%) | 0 (0.0%) |
| Total (Category) | 0 (0.0%) | 0 (0.0%) |
| Total (Overall) | 13 (50.0%) | 13 (50.0%) |
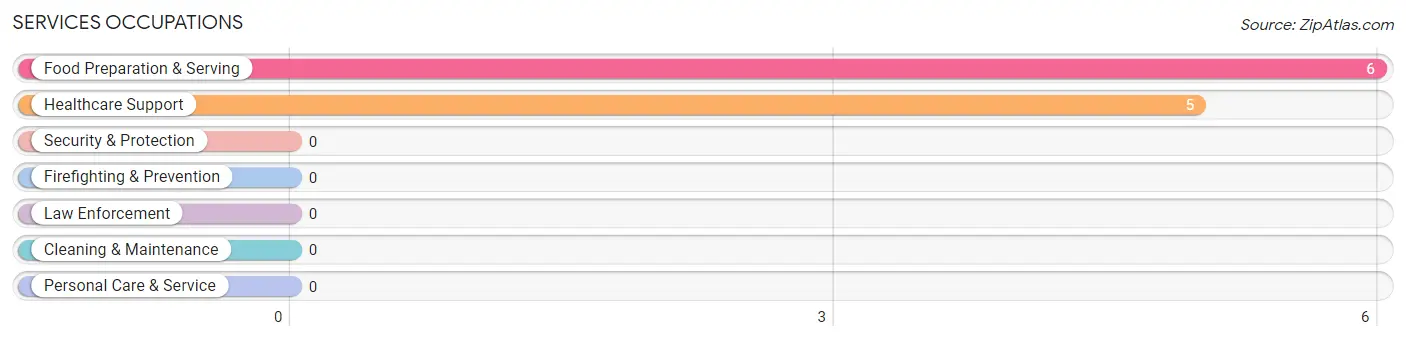
Services Occupations
The most common Services occupations in Avilla are Food Preparation & Serving (6 | 23.1%), and Healthcare Support (5 | 19.2%).
Services Occupations by Sex
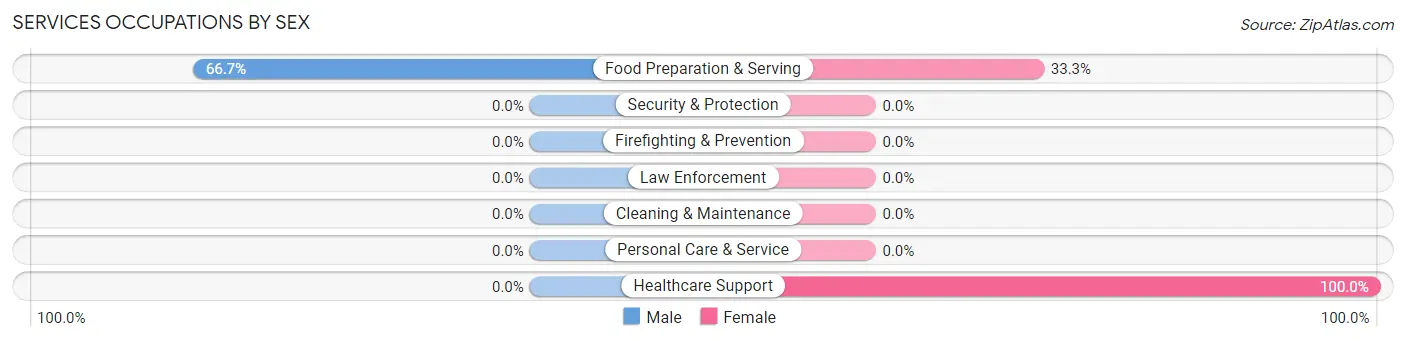
| Occupation | Male | Female |
| Healthcare Support | 0 (0.0%) | 5 (100.0%) |
| Security & Protection | 0 (0.0%) | 0 (0.0%) |
| Firefighting & Prevention | 0 (0.0%) | 0 (0.0%) |
| Law Enforcement | 0 (0.0%) | 0 (0.0%) |
| Food Preparation & Serving | 4 (66.7%) | 2 (33.3%) |
| Cleaning & Maintenance | 0 (0.0%) | 0 (0.0%) |
| Personal Care & Service | 0 (0.0%) | 0 (0.0%) |
| Total (Category) | 4 (36.4%) | 7 (63.6%) |
| Total (Overall) | 13 (50.0%) | 13 (50.0%) |
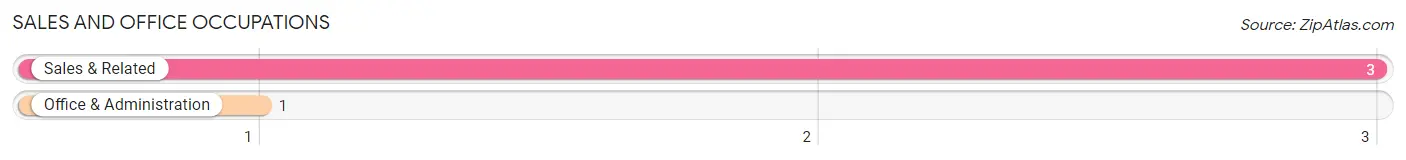
Sales and Office Occupations
The most common Sales and Office occupations in Avilla are Sales & Related (3 | 11.5%), and Office & Administration (1 | 3.8%).
Sales and Office Occupations by Sex
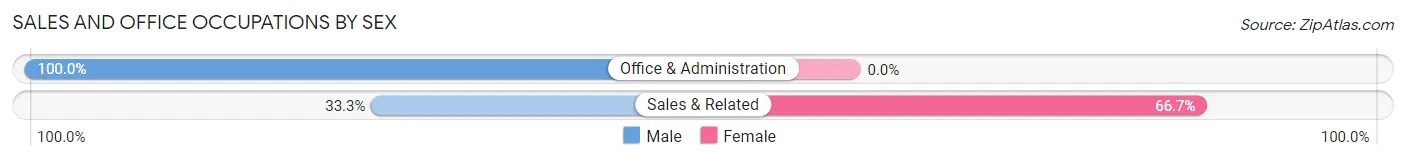
| Occupation | Male | Female |
| Sales & Related | 1 (33.3%) | 2 (66.7%) |
| Office & Administration | 1 (100.0%) | 0 (0.0%) |
| Total (Category) | 2 (50.0%) | 2 (50.0%) |
| Total (Overall) | 13 (50.0%) | 13 (50.0%) |
Natural Resources, Construction and Maintenance Occupations
Natural Resources, Construction and Maintenance Occupations by Sex
| Occupation | Male | Female |
| Farming, Fishing & Forestry | 0 (0.0%) | 0 (0.0%) |
| Construction & Extraction | 0 (0.0%) | 0 (0.0%) |
| Installation, Maintenance & Repair | 0 (0.0%) | 0 (0.0%) |
| Total (Category) | 0 (0.0%) | 0 (0.0%) |
| Total (Overall) | 13 (50.0%) | 13 (50.0%) |
Production, Transportation and Moving Occupations
The most common Production, Transportation and Moving occupations in Avilla are , and Production (11 | 42.3%).
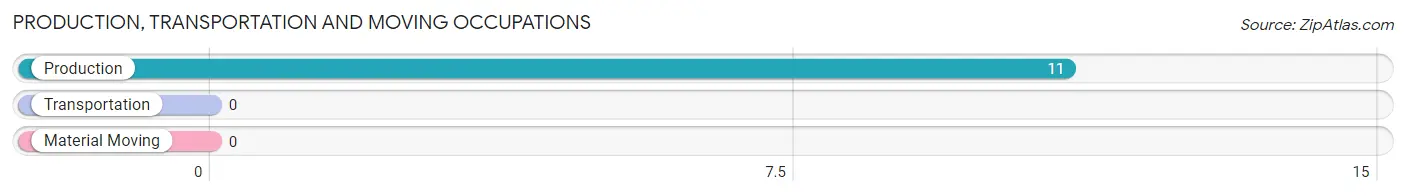
Production, Transportation and Moving Occupations by Sex
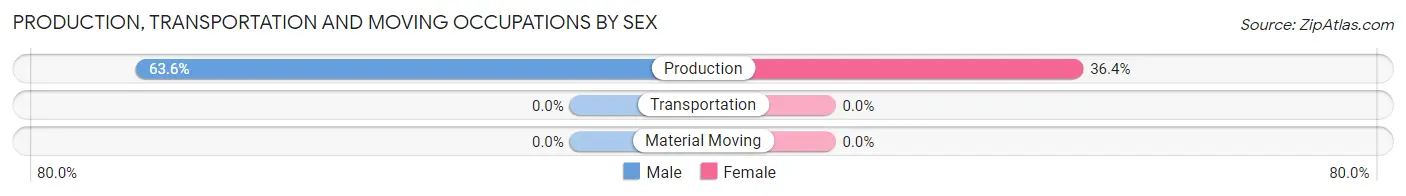
| Occupation | Male | Female |
| Production | 7 (63.6%) | 4 (36.4%) |
| Transportation | 0 (0.0%) | 0 (0.0%) |
| Material Moving | 0 (0.0%) | 0 (0.0%) |
| Total (Category) | 7 (63.6%) | 4 (36.4%) |
| Total (Overall) | 13 (50.0%) | 13 (50.0%) |
Employment Industries by Sex in Avilla
Employment Industries in Avilla
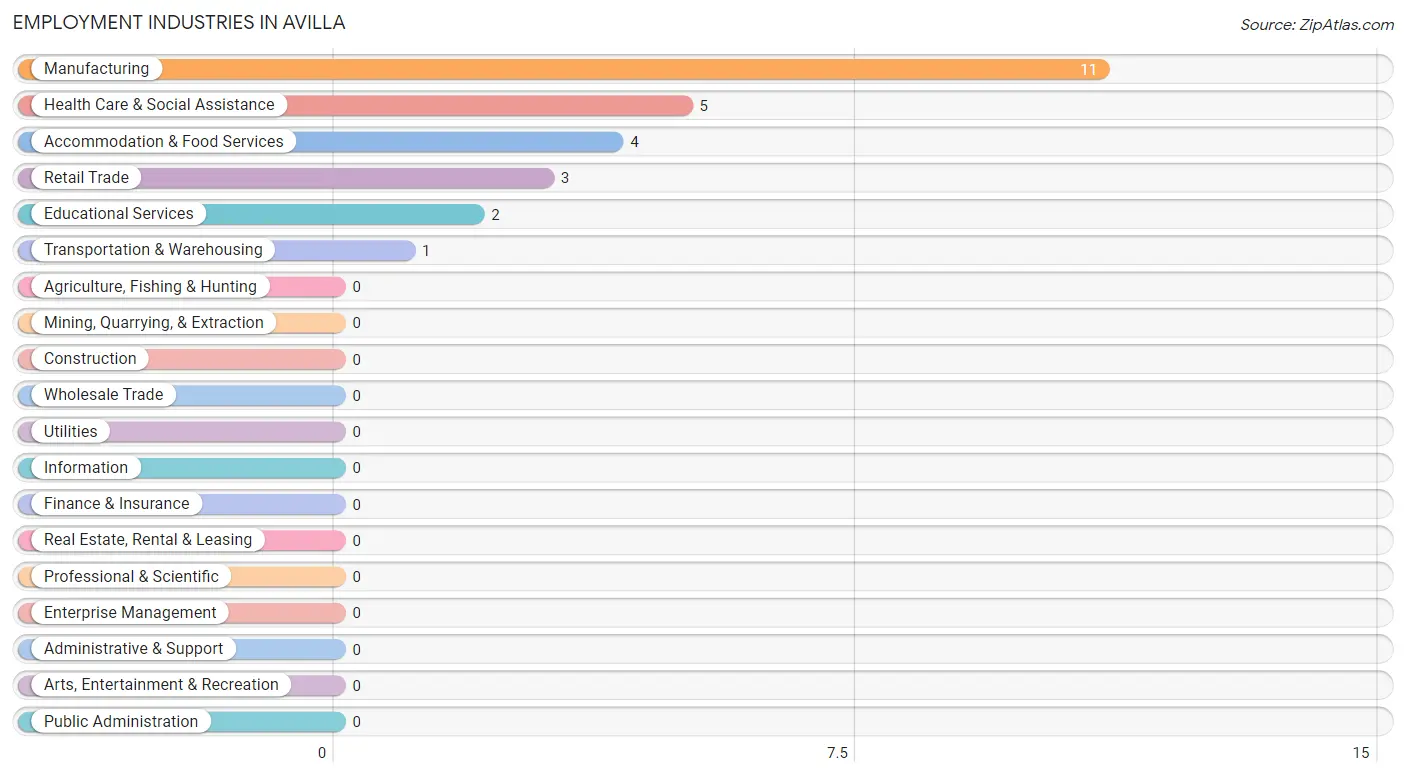
The major employment industries in Avilla include Manufacturing (11 | 42.3%), Health Care & Social Assistance (5 | 19.2%), Accommodation & Food Services (4 | 15.4%), Retail Trade (3 | 11.5%), and Educational Services (2 | 7.7%).
Employment Industries by Sex in Avilla
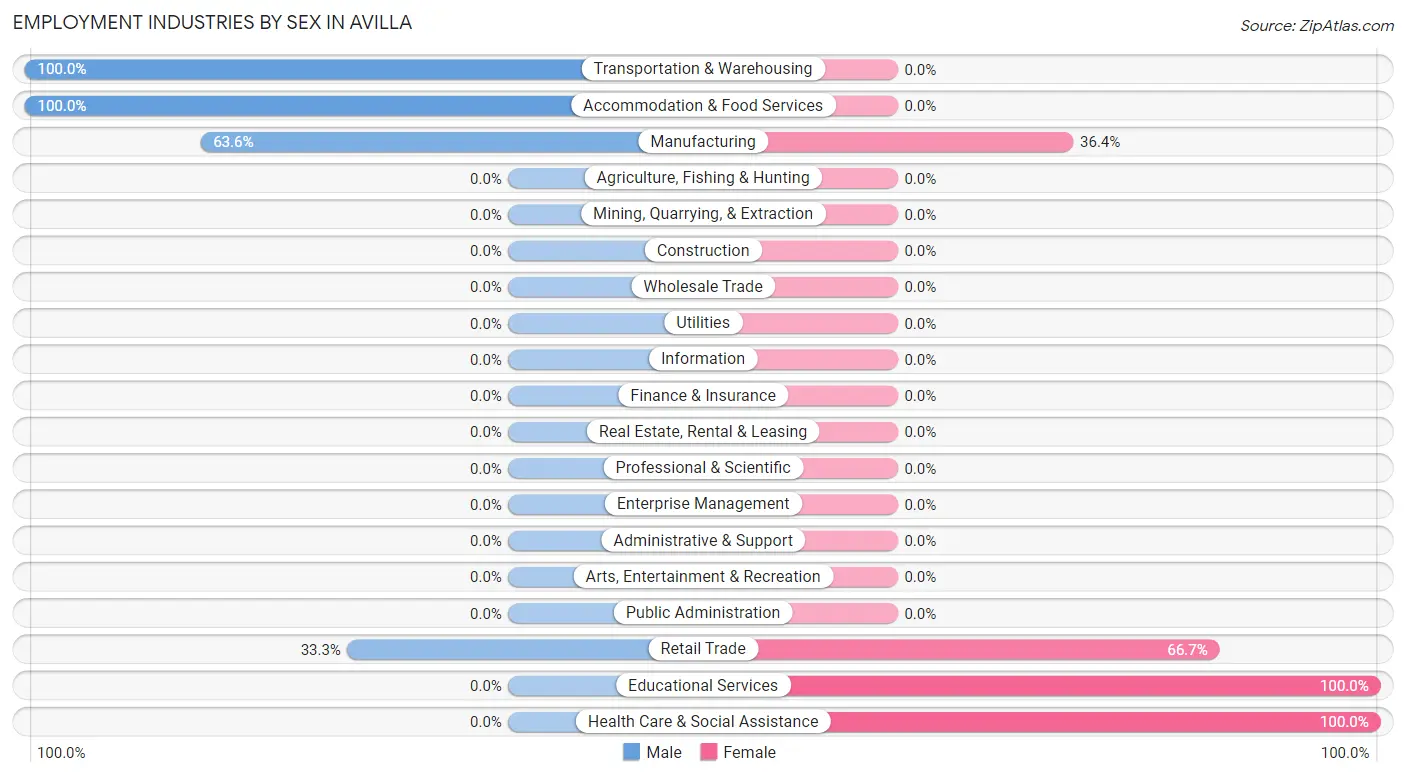
The Avilla industries that see more men than women are Transportation & Warehousing (100.0%), Accommodation & Food Services (100.0%), and Manufacturing (63.6%), whereas the industries that tend to have a higher number of women are Educational Services (100.0%), Health Care & Social Assistance (100.0%), and Retail Trade (66.7%).
| Industry | Male | Female |
| Agriculture, Fishing & Hunting | 0 (0.0%) | 0 (0.0%) |
| Mining, Quarrying, & Extraction | 0 (0.0%) | 0 (0.0%) |
| Construction | 0 (0.0%) | 0 (0.0%) |
| Manufacturing | 7 (63.6%) | 4 (36.4%) |
| Wholesale Trade | 0 (0.0%) | 0 (0.0%) |
| Retail Trade | 1 (33.3%) | 2 (66.7%) |
| Transportation & Warehousing | 1 (100.0%) | 0 (0.0%) |
| Utilities | 0 (0.0%) | 0 (0.0%) |
| Information | 0 (0.0%) | 0 (0.0%) |
| Finance & Insurance | 0 (0.0%) | 0 (0.0%) |
| Real Estate, Rental & Leasing | 0 (0.0%) | 0 (0.0%) |
| Professional & Scientific | 0 (0.0%) | 0 (0.0%) |
| Enterprise Management | 0 (0.0%) | 0 (0.0%) |
| Administrative & Support | 0 (0.0%) | 0 (0.0%) |
| Educational Services | 0 (0.0%) | 2 (100.0%) |
| Health Care & Social Assistance | 0 (0.0%) | 5 (100.0%) |
| Arts, Entertainment & Recreation | 0 (0.0%) | 0 (0.0%) |
| Accommodation & Food Services | 4 (100.0%) | 0 (0.0%) |
| Public Administration | 0 (0.0%) | 0 (0.0%) |
| Total | 13 (50.0%) | 13 (50.0%) |
Education in Avilla
School Enrollment in Avilla
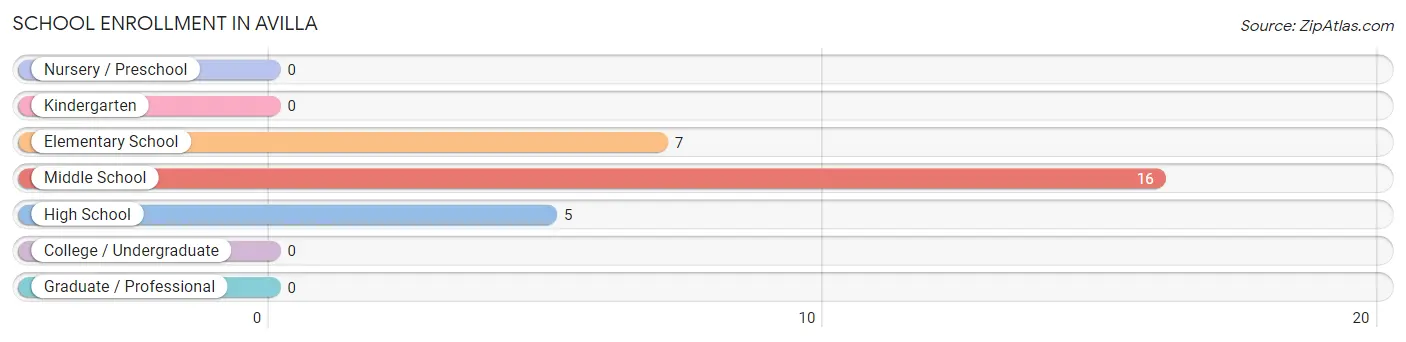
The most common levels of schooling among the 28 students in Avilla are middle school (16 | 57.1%), elementary school (7 | 25.0%), and high school (5 | 17.9%).
| School Level | # Students | % Students |
| Nursery / Preschool | 0 | 0.0% |
| Kindergarten | 0 | 0.0% |
| Elementary School | 7 | 25.0% |
| Middle School | 16 | 57.1% |
| High School | 5 | 17.9% |
| College / Undergraduate | 0 | 0.0% |
| Graduate / Professional | 0 | 0.0% |
| Total | 28 | 100.0% |
School Enrollment by Age by Funding Source in Avilla
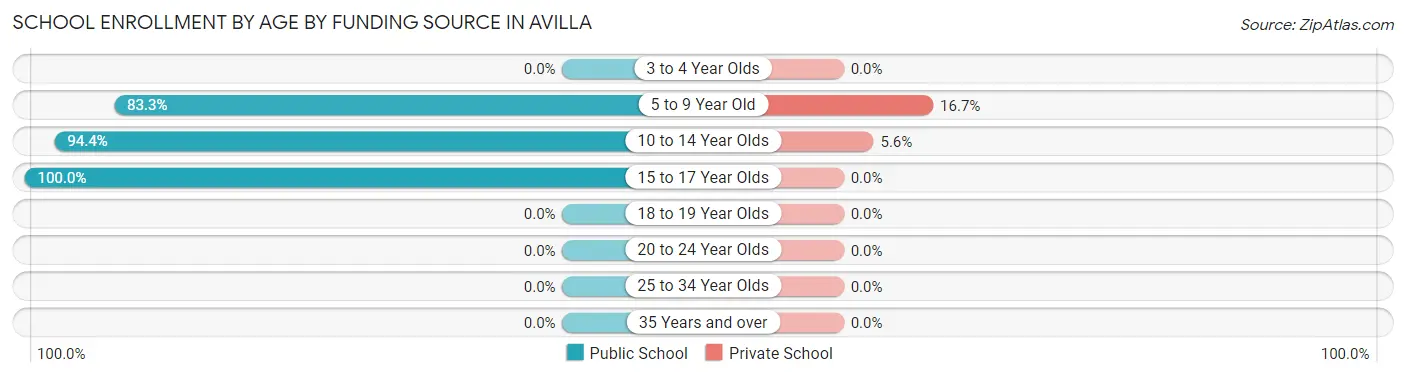
Out of a total of 28 students who are enrolled in schools in Avilla, 2 (7.1%) attend a private institution, while the remaining 26 (92.9%) are enrolled in public schools. The age group of 5 to 9 year old has the highest likelihood of being enrolled in private schools, with 1 (16.7% in the age bracket) enrolled. Conversely, the age group of 15 to 17 year olds has the lowest likelihood of being enrolled in a private school, with 4 (100.0% in the age bracket) attending a public institution.
| Age Bracket | Public School | Private School |
| 3 to 4 Year Olds | 0 (0.0%) | 0 (0.0%) |
| 5 to 9 Year Old | 5 (83.3%) | 1 (16.7%) |
| 10 to 14 Year Olds | 17 (94.4%) | 1 (5.6%) |
| 15 to 17 Year Olds | 4 (100.0%) | 0 (0.0%) |
| 18 to 19 Year Olds | 0 (0.0%) | 0 (0.0%) |
| 20 to 24 Year Olds | 0 (0.0%) | 0 (0.0%) |
| 25 to 34 Year Olds | 0 (0.0%) | 0 (0.0%) |
| 35 Years and over | 0 (0.0%) | 0 (0.0%) |
| Total | 26 (92.9%) | 2 (7.1%) |
Educational Attainment by Field of Study in Avilla
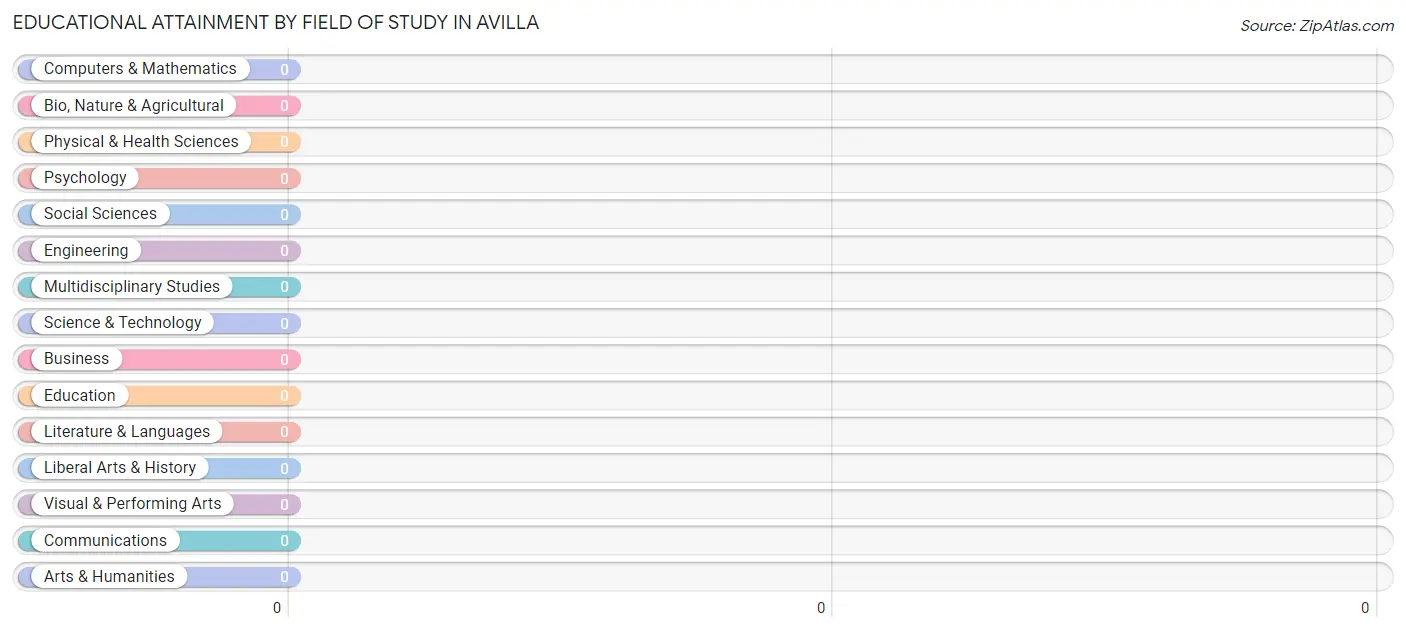
| Field of Study | # Graduates | % Graduates |
| Computers & Mathematics | 0 | 0.0% |
| Bio, Nature & Agricultural | 0 | 0.0% |
| Physical & Health Sciences | 0 | 0.0% |
| Psychology | 0 | 0.0% |
| Social Sciences | 0 | 0.0% |
| Engineering | 0 | 0.0% |
| Multidisciplinary Studies | 0 | 0.0% |
| Science & Technology | 0 | 0.0% |
| Business | 0 | 0.0% |
| Education | 0 | 0.0% |
| Literature & Languages | 0 | 0.0% |
| Liberal Arts & History | 0 | 0.0% |
| Visual & Performing Arts | 0 | 0.0% |
| Communications | 0 | 0.0% |
| Arts & Humanities | 0 | 0.0% |
| Total | 0 | 0.0% |
Transportation & Commute in Avilla
Vehicle Availability by Sex in Avilla
The most prevalent vehicle ownership categories in Avilla are males with 4 vehicles (8, accounting for 61.5%) and females with 4 vehicles (4, making up 61.5%).
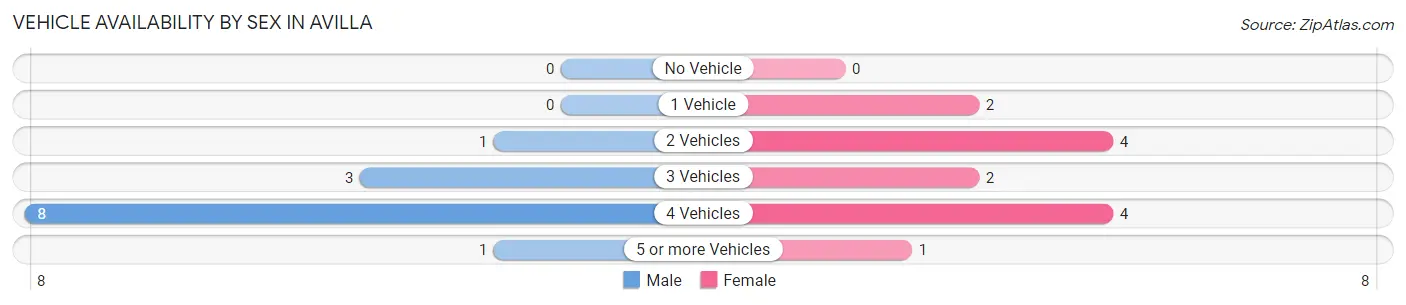
| Vehicles Available | Male | Female |
| No Vehicle | 0 (0.0%) | 0 (0.0%) |
| 1 Vehicle | 0 (0.0%) | 2 (15.4%) |
| 2 Vehicles | 1 (7.7%) | 4 (30.8%) |
| 3 Vehicles | 3 (23.1%) | 2 (15.4%) |
| 4 Vehicles | 8 (61.5%) | 4 (30.8%) |
| 5 or more Vehicles | 1 (7.7%) | 1 (7.7%) |
| Total | 13 (100.0%) | 13 (100.0%) |
Commute Time in Avilla
The most frequently occuring commute durations in Avilla are 15 to 19 minutes (9 commuters, 34.6%), 30 to 34 minutes (7 commuters, 26.9%), and 45 to 59 minutes (5 commuters, 19.2%).
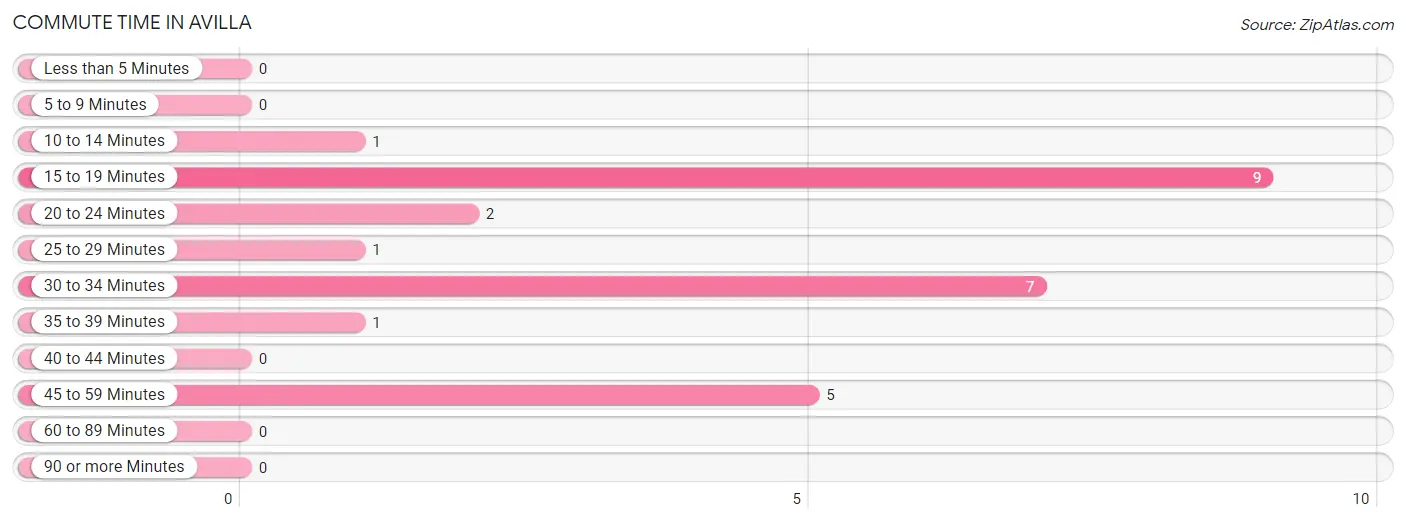
| Commute Time | # Commuters | % Commuters |
| Less than 5 Minutes | 0 | 0.0% |
| 5 to 9 Minutes | 0 | 0.0% |
| 10 to 14 Minutes | 1 | 3.8% |
| 15 to 19 Minutes | 9 | 34.6% |
| 20 to 24 Minutes | 2 | 7.7% |
| 25 to 29 Minutes | 1 | 3.8% |
| 30 to 34 Minutes | 7 | 26.9% |
| 35 to 39 Minutes | 1 | 3.8% |
| 40 to 44 Minutes | 0 | 0.0% |
| 45 to 59 Minutes | 5 | 19.2% |
| 60 to 89 Minutes | 0 | 0.0% |
| 90 or more Minutes | 0 | 0.0% |
Commute Time by Sex in Avilla
The most common commute times in Avilla are 45 to 59 minutes (5 commuters, 38.5%) for males and 15 to 19 minutes (5 commuters, 38.5%) for females.
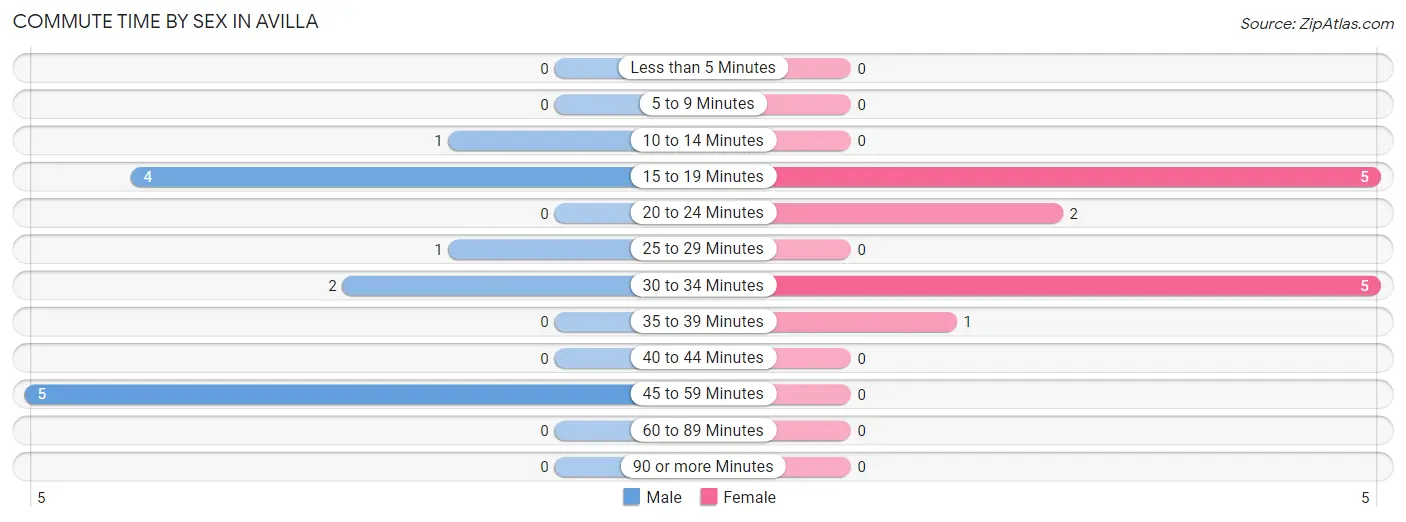
| Commute Time | Male | Female |
| Less than 5 Minutes | 0 (0.0%) | 0 (0.0%) |
| 5 to 9 Minutes | 0 (0.0%) | 0 (0.0%) |
| 10 to 14 Minutes | 1 (7.7%) | 0 (0.0%) |
| 15 to 19 Minutes | 4 (30.8%) | 5 (38.5%) |
| 20 to 24 Minutes | 0 (0.0%) | 2 (15.4%) |
| 25 to 29 Minutes | 1 (7.7%) | 0 (0.0%) |
| 30 to 34 Minutes | 2 (15.4%) | 5 (38.5%) |
| 35 to 39 Minutes | 0 (0.0%) | 1 (7.7%) |
| 40 to 44 Minutes | 0 (0.0%) | 0 (0.0%) |
| 45 to 59 Minutes | 5 (38.5%) | 0 (0.0%) |
| 60 to 89 Minutes | 0 (0.0%) | 0 (0.0%) |
| 90 or more Minutes | 0 (0.0%) | 0 (0.0%) |
Time of Departure to Work by Sex in Avilla
The most frequent times of departure to work in Avilla are 5:00 AM to 5:29 AM (4, 30.8%) for males and 4:00 PM to 11:59 PM (5, 38.5%) for females.
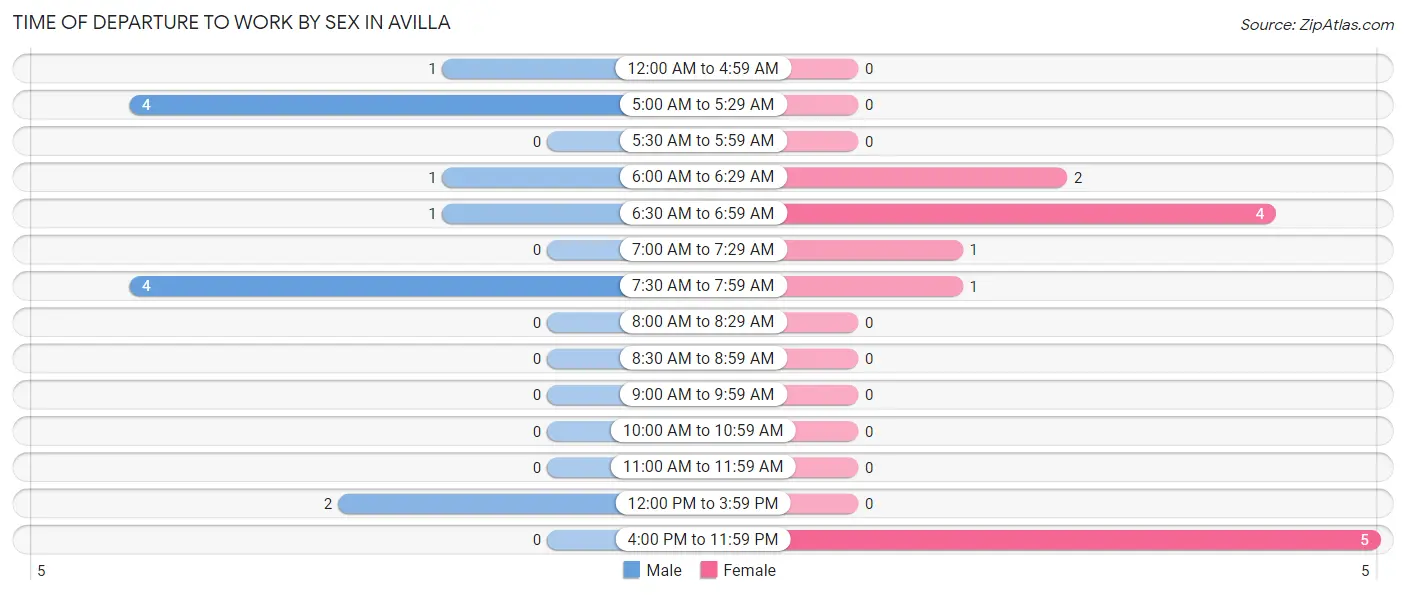
| Time of Departure | Male | Female |
| 12:00 AM to 4:59 AM | 1 (7.7%) | 0 (0.0%) |
| 5:00 AM to 5:29 AM | 4 (30.8%) | 0 (0.0%) |
| 5:30 AM to 5:59 AM | 0 (0.0%) | 0 (0.0%) |
| 6:00 AM to 6:29 AM | 1 (7.7%) | 2 (15.4%) |
| 6:30 AM to 6:59 AM | 1 (7.7%) | 4 (30.8%) |
| 7:00 AM to 7:29 AM | 0 (0.0%) | 1 (7.7%) |
| 7:30 AM to 7:59 AM | 4 (30.8%) | 1 (7.7%) |
| 8:00 AM to 8:29 AM | 0 (0.0%) | 0 (0.0%) |
| 8:30 AM to 8:59 AM | 0 (0.0%) | 0 (0.0%) |
| 9:00 AM to 9:59 AM | 0 (0.0%) | 0 (0.0%) |
| 10:00 AM to 10:59 AM | 0 (0.0%) | 0 (0.0%) |
| 11:00 AM to 11:59 AM | 0 (0.0%) | 0 (0.0%) |
| 12:00 PM to 3:59 PM | 2 (15.4%) | 0 (0.0%) |
| 4:00 PM to 11:59 PM | 0 (0.0%) | 5 (38.5%) |
| Total | 13 (100.0%) | 13 (100.0%) |
Housing Occupancy in Avilla
Occupancy by Ownership in Avilla
Of the total 16 dwellings in Avilla, owner-occupied units account for 15 (93.8%), while renter-occupied units make up 1 (6.2%).
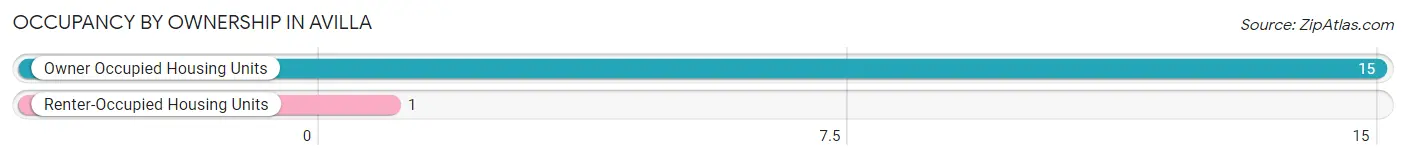
| Occupancy | # Housing Units | % Housing Units |
| Owner Occupied Housing Units | 15 | 93.8% |
| Renter-Occupied Housing Units | 1 | 6.2% |
| Total Occupied Housing Units | 16 | 100.0% |
Occupancy by Household Size in Avilla
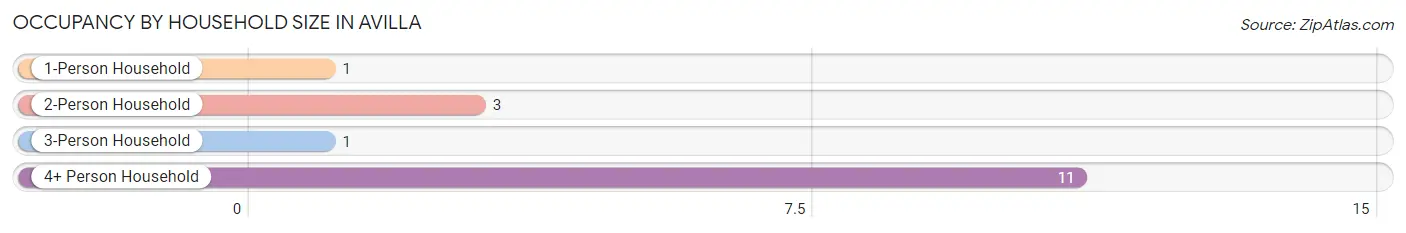
| Household Size | # Housing Units | % Housing Units |
| 1-Person Household | 1 | 6.2% |
| 2-Person Household | 3 | 18.8% |
| 3-Person Household | 1 | 6.2% |
| 4+ Person Household | 11 | 68.8% |
| Total Housing Units | 16 | 100.0% |
Occupancy by Ownership by Household Size in Avilla
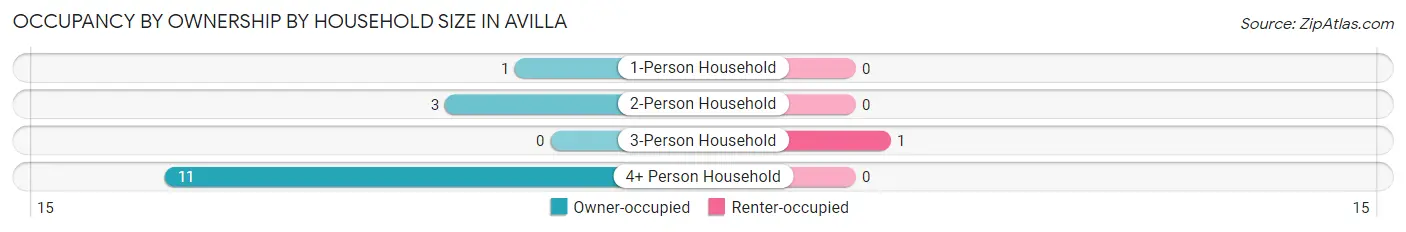
| Household Size | Owner-occupied | Renter-occupied |
| 1-Person Household | 1 (100.0%) | 0 (0.0%) |
| 2-Person Household | 3 (100.0%) | 0 (0.0%) |
| 3-Person Household | 0 (0.0%) | 1 (100.0%) |
| 4+ Person Household | 11 (100.0%) | 0 (0.0%) |
| Total Housing Units | 15 (93.8%) | 1 (6.2%) |
Occupancy by Educational Attainment in Avilla
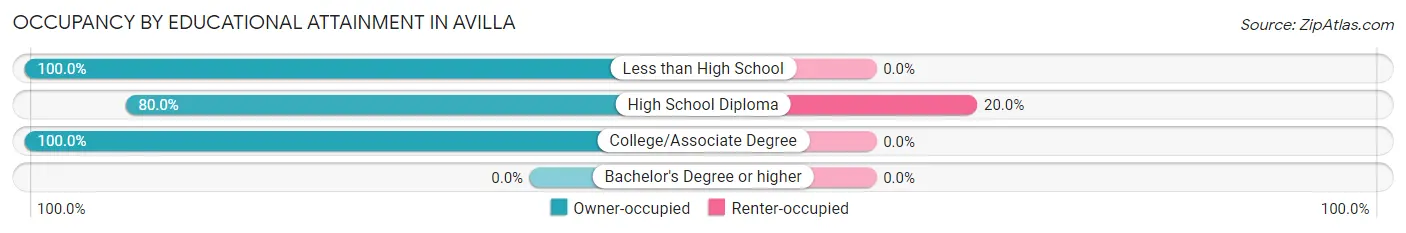
| Household Size | Owner-occupied | Renter-occupied |
| Less than High School | 6 (100.0%) | 0 (0.0%) |
| High School Diploma | 4 (80.0%) | 1 (20.0%) |
| College/Associate Degree | 5 (100.0%) | 0 (0.0%) |
| Bachelor's Degree or higher | 0 (0.0%) | 0 (0.0%) |
Occupancy by Age of Householder in Avilla
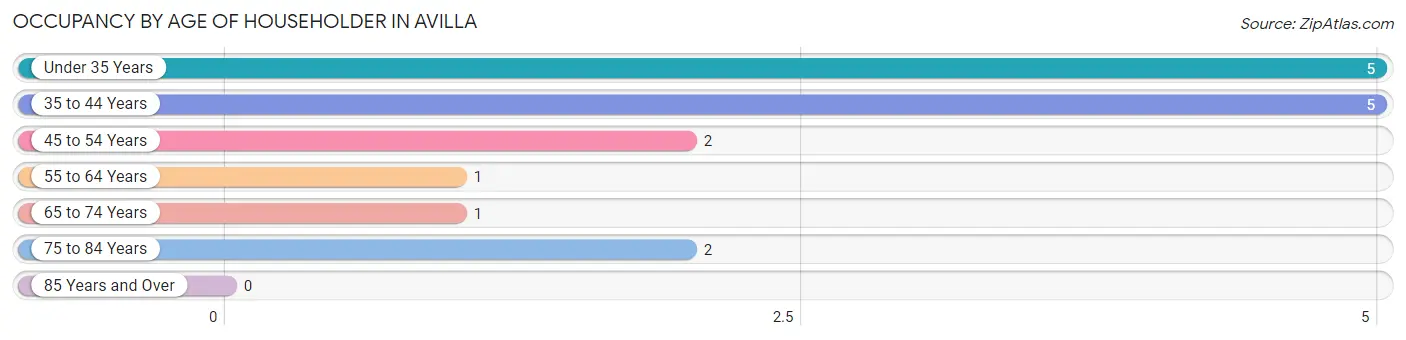
| Age Bracket | # Households | % Households |
| Under 35 Years | 5 | 31.2% |
| 35 to 44 Years | 5 | 31.2% |
| 45 to 54 Years | 2 | 12.5% |
| 55 to 64 Years | 1 | 6.2% |
| 65 to 74 Years | 1 | 6.2% |
| 75 to 84 Years | 2 | 12.5% |
| 85 Years and Over | 0 | 0.0% |
| Total | 16 | 100.0% |
Housing Finances in Avilla
Median Income by Occupancy in Avilla
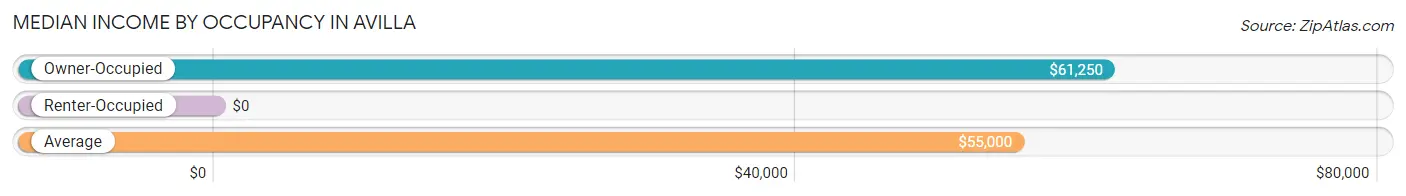
| Occupancy Type | # Households | Median Income |
| Owner-Occupied | 15 (93.8%) | $61,250 |
| Renter-Occupied | 1 (6.2%) | $0 |
| Average | 16 (100.0%) | $55,000 |
Occupancy by Householder Income Bracket in Avilla
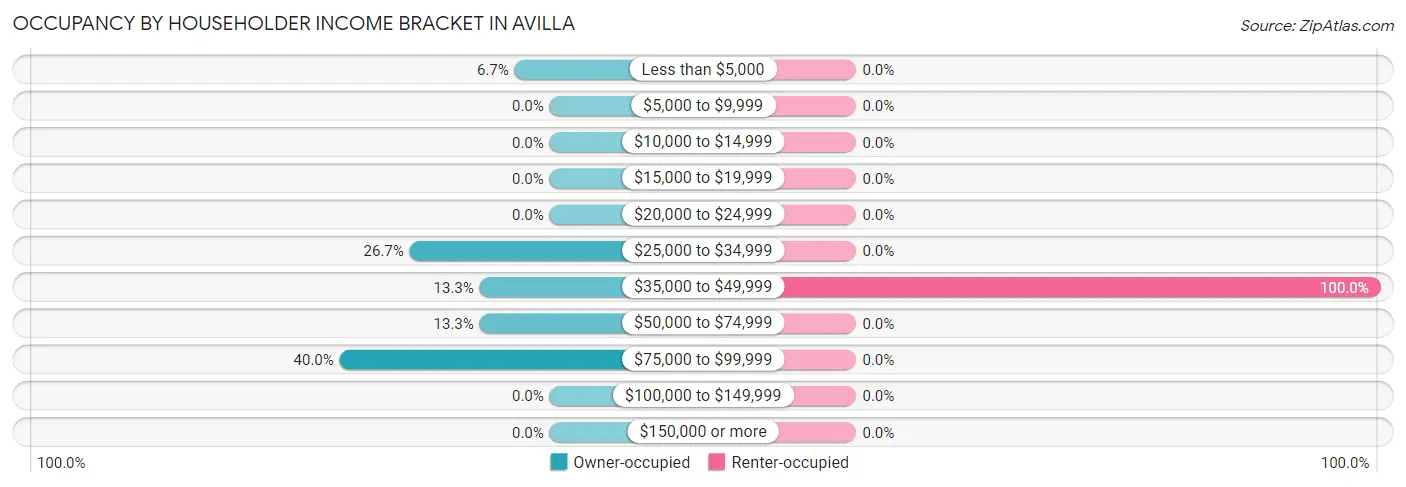
| Income Bracket | Owner-occupied | Renter-occupied |
| Less than $5,000 | 1 (6.7%) | 0 (0.0%) |
| $5,000 to $9,999 | 0 (0.0%) | 0 (0.0%) |
| $10,000 to $14,999 | 0 (0.0%) | 0 (0.0%) |
| $15,000 to $19,999 | 0 (0.0%) | 0 (0.0%) |
| $20,000 to $24,999 | 0 (0.0%) | 0 (0.0%) |
| $25,000 to $34,999 | 4 (26.7%) | 0 (0.0%) |
| $35,000 to $49,999 | 2 (13.3%) | 1 (100.0%) |
| $50,000 to $74,999 | 2 (13.3%) | 0 (0.0%) |
| $75,000 to $99,999 | 6 (40.0%) | 0 (0.0%) |
| $100,000 to $149,999 | 0 (0.0%) | 0 (0.0%) |
| $150,000 or more | 0 (0.0%) | 0 (0.0%) |
| Total | 15 (100.0%) | 1 (100.0%) |
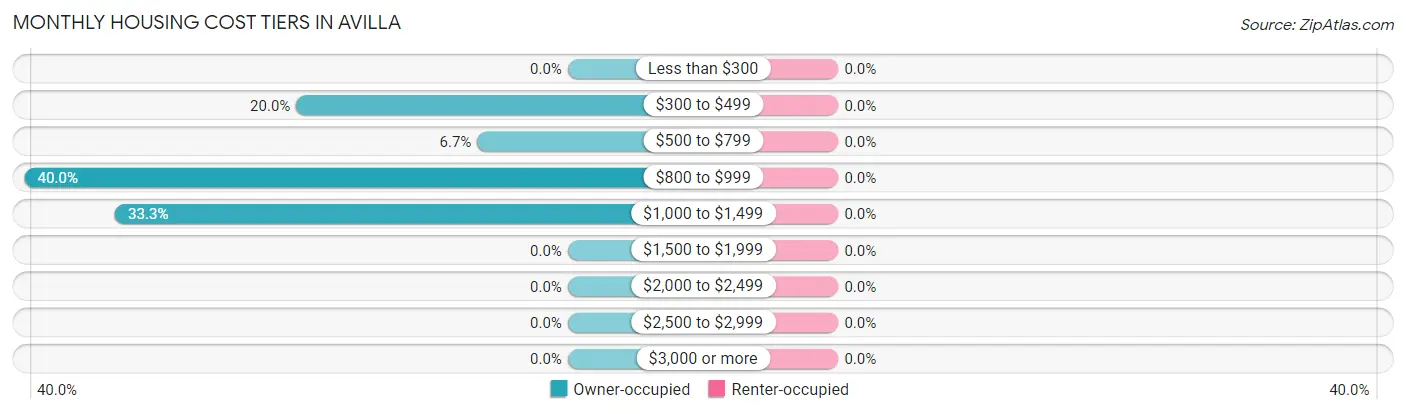
Monthly Housing Cost Tiers in Avilla
| Monthly Cost | Owner-occupied | Renter-occupied |
| Less than $300 | 0 (0.0%) | 0 (0.0%) |
| $300 to $499 | 3 (20.0%) | 0 (0.0%) |
| $500 to $799 | 1 (6.7%) | 0 (0.0%) |
| $800 to $999 | 6 (40.0%) | 0 (0.0%) |
| $1,000 to $1,499 | 5 (33.3%) | 0 (0.0%) |
| $1,500 to $1,999 | 0 (0.0%) | 0 (0.0%) |
| $2,000 to $2,499 | 0 (0.0%) | 0 (0.0%) |
| $2,500 to $2,999 | 0 (0.0%) | 0 (0.0%) |
| $3,000 or more | 0 (0.0%) | 0 (0.0%) |
| Total | 15 (100.0%) | 1 (100.0%) |
Physical Housing Characteristics in Avilla
Housing Structures in Avilla
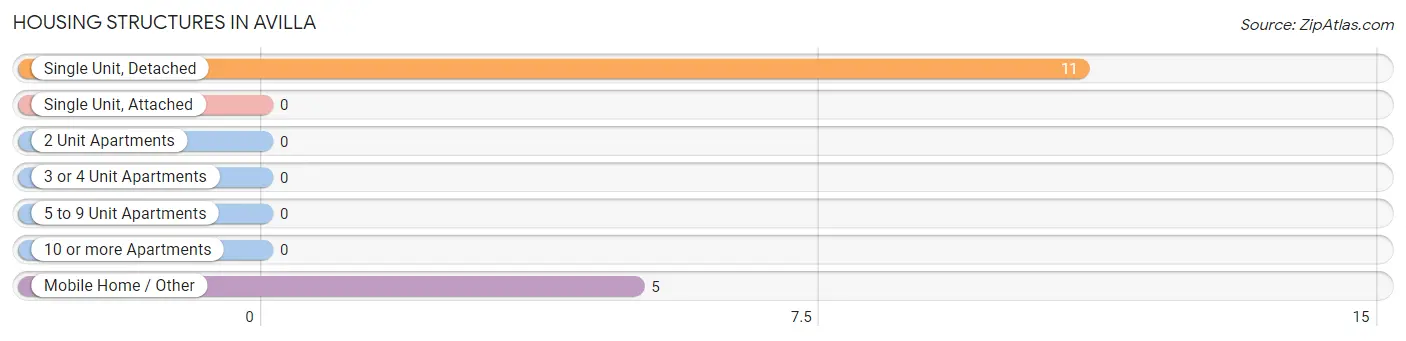
| Structure Type | # Housing Units | % Housing Units |
| Single Unit, Detached | 11 | 68.8% |
| Single Unit, Attached | 0 | 0.0% |
| 2 Unit Apartments | 0 | 0.0% |
| 3 or 4 Unit Apartments | 0 | 0.0% |
| 5 to 9 Unit Apartments | 0 | 0.0% |
| 10 or more Apartments | 0 | 0.0% |
| Mobile Home / Other | 5 | 31.2% |
| Total | 16 | 100.0% |
Housing Structures by Occupancy in Avilla
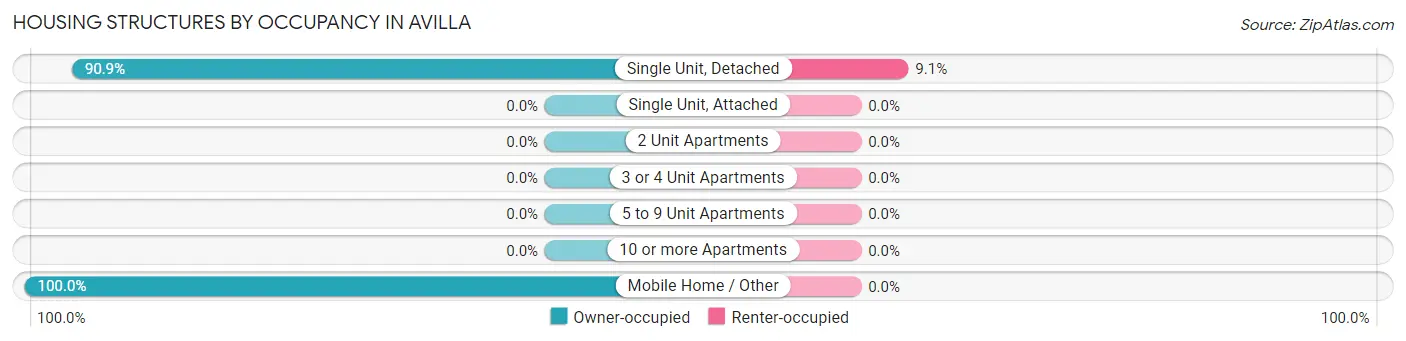
| Structure Type | Owner-occupied | Renter-occupied |
| Single Unit, Detached | 10 (90.9%) | 1 (9.1%) |
| Single Unit, Attached | 0 (0.0%) | 0 (0.0%) |
| 2 Unit Apartments | 0 (0.0%) | 0 (0.0%) |
| 3 or 4 Unit Apartments | 0 (0.0%) | 0 (0.0%) |
| 5 to 9 Unit Apartments | 0 (0.0%) | 0 (0.0%) |
| 10 or more Apartments | 0 (0.0%) | 0 (0.0%) |
| Mobile Home / Other | 5 (100.0%) | 0 (0.0%) |
| Total | 15 (93.8%) | 1 (6.2%) |
Housing Structures by Number of Rooms in Avilla
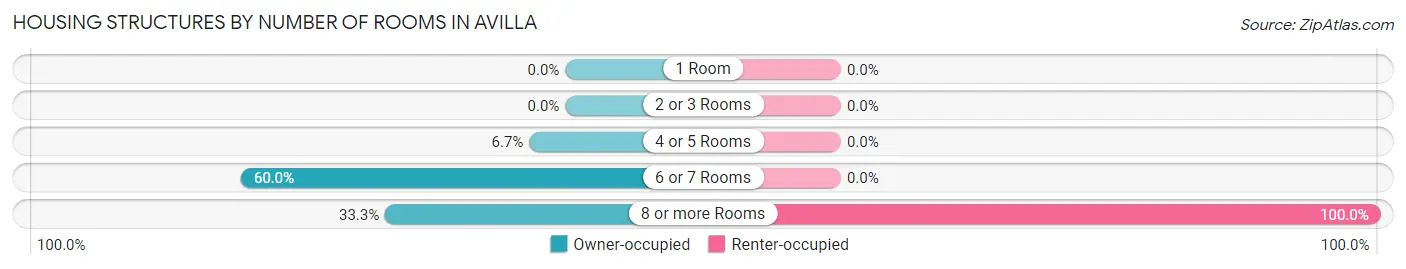
| Number of Rooms | Owner-occupied | Renter-occupied |
| 1 Room | 0 (0.0%) | 0 (0.0%) |
| 2 or 3 Rooms | 0 (0.0%) | 0 (0.0%) |
| 4 or 5 Rooms | 1 (6.7%) | 0 (0.0%) |
| 6 or 7 Rooms | 9 (60.0%) | 0 (0.0%) |
| 8 or more Rooms | 5 (33.3%) | 1 (100.0%) |
| Total | 15 (100.0%) | 1 (100.0%) |
Housing Structure by Heating Type in Avilla
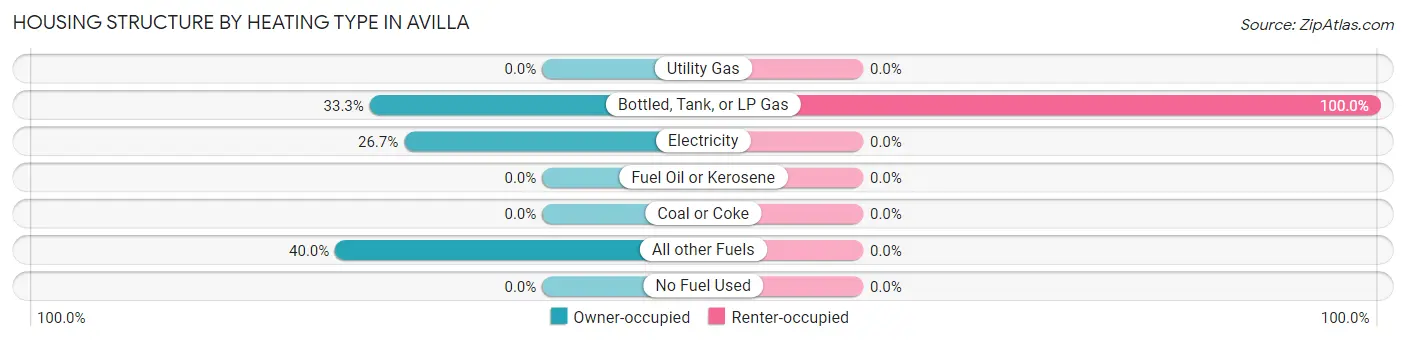
| Heating Type | Owner-occupied | Renter-occupied |
| Utility Gas | 0 (0.0%) | 0 (0.0%) |
| Bottled, Tank, or LP Gas | 5 (33.3%) | 1 (100.0%) |
| Electricity | 4 (26.7%) | 0 (0.0%) |
| Fuel Oil or Kerosene | 0 (0.0%) | 0 (0.0%) |
| Coal or Coke | 0 (0.0%) | 0 (0.0%) |
| All other Fuels | 6 (40.0%) | 0 (0.0%) |
| No Fuel Used | 0 (0.0%) | 0 (0.0%) |
| Total | 15 (100.0%) | 1 (100.0%) |
Household Vehicle Usage in Avilla
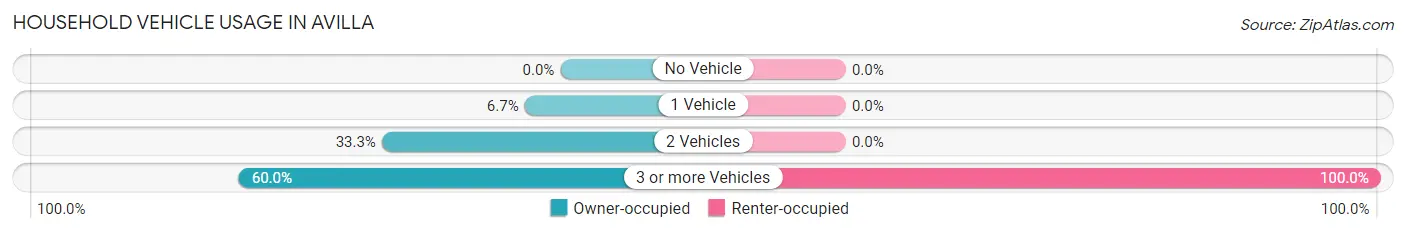
| Vehicles per Household | Owner-occupied | Renter-occupied |
| No Vehicle | 0 (0.0%) | 0 (0.0%) |
| 1 Vehicle | 1 (6.7%) | 0 (0.0%) |
| 2 Vehicles | 5 (33.3%) | 0 (0.0%) |
| 3 or more Vehicles | 9 (60.0%) | 1 (100.0%) |
| Total | 15 (100.0%) | 1 (100.0%) |
Real Estate & Mortgages in Avilla
Real Estate and Mortgage Overview in Avilla
| Characteristic | Without Mortgage | With Mortgage |
| Housing Units | 5 | 10 |
| Median Property Value | - | - |
| Median Household Income | $61,250 | $0 |
| Monthly Housing Costs | $342 | $0 |
| Real Estate Taxes | $500 | $0 |
Property Value by Mortgage Status in Avilla
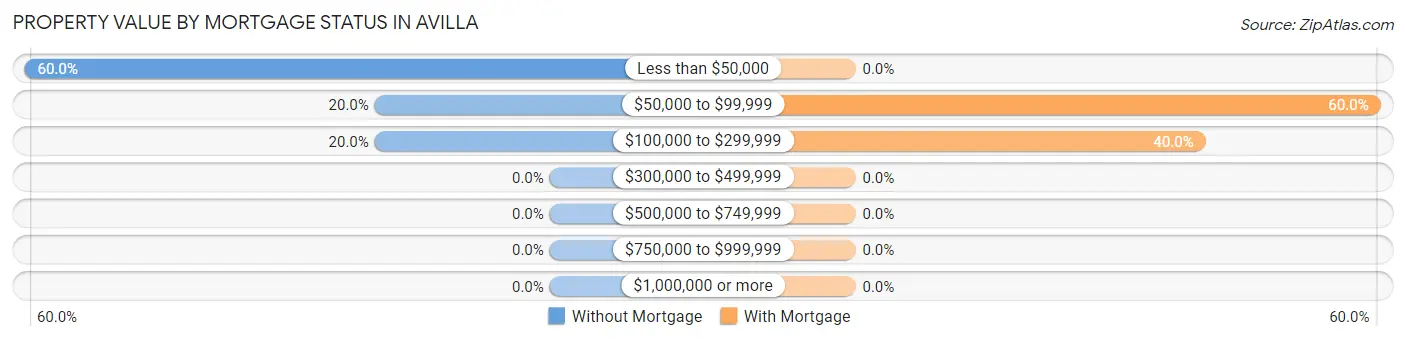
| Property Value | Without Mortgage | With Mortgage |
| Less than $50,000 | 3 (60.0%) | 0 (0.0%) |
| $50,000 to $99,999 | 1 (20.0%) | 6 (60.0%) |
| $100,000 to $299,999 | 1 (20.0%) | 4 (40.0%) |
| $300,000 to $499,999 | 0 (0.0%) | 0 (0.0%) |
| $500,000 to $749,999 | 0 (0.0%) | 0 (0.0%) |
| $750,000 to $999,999 | 0 (0.0%) | 0 (0.0%) |
| $1,000,000 or more | 0 (0.0%) | 0 (0.0%) |
| Total | 5 (100.0%) | 10 (100.0%) |
Household Income by Mortgage Status in Avilla
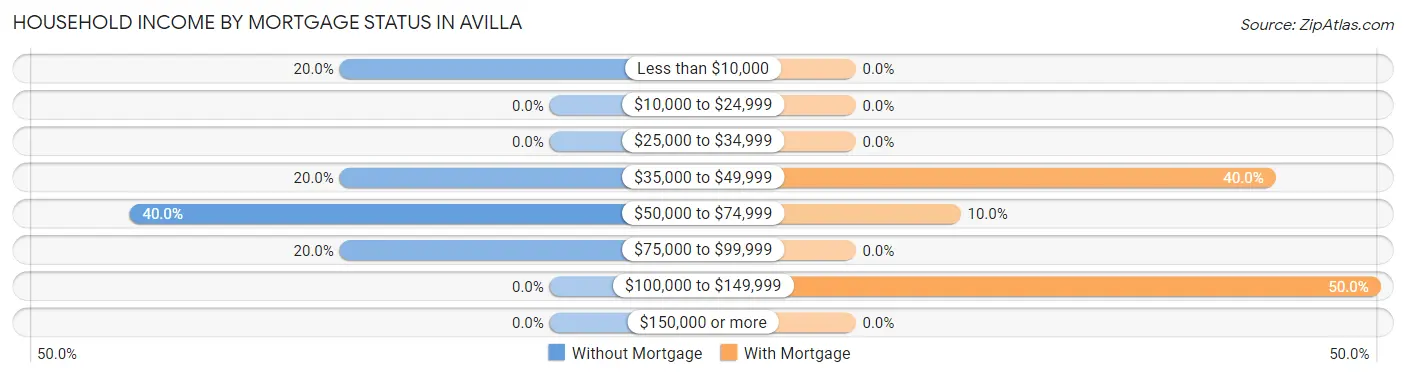
| Household Income | Without Mortgage | With Mortgage |
| Less than $10,000 | 1 (20.0%) | 0 (0.0%) |
| $10,000 to $24,999 | 0 (0.0%) | 0 (0.0%) |
| $25,000 to $34,999 | 0 (0.0%) | 0 (0.0%) |
| $35,000 to $49,999 | 1 (20.0%) | 4 (40.0%) |
| $50,000 to $74,999 | 2 (40.0%) | 1 (10.0%) |
| $75,000 to $99,999 | 1 (20.0%) | 0 (0.0%) |
| $100,000 to $149,999 | 0 (0.0%) | 5 (50.0%) |
| $150,000 or more | 0 (0.0%) | 0 (0.0%) |
| Total | 5 (100.0%) | 10 (100.0%) |
Property Value to Household Income Ratio in Avilla
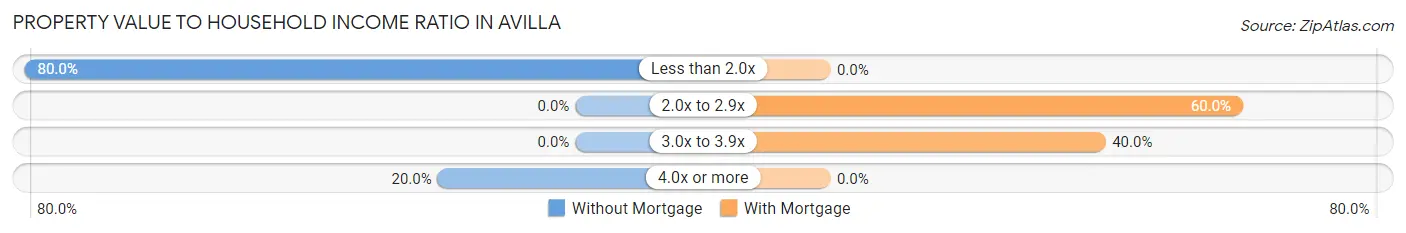
| Value-to-Income Ratio | Without Mortgage | With Mortgage |
| Less than 2.0x | 4 (80.0%) | 0 (0.0%) |
| 2.0x to 2.9x | 0 (0.0%) | 6 (60.0%) |
| 3.0x to 3.9x | 0 (0.0%) | 4 (40.0%) |
| 4.0x or more | 1 (20.0%) | 0 (0.0%) |
| Total | 5 (100.0%) | 10 (100.0%) |
Real Estate Taxes by Mortgage Status in Avilla
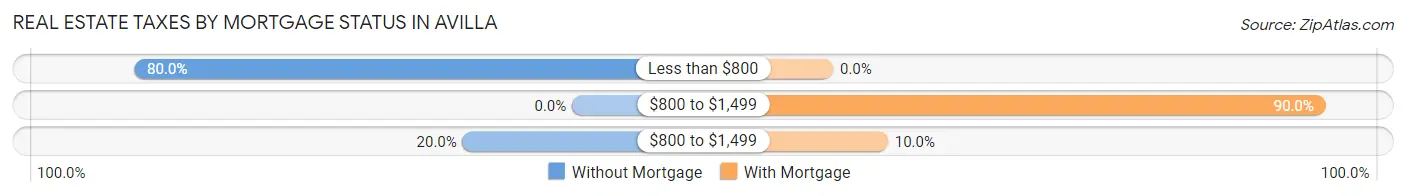
| Property Taxes | Without Mortgage | With Mortgage |
| Less than $800 | 4 (80.0%) | 0 (0.0%) |
| $800 to $1,499 | 0 (0.0%) | 9 (90.0%) |
| $800 to $1,499 | 1 (20.0%) | 1 (10.0%) |
| Total | 5 (100.0%) | 10 (100.0%) |
Health & Disability in Avilla
Health Insurance Coverage by Age in Avilla
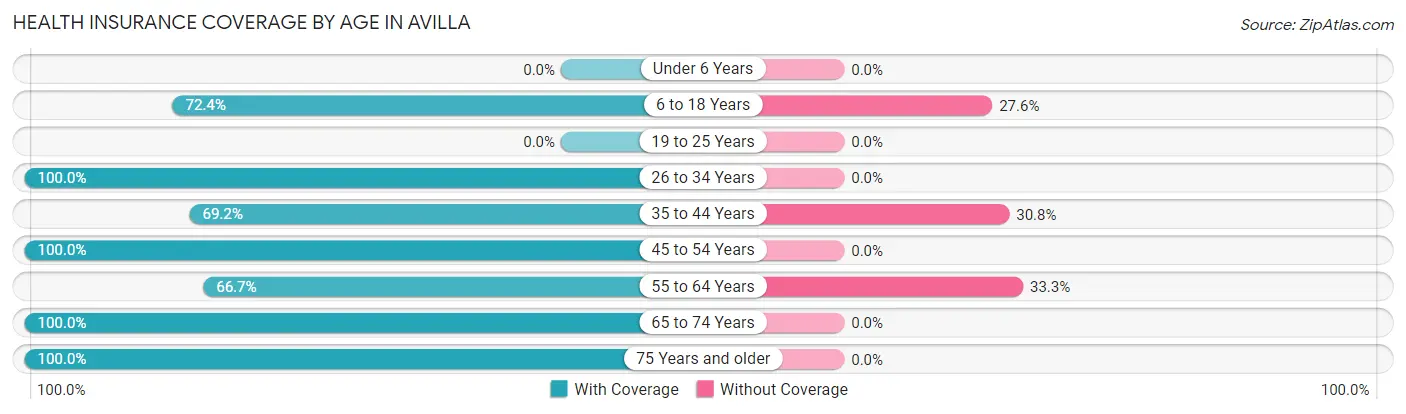
| Age Bracket | With Coverage | Without Coverage |
| Under 6 Years | 0 (0.0%) | 0 (0.0%) |
| 6 to 18 Years | 21 (72.4%) | 8 (27.6%) |
| 19 to 25 Years | 0 (0.0%) | 0 (0.0%) |
| 26 to 34 Years | 8 (100.0%) | 0 (0.0%) |
| 35 to 44 Years | 9 (69.2%) | 4 (30.8%) |
| 45 to 54 Years | 5 (100.0%) | 0 (0.0%) |
| 55 to 64 Years | 2 (66.7%) | 1 (33.3%) |
| 65 to 74 Years | 3 (100.0%) | 0 (0.0%) |
| 75 Years and older | 4 (100.0%) | 0 (0.0%) |
| Total | 52 (80.0%) | 13 (20.0%) |
Health Insurance Coverage by Citizenship Status in Avilla
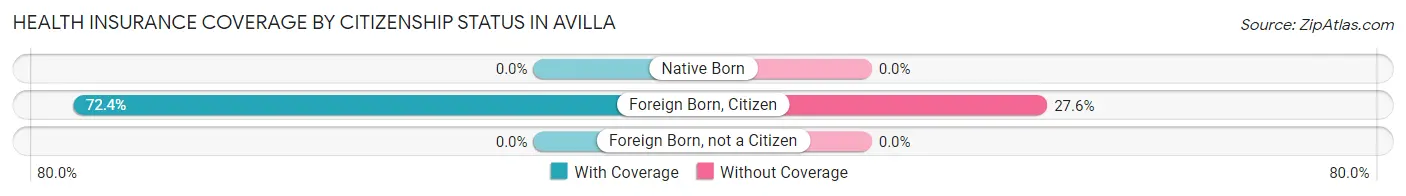
| Citizenship Status | With Coverage | Without Coverage |
| Native Born | 0 (0.0%) | 0 (0.0%) |
| Foreign Born, Citizen | 21 (72.4%) | 8 (27.6%) |
| Foreign Born, not a Citizen | 0 (0.0%) | 0 (0.0%) |
Health Insurance Coverage by Household Income in Avilla
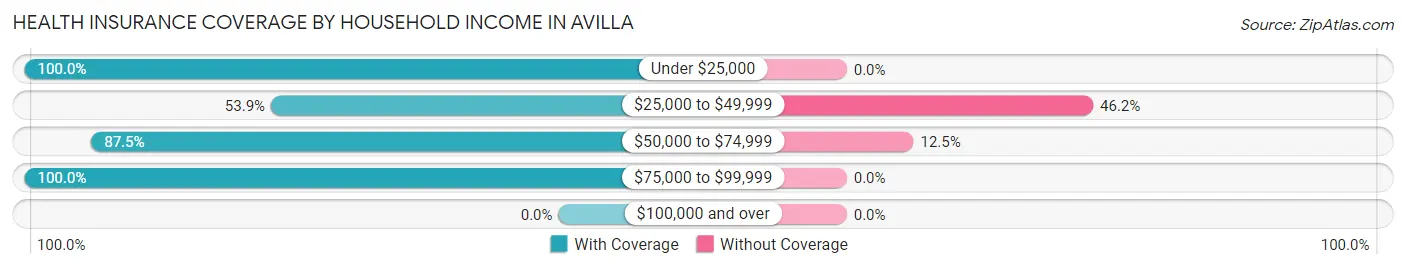
| Household Income | With Coverage | Without Coverage |
| Under $25,000 | 1 (100.0%) | 0 (0.0%) |
| $25,000 to $49,999 | 14 (53.8%) | 12 (46.2%) |
| $50,000 to $74,999 | 7 (87.5%) | 1 (12.5%) |
| $75,000 to $99,999 | 30 (100.0%) | 0 (0.0%) |
| $100,000 and over | 0 (0.0%) | 0 (0.0%) |
Public vs Private Health Insurance Coverage by Age in Avilla
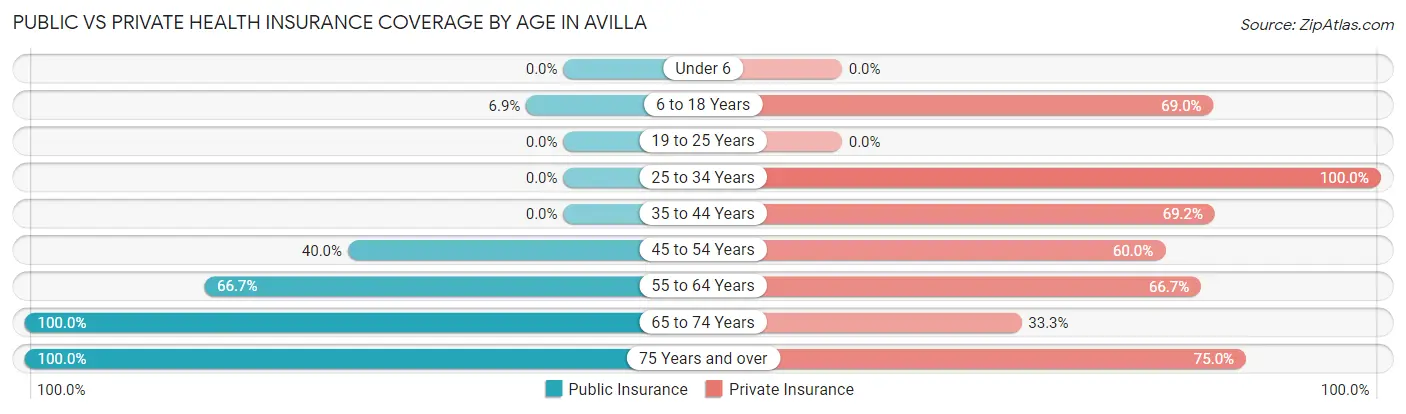
| Age Bracket | Public Insurance | Private Insurance |
| Under 6 | 0 (0.0%) | 0 (0.0%) |
| 6 to 18 Years | 2 (6.9%) | 20 (69.0%) |
| 19 to 25 Years | 0 (0.0%) | 0 (0.0%) |
| 25 to 34 Years | 0 (0.0%) | 8 (100.0%) |
| 35 to 44 Years | 0 (0.0%) | 9 (69.2%) |
| 45 to 54 Years | 2 (40.0%) | 3 (60.0%) |
| 55 to 64 Years | 2 (66.7%) | 2 (66.7%) |
| 65 to 74 Years | 3 (100.0%) | 1 (33.3%) |
| 75 Years and over | 4 (100.0%) | 3 (75.0%) |
| Total | 13 (20.0%) | 46 (70.8%) |
Disability Status by Sex by Age in Avilla
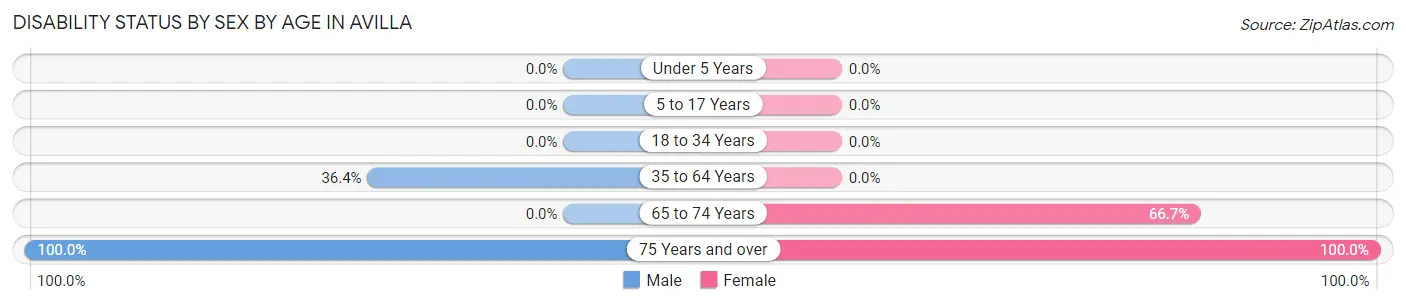
| Age Bracket | Male | Female |
| Under 5 Years | 0 (0.0%) | 0 (0.0%) |
| 5 to 17 Years | 0 (0.0%) | 0 (0.0%) |
| 18 to 34 Years | 0 (0.0%) | 0 (0.0%) |
| 35 to 64 Years | 4 (36.4%) | 0 (0.0%) |
| 65 to 74 Years | 0 (0.0%) | 2 (66.7%) |
| 75 Years and over | 2 (100.0%) | 2 (100.0%) |
Disability Class by Sex by Age in Avilla
Disability Class: Hearing Difficulty
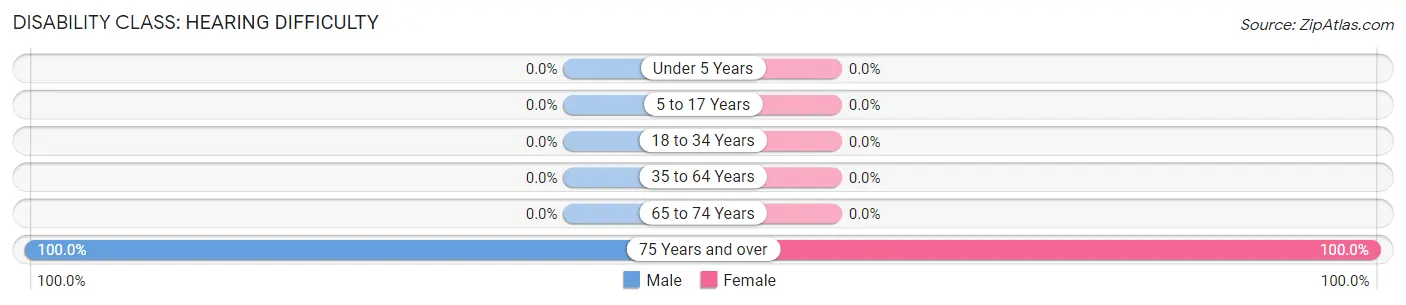
| Age Bracket | Male | Female |
| Under 5 Years | 0 (0.0%) | 0 (0.0%) |
| 5 to 17 Years | 0 (0.0%) | 0 (0.0%) |
| 18 to 34 Years | 0 (0.0%) | 0 (0.0%) |
| 35 to 64 Years | 0 (0.0%) | 0 (0.0%) |
| 65 to 74 Years | 0 (0.0%) | 0 (0.0%) |
| 75 Years and over | 2 (100.0%) | 2 (100.0%) |
Disability Class: Vision Difficulty
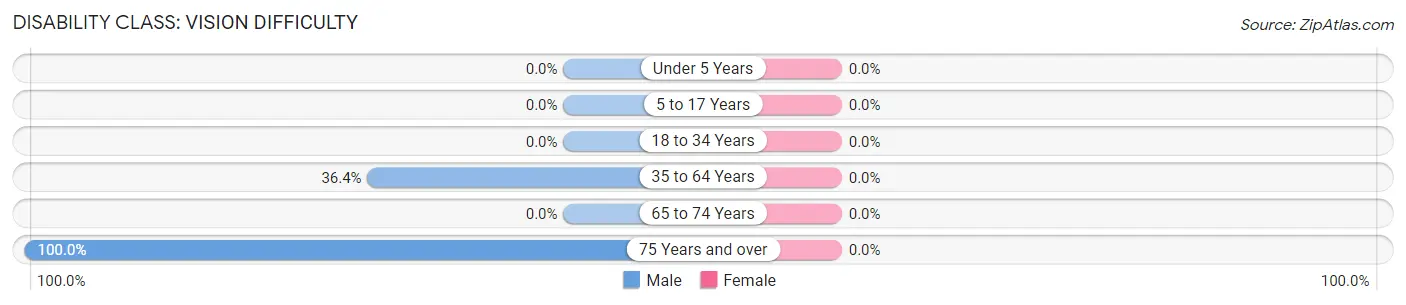
| Age Bracket | Male | Female |
| Under 5 Years | 0 (0.0%) | 0 (0.0%) |
| 5 to 17 Years | 0 (0.0%) | 0 (0.0%) |
| 18 to 34 Years | 0 (0.0%) | 0 (0.0%) |
| 35 to 64 Years | 4 (36.4%) | 0 (0.0%) |
| 65 to 74 Years | 0 (0.0%) | 0 (0.0%) |
| 75 Years and over | 2 (100.0%) | 0 (0.0%) |
Disability Class: Cognitive Difficulty
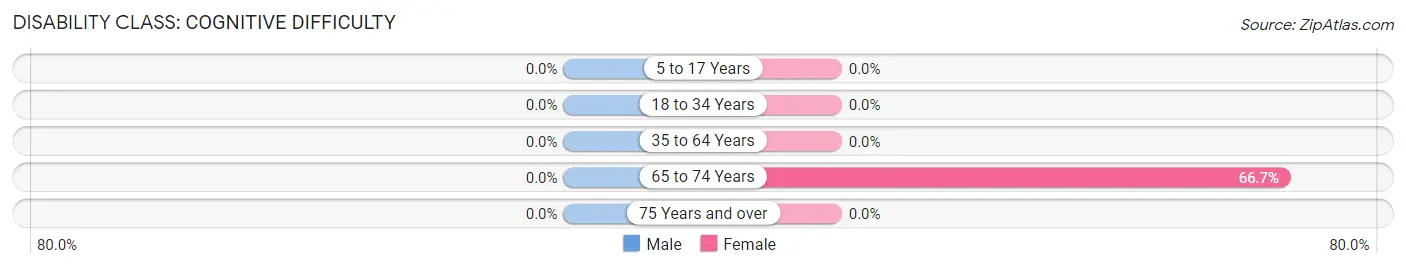
| Age Bracket | Male | Female |
| 5 to 17 Years | 0 (0.0%) | 0 (0.0%) |
| 18 to 34 Years | 0 (0.0%) | 0 (0.0%) |
| 35 to 64 Years | 0 (0.0%) | 0 (0.0%) |
| 65 to 74 Years | 0 (0.0%) | 2 (66.7%) |
| 75 Years and over | 0 (0.0%) | 0 (0.0%) |
Disability Class: Ambulatory Difficulty
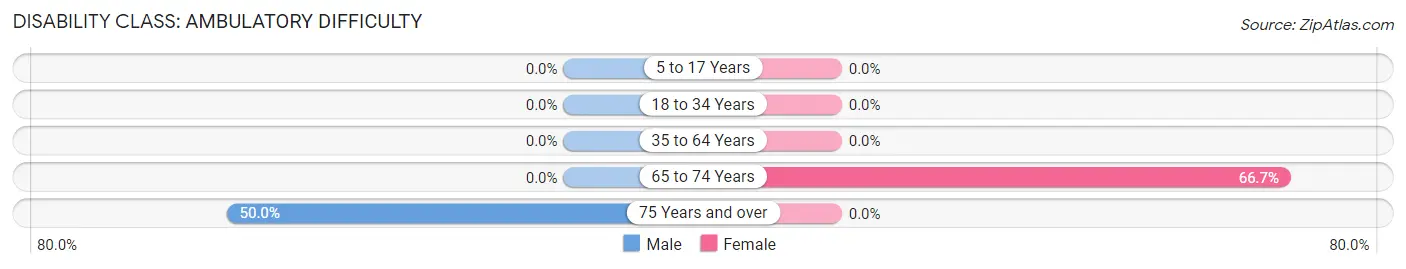
| Age Bracket | Male | Female |
| 5 to 17 Years | 0 (0.0%) | 0 (0.0%) |
| 18 to 34 Years | 0 (0.0%) | 0 (0.0%) |
| 35 to 64 Years | 0 (0.0%) | 0 (0.0%) |
| 65 to 74 Years | 0 (0.0%) | 2 (66.7%) |
| 75 Years and over | 1 (50.0%) | 0 (0.0%) |
Disability Class: Self-Care Difficulty
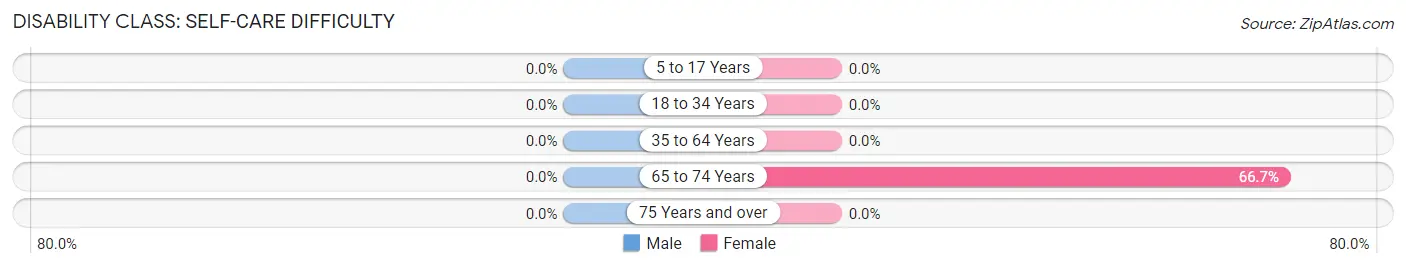
| Age Bracket | Male | Female |
| 5 to 17 Years | 0 (0.0%) | 0 (0.0%) |
| 18 to 34 Years | 0 (0.0%) | 0 (0.0%) |
| 35 to 64 Years | 0 (0.0%) | 0 (0.0%) |
| 65 to 74 Years | 0 (0.0%) | 2 (66.7%) |
| 75 Years and over | 0 (0.0%) | 0 (0.0%) |
Technology Access in Avilla
Computing Device Access in Avilla
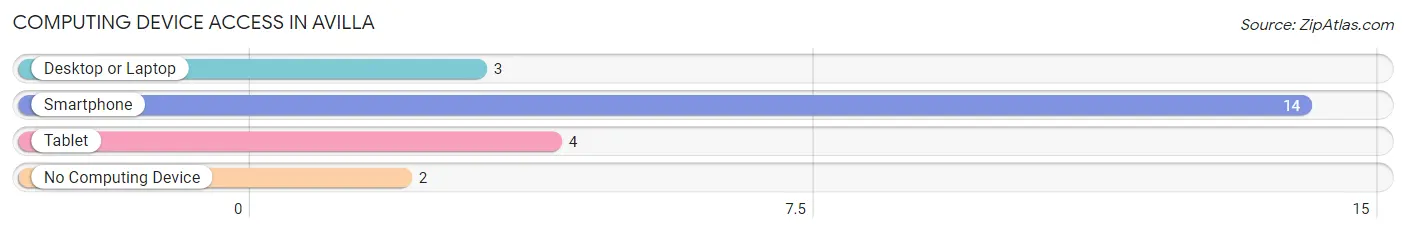
| Device Type | # Households | % Households |
| Desktop or Laptop | 3 | 18.8% |
| Smartphone | 14 | 87.5% |
| Tablet | 4 | 25.0% |
| No Computing Device | 2 | 12.5% |
| Total | 16 | 100.0% |
Internet Access in Avilla
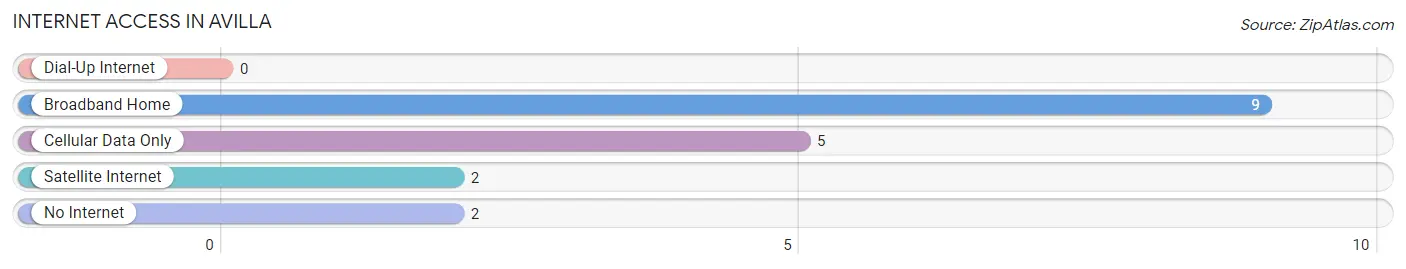
| Internet Type | # Households | % Households |
| Dial-Up Internet | 0 | 0.0% |
| Broadband Home | 9 | 56.2% |
| Cellular Data Only | 5 | 31.2% |
| Satellite Internet | 2 | 12.5% |
| No Internet | 2 | 12.5% |
| Total | 16 | 100.0% |
Avilla Summary
Avilla, Missouri is a small town located in the Ozark Mountains of southwest Missouri. It is situated in the heart of the Ozark National Scenic Riverways, a protected area of the Ozark Mountains. The town is located in Taney County, and is part of the Branson, Missouri metropolitan area. The population of Avilla was estimated to be 1,072 in 2020.
History
Avilla was founded in 1883 by a group of settlers from the nearby town of Forsyth. The town was named after the Avilla family, who were among the first settlers in the area. The town was originally a farming community, and the main crops grown were corn, wheat, and oats. In the early 1900s, the town began to grow as a tourist destination, with the opening of several resorts and hotels.
In the 1950s, the town began to experience a decline in population as people moved away to larger cities. However, in the late 1970s, the town began to experience a resurgence in popularity as a tourist destination. This was due to the opening of Silver Dollar City, a theme park located just outside of town. The park has since become one of the most popular attractions in the area, and has helped to revitalize the town.
Geography
Avilla is located in the Ozark Mountains of southwest Missouri. The town is situated in the heart of the Ozark National Scenic Riverways, a protected area of the Ozark Mountains. The town is located in Taney County, and is part of the Branson, Missouri metropolitan area. The town is located at an elevation of 1,072 feet above sea level.
The town is located near several bodies of water, including the White River, Table Rock Lake, and Bull Shoals Lake. The town is also located near several state parks, including the Mark Twain National Forest, the Ozark National Scenic Riverways, and the Table Rock State Park.
Economy
Avilla’s economy is largely based on tourism. The town is home to several resorts and hotels, as well as Silver Dollar City, a popular theme park. The town is also home to several restaurants, shops, and other businesses.
The town is also home to several manufacturing companies, including a furniture factory and a plastics factory. The town is also home to several farms, which produce corn, wheat, and oats.
Demographics
As of 2020, the population of Avilla was estimated to be 1,072. The town has a median age of 44.7 years, and a median household income of $41,944. The town is predominantly white, with 91.2% of the population identifying as white. The town also has a small Hispanic population, with 4.2% of the population identifying as Hispanic or Latino.
Avilla is a small town with a rich history and a vibrant economy. The town is home to several resorts and hotels, as well as Silver Dollar City, a popular theme park. The town is also home to several manufacturing companies, farms, and other businesses. The town has a diverse population, with a median age of 44.7 years and a median household income of $41,944. Avilla is a great place to live, work, and visit.
Common Questions
What is Per Capita Income in Avilla?
Per Capita income in Avilla is $15,714.
What is the Median Family Income in Avilla?
Median Family Income in Avilla is $61,250.
What is the Median Household income in Avilla?
Median Household Income in Avilla is $55,000.
What is Inequality or Gini Index in Avilla?
Inequality or Gini Index in Avilla is 0.29.
What is the Total Population of Avilla?
Total Population of Avilla is 65.
What is the Total Male Population of Avilla?
Total Male Population of Avilla is 28.
What is the Total Female Population of Avilla?
Total Female Population of Avilla is 37.
What is the Ratio of Males per 100 Females in Avilla?
There are 75.68 Males per 100 Females in Avilla.
What is the Ratio of Females per 100 Males in Avilla?
There are 132.14 Females per 100 Males in Avilla.
What is the Median Population Age in Avilla?
Median Population Age in Avilla is 33.5 Years.
What is the Average Family Size in Avilla
Average Family Size in Avilla is 4.0 People.
What is the Average Household Size in Avilla
Average Household Size in Avilla is 4.1 People.
How Large is the Labor Force in Avilla?
There are 30 People in the Labor Forcein in Avilla.
What is the Percentage of People in the Labor Force in Avilla?
75.0% of People are in the Labor Force in Avilla.
What is the Unemployment Rate in Avilla?
Unemployment Rate in Avilla is 13.3%.