Zip Codes with the Highest Percentage of Population Employed in Food Preparation & Serving in Lees Summit, MO
RELATED REPORTS & OPTIONS
Food Preparation & Serving
Lees Summit
Compare Zip Codes
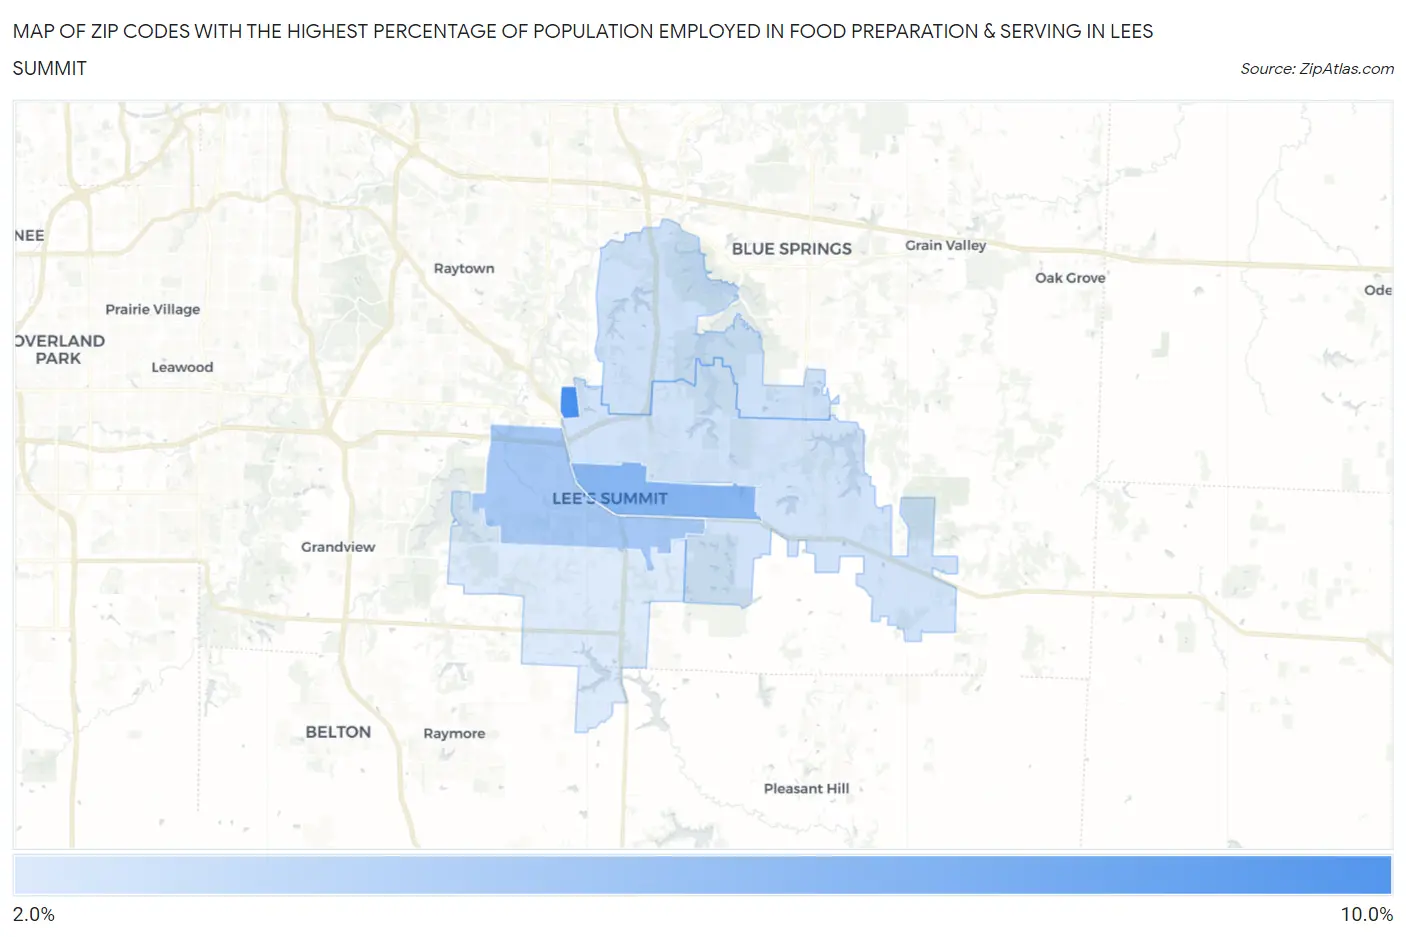
Map of Zip Codes with the Highest Percentage of Population Employed in Food Preparation & Serving in Lees Summit
2.8%
8.3%
Zip Codes with the Highest Percentage of Population Employed in Food Preparation & Serving in Lees Summit, MO
| Zip Code | % Employed | vs State | vs National | |
| 1. | 64065 | 8.3% | 5.2%(+3.10)#142 | 5.3%(+3.05)#4,278 |
| 2. | 64063 | 5.9% | 5.2%(+0.653)#303 | 5.3%(+0.603)#9,723 |
| 3. | 64081 | 4.8% | 5.2%(-0.474)#411 | 5.3%(-0.524)#13,902 |
| 4. | 64064 | 3.3% | 5.2%(-1.96)#597 | 5.3%(-2.01)#20,153 |
| 5. | 64086 | 3.2% | 5.2%(-2.04)#608 | 5.3%(-2.09)#20,493 |
| 6. | 64082 | 2.8% | 5.2%(-2.46)#657 | 5.3%(-2.51)#22,162 |
1
Common Questions
What are the Top 5 Zip Codes with the Highest Percentage of Population Employed in Food Preparation & Serving in Lees Summit, MO?
Top 5 Zip Codes with the Highest Percentage of Population Employed in Food Preparation & Serving in Lees Summit, MO are:
What zip code has the Highest Percentage of Population Employed in Food Preparation & Serving in Lees Summit, MO?
64065 has the Highest Percentage of Population Employed in Food Preparation & Serving in Lees Summit, MO with 8.3%.
What is the Percentage of Population Employed in Food Preparation & Serving in Missouri?
Percentage of Population Employed in Food Preparation & Serving in Missouri is 5.2%.
What is the Percentage of Population Employed in Food Preparation & Serving in the United States?
Percentage of Population Employed in Food Preparation & Serving in the United States is 5.3%.