Haywood City, MO Map & Demographics
Haywood City Map
Haywood City Overview
$21,810
PER CAPITA INCOME
$24,167
AVG FAMILY INCOME
$31,042
AVG HOUSEHOLD INCOME
0.47
INEQUALITY / GINI INDEX
172
TOTAL POPULATION
86
MALE POPULATION
86
FEMALE POPULATION
100.00
MALES / 100 FEMALES
100.00
FEMALES / 100 MALES
33.1
MEDIAN AGE
3.5
AVG FAMILY SIZE
2.8
AVG HOUSEHOLD SIZE
70
LABOR FORCE [ PEOPLE ]
54.3%
PERCENT IN LABOR FORCE
Income in Haywood City
Income Overview in Haywood City
Per Capita Income in Haywood City is $21,810, while median incomes of families and households are $24,167 and $31,042 respectively.
| Characteristic | Number | Measure |
| Per Capita Income | 172 | $21,810 |
| Median Family Income | 38 | $24,167 |
| Mean Family Income | 38 | $42,779 |
| Median Household Income | 61 | $31,042 |
| Mean Household Income | 61 | $45,997 |
| Income Deficit | 38 | $0 |
| Wage / Income Gap (%) | 172 | 0.00% |
| Wage / Income Gap ($) | 172 | 100.00¢ per $1 |
| Gini / Inequality Index | 172 | 0.47 |
Earnings by Sex in Haywood City
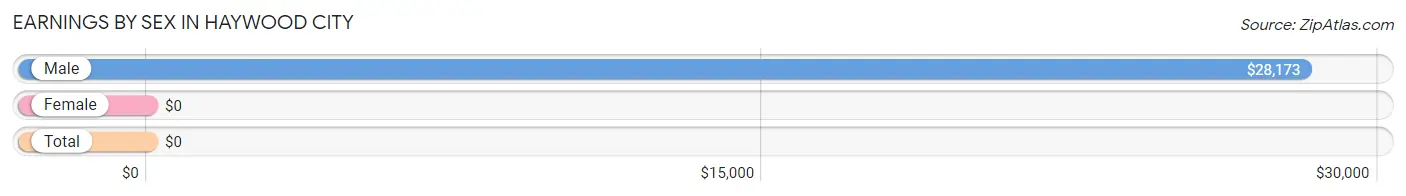
| Sex | Number | Average Earnings |
| Male | 23 (30.3%) | $28,173 |
| Female | 53 (69.7%) | $0 |
| Total | 76 (100.0%) | $0 |
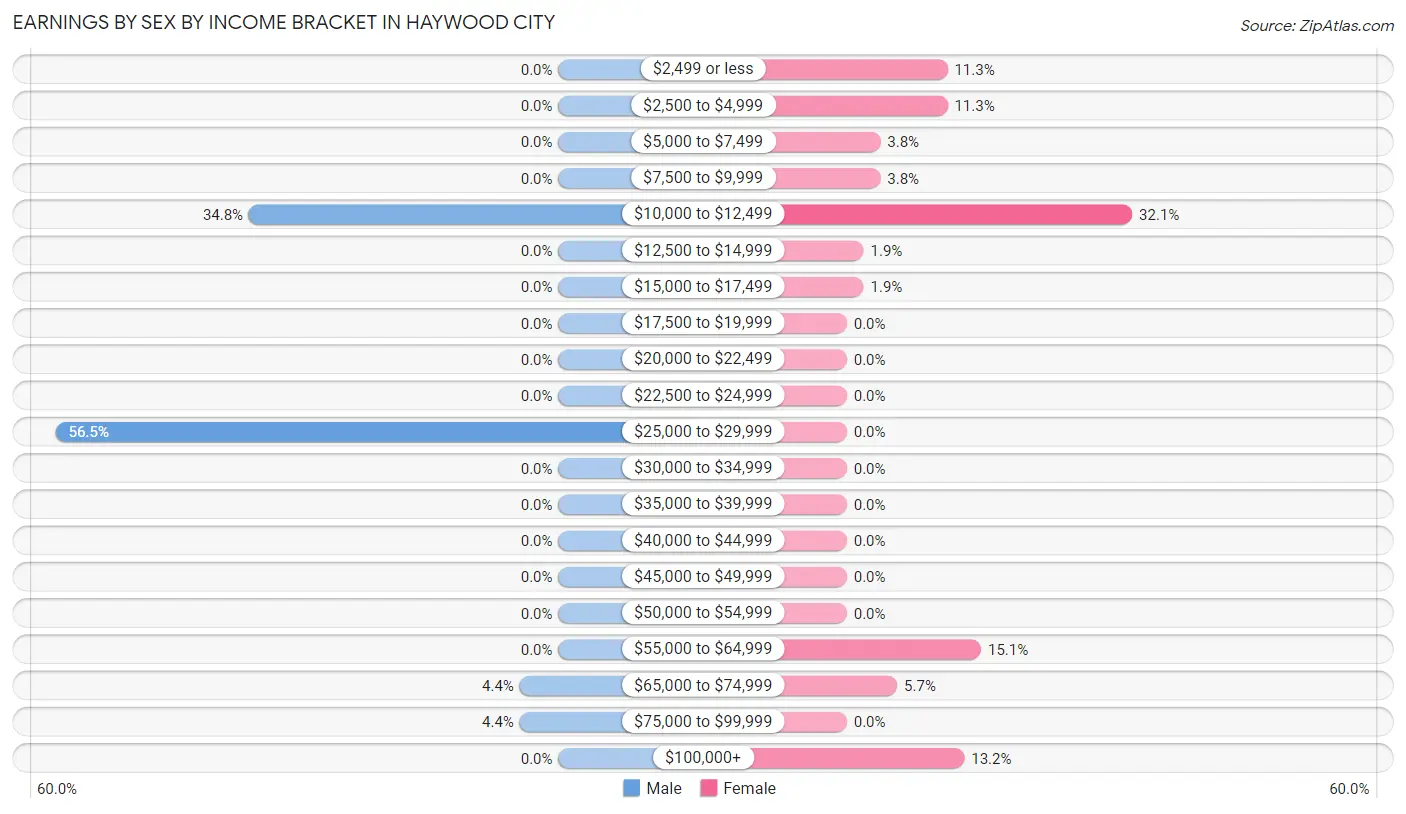
Earnings by Sex by Income Bracket in Haywood City
The most common earnings brackets in Haywood City are $25,000 to $29,999 for men (13 | 56.5%) and $10,000 to $12,499 for women (17 | 32.1%).
| Income | Male | Female |
| $2,499 or less | 0 (0.0%) | 6 (11.3%) |
| $2,500 to $4,999 | 0 (0.0%) | 6 (11.3%) |
| $5,000 to $7,499 | 0 (0.0%) | 2 (3.8%) |
| $7,500 to $9,999 | 0 (0.0%) | 2 (3.8%) |
| $10,000 to $12,499 | 8 (34.8%) | 17 (32.1%) |
| $12,500 to $14,999 | 0 (0.0%) | 1 (1.9%) |
| $15,000 to $17,499 | 0 (0.0%) | 1 (1.9%) |
| $17,500 to $19,999 | 0 (0.0%) | 0 (0.0%) |
| $20,000 to $22,499 | 0 (0.0%) | 0 (0.0%) |
| $22,500 to $24,999 | 0 (0.0%) | 0 (0.0%) |
| $25,000 to $29,999 | 13 (56.5%) | 0 (0.0%) |
| $30,000 to $34,999 | 0 (0.0%) | 0 (0.0%) |
| $35,000 to $39,999 | 0 (0.0%) | 0 (0.0%) |
| $40,000 to $44,999 | 0 (0.0%) | 0 (0.0%) |
| $45,000 to $49,999 | 0 (0.0%) | 0 (0.0%) |
| $50,000 to $54,999 | 0 (0.0%) | 0 (0.0%) |
| $55,000 to $64,999 | 0 (0.0%) | 8 (15.1%) |
| $65,000 to $74,999 | 1 (4.3%) | 3 (5.7%) |
| $75,000 to $99,999 | 1 (4.3%) | 0 (0.0%) |
| $100,000+ | 0 (0.0%) | 7 (13.2%) |
| Total | 23 (100.0%) | 53 (100.0%) |
Earnings by Sex by Educational Attainment in Haywood City
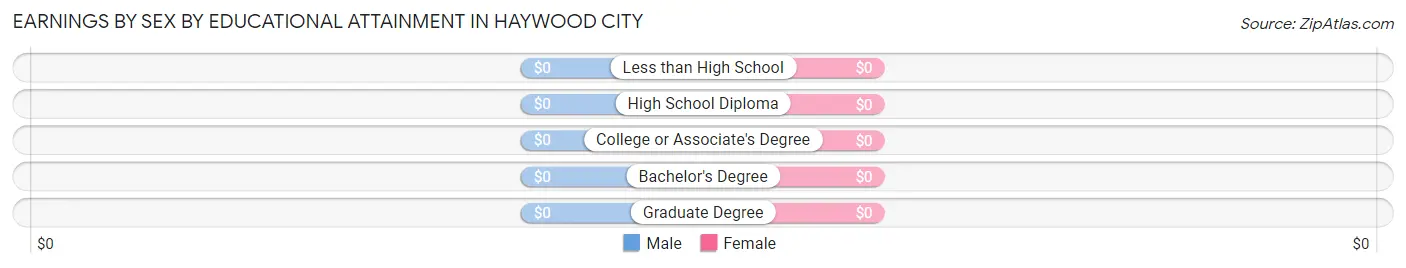
| Educational Attainment | Male Income | Female Income |
| Less than High School | - | - |
| High School Diploma | - | - |
| College or Associate's Degree | - | - |
| Bachelor's Degree | - | - |
| Graduate Degree | - | - |
| Total | - | - |
Family Income in Haywood City
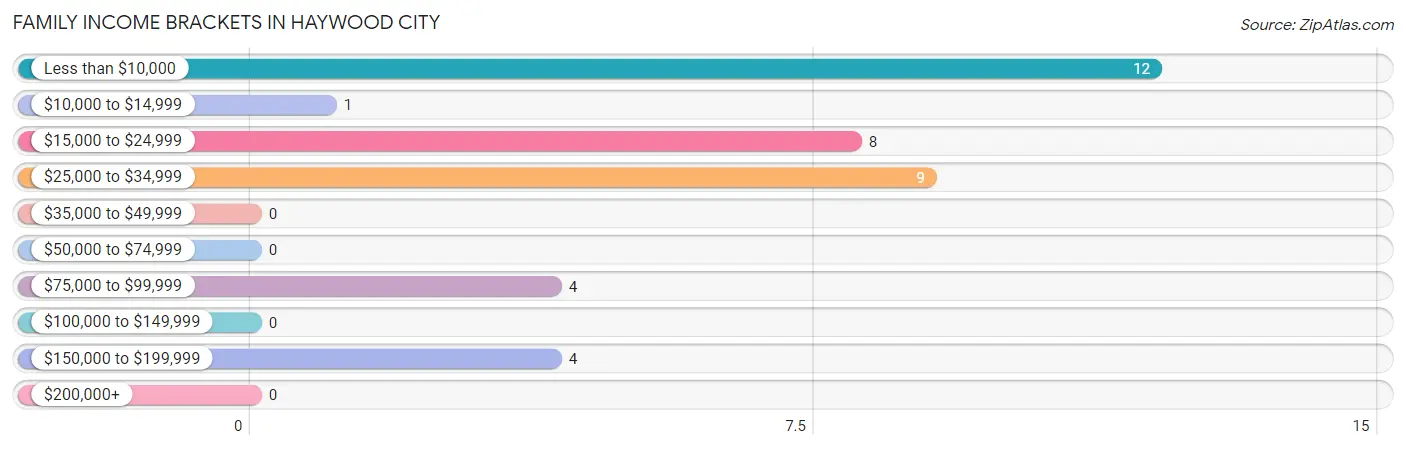
Family Income Brackets in Haywood City
According to the Haywood City family income data, there are 12 families falling into the less than $10,000 income range, which is the most common income bracket and makes up 31.6% of all families.
| Income Bracket | # Families | % Families |
| Less than $10,000 | 12 | 31.6% |
| $10,000 to $14,999 | 1 | 2.6% |
| $15,000 to $24,999 | 8 | 21.1% |
| $25,000 to $34,999 | 9 | 23.7% |
| $35,000 to $49,999 | 0 | 0.0% |
| $50,000 to $74,999 | 0 | 0.0% |
| $75,000 to $99,999 | 4 | 10.5% |
| $100,000 to $149,999 | 0 | 0.0% |
| $150,000 to $199,999 | 4 | 10.5% |
| $200,000+ | 0 | 0.0% |
Family Income by Famaliy Size in Haywood City
| Income Bracket | # Families | Median Income |
| 2-Person Families | 19 (50.0%) | $0 |
| 3-Person Families | 13 (34.2%) | $0 |
| 4-Person Families | 0 (0.0%) | $0 |
| 5-Person Families | 0 (0.0%) | $0 |
| 6-Person Families | 6 (15.8%) | $0 |
| 7+ Person Families | 0 (0.0%) | $0 |
| Total | 38 (100.0%) | $24,167 |
Family Income by Number of Earners in Haywood City
| Number of Earners | # Families | Median Income |
| No Earners | 12 (31.6%) | $0 |
| 1 Earner | 19 (50.0%) | $0 |
| 2 Earners | 7 (18.4%) | $0 |
| 3+ Earners | 0 (0.0%) | $0 |
| Total | 38 (100.0%) | $24,167 |
Household Income in Haywood City
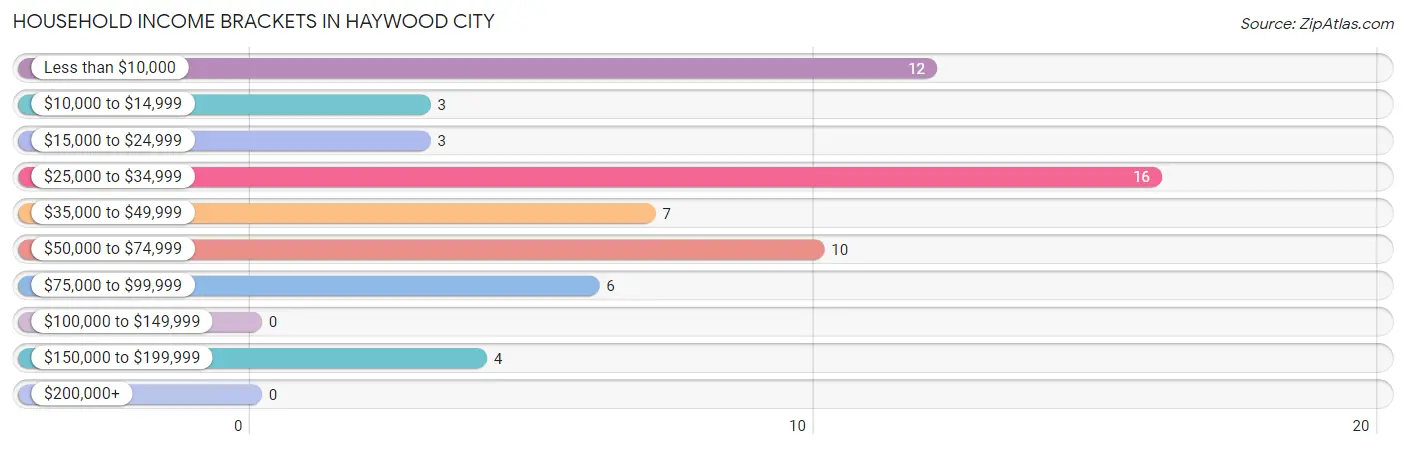
Household Income Brackets in Haywood City
With 16 households falling in the category, the $25,000 to $34,999 income range is the most frequent in Haywood City, accounting for 26.2% of all households.
| Income Bracket | # Households | % Households |
| Less than $10,000 | 12 | 19.7% |
| $10,000 to $14,999 | 3 | 4.9% |
| $15,000 to $24,999 | 3 | 4.9% |
| $25,000 to $34,999 | 16 | 26.2% |
| $35,000 to $49,999 | 7 | 11.5% |
| $50,000 to $74,999 | 10 | 16.4% |
| $75,000 to $99,999 | 6 | 9.8% |
| $100,000 to $149,999 | 0 | 0.0% |
| $150,000 to $199,999 | 4 | 6.6% |
| $200,000+ | 0 | 0.0% |
Household Income by Householder Age in Haywood City
The median household income in Haywood City is $31,042, with the highest median household income of $64,219 found in the 45 to 64 years age bracket for the primary householder. A total of 23 households (37.7%) fall into this category. Meanwhile, the 15 to 24 years age bracket for the primary householder has the lowest median household income of $0, with 7 households (11.5%) in this group.
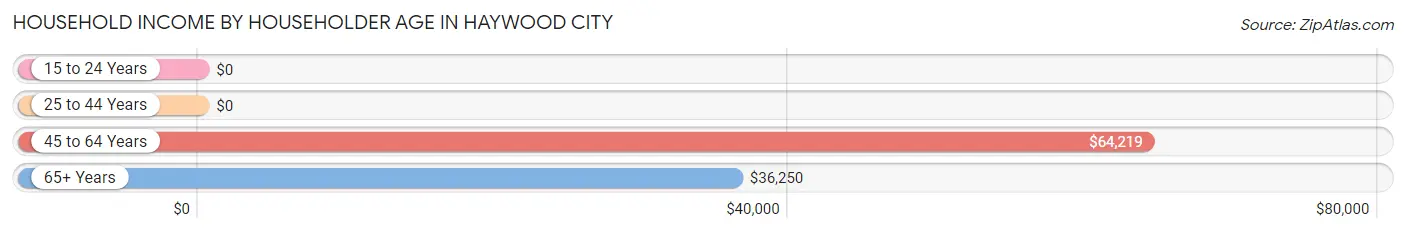
| Income Bracket | # Households | Median Income |
| 15 to 24 Years | 7 (11.5%) | $0 |
| 25 to 44 Years | 17 (27.9%) | $0 |
| 45 to 64 Years | 23 (37.7%) | $64,219 |
| 65+ Years | 14 (23.0%) | $36,250 |
| Total | 61 (100.0%) | $31,042 |
Poverty in Haywood City
Income Below Poverty by Sex and Age in Haywood City
With 50.0% poverty level for males and 54.6% for females among the residents of Haywood City, under 5 year old males and 6 to 11 year old females are the most vulnerable to poverty, with 19 males (100.0%) and 4 females (100.0%) in their respective age groups living below the poverty level.
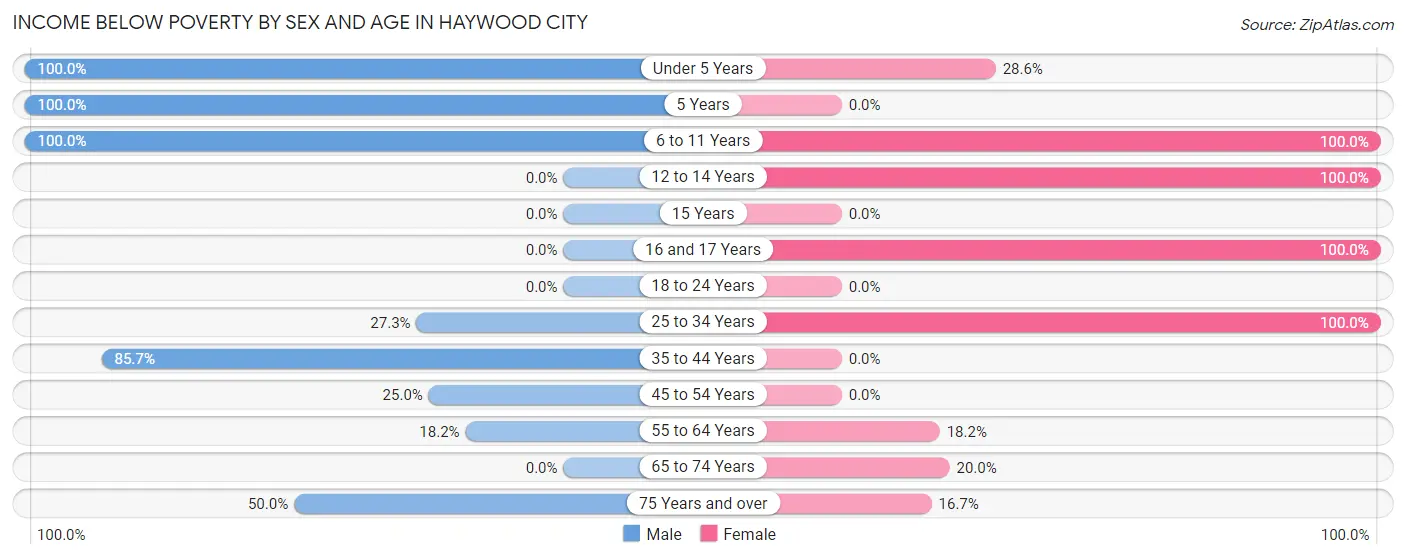
| Age Bracket | Male | Female |
| Under 5 Years | 19 (100.0%) | 2 (28.6%) |
| 5 Years | 6 (100.0%) | 0 (0.0%) |
| 6 to 11 Years | 3 (100.0%) | 4 (100.0%) |
| 12 to 14 Years | 0 (0.0%) | 4 (100.0%) |
| 15 Years | 0 (0.0%) | 0 (0.0%) |
| 16 and 17 Years | 0 (0.0%) | 3 (100.0%) |
| 18 to 24 Years | 0 (0.0%) | 0 (0.0%) |
| 25 to 34 Years | 3 (27.3%) | 29 (100.0%) |
| 35 to 44 Years | 6 (85.7%) | 0 (0.0%) |
| 45 to 54 Years | 1 (25.0%) | 0 (0.0%) |
| 55 to 64 Years | 4 (18.2%) | 2 (18.2%) |
| 65 to 74 Years | 0 (0.0%) | 2 (20.0%) |
| 75 Years and over | 1 (50.0%) | 1 (16.7%) |
| Total | 43 (50.0%) | 47 (54.6%) |
Income Above Poverty by Sex and Age in Haywood City
According to the poverty statistics in Haywood City, males aged 18 to 24 years and females aged 45 to 54 years are the age groups that are most secure financially, with 100.0% of males and 100.0% of females in these age groups living above the poverty line.
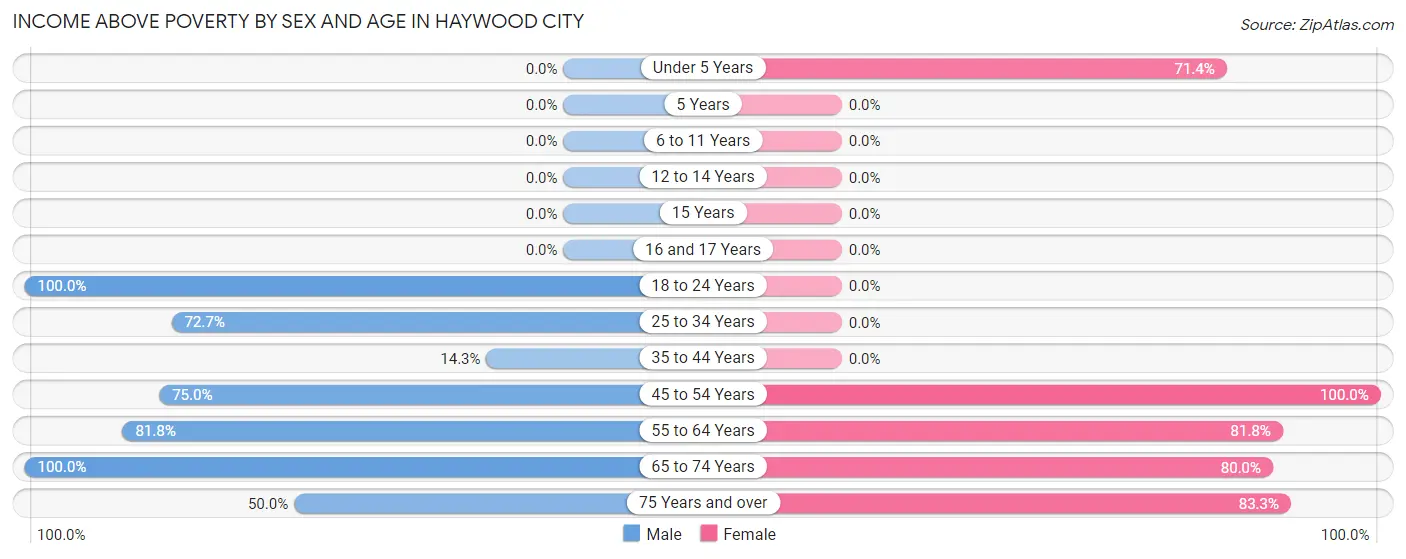
| Age Bracket | Male | Female |
| Under 5 Years | 0 (0.0%) | 5 (71.4%) |
| 5 Years | 0 (0.0%) | 0 (0.0%) |
| 6 to 11 Years | 0 (0.0%) | 0 (0.0%) |
| 12 to 14 Years | 0 (0.0%) | 0 (0.0%) |
| 15 Years | 0 (0.0%) | 0 (0.0%) |
| 16 and 17 Years | 0 (0.0%) | 0 (0.0%) |
| 18 to 24 Years | 7 (100.0%) | 0 (0.0%) |
| 25 to 34 Years | 8 (72.7%) | 0 (0.0%) |
| 35 to 44 Years | 1 (14.3%) | 0 (0.0%) |
| 45 to 54 Years | 3 (75.0%) | 12 (100.0%) |
| 55 to 64 Years | 18 (81.8%) | 9 (81.8%) |
| 65 to 74 Years | 5 (100.0%) | 8 (80.0%) |
| 75 Years and over | 1 (50.0%) | 5 (83.3%) |
| Total | 43 (50.0%) | 39 (45.4%) |
Income Below Poverty Among Married-Couple Families in Haywood City
The poverty statistics for married-couple families in Haywood City show that 60.0% or 9 of the total 15 families live below the poverty line. Families with 1 or 2 children have the highest poverty rate of 100.0%, comprising of 1 families. On the other hand, families with no children have the lowest poverty rate of 25.0%, which includes 2 families.
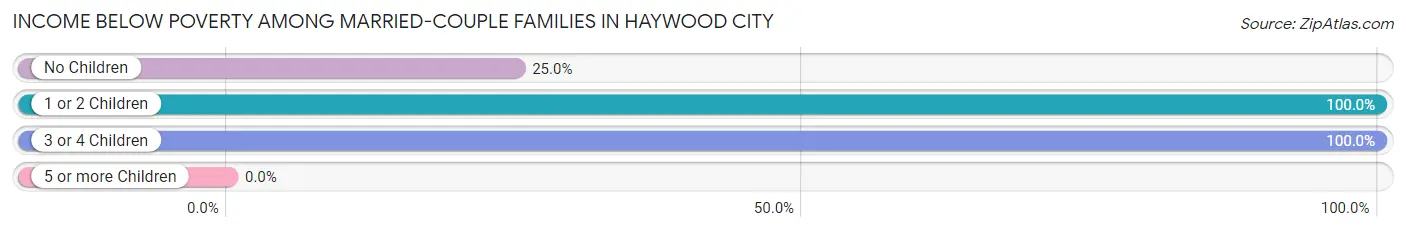
| Children | Above Poverty | Below Poverty |
| No Children | 6 (75.0%) | 2 (25.0%) |
| 1 or 2 Children | 0 (0.0%) | 1 (100.0%) |
| 3 or 4 Children | 0 (0.0%) | 6 (100.0%) |
| 5 or more Children | 0 (0.0%) | 0 (0.0%) |
| Total | 6 (40.0%) | 9 (60.0%) |
Income Below Poverty Among Single-Parent Households in Haywood City
According to the poverty data in Haywood City, 33.3% or 1 single-father households and 50.0% or 10 single-mother households are living below the poverty line. Among single-father households, those with 1 or 2 children have the highest poverty rate, with 1 households (100.0%) experiencing poverty. Likewise, among single-mother households, those with 1 or 2 children have the highest poverty rate, with 10 households (62.5%) falling below the poverty line.
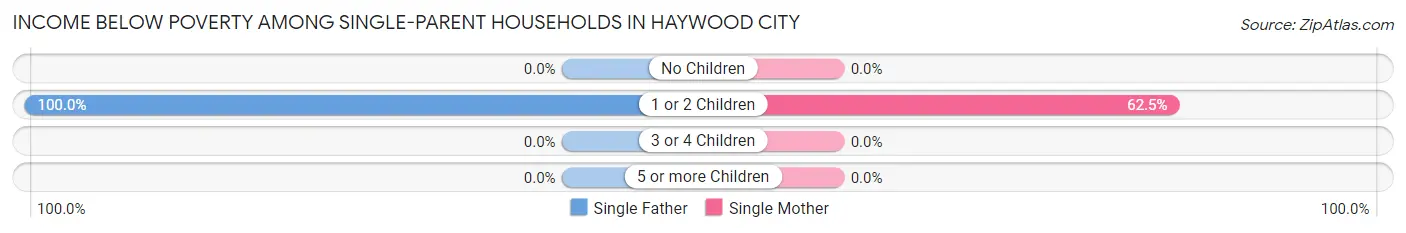
| Children | Single Father | Single Mother |
| No Children | 0 (0.0%) | 0 (0.0%) |
| 1 or 2 Children | 1 (100.0%) | 10 (62.5%) |
| 3 or 4 Children | 0 (0.0%) | 0 (0.0%) |
| 5 or more Children | 0 (0.0%) | 0 (0.0%) |
| Total | 1 (33.3%) | 10 (50.0%) |
Income Below Poverty Among Married-Couple vs Single-Parent Households in Haywood City
The poverty data for Haywood City shows that 9 of the married-couple family households (60.0%) and 11 of the single-parent households (47.8%) are living below the poverty level. Within the married-couple family households, those with 1 or 2 children have the highest poverty rate, with 1 households (100.0%) falling below the poverty line. Among the single-parent households, those with 1 or 2 children have the highest poverty rate, with 11 household (64.7%) living below poverty.
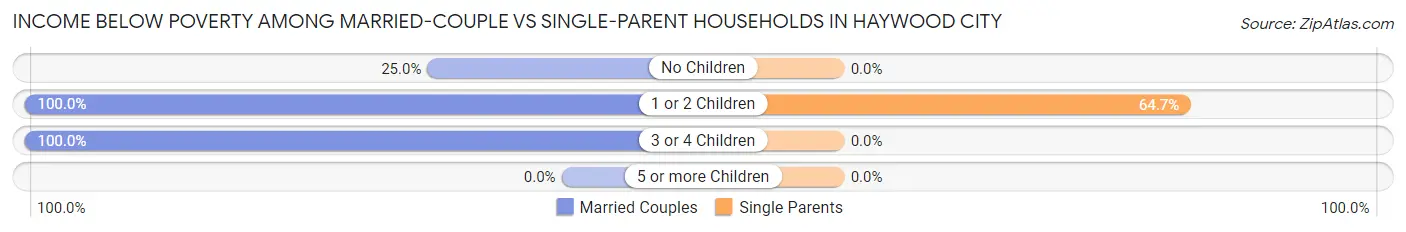
| Children | Married-Couple Families | Single-Parent Households |
| No Children | 2 (25.0%) | 0 (0.0%) |
| 1 or 2 Children | 1 (100.0%) | 11 (64.7%) |
| 3 or 4 Children | 6 (100.0%) | 0 (0.0%) |
| 5 or more Children | 0 (0.0%) | 0 (0.0%) |
| Total | 9 (60.0%) | 11 (47.8%) |
Race in Haywood City
The most populous races in Haywood City are Black / African American (135 | 78.5%), White / Caucasian (37 | 21.5%), and Hispanic or Latino (26 | 15.1%).
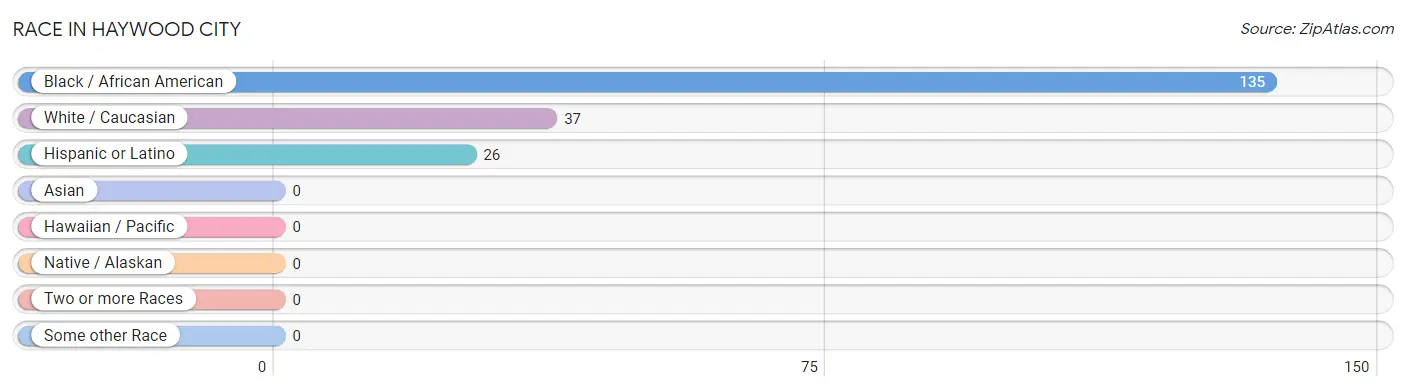
| Race | # Population | % Population |
| Asian | 0 | 0.0% |
| Black / African American | 135 | 78.5% |
| Hawaiian / Pacific | 0 | 0.0% |
| Hispanic or Latino | 26 | 15.1% |
| Native / Alaskan | 0 | 0.0% |
| White / Caucasian | 37 | 21.5% |
| Two or more Races | 0 | 0.0% |
| Some other Race | 0 | 0.0% |
| Total | 172 | 100.0% |
Ancestry in Haywood City
The most populous ancestries reported in Haywood City are German (37 | 21.5%), Norwegian (37 | 21.5%), Mexican (26 | 15.1%), and Israeli (4 | 2.3%), together accounting for 60.5% of all Haywood City residents.
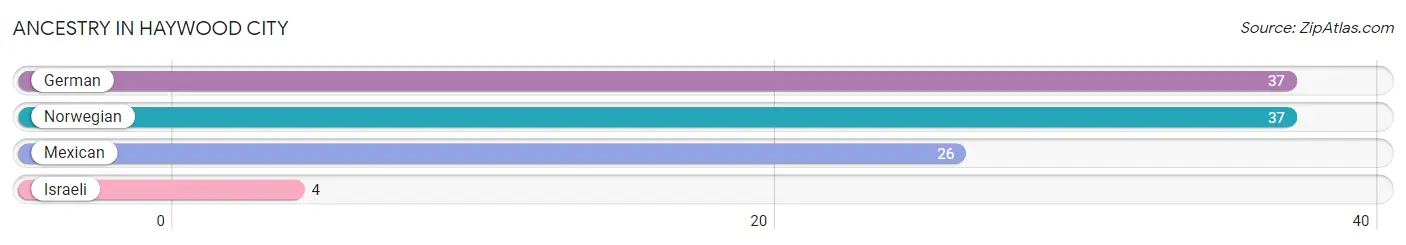
| Ancestry | # Population | % Population |
| German | 37 | 21.5% |
| Israeli | 4 | 2.3% |
| Mexican | 26 | 15.1% |
| Norwegian | 37 | 21.5% | View All 4 Rows |
Immigrants in Haywood City

| Immigration Origin | # Population | % Population | View All 0 Rows |
Sex and Age in Haywood City
Sex and Age in Haywood City
The most populous age groups in Haywood City are 60 to 64 Years (20 | 23.3%) for men and 30 to 34 Years (29 | 33.7%) for women.
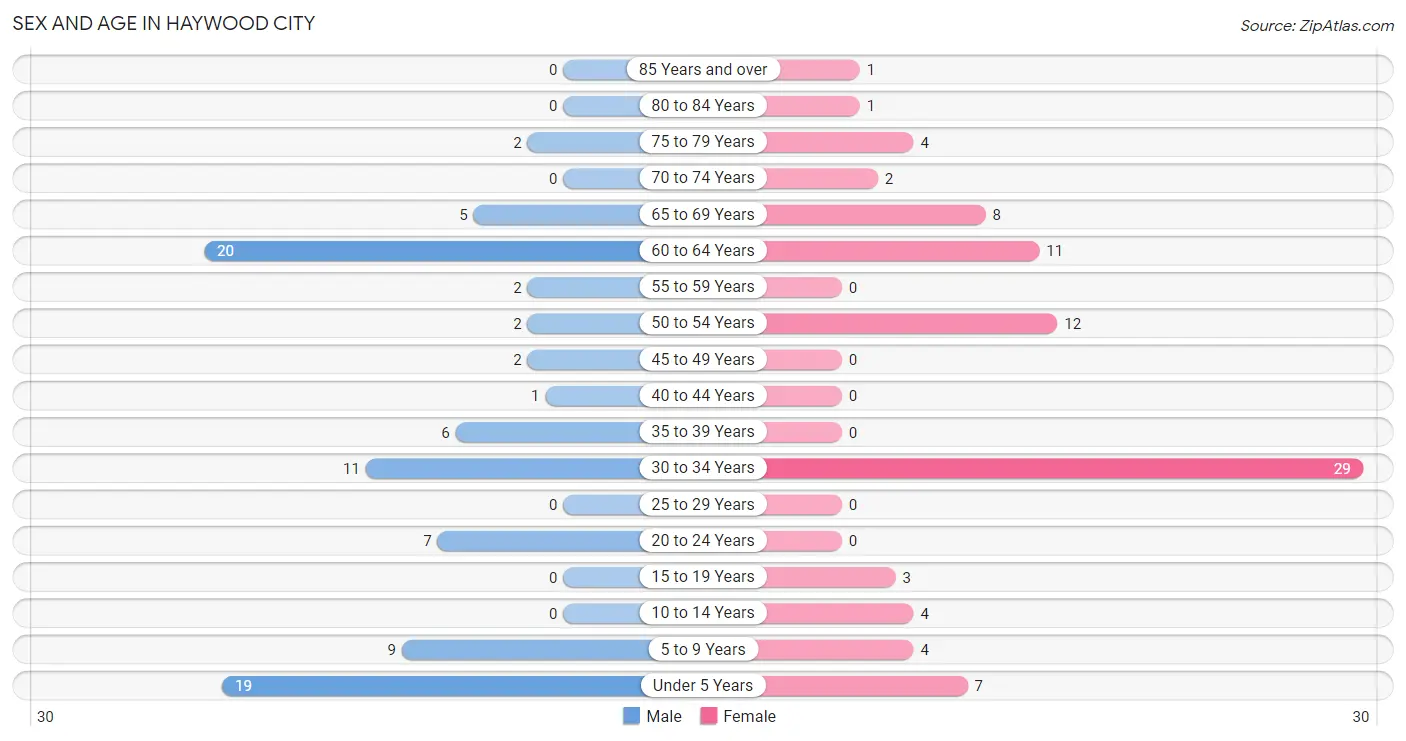
| Age Bracket | Male | Female |
| Under 5 Years | 19 (22.1%) | 7 (8.1%) |
| 5 to 9 Years | 9 (10.5%) | 4 (4.6%) |
| 10 to 14 Years | 0 (0.0%) | 4 (4.6%) |
| 15 to 19 Years | 0 (0.0%) | 3 (3.5%) |
| 20 to 24 Years | 7 (8.1%) | 0 (0.0%) |
| 25 to 29 Years | 0 (0.0%) | 0 (0.0%) |
| 30 to 34 Years | 11 (12.8%) | 29 (33.7%) |
| 35 to 39 Years | 6 (7.0%) | 0 (0.0%) |
| 40 to 44 Years | 1 (1.2%) | 0 (0.0%) |
| 45 to 49 Years | 2 (2.3%) | 0 (0.0%) |
| 50 to 54 Years | 2 (2.3%) | 12 (14.0%) |
| 55 to 59 Years | 2 (2.3%) | 0 (0.0%) |
| 60 to 64 Years | 20 (23.3%) | 11 (12.8%) |
| 65 to 69 Years | 5 (5.8%) | 8 (9.3%) |
| 70 to 74 Years | 0 (0.0%) | 2 (2.3%) |
| 75 to 79 Years | 2 (2.3%) | 4 (4.6%) |
| 80 to 84 Years | 0 (0.0%) | 1 (1.2%) |
| 85 Years and over | 0 (0.0%) | 1 (1.2%) |
| Total | 86 (100.0%) | 86 (100.0%) |
Families and Households in Haywood City
Median Family Size in Haywood City
The median family size in Haywood City is 3.45 persons per family, with single male/father families (3 | 7.9%) accounting for the largest median family size of 7 persons per family. On the other hand, single female/mother families (20 | 52.6%) represent the smallest median family size with 2.45 persons per family.
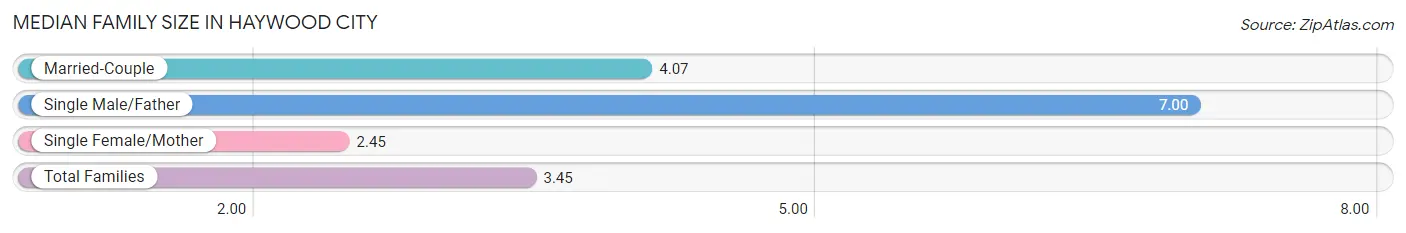
| Family Type | # Families | Family Size |
| Married-Couple | 15 (39.5%) | 4.07 |
| Single Male/Father | 3 (7.9%) | 7.00 |
| Single Female/Mother | 20 (52.6%) | 2.45 |
| Total Families | 38 (100.0%) | 3.45 |
Median Household Size in Haywood City
The median household size in Haywood City is 2.82 persons per household, with single male/father households (3 | 4.9%) accounting for the largest median household size of 7 persons per household. non-family households (23 | 37.7%) represent the smallest median household size with 1.09 persons per household.
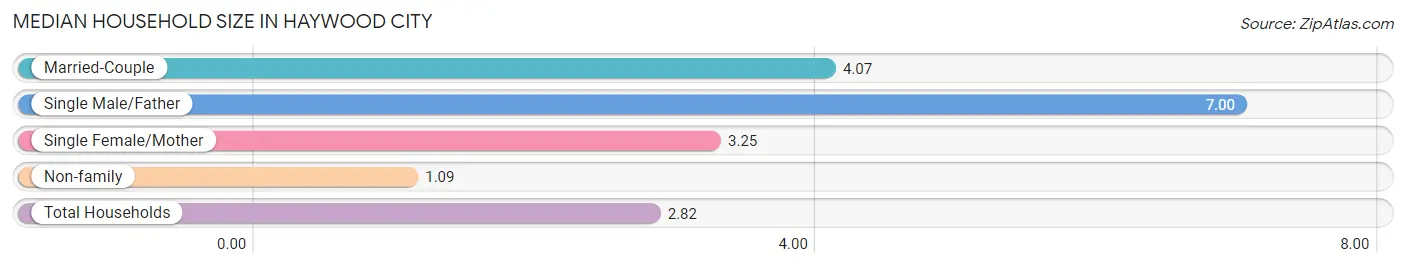
| Household Type | # Households | Household Size |
| Married-Couple | 15 (24.6%) | 4.07 |
| Single Male/Father | 3 (4.9%) | 7.00 |
| Single Female/Mother | 20 (32.8%) | 3.25 |
| Non-family | 23 (37.7%) | 1.09 |
| Total Households | 61 (100.0%) | 2.82 |
Household Size by Marriage Status in Haywood City
Out of a total of 61 households in Haywood City, 38 (62.3%) are family households, while 23 (37.7%) are nonfamily households. The most numerous type of family households are 2-person households, comprising 15, and the most common type of nonfamily households are 1-person households, comprising 22.
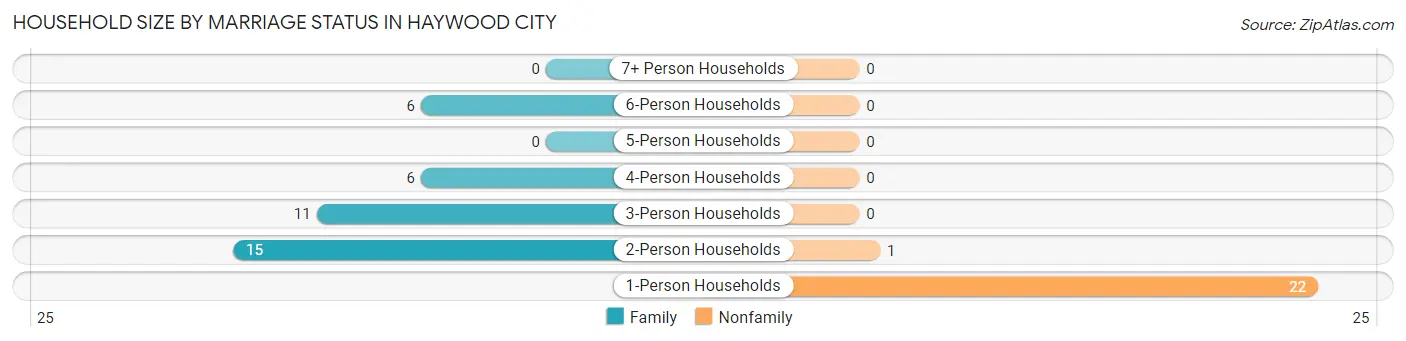
| Household Size | Family Households | Nonfamily Households |
| 1-Person Households | - | 22 (36.1%) |
| 2-Person Households | 15 (24.6%) | 1 (1.6%) |
| 3-Person Households | 11 (18.0%) | 0 (0.0%) |
| 4-Person Households | 6 (9.8%) | 0 (0.0%) |
| 5-Person Households | 0 (0.0%) | 0 (0.0%) |
| 6-Person Households | 6 (9.8%) | 0 (0.0%) |
| 7+ Person Households | 0 (0.0%) | 0 (0.0%) |
| Total | 38 (62.3%) | 23 (37.7%) |
Female Fertility in Haywood City
Fertility by Age in Haywood City
| Age Bracket | Women with Births | Births / 1,000 Women |
| 15 to 19 years | 0 (0.0%) | 0.0 |
| 20 to 34 years | 0 (0.0%) | 0.0 |
| 35 to 50 years | 0 (0.0%) | 0.0 |
| Total | 0 (0.0%) | 0.0 |
Fertility by Age by Marriage Status in Haywood City
| Age Bracket | Married | Unmarried |
| 15 to 19 years | 0 (0.0%) | 0 (0.0%) |
| 20 to 34 years | 0 (0.0%) | 0 (0.0%) |
| 35 to 50 years | 0 (0.0%) | 0 (0.0%) |
| Total | 0 (0.0%) | 0 (0.0%) |
Fertility by Education in Haywood City
| Educational Attainment | Women with Births | Births / 1,000 Women |
| Less than High School | 0 (0.0%) | 0.0 |
| High School Diploma | 0 (0.0%) | 0.0 |
| College or Associate's Degree | 0 (0.0%) | 0.0 |
| Bachelor's Degree | 0 (0.0%) | 0.0 |
| Graduate Degree | 0 (0.0%) | 0.0 |
| Total | 0 (0.0%) | 0.0 |
Fertility by Education by Marriage Status in Haywood City
| Educational Attainment | Married | Unmarried |
| Less than High School | 0 (0.0%) | 0 (0.0%) |
| High School Diploma | 0 (0.0%) | 0 (0.0%) |
| College or Associate's Degree | 0 (0.0%) | 0 (0.0%) |
| Bachelor's Degree | 0 (0.0%) | 0 (0.0%) |
| Graduate Degree | 0 (0.0%) | 0 (0.0%) |
| Total | 0 (0.0%) | 0 (0.0%) |
Employment Characteristics in Haywood City
Employment by Class of Employer in Haywood City
Among the 70 employed individuals in Haywood City, private company employees (55 | 78.6%), self-employed (not incorporated) (9 | 12.9%), and not-for-profit organizations (3 | 4.3%) make up the most common classes of employment.
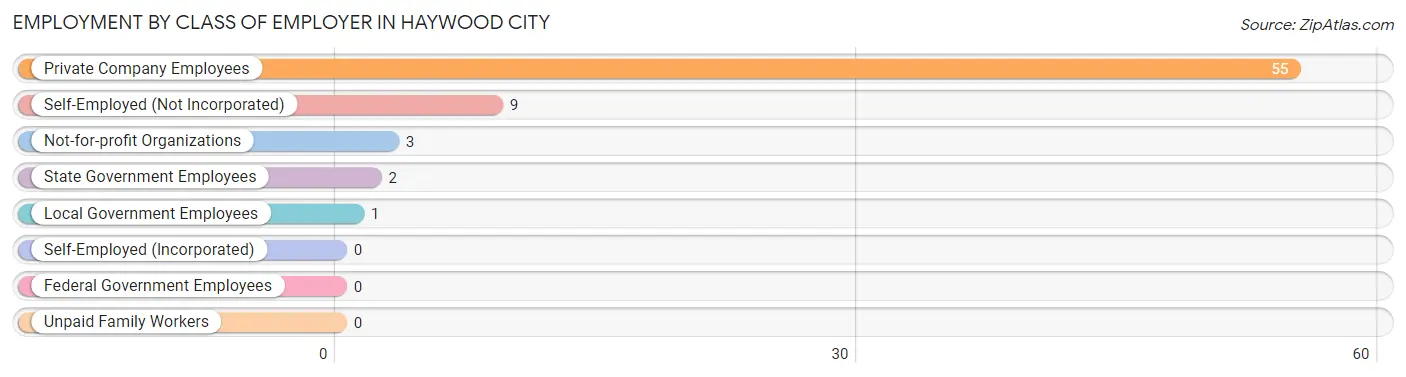
| Employer Class | # Employees | % Employees |
| Private Company Employees | 55 | 78.6% |
| Self-Employed (Incorporated) | 0 | 0.0% |
| Self-Employed (Not Incorporated) | 9 | 12.9% |
| Not-for-profit Organizations | 3 | 4.3% |
| Local Government Employees | 1 | 1.4% |
| State Government Employees | 2 | 2.9% |
| Federal Government Employees | 0 | 0.0% |
| Unpaid Family Workers | 0 | 0.0% |
| Total | 70 | 100.0% |
Employment Status by Age in Haywood City
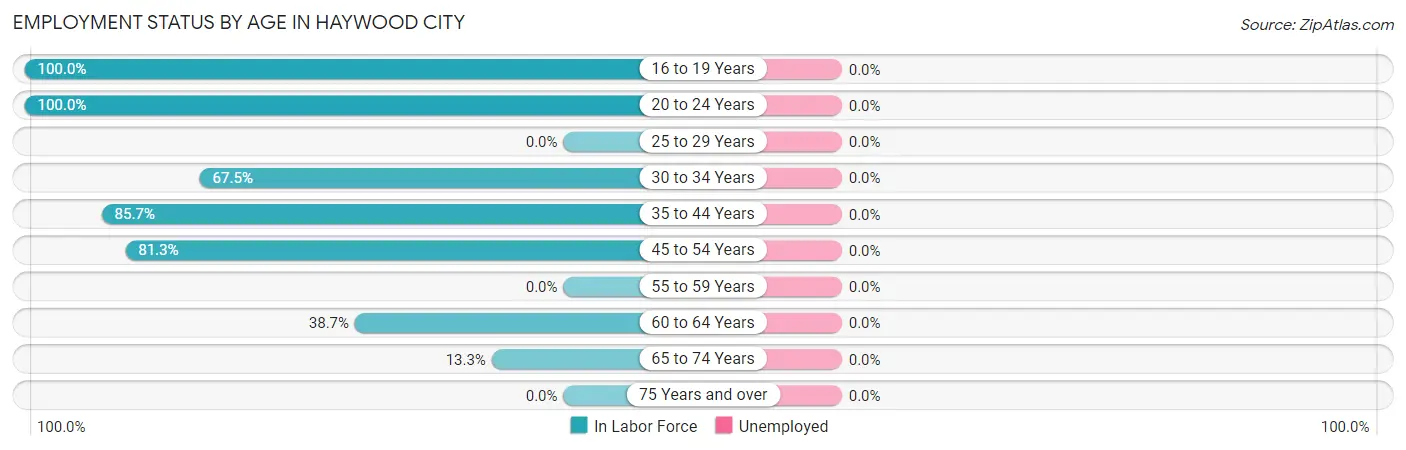
| Age Bracket | In Labor Force | Unemployed |
| 16 to 19 Years | 3 (100.0%) | 0 (0.0%) |
| 20 to 24 Years | 7 (100.0%) | 0 (0.0%) |
| 25 to 29 Years | 0 (0.0%) | 0 (0.0%) |
| 30 to 34 Years | 27 (67.5%) | 0 (0.0%) |
| 35 to 44 Years | 6 (85.7%) | 0 (0.0%) |
| 45 to 54 Years | 13 (81.3%) | 0 (0.0%) |
| 55 to 59 Years | 0 (0.0%) | 0 (0.0%) |
| 60 to 64 Years | 12 (38.7%) | 0 (0.0%) |
| 65 to 74 Years | 2 (13.3%) | 0 (0.0%) |
| 75 Years and over | 0 (0.0%) | 0 (0.0%) |
| Total | 70 (54.3%) | 0 (0.0%) |
Employment Status by Educational Attainment in Haywood City
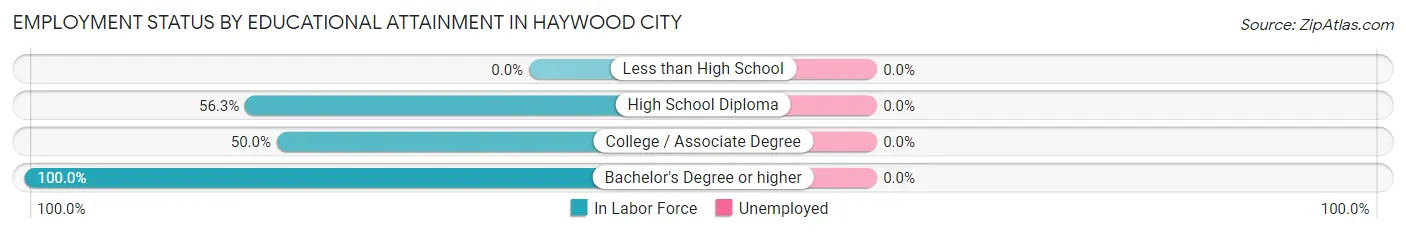
| Educational Attainment | In Labor Force | Unemployed |
| Less than High School | 0 (0.0%) | 0 (0.0%) |
| High School Diploma | 27 (56.3%) | 0 (0.0%) |
| College / Associate Degree | 17 (50.0%) | 0 (0.0%) |
| Bachelor's Degree or higher | 14 (100.0%) | 0 (0.0%) |
| Total | 58 (60.4%) | 0 (0.0%) |
Employment Occupations by Sex in Haywood City
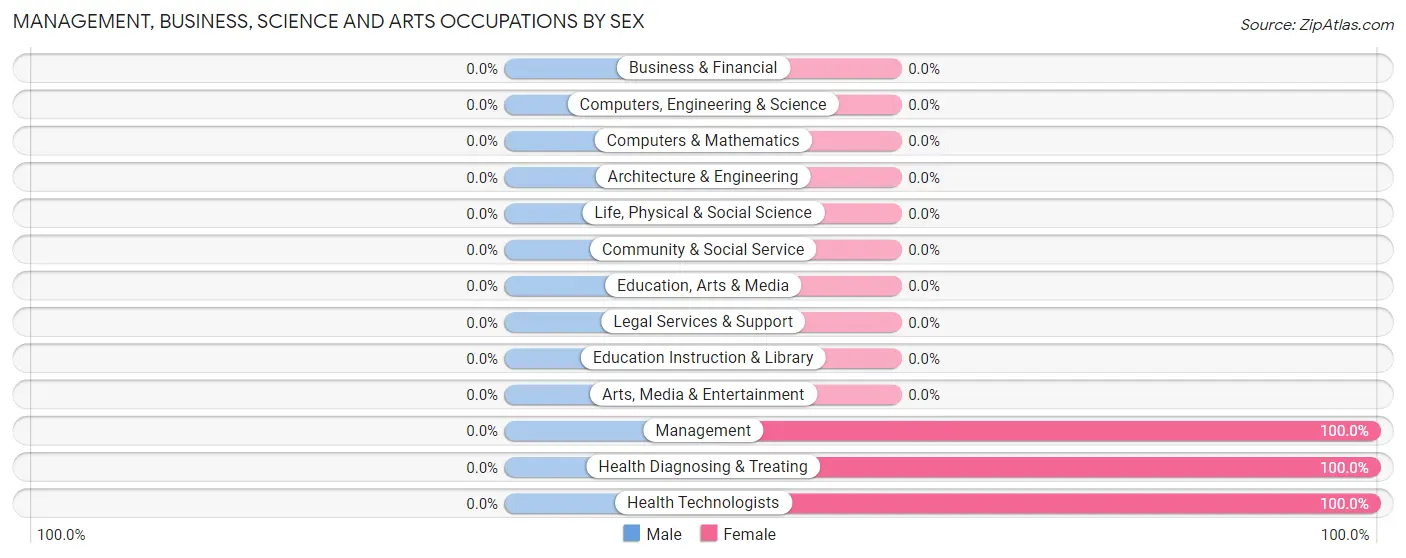
Management, Business, Science and Arts Occupations
The most common Management, Business, Science and Arts occupations in Haywood City are Health Diagnosing & Treating (2 | 2.9%), Health Technologists (2 | 2.9%), and Management (1 | 1.4%).
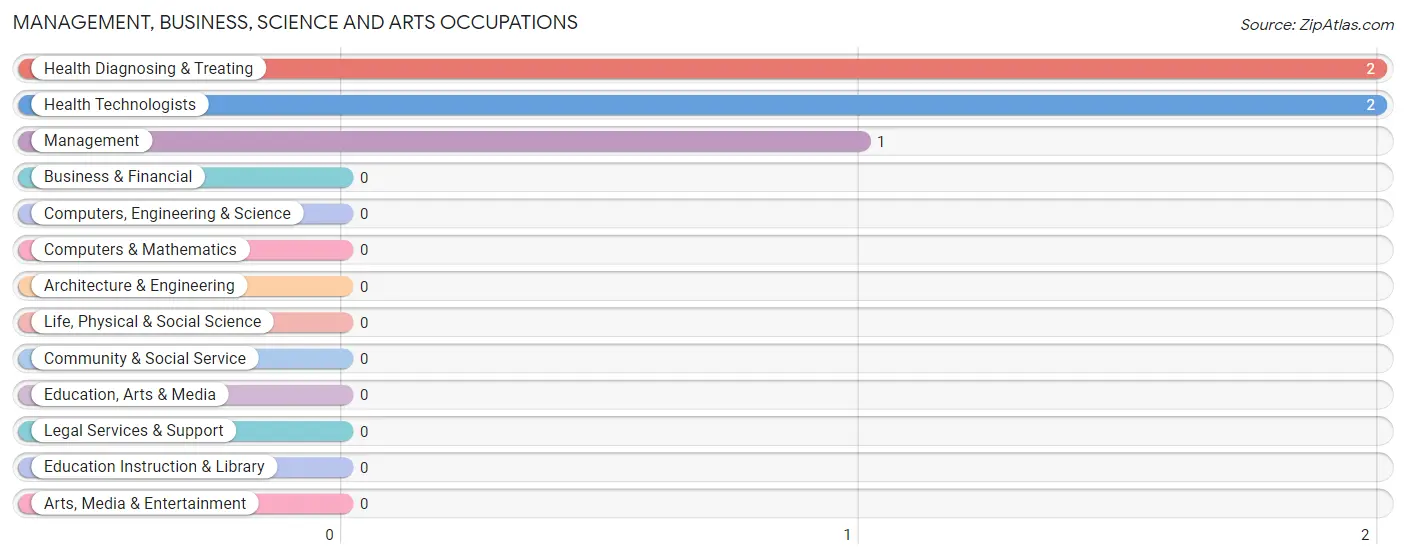
Management, Business, Science and Arts Occupations by Sex
| Occupation | Male | Female |
| Management | 0 (0.0%) | 1 (100.0%) |
| Business & Financial | 0 (0.0%) | 0 (0.0%) |
| Computers, Engineering & Science | 0 (0.0%) | 0 (0.0%) |
| Computers & Mathematics | 0 (0.0%) | 0 (0.0%) |
| Architecture & Engineering | 0 (0.0%) | 0 (0.0%) |
| Life, Physical & Social Science | 0 (0.0%) | 0 (0.0%) |
| Community & Social Service | 0 (0.0%) | 0 (0.0%) |
| Education, Arts & Media | 0 (0.0%) | 0 (0.0%) |
| Legal Services & Support | 0 (0.0%) | 0 (0.0%) |
| Education Instruction & Library | 0 (0.0%) | 0 (0.0%) |
| Arts, Media & Entertainment | 0 (0.0%) | 0 (0.0%) |
| Health Diagnosing & Treating | 0 (0.0%) | 2 (100.0%) |
| Health Technologists | 0 (0.0%) | 2 (100.0%) |
| Total (Category) | 0 (0.0%) | 3 (100.0%) |
| Total (Overall) | 23 (32.9%) | 47 (67.1%) |
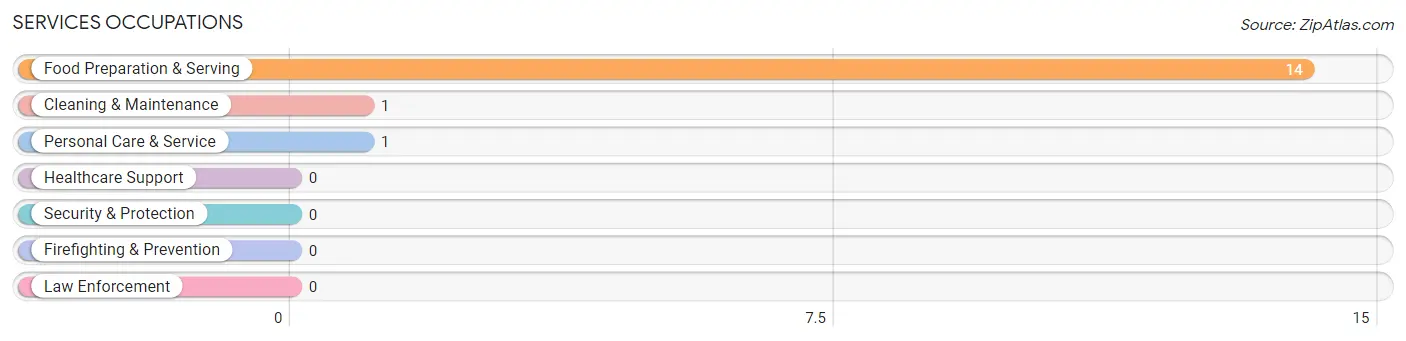
Services Occupations
The most common Services occupations in Haywood City are Food Preparation & Serving (14 | 20.0%), Cleaning & Maintenance (1 | 1.4%), and Personal Care & Service (1 | 1.4%).
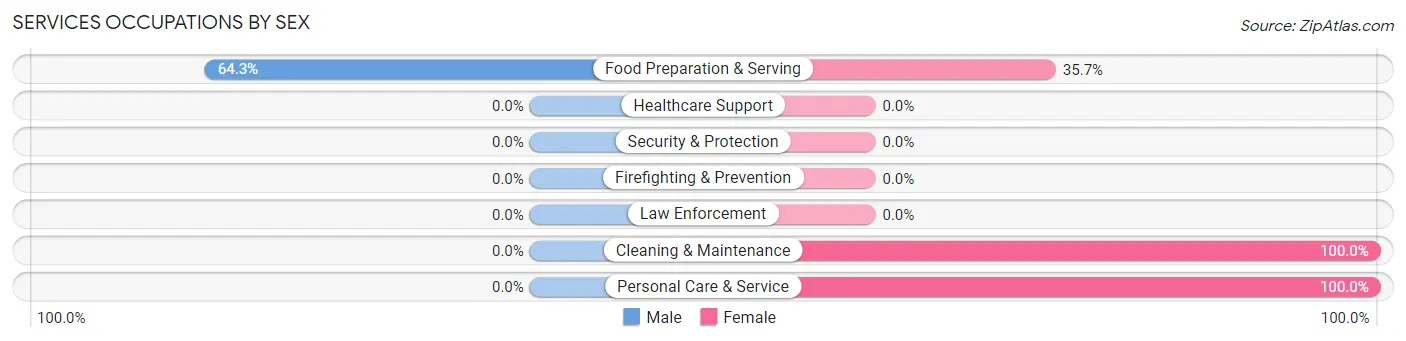
Services Occupations by Sex
| Occupation | Male | Female |
| Healthcare Support | 0 (0.0%) | 0 (0.0%) |
| Security & Protection | 0 (0.0%) | 0 (0.0%) |
| Firefighting & Prevention | 0 (0.0%) | 0 (0.0%) |
| Law Enforcement | 0 (0.0%) | 0 (0.0%) |
| Food Preparation & Serving | 9 (64.3%) | 5 (35.7%) |
| Cleaning & Maintenance | 0 (0.0%) | 1 (100.0%) |
| Personal Care & Service | 0 (0.0%) | 1 (100.0%) |
| Total (Category) | 9 (56.2%) | 7 (43.8%) |
| Total (Overall) | 23 (32.9%) | 47 (67.1%) |
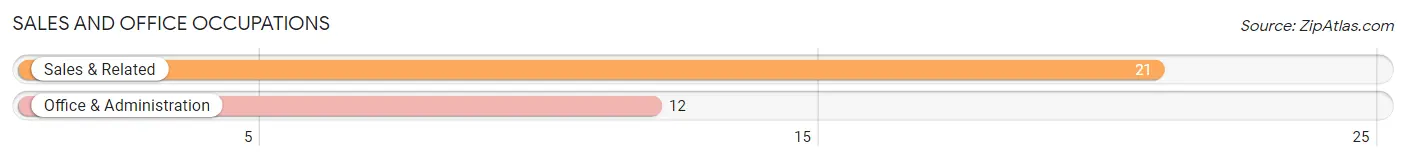
Sales and Office Occupations
The most common Sales and Office occupations in Haywood City are Sales & Related (21 | 30.0%), and Office & Administration (12 | 17.1%).
Sales and Office Occupations by Sex
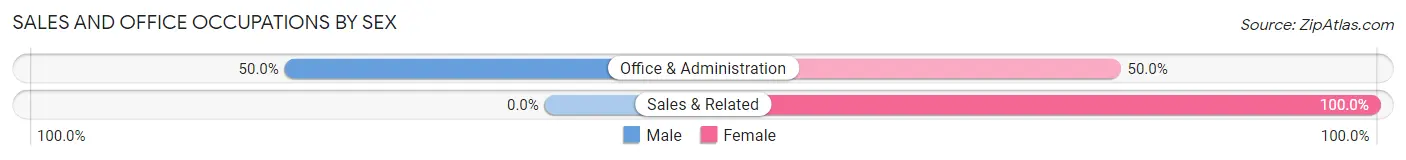
| Occupation | Male | Female |
| Sales & Related | 0 (0.0%) | 21 (100.0%) |
| Office & Administration | 6 (50.0%) | 6 (50.0%) |
| Total (Category) | 6 (18.2%) | 27 (81.8%) |
| Total (Overall) | 23 (32.9%) | 47 (67.1%) |
Natural Resources, Construction and Maintenance Occupations
Natural Resources, Construction and Maintenance Occupations by Sex
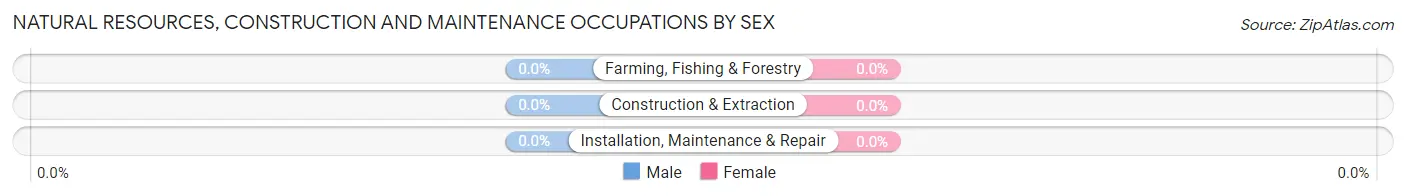
| Occupation | Male | Female |
| Farming, Fishing & Forestry | 0 (0.0%) | 0 (0.0%) |
| Construction & Extraction | 0 (0.0%) | 0 (0.0%) |
| Installation, Maintenance & Repair | 0 (0.0%) | 0 (0.0%) |
| Total (Category) | 0 (0.0%) | 0 (0.0%) |
| Total (Overall) | 23 (32.9%) | 47 (67.1%) |
Production, Transportation and Moving Occupations
The most common Production, Transportation and Moving occupations in Haywood City are Production (8 | 11.4%), Material Moving (8 | 11.4%), and Transportation (2 | 2.9%).
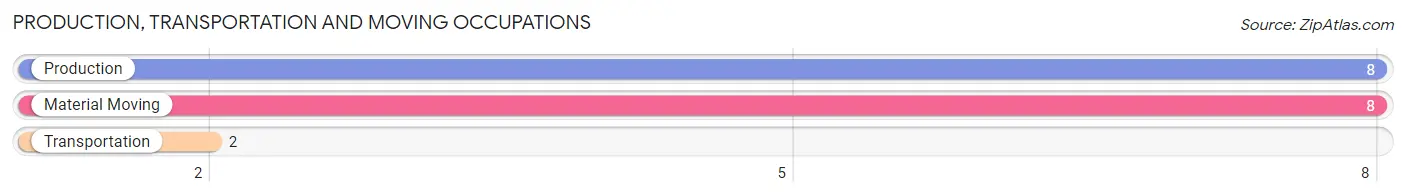
Production, Transportation and Moving Occupations by Sex
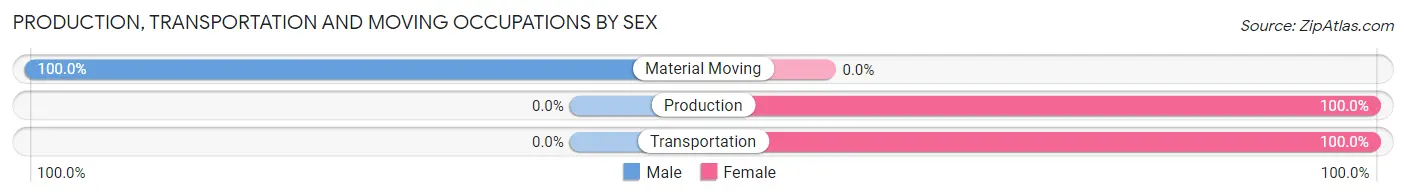
| Occupation | Male | Female |
| Production | 0 (0.0%) | 8 (100.0%) |
| Transportation | 0 (0.0%) | 2 (100.0%) |
| Material Moving | 8 (100.0%) | 0 (0.0%) |
| Total (Category) | 8 (44.4%) | 10 (55.6%) |
| Total (Overall) | 23 (32.9%) | 47 (67.1%) |
Employment Industries by Sex in Haywood City
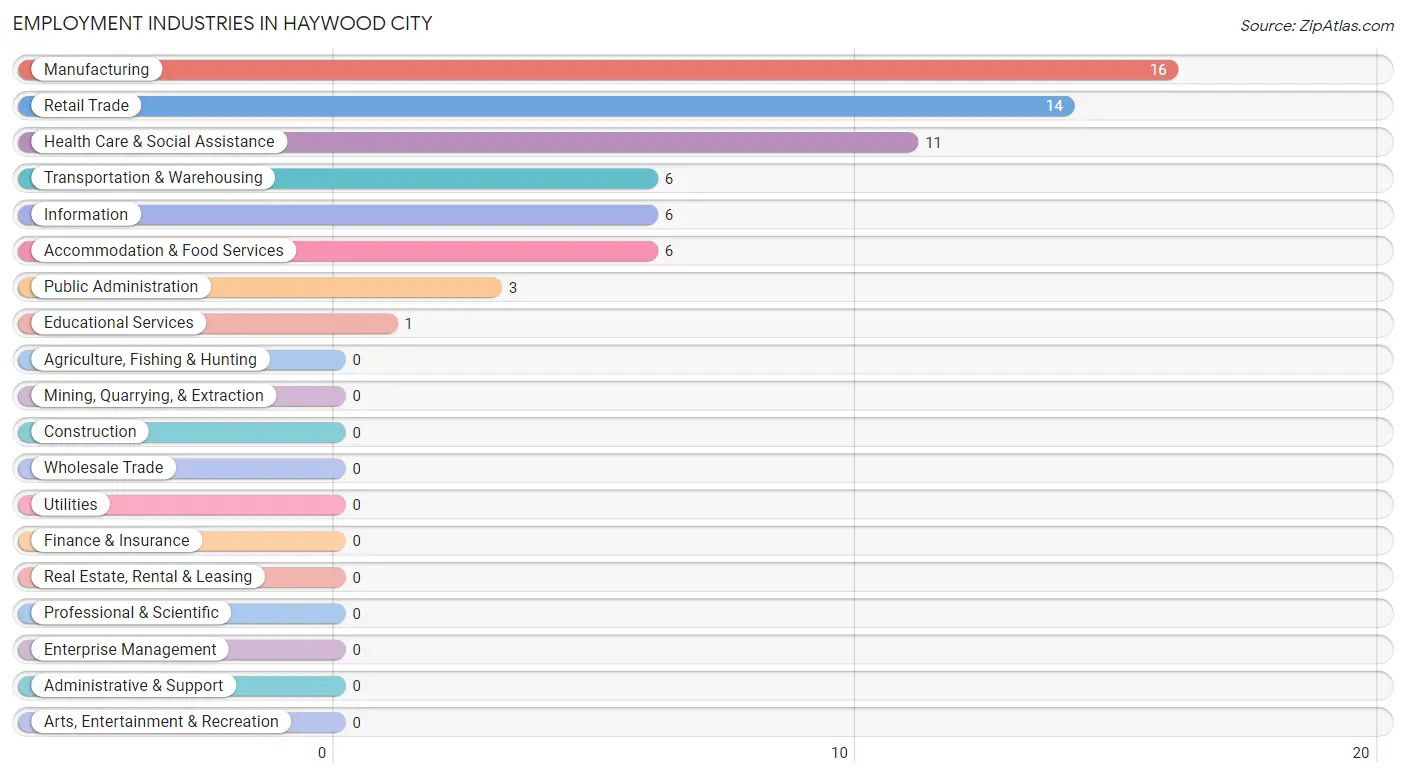
Employment Industries in Haywood City
The major employment industries in Haywood City include Manufacturing (16 | 22.9%), Retail Trade (14 | 20.0%), Health Care & Social Assistance (11 | 15.7%), Transportation & Warehousing (6 | 8.6%), and Information (6 | 8.6%).
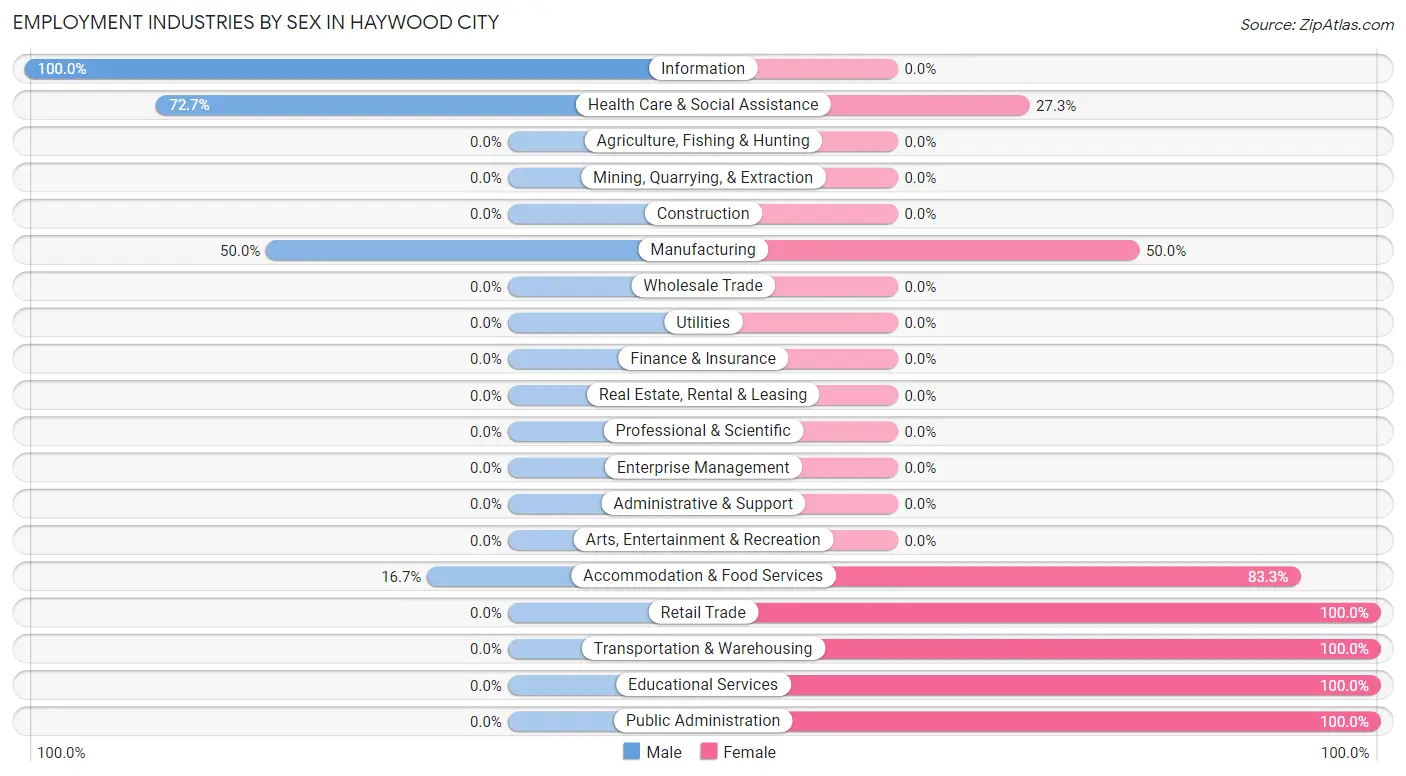
Employment Industries by Sex in Haywood City
The Haywood City industries that see more men than women are Information (100.0%), Health Care & Social Assistance (72.7%), and Manufacturing (50.0%), whereas the industries that tend to have a higher number of women are Retail Trade (100.0%), Transportation & Warehousing (100.0%), and Educational Services (100.0%).
| Industry | Male | Female |
| Agriculture, Fishing & Hunting | 0 (0.0%) | 0 (0.0%) |
| Mining, Quarrying, & Extraction | 0 (0.0%) | 0 (0.0%) |
| Construction | 0 (0.0%) | 0 (0.0%) |
| Manufacturing | 8 (50.0%) | 8 (50.0%) |
| Wholesale Trade | 0 (0.0%) | 0 (0.0%) |
| Retail Trade | 0 (0.0%) | 14 (100.0%) |
| Transportation & Warehousing | 0 (0.0%) | 6 (100.0%) |
| Utilities | 0 (0.0%) | 0 (0.0%) |
| Information | 6 (100.0%) | 0 (0.0%) |
| Finance & Insurance | 0 (0.0%) | 0 (0.0%) |
| Real Estate, Rental & Leasing | 0 (0.0%) | 0 (0.0%) |
| Professional & Scientific | 0 (0.0%) | 0 (0.0%) |
| Enterprise Management | 0 (0.0%) | 0 (0.0%) |
| Administrative & Support | 0 (0.0%) | 0 (0.0%) |
| Educational Services | 0 (0.0%) | 1 (100.0%) |
| Health Care & Social Assistance | 8 (72.7%) | 3 (27.3%) |
| Arts, Entertainment & Recreation | 0 (0.0%) | 0 (0.0%) |
| Accommodation & Food Services | 1 (16.7%) | 5 (83.3%) |
| Public Administration | 0 (0.0%) | 3 (100.0%) |
| Total | 23 (32.9%) | 47 (67.1%) |
Education in Haywood City
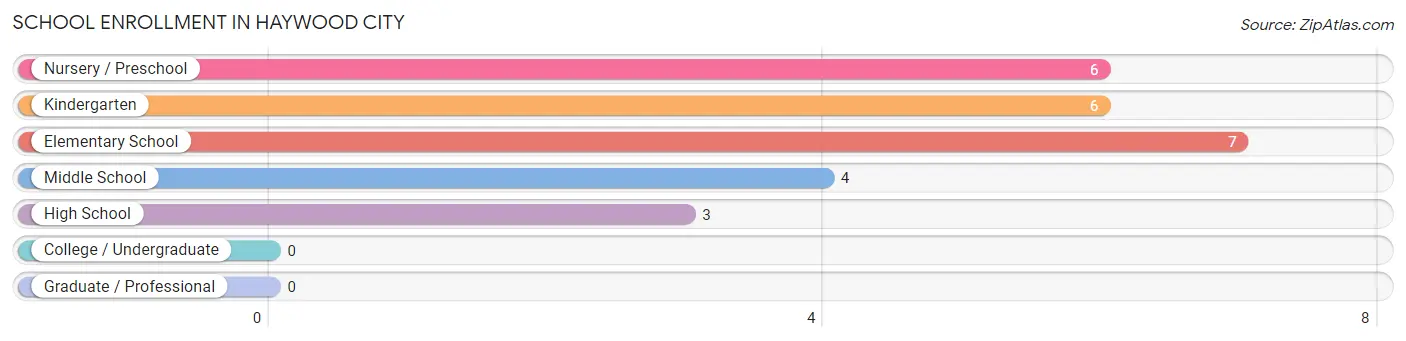
School Enrollment in Haywood City
The most common levels of schooling among the 26 students in Haywood City are elementary school (7 | 26.9%), nursery / preschool (6 | 23.1%), and kindergarten (6 | 23.1%).
| School Level | # Students | % Students |
| Nursery / Preschool | 6 | 23.1% |
| Kindergarten | 6 | 23.1% |
| Elementary School | 7 | 26.9% |
| Middle School | 4 | 15.4% |
| High School | 3 | 11.5% |
| College / Undergraduate | 0 | 0.0% |
| Graduate / Professional | 0 | 0.0% |
| Total | 26 | 100.0% |
School Enrollment by Age by Funding Source in Haywood City
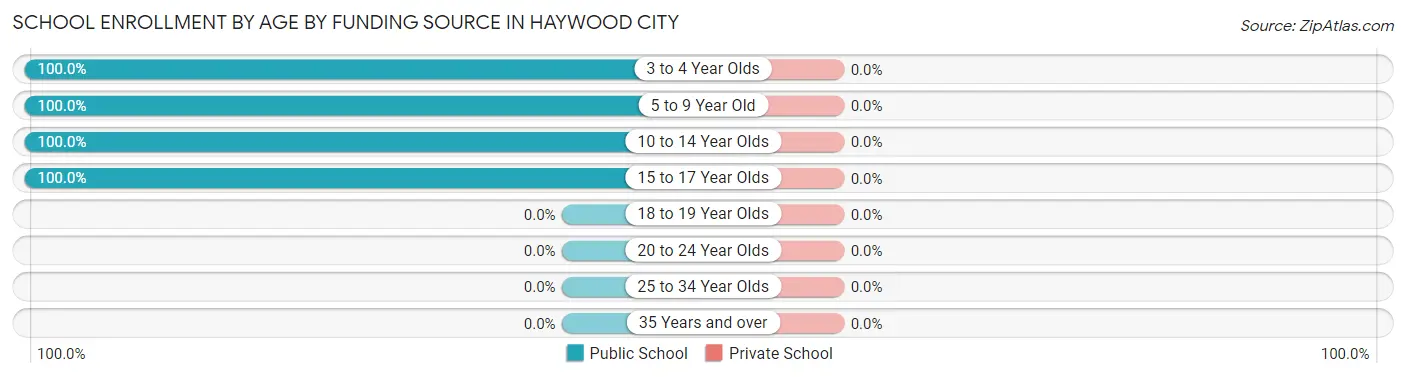
| Age Bracket | Public School | Private School |
| 3 to 4 Year Olds | 6 (100.0%) | 0 (0.0%) |
| 5 to 9 Year Old | 13 (100.0%) | 0 (0.0%) |
| 10 to 14 Year Olds | 4 (100.0%) | 0 (0.0%) |
| 15 to 17 Year Olds | 3 (100.0%) | 0 (0.0%) |
| 18 to 19 Year Olds | 0 (0.0%) | 0 (0.0%) |
| 20 to 24 Year Olds | 0 (0.0%) | 0 (0.0%) |
| 25 to 34 Year Olds | 0 (0.0%) | 0 (0.0%) |
| 35 Years and over | 0 (0.0%) | 0 (0.0%) |
| Total | 26 (100.0%) | 0 (0.0%) |
Educational Attainment by Field of Study in Haywood City
Education (14 | 93.3%), and business (1 | 6.7%) are the most common fields of study among 15 individuals in Haywood City who have obtained a bachelor's degree or higher.
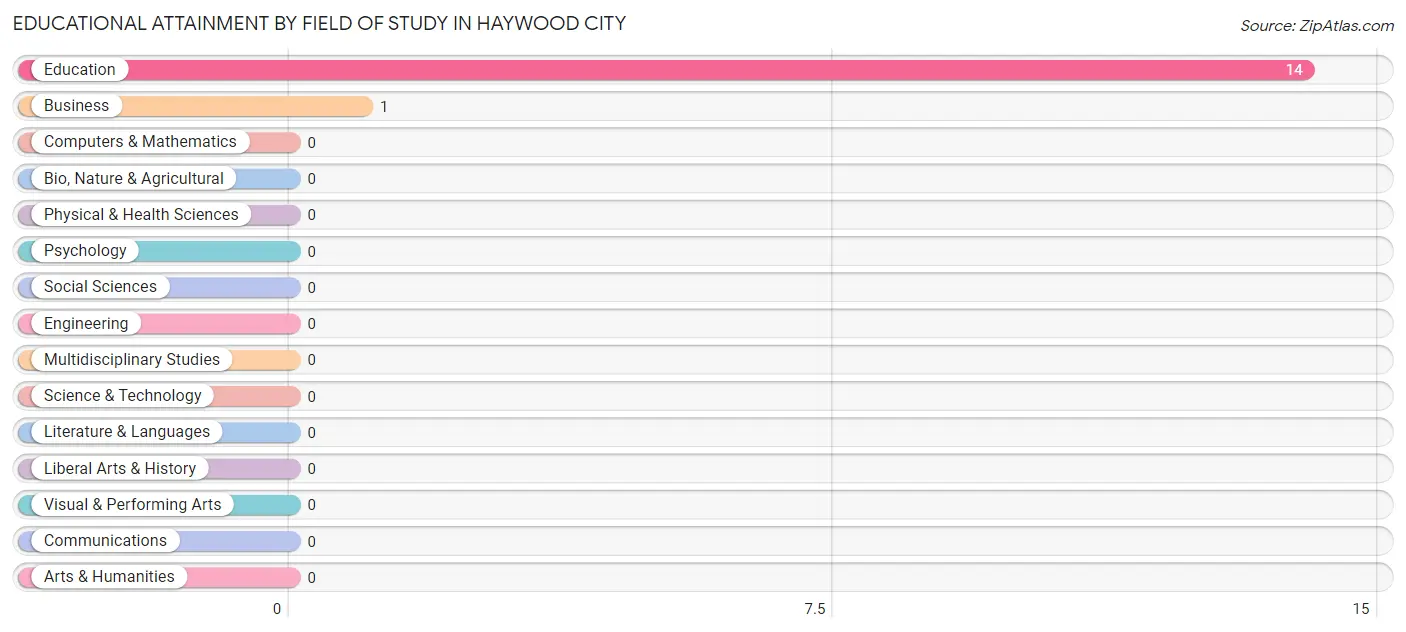
| Field of Study | # Graduates | % Graduates |
| Computers & Mathematics | 0 | 0.0% |
| Bio, Nature & Agricultural | 0 | 0.0% |
| Physical & Health Sciences | 0 | 0.0% |
| Psychology | 0 | 0.0% |
| Social Sciences | 0 | 0.0% |
| Engineering | 0 | 0.0% |
| Multidisciplinary Studies | 0 | 0.0% |
| Science & Technology | 0 | 0.0% |
| Business | 1 | 6.7% |
| Education | 14 | 93.3% |
| Literature & Languages | 0 | 0.0% |
| Liberal Arts & History | 0 | 0.0% |
| Visual & Performing Arts | 0 | 0.0% |
| Communications | 0 | 0.0% |
| Arts & Humanities | 0 | 0.0% |
| Total | 15 | 100.0% |
Transportation & Commute in Haywood City
Vehicle Availability by Sex in Haywood City
The most prevalent vehicle ownership categories in Haywood City are males with 3 vehicles (8, accounting for 34.8%) and females with 3 vehicles (15, making up 17.0%).
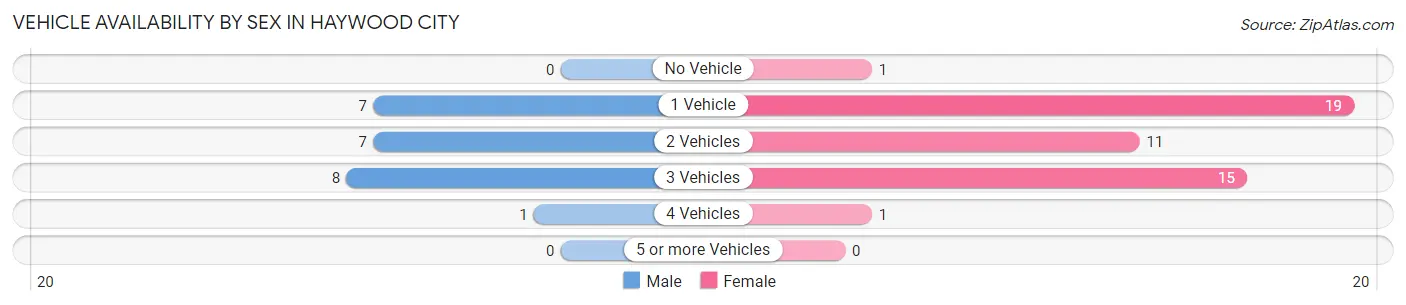
| Vehicles Available | Male | Female |
| No Vehicle | 0 (0.0%) | 1 (2.1%) |
| 1 Vehicle | 7 (30.4%) | 19 (40.4%) |
| 2 Vehicles | 7 (30.4%) | 11 (23.4%) |
| 3 Vehicles | 8 (34.8%) | 15 (31.9%) |
| 4 Vehicles | 1 (4.3%) | 1 (2.1%) |
| 5 or more Vehicles | 0 (0.0%) | 0 (0.0%) |
| Total | 23 (100.0%) | 47 (100.0%) |
Commute Time in Haywood City
The most frequently occuring commute durations in Haywood City are 15 to 19 minutes (28 commuters, 43.8%), 30 to 34 minutes (14 commuters, 21.9%), and 10 to 14 minutes (9 commuters, 14.1%).
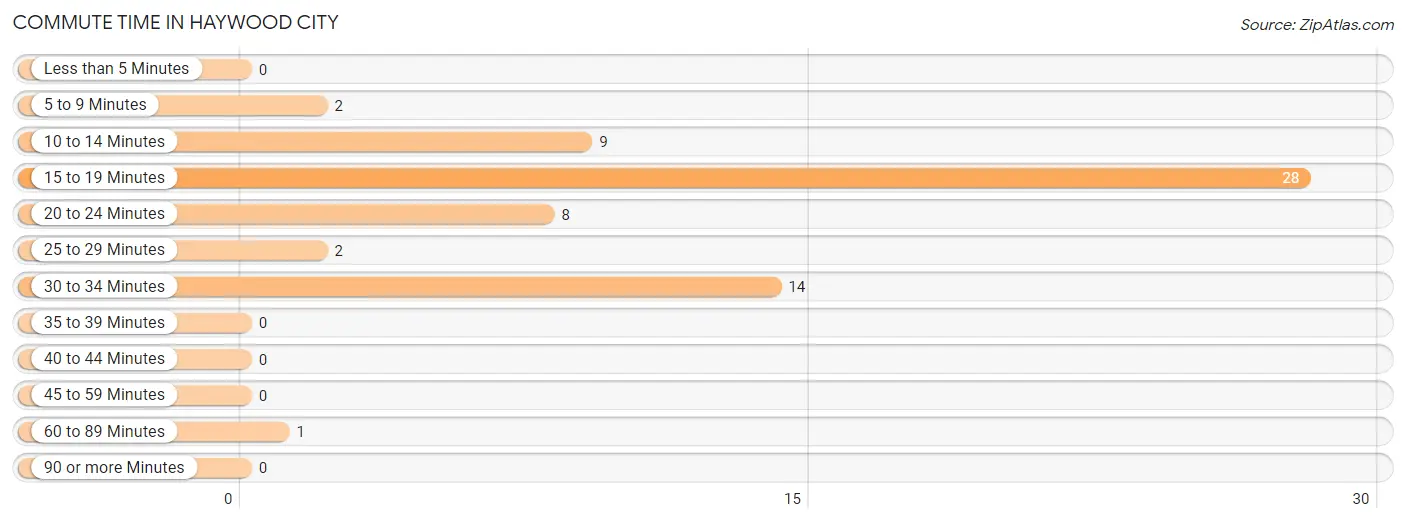
| Commute Time | # Commuters | % Commuters |
| Less than 5 Minutes | 0 | 0.0% |
| 5 to 9 Minutes | 2 | 3.1% |
| 10 to 14 Minutes | 9 | 14.1% |
| 15 to 19 Minutes | 28 | 43.8% |
| 20 to 24 Minutes | 8 | 12.5% |
| 25 to 29 Minutes | 2 | 3.1% |
| 30 to 34 Minutes | 14 | 21.9% |
| 35 to 39 Minutes | 0 | 0.0% |
| 40 to 44 Minutes | 0 | 0.0% |
| 45 to 59 Minutes | 0 | 0.0% |
| 60 to 89 Minutes | 1 | 1.6% |
| 90 or more Minutes | 0 | 0.0% |
Commute Time by Sex in Haywood City
The most common commute times in Haywood City are 15 to 19 minutes (15 commuters, 88.2%) for males and 15 to 19 minutes (13 commuters, 27.7%) for females.
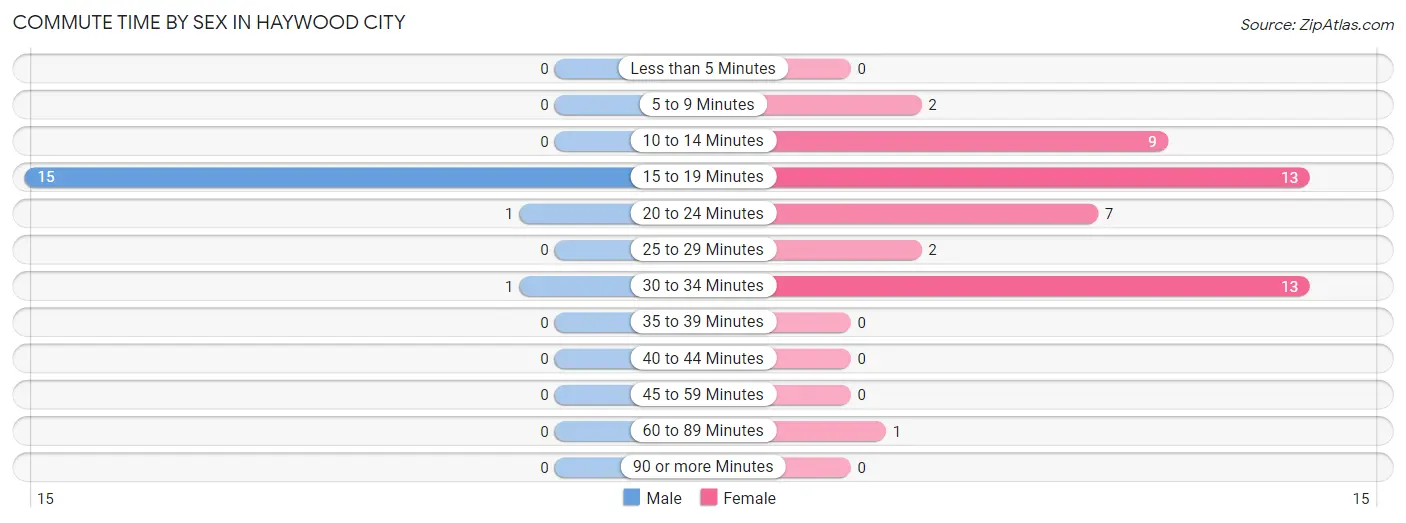
| Commute Time | Male | Female |
| Less than 5 Minutes | 0 (0.0%) | 0 (0.0%) |
| 5 to 9 Minutes | 0 (0.0%) | 2 (4.3%) |
| 10 to 14 Minutes | 0 (0.0%) | 9 (19.2%) |
| 15 to 19 Minutes | 15 (88.2%) | 13 (27.7%) |
| 20 to 24 Minutes | 1 (5.9%) | 7 (14.9%) |
| 25 to 29 Minutes | 0 (0.0%) | 2 (4.3%) |
| 30 to 34 Minutes | 1 (5.9%) | 13 (27.7%) |
| 35 to 39 Minutes | 0 (0.0%) | 0 (0.0%) |
| 40 to 44 Minutes | 0 (0.0%) | 0 (0.0%) |
| 45 to 59 Minutes | 0 (0.0%) | 0 (0.0%) |
| 60 to 89 Minutes | 0 (0.0%) | 1 (2.1%) |
| 90 or more Minutes | 0 (0.0%) | 0 (0.0%) |
Time of Departure to Work by Sex in Haywood City
The most frequent times of departure to work in Haywood City are 12:00 PM to 3:59 PM (8, 47.1%) for males and 9:00 AM to 9:59 AM (13, 27.7%) for females.
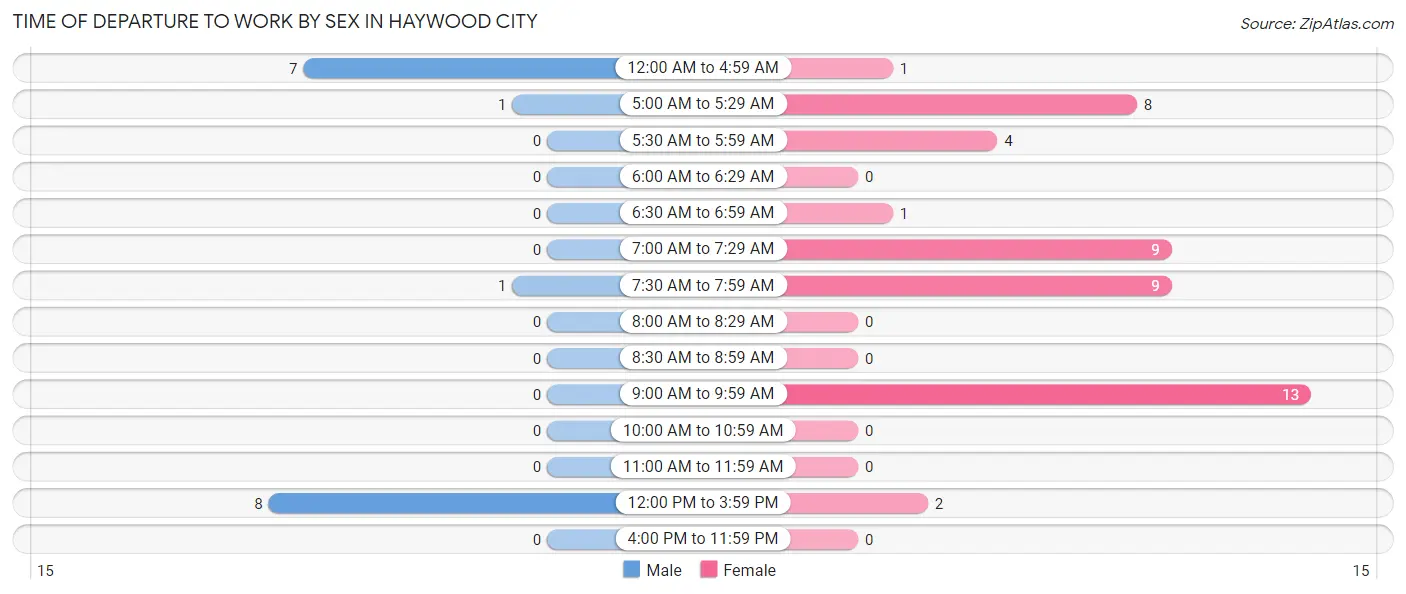
| Time of Departure | Male | Female |
| 12:00 AM to 4:59 AM | 7 (41.2%) | 1 (2.1%) |
| 5:00 AM to 5:29 AM | 1 (5.9%) | 8 (17.0%) |
| 5:30 AM to 5:59 AM | 0 (0.0%) | 4 (8.5%) |
| 6:00 AM to 6:29 AM | 0 (0.0%) | 0 (0.0%) |
| 6:30 AM to 6:59 AM | 0 (0.0%) | 1 (2.1%) |
| 7:00 AM to 7:29 AM | 0 (0.0%) | 9 (19.2%) |
| 7:30 AM to 7:59 AM | 1 (5.9%) | 9 (19.2%) |
| 8:00 AM to 8:29 AM | 0 (0.0%) | 0 (0.0%) |
| 8:30 AM to 8:59 AM | 0 (0.0%) | 0 (0.0%) |
| 9:00 AM to 9:59 AM | 0 (0.0%) | 13 (27.7%) |
| 10:00 AM to 10:59 AM | 0 (0.0%) | 0 (0.0%) |
| 11:00 AM to 11:59 AM | 0 (0.0%) | 0 (0.0%) |
| 12:00 PM to 3:59 PM | 8 (47.1%) | 2 (4.3%) |
| 4:00 PM to 11:59 PM | 0 (0.0%) | 0 (0.0%) |
| Total | 17 (100.0%) | 47 (100.0%) |
Housing Occupancy in Haywood City
Occupancy by Ownership in Haywood City
Of the total 61 dwellings in Haywood City, owner-occupied units account for 43 (70.5%), while renter-occupied units make up 18 (29.5%).
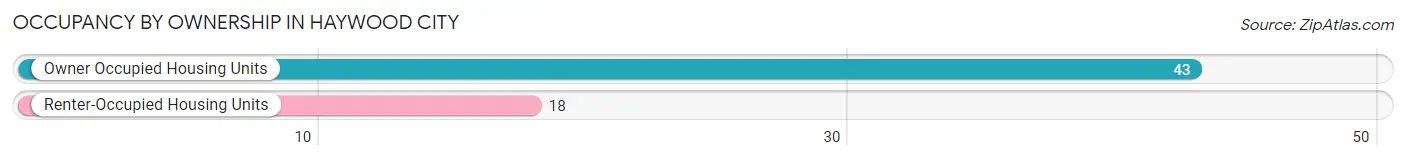
| Occupancy | # Housing Units | % Housing Units |
| Owner Occupied Housing Units | 43 | 70.5% |
| Renter-Occupied Housing Units | 18 | 29.5% |
| Total Occupied Housing Units | 61 | 100.0% |
Occupancy by Household Size in Haywood City
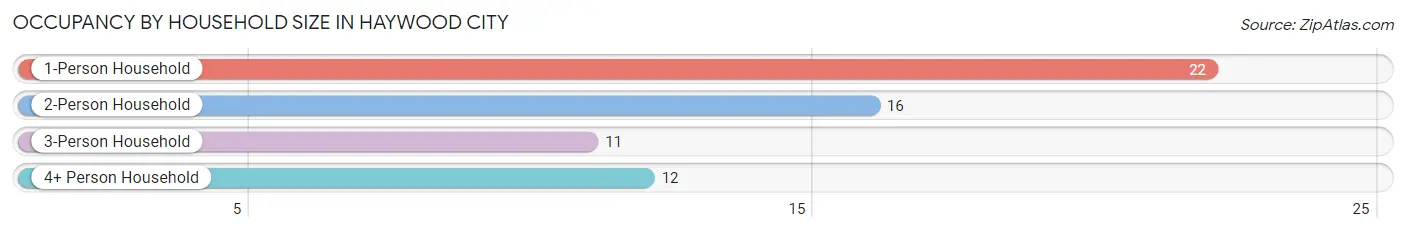
| Household Size | # Housing Units | % Housing Units |
| 1-Person Household | 22 | 36.1% |
| 2-Person Household | 16 | 26.2% |
| 3-Person Household | 11 | 18.0% |
| 4+ Person Household | 12 | 19.7% |
| Total Housing Units | 61 | 100.0% |
Occupancy by Ownership by Household Size in Haywood City
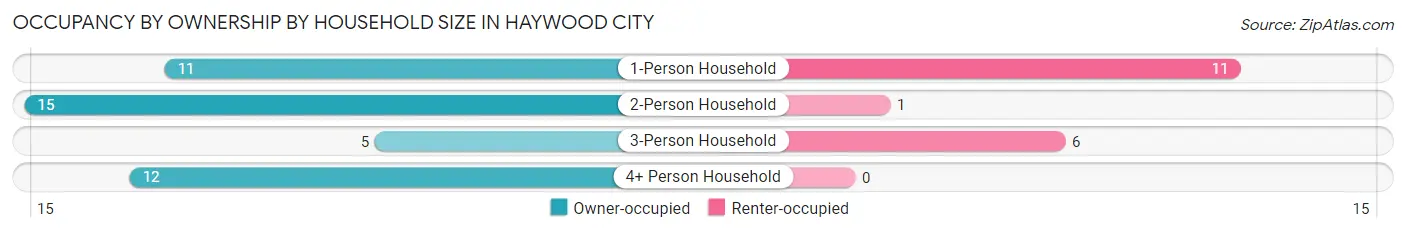
| Household Size | Owner-occupied | Renter-occupied |
| 1-Person Household | 11 (50.0%) | 11 (50.0%) |
| 2-Person Household | 15 (93.8%) | 1 (6.2%) |
| 3-Person Household | 5 (45.5%) | 6 (54.5%) |
| 4+ Person Household | 12 (100.0%) | 0 (0.0%) |
| Total Housing Units | 43 (70.5%) | 18 (29.5%) |
Occupancy by Educational Attainment in Haywood City
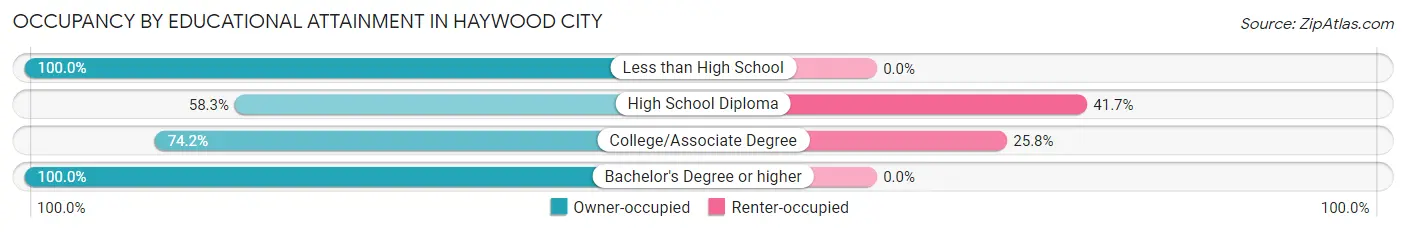
| Household Size | Owner-occupied | Renter-occupied |
| Less than High School | 4 (100.0%) | 0 (0.0%) |
| High School Diploma | 14 (58.3%) | 10 (41.7%) |
| College/Associate Degree | 23 (74.2%) | 8 (25.8%) |
| Bachelor's Degree or higher | 2 (100.0%) | 0 (0.0%) |
Occupancy by Age of Householder in Haywood City
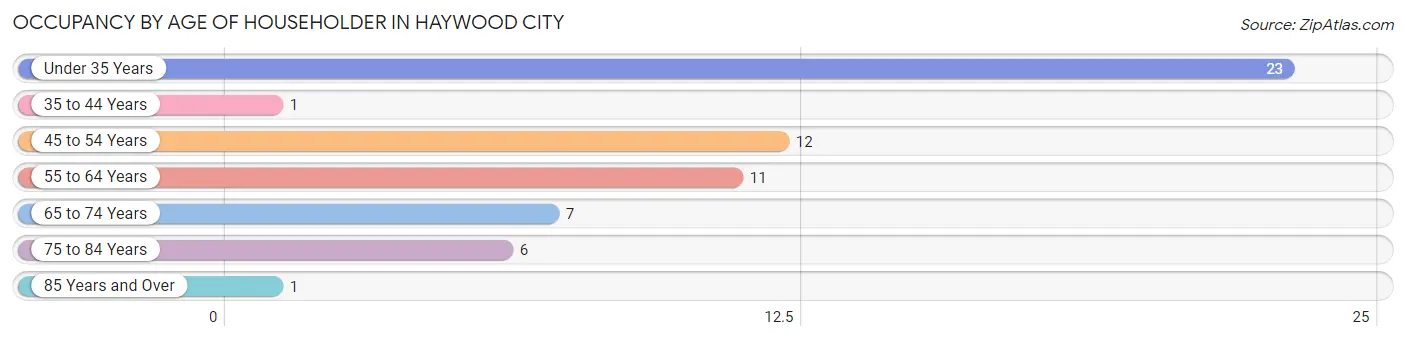
| Age Bracket | # Households | % Households |
| Under 35 Years | 23 | 37.7% |
| 35 to 44 Years | 1 | 1.6% |
| 45 to 54 Years | 12 | 19.7% |
| 55 to 64 Years | 11 | 18.0% |
| 65 to 74 Years | 7 | 11.5% |
| 75 to 84 Years | 6 | 9.8% |
| 85 Years and Over | 1 | 1.6% |
| Total | 61 | 100.0% |
Housing Finances in Haywood City
Median Income by Occupancy in Haywood City
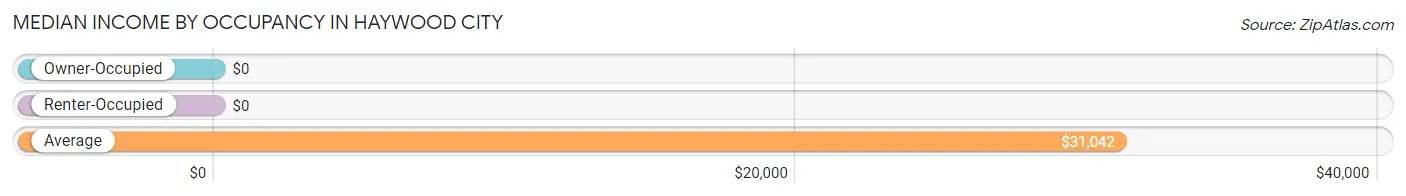
| Occupancy Type | # Households | Median Income |
| Owner-Occupied | 43 (70.5%) | $0 |
| Renter-Occupied | 18 (29.5%) | $0 |
| Average | 61 (100.0%) | $31,042 |
Occupancy by Householder Income Bracket in Haywood City
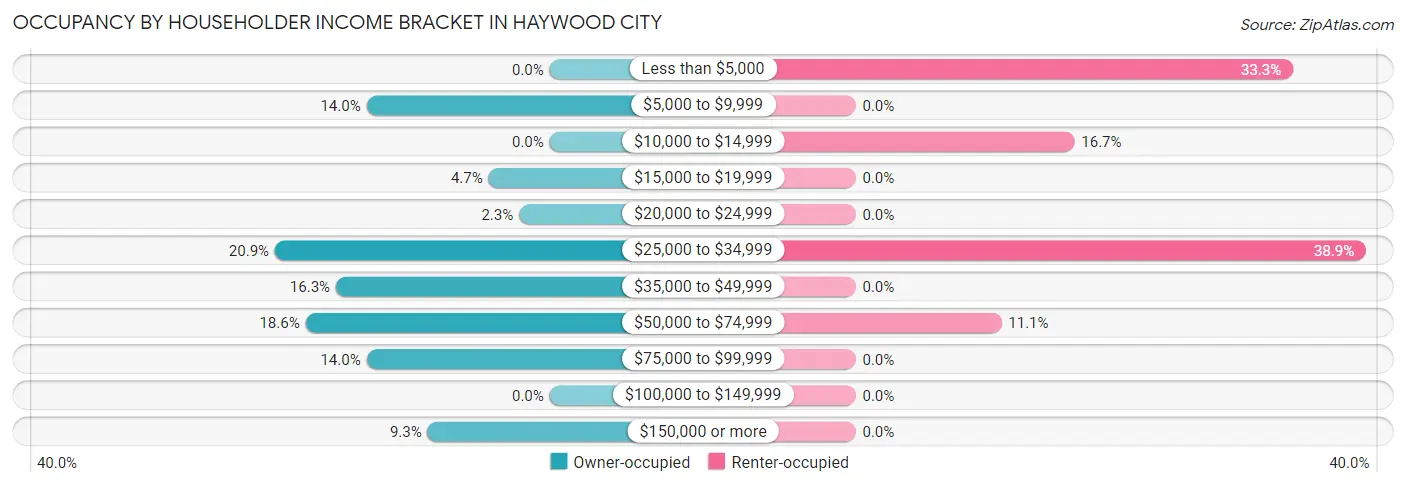
| Income Bracket | Owner-occupied | Renter-occupied |
| Less than $5,000 | 0 (0.0%) | 6 (33.3%) |
| $5,000 to $9,999 | 6 (14.0%) | 0 (0.0%) |
| $10,000 to $14,999 | 0 (0.0%) | 3 (16.7%) |
| $15,000 to $19,999 | 2 (4.6%) | 0 (0.0%) |
| $20,000 to $24,999 | 1 (2.3%) | 0 (0.0%) |
| $25,000 to $34,999 | 9 (20.9%) | 7 (38.9%) |
| $35,000 to $49,999 | 7 (16.3%) | 0 (0.0%) |
| $50,000 to $74,999 | 8 (18.6%) | 2 (11.1%) |
| $75,000 to $99,999 | 6 (14.0%) | 0 (0.0%) |
| $100,000 to $149,999 | 0 (0.0%) | 0 (0.0%) |
| $150,000 or more | 4 (9.3%) | 0 (0.0%) |
| Total | 43 (100.0%) | 18 (100.0%) |
Monthly Housing Cost Tiers in Haywood City
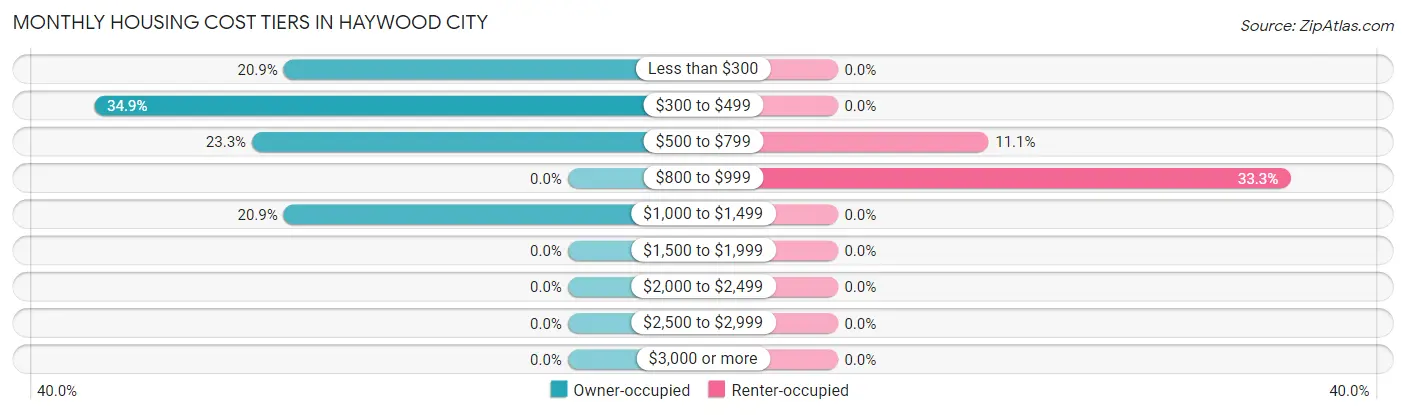
| Monthly Cost | Owner-occupied | Renter-occupied |
| Less than $300 | 9 (20.9%) | 0 (0.0%) |
| $300 to $499 | 15 (34.9%) | 0 (0.0%) |
| $500 to $799 | 10 (23.3%) | 2 (11.1%) |
| $800 to $999 | 0 (0.0%) | 6 (33.3%) |
| $1,000 to $1,499 | 9 (20.9%) | 0 (0.0%) |
| $1,500 to $1,999 | 0 (0.0%) | 0 (0.0%) |
| $2,000 to $2,499 | 0 (0.0%) | 0 (0.0%) |
| $2,500 to $2,999 | 0 (0.0%) | 0 (0.0%) |
| $3,000 or more | 0 (0.0%) | 0 (0.0%) |
| Total | 43 (100.0%) | 18 (100.0%) |
Physical Housing Characteristics in Haywood City
Housing Structures in Haywood City
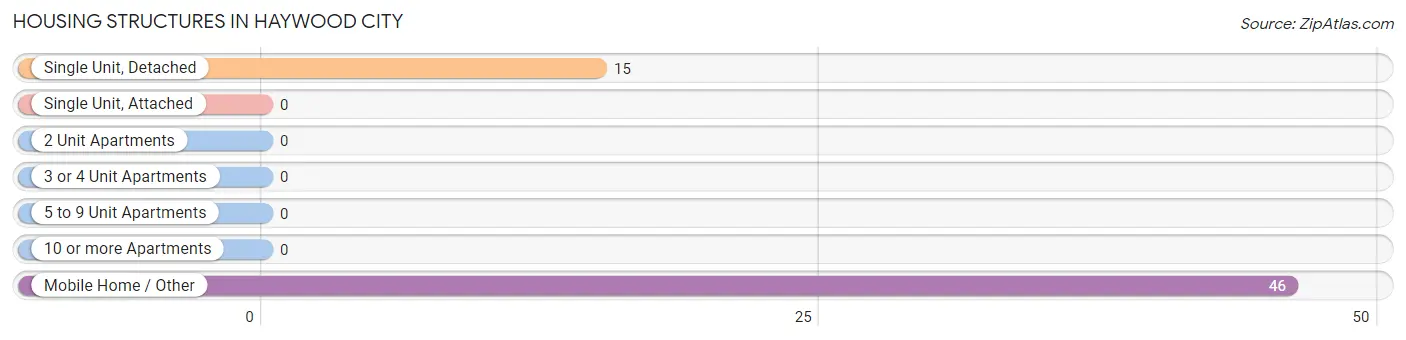
| Structure Type | # Housing Units | % Housing Units |
| Single Unit, Detached | 15 | 24.6% |
| Single Unit, Attached | 0 | 0.0% |
| 2 Unit Apartments | 0 | 0.0% |
| 3 or 4 Unit Apartments | 0 | 0.0% |
| 5 to 9 Unit Apartments | 0 | 0.0% |
| 10 or more Apartments | 0 | 0.0% |
| Mobile Home / Other | 46 | 75.4% |
| Total | 61 | 100.0% |
Housing Structures by Occupancy in Haywood City
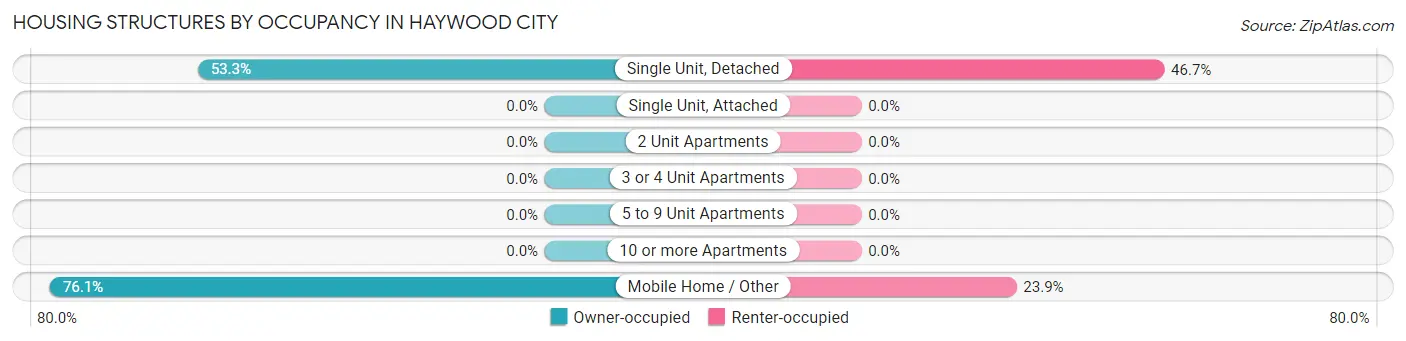
| Structure Type | Owner-occupied | Renter-occupied |
| Single Unit, Detached | 8 (53.3%) | 7 (46.7%) |
| Single Unit, Attached | 0 (0.0%) | 0 (0.0%) |
| 2 Unit Apartments | 0 (0.0%) | 0 (0.0%) |
| 3 or 4 Unit Apartments | 0 (0.0%) | 0 (0.0%) |
| 5 to 9 Unit Apartments | 0 (0.0%) | 0 (0.0%) |
| 10 or more Apartments | 0 (0.0%) | 0 (0.0%) |
| Mobile Home / Other | 35 (76.1%) | 11 (23.9%) |
| Total | 43 (70.5%) | 18 (29.5%) |
Housing Structures by Number of Rooms in Haywood City
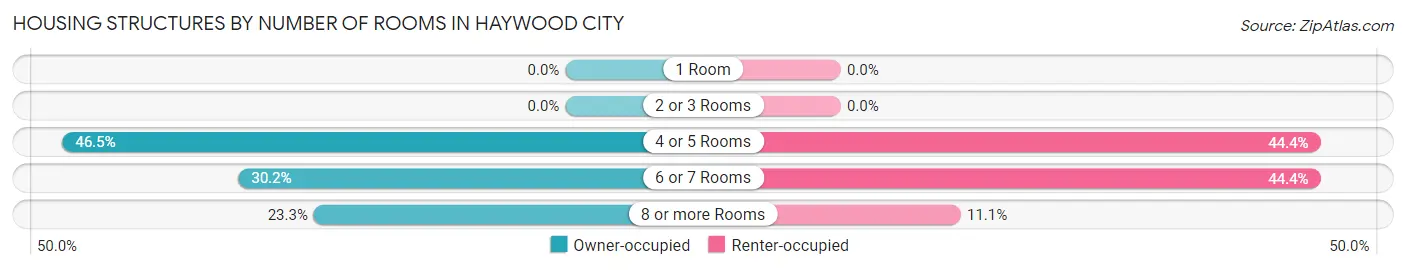
| Number of Rooms | Owner-occupied | Renter-occupied |
| 1 Room | 0 (0.0%) | 0 (0.0%) |
| 2 or 3 Rooms | 0 (0.0%) | 0 (0.0%) |
| 4 or 5 Rooms | 20 (46.5%) | 8 (44.4%) |
| 6 or 7 Rooms | 13 (30.2%) | 8 (44.4%) |
| 8 or more Rooms | 10 (23.3%) | 2 (11.1%) |
| Total | 43 (100.0%) | 18 (100.0%) |
Housing Structure by Heating Type in Haywood City
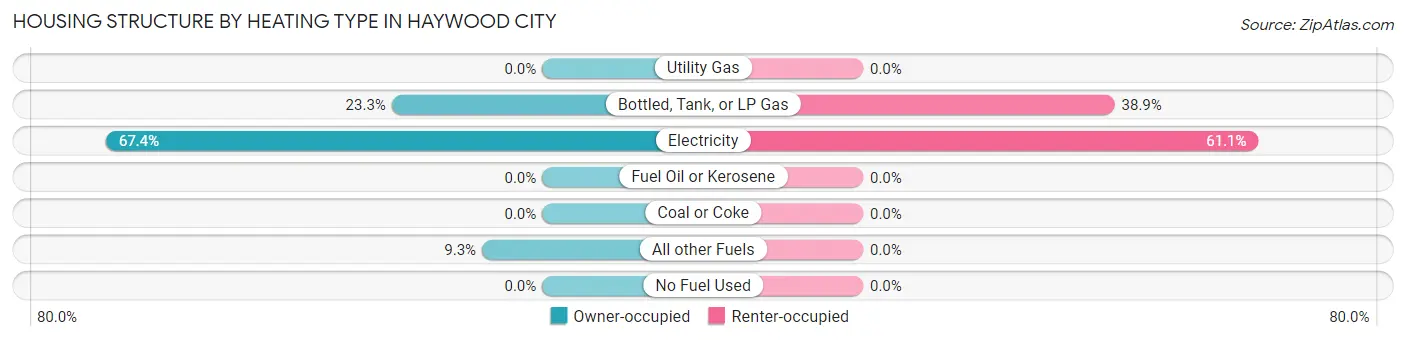
| Heating Type | Owner-occupied | Renter-occupied |
| Utility Gas | 0 (0.0%) | 0 (0.0%) |
| Bottled, Tank, or LP Gas | 10 (23.3%) | 7 (38.9%) |
| Electricity | 29 (67.4%) | 11 (61.1%) |
| Fuel Oil or Kerosene | 0 (0.0%) | 0 (0.0%) |
| Coal or Coke | 0 (0.0%) | 0 (0.0%) |
| All other Fuels | 4 (9.3%) | 0 (0.0%) |
| No Fuel Used | 0 (0.0%) | 0 (0.0%) |
| Total | 43 (100.0%) | 18 (100.0%) |
Household Vehicle Usage in Haywood City
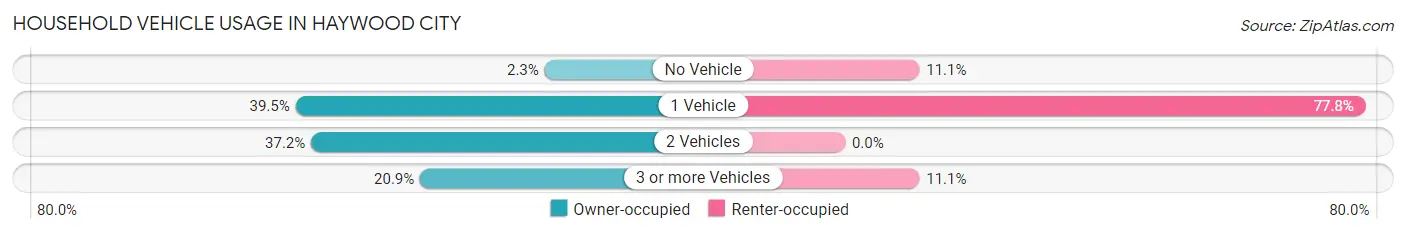
| Vehicles per Household | Owner-occupied | Renter-occupied |
| No Vehicle | 1 (2.3%) | 2 (11.1%) |
| 1 Vehicle | 17 (39.5%) | 14 (77.8%) |
| 2 Vehicles | 16 (37.2%) | 0 (0.0%) |
| 3 or more Vehicles | 9 (20.9%) | 2 (11.1%) |
| Total | 43 (100.0%) | 18 (100.0%) |
Real Estate & Mortgages in Haywood City
Real Estate and Mortgage Overview in Haywood City
| Characteristic | Without Mortgage | With Mortgage |
| Housing Units | 22 | 21 |
| Median Property Value | $20,000 | $0 |
| Median Household Income | - | - |
| Monthly Housing Costs | $314 | $0 |
| Real Estate Taxes | $467 | $0 |
Property Value by Mortgage Status in Haywood City

| Property Value | Without Mortgage | With Mortgage |
| Less than $50,000 | 17 (77.3%) | 10 (47.6%) |
| $50,000 to $99,999 | 4 (18.2%) | 10 (47.6%) |
| $100,000 to $299,999 | 1 (4.5%) | 1 (4.8%) |
| $300,000 to $499,999 | 0 (0.0%) | 0 (0.0%) |
| $500,000 to $749,999 | 0 (0.0%) | 0 (0.0%) |
| $750,000 to $999,999 | 0 (0.0%) | 0 (0.0%) |
| $1,000,000 or more | 0 (0.0%) | 0 (0.0%) |
| Total | 22 (100.0%) | 21 (100.0%) |
Household Income by Mortgage Status in Haywood City
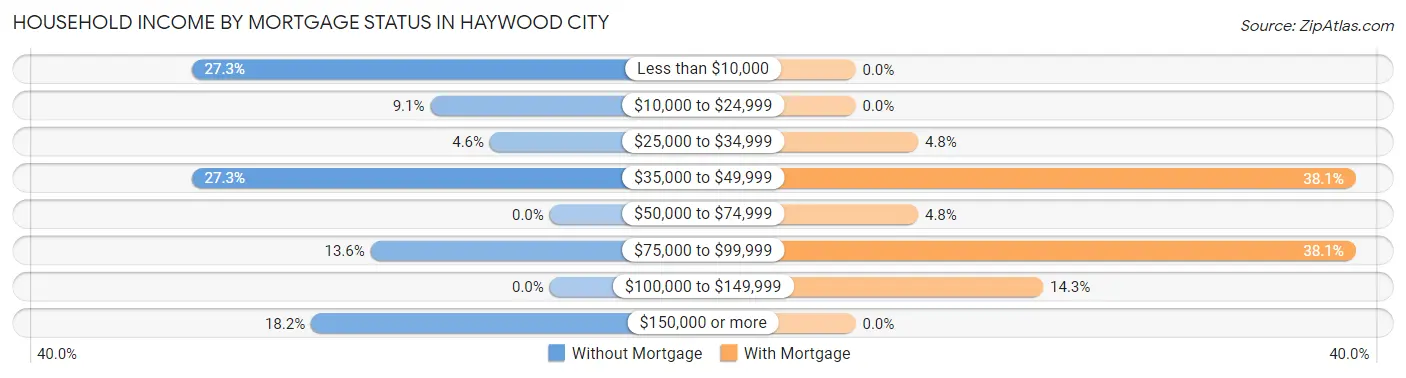
| Household Income | Without Mortgage | With Mortgage |
| Less than $10,000 | 6 (27.3%) | 0 (0.0%) |
| $10,000 to $24,999 | 2 (9.1%) | 0 (0.0%) |
| $25,000 to $34,999 | 1 (4.5%) | 1 (4.8%) |
| $35,000 to $49,999 | 6 (27.3%) | 8 (38.1%) |
| $50,000 to $74,999 | 0 (0.0%) | 1 (4.8%) |
| $75,000 to $99,999 | 3 (13.6%) | 8 (38.1%) |
| $100,000 to $149,999 | 0 (0.0%) | 3 (14.3%) |
| $150,000 or more | 4 (18.2%) | 0 (0.0%) |
| Total | 22 (100.0%) | 21 (100.0%) |
Property Value to Household Income Ratio in Haywood City
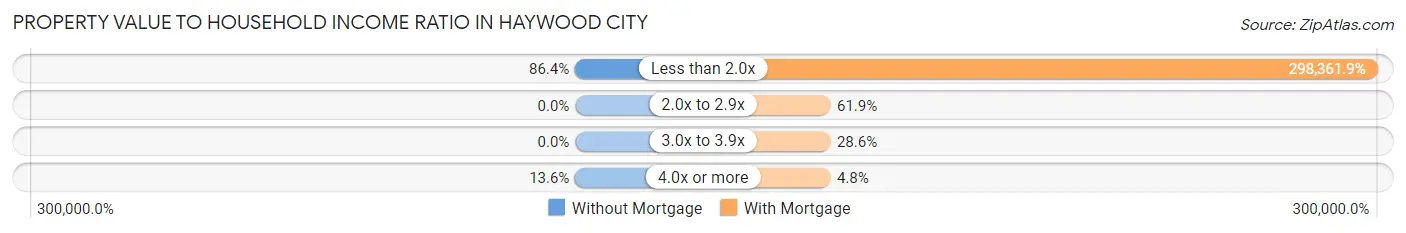
| Value-to-Income Ratio | Without Mortgage | With Mortgage |
| Less than 2.0x | 19 (86.4%) | 62,656 (298,361.9%) |
| 2.0x to 2.9x | 0 (0.0%) | 13 (61.9%) |
| 3.0x to 3.9x | 0 (0.0%) | 6 (28.6%) |
| 4.0x or more | 3 (13.6%) | 1 (4.8%) |
| Total | 22 (100.0%) | 21 (100.0%) |
Real Estate Taxes by Mortgage Status in Haywood City
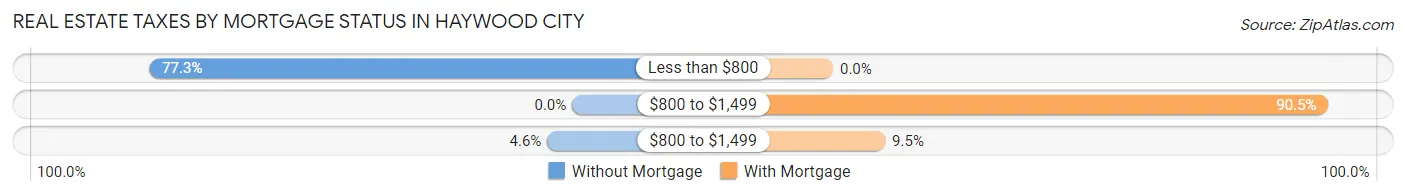
| Property Taxes | Without Mortgage | With Mortgage |
| Less than $800 | 17 (77.3%) | 0 (0.0%) |
| $800 to $1,499 | 0 (0.0%) | 19 (90.5%) |
| $800 to $1,499 | 1 (4.5%) | 2 (9.5%) |
| Total | 22 (100.0%) | 21 (100.0%) |
Health & Disability in Haywood City
Health Insurance Coverage by Age in Haywood City
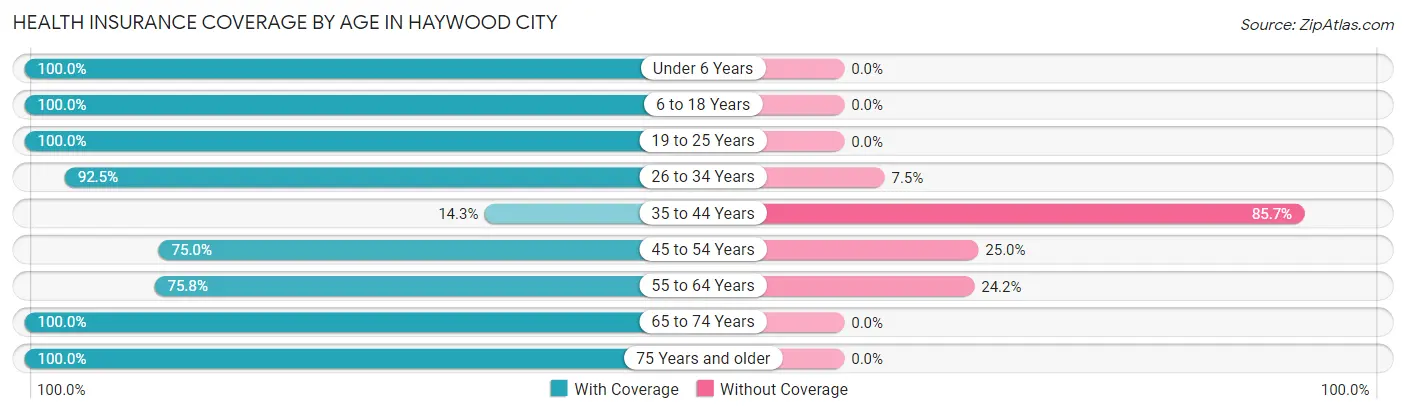
| Age Bracket | With Coverage | Without Coverage |
| Under 6 Years | 32 (100.0%) | 0 (0.0%) |
| 6 to 18 Years | 14 (100.0%) | 0 (0.0%) |
| 19 to 25 Years | 7 (100.0%) | 0 (0.0%) |
| 26 to 34 Years | 37 (92.5%) | 3 (7.5%) |
| 35 to 44 Years | 1 (14.3%) | 6 (85.7%) |
| 45 to 54 Years | 12 (75.0%) | 4 (25.0%) |
| 55 to 64 Years | 25 (75.8%) | 8 (24.2%) |
| 65 to 74 Years | 15 (100.0%) | 0 (0.0%) |
| 75 Years and older | 8 (100.0%) | 0 (0.0%) |
| Total | 151 (87.8%) | 21 (12.2%) |
Health Insurance Coverage by Citizenship Status in Haywood City
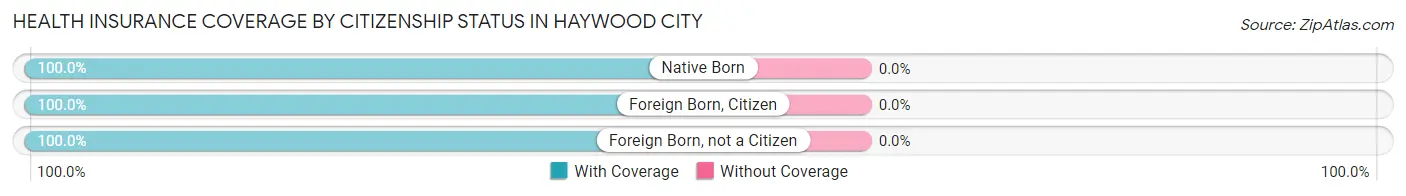
| Citizenship Status | With Coverage | Without Coverage |
| Native Born | 32 (100.0%) | 0 (0.0%) |
| Foreign Born, Citizen | 14 (100.0%) | 0 (0.0%) |
| Foreign Born, not a Citizen | 7 (100.0%) | 0 (0.0%) |
Health Insurance Coverage by Household Income in Haywood City
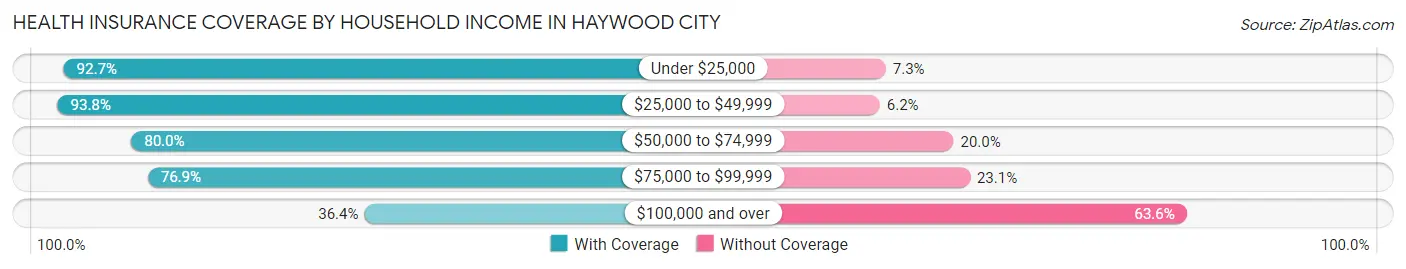
| Household Income | With Coverage | Without Coverage |
| Under $25,000 | 38 (92.7%) | 3 (7.3%) |
| $25,000 to $49,999 | 91 (93.8%) | 6 (6.2%) |
| $50,000 to $74,999 | 8 (80.0%) | 2 (20.0%) |
| $75,000 to $99,999 | 10 (76.9%) | 3 (23.1%) |
| $100,000 and over | 4 (36.4%) | 7 (63.6%) |
Public vs Private Health Insurance Coverage by Age in Haywood City
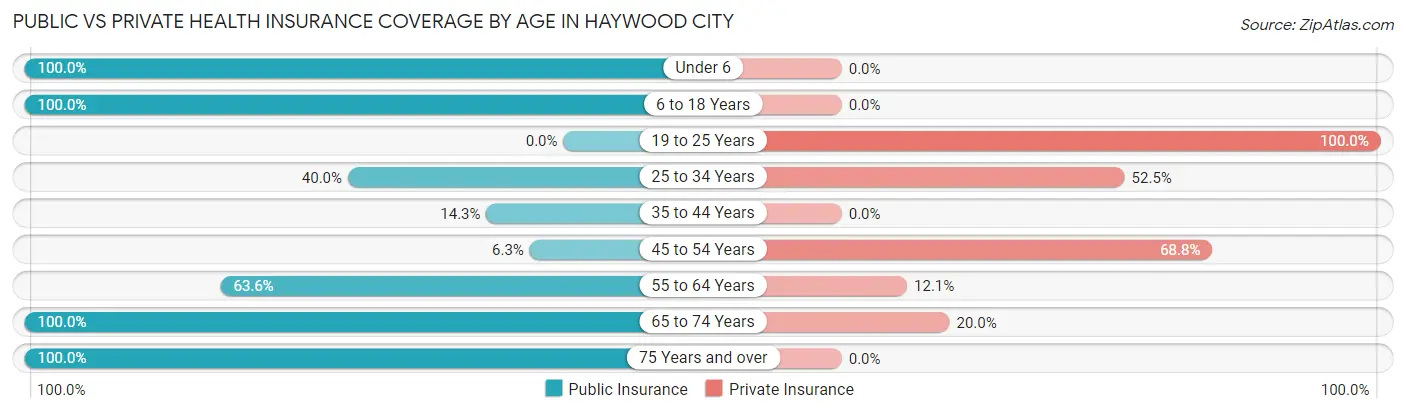
| Age Bracket | Public Insurance | Private Insurance |
| Under 6 | 32 (100.0%) | 0 (0.0%) |
| 6 to 18 Years | 14 (100.0%) | 0 (0.0%) |
| 19 to 25 Years | 0 (0.0%) | 7 (100.0%) |
| 25 to 34 Years | 16 (40.0%) | 21 (52.5%) |
| 35 to 44 Years | 1 (14.3%) | 0 (0.0%) |
| 45 to 54 Years | 1 (6.2%) | 11 (68.8%) |
| 55 to 64 Years | 21 (63.6%) | 4 (12.1%) |
| 65 to 74 Years | 15 (100.0%) | 3 (20.0%) |
| 75 Years and over | 8 (100.0%) | 0 (0.0%) |
| Total | 108 (62.8%) | 46 (26.7%) |
Disability Status by Sex by Age in Haywood City
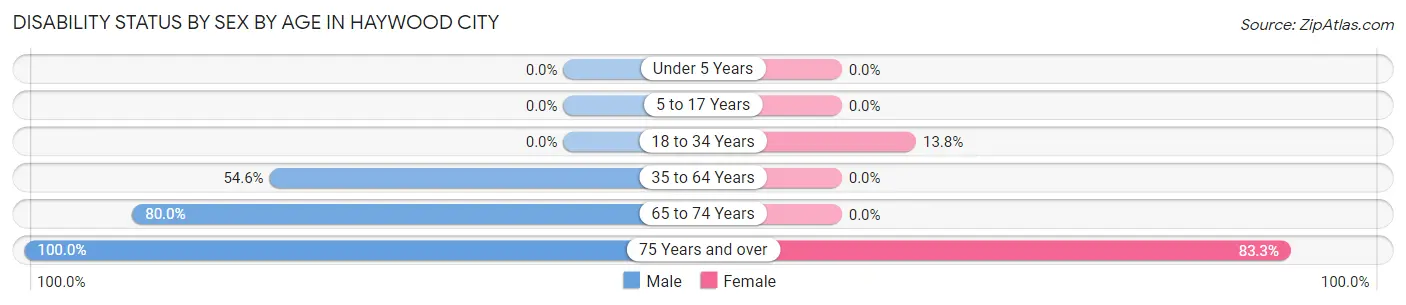
| Age Bracket | Male | Female |
| Under 5 Years | 0 (0.0%) | 0 (0.0%) |
| 5 to 17 Years | 0 (0.0%) | 0 (0.0%) |
| 18 to 34 Years | 0 (0.0%) | 4 (13.8%) |
| 35 to 64 Years | 18 (54.5%) | 0 (0.0%) |
| 65 to 74 Years | 4 (80.0%) | 0 (0.0%) |
| 75 Years and over | 2 (100.0%) | 5 (83.3%) |
Disability Class by Sex by Age in Haywood City
Disability Class: Hearing Difficulty
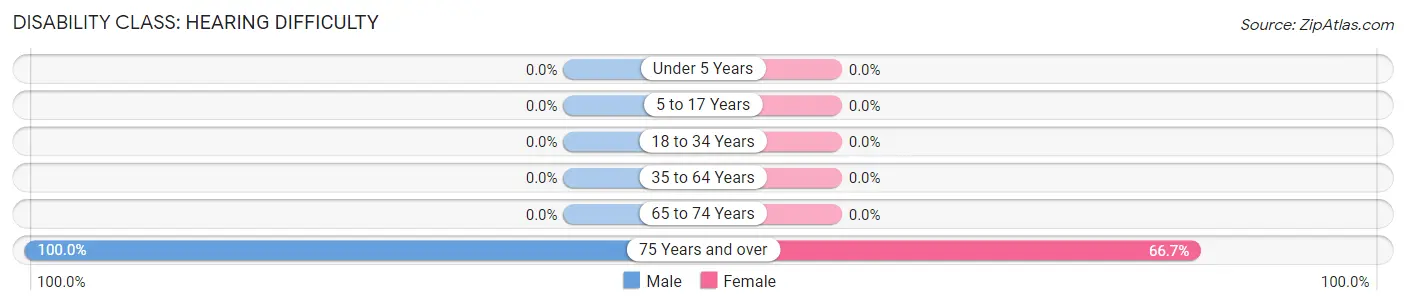
| Age Bracket | Male | Female |
| Under 5 Years | 0 (0.0%) | 0 (0.0%) |
| 5 to 17 Years | 0 (0.0%) | 0 (0.0%) |
| 18 to 34 Years | 0 (0.0%) | 0 (0.0%) |
| 35 to 64 Years | 0 (0.0%) | 0 (0.0%) |
| 65 to 74 Years | 0 (0.0%) | 0 (0.0%) |
| 75 Years and over | 2 (100.0%) | 4 (66.7%) |
Disability Class: Vision Difficulty
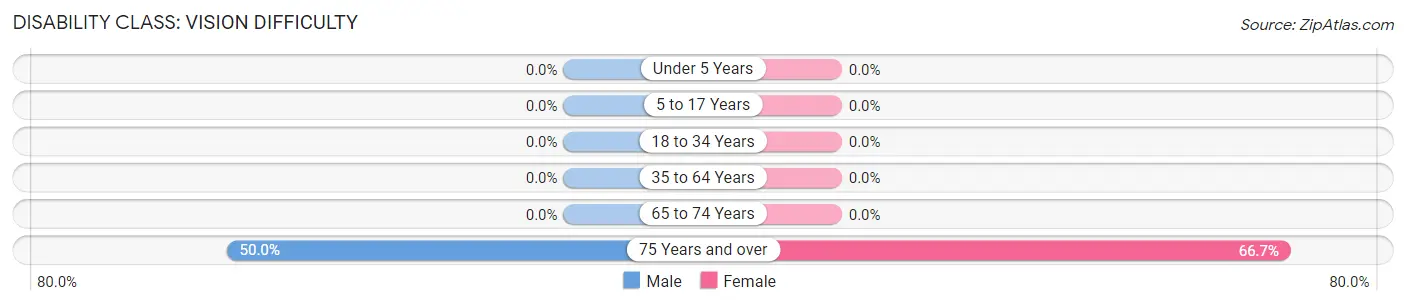
| Age Bracket | Male | Female |
| Under 5 Years | 0 (0.0%) | 0 (0.0%) |
| 5 to 17 Years | 0 (0.0%) | 0 (0.0%) |
| 18 to 34 Years | 0 (0.0%) | 0 (0.0%) |
| 35 to 64 Years | 0 (0.0%) | 0 (0.0%) |
| 65 to 74 Years | 0 (0.0%) | 0 (0.0%) |
| 75 Years and over | 1 (50.0%) | 4 (66.7%) |
Disability Class: Cognitive Difficulty
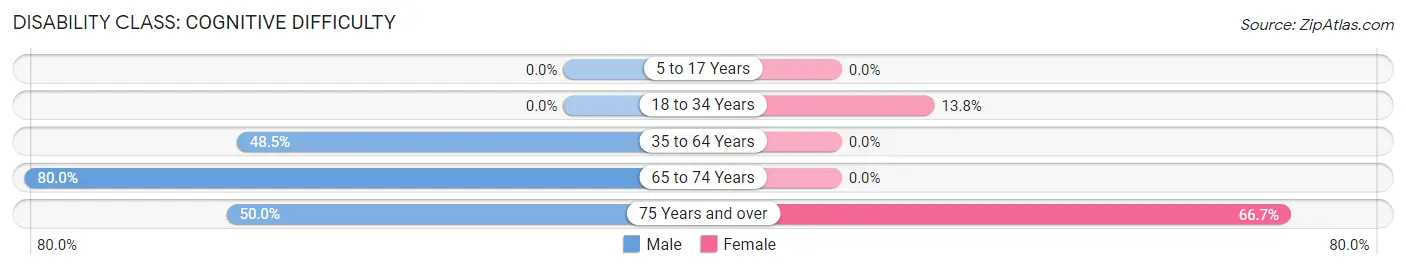
| Age Bracket | Male | Female |
| 5 to 17 Years | 0 (0.0%) | 0 (0.0%) |
| 18 to 34 Years | 0 (0.0%) | 4 (13.8%) |
| 35 to 64 Years | 16 (48.5%) | 0 (0.0%) |
| 65 to 74 Years | 4 (80.0%) | 0 (0.0%) |
| 75 Years and over | 1 (50.0%) | 4 (66.7%) |
Disability Class: Ambulatory Difficulty
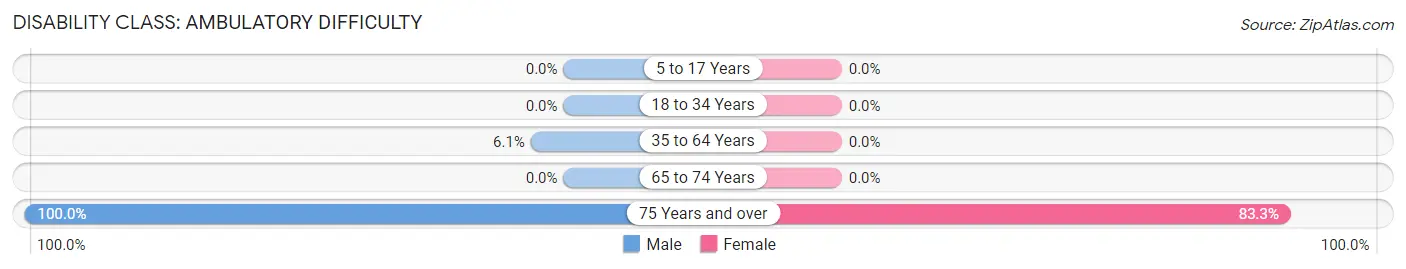
| Age Bracket | Male | Female |
| 5 to 17 Years | 0 (0.0%) | 0 (0.0%) |
| 18 to 34 Years | 0 (0.0%) | 0 (0.0%) |
| 35 to 64 Years | 2 (6.1%) | 0 (0.0%) |
| 65 to 74 Years | 0 (0.0%) | 0 (0.0%) |
| 75 Years and over | 2 (100.0%) | 5 (83.3%) |
Disability Class: Self-Care Difficulty
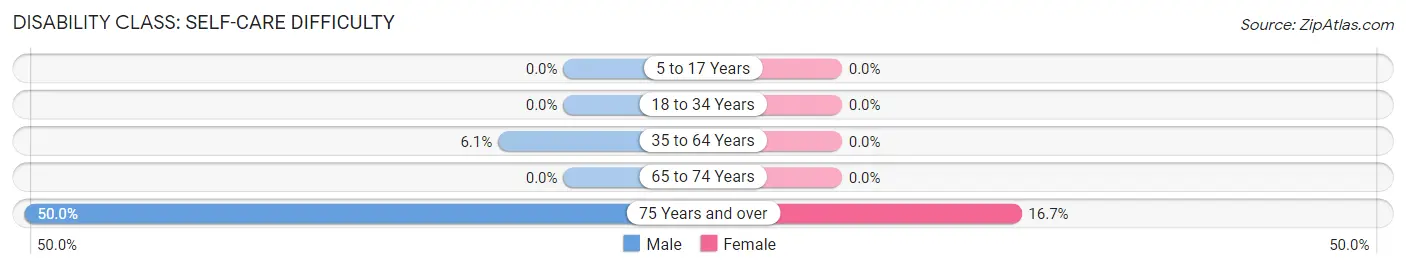
| Age Bracket | Male | Female |
| 5 to 17 Years | 0 (0.0%) | 0 (0.0%) |
| 18 to 34 Years | 0 (0.0%) | 0 (0.0%) |
| 35 to 64 Years | 2 (6.1%) | 0 (0.0%) |
| 65 to 74 Years | 0 (0.0%) | 0 (0.0%) |
| 75 Years and over | 1 (50.0%) | 1 (16.7%) |
Technology Access in Haywood City
Computing Device Access in Haywood City
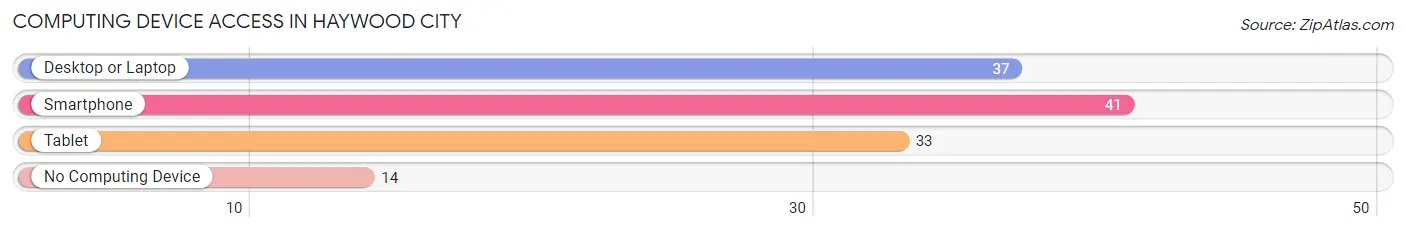
| Device Type | # Households | % Households |
| Desktop or Laptop | 37 | 60.7% |
| Smartphone | 41 | 67.2% |
| Tablet | 33 | 54.1% |
| No Computing Device | 14 | 23.0% |
| Total | 61 | 100.0% |
Internet Access in Haywood City
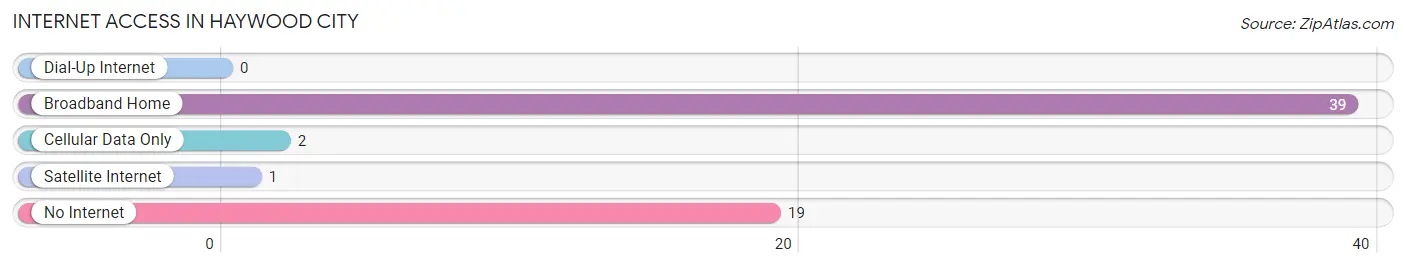
| Internet Type | # Households | % Households |
| Dial-Up Internet | 0 | 0.0% |
| Broadband Home | 39 | 63.9% |
| Cellular Data Only | 2 | 3.3% |
| Satellite Internet | 1 | 1.6% |
| No Internet | 19 | 31.1% |
| Total | 61 | 100.0% |
Haywood City Summary
Haywood City is a small city located in the state of Missouri, United States. It is situated in the southeastern corner of the state, in the Ozark Mountains region. The city is located in the county of Ozark, and is part of the Springfield Metropolitan Statistical Area. As of the 2010 census, the population of Haywood City was 1,845.
Geography
Haywood City is located at 37°14'25"N 92°45'45"W (37.240278, -92.7625). It is situated in the Ozark Mountains region of Missouri, in the southeastern corner of the state. The city is located in the county of Ozark, and is part of the Springfield Metropolitan Statistical Area. The city has a total area of 1.2 square miles, all of which is land.
Climate
Haywood City has a humid subtropical climate, with hot, humid summers and mild winters. The average annual temperature is around 60°F, with an average high of around 80°F in the summer and an average low of around 40°F in the winter. The average annual precipitation is around 40 inches.
Demographics
As of the 2010 census, the population of Haywood City was 1,845. The racial makeup of the city was 95.2% White, 0.7% African American, 0.3% Native American, 0.3% Asian, 0.1% Pacific Islander, 1.2% from other races, and 2.3% from two or more races. Hispanic or Latino of any race were 3.2% of the population.
Economy
The economy of Haywood City is largely based on agriculture and tourism. The city is home to several farms, which produce a variety of crops, including corn, soybeans, wheat, and hay. The city is also home to several tourist attractions, including the Ozark National Scenic Riverways, which offers canoeing, kayaking, and fishing opportunities.
The city is also home to several small businesses, including restaurants, retail stores, and service providers. The city is served by the Ozark Regional Airport, which offers flights to several major cities in the region.
Education
Haywood City is served by the Ozark School District, which operates several elementary, middle, and high schools in the city. The city is also home to several private schools, including the Haywood City Christian Academy.
Conclusion
Haywood City is a small city located in the southeastern corner of Missouri, in the Ozark Mountains region. The city has a population of 1,845, and is part of the Springfield Metropolitan Statistical Area. The economy of Haywood City is largely based on agriculture and tourism, and the city is served by the Ozark School District. Haywood City is a great place to live, work, and visit, and offers a variety of attractions and activities for residents and visitors alike.
Common Questions
What is Per Capita Income in Haywood City?
Per Capita income in Haywood City is $21,810.
What is the Median Family Income in Haywood City?
Median Family Income in Haywood City is $24,167.
What is the Median Household income in Haywood City?
Median Household Income in Haywood City is $31,042.
What is Inequality or Gini Index in Haywood City?
Inequality or Gini Index in Haywood City is 0.47.
What is the Total Population of Haywood City?
Total Population of Haywood City is 172.
What is the Total Male Population of Haywood City?
Total Male Population of Haywood City is 86.
What is the Total Female Population of Haywood City?
Total Female Population of Haywood City is 86.
What is the Ratio of Males per 100 Females in Haywood City?
There are 100.00 Males per 100 Females in Haywood City.
What is the Ratio of Females per 100 Males in Haywood City?
There are 100.00 Females per 100 Males in Haywood City.
What is the Median Population Age in Haywood City?
Median Population Age in Haywood City is 33.1 Years.
What is the Average Family Size in Haywood City
Average Family Size in Haywood City is 3.5 People.
What is the Average Household Size in Haywood City
Average Household Size in Haywood City is 2.8 People.
How Large is the Labor Force in Haywood City?
There are 70 People in the Labor Forcein in Haywood City.
What is the Percentage of People in the Labor Force in Haywood City?
54.3% of People are in the Labor Force in Haywood City.