Denver, MO Map & Demographics
Denver Map
Denver Overview
$15,843
PER CAPITA INCOME
$45,000
AVG FAMILY INCOME
$43,750
AVG HOUSEHOLD INCOME
0.10
INEQUALITY / GINI INDEX
21
TOTAL POPULATION
12
MALE POPULATION
9
FEMALE POPULATION
133.33
MALES / 100 FEMALES
75.00
FEMALES / 100 MALES
56.3
MEDIAN AGE
3.2
AVG FAMILY SIZE
2.6
AVG HOUSEHOLD SIZE
9
LABOR FORCE [ PEOPLE ]
52.9%
PERCENT IN LABOR FORCE
Denver Zip Codes
Denver Area Codes
Income in Denver
Income Overview in Denver
Per Capita Income in Denver is $15,843, while median incomes of families and households are $45,000 and $43,750 respectively.
| Characteristic | Number | Measure |
| Per Capita Income | 21 | $15,843 |
| Median Family Income | 6 | $45,000 |
| Mean Family Income | 6 | $42,783 |
| Median Household Income | 8 | $43,750 |
| Mean Household Income | 8 | $39,700 |
| Income Deficit | 6 | $0 |
| Wage / Income Gap (%) | 21 | 0.00% |
| Wage / Income Gap ($) | 21 | 100.00¢ per $1 |
| Gini / Inequality Index | 21 | 0.10 |
Earnings by Sex in Denver
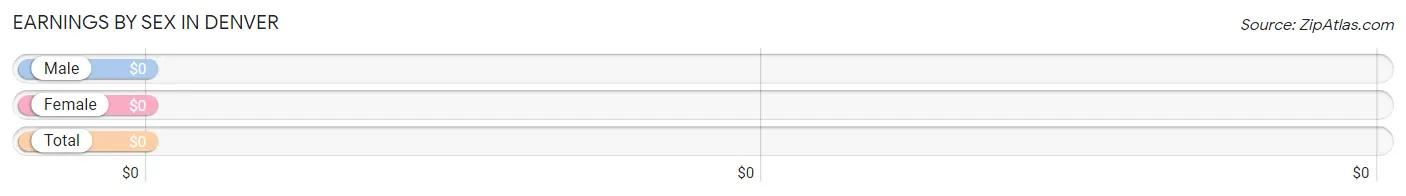
| Sex | Number | Average Earnings |
| Male | 7 (77.8%) | $0 |
| Female | 2 (22.2%) | $0 |
| Total | 9 (100.0%) | $0 |
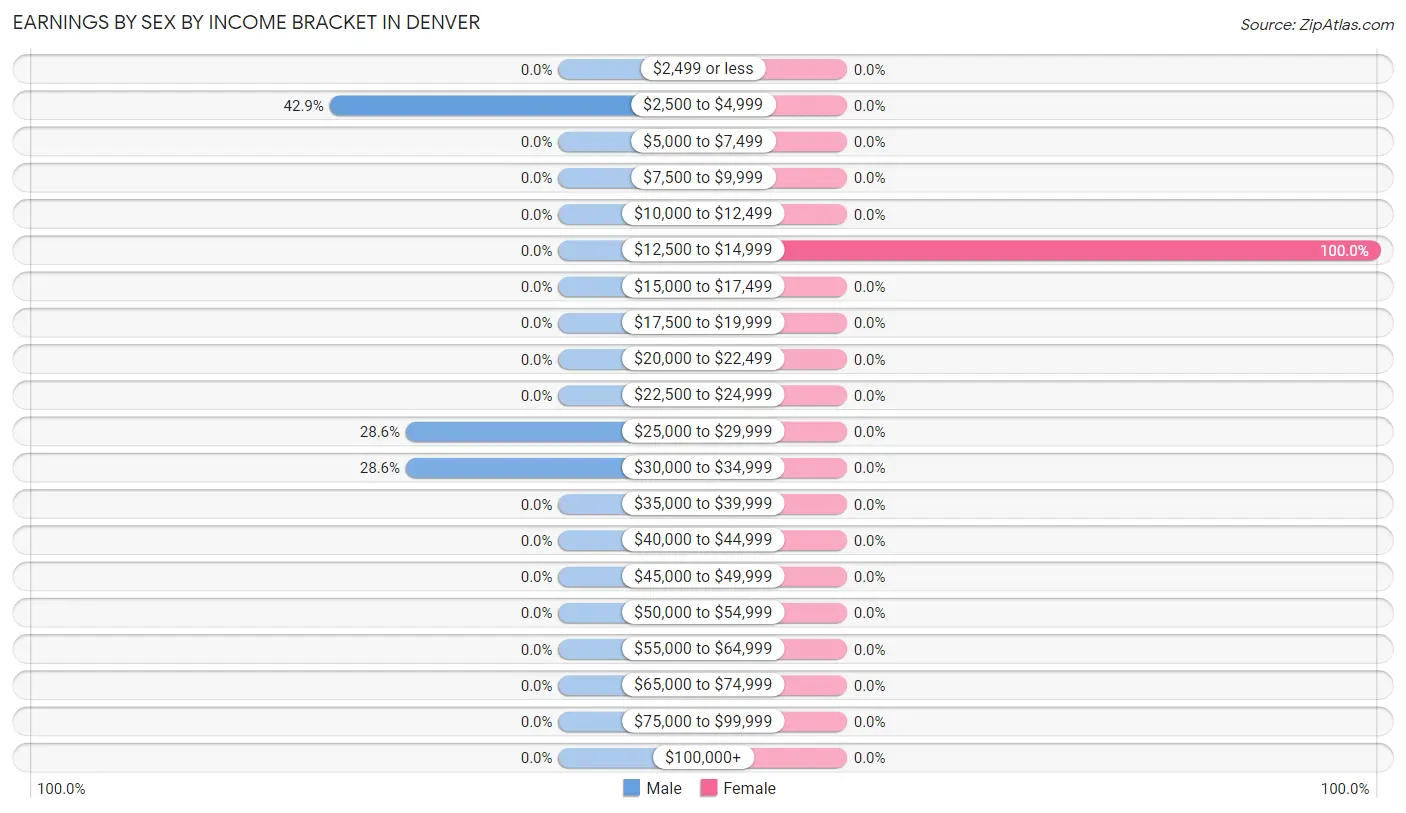
Earnings by Sex by Income Bracket in Denver
The most common earnings brackets in Denver are $2,500 to $4,999 for men (3 | 42.9%) and $12,500 to $14,999 for women (2 | 100.0%).
| Income | Male | Female |
| $2,499 or less | 0 (0.0%) | 0 (0.0%) |
| $2,500 to $4,999 | 3 (42.9%) | 0 (0.0%) |
| $5,000 to $7,499 | 0 (0.0%) | 0 (0.0%) |
| $7,500 to $9,999 | 0 (0.0%) | 0 (0.0%) |
| $10,000 to $12,499 | 0 (0.0%) | 0 (0.0%) |
| $12,500 to $14,999 | 0 (0.0%) | 2 (100.0%) |
| $15,000 to $17,499 | 0 (0.0%) | 0 (0.0%) |
| $17,500 to $19,999 | 0 (0.0%) | 0 (0.0%) |
| $20,000 to $22,499 | 0 (0.0%) | 0 (0.0%) |
| $22,500 to $24,999 | 0 (0.0%) | 0 (0.0%) |
| $25,000 to $29,999 | 2 (28.6%) | 0 (0.0%) |
| $30,000 to $34,999 | 2 (28.6%) | 0 (0.0%) |
| $35,000 to $39,999 | 0 (0.0%) | 0 (0.0%) |
| $40,000 to $44,999 | 0 (0.0%) | 0 (0.0%) |
| $45,000 to $49,999 | 0 (0.0%) | 0 (0.0%) |
| $50,000 to $54,999 | 0 (0.0%) | 0 (0.0%) |
| $55,000 to $64,999 | 0 (0.0%) | 0 (0.0%) |
| $65,000 to $74,999 | 0 (0.0%) | 0 (0.0%) |
| $75,000 to $99,999 | 0 (0.0%) | 0 (0.0%) |
| $100,000+ | 0 (0.0%) | 0 (0.0%) |
| Total | 7 (100.0%) | 2 (100.0%) |
Earnings by Sex by Educational Attainment in Denver
| Educational Attainment | Male Income | Female Income |
| Less than High School | - | - |
| High School Diploma | - | - |
| College or Associate's Degree | - | - |
| Bachelor's Degree | - | - |
| Graduate Degree | - | - |
| Total | - | - |
Family Income in Denver
Family Income Brackets in Denver
According to the Denver family income data, there are 5 families falling into the $35,000 to $49,999 income range, which is the most common income bracket and makes up 83.3% of all families.
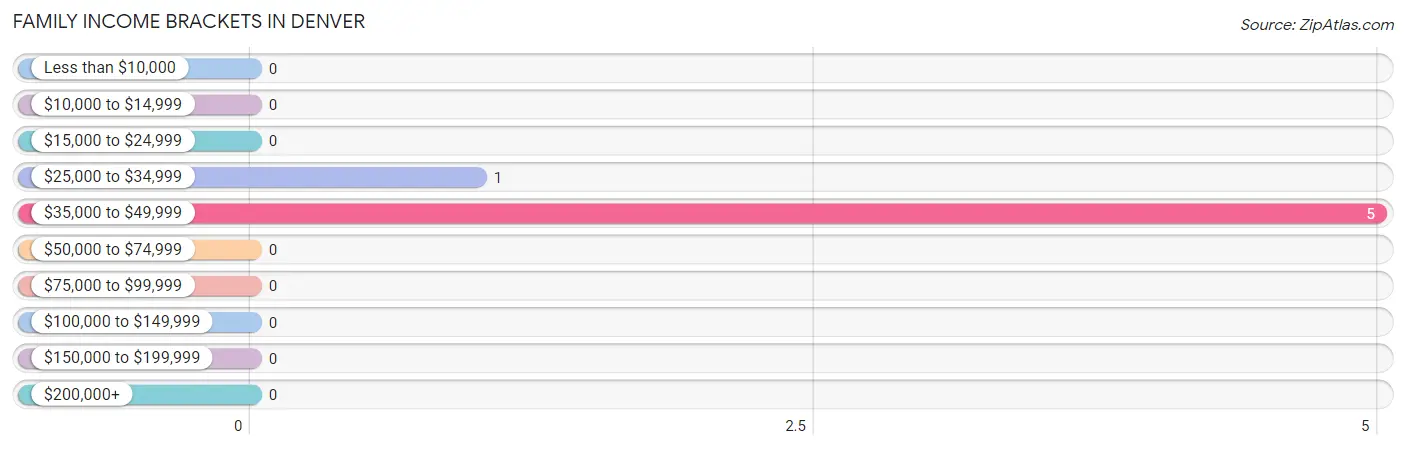
| Income Bracket | # Families | % Families |
| Less than $10,000 | 0 | 0.0% |
| $10,000 to $14,999 | 0 | 0.0% |
| $15,000 to $24,999 | 0 | 0.0% |
| $25,000 to $34,999 | 1 | 16.7% |
| $35,000 to $49,999 | 5 | 83.3% |
| $50,000 to $74,999 | 0 | 0.0% |
| $75,000 to $99,999 | 0 | 0.0% |
| $100,000 to $149,999 | 0 | 0.0% |
| $150,000 to $199,999 | 0 | 0.0% |
| $200,000+ | 0 | 0.0% |
Family Income by Famaliy Size in Denver
| Income Bracket | # Families | Median Income |
| 2-Person Families | 3 (50.0%) | $0 |
| 3-Person Families | 2 (33.3%) | $0 |
| 4-Person Families | 0 (0.0%) | $0 |
| 5-Person Families | 1 (16.7%) | $0 |
| 6-Person Families | 0 (0.0%) | $0 |
| 7+ Person Families | 0 (0.0%) | $0 |
| Total | 6 (100.0%) | $45,000 |
Family Income by Number of Earners in Denver
| Number of Earners | # Families | Median Income |
| No Earners | 0 (0.0%) | $0 |
| 1 Earner | 4 (66.7%) | $0 |
| 2 Earners | 2 (33.3%) | $0 |
| 3+ Earners | 0 (0.0%) | $0 |
| Total | 6 (100.0%) | $45,000 |
Household Income in Denver
Household Income Brackets in Denver
With 5 households falling in the category, the $35,000 to $49,999 income range is the most frequent in Denver, accounting for 62.5% of all households.
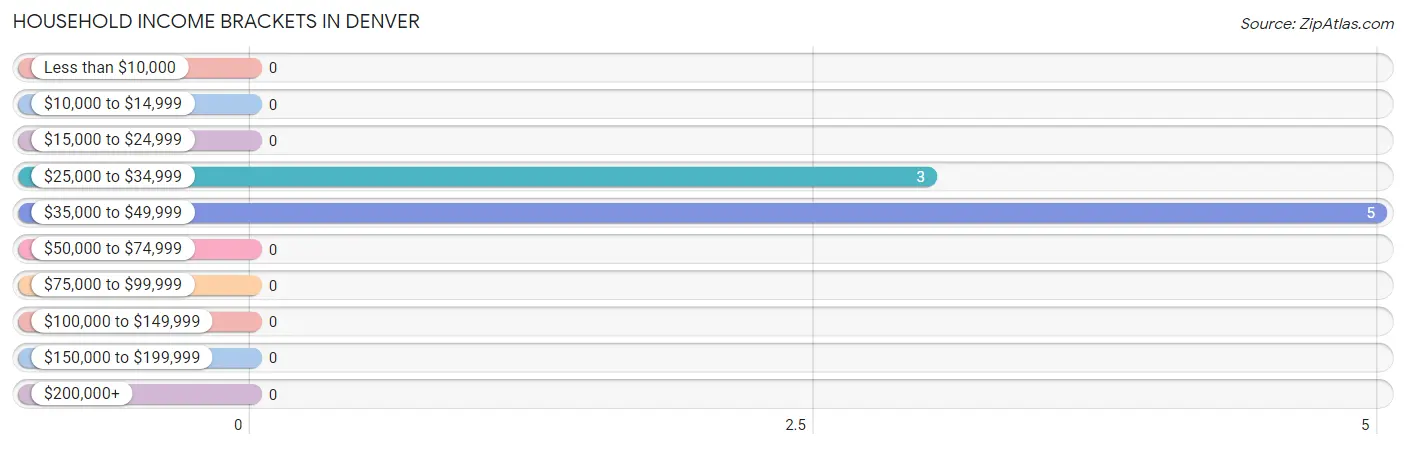
| Income Bracket | # Households | % Households |
| Less than $10,000 | 0 | 0.0% |
| $10,000 to $14,999 | 0 | 0.0% |
| $15,000 to $24,999 | 0 | 0.0% |
| $25,000 to $34,999 | 3 | 37.5% |
| $35,000 to $49,999 | 5 | 62.5% |
| $50,000 to $74,999 | 0 | 0.0% |
| $75,000 to $99,999 | 0 | 0.0% |
| $100,000 to $149,999 | 0 | 0.0% |
| $150,000 to $199,999 | 0 | 0.0% |
| $200,000+ | 0 | 0.0% |
Household Income by Householder Age in Denver
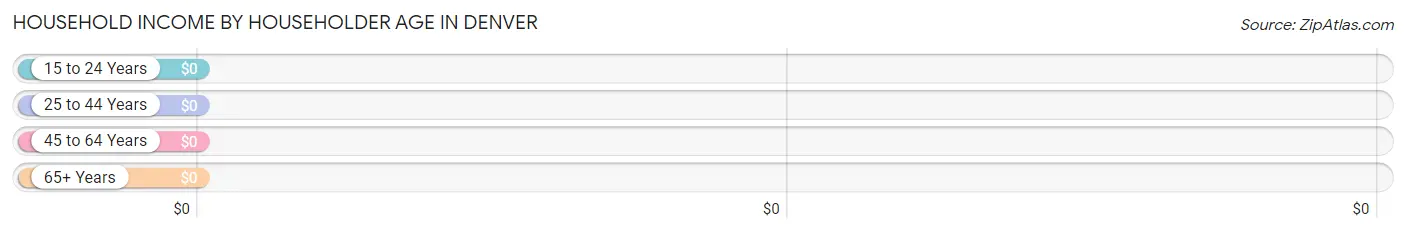
| Income Bracket | # Households | Median Income |
| 15 to 24 Years | 0 (0.0%) | $0 |
| 25 to 44 Years | 1 (12.5%) | $0 |
| 45 to 64 Years | 4 (50.0%) | $0 |
| 65+ Years | 3 (37.5%) | $0 |
| Total | 8 (100.0%) | $43,750 |
Poverty in Denver
Income Below Poverty by Sex and Age in Denver
With 16.7% poverty level for males and 55.6% for females among the residents of Denver, 35 to 44 year old males and under 5 year old females are the most vulnerable to poverty, with 2 males (100.0%) and 1 females (100.0%) in their respective age groups living below the poverty level.
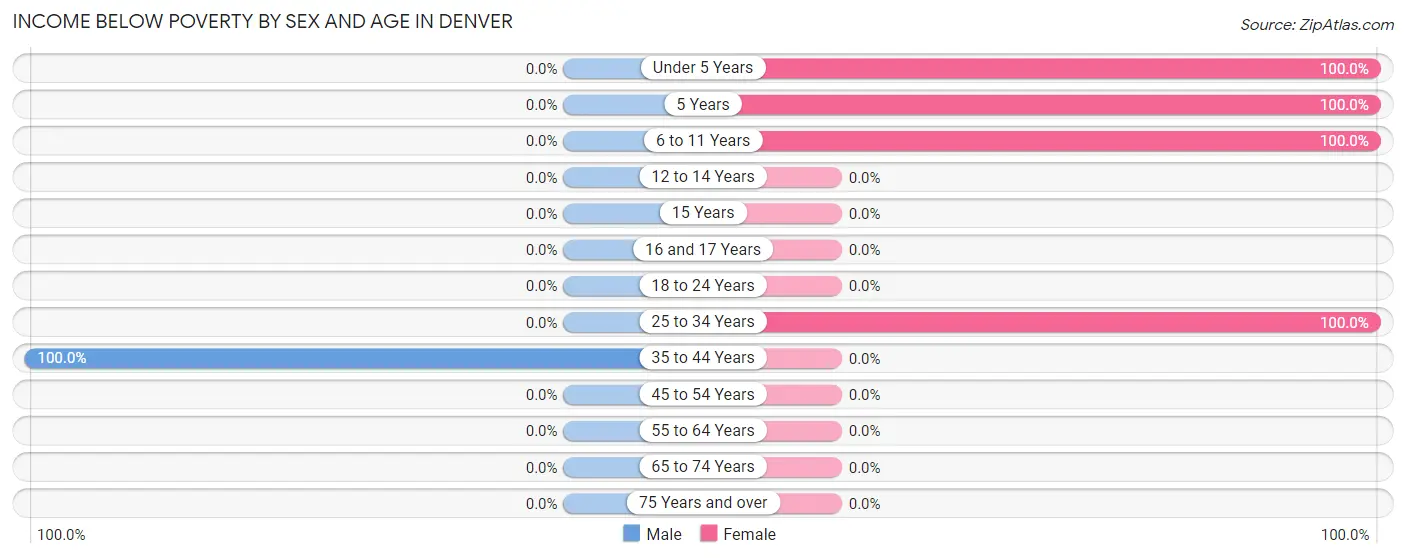
| Age Bracket | Male | Female |
| Under 5 Years | 0 (0.0%) | 1 (100.0%) |
| 5 Years | 0 (0.0%) | 1 (100.0%) |
| 6 to 11 Years | 0 (0.0%) | 2 (100.0%) |
| 12 to 14 Years | 0 (0.0%) | 0 (0.0%) |
| 15 Years | 0 (0.0%) | 0 (0.0%) |
| 16 and 17 Years | 0 (0.0%) | 0 (0.0%) |
| 18 to 24 Years | 0 (0.0%) | 0 (0.0%) |
| 25 to 34 Years | 0 (0.0%) | 1 (100.0%) |
| 35 to 44 Years | 2 (100.0%) | 0 (0.0%) |
| 45 to 54 Years | 0 (0.0%) | 0 (0.0%) |
| 55 to 64 Years | 0 (0.0%) | 0 (0.0%) |
| 65 to 74 Years | 0 (0.0%) | 0 (0.0%) |
| 75 Years and over | 0 (0.0%) | 0 (0.0%) |
| Total | 2 (16.7%) | 5 (55.6%) |
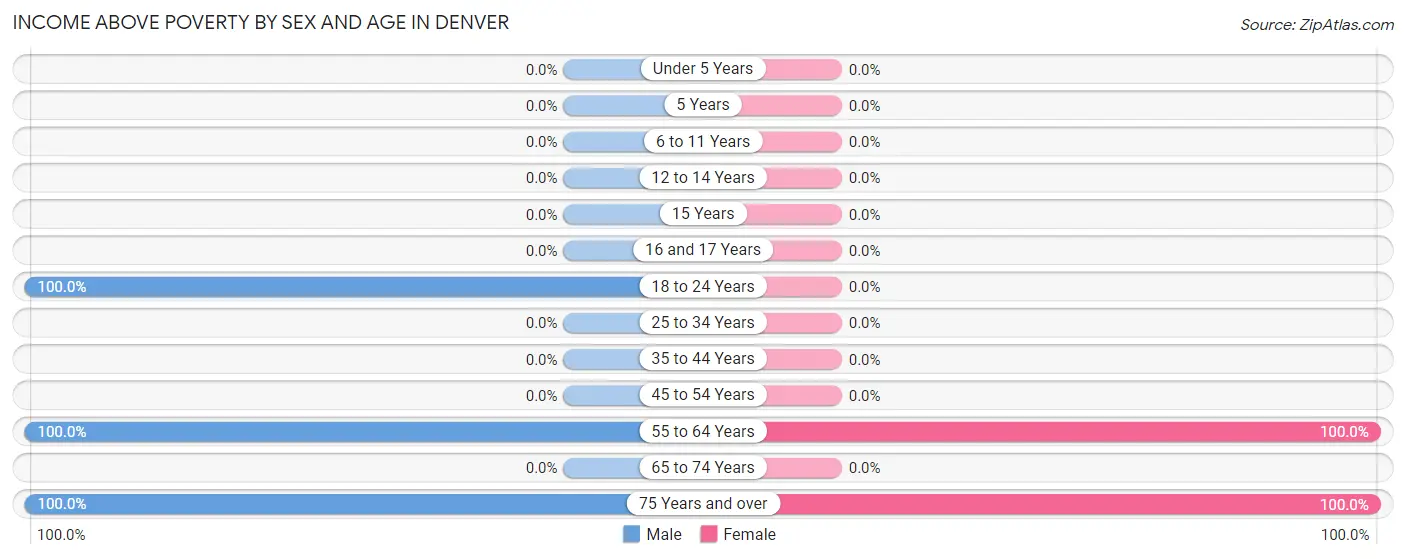
Income Above Poverty by Sex and Age in Denver
According to the poverty statistics in Denver, males aged 18 to 24 years and females aged 55 to 64 years are the age groups that are most secure financially, with 100.0% of males and 100.0% of females in these age groups living above the poverty line.
| Age Bracket | Male | Female |
| Under 5 Years | 0 (0.0%) | 0 (0.0%) |
| 5 Years | 0 (0.0%) | 0 (0.0%) |
| 6 to 11 Years | 0 (0.0%) | 0 (0.0%) |
| 12 to 14 Years | 0 (0.0%) | 0 (0.0%) |
| 15 Years | 0 (0.0%) | 0 (0.0%) |
| 16 and 17 Years | 0 (0.0%) | 0 (0.0%) |
| 18 to 24 Years | 3 (100.0%) | 0 (0.0%) |
| 25 to 34 Years | 0 (0.0%) | 0 (0.0%) |
| 35 to 44 Years | 0 (0.0%) | 0 (0.0%) |
| 45 to 54 Years | 0 (0.0%) | 0 (0.0%) |
| 55 to 64 Years | 4 (100.0%) | 2 (100.0%) |
| 65 to 74 Years | 0 (0.0%) | 0 (0.0%) |
| 75 Years and over | 3 (100.0%) | 2 (100.0%) |
| Total | 10 (83.3%) | 4 (44.4%) |
Income Below Poverty Among Married-Couple Families in Denver
The poverty statistics for married-couple families in Denver show that 16.7% or 1 of the total 6 families live below the poverty line. Families with 3 or 4 children have the highest poverty rate of 100.0%, comprising of 1 families. On the other hand, families with no children have the lowest poverty rate of 0.0%, which includes 0 families.
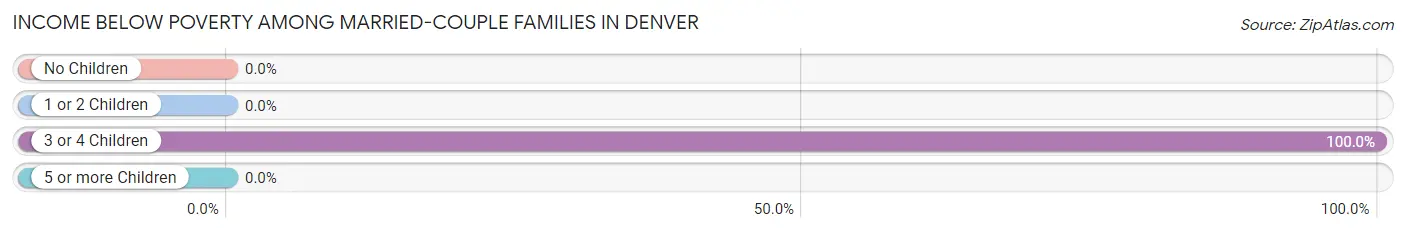
| Children | Above Poverty | Below Poverty |
| No Children | 5 (100.0%) | 0 (0.0%) |
| 1 or 2 Children | 0 (0.0%) | 0 (0.0%) |
| 3 or 4 Children | 0 (0.0%) | 1 (100.0%) |
| 5 or more Children | 0 (0.0%) | 0 (0.0%) |
| Total | 5 (83.3%) | 1 (16.7%) |
Income Below Poverty Among Single-Parent Households in Denver
| Children | Single Father | Single Mother |
| No Children | 0 (0.0%) | 0 (0.0%) |
| 1 or 2 Children | 0 (0.0%) | 0 (0.0%) |
| 3 or 4 Children | 0 (0.0%) | 0 (0.0%) |
| 5 or more Children | 0 (0.0%) | 0 (0.0%) |
| Total | 0 (0.0%) | 0 (0.0%) |
Income Below Poverty Among Married-Couple vs Single-Parent Households in Denver
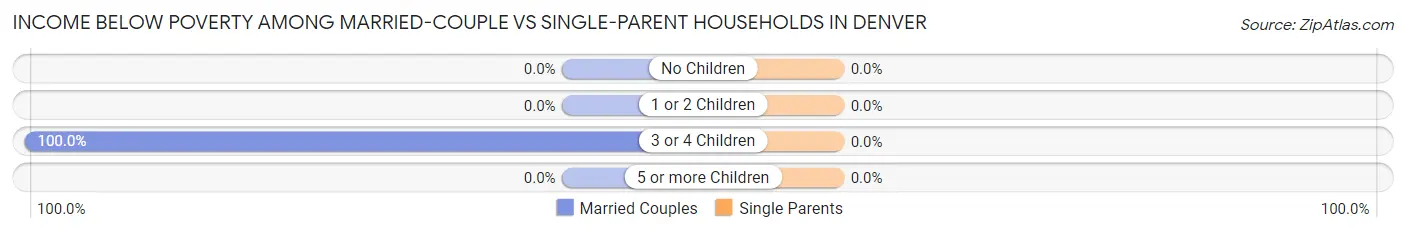
| Children | Married-Couple Families | Single-Parent Households |
| No Children | 0 (0.0%) | 0 (0.0%) |
| 1 or 2 Children | 0 (0.0%) | 0 (0.0%) |
| 3 or 4 Children | 1 (100.0%) | 0 (0.0%) |
| 5 or more Children | 0 (0.0%) | 0 (0.0%) |
| Total | 1 (16.7%) | 0 (0.0%) |
Race in Denver
The most populous races in Denver are , and White / Caucasian (21 | 100.0%).
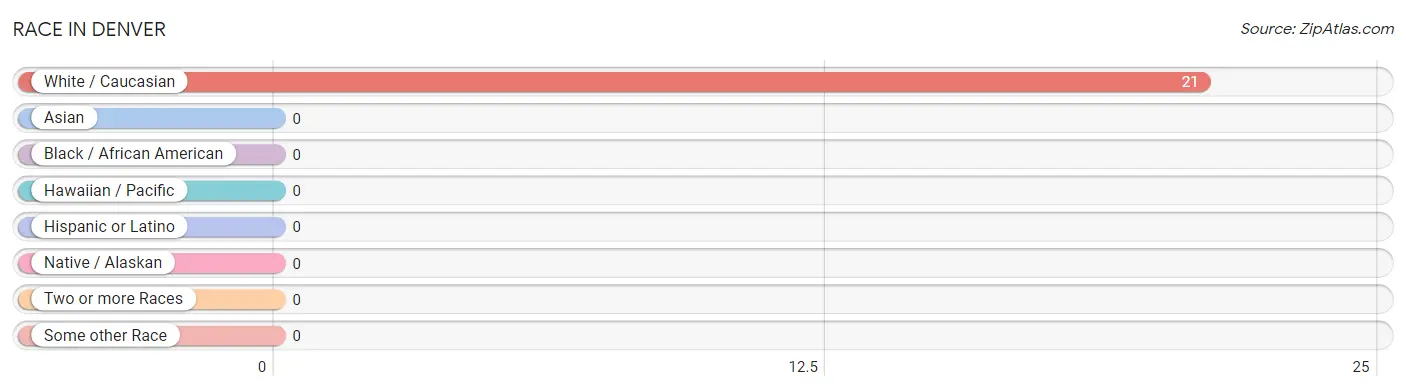
| Race | # Population | % Population |
| Asian | 0 | 0.0% |
| Black / African American | 0 | 0.0% |
| Hawaiian / Pacific | 0 | 0.0% |
| Hispanic or Latino | 0 | 0.0% |
| Native / Alaskan | 0 | 0.0% |
| White / Caucasian | 21 | 100.0% |
| Two or more Races | 0 | 0.0% |
| Some other Race | 0 | 0.0% |
| Total | 21 | 100.0% |
Ancestry in Denver
The most populous ancestries reported in Denver are English (5 | 23.8%), German (5 | 23.8%), and Scottish (2 | 9.5%), together accounting for 57.1% of all Denver residents.
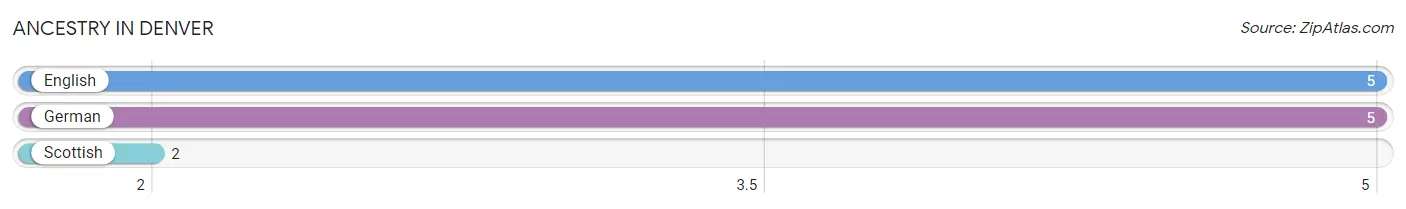
| Ancestry | # Population | % Population |
| English | 5 | 23.8% |
| German | 5 | 23.8% |
| Scottish | 2 | 9.5% | View All 3 Rows |
Immigrants in Denver

| Immigration Origin | # Population | % Population | View All 0 Rows |
Sex and Age in Denver
Sex and Age in Denver
The most populous age groups in Denver are 15 to 19 Years (3 | 25.0%) for men and 5 to 9 Years (3 | 33.3%) for women.
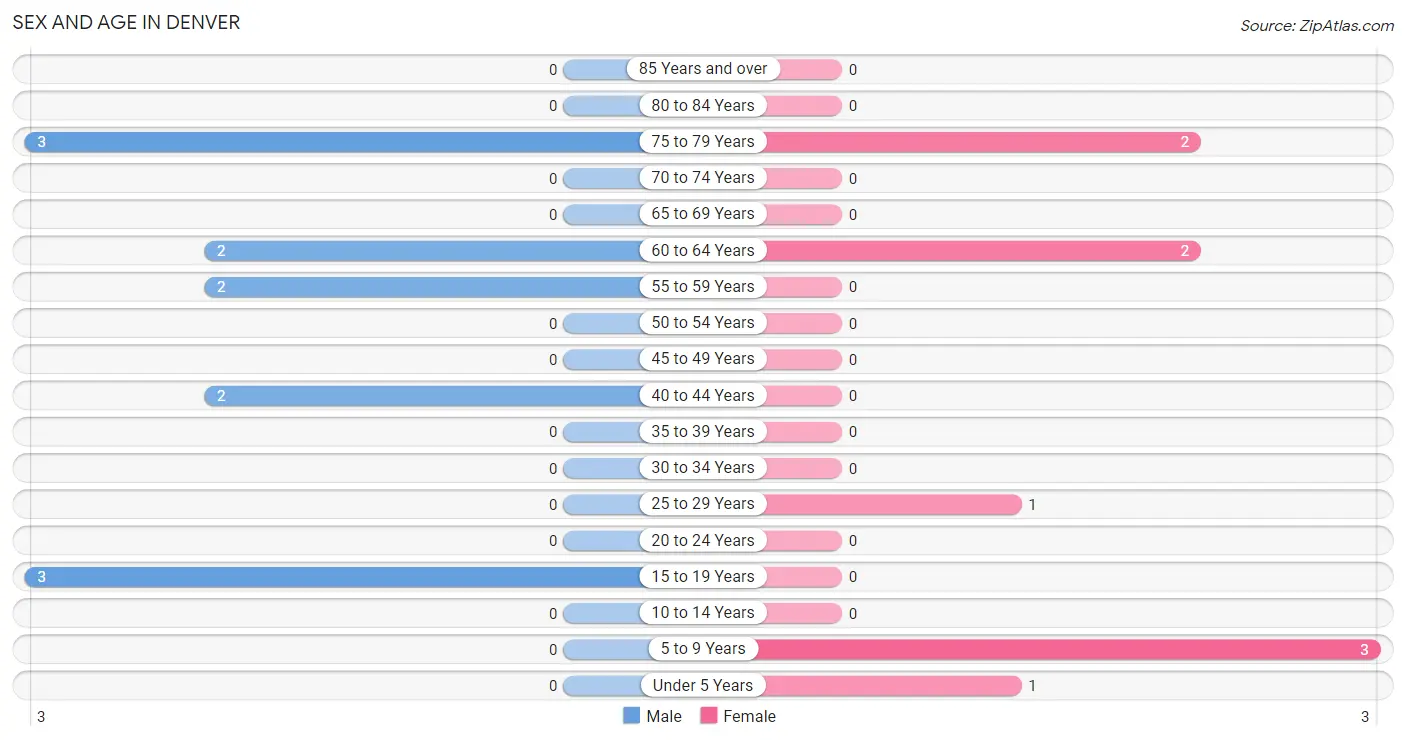
| Age Bracket | Male | Female |
| Under 5 Years | 0 (0.0%) | 1 (11.1%) |
| 5 to 9 Years | 0 (0.0%) | 3 (33.3%) |
| 10 to 14 Years | 0 (0.0%) | 0 (0.0%) |
| 15 to 19 Years | 3 (25.0%) | 0 (0.0%) |
| 20 to 24 Years | 0 (0.0%) | 0 (0.0%) |
| 25 to 29 Years | 0 (0.0%) | 1 (11.1%) |
| 30 to 34 Years | 0 (0.0%) | 0 (0.0%) |
| 35 to 39 Years | 0 (0.0%) | 0 (0.0%) |
| 40 to 44 Years | 2 (16.7%) | 0 (0.0%) |
| 45 to 49 Years | 0 (0.0%) | 0 (0.0%) |
| 50 to 54 Years | 0 (0.0%) | 0 (0.0%) |
| 55 to 59 Years | 2 (16.7%) | 0 (0.0%) |
| 60 to 64 Years | 2 (16.7%) | 2 (22.2%) |
| 65 to 69 Years | 0 (0.0%) | 0 (0.0%) |
| 70 to 74 Years | 0 (0.0%) | 0 (0.0%) |
| 75 to 79 Years | 3 (25.0%) | 2 (22.2%) |
| 80 to 84 Years | 0 (0.0%) | 0 (0.0%) |
| 85 Years and over | 0 (0.0%) | 0 (0.0%) |
| Total | 12 (100.0%) | 9 (100.0%) |
Families and Households in Denver
Median Family Size in Denver
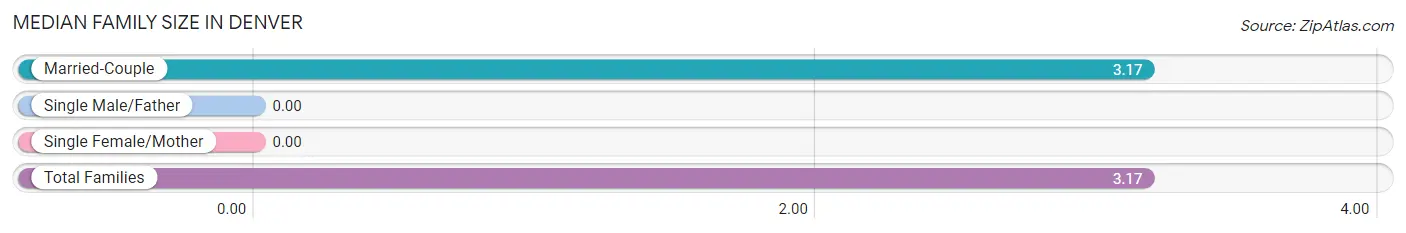
| Family Type | # Families | Family Size |
| Married-Couple | 6 (100.0%) | 3.17 |
| Single Male/Father | 0 (0.0%) | - |
| Single Female/Mother | 0 (0.0%) | - |
| Total Families | 6 (100.0%) | 3.17 |
Median Household Size in Denver
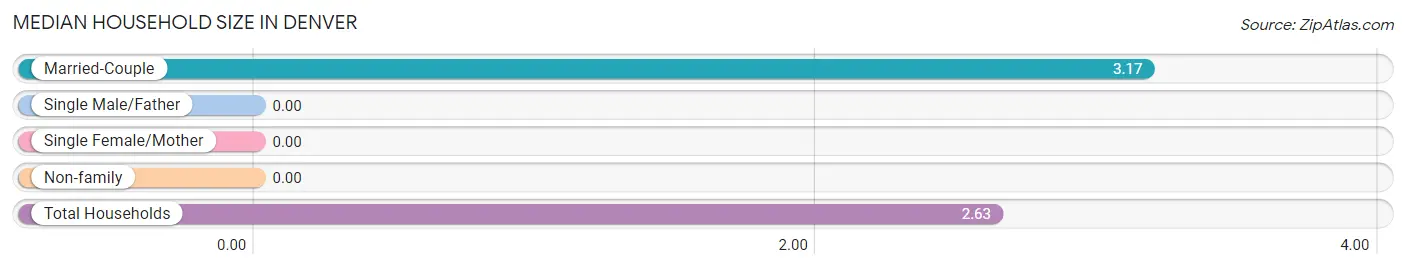
| Household Type | # Households | Household Size |
| Married-Couple | 6 (75.0%) | 3.17 |
| Single Male/Father | 0 (0.0%) | - |
| Single Female/Mother | 0 (0.0%) | - |
| Non-family | 2 (25.0%) | - |
| Total Households | 8 (100.0%) | 2.63 |
Household Size by Marriage Status in Denver
Out of a total of 8 households in Denver, 6 (75.0%) are family households, while 2 (25.0%) are nonfamily households. The most numerous type of family households are 2-person households, comprising 3, and the most common type of nonfamily households are 1-person households, comprising 2.
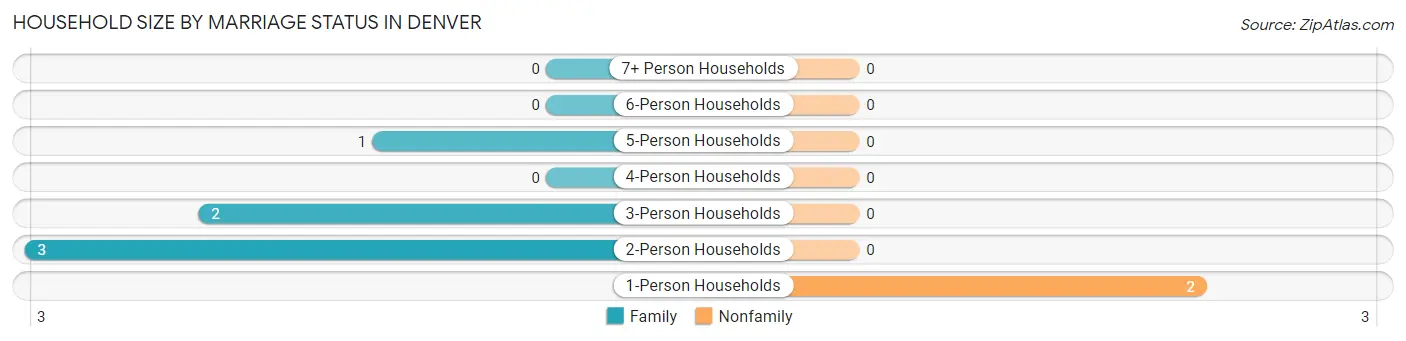
| Household Size | Family Households | Nonfamily Households |
| 1-Person Households | - | 2 (25.0%) |
| 2-Person Households | 3 (37.5%) | 0 (0.0%) |
| 3-Person Households | 2 (25.0%) | 0 (0.0%) |
| 4-Person Households | 0 (0.0%) | 0 (0.0%) |
| 5-Person Households | 1 (12.5%) | 0 (0.0%) |
| 6-Person Households | 0 (0.0%) | 0 (0.0%) |
| 7+ Person Households | 0 (0.0%) | 0 (0.0%) |
| Total | 6 (75.0%) | 2 (25.0%) |
Female Fertility in Denver
Fertility by Age in Denver
Average fertility rate in Denver is 1,000.0 births per 1,000 women. Women in the age bracket of 20 to 34 years have the highest fertility rate with 1,000.0 births per 1,000 women. Women in the age bracket of 20 to 34 years acount for 100.0% of all women with births.
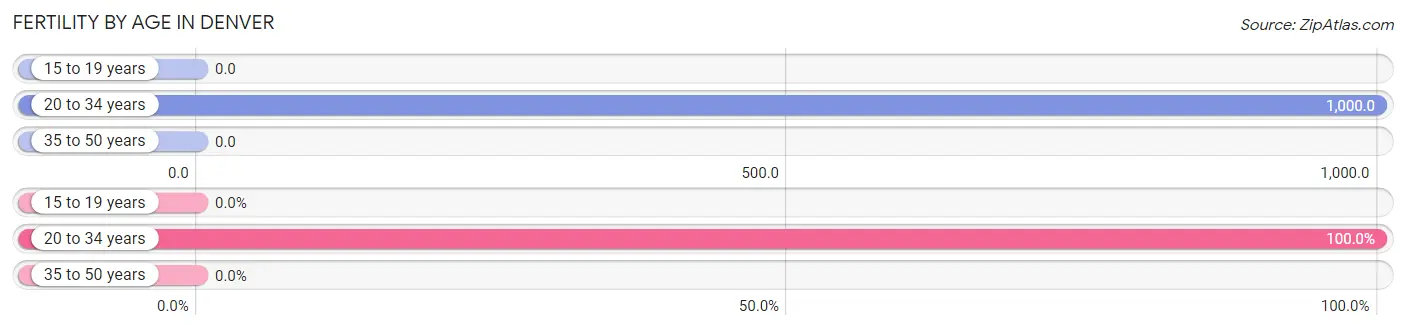
| Age Bracket | Women with Births | Births / 1,000 Women |
| 15 to 19 years | 0 (0.0%) | 0.0 |
| 20 to 34 years | 1 (100.0%) | 1,000.0 |
| 35 to 50 years | 0 (0.0%) | 0.0 |
| Total | 1 (100.0%) | 1,000.0 |
Fertility by Age by Marriage Status in Denver
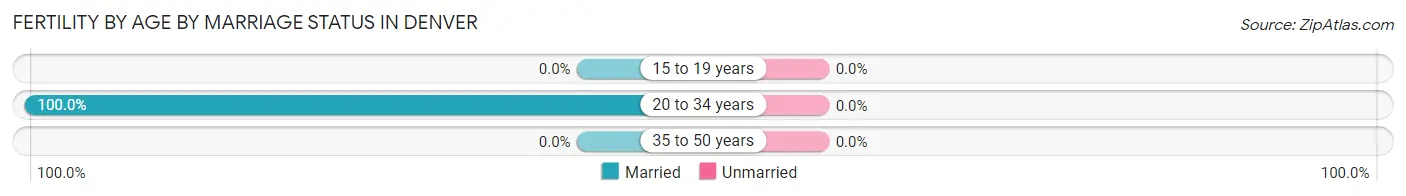
| Age Bracket | Married | Unmarried |
| 15 to 19 years | 0 (0.0%) | 0 (0.0%) |
| 20 to 34 years | 1 (100.0%) | 0 (0.0%) |
| 35 to 50 years | 0 (0.0%) | 0 (0.0%) |
| Total | 1 (100.0%) | 0 (0.0%) |
Fertility by Education in Denver
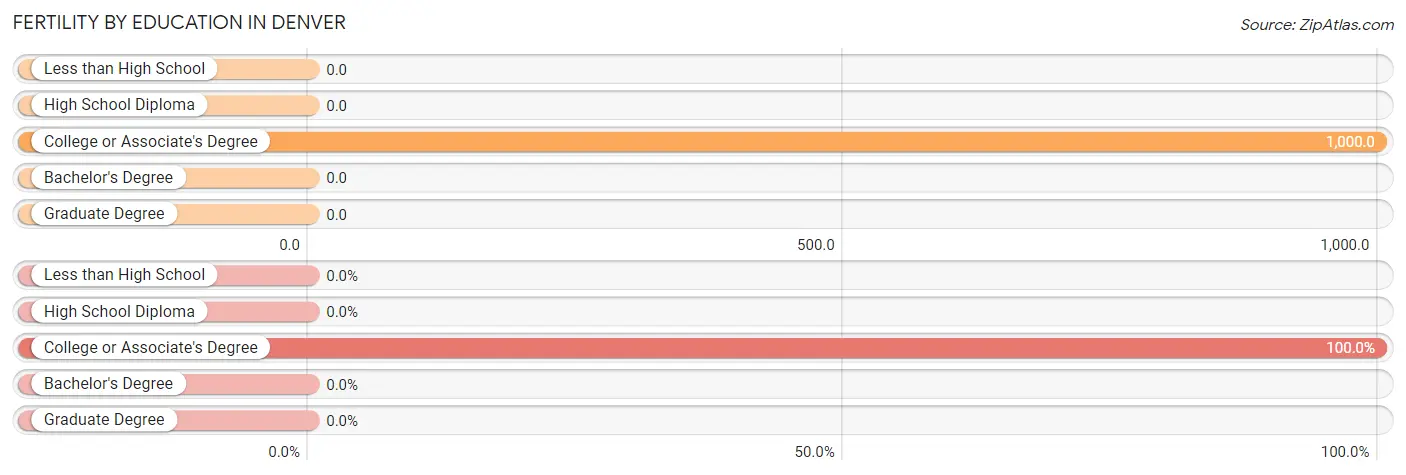
| Educational Attainment | Women with Births | Births / 1,000 Women |
| Less than High School | 0 (0.0%) | 0.0 |
| High School Diploma | 0 (0.0%) | 0.0 |
| College or Associate's Degree | 1 (100.0%) | 1,000.0 |
| Bachelor's Degree | 0 (0.0%) | 0.0 |
| Graduate Degree | 0 (0.0%) | 0.0 |
| Total | 1 (100.0%) | 1,000.0 |
Fertility by Education by Marriage Status in Denver
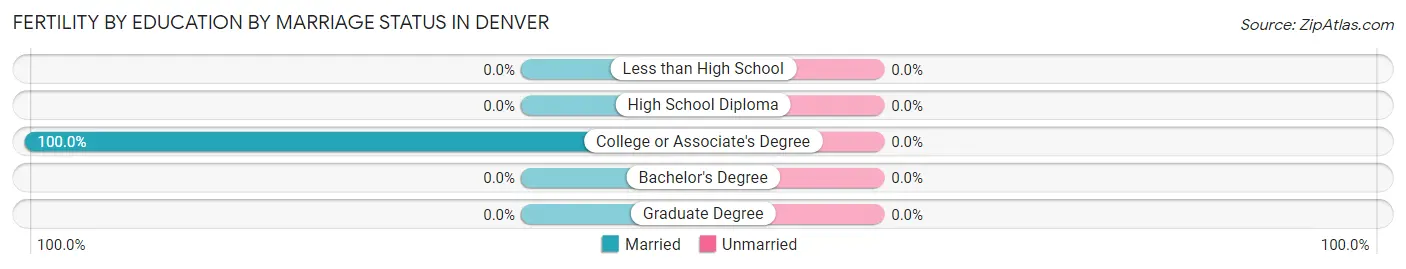
| Educational Attainment | Married | Unmarried |
| Less than High School | 0 (0.0%) | 0 (0.0%) |
| High School Diploma | 0 (0.0%) | 0 (0.0%) |
| College or Associate's Degree | 1 (100.0%) | 0 (0.0%) |
| Bachelor's Degree | 0 (0.0%) | 0 (0.0%) |
| Graduate Degree | 0 (0.0%) | 0 (0.0%) |
| Total | 1 (100.0%) | 0 (0.0%) |
Employment Characteristics in Denver
Employment by Class of Employer in Denver
Among the 9 employed individuals in Denver, private company employees (6 | 66.7%), and not-for-profit organizations (3 | 33.3%) make up the most common classes of employment.
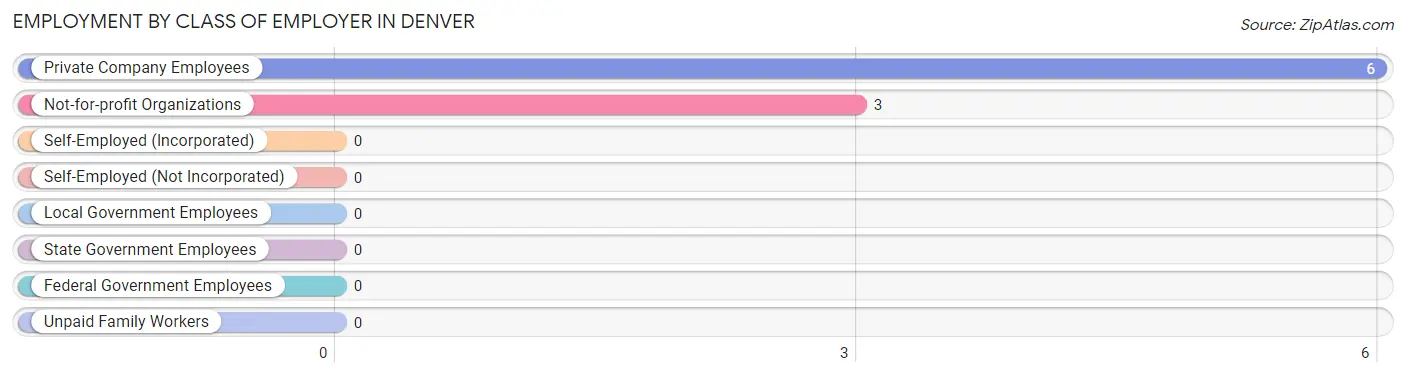
| Employer Class | # Employees | % Employees |
| Private Company Employees | 6 | 66.7% |
| Self-Employed (Incorporated) | 0 | 0.0% |
| Self-Employed (Not Incorporated) | 0 | 0.0% |
| Not-for-profit Organizations | 3 | 33.3% |
| Local Government Employees | 0 | 0.0% |
| State Government Employees | 0 | 0.0% |
| Federal Government Employees | 0 | 0.0% |
| Unpaid Family Workers | 0 | 0.0% |
| Total | 9 | 100.0% |
Employment Status by Age in Denver
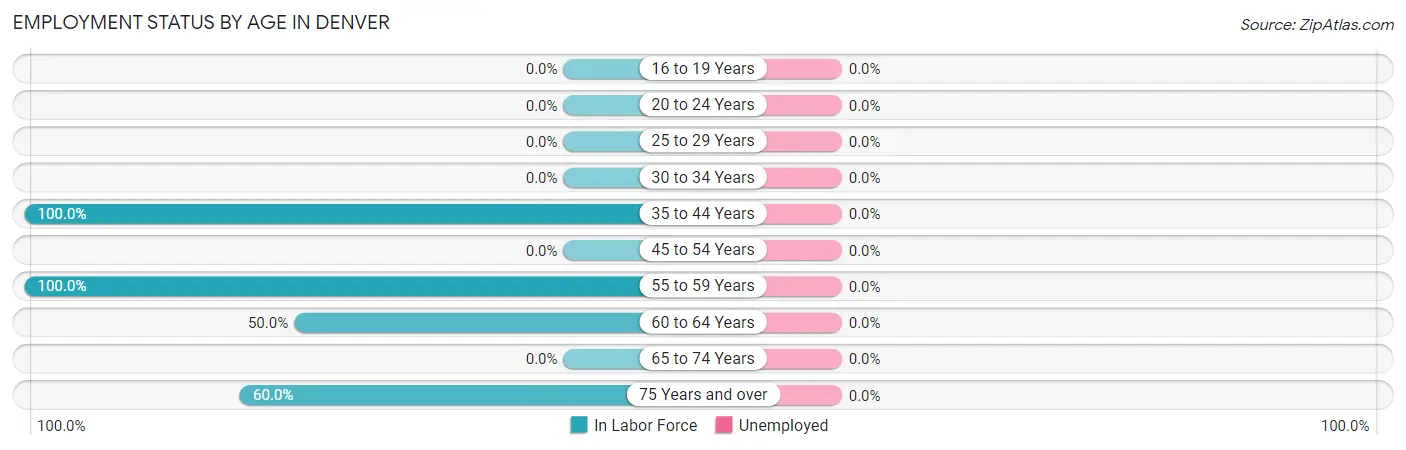
| Age Bracket | In Labor Force | Unemployed |
| 16 to 19 Years | 0 (0.0%) | 0 (0.0%) |
| 20 to 24 Years | 0 (0.0%) | 0 (0.0%) |
| 25 to 29 Years | 0 (0.0%) | 0 (0.0%) |
| 30 to 34 Years | 0 (0.0%) | 0 (0.0%) |
| 35 to 44 Years | 2 (100.0%) | 0 (0.0%) |
| 45 to 54 Years | 0 (0.0%) | 0 (0.0%) |
| 55 to 59 Years | 2 (100.0%) | 0 (0.0%) |
| 60 to 64 Years | 2 (50.0%) | 0 (0.0%) |
| 65 to 74 Years | 0 (0.0%) | 0 (0.0%) |
| 75 Years and over | 3 (60.0%) | 0 (0.0%) |
| Total | 9 (52.9%) | 0 (0.0%) |
Employment Status by Educational Attainment in Denver
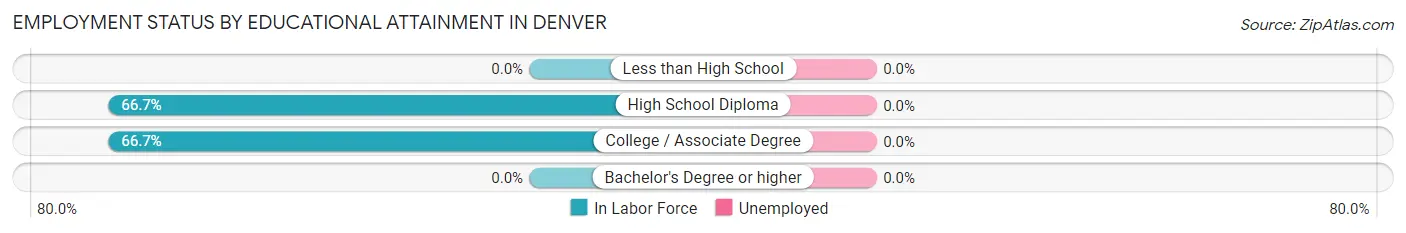
| Educational Attainment | In Labor Force | Unemployed |
| Less than High School | 0 (0.0%) | 0 (0.0%) |
| High School Diploma | 4 (66.7%) | 0 (0.0%) |
| College / Associate Degree | 2 (66.7%) | 0 (0.0%) |
| Bachelor's Degree or higher | 0 (0.0%) | 0 (0.0%) |
| Total | 6 (66.7%) | 0 (0.0%) |
Employment Occupations by Sex in Denver
Management, Business, Science and Arts Occupations
The most common Management, Business, Science and Arts occupations in Denver are Community & Social Service (3 | 33.3%), Education, Arts & Media (3 | 33.3%), and Management (2 | 22.2%).
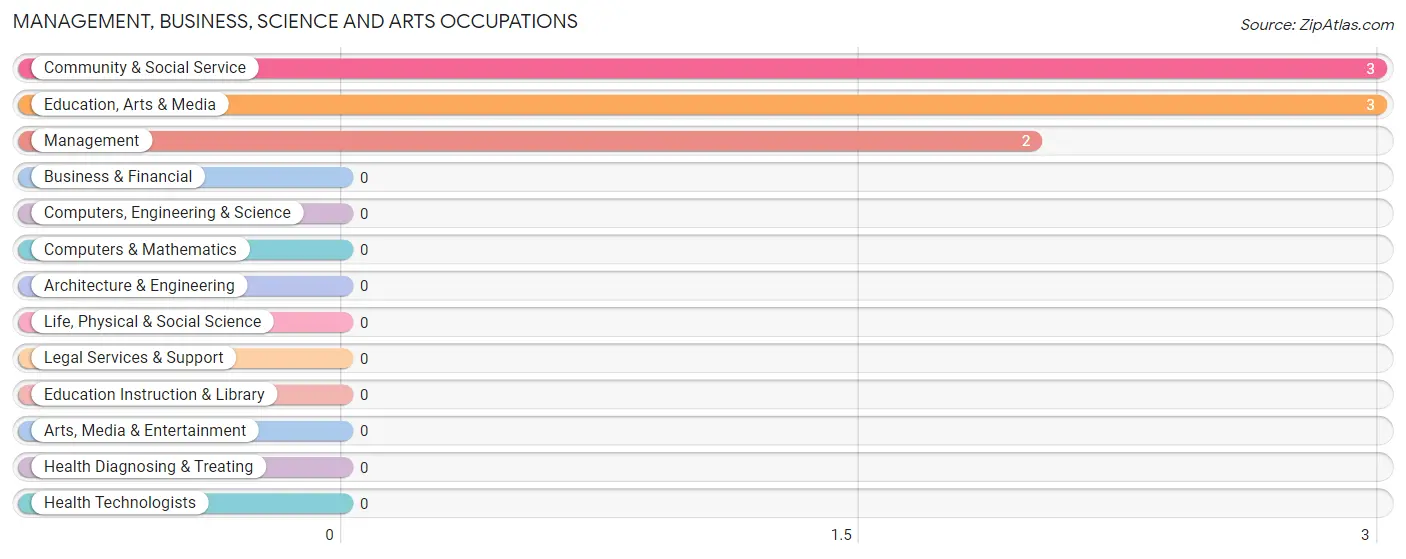
Management, Business, Science and Arts Occupations by Sex
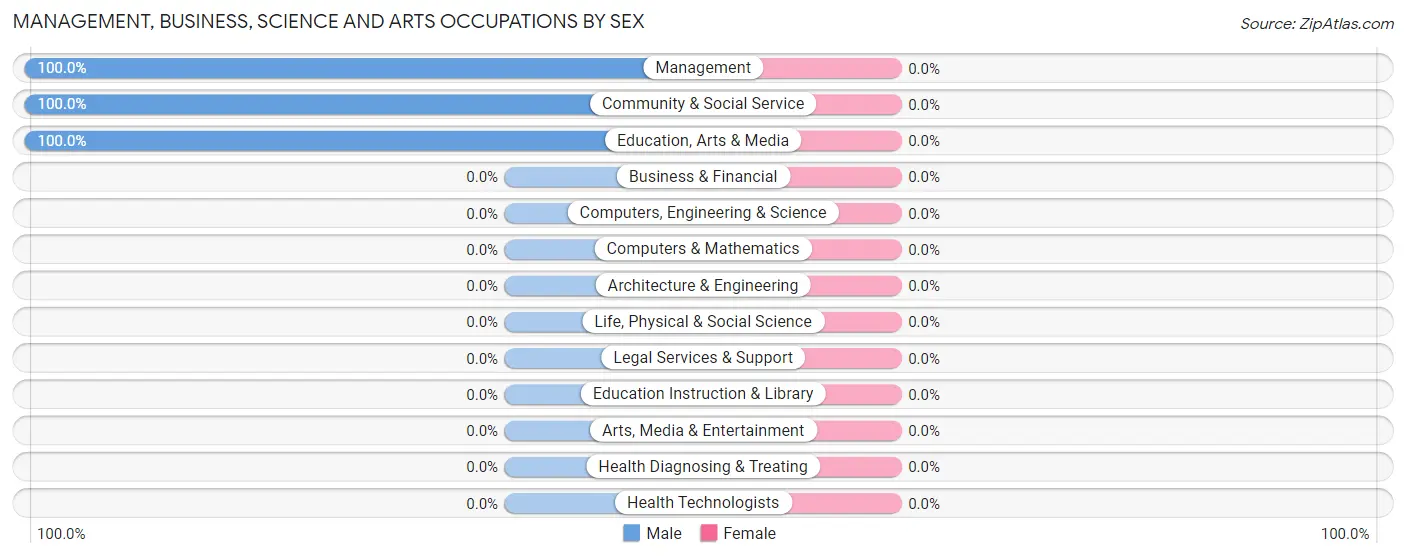
| Occupation | Male | Female |
| Management | 2 (100.0%) | 0 (0.0%) |
| Business & Financial | 0 (0.0%) | 0 (0.0%) |
| Computers, Engineering & Science | 0 (0.0%) | 0 (0.0%) |
| Computers & Mathematics | 0 (0.0%) | 0 (0.0%) |
| Architecture & Engineering | 0 (0.0%) | 0 (0.0%) |
| Life, Physical & Social Science | 0 (0.0%) | 0 (0.0%) |
| Community & Social Service | 3 (100.0%) | 0 (0.0%) |
| Education, Arts & Media | 3 (100.0%) | 0 (0.0%) |
| Legal Services & Support | 0 (0.0%) | 0 (0.0%) |
| Education Instruction & Library | 0 (0.0%) | 0 (0.0%) |
| Arts, Media & Entertainment | 0 (0.0%) | 0 (0.0%) |
| Health Diagnosing & Treating | 0 (0.0%) | 0 (0.0%) |
| Health Technologists | 0 (0.0%) | 0 (0.0%) |
| Total (Category) | 5 (100.0%) | 0 (0.0%) |
| Total (Overall) | 7 (77.8%) | 2 (22.2%) |
Services Occupations
The most common Services occupations in Denver are , and Food Preparation & Serving (2 | 22.2%).
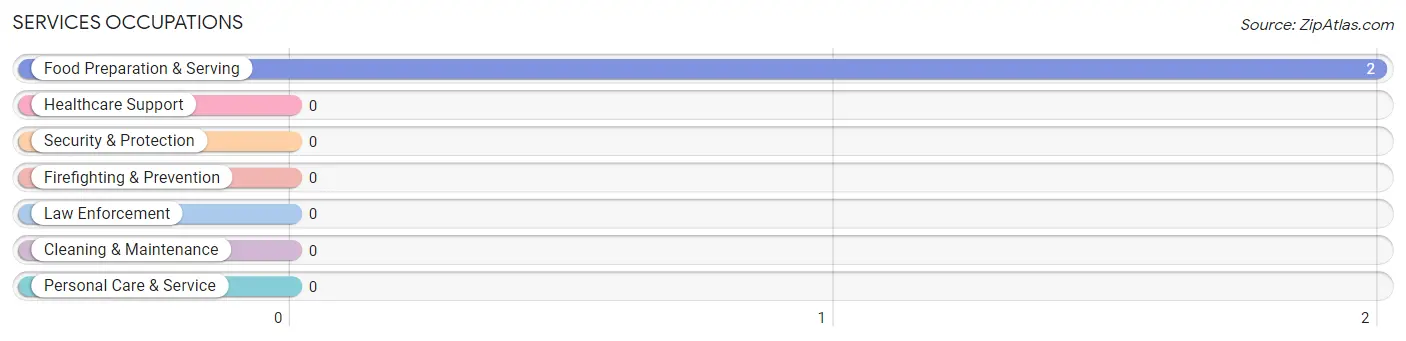
Services Occupations by Sex
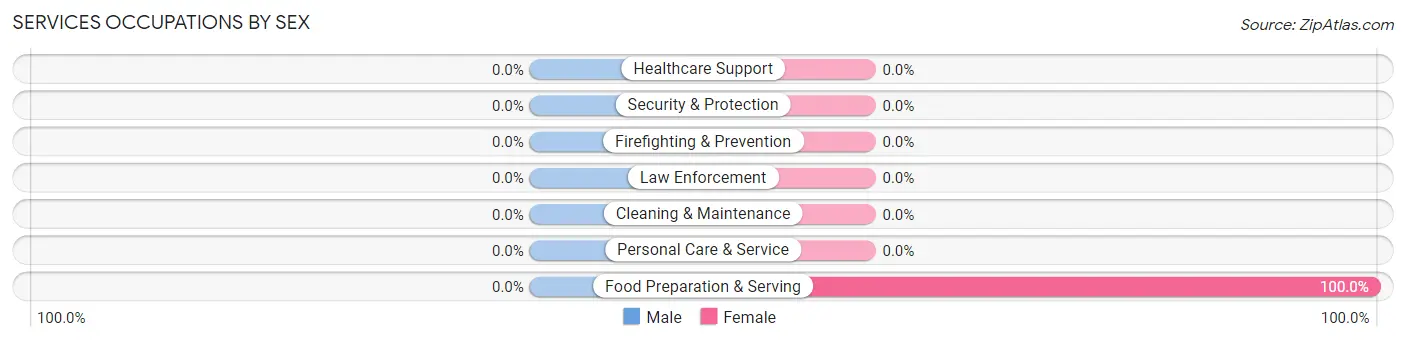
| Occupation | Male | Female |
| Healthcare Support | 0 (0.0%) | 0 (0.0%) |
| Security & Protection | 0 (0.0%) | 0 (0.0%) |
| Firefighting & Prevention | 0 (0.0%) | 0 (0.0%) |
| Law Enforcement | 0 (0.0%) | 0 (0.0%) |
| Food Preparation & Serving | 0 (0.0%) | 2 (100.0%) |
| Cleaning & Maintenance | 0 (0.0%) | 0 (0.0%) |
| Personal Care & Service | 0 (0.0%) | 0 (0.0%) |
| Total (Category) | 0 (0.0%) | 2 (100.0%) |
| Total (Overall) | 7 (77.8%) | 2 (22.2%) |
Sales and Office Occupations

Sales and Office Occupations by Sex
| Occupation | Male | Female |
| Sales & Related | 0 (0.0%) | 0 (0.0%) |
| Office & Administration | 0 (0.0%) | 0 (0.0%) |
| Total (Category) | 0 (0.0%) | 0 (0.0%) |
| Total (Overall) | 7 (77.8%) | 2 (22.2%) |
Natural Resources, Construction and Maintenance Occupations

Natural Resources, Construction and Maintenance Occupations by Sex
| Occupation | Male | Female |
| Farming, Fishing & Forestry | 0 (0.0%) | 0 (0.0%) |
| Construction & Extraction | 0 (0.0%) | 0 (0.0%) |
| Installation, Maintenance & Repair | 0 (0.0%) | 0 (0.0%) |
| Total (Category) | 0 (0.0%) | 0 (0.0%) |
| Total (Overall) | 7 (77.8%) | 2 (22.2%) |
Production, Transportation and Moving Occupations
The most common Production, Transportation and Moving occupations in Denver are , and Material Moving (2 | 22.2%).
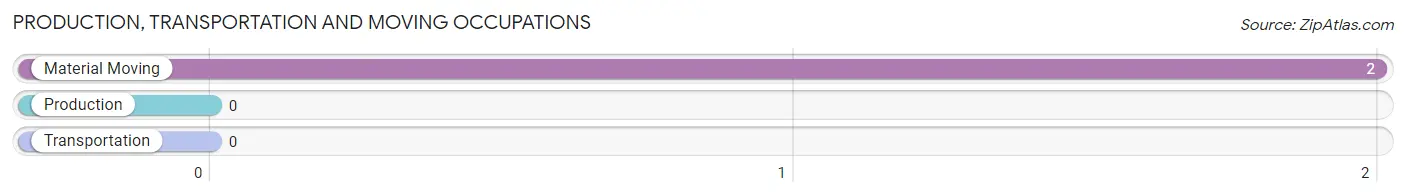
Production, Transportation and Moving Occupations by Sex
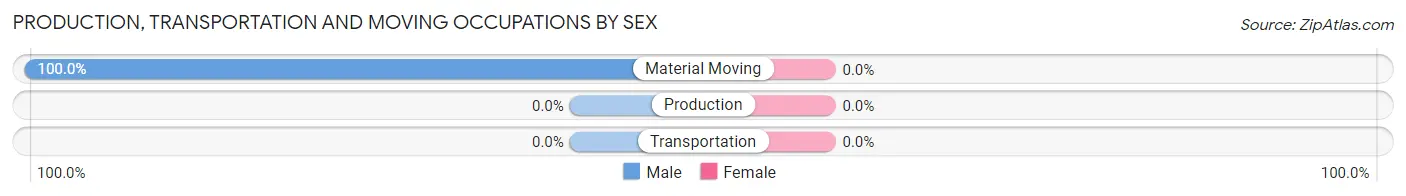
| Occupation | Male | Female |
| Production | 0 (0.0%) | 0 (0.0%) |
| Transportation | 0 (0.0%) | 0 (0.0%) |
| Material Moving | 2 (100.0%) | 0 (0.0%) |
| Total (Category) | 2 (100.0%) | 0 (0.0%) |
| Total (Overall) | 7 (77.8%) | 2 (22.2%) |
Employment Industries by Sex in Denver
Employment Industries in Denver
The major employment industries in Denver include Agriculture, Fishing & Hunting (2 | 22.2%), Manufacturing (2 | 22.2%), and Accommodation & Food Services (2 | 22.2%).
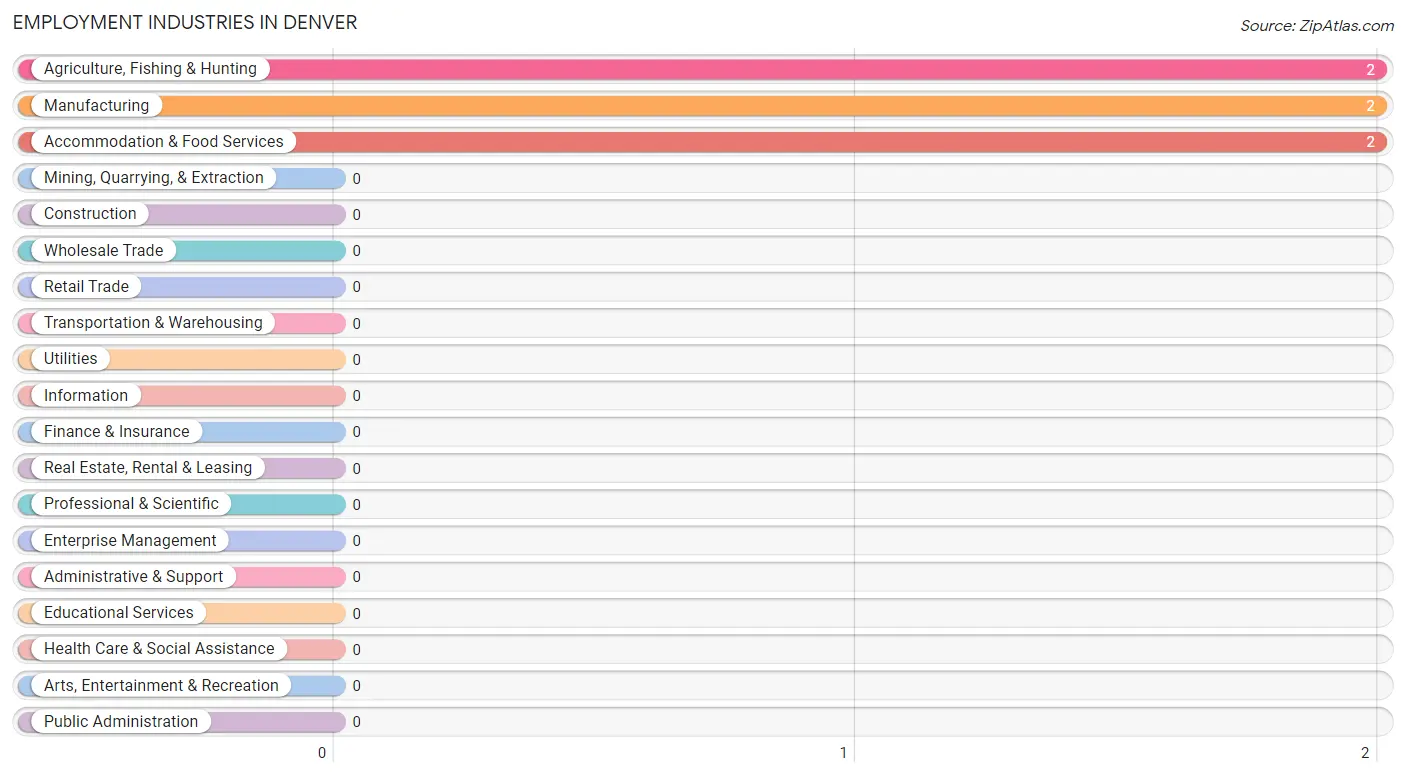
Employment Industries by Sex in Denver
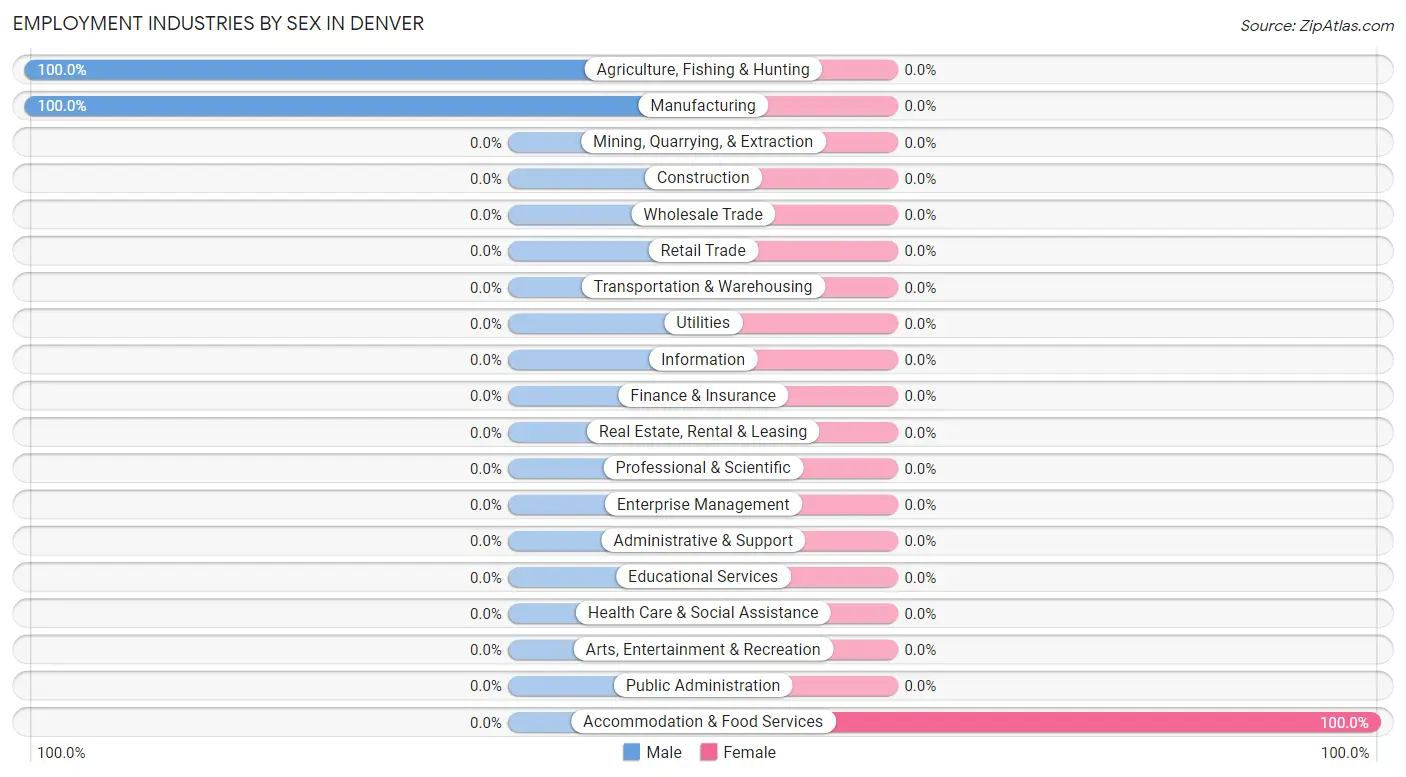
| Industry | Male | Female |
| Agriculture, Fishing & Hunting | 2 (100.0%) | 0 (0.0%) |
| Mining, Quarrying, & Extraction | 0 (0.0%) | 0 (0.0%) |
| Construction | 0 (0.0%) | 0 (0.0%) |
| Manufacturing | 2 (100.0%) | 0 (0.0%) |
| Wholesale Trade | 0 (0.0%) | 0 (0.0%) |
| Retail Trade | 0 (0.0%) | 0 (0.0%) |
| Transportation & Warehousing | 0 (0.0%) | 0 (0.0%) |
| Utilities | 0 (0.0%) | 0 (0.0%) |
| Information | 0 (0.0%) | 0 (0.0%) |
| Finance & Insurance | 0 (0.0%) | 0 (0.0%) |
| Real Estate, Rental & Leasing | 0 (0.0%) | 0 (0.0%) |
| Professional & Scientific | 0 (0.0%) | 0 (0.0%) |
| Enterprise Management | 0 (0.0%) | 0 (0.0%) |
| Administrative & Support | 0 (0.0%) | 0 (0.0%) |
| Educational Services | 0 (0.0%) | 0 (0.0%) |
| Health Care & Social Assistance | 0 (0.0%) | 0 (0.0%) |
| Arts, Entertainment & Recreation | 0 (0.0%) | 0 (0.0%) |
| Accommodation & Food Services | 0 (0.0%) | 2 (100.0%) |
| Public Administration | 0 (0.0%) | 0 (0.0%) |
| Total | 7 (77.8%) | 2 (22.2%) |
Education in Denver
School Enrollment in Denver
The most common levels of schooling among the 9 students in Denver are high school (3 | 33.3%), college / undergraduate (3 | 33.3%), and elementary school (2 | 22.2%).
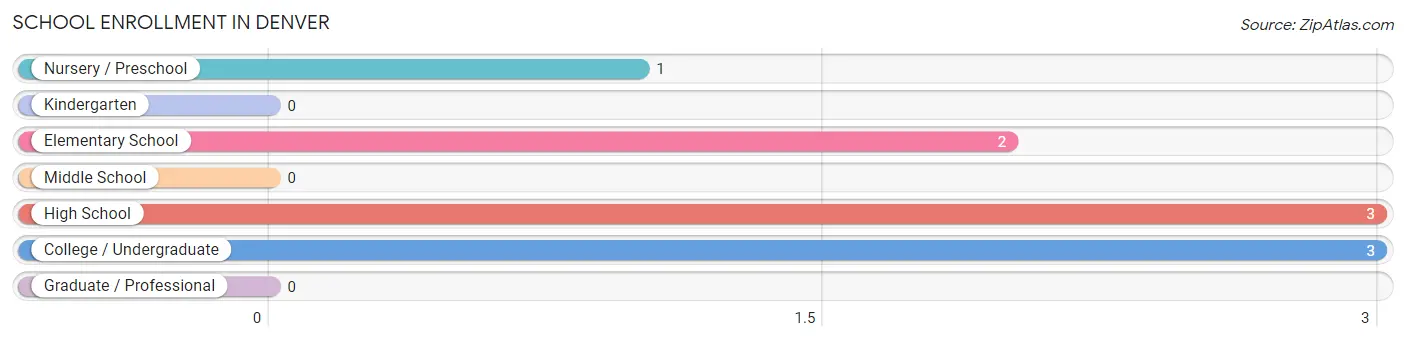
| School Level | # Students | % Students |
| Nursery / Preschool | 1 | 11.1% |
| Kindergarten | 0 | 0.0% |
| Elementary School | 2 | 22.2% |
| Middle School | 0 | 0.0% |
| High School | 3 | 33.3% |
| College / Undergraduate | 3 | 33.3% |
| Graduate / Professional | 0 | 0.0% |
| Total | 9 | 100.0% |
School Enrollment by Age by Funding Source in Denver
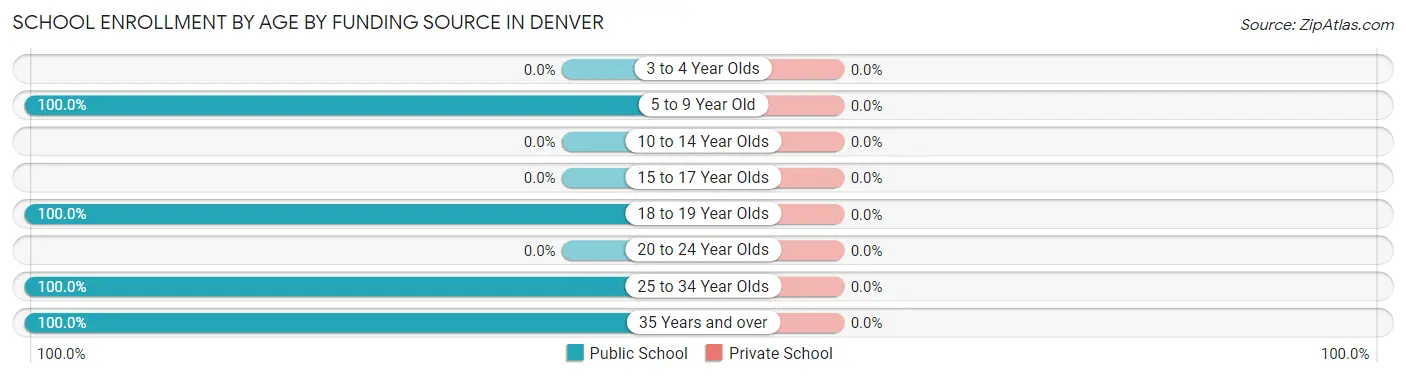
| Age Bracket | Public School | Private School |
| 3 to 4 Year Olds | 0 (0.0%) | 0 (0.0%) |
| 5 to 9 Year Old | 3 (100.0%) | 0 (0.0%) |
| 10 to 14 Year Olds | 0 (0.0%) | 0 (0.0%) |
| 15 to 17 Year Olds | 0 (0.0%) | 0 (0.0%) |
| 18 to 19 Year Olds | 3 (100.0%) | 0 (0.0%) |
| 20 to 24 Year Olds | 0 (0.0%) | 0 (0.0%) |
| 25 to 34 Year Olds | 1 (100.0%) | 0 (0.0%) |
| 35 Years and over | 2 (100.0%) | 0 (0.0%) |
| Total | 9 (100.0%) | 0 (0.0%) |
Educational Attainment by Field of Study in Denver
, and education (3 | 100.0%) are the most common fields of study among 3 individuals in Denver who have obtained a bachelor's degree or higher.
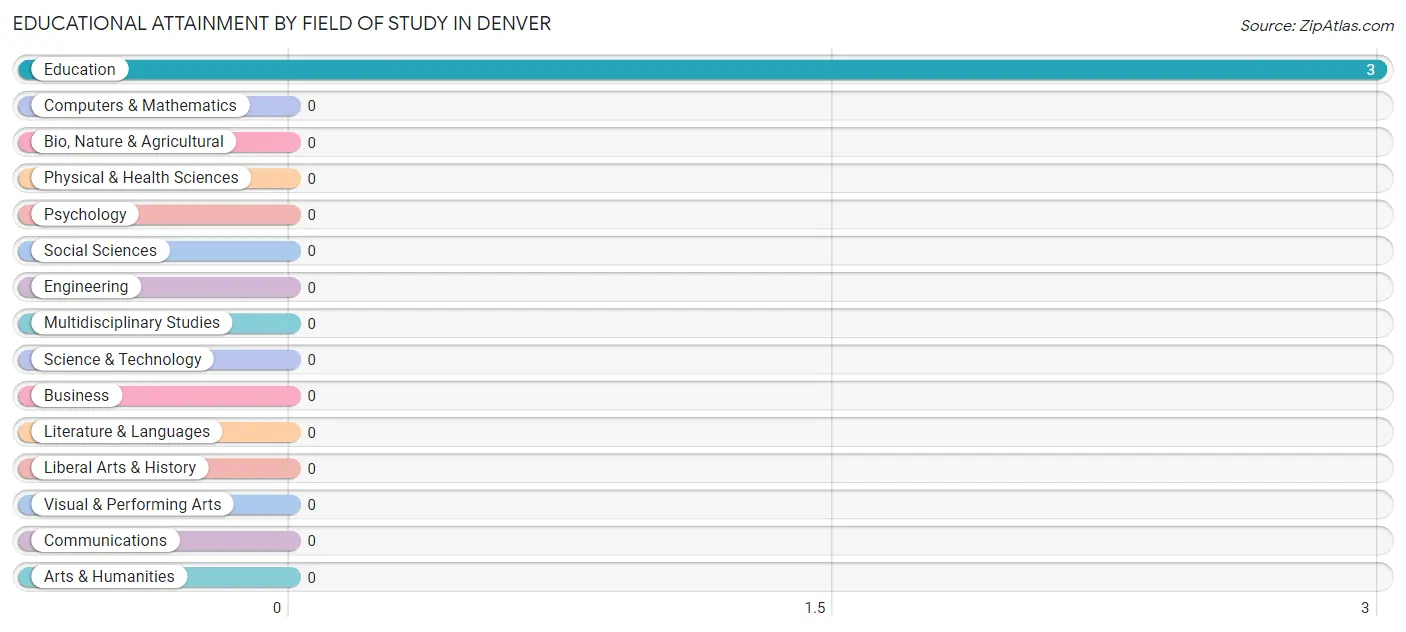
| Field of Study | # Graduates | % Graduates |
| Computers & Mathematics | 0 | 0.0% |
| Bio, Nature & Agricultural | 0 | 0.0% |
| Physical & Health Sciences | 0 | 0.0% |
| Psychology | 0 | 0.0% |
| Social Sciences | 0 | 0.0% |
| Engineering | 0 | 0.0% |
| Multidisciplinary Studies | 0 | 0.0% |
| Science & Technology | 0 | 0.0% |
| Business | 0 | 0.0% |
| Education | 3 | 100.0% |
| Literature & Languages | 0 | 0.0% |
| Liberal Arts & History | 0 | 0.0% |
| Visual & Performing Arts | 0 | 0.0% |
| Communications | 0 | 0.0% |
| Arts & Humanities | 0 | 0.0% |
| Total | 3 | 100.0% |
Transportation & Commute in Denver
Vehicle Availability by Sex in Denver
The most prevalent vehicle ownership categories in Denver are males with 2 vehicles (5, accounting for 71.4%) and females with 2 vehicles (0, making up 250.0%).
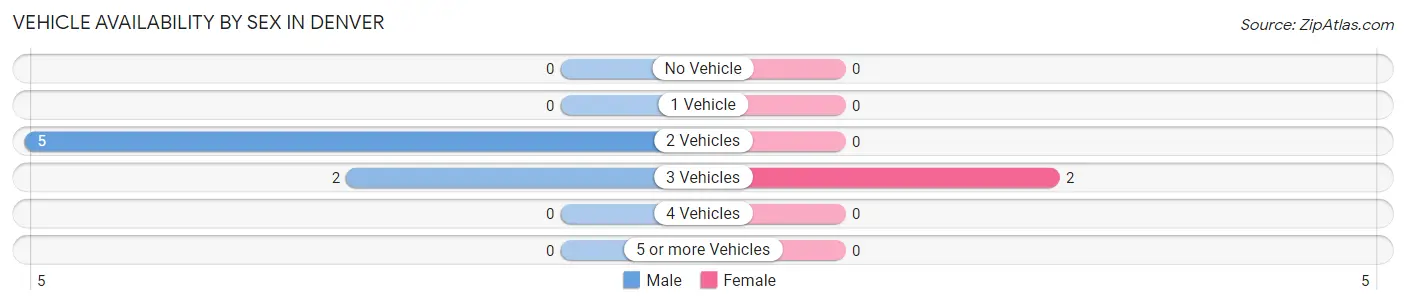
| Vehicles Available | Male | Female |
| No Vehicle | 0 (0.0%) | 0 (0.0%) |
| 1 Vehicle | 0 (0.0%) | 0 (0.0%) |
| 2 Vehicles | 5 (71.4%) | 0 (0.0%) |
| 3 Vehicles | 2 (28.6%) | 2 (100.0%) |
| 4 Vehicles | 0 (0.0%) | 0 (0.0%) |
| 5 or more Vehicles | 0 (0.0%) | 0 (0.0%) |
| Total | 7 (100.0%) | 2 (100.0%) |
Commute Time in Denver
The most frequently occuring commute durations in Denver are less than 5 minutes (3 commuters, 33.3%), 10 to 14 minutes (2 commuters, 22.2%), and 15 to 19 minutes (2 commuters, 22.2%).
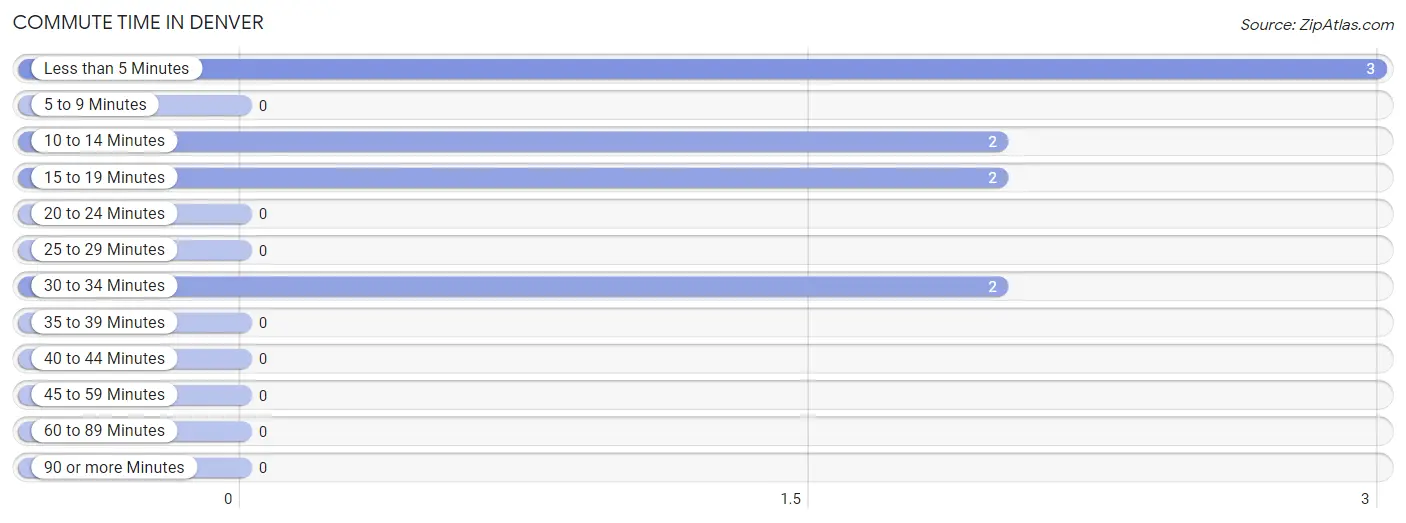
| Commute Time | # Commuters | % Commuters |
| Less than 5 Minutes | 3 | 33.3% |
| 5 to 9 Minutes | 0 | 0.0% |
| 10 to 14 Minutes | 2 | 22.2% |
| 15 to 19 Minutes | 2 | 22.2% |
| 20 to 24 Minutes | 0 | 0.0% |
| 25 to 29 Minutes | 0 | 0.0% |
| 30 to 34 Minutes | 2 | 22.2% |
| 35 to 39 Minutes | 0 | 0.0% |
| 40 to 44 Minutes | 0 | 0.0% |
| 45 to 59 Minutes | 0 | 0.0% |
| 60 to 89 Minutes | 0 | 0.0% |
| 90 or more Minutes | 0 | 0.0% |
Commute Time by Sex in Denver
The most common commute times in Denver are less than 5 minutes (3 commuters, 42.9%) for males and 15 to 19 minutes (2 commuters, 100.0%) for females.
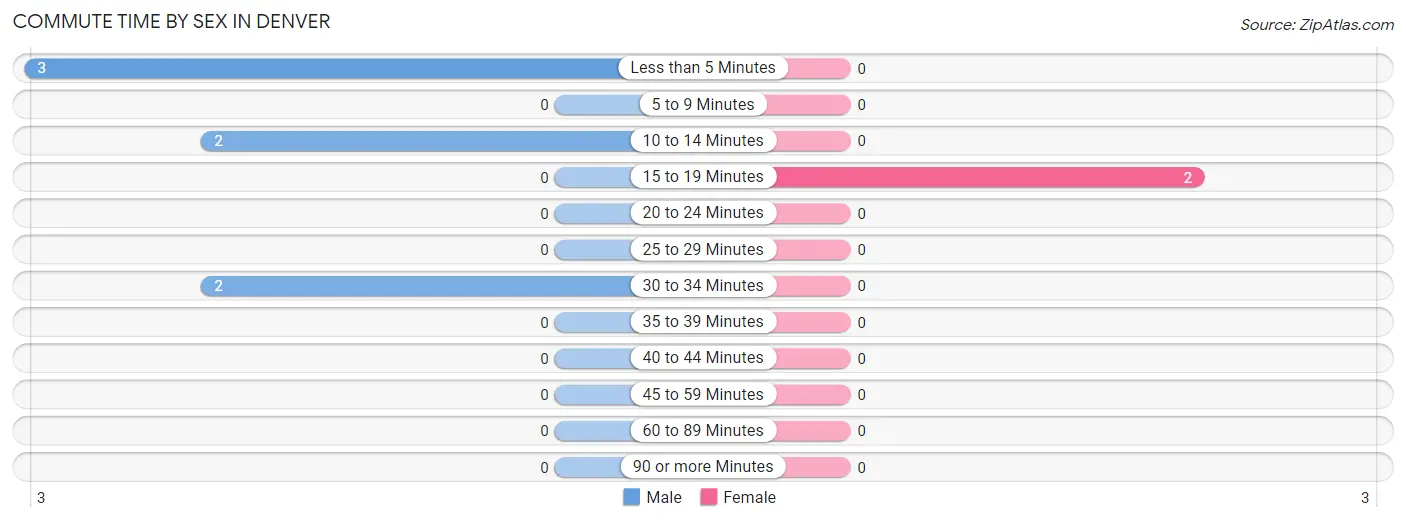
| Commute Time | Male | Female |
| Less than 5 Minutes | 3 (42.9%) | 0 (0.0%) |
| 5 to 9 Minutes | 0 (0.0%) | 0 (0.0%) |
| 10 to 14 Minutes | 2 (28.6%) | 0 (0.0%) |
| 15 to 19 Minutes | 0 (0.0%) | 2 (100.0%) |
| 20 to 24 Minutes | 0 (0.0%) | 0 (0.0%) |
| 25 to 29 Minutes | 0 (0.0%) | 0 (0.0%) |
| 30 to 34 Minutes | 2 (28.6%) | 0 (0.0%) |
| 35 to 39 Minutes | 0 (0.0%) | 0 (0.0%) |
| 40 to 44 Minutes | 0 (0.0%) | 0 (0.0%) |
| 45 to 59 Minutes | 0 (0.0%) | 0 (0.0%) |
| 60 to 89 Minutes | 0 (0.0%) | 0 (0.0%) |
| 90 or more Minutes | 0 (0.0%) | 0 (0.0%) |
Time of Departure to Work by Sex in Denver
The most frequent times of departure to work in Denver are 6:00 AM to 6:29 AM (5, 71.4%) for males and 12:00 PM to 3:59 PM (2, 100.0%) for females.
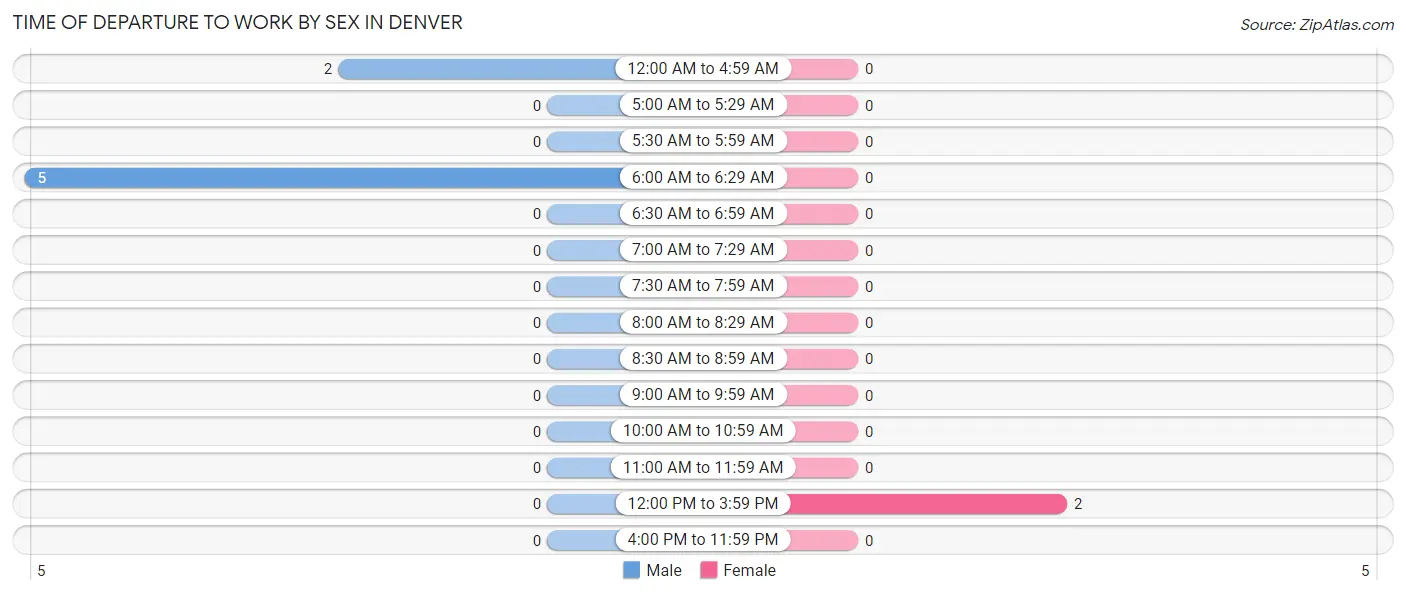
| Time of Departure | Male | Female |
| 12:00 AM to 4:59 AM | 2 (28.6%) | 0 (0.0%) |
| 5:00 AM to 5:29 AM | 0 (0.0%) | 0 (0.0%) |
| 5:30 AM to 5:59 AM | 0 (0.0%) | 0 (0.0%) |
| 6:00 AM to 6:29 AM | 5 (71.4%) | 0 (0.0%) |
| 6:30 AM to 6:59 AM | 0 (0.0%) | 0 (0.0%) |
| 7:00 AM to 7:29 AM | 0 (0.0%) | 0 (0.0%) |
| 7:30 AM to 7:59 AM | 0 (0.0%) | 0 (0.0%) |
| 8:00 AM to 8:29 AM | 0 (0.0%) | 0 (0.0%) |
| 8:30 AM to 8:59 AM | 0 (0.0%) | 0 (0.0%) |
| 9:00 AM to 9:59 AM | 0 (0.0%) | 0 (0.0%) |
| 10:00 AM to 10:59 AM | 0 (0.0%) | 0 (0.0%) |
| 11:00 AM to 11:59 AM | 0 (0.0%) | 0 (0.0%) |
| 12:00 PM to 3:59 PM | 0 (0.0%) | 2 (100.0%) |
| 4:00 PM to 11:59 PM | 0 (0.0%) | 0 (0.0%) |
| Total | 7 (100.0%) | 2 (100.0%) |
Housing Occupancy in Denver
Occupancy by Ownership in Denver
Of the total 8 dwellings in Denver, owner-occupied units account for 7 (87.5%), while renter-occupied units make up 1 (12.5%).
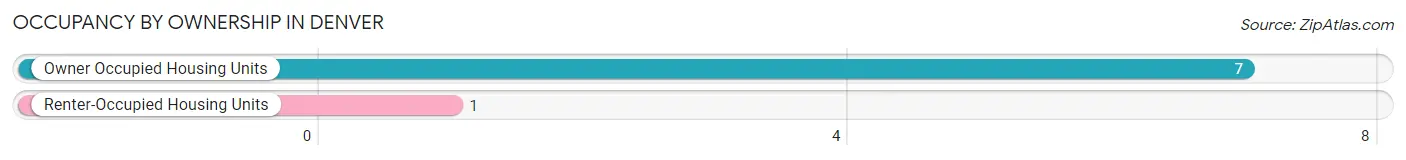
| Occupancy | # Housing Units | % Housing Units |
| Owner Occupied Housing Units | 7 | 87.5% |
| Renter-Occupied Housing Units | 1 | 12.5% |
| Total Occupied Housing Units | 8 | 100.0% |
Occupancy by Household Size in Denver
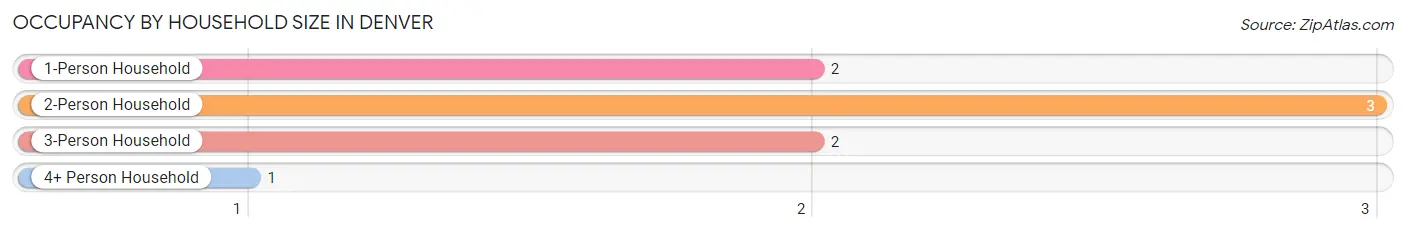
| Household Size | # Housing Units | % Housing Units |
| 1-Person Household | 2 | 25.0% |
| 2-Person Household | 3 | 37.5% |
| 3-Person Household | 2 | 25.0% |
| 4+ Person Household | 1 | 12.5% |
| Total Housing Units | 8 | 100.0% |
Occupancy by Ownership by Household Size in Denver
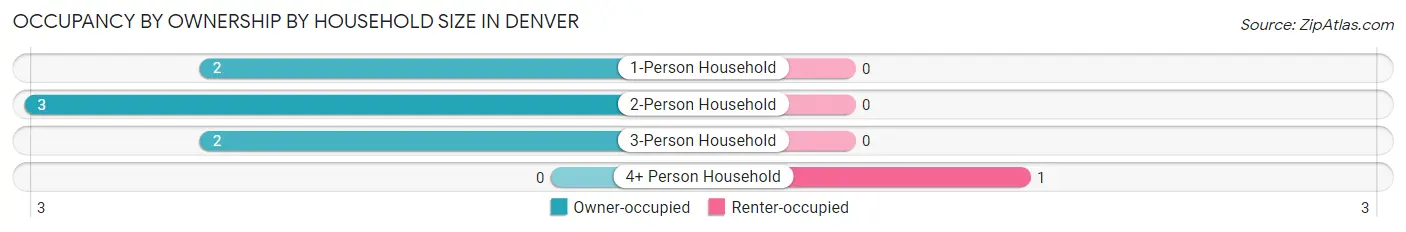
| Household Size | Owner-occupied | Renter-occupied |
| 1-Person Household | 2 (100.0%) | 0 (0.0%) |
| 2-Person Household | 3 (100.0%) | 0 (0.0%) |
| 3-Person Household | 2 (100.0%) | 0 (0.0%) |
| 4+ Person Household | 0 (0.0%) | 1 (100.0%) |
| Total Housing Units | 7 (87.5%) | 1 (12.5%) |
Occupancy by Educational Attainment in Denver
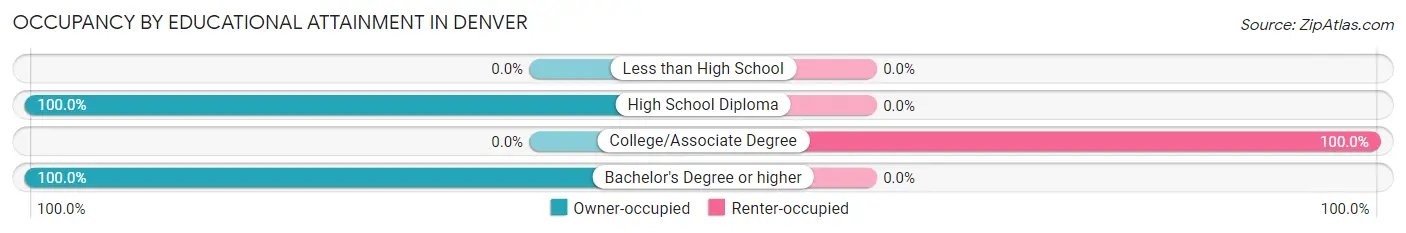
| Household Size | Owner-occupied | Renter-occupied |
| Less than High School | 0 (0.0%) | 0 (0.0%) |
| High School Diploma | 4 (100.0%) | 0 (0.0%) |
| College/Associate Degree | 0 (0.0%) | 1 (100.0%) |
| Bachelor's Degree or higher | 3 (100.0%) | 0 (0.0%) |
Occupancy by Age of Householder in Denver
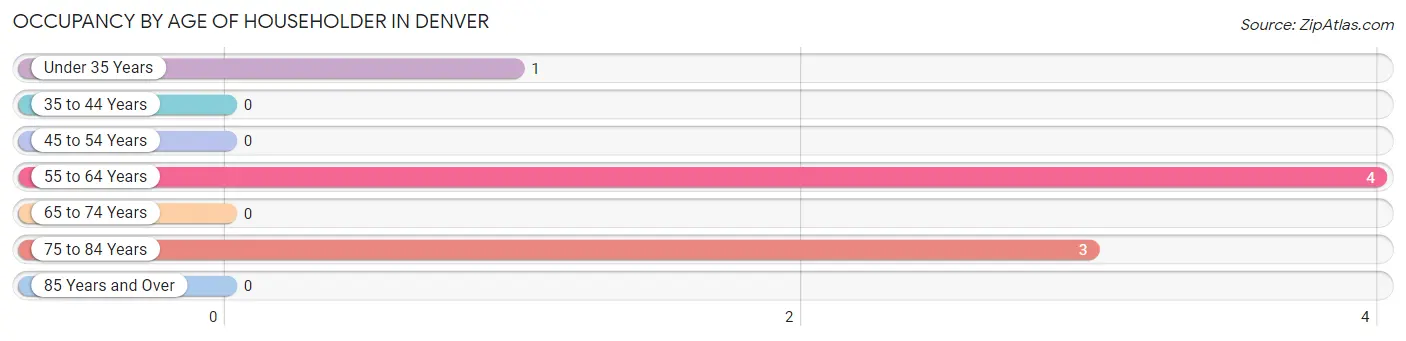
| Age Bracket | # Households | % Households |
| Under 35 Years | 1 | 12.5% |
| 35 to 44 Years | 0 | 0.0% |
| 45 to 54 Years | 0 | 0.0% |
| 55 to 64 Years | 4 | 50.0% |
| 65 to 74 Years | 0 | 0.0% |
| 75 to 84 Years | 3 | 37.5% |
| 85 Years and Over | 0 | 0.0% |
| Total | 8 | 100.0% |
Housing Finances in Denver
Median Income by Occupancy in Denver
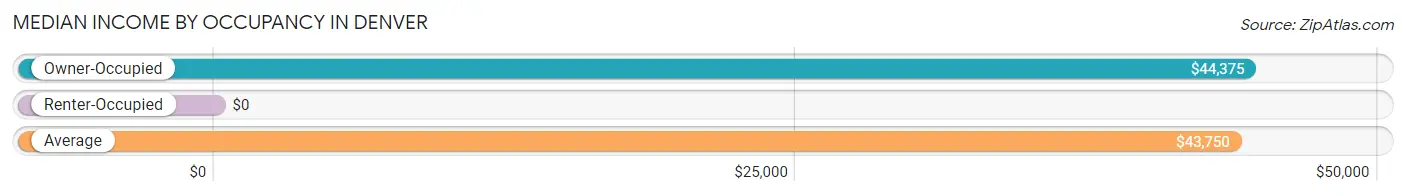
| Occupancy Type | # Households | Median Income |
| Owner-Occupied | 7 (87.5%) | $44,375 |
| Renter-Occupied | 1 (12.5%) | $0 |
| Average | 8 (100.0%) | $43,750 |
Occupancy by Householder Income Bracket in Denver
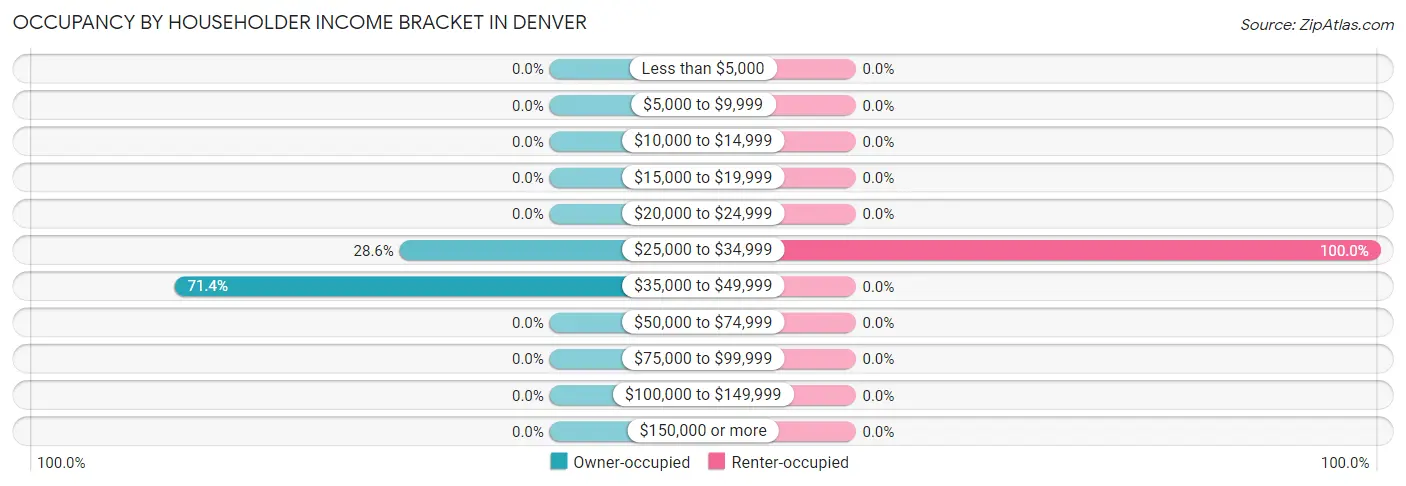
| Income Bracket | Owner-occupied | Renter-occupied |
| Less than $5,000 | 0 (0.0%) | 0 (0.0%) |
| $5,000 to $9,999 | 0 (0.0%) | 0 (0.0%) |
| $10,000 to $14,999 | 0 (0.0%) | 0 (0.0%) |
| $15,000 to $19,999 | 0 (0.0%) | 0 (0.0%) |
| $20,000 to $24,999 | 0 (0.0%) | 0 (0.0%) |
| $25,000 to $34,999 | 2 (28.6%) | 1 (100.0%) |
| $35,000 to $49,999 | 5 (71.4%) | 0 (0.0%) |
| $50,000 to $74,999 | 0 (0.0%) | 0 (0.0%) |
| $75,000 to $99,999 | 0 (0.0%) | 0 (0.0%) |
| $100,000 to $149,999 | 0 (0.0%) | 0 (0.0%) |
| $150,000 or more | 0 (0.0%) | 0 (0.0%) |
| Total | 7 (100.0%) | 1 (100.0%) |
Monthly Housing Cost Tiers in Denver
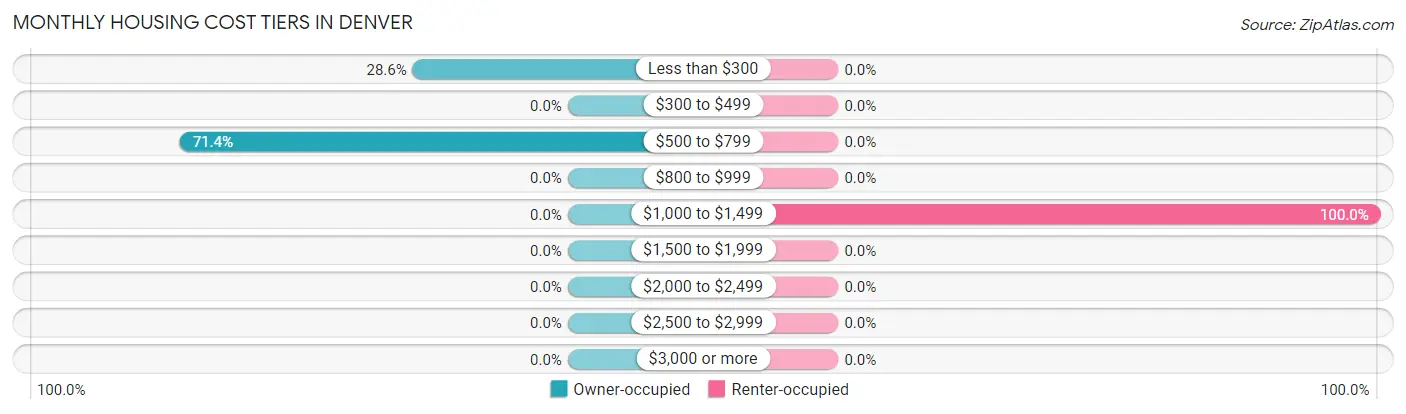
| Monthly Cost | Owner-occupied | Renter-occupied |
| Less than $300 | 2 (28.6%) | 0 (0.0%) |
| $300 to $499 | 0 (0.0%) | 0 (0.0%) |
| $500 to $799 | 5 (71.4%) | 0 (0.0%) |
| $800 to $999 | 0 (0.0%) | 0 (0.0%) |
| $1,000 to $1,499 | 0 (0.0%) | 1 (100.0%) |
| $1,500 to $1,999 | 0 (0.0%) | 0 (0.0%) |
| $2,000 to $2,499 | 0 (0.0%) | 0 (0.0%) |
| $2,500 to $2,999 | 0 (0.0%) | 0 (0.0%) |
| $3,000 or more | 0 (0.0%) | 0 (0.0%) |
| Total | 7 (100.0%) | 1 (100.0%) |
Physical Housing Characteristics in Denver
Housing Structures in Denver
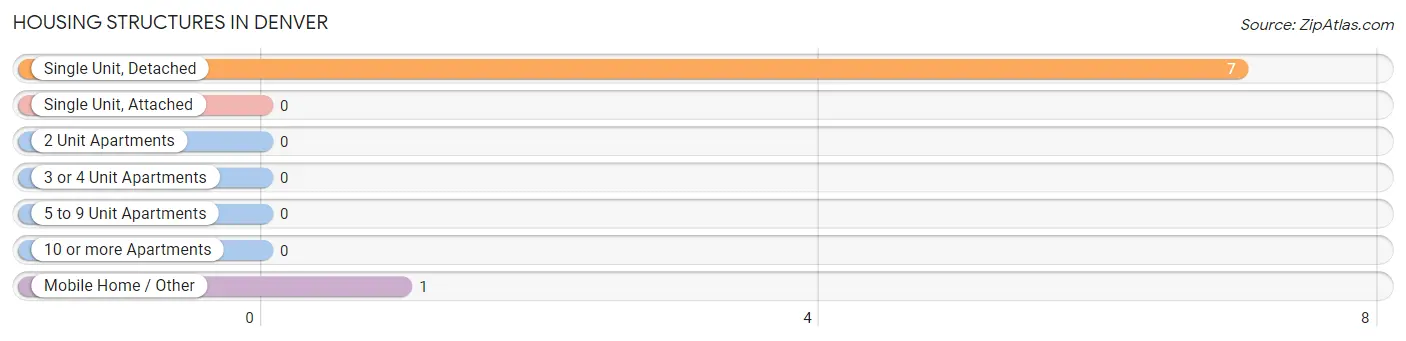
| Structure Type | # Housing Units | % Housing Units |
| Single Unit, Detached | 7 | 87.5% |
| Single Unit, Attached | 0 | 0.0% |
| 2 Unit Apartments | 0 | 0.0% |
| 3 or 4 Unit Apartments | 0 | 0.0% |
| 5 to 9 Unit Apartments | 0 | 0.0% |
| 10 or more Apartments | 0 | 0.0% |
| Mobile Home / Other | 1 | 12.5% |
| Total | 8 | 100.0% |
Housing Structures by Occupancy in Denver
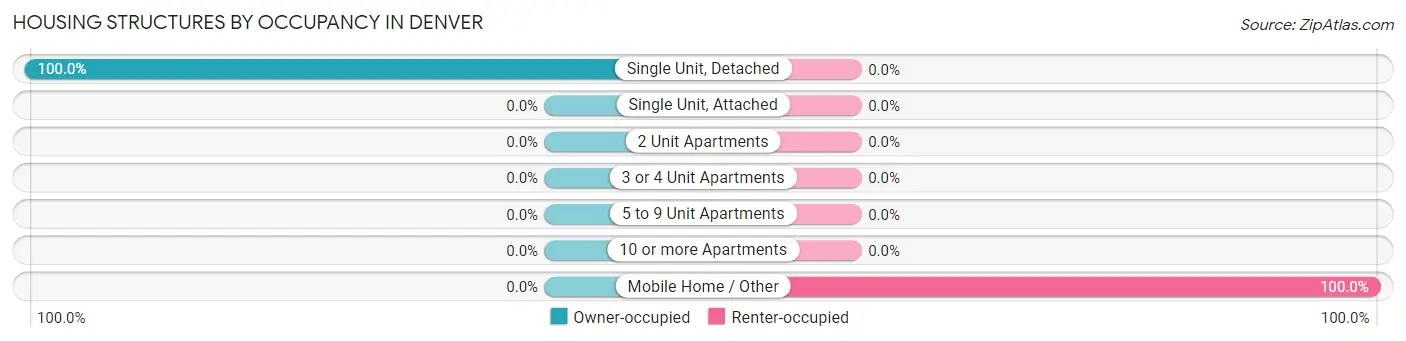
| Structure Type | Owner-occupied | Renter-occupied |
| Single Unit, Detached | 7 (100.0%) | 0 (0.0%) |
| Single Unit, Attached | 0 (0.0%) | 0 (0.0%) |
| 2 Unit Apartments | 0 (0.0%) | 0 (0.0%) |
| 3 or 4 Unit Apartments | 0 (0.0%) | 0 (0.0%) |
| 5 to 9 Unit Apartments | 0 (0.0%) | 0 (0.0%) |
| 10 or more Apartments | 0 (0.0%) | 0 (0.0%) |
| Mobile Home / Other | 0 (0.0%) | 1 (100.0%) |
| Total | 7 (87.5%) | 1 (12.5%) |
Housing Structures by Number of Rooms in Denver
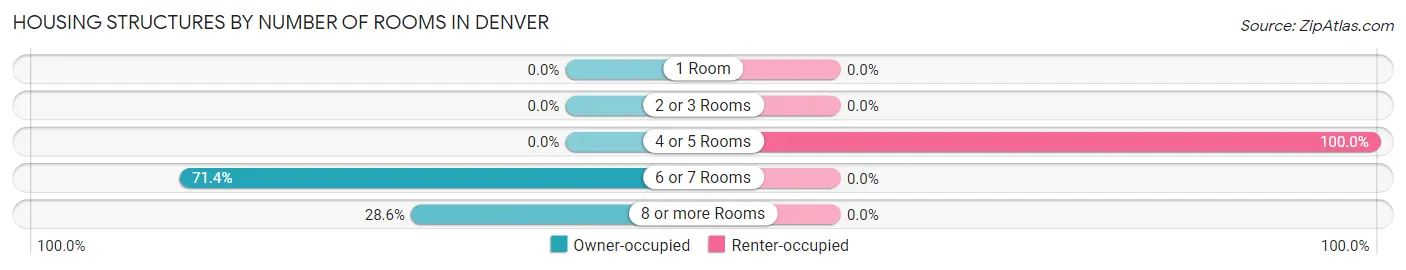
| Number of Rooms | Owner-occupied | Renter-occupied |
| 1 Room | 0 (0.0%) | 0 (0.0%) |
| 2 or 3 Rooms | 0 (0.0%) | 0 (0.0%) |
| 4 or 5 Rooms | 0 (0.0%) | 1 (100.0%) |
| 6 or 7 Rooms | 5 (71.4%) | 0 (0.0%) |
| 8 or more Rooms | 2 (28.6%) | 0 (0.0%) |
| Total | 7 (100.0%) | 1 (100.0%) |
Housing Structure by Heating Type in Denver
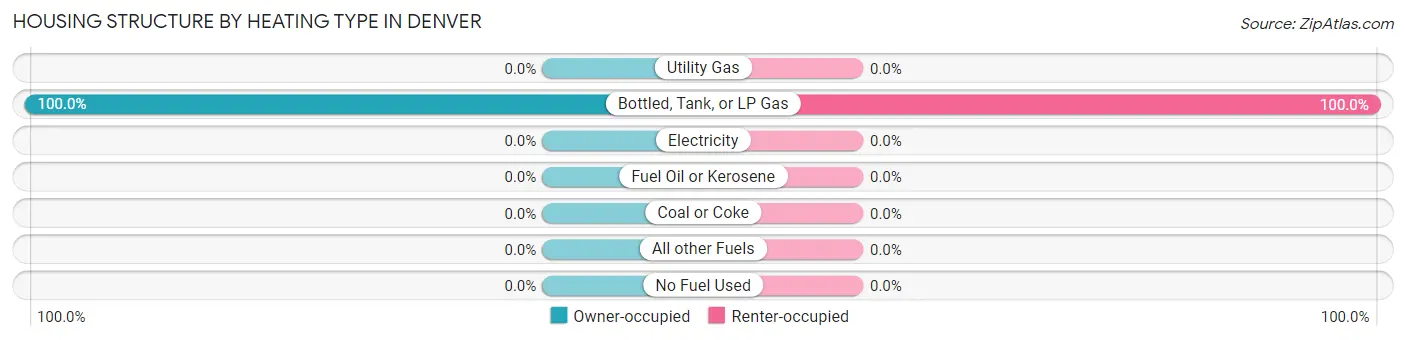
| Heating Type | Owner-occupied | Renter-occupied |
| Utility Gas | 0 (0.0%) | 0 (0.0%) |
| Bottled, Tank, or LP Gas | 7 (100.0%) | 1 (100.0%) |
| Electricity | 0 (0.0%) | 0 (0.0%) |
| Fuel Oil or Kerosene | 0 (0.0%) | 0 (0.0%) |
| Coal or Coke | 0 (0.0%) | 0 (0.0%) |
| All other Fuels | 0 (0.0%) | 0 (0.0%) |
| No Fuel Used | 0 (0.0%) | 0 (0.0%) |
| Total | 7 (100.0%) | 1 (100.0%) |
Household Vehicle Usage in Denver
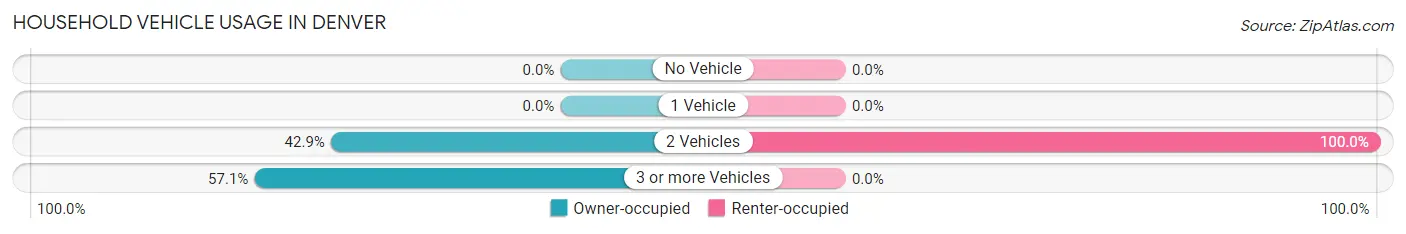
| Vehicles per Household | Owner-occupied | Renter-occupied |
| No Vehicle | 0 (0.0%) | 0 (0.0%) |
| 1 Vehicle | 0 (0.0%) | 0 (0.0%) |
| 2 Vehicles | 3 (42.9%) | 1 (100.0%) |
| 3 or more Vehicles | 4 (57.1%) | 0 (0.0%) |
| Total | 7 (100.0%) | 1 (100.0%) |
Real Estate & Mortgages in Denver
Real Estate and Mortgage Overview in Denver
| Characteristic | Without Mortgage | With Mortgage |
| Housing Units | 4 | 3 |
| Median Property Value | - | - |
| Median Household Income | - | - |
| Monthly Housing Costs | - | - |
| Real Estate Taxes | - | - |
Property Value by Mortgage Status in Denver
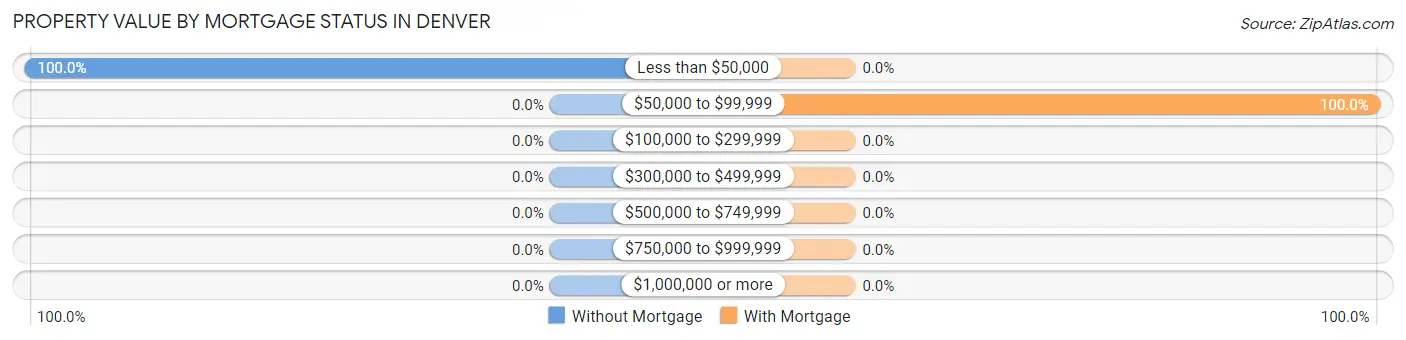
| Property Value | Without Mortgage | With Mortgage |
| Less than $50,000 | 4 (100.0%) | 0 (0.0%) |
| $50,000 to $99,999 | 0 (0.0%) | 3 (100.0%) |
| $100,000 to $299,999 | 0 (0.0%) | 0 (0.0%) |
| $300,000 to $499,999 | 0 (0.0%) | 0 (0.0%) |
| $500,000 to $749,999 | 0 (0.0%) | 0 (0.0%) |
| $750,000 to $999,999 | 0 (0.0%) | 0 (0.0%) |
| $1,000,000 or more | 0 (0.0%) | 0 (0.0%) |
| Total | 4 (100.0%) | 3 (100.0%) |
Household Income by Mortgage Status in Denver
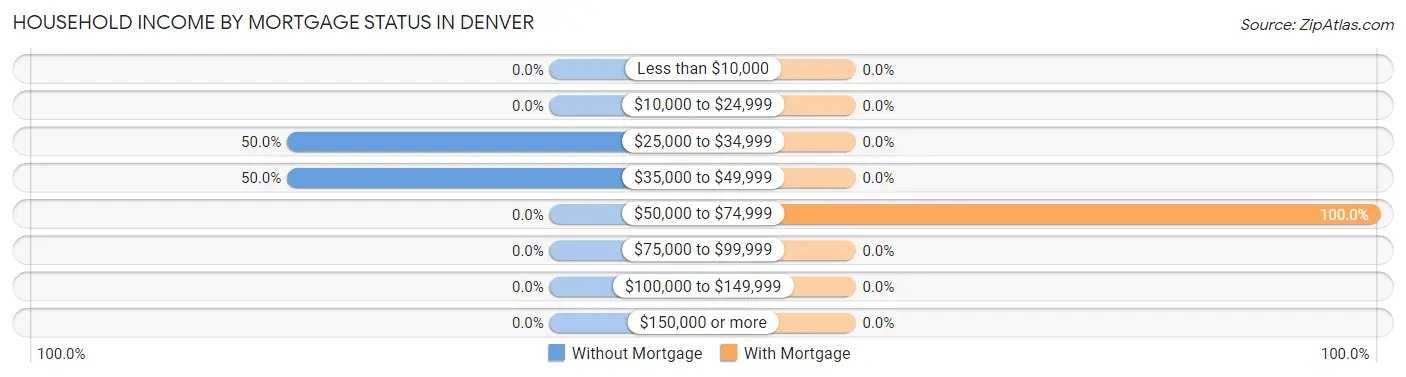
| Household Income | Without Mortgage | With Mortgage |
| Less than $10,000 | 0 (0.0%) | 0 (0.0%) |
| $10,000 to $24,999 | 0 (0.0%) | 0 (0.0%) |
| $25,000 to $34,999 | 2 (50.0%) | 0 (0.0%) |
| $35,000 to $49,999 | 2 (50.0%) | 0 (0.0%) |
| $50,000 to $74,999 | 0 (0.0%) | 3 (100.0%) |
| $75,000 to $99,999 | 0 (0.0%) | 0 (0.0%) |
| $100,000 to $149,999 | 0 (0.0%) | 0 (0.0%) |
| $150,000 or more | 0 (0.0%) | 0 (0.0%) |
| Total | 4 (100.0%) | 3 (100.0%) |
Property Value to Household Income Ratio in Denver
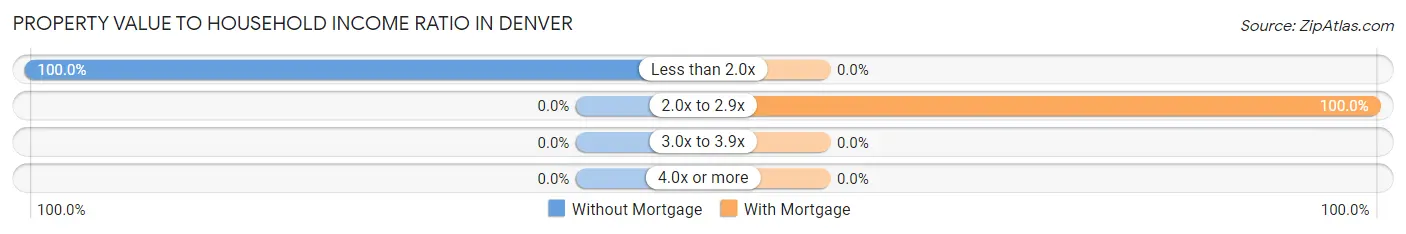
| Value-to-Income Ratio | Without Mortgage | With Mortgage |
| Less than 2.0x | 4 (100.0%) | 0 (0.0%) |
| 2.0x to 2.9x | 0 (0.0%) | 3 (100.0%) |
| 3.0x to 3.9x | 0 (0.0%) | 0 (0.0%) |
| 4.0x or more | 0 (0.0%) | 0 (0.0%) |
| Total | 4 (100.0%) | 3 (100.0%) |
Real Estate Taxes by Mortgage Status in Denver
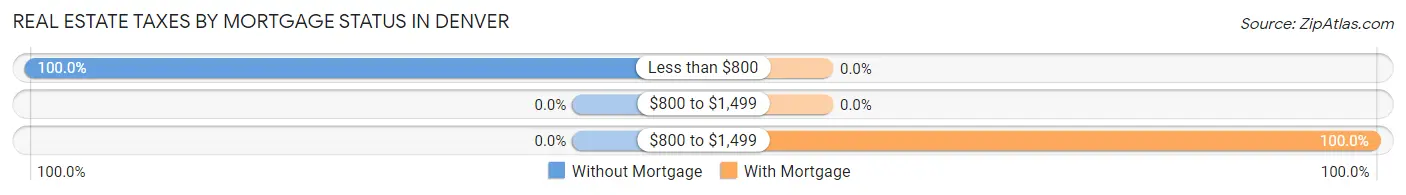
| Property Taxes | Without Mortgage | With Mortgage |
| Less than $800 | 4 (100.0%) | 0 (0.0%) |
| $800 to $1,499 | 0 (0.0%) | 0 (0.0%) |
| $800 to $1,499 | 0 (0.0%) | 3 (100.0%) |
| Total | 4 (100.0%) | 3 (100.0%) |
Health & Disability in Denver
Health Insurance Coverage by Age in Denver
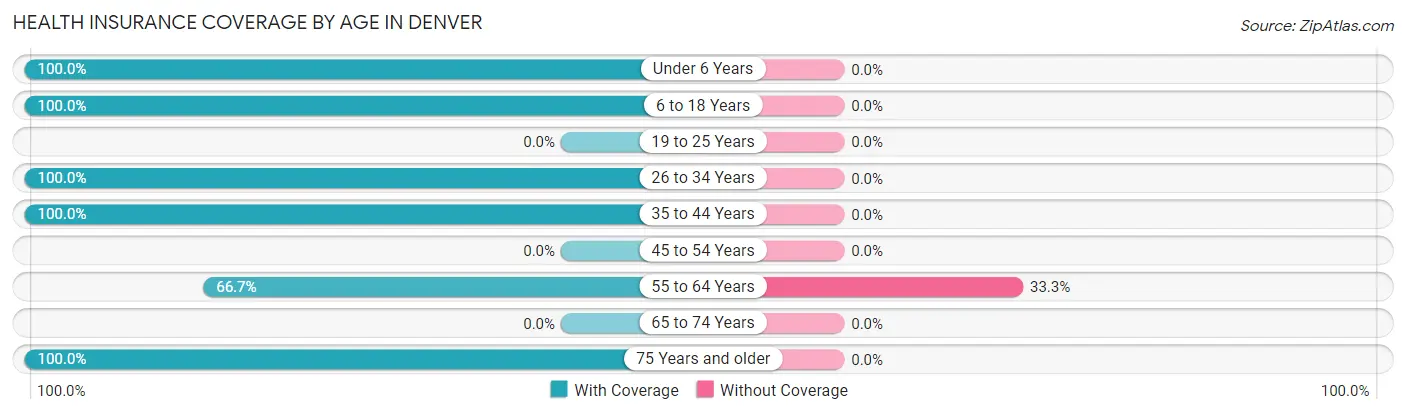
| Age Bracket | With Coverage | Without Coverage |
| Under 6 Years | 2 (100.0%) | 0 (0.0%) |
| 6 to 18 Years | 5 (100.0%) | 0 (0.0%) |
| 19 to 25 Years | 0 (0.0%) | 0 (0.0%) |
| 26 to 34 Years | 1 (100.0%) | 0 (0.0%) |
| 35 to 44 Years | 2 (100.0%) | 0 (0.0%) |
| 45 to 54 Years | 0 (0.0%) | 0 (0.0%) |
| 55 to 64 Years | 4 (66.7%) | 2 (33.3%) |
| 65 to 74 Years | 0 (0.0%) | 0 (0.0%) |
| 75 Years and older | 5 (100.0%) | 0 (0.0%) |
| Total | 19 (90.5%) | 2 (9.5%) |
Health Insurance Coverage by Citizenship Status in Denver
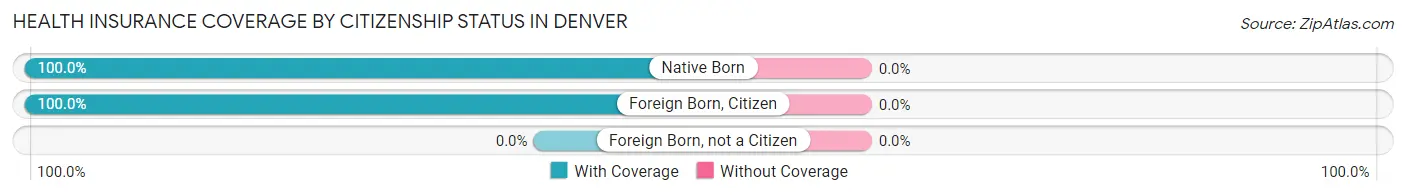
| Citizenship Status | With Coverage | Without Coverage |
| Native Born | 2 (100.0%) | 0 (0.0%) |
| Foreign Born, Citizen | 5 (100.0%) | 0 (0.0%) |
| Foreign Born, not a Citizen | 0 (0.0%) | 0 (0.0%) |
Health Insurance Coverage by Household Income in Denver
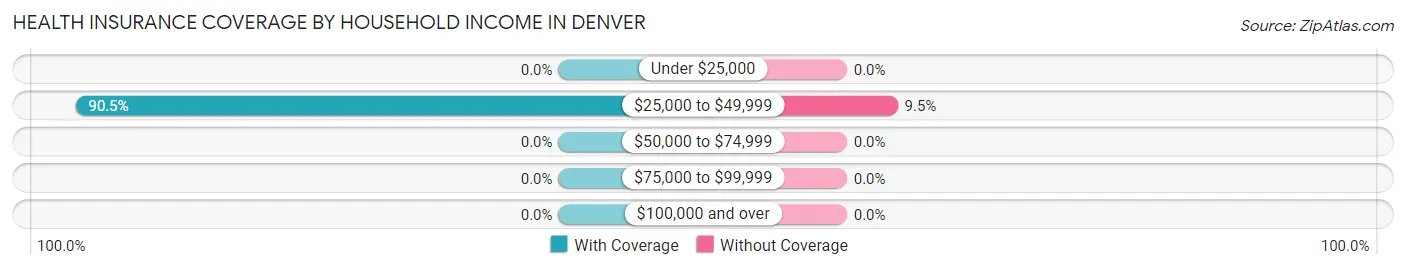
| Household Income | With Coverage | Without Coverage |
| Under $25,000 | 0 (0.0%) | 0 (0.0%) |
| $25,000 to $49,999 | 19 (90.5%) | 2 (9.5%) |
| $50,000 to $74,999 | 0 (0.0%) | 0 (0.0%) |
| $75,000 to $99,999 | 0 (0.0%) | 0 (0.0%) |
| $100,000 and over | 0 (0.0%) | 0 (0.0%) |
Public vs Private Health Insurance Coverage by Age in Denver
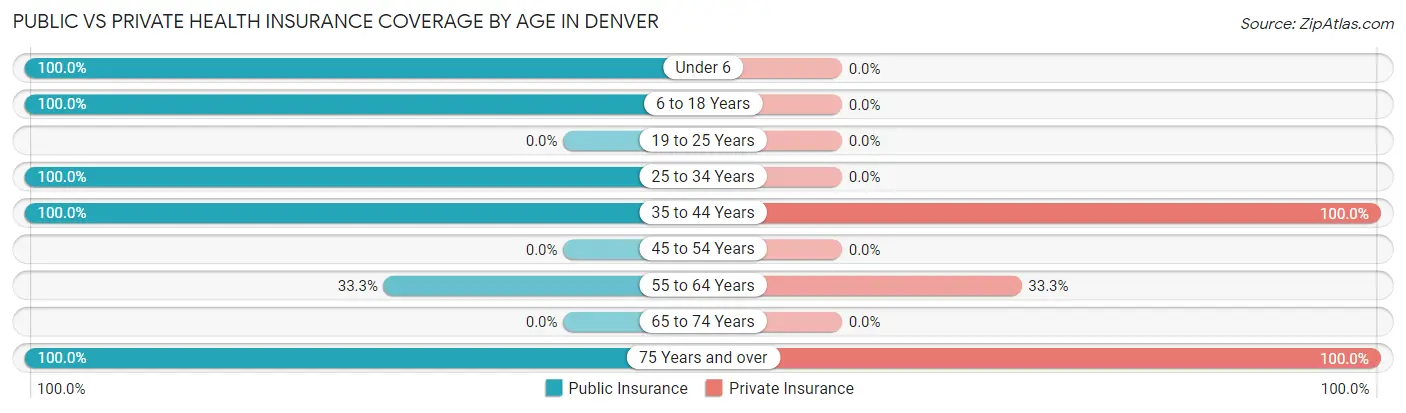
| Age Bracket | Public Insurance | Private Insurance |
| Under 6 | 2 (100.0%) | 0 (0.0%) |
| 6 to 18 Years | 5 (100.0%) | 0 (0.0%) |
| 19 to 25 Years | 0 (0.0%) | 0 (0.0%) |
| 25 to 34 Years | 1 (100.0%) | 0 (0.0%) |
| 35 to 44 Years | 2 (100.0%) | 2 (100.0%) |
| 45 to 54 Years | 0 (0.0%) | 0 (0.0%) |
| 55 to 64 Years | 2 (33.3%) | 2 (33.3%) |
| 65 to 74 Years | 0 (0.0%) | 0 (0.0%) |
| 75 Years and over | 5 (100.0%) | 5 (100.0%) |
| Total | 17 (80.9%) | 9 (42.9%) |
Disability Status by Sex by Age in Denver
| Age Bracket | Male | Female |
| Under 5 Years | 0 (0.0%) | 0 (0.0%) |
| 5 to 17 Years | 0 (0.0%) | 0 (0.0%) |
| 18 to 34 Years | 0 (0.0%) | 0 (0.0%) |
| 35 to 64 Years | 0 (0.0%) | 0 (0.0%) |
| 65 to 74 Years | 0 (0.0%) | 0 (0.0%) |
| 75 Years and over | 0 (0.0%) | 0 (0.0%) |
Disability Class by Sex by Age in Denver
Disability Class: Hearing Difficulty
| Age Bracket | Male | Female |
| Under 5 Years | 0 (0.0%) | 0 (0.0%) |
| 5 to 17 Years | 0 (0.0%) | 0 (0.0%) |
| 18 to 34 Years | 0 (0.0%) | 0 (0.0%) |
| 35 to 64 Years | 0 (0.0%) | 0 (0.0%) |
| 65 to 74 Years | 0 (0.0%) | 0 (0.0%) |
| 75 Years and over | 0 (0.0%) | 0 (0.0%) |
Disability Class: Vision Difficulty
| Age Bracket | Male | Female |
| Under 5 Years | 0 (0.0%) | 0 (0.0%) |
| 5 to 17 Years | 0 (0.0%) | 0 (0.0%) |
| 18 to 34 Years | 0 (0.0%) | 0 (0.0%) |
| 35 to 64 Years | 0 (0.0%) | 0 (0.0%) |
| 65 to 74 Years | 0 (0.0%) | 0 (0.0%) |
| 75 Years and over | 0 (0.0%) | 0 (0.0%) |
Disability Class: Cognitive Difficulty
| Age Bracket | Male | Female |
| 5 to 17 Years | 0 (0.0%) | 0 (0.0%) |
| 18 to 34 Years | 0 (0.0%) | 0 (0.0%) |
| 35 to 64 Years | 0 (0.0%) | 0 (0.0%) |
| 65 to 74 Years | 0 (0.0%) | 0 (0.0%) |
| 75 Years and over | 0 (0.0%) | 0 (0.0%) |
Disability Class: Ambulatory Difficulty
| Age Bracket | Male | Female |
| 5 to 17 Years | 0 (0.0%) | 0 (0.0%) |
| 18 to 34 Years | 0 (0.0%) | 0 (0.0%) |
| 35 to 64 Years | 0 (0.0%) | 0 (0.0%) |
| 65 to 74 Years | 0 (0.0%) | 0 (0.0%) |
| 75 Years and over | 0 (0.0%) | 0 (0.0%) |
Disability Class: Self-Care Difficulty
| Age Bracket | Male | Female |
| 5 to 17 Years | 0 (0.0%) | 0 (0.0%) |
| 18 to 34 Years | 0 (0.0%) | 0 (0.0%) |
| 35 to 64 Years | 0 (0.0%) | 0 (0.0%) |
| 65 to 74 Years | 0 (0.0%) | 0 (0.0%) |
| 75 Years and over | 0 (0.0%) | 0 (0.0%) |
Technology Access in Denver
Computing Device Access in Denver
| Device Type | # Households | % Households |
| Desktop or Laptop | 4 | 50.0% |
| Smartphone | 4 | 50.0% |
| Tablet | 4 | 50.0% |
| No Computing Device | 4 | 50.0% |
| Total | 8 | 100.0% |
Internet Access in Denver
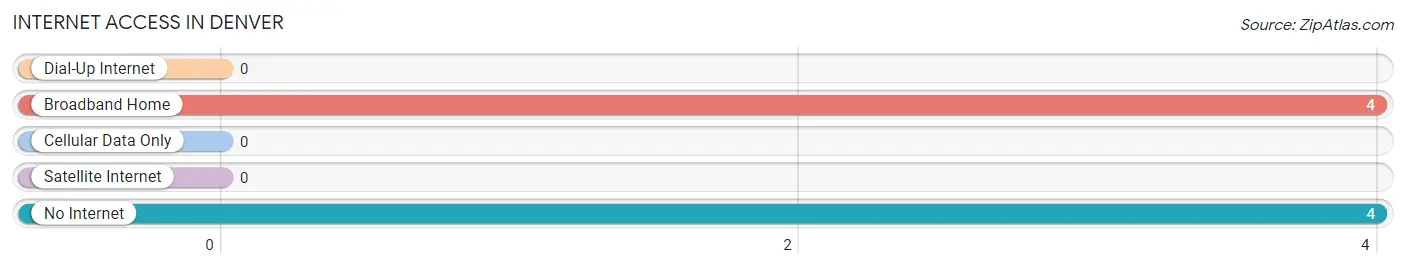
| Internet Type | # Households | % Households |
| Dial-Up Internet | 0 | 0.0% |
| Broadband Home | 4 | 50.0% |
| Cellular Data Only | 0 | 0.0% |
| Satellite Internet | 0 | 0.0% |
| No Internet | 4 | 50.0% |
| Total | 8 | 100.0% |
Denver Summary
Denver, Colorado is the capital and most populous city of the U.S. state of Colorado. It is located in the South Platte River Valley on the western edge of the High Plains just east of the Front Range of the Rocky Mountains. Denver is nicknamed the Mile High City because its official elevation is exactly one mile (5280 feet or 1609.3 meters) above sea level. The 105th meridian west of Greenwich, the longitudinal reference for the Mountain Time Zone, passes directly through Denver Union Station.
History
Denver was founded in 1858 as a mining town during the Pike’s Peak Gold Rush. The city was named after James W. Denver, a governor of the Kansas Territory. It quickly grew during the late 19th century, becoming a major transportation hub for the region. The Denver Pacific Railroad connected Denver with the transcontinental railroad in 1870, and the city grew rapidly in the following decades. By 1900, Denver had become the largest city in the Rocky Mountain region.
Geography
Denver is located in the South Platte River Valley on the western edge of the High Plains, just east of the Front Range of the Rocky Mountains. The city lies at an elevation of 5,280 feet (1,609 m) above sea level, making it the highest major city in the United States. The city is located in the center of the Front Range Urban Corridor, an oblong region of urban population that extends from Cheyenne, Wyoming, to Pueblo, Colorado.
Denver is surrounded by mountains and valleys and is located at the base of the Rocky Mountains. The city is situated on the South Platte River, approximately 15 miles (24 km) east of the foothills of the Rocky Mountains. The city is located in the foothills of the Front Range of the Rocky Mountains, which rise to the west of the city.
Economy
Denver is an important economic center for the Rocky Mountain region. The city is home to several major corporations, including the headquarters of four major publicly traded companies: Molson Coors Brewing Company, DaVita, Liberty Global, and Qwest Communications. The city is also home to the Denver Federal Center, the largest concentration of federal government employees in the United States outside of Washington, D.C.
The city's economy is based on a diverse mix of industries, including aerospace, telecommunications, energy, healthcare, finance, manufacturing, and tourism. Denver is home to several major corporate headquarters, including those of Frontier Airlines, United Airlines, and United Launch Alliance. The city is also home to several major universities, including the University of Colorado Denver, the University of Denver, and the University of Northern Colorado.
Demographics
As of the 2010 census, the population of Denver was 600,158, making it the 24th most populous city in the United States. The city's population is racially and ethnically diverse, with a majority of the population being non-Hispanic white (48.9%). The city also has a large Hispanic population (31.2%), as well as a significant African American population (10.2%). Other racial and ethnic groups include Asian (4.2%), Native American (1.2%), and Pacific Islander (0.2%).
The median household income in Denver is $54,735, and the median family income is $63,845. The city's poverty rate is 13.2%, slightly higher than the national average of 12.3%. The city's unemployment rate is 4.2%, slightly lower than the national average of 4.4%.
Conclusion
Denver is the capital and most populous city of the U.S. state of Colorado. It is located in the South Platte River Valley on the western edge of the High Plains just east of the Front Range of the Rocky Mountains. Denver is nicknamed the Mile High City because its official elevation is exactly one mile (5280 feet or 1609.3 meters) above sea level. The city was founded in 1858 as a mining town during the Pike’s Peak Gold Rush and has since grown to become an important economic center for the Rocky Mountain region. The city is home to several major corporations, universities, and federal government employees. The population of Denver is racially and ethnically diverse, with a majority of the population being non-Hispanic white. The city's median household income is $54,735, and the poverty rate is 13.2%.
Common Questions
What is Per Capita Income in Denver?
Per Capita income in Denver is $15,843.
What is the Median Family Income in Denver?
Median Family Income in Denver is $45,000.
What is the Median Household income in Denver?
Median Household Income in Denver is $43,750.
What is Inequality or Gini Index in Denver?
Inequality or Gini Index in Denver is 0.10.
What is the Total Population of Denver?
Total Population of Denver is 21.
What is the Total Male Population of Denver?
Total Male Population of Denver is 12.
What is the Total Female Population of Denver?
Total Female Population of Denver is 9.
What is the Ratio of Males per 100 Females in Denver?
There are 133.33 Males per 100 Females in Denver.
What is the Ratio of Females per 100 Males in Denver?
There are 75.00 Females per 100 Males in Denver.
What is the Median Population Age in Denver?
Median Population Age in Denver is 56.3 Years.
What is the Average Family Size in Denver
Average Family Size in Denver is 3.2 People.
What is the Average Household Size in Denver
Average Household Size in Denver is 2.6 People.
How Large is the Labor Force in Denver?
There are 9 People in the Labor Forcein in Denver.
What is the Percentage of People in the Labor Force in Denver?
52.9% of People are in the Labor Force in Denver.