Zip Codes with the Highest Percentage of Population Employed in Food Preparation & Serving in Missouri
RELATED REPORTS & OPTIONS
Food Preparation & Serving
Missouri
Compare Zip Codes
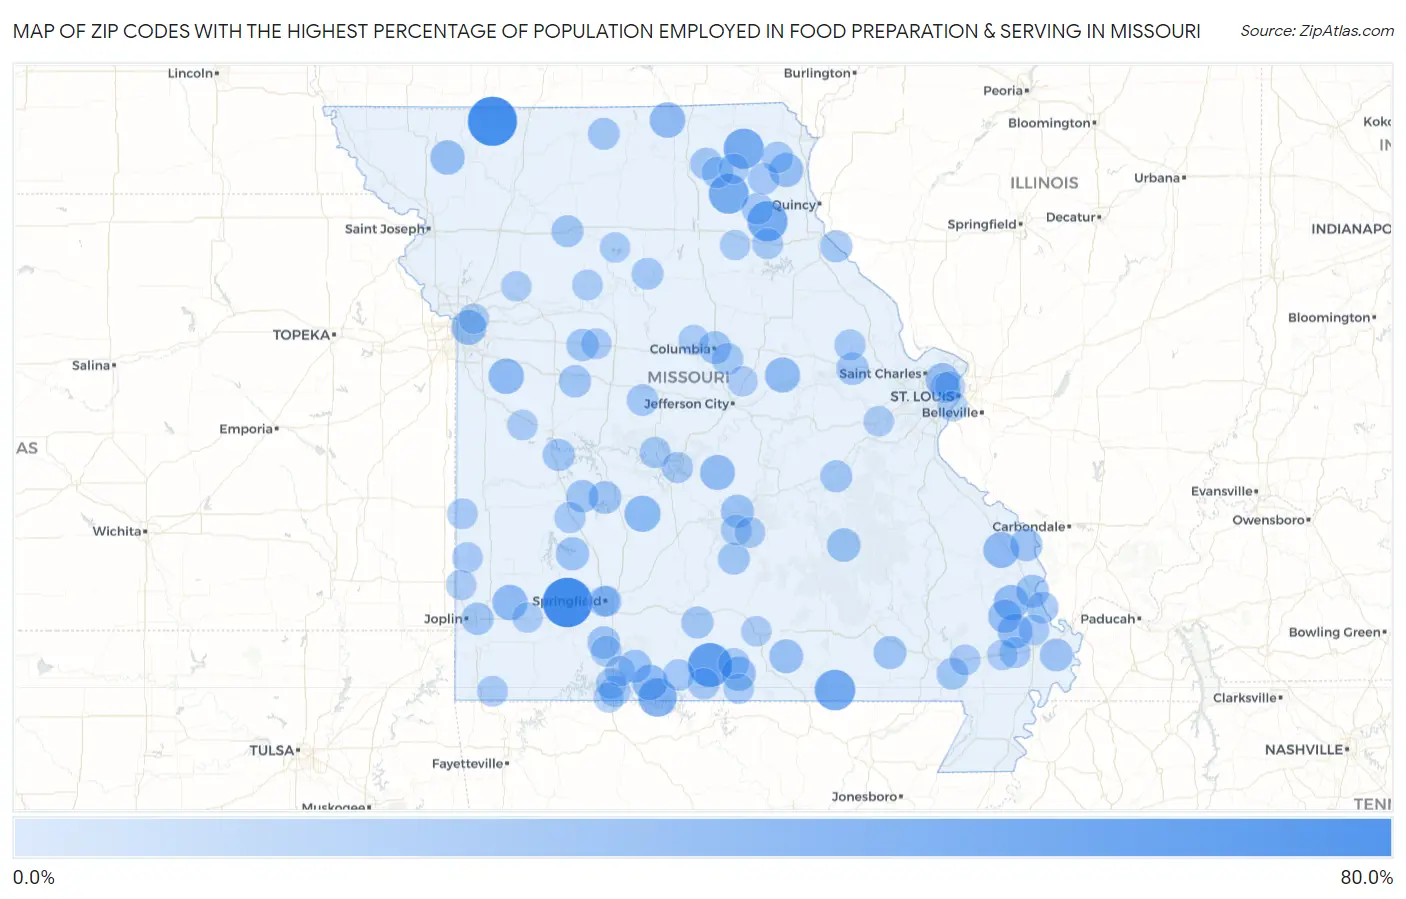
Map of Zip Codes with the Highest Percentage of Population Employed in Food Preparation & Serving in Missouri
0.0%
80.0%
Zip Codes with the Highest Percentage of Population Employed in Food Preparation & Serving in Missouri
| Zip Code | % Employed | vs State | vs National | |
| 1. | 65664 | 62.5% | 5.2%(+57.3)#1 | 5.3%(+57.2)#29 |
| 2. | 64420 | 61.5% | 5.2%(+56.3)#2 | 5.3%(+56.3)#30 |
| 3. | 65618 | 46.5% | 5.2%(+41.3)#3 | 5.3%(+41.2)#68 |
| 4. | 65690 | 37.5% | 5.2%(+32.3)#4 | 5.3%(+32.2)#124 |
| 5. | 63563 | 36.4% | 5.2%(+31.2)#5 | 5.3%(+31.2)#132 |
| 6. | 63439 | 36.0% | 5.2%(+30.8)#6 | 5.3%(+30.7)#137 |
| 7. | 63460 | 35.4% | 5.2%(+30.2)#7 | 5.3%(+30.1)#145 |
| 8. | 65733 | 31.5% | 5.2%(+26.2)#8 | 5.3%(+26.2)#192 |
| 9. | 65764 | 25.1% | 5.2%(+19.9)#9 | 5.3%(+19.9)#311 |
| 10. | 63747 | 24.2% | 5.2%(+18.9)#10 | 5.3%(+18.9)#335 |
| 11. | 63551 | 23.6% | 5.2%(+18.4)#11 | 5.3%(+18.3)#362 |
| 12. | 65744 | 23.5% | 5.2%(+18.3)#12 | 5.3%(+18.2)#365 |
| 13. | 64090 | 23.4% | 5.2%(+18.1)#13 | 5.3%(+18.1)#374 |
| 14. | 64833 | 23.1% | 5.2%(+17.8)#14 | 5.3%(+17.8)#383 |
| 15. | 65067 | 22.5% | 5.2%(+17.2)#15 | 5.3%(+17.2)#403 |
| 16. | 63744 | 22.5% | 5.2%(+17.2)#16 | 5.3%(+17.2)#404 |
| 17. | 65486 | 22.0% | 5.2%(+16.7)#17 | 5.3%(+16.7)#419 |
| 18. | 64126 | 21.8% | 5.2%(+16.6)#18 | 5.3%(+16.5)#425 |
| 19. | 63784 | 21.2% | 5.2%(+16.0)#19 | 5.3%(+15.9)#449 |
| 20. | 64433 | 20.7% | 5.2%(+15.5)#20 | 5.3%(+15.4)#470 |
| 21. | 65790 | 20.1% | 5.2%(+14.8)#21 | 5.3%(+14.8)#498 |
| 22. | 63457 | 19.8% | 5.2%(+14.5)#22 | 5.3%(+14.5)#518 |
| 23. | 63140 | 19.4% | 5.2%(+14.2)#23 | 5.3%(+14.1)#537 |
| 24. | 65788 | 19.0% | 5.2%(+13.8)#24 | 5.3%(+13.7)#566 |
| 25. | 63774 | 18.6% | 5.2%(+13.4)#25 | 5.3%(+13.4)#600 |
| 26. | 65440 | 18.0% | 5.2%(+12.8)#26 | 5.3%(+12.7)#656 |
| 27. | 65601 | 17.4% | 5.2%(+12.1)#27 | 5.3%(+12.1)#718 |
| 28. | 65584 | 17.1% | 5.2%(+11.8)#28 | 5.3%(+11.8)#739 |
| 29. | 65759 | 16.8% | 5.2%(+11.5)#29 | 5.3%(+11.5)#766 |
| 30. | 63703 | 16.7% | 5.2%(+11.4)#30 | 5.3%(+11.4)#773 |
| 31. | 63943 | 16.6% | 5.2%(+11.3)#31 | 5.3%(+11.3)#792 |
| 32. | 63820 | 16.4% | 5.2%(+11.2)#32 | 5.3%(+11.1)#805 |
| 33. | 65668 | 16.3% | 5.2%(+11.0)#33 | 5.3%(+11.0)#827 |
| 34. | 65216 | 15.9% | 5.2%(+10.6)#34 | 5.3%(+10.6)#877 |
| 35. | 65669 | 15.7% | 5.2%(+10.5)#35 | 5.3%(+10.5)#889 |
| 36. | 63732 | 15.6% | 5.2%(+10.4)#36 | 5.3%(+10.4)#899 |
| 37. | 65774 | 15.5% | 5.2%(+10.2)#37 | 5.3%(+10.2)#919 |
| 38. | 63380 | 15.3% | 5.2%(+10.1)#38 | 5.3%(+10.1)#937 |
| 39. | 65327 | 15.0% | 5.2%(+9.73)#39 | 5.3%(+9.68)#986 |
| 40. | 65305 | 14.7% | 5.2%(+9.51)#40 | 5.3%(+9.46)#1,020 |
| 41. | 64740 | 14.6% | 5.2%(+9.34)#41 | 5.3%(+9.29)#1,044 |
| 42. | 64841 | 14.6% | 5.2%(+9.33)#42 | 5.3%(+9.28)#1,045 |
| 43. | 64686 | 14.3% | 5.2%(+9.05)#43 | 5.3%(+9.00)#1,102 |
| 44. | 63467 | 14.3% | 5.2%(+9.05)#44 | 5.3%(+9.00)#1,106 |
| 45. | 65702 | 14.2% | 5.2%(+8.92)#45 | 5.3%(+8.87)#1,133 |
| 46. | 65535 | 14.1% | 5.2%(+8.84)#46 | 5.3%(+8.79)#1,146 |
| 47. | 63533 | 14.0% | 5.2%(+8.75)#47 | 5.3%(+8.70)#1,164 |
| 48. | 63932 | 13.8% | 5.2%(+8.59)#48 | 5.3%(+8.54)#1,200 |
| 49. | 65552 | 13.5% | 5.2%(+8.25)#49 | 5.3%(+8.20)#1,280 |
| 50. | 64667 | 13.4% | 5.2%(+8.15)#50 | 5.3%(+8.10)#1,294 |
| 51. | 63742 | 13.3% | 5.2%(+8.10)#51 | 5.3%(+8.05)#1,308 |
| 52. | 65201 | 13.3% | 5.2%(+8.05)#52 | 5.3%(+8.00)#1,322 |
| 53. | 65261 | 13.3% | 5.2%(+8.05)#53 | 5.3%(+8.00)#1,323 |
| 54. | 63434 | 13.2% | 5.2%(+7.95)#54 | 5.3%(+7.90)#1,342 |
| 55. | 65329 | 12.9% | 5.2%(+7.70)#55 | 5.3%(+7.65)#1,406 |
| 56. | 63447 | 12.8% | 5.2%(+7.57)#56 | 5.3%(+7.52)#1,440 |
| 57. | 63547 | 12.8% | 5.2%(+7.56)#57 | 5.3%(+7.50)#1,444 |
| 58. | 63473 | 12.8% | 5.2%(+7.53)#58 | 5.3%(+7.48)#1,448 |
| 59. | 65655 | 12.7% | 5.2%(+7.49)#59 | 5.3%(+7.44)#1,461 |
| 60. | 65762 | 12.4% | 5.2%(+7.21)#60 | 5.3%(+7.16)#1,533 |
| 61. | 65637 | 12.2% | 5.2%(+6.99)#61 | 5.3%(+6.94)#1,585 |
| 62. | 65037 | 12.1% | 5.2%(+6.90)#62 | 5.3%(+6.85)#1,619 |
| 63. | 65674 | 11.9% | 5.2%(+6.70)#63 | 5.3%(+6.65)#1,690 |
| 64. | 65672 | 11.8% | 5.2%(+6.57)#64 | 5.3%(+6.52)#1,734 |
| 65. | 65065 | 11.7% | 5.2%(+6.48)#65 | 5.3%(+6.43)#1,764 |
| 66. | 63443 | 11.7% | 5.2%(+6.48)#66 | 5.3%(+6.43)#1,769 |
| 67. | 63349 | 11.6% | 5.2%(+6.40)#67 | 5.3%(+6.34)#1,805 |
| 68. | 63868 | 11.5% | 5.2%(+6.30)#68 | 5.3%(+6.25)#1,835 |
| 69. | 65726 | 11.2% | 5.2%(+5.97)#69 | 5.3%(+5.92)#1,956 |
| 70. | 63936 | 11.1% | 5.2%(+5.88)#70 | 5.3%(+5.83)#1,997 |
| 71. | 65754 | 11.0% | 5.2%(+5.79)#71 | 5.3%(+5.74)#2,046 |
| 72. | 65806 | 11.0% | 5.2%(+5.76)#72 | 5.3%(+5.70)#2,060 |
| 73. | 65473 | 10.9% | 5.2%(+5.71)#73 | 5.3%(+5.66)#2,081 |
| 74. | 64856 | 10.8% | 5.2%(+5.58)#74 | 5.3%(+5.53)#2,148 |
| 75. | 63824 | 10.8% | 5.2%(+5.58)#75 | 5.3%(+5.52)#2,151 |
| 76. | 64633 | 10.7% | 5.2%(+5.45)#76 | 5.3%(+5.39)#2,215 |
| 77. | 65351 | 10.6% | 5.2%(+5.39)#77 | 5.3%(+5.34)#2,249 |
| 78. | 65897 | 10.6% | 5.2%(+5.37)#78 | 5.3%(+5.32)#2,257 |
| 79. | 64741 | 10.6% | 5.2%(+5.35)#79 | 5.3%(+5.30)#2,272 |
| 80. | 65740 | 10.6% | 5.2%(+5.35)#80 | 5.3%(+5.30)#2,275 |
| 81. | 65461 | 10.2% | 5.2%(+4.97)#81 | 5.3%(+4.92)#2,482 |
| 82. | 63133 | 10.2% | 5.2%(+4.93)#82 | 5.3%(+4.88)#2,510 |
| 83. | 64762 | 10.2% | 5.2%(+4.92)#83 | 5.3%(+4.87)#2,512 |
| 84. | 64788 | 10.1% | 5.2%(+4.89)#84 | 5.3%(+4.84)#2,542 |
| 85. | 65279 | 10.1% | 5.2%(+4.87)#85 | 5.3%(+4.81)#2,557 |
| 86. | 65756 | 10.0% | 5.2%(+4.81)#86 | 5.3%(+4.76)#2,599 |
| 87. | 65793 | 10.0% | 5.2%(+4.78)#87 | 5.3%(+4.73)#2,616 |
| 88. | 63846 | 10.0% | 5.2%(+4.78)#88 | 5.3%(+4.73)#2,617 |
| 89. | 64084 | 10.0% | 5.2%(+4.76)#89 | 5.3%(+4.71)#2,628 |
| 90. | 64161 | 10.0% | 5.2%(+4.76)#90 | 5.3%(+4.71)#2,638 |
| 91. | 63120 | 10.0% | 5.2%(+4.76)#91 | 5.3%(+4.70)#2,643 |
| 92. | 64832 | 9.8% | 5.2%(+4.60)#92 | 5.3%(+4.55)#2,768 |
| 93. | 65739 | 9.8% | 5.2%(+4.55)#93 | 5.3%(+4.50)#2,808 |
| 94. | 64681 | 9.7% | 5.2%(+4.49)#94 | 5.3%(+4.44)#2,868 |
| 95. | 65063 | 9.7% | 5.2%(+4.49)#95 | 5.3%(+4.44)#2,869 |
| 96. | 63111 | 9.7% | 5.2%(+4.44)#96 | 5.3%(+4.39)#2,907 |
| 97. | 63537 | 9.7% | 5.2%(+4.43)#97 | 5.3%(+4.38)#2,913 |
| 98. | 63089 | 9.6% | 5.2%(+4.41)#98 | 5.3%(+4.36)#2,927 |
| 99. | 63450 | 9.6% | 5.2%(+4.38)#99 | 5.3%(+4.33)#2,957 |
| 100. | 65626 | 9.6% | 5.2%(+4.38)#100 | 5.3%(+4.33)#2,961 |
Common Questions
What are the Top 10 Zip Codes with the Highest Percentage of Population Employed in Food Preparation & Serving in Missouri?
Top 10 Zip Codes with the Highest Percentage of Population Employed in Food Preparation & Serving in Missouri are:
What zip code has the Highest Percentage of Population Employed in Food Preparation & Serving in Missouri?
65664 has the Highest Percentage of Population Employed in Food Preparation & Serving in Missouri with 62.5%.
What is the Percentage of Population Employed in Food Preparation & Serving in the State of Missouri?
Percentage of Population Employed in Food Preparation & Serving in Missouri is 5.2%.
What is the Percentage of Population Employed in Food Preparation & Serving in the United States?
Percentage of Population Employed in Food Preparation & Serving in the United States is 5.3%.