Vanduser, MO Map & Demographics
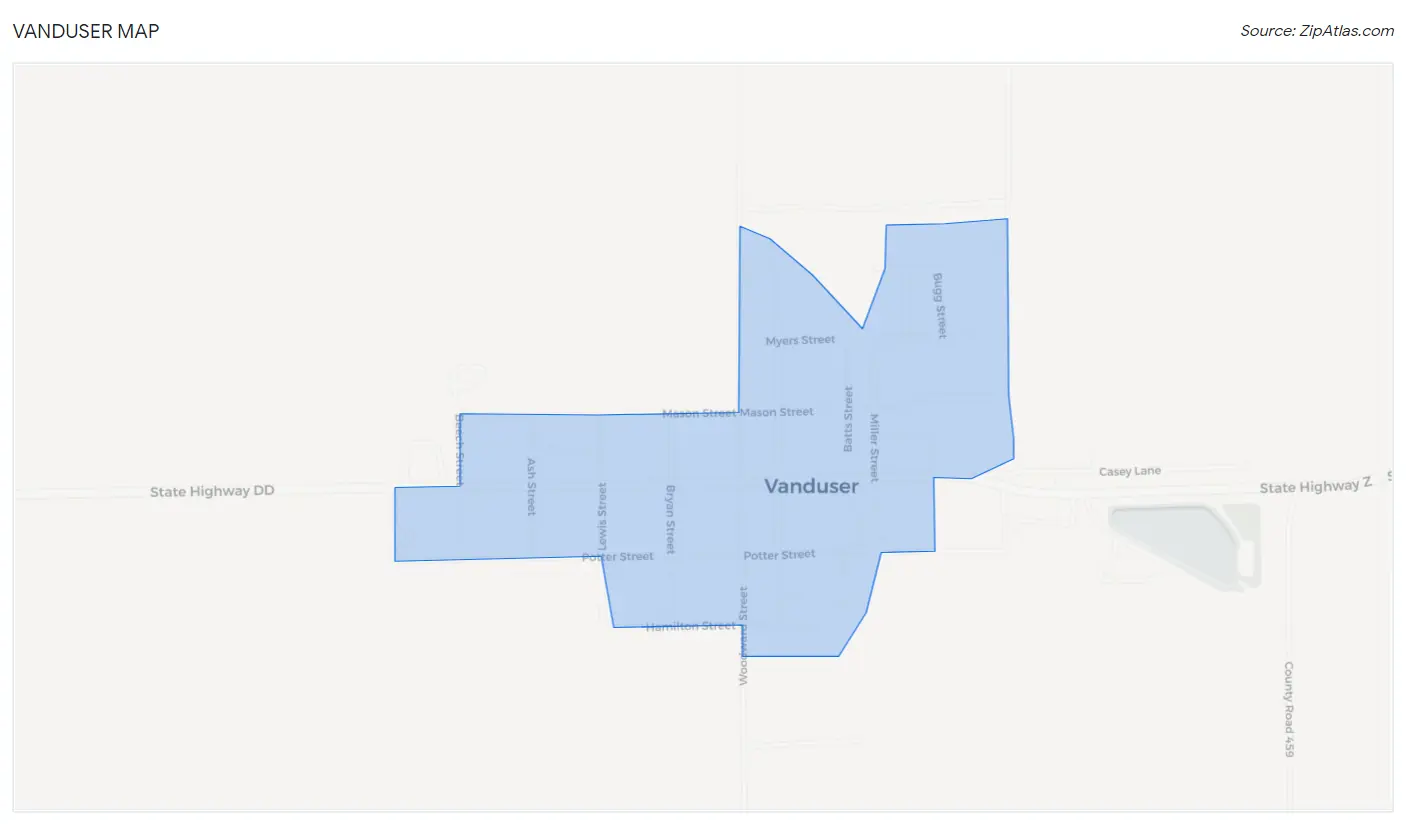
Vanduser Map
Vanduser Overview
$19,482
PER CAPITA INCOME
$55,781
AVG FAMILY INCOME
$54,375
AVG HOUSEHOLD INCOME
0.39
INEQUALITY / GINI INDEX
182
TOTAL POPULATION
116
MALE POPULATION
66
FEMALE POPULATION
175.76
MALES / 100 FEMALES
56.90
FEMALES / 100 MALES
39.7
MEDIAN AGE
2.8
AVG FAMILY SIZE
2.5
AVG HOUSEHOLD SIZE
73
LABOR FORCE [ PEOPLE ]
43.7%
PERCENT IN LABOR FORCE
12.3%
UNEMPLOYMENT RATE
Vanduser Zip Codes
Vanduser Area Codes
Income in Vanduser
Income Overview in Vanduser
Per Capita Income in Vanduser is $19,482, while median incomes of families and households are $55,781 and $54,375 respectively.
| Characteristic | Number | Measure |
| Per Capita Income | 182 | $19,482 |
| Median Family Income | 45 | $55,781 |
| Mean Family Income | 45 | $60,791 |
| Median Household Income | 60 | $54,375 |
| Mean Household Income | 60 | $60,922 |
| Income Deficit | 45 | $0 |
| Wage / Income Gap (%) | 182 | 0.00% |
| Wage / Income Gap ($) | 182 | 100.00¢ per $1 |
| Gini / Inequality Index | 182 | 0.39 |
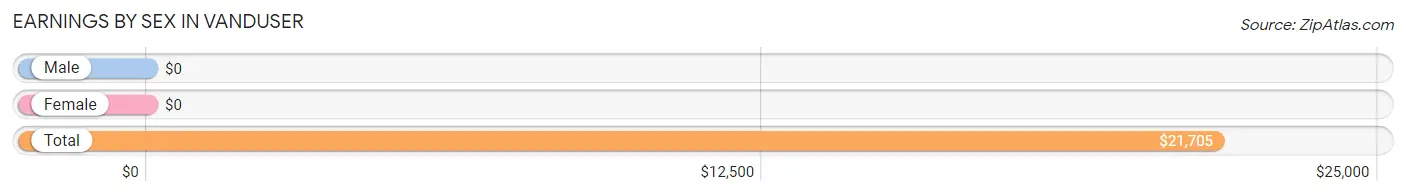
Earnings by Sex in Vanduser
| Sex | Number | Average Earnings |
| Male | 47 (62.7%) | $0 |
| Female | 28 (37.3%) | $0 |
| Total | 75 (100.0%) | $21,705 |
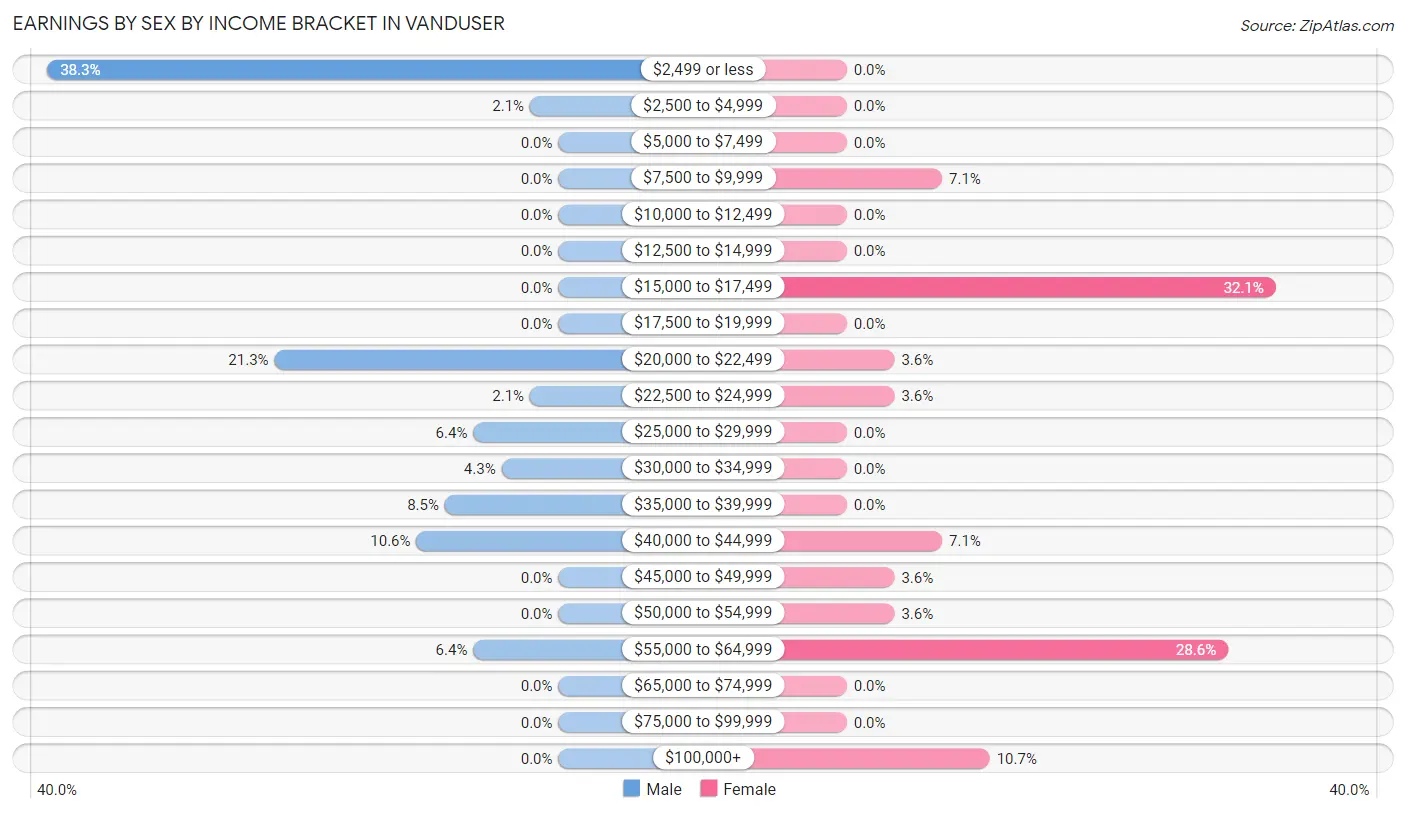
Earnings by Sex by Income Bracket in Vanduser
The most common earnings brackets in Vanduser are $2,499 or less for men (18 | 38.3%) and $15,000 to $17,499 for women (9 | 32.1%).
| Income | Male | Female |
| $2,499 or less | 18 (38.3%) | 0 (0.0%) |
| $2,500 to $4,999 | 1 (2.1%) | 0 (0.0%) |
| $5,000 to $7,499 | 0 (0.0%) | 0 (0.0%) |
| $7,500 to $9,999 | 0 (0.0%) | 2 (7.1%) |
| $10,000 to $12,499 | 0 (0.0%) | 0 (0.0%) |
| $12,500 to $14,999 | 0 (0.0%) | 0 (0.0%) |
| $15,000 to $17,499 | 0 (0.0%) | 9 (32.1%) |
| $17,500 to $19,999 | 0 (0.0%) | 0 (0.0%) |
| $20,000 to $22,499 | 10 (21.3%) | 1 (3.6%) |
| $22,500 to $24,999 | 1 (2.1%) | 1 (3.6%) |
| $25,000 to $29,999 | 3 (6.4%) | 0 (0.0%) |
| $30,000 to $34,999 | 2 (4.3%) | 0 (0.0%) |
| $35,000 to $39,999 | 4 (8.5%) | 0 (0.0%) |
| $40,000 to $44,999 | 5 (10.6%) | 2 (7.1%) |
| $45,000 to $49,999 | 0 (0.0%) | 1 (3.6%) |
| $50,000 to $54,999 | 0 (0.0%) | 1 (3.6%) |
| $55,000 to $64,999 | 3 (6.4%) | 8 (28.6%) |
| $65,000 to $74,999 | 0 (0.0%) | 0 (0.0%) |
| $75,000 to $99,999 | 0 (0.0%) | 0 (0.0%) |
| $100,000+ | 0 (0.0%) | 3 (10.7%) |
| Total | 47 (100.0%) | 28 (100.0%) |
Earnings by Sex by Educational Attainment in Vanduser

| Educational Attainment | Male Income | Female Income |
| Less than High School | - | - |
| High School Diploma | $21,625 | $46,250 |
| College or Associate's Degree | - | - |
| Bachelor's Degree | - | - |
| Graduate Degree | - | - |
| Total | $22,375 | $0 |
Family Income in Vanduser
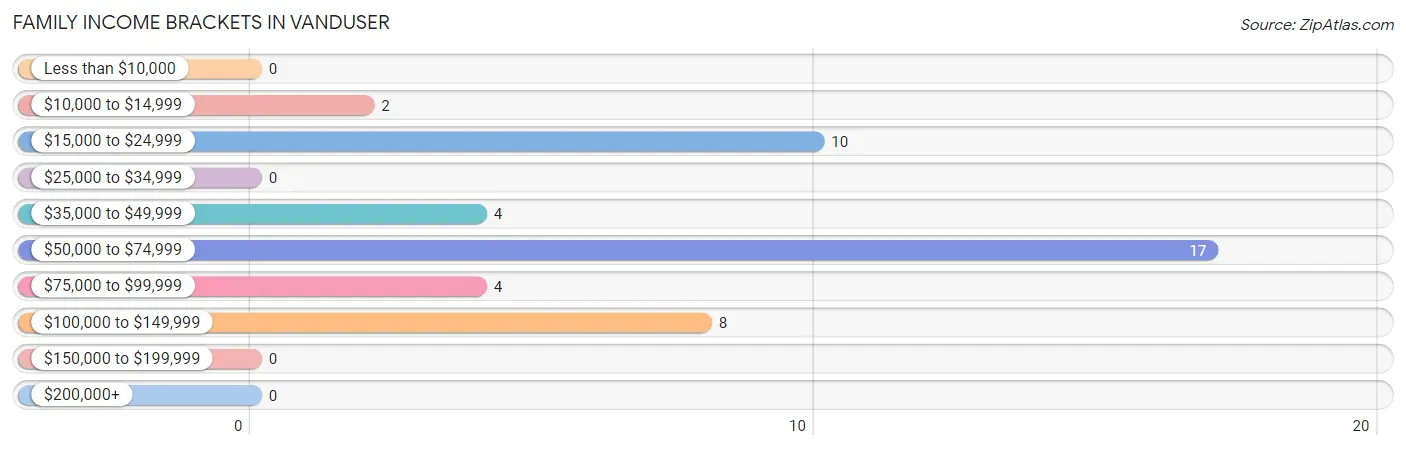
Family Income Brackets in Vanduser
According to the Vanduser family income data, there are 17 families falling into the $50,000 to $74,999 income range, which is the most common income bracket and makes up 37.8% of all families.
| Income Bracket | # Families | % Families |
| Less than $10,000 | 0 | 0.0% |
| $10,000 to $14,999 | 2 | 4.4% |
| $15,000 to $24,999 | 10 | 22.2% |
| $25,000 to $34,999 | 0 | 0.0% |
| $35,000 to $49,999 | 4 | 8.9% |
| $50,000 to $74,999 | 17 | 37.8% |
| $75,000 to $99,999 | 4 | 8.9% |
| $100,000 to $149,999 | 8 | 17.8% |
| $150,000 to $199,999 | 0 | 0.0% |
| $200,000+ | 0 | 0.0% |
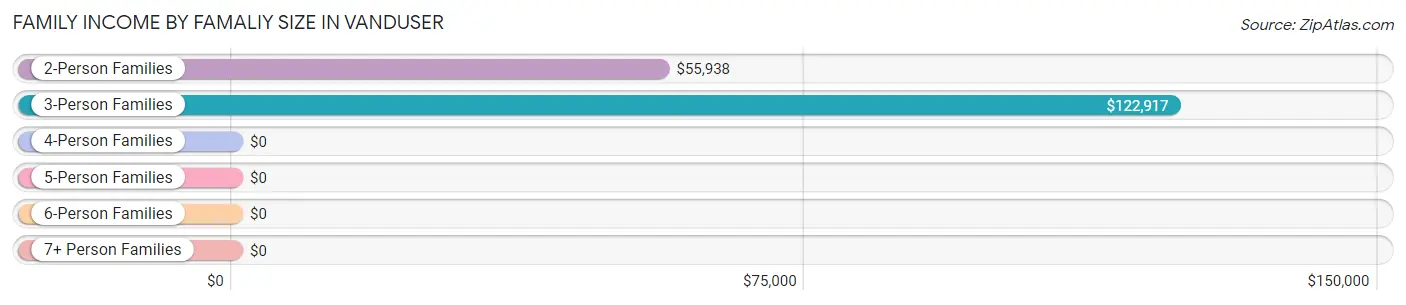
Family Income by Famaliy Size in Vanduser
3-person families (10 | 22.2%) account for the highest median family income in Vanduser with $122,917 per family, while 3-person families (10 | 22.2%) have the highest median income of $40,972 per family member.
| Income Bracket | # Families | Median Income |
| 2-Person Families | 30 (66.7%) | $55,938 |
| 3-Person Families | 10 (22.2%) | $122,917 |
| 4-Person Families | 4 (8.9%) | $0 |
| 5-Person Families | 1 (2.2%) | $0 |
| 6-Person Families | 0 (0.0%) | $0 |
| 7+ Person Families | 0 (0.0%) | $0 |
| Total | 45 (100.0%) | $55,781 |
Family Income by Number of Earners in Vanduser
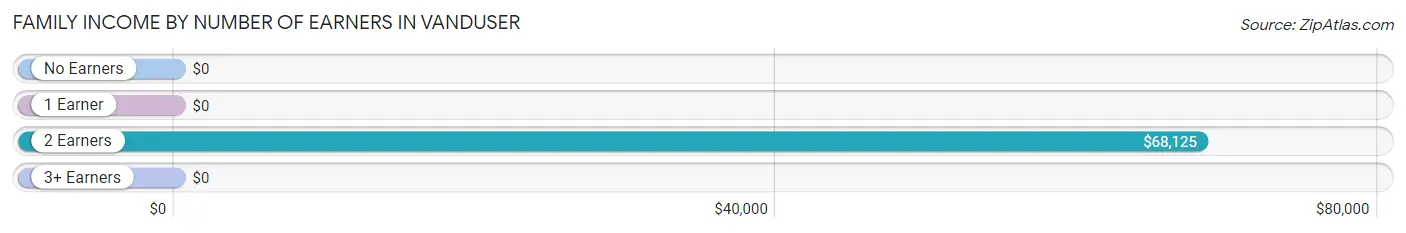
| Number of Earners | # Families | Median Income |
| No Earners | 17 (37.8%) | $0 |
| 1 Earner | 13 (28.9%) | $0 |
| 2 Earners | 9 (20.0%) | $68,125 |
| 3+ Earners | 6 (13.3%) | $0 |
| Total | 45 (100.0%) | $55,781 |
Household Income in Vanduser
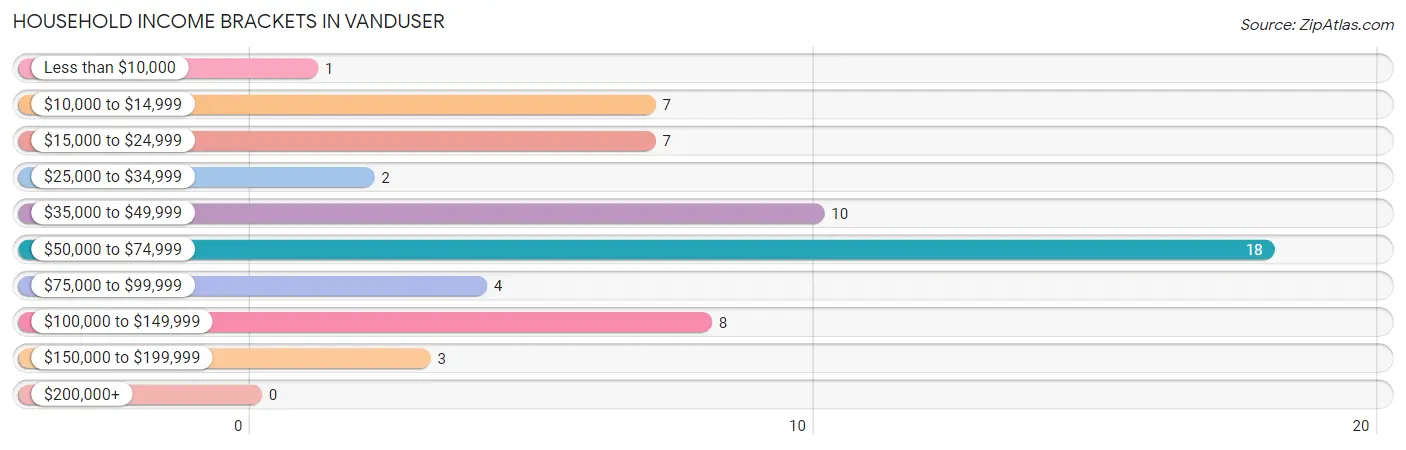
Household Income Brackets in Vanduser
With 18 households falling in the category, the $50,000 to $74,999 income range is the most frequent in Vanduser, accounting for 30.0% of all households.
| Income Bracket | # Households | % Households |
| Less than $10,000 | 1 | 1.7% |
| $10,000 to $14,999 | 7 | 11.7% |
| $15,000 to $24,999 | 7 | 11.7% |
| $25,000 to $34,999 | 2 | 3.3% |
| $35,000 to $49,999 | 10 | 16.7% |
| $50,000 to $74,999 | 18 | 30.0% |
| $75,000 to $99,999 | 4 | 6.7% |
| $100,000 to $149,999 | 8 | 13.3% |
| $150,000 to $199,999 | 3 | 5.0% |
| $200,000+ | 0 | 0.0% |
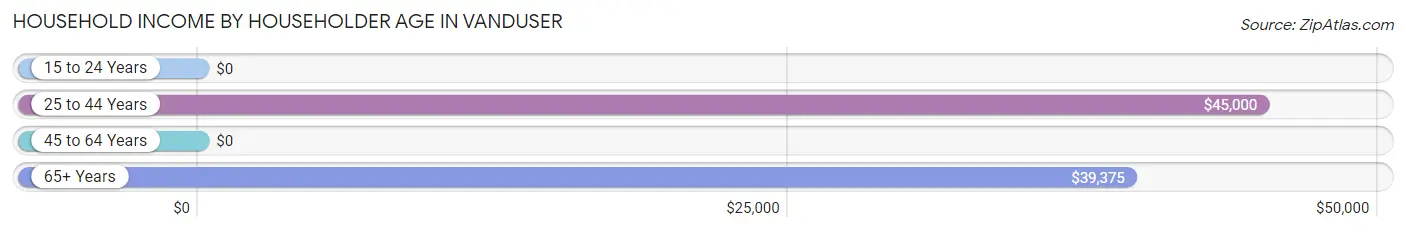
Household Income by Householder Age in Vanduser
The median household income in Vanduser is $54,375, with the highest median household income of $45,000 found in the 25 to 44 years age bracket for the primary householder. A total of 8 households (13.3%) fall into this category.
| Income Bracket | # Households | Median Income |
| 15 to 24 Years | 0 (0.0%) | $0 |
| 25 to 44 Years | 8 (13.3%) | $45,000 |
| 45 to 64 Years | 17 (28.3%) | $0 |
| 65+ Years | 35 (58.3%) | $39,375 |
| Total | 60 (100.0%) | $54,375 |
Poverty in Vanduser
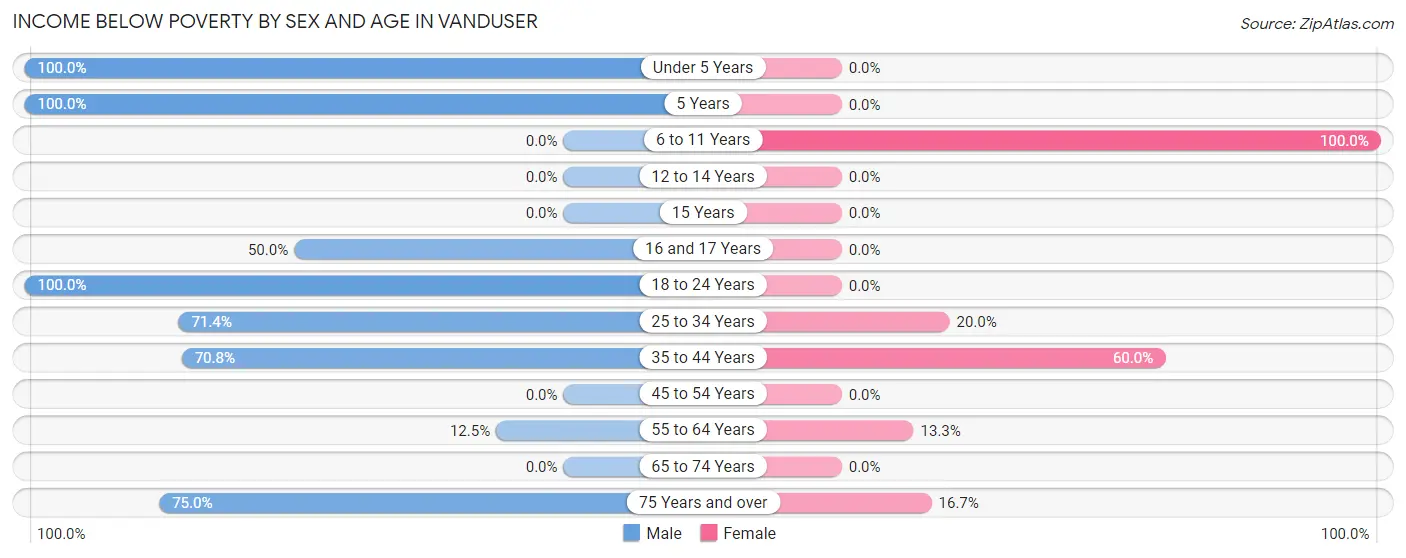
Income Below Poverty by Sex and Age in Vanduser
With 55.9% poverty level for males and 12.1% for females among the residents of Vanduser, under 5 year old males and 6 to 11 year old females are the most vulnerable to poverty, with 1 males (100.0%) and 1 females (100.0%) in their respective age groups living below the poverty level.
| Age Bracket | Male | Female |
| Under 5 Years | 1 (100.0%) | 0 (0.0%) |
| 5 Years | 1 (100.0%) | 0 (0.0%) |
| 6 to 11 Years | 0 (0.0%) | 1 (100.0%) |
| 12 to 14 Years | 0 (0.0%) | 0 (0.0%) |
| 15 Years | 0 (0.0%) | 0 (0.0%) |
| 16 and 17 Years | 4 (50.0%) | 0 (0.0%) |
| 18 to 24 Years | 20 (100.0%) | 0 (0.0%) |
| 25 to 34 Years | 15 (71.4%) | 1 (20.0%) |
| 35 to 44 Years | 17 (70.8%) | 3 (60.0%) |
| 45 to 54 Years | 0 (0.0%) | 0 (0.0%) |
| 55 to 64 Years | 1 (12.5%) | 2 (13.3%) |
| 65 to 74 Years | 0 (0.0%) | 0 (0.0%) |
| 75 Years and over | 3 (75.0%) | 1 (16.7%) |
| Total | 62 (55.9%) | 8 (12.1%) |
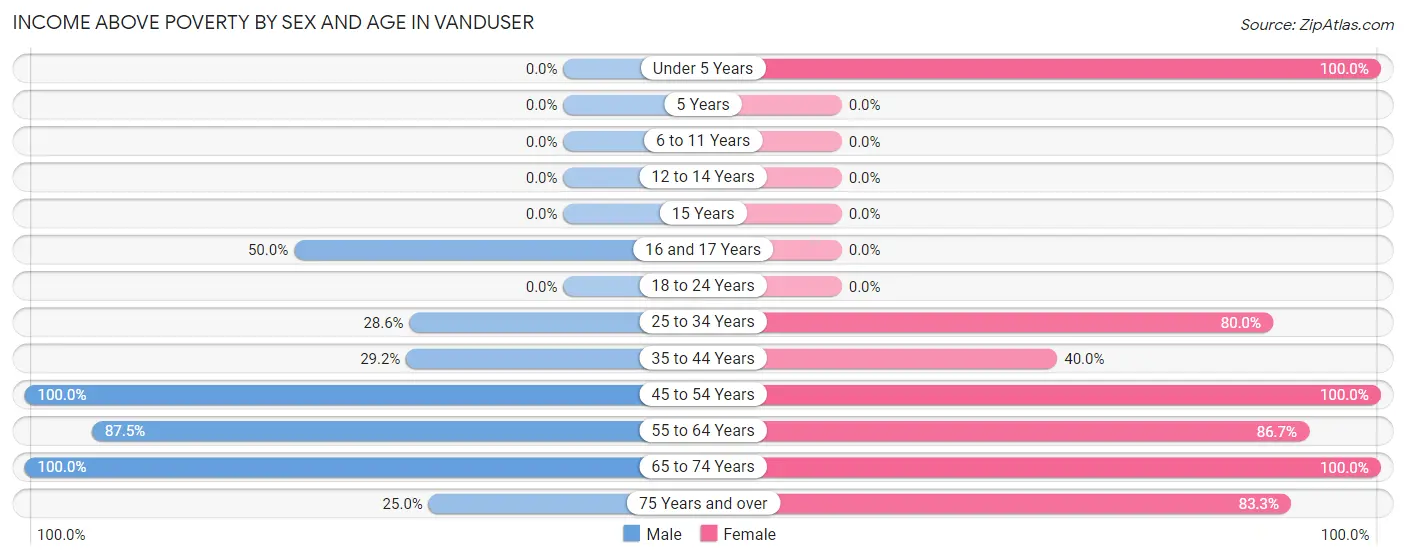
Income Above Poverty by Sex and Age in Vanduser
According to the poverty statistics in Vanduser, males aged 45 to 54 years and females aged under 5 years are the age groups that are most secure financially, with 100.0% of males and 100.0% of females in these age groups living above the poverty line.
| Age Bracket | Male | Female |
| Under 5 Years | 0 (0.0%) | 7 (100.0%) |
| 5 Years | 0 (0.0%) | 0 (0.0%) |
| 6 to 11 Years | 0 (0.0%) | 0 (0.0%) |
| 12 to 14 Years | 0 (0.0%) | 0 (0.0%) |
| 15 Years | 0 (0.0%) | 0 (0.0%) |
| 16 and 17 Years | 4 (50.0%) | 0 (0.0%) |
| 18 to 24 Years | 0 (0.0%) | 0 (0.0%) |
| 25 to 34 Years | 6 (28.6%) | 4 (80.0%) |
| 35 to 44 Years | 7 (29.2%) | 2 (40.0%) |
| 45 to 54 Years | 2 (100.0%) | 4 (100.0%) |
| 55 to 64 Years | 7 (87.5%) | 13 (86.7%) |
| 65 to 74 Years | 22 (100.0%) | 23 (100.0%) |
| 75 Years and over | 1 (25.0%) | 5 (83.3%) |
| Total | 49 (44.1%) | 58 (87.9%) |
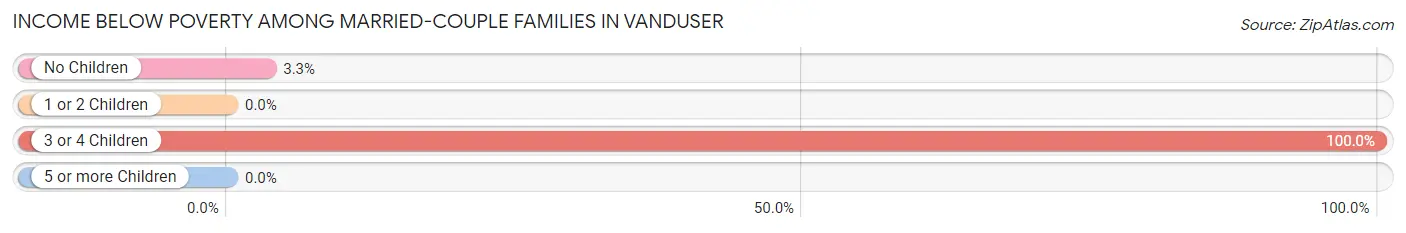
Income Below Poverty Among Married-Couple Families in Vanduser
The poverty statistics for married-couple families in Vanduser show that 5.7% or 2 of the total 35 families live below the poverty line. Families with 3 or 4 children have the highest poverty rate of 100.0%, comprising of 1 families. On the other hand, families with 1 or 2 children have the lowest poverty rate of 0.0%, which includes 0 families.
| Children | Above Poverty | Below Poverty |
| No Children | 29 (96.7%) | 1 (3.3%) |
| 1 or 2 Children | 4 (100.0%) | 0 (0.0%) |
| 3 or 4 Children | 0 (0.0%) | 1 (100.0%) |
| 5 or more Children | 0 (0.0%) | 0 (0.0%) |
| Total | 33 (94.3%) | 2 (5.7%) |
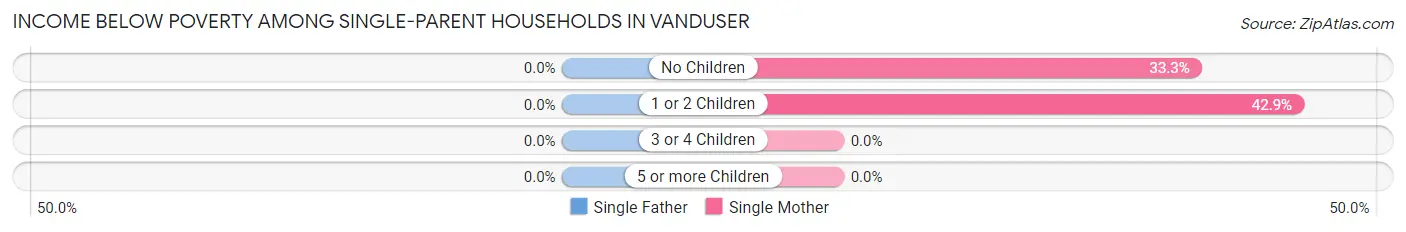
Income Below Poverty Among Single-Parent Households in Vanduser
| Children | Single Father | Single Mother |
| No Children | 0 (0.0%) | 1 (33.3%) |
| 1 or 2 Children | 0 (0.0%) | 3 (42.9%) |
| 3 or 4 Children | 0 (0.0%) | 0 (0.0%) |
| 5 or more Children | 0 (0.0%) | 0 (0.0%) |
| Total | 0 (0.0%) | 4 (40.0%) |
Income Below Poverty Among Married-Couple vs Single-Parent Households in Vanduser
The poverty data for Vanduser shows that 2 of the married-couple family households (5.7%) and 4 of the single-parent households (40.0%) are living below the poverty level. Within the married-couple family households, those with 3 or 4 children have the highest poverty rate, with 1 households (100.0%) falling below the poverty line. Among the single-parent households, those with 1 or 2 children have the highest poverty rate, with 3 household (42.9%) living below poverty.
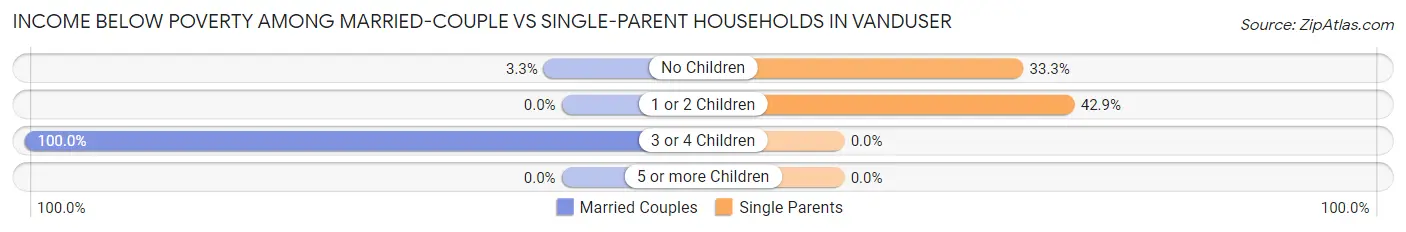
| Children | Married-Couple Families | Single-Parent Households |
| No Children | 1 (3.3%) | 1 (33.3%) |
| 1 or 2 Children | 0 (0.0%) | 3 (42.9%) |
| 3 or 4 Children | 1 (100.0%) | 0 (0.0%) |
| 5 or more Children | 0 (0.0%) | 0 (0.0%) |
| Total | 2 (5.7%) | 4 (40.0%) |
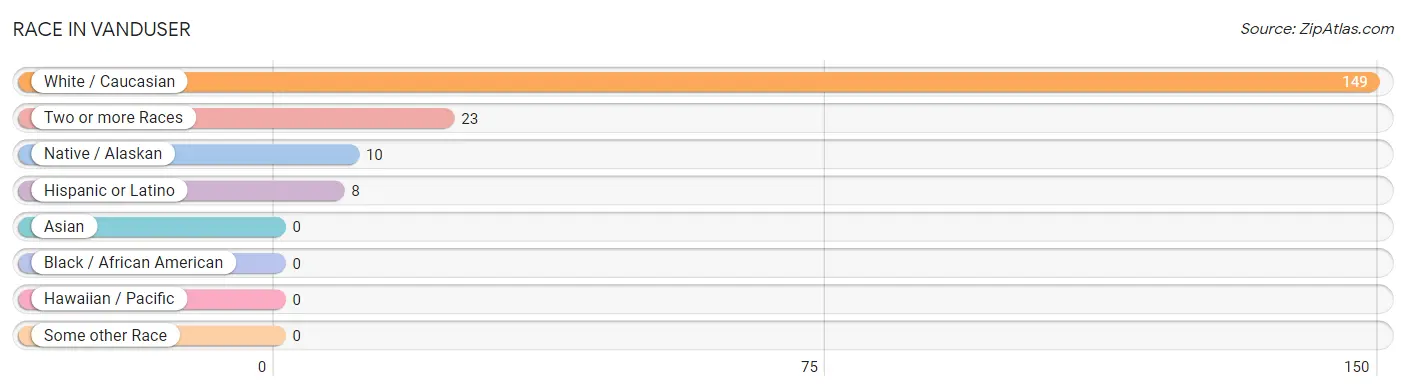
Race in Vanduser
The most populous races in Vanduser are White / Caucasian (149 | 81.9%), Two or more Races (23 | 12.6%), and Native / Alaskan (10 | 5.5%).
| Race | # Population | % Population |
| Asian | 0 | 0.0% |
| Black / African American | 0 | 0.0% |
| Hawaiian / Pacific | 0 | 0.0% |
| Hispanic or Latino | 8 | 4.4% |
| Native / Alaskan | 10 | 5.5% |
| White / Caucasian | 149 | 81.9% |
| Two or more Races | 23 | 12.6% |
| Some other Race | 0 | 0.0% |
| Total | 182 | 100.0% |
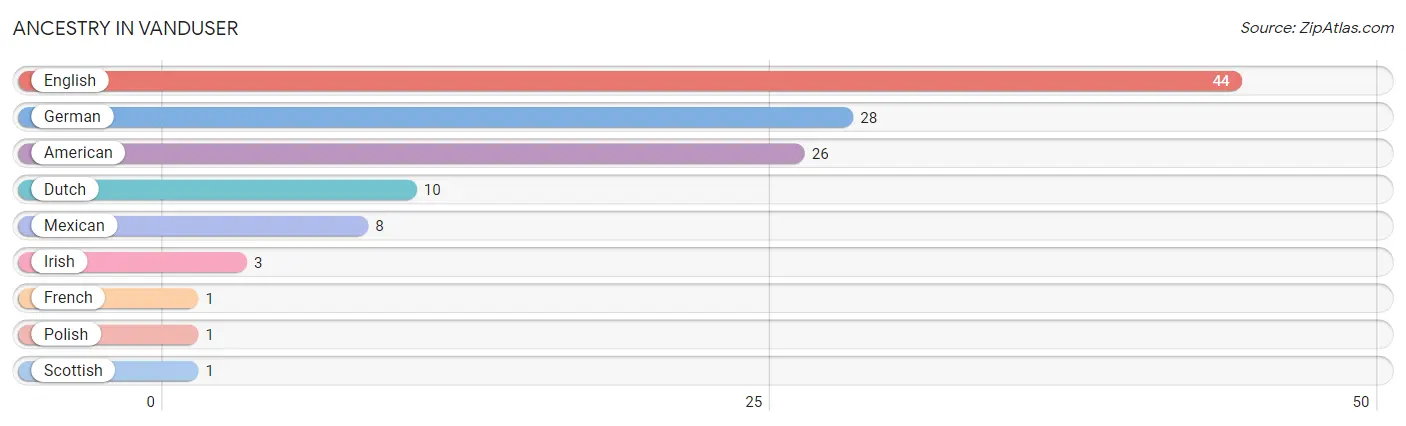
Ancestry in Vanduser
The most populous ancestries reported in Vanduser are English (44 | 24.2%), German (28 | 15.4%), American (26 | 14.3%), Dutch (10 | 5.5%), and Mexican (8 | 4.4%), together accounting for 63.7% of all Vanduser residents.
| Ancestry | # Population | % Population |
| American | 26 | 14.3% |
| Dutch | 10 | 5.5% |
| English | 44 | 24.2% |
| French | 1 | 0.5% |
| German | 28 | 15.4% |
| Irish | 3 | 1.7% |
| Mexican | 8 | 4.4% |
| Polish | 1 | 0.5% |
| Scottish | 1 | 0.5% | View All 9 Rows |
Immigrants in Vanduser

| Immigration Origin | # Population | % Population | View All 0 Rows |
Sex and Age in Vanduser
Sex and Age in Vanduser
The most populous age groups in Vanduser are 35 to 39 Years (24 | 20.7%) for men and 65 to 69 Years (14 | 21.2%) for women.
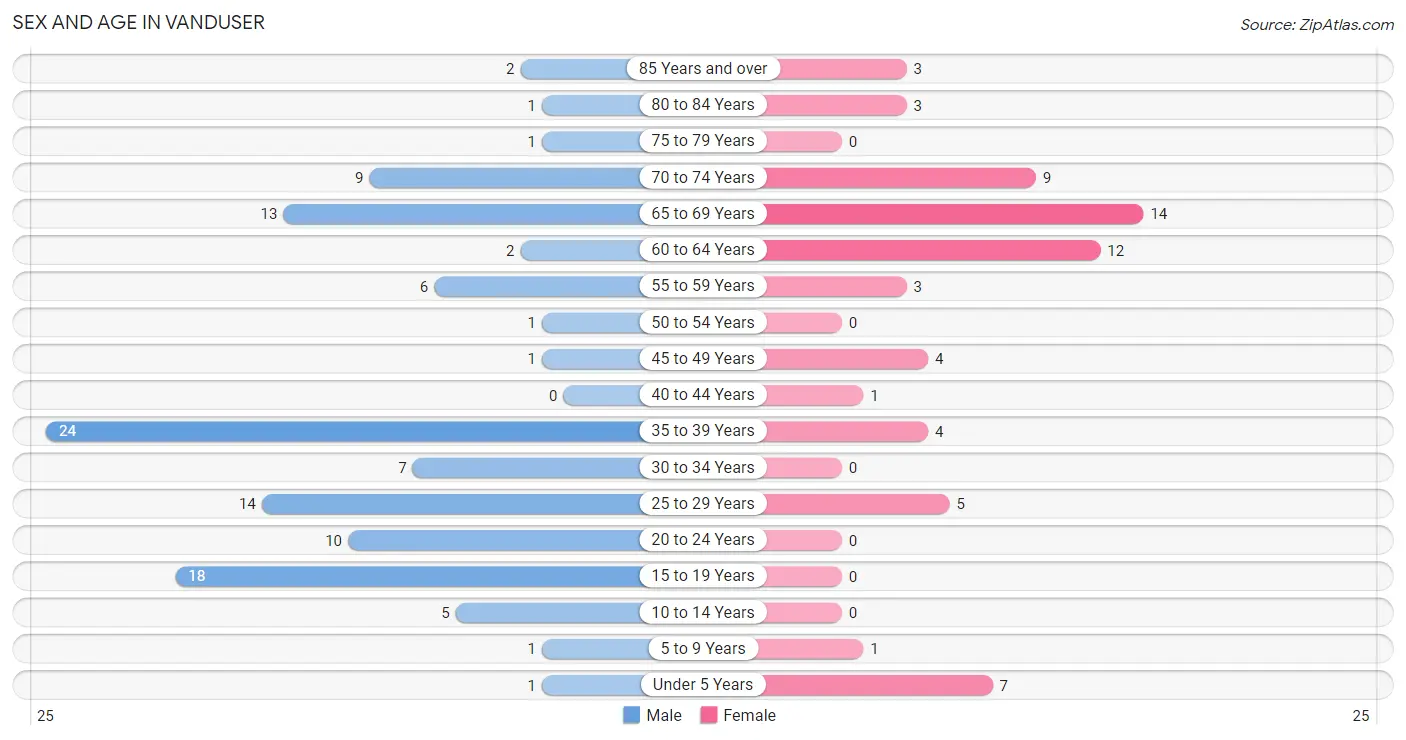
| Age Bracket | Male | Female |
| Under 5 Years | 1 (0.9%) | 7 (10.6%) |
| 5 to 9 Years | 1 (0.9%) | 1 (1.5%) |
| 10 to 14 Years | 5 (4.3%) | 0 (0.0%) |
| 15 to 19 Years | 18 (15.5%) | 0 (0.0%) |
| 20 to 24 Years | 10 (8.6%) | 0 (0.0%) |
| 25 to 29 Years | 14 (12.1%) | 5 (7.6%) |
| 30 to 34 Years | 7 (6.0%) | 0 (0.0%) |
| 35 to 39 Years | 24 (20.7%) | 4 (6.1%) |
| 40 to 44 Years | 0 (0.0%) | 1 (1.5%) |
| 45 to 49 Years | 1 (0.9%) | 4 (6.1%) |
| 50 to 54 Years | 1 (0.9%) | 0 (0.0%) |
| 55 to 59 Years | 6 (5.2%) | 3 (4.5%) |
| 60 to 64 Years | 2 (1.7%) | 12 (18.2%) |
| 65 to 69 Years | 13 (11.2%) | 14 (21.2%) |
| 70 to 74 Years | 9 (7.8%) | 9 (13.6%) |
| 75 to 79 Years | 1 (0.9%) | 0 (0.0%) |
| 80 to 84 Years | 1 (0.9%) | 3 (4.5%) |
| 85 Years and over | 2 (1.7%) | 3 (4.5%) |
| Total | 116 (100.0%) | 66 (100.0%) |
Families and Households in Vanduser
Median Family Size in Vanduser
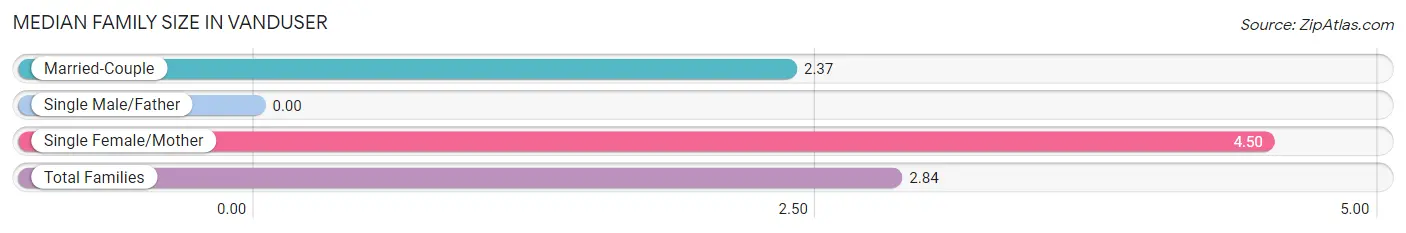
| Family Type | # Families | Family Size |
| Married-Couple | 35 (77.8%) | 2.37 |
| Single Male/Father | 0 (0.0%) | - |
| Single Female/Mother | 10 (22.2%) | 4.50 |
| Total Families | 45 (100.0%) | 2.84 |
Median Household Size in Vanduser
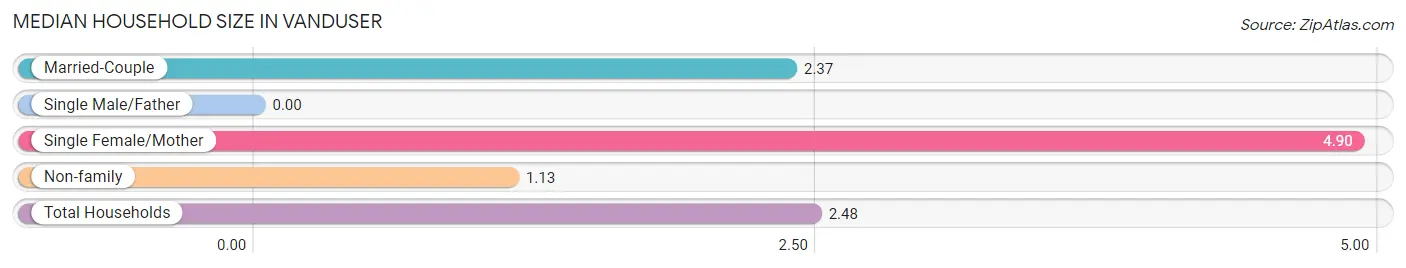
| Household Type | # Households | Household Size |
| Married-Couple | 35 (58.3%) | 2.37 |
| Single Male/Father | 0 (0.0%) | - |
| Single Female/Mother | 10 (16.7%) | 4.90 |
| Non-family | 15 (25.0%) | 1.13 |
| Total Households | 60 (100.0%) | 2.48 |
Household Size by Marriage Status in Vanduser
Out of a total of 60 households in Vanduser, 45 (75.0%) are family households, while 15 (25.0%) are nonfamily households. The most numerous type of family households are 2-person households, comprising 27, and the most common type of nonfamily households are 1-person households, comprising 13.
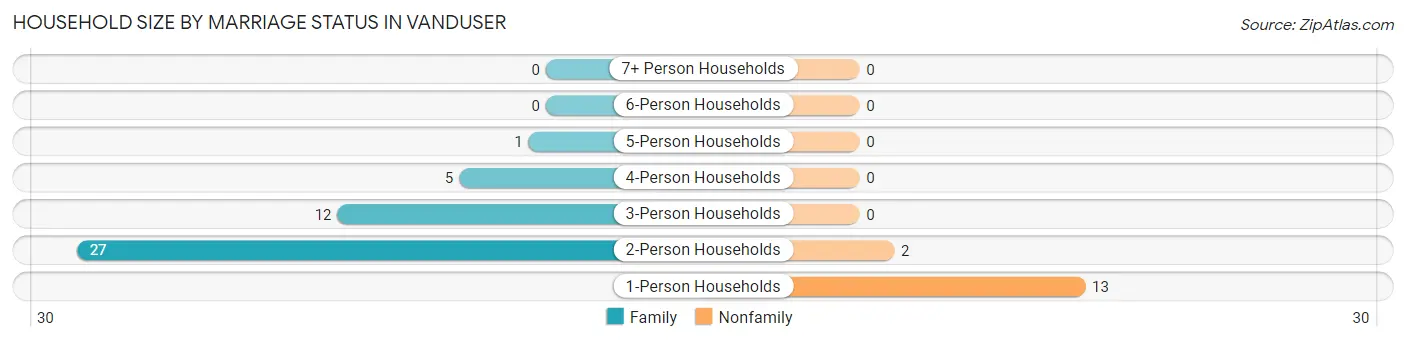
| Household Size | Family Households | Nonfamily Households |
| 1-Person Households | - | 13 (21.7%) |
| 2-Person Households | 27 (45.0%) | 2 (3.3%) |
| 3-Person Households | 12 (20.0%) | 0 (0.0%) |
| 4-Person Households | 5 (8.3%) | 0 (0.0%) |
| 5-Person Households | 1 (1.7%) | 0 (0.0%) |
| 6-Person Households | 0 (0.0%) | 0 (0.0%) |
| 7+ Person Households | 0 (0.0%) | 0 (0.0%) |
| Total | 45 (75.0%) | 15 (25.0%) |
Female Fertility in Vanduser
Fertility by Age in Vanduser
Average fertility rate in Vanduser is 286.0 births per 1,000 women. Women in the age bracket of 20 to 34 years have the highest fertility rate with 800.0 births per 1,000 women. Women in the age bracket of 20 to 34 years acount for 100.0% of all women with births.
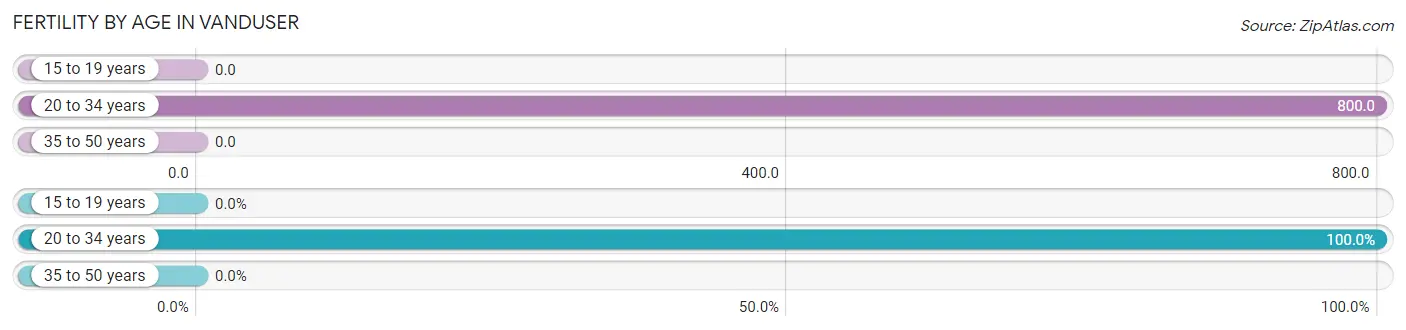
| Age Bracket | Women with Births | Births / 1,000 Women |
| 15 to 19 years | 0 (0.0%) | 0.0 |
| 20 to 34 years | 4 (100.0%) | 800.0 |
| 35 to 50 years | 0 (0.0%) | 0.0 |
| Total | 4 (100.0%) | 286.0 |
Fertility by Age by Marriage Status in Vanduser
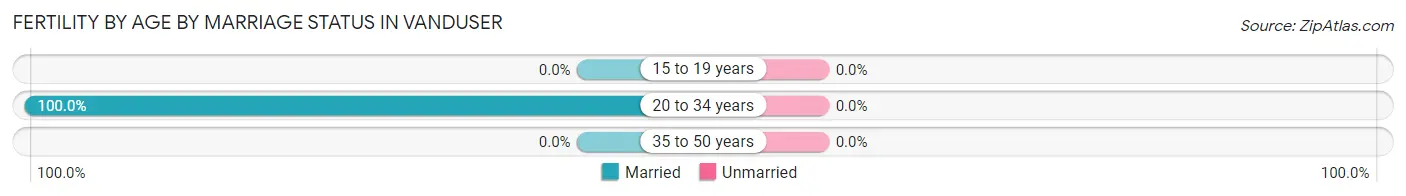
| Age Bracket | Married | Unmarried |
| 15 to 19 years | 0 (0.0%) | 0 (0.0%) |
| 20 to 34 years | 4 (100.0%) | 0 (0.0%) |
| 35 to 50 years | 0 (0.0%) | 0 (0.0%) |
| Total | 4 (100.0%) | 0 (0.0%) |
Fertility by Education in Vanduser
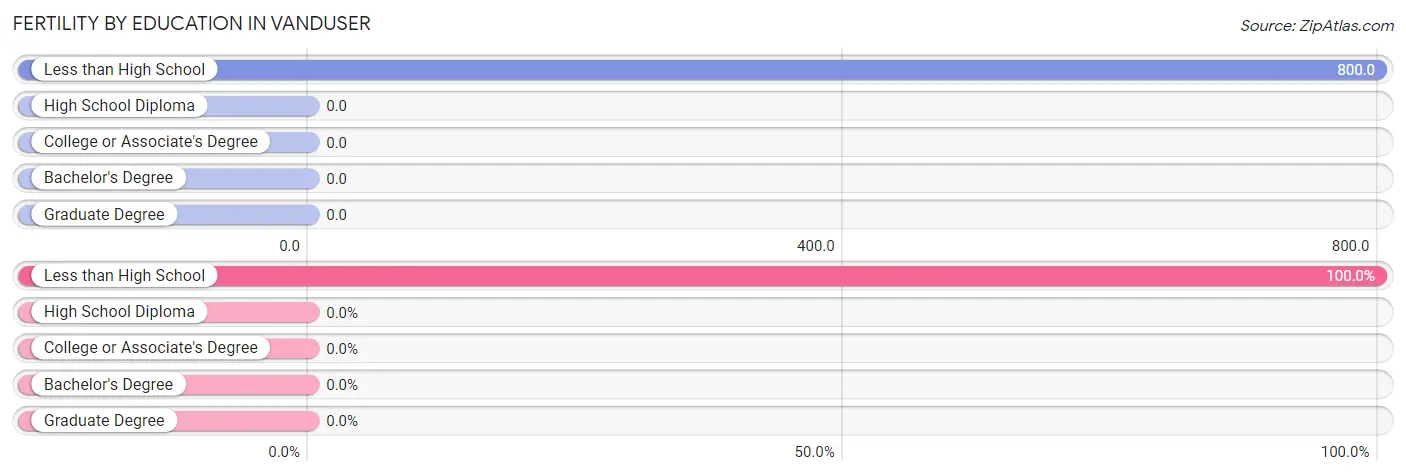
| Educational Attainment | Women with Births | Births / 1,000 Women |
| Less than High School | 4 (100.0%) | 800.0 |
| High School Diploma | 0 (0.0%) | 0.0 |
| College or Associate's Degree | 0 (0.0%) | 0.0 |
| Bachelor's Degree | 0 (0.0%) | 0.0 |
| Graduate Degree | 0 (0.0%) | 0.0 |
| Total | 4 (100.0%) | 286.0 |
Fertility by Education by Marriage Status in Vanduser
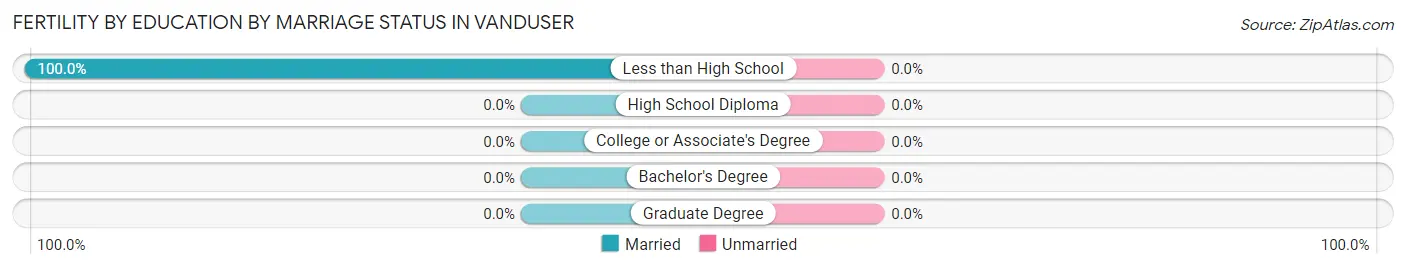
| Educational Attainment | Married | Unmarried |
| Less than High School | 4 (100.0%) | 0 (0.0%) |
| High School Diploma | 0 (0.0%) | 0 (0.0%) |
| College or Associate's Degree | 0 (0.0%) | 0 (0.0%) |
| Bachelor's Degree | 0 (0.0%) | 0 (0.0%) |
| Graduate Degree | 0 (0.0%) | 0 (0.0%) |
| Total | 4 (100.0%) | 0 (0.0%) |
Employment Characteristics in Vanduser
Employment by Class of Employer in Vanduser
Among the 64 employed individuals in Vanduser, private company employees (49 | 76.6%), not-for-profit organizations (12 | 18.8%), and local government employees (2 | 3.1%) make up the most common classes of employment.
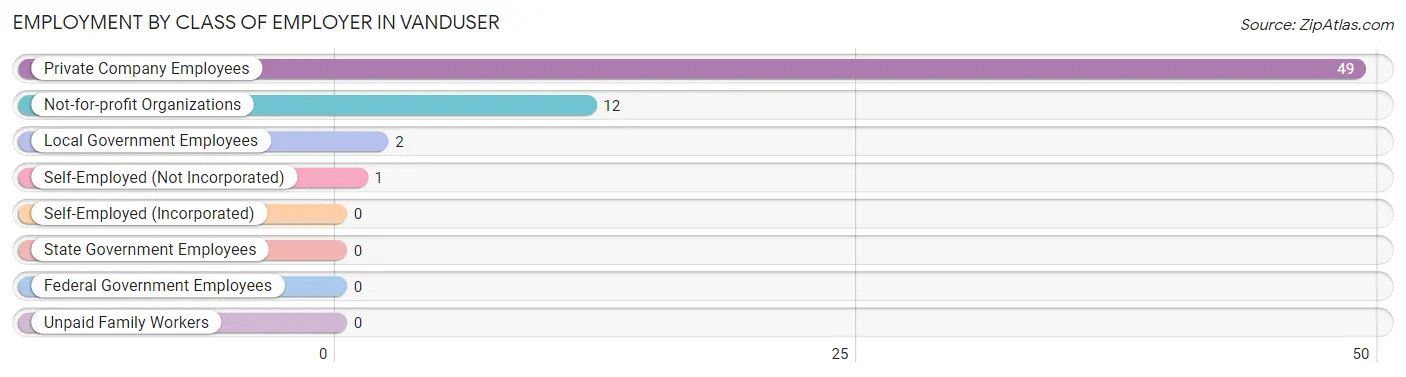
| Employer Class | # Employees | % Employees |
| Private Company Employees | 49 | 76.6% |
| Self-Employed (Incorporated) | 0 | 0.0% |
| Self-Employed (Not Incorporated) | 1 | 1.6% |
| Not-for-profit Organizations | 12 | 18.8% |
| Local Government Employees | 2 | 3.1% |
| State Government Employees | 0 | 0.0% |
| Federal Government Employees | 0 | 0.0% |
| Unpaid Family Workers | 0 | 0.0% |
| Total | 64 | 100.0% |
Employment Status by Age in Vanduser
According to the labor force statistics for Vanduser, out of the total population over 16 years of age (167), 43.7% or 73 individuals are in the labor force, with 12.3% or 9 of them unemployed. The age group with the highest labor force participation rate is 20 to 24 years, with 100.0% or 10 individuals in the labor force. Within the labor force, the 25 to 29 years age range has the highest percentage of unemployed individuals, with 66.7% or 8 of them being unemployed.
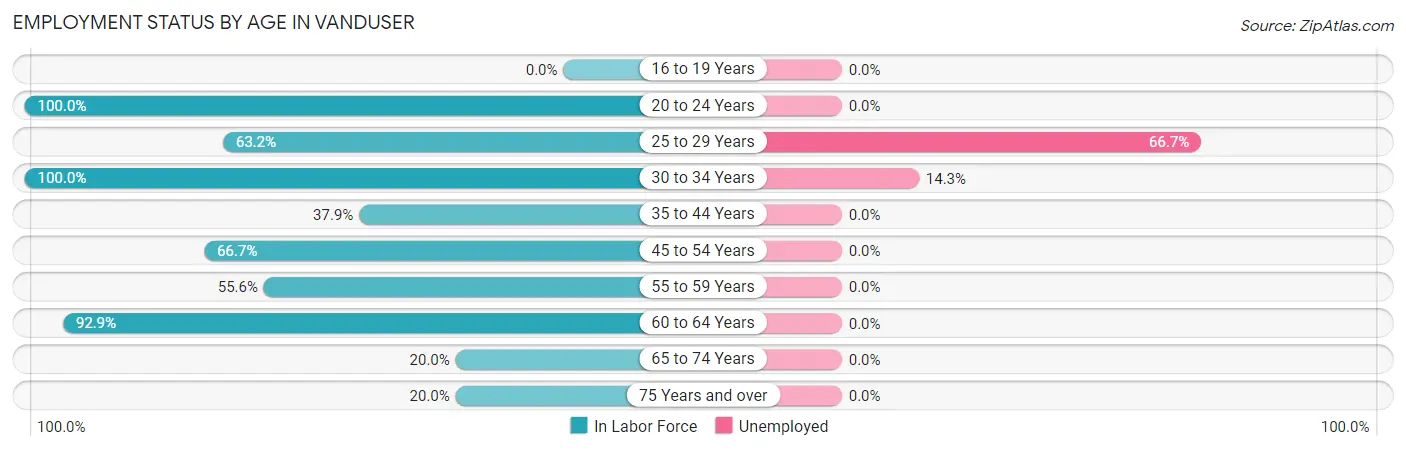
| Age Bracket | In Labor Force | Unemployed |
| 16 to 19 Years | 0 (0.0%) | 0 (0.0%) |
| 20 to 24 Years | 10 (100.0%) | 0 (0.0%) |
| 25 to 29 Years | 12 (63.2%) | 8 (66.7%) |
| 30 to 34 Years | 7 (100.0%) | 1 (14.3%) |
| 35 to 44 Years | 11 (37.9%) | 0 (0.0%) |
| 45 to 54 Years | 4 (66.7%) | 0 (0.0%) |
| 55 to 59 Years | 5 (55.6%) | 0 (0.0%) |
| 60 to 64 Years | 13 (92.9%) | 0 (0.0%) |
| 65 to 74 Years | 9 (20.0%) | 0 (0.0%) |
| 75 Years and over | 2 (20.0%) | 0 (0.0%) |
| Total | 73 (43.7%) | 9 (12.3%) |
Employment Status by Educational Attainment in Vanduser
According to labor force statistics for Vanduser, 61.9% of individuals (52) out of the total population between 25 and 64 years of age (84) are in the labor force, with 17.3% or 9 of them being unemployed. The group with the highest labor force participation rate are those with the educational attainment of college / associate degree, with 100.0% or 5 individuals in the labor force. Within the labor force, individuals with high school diploma education have the highest percentage of unemployment, with 23.7% or 9 of them being unemployed.
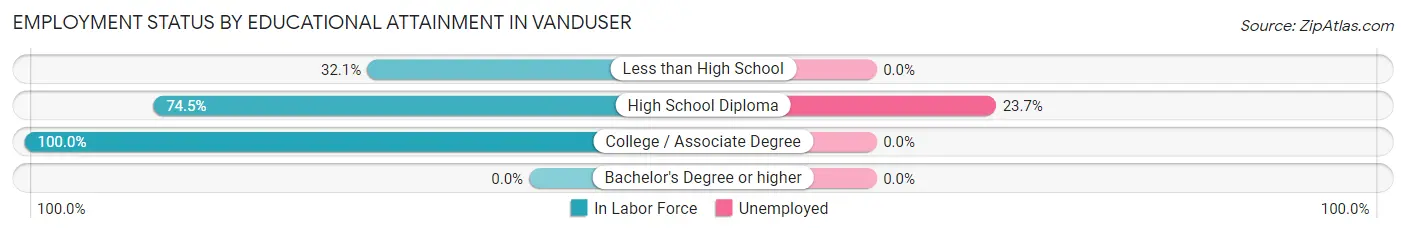
| Educational Attainment | In Labor Force | Unemployed |
| Less than High School | 9 (32.1%) | 0 (0.0%) |
| High School Diploma | 38 (74.5%) | 12 (23.7%) |
| College / Associate Degree | 5 (100.0%) | 0 (0.0%) |
| Bachelor's Degree or higher | 0 (0.0%) | 0 (0.0%) |
| Total | 52 (61.9%) | 15 (17.3%) |
Employment Occupations by Sex in Vanduser
Management, Business, Science and Arts Occupations
The most common Management, Business, Science and Arts occupations in Vanduser are Health Diagnosing & Treating (5 | 7.8%), and Health Technologists (5 | 7.8%).
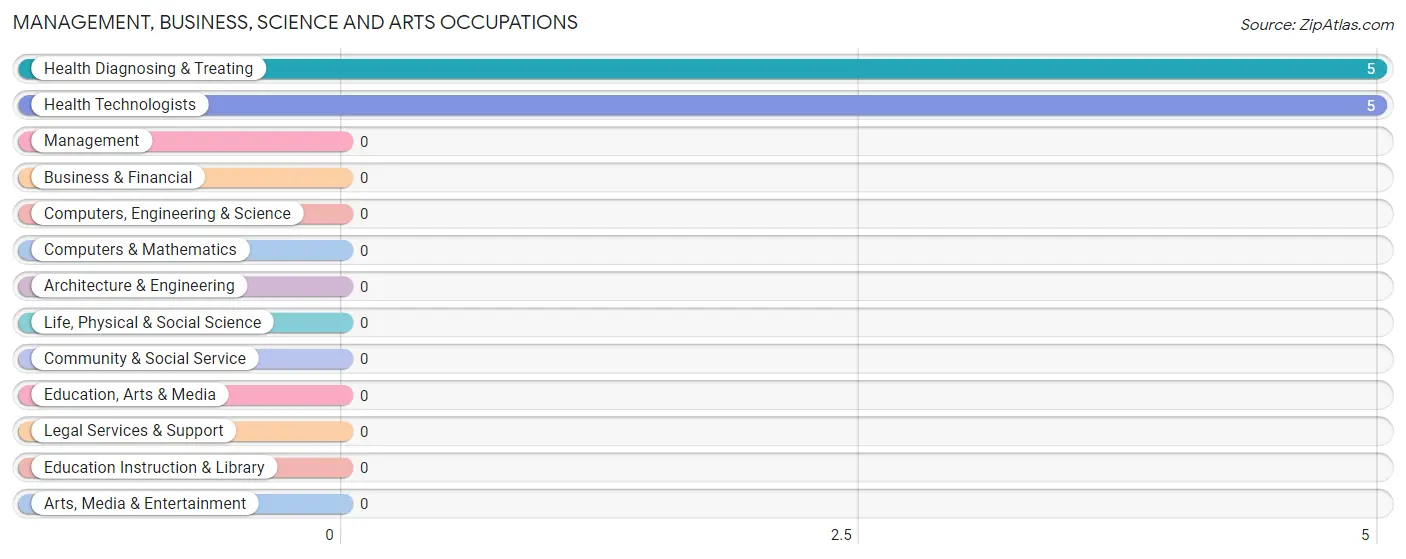
Management, Business, Science and Arts Occupations by Sex
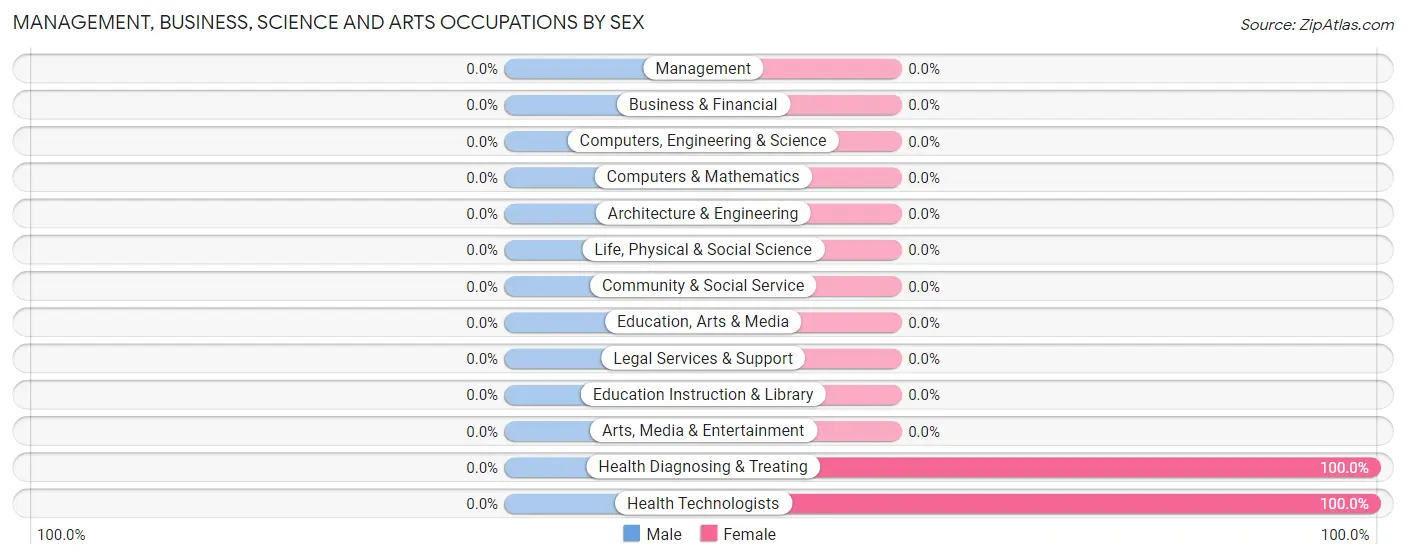
| Occupation | Male | Female |
| Management | 0 (0.0%) | 0 (0.0%) |
| Business & Financial | 0 (0.0%) | 0 (0.0%) |
| Computers, Engineering & Science | 0 (0.0%) | 0 (0.0%) |
| Computers & Mathematics | 0 (0.0%) | 0 (0.0%) |
| Architecture & Engineering | 0 (0.0%) | 0 (0.0%) |
| Life, Physical & Social Science | 0 (0.0%) | 0 (0.0%) |
| Community & Social Service | 0 (0.0%) | 0 (0.0%) |
| Education, Arts & Media | 0 (0.0%) | 0 (0.0%) |
| Legal Services & Support | 0 (0.0%) | 0 (0.0%) |
| Education Instruction & Library | 0 (0.0%) | 0 (0.0%) |
| Arts, Media & Entertainment | 0 (0.0%) | 0 (0.0%) |
| Health Diagnosing & Treating | 0 (0.0%) | 5 (100.0%) |
| Health Technologists | 0 (0.0%) | 5 (100.0%) |
| Total (Category) | 0 (0.0%) | 5 (100.0%) |
| Total (Overall) | 38 (59.4%) | 26 (40.6%) |
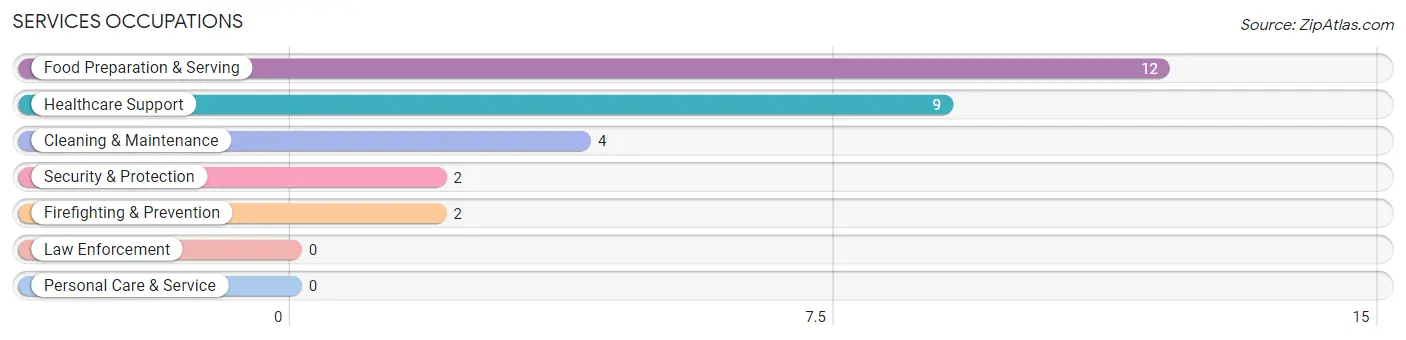
Services Occupations
The most common Services occupations in Vanduser are Food Preparation & Serving (12 | 18.8%), Healthcare Support (9 | 14.1%), Cleaning & Maintenance (4 | 6.2%), Security & Protection (2 | 3.1%), and Firefighting & Prevention (2 | 3.1%).
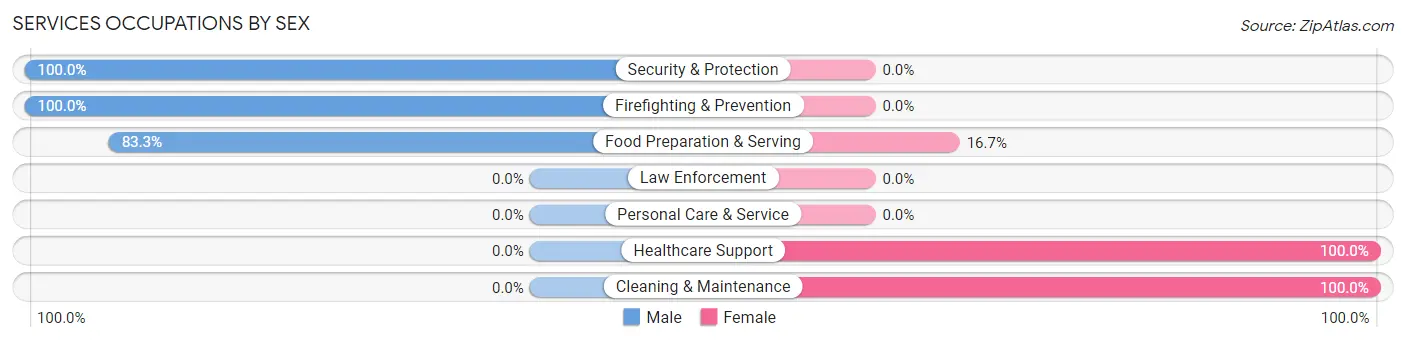
Services Occupations by Sex
Within the Services occupations in Vanduser, the most male-oriented occupations are Security & Protection (100.0%), Firefighting & Prevention (100.0%), and Food Preparation & Serving (83.3%), while the most female-oriented occupations are Healthcare Support (100.0%), Cleaning & Maintenance (100.0%), and Food Preparation & Serving (16.7%).
| Occupation | Male | Female |
| Healthcare Support | 0 (0.0%) | 9 (100.0%) |
| Security & Protection | 2 (100.0%) | 0 (0.0%) |
| Firefighting & Prevention | 2 (100.0%) | 0 (0.0%) |
| Law Enforcement | 0 (0.0%) | 0 (0.0%) |
| Food Preparation & Serving | 10 (83.3%) | 2 (16.7%) |
| Cleaning & Maintenance | 0 (0.0%) | 4 (100.0%) |
| Personal Care & Service | 0 (0.0%) | 0 (0.0%) |
| Total (Category) | 12 (44.4%) | 15 (55.6%) |
| Total (Overall) | 38 (59.4%) | 26 (40.6%) |
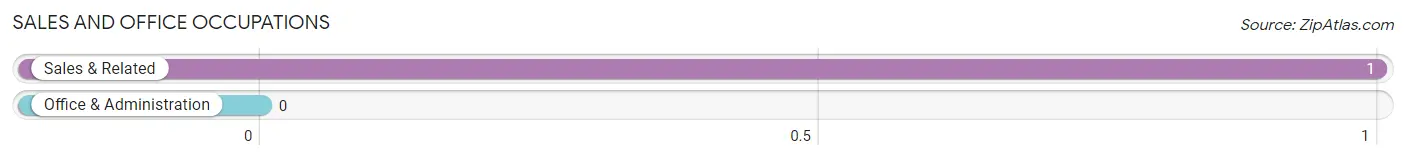
Sales and Office Occupations
The most common Sales and Office occupations in Vanduser are , and Sales & Related (1 | 1.6%).
Sales and Office Occupations by Sex
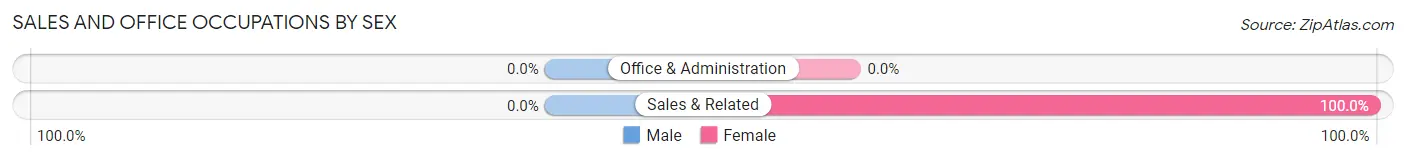
| Occupation | Male | Female |
| Sales & Related | 0 (0.0%) | 1 (100.0%) |
| Office & Administration | 0 (0.0%) | 0 (0.0%) |
| Total (Category) | 0 (0.0%) | 1 (100.0%) |
| Total (Overall) | 38 (59.4%) | 26 (40.6%) |
Natural Resources, Construction and Maintenance Occupations
The most common Natural Resources, Construction and Maintenance occupations in Vanduser are Farming, Fishing & Forestry (6 | 9.4%), Construction & Extraction (4 | 6.2%), and Installation, Maintenance & Repair (1 | 1.6%).
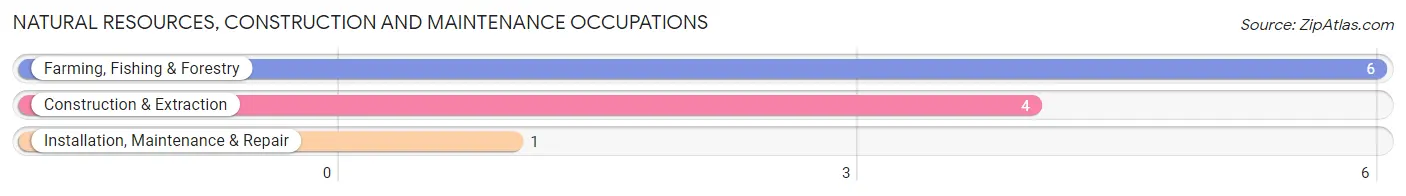
Natural Resources, Construction and Maintenance Occupations by Sex
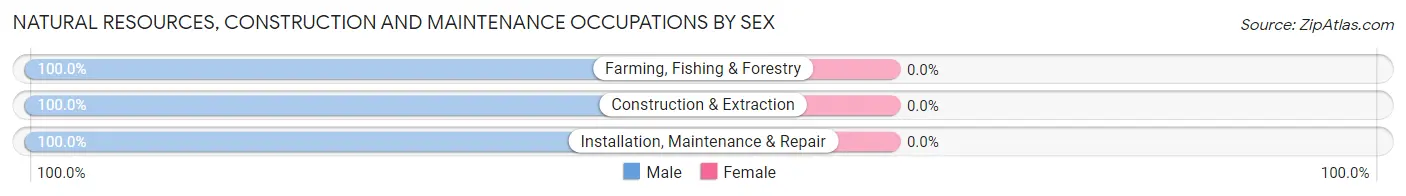
| Occupation | Male | Female |
| Farming, Fishing & Forestry | 6 (100.0%) | 0 (0.0%) |
| Construction & Extraction | 4 (100.0%) | 0 (0.0%) |
| Installation, Maintenance & Repair | 1 (100.0%) | 0 (0.0%) |
| Total (Category) | 11 (100.0%) | 0 (0.0%) |
| Total (Overall) | 38 (59.4%) | 26 (40.6%) |
Production, Transportation and Moving Occupations
The most common Production, Transportation and Moving occupations in Vanduser are Material Moving (10 | 15.6%), Production (5 | 7.8%), and Transportation (5 | 7.8%).
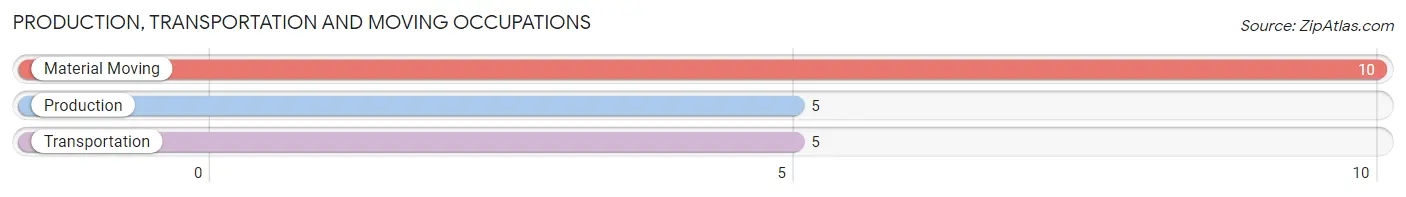
Production, Transportation and Moving Occupations by Sex
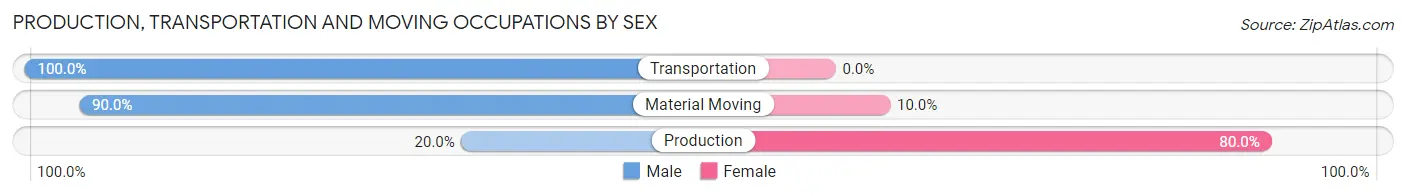
| Occupation | Male | Female |
| Production | 1 (20.0%) | 4 (80.0%) |
| Transportation | 5 (100.0%) | 0 (0.0%) |
| Material Moving | 9 (90.0%) | 1 (10.0%) |
| Total (Category) | 15 (75.0%) | 5 (25.0%) |
| Total (Overall) | 38 (59.4%) | 26 (40.6%) |
Employment Industries by Sex in Vanduser
Employment Industries in Vanduser
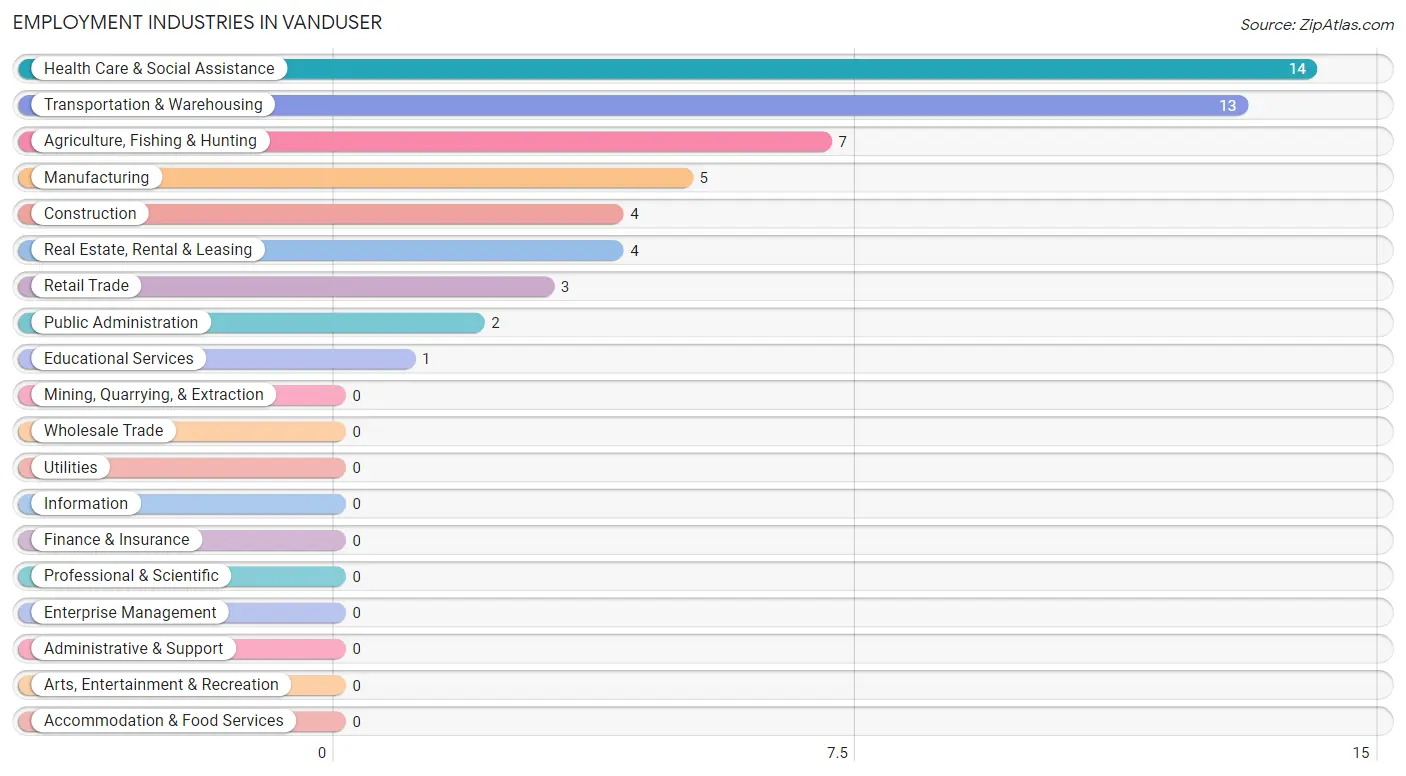
The major employment industries in Vanduser include Health Care & Social Assistance (14 | 21.9%), Transportation & Warehousing (13 | 20.3%), Agriculture, Fishing & Hunting (7 | 10.9%), Manufacturing (5 | 7.8%), and Construction (4 | 6.2%).
Employment Industries by Sex in Vanduser
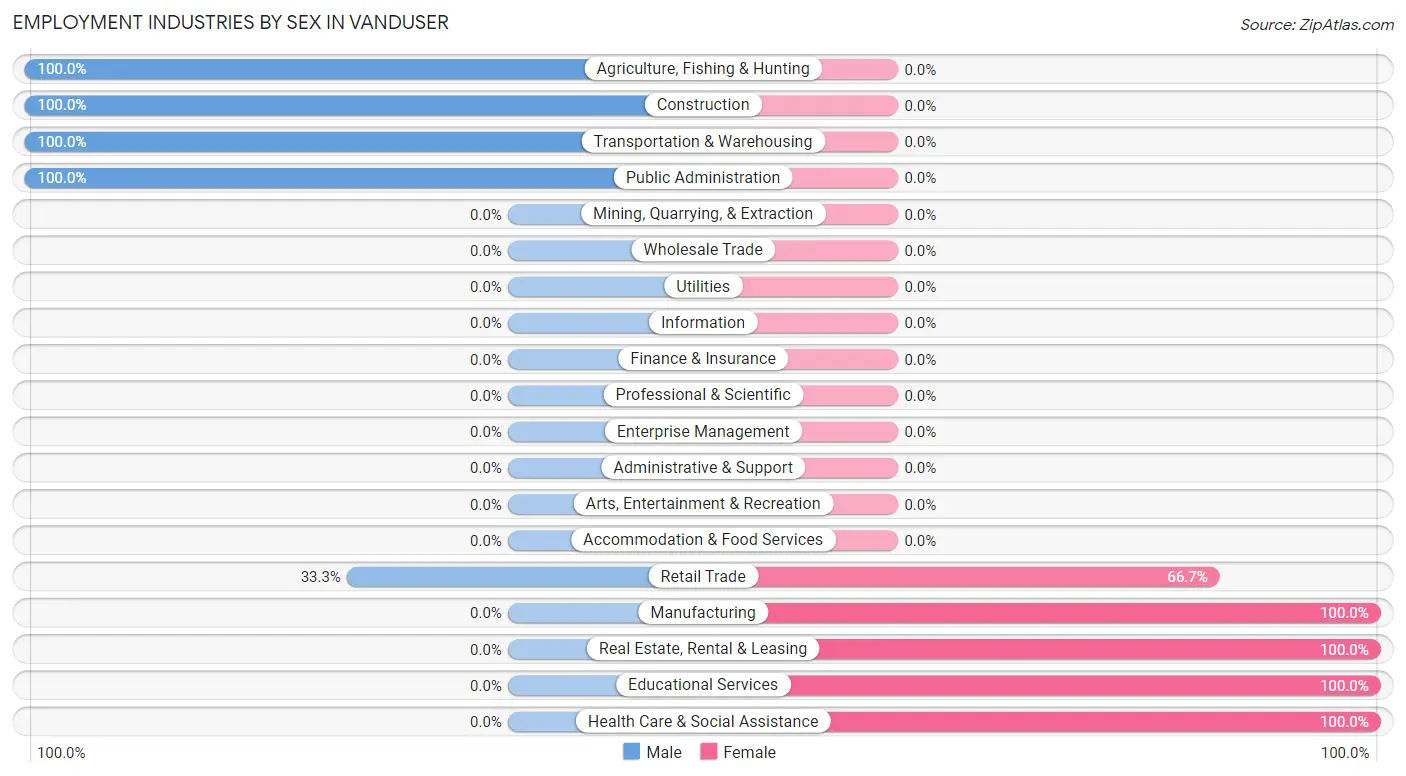
The Vanduser industries that see more men than women are Agriculture, Fishing & Hunting (100.0%), Construction (100.0%), and Transportation & Warehousing (100.0%), whereas the industries that tend to have a higher number of women are Manufacturing (100.0%), Real Estate, Rental & Leasing (100.0%), and Educational Services (100.0%).
| Industry | Male | Female |
| Agriculture, Fishing & Hunting | 7 (100.0%) | 0 (0.0%) |
| Mining, Quarrying, & Extraction | 0 (0.0%) | 0 (0.0%) |
| Construction | 4 (100.0%) | 0 (0.0%) |
| Manufacturing | 0 (0.0%) | 5 (100.0%) |
| Wholesale Trade | 0 (0.0%) | 0 (0.0%) |
| Retail Trade | 1 (33.3%) | 2 (66.7%) |
| Transportation & Warehousing | 13 (100.0%) | 0 (0.0%) |
| Utilities | 0 (0.0%) | 0 (0.0%) |
| Information | 0 (0.0%) | 0 (0.0%) |
| Finance & Insurance | 0 (0.0%) | 0 (0.0%) |
| Real Estate, Rental & Leasing | 0 (0.0%) | 4 (100.0%) |
| Professional & Scientific | 0 (0.0%) | 0 (0.0%) |
| Enterprise Management | 0 (0.0%) | 0 (0.0%) |
| Administrative & Support | 0 (0.0%) | 0 (0.0%) |
| Educational Services | 0 (0.0%) | 1 (100.0%) |
| Health Care & Social Assistance | 0 (0.0%) | 14 (100.0%) |
| Arts, Entertainment & Recreation | 0 (0.0%) | 0 (0.0%) |
| Accommodation & Food Services | 0 (0.0%) | 0 (0.0%) |
| Public Administration | 2 (100.0%) | 0 (0.0%) |
| Total | 38 (59.4%) | 26 (40.6%) |
Education in Vanduser
School Enrollment in Vanduser
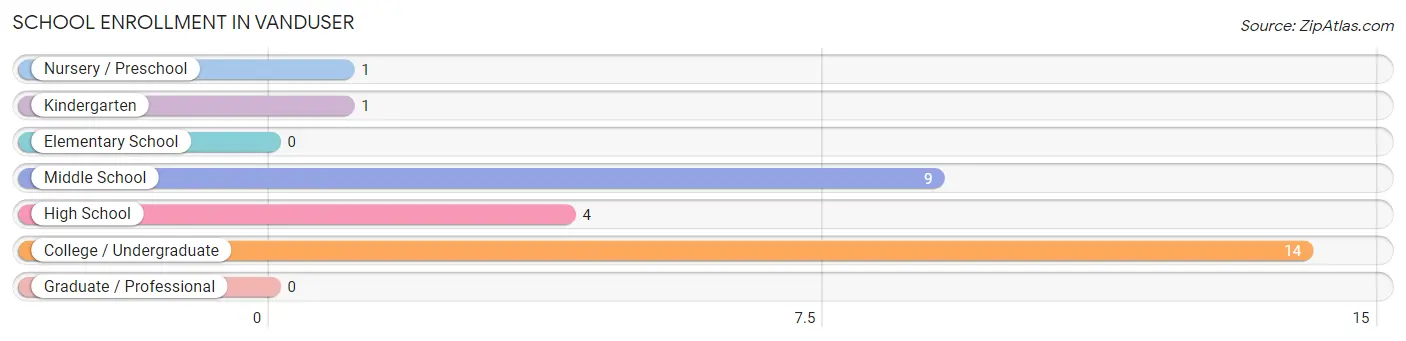
The most common levels of schooling among the 29 students in Vanduser are college / undergraduate (14 | 48.3%), middle school (9 | 31.0%), and high school (4 | 13.8%).
| School Level | # Students | % Students |
| Nursery / Preschool | 1 | 3.5% |
| Kindergarten | 1 | 3.5% |
| Elementary School | 0 | 0.0% |
| Middle School | 9 | 31.0% |
| High School | 4 | 13.8% |
| College / Undergraduate | 14 | 48.3% |
| Graduate / Professional | 0 | 0.0% |
| Total | 29 | 100.0% |
School Enrollment by Age by Funding Source in Vanduser
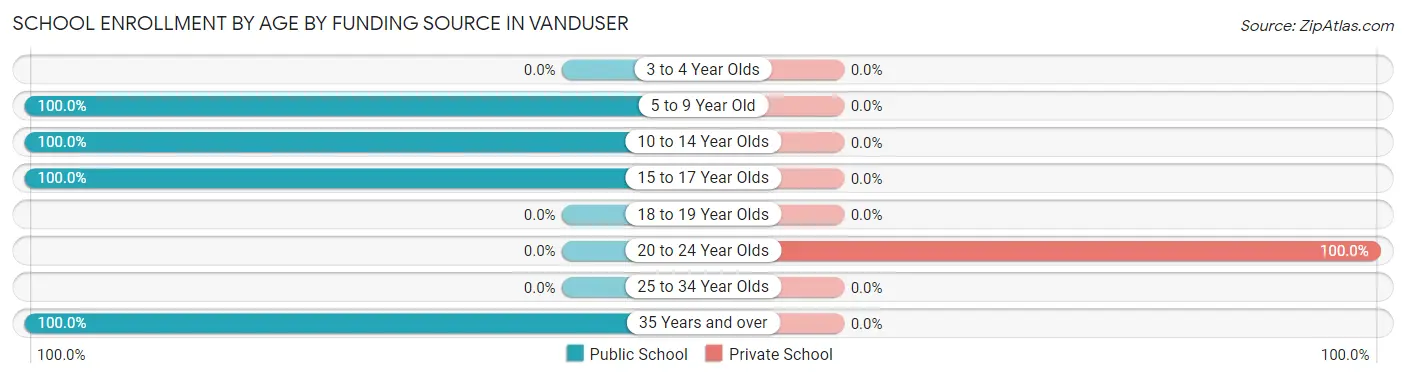
Out of a total of 29 students who are enrolled in schools in Vanduser, 10 (34.5%) attend a private institution, while the remaining 19 (65.5%) are enrolled in public schools. The age group of 20 to 24 year olds has the highest likelihood of being enrolled in private schools, with 10 (100.0% in the age bracket) enrolled. Conversely, the age group of 5 to 9 year old has the lowest likelihood of being enrolled in a private school, with 2 (100.0% in the age bracket) attending a public institution.
| Age Bracket | Public School | Private School |
| 3 to 4 Year Olds | 0 (0.0%) | 0 (0.0%) |
| 5 to 9 Year Old | 2 (100.0%) | 0 (0.0%) |
| 10 to 14 Year Olds | 5 (100.0%) | 0 (0.0%) |
| 15 to 17 Year Olds | 8 (100.0%) | 0 (0.0%) |
| 18 to 19 Year Olds | 0 (0.0%) | 0 (0.0%) |
| 20 to 24 Year Olds | 0 (0.0%) | 10 (100.0%) |
| 25 to 34 Year Olds | 0 (0.0%) | 0 (0.0%) |
| 35 Years and over | 4 (100.0%) | 0 (0.0%) |
| Total | 19 (65.5%) | 10 (34.5%) |
Educational Attainment by Field of Study in Vanduser
Education (4 | 57.1%), and physical & health sciences (3 | 42.9%) are the most common fields of study among 7 individuals in Vanduser who have obtained a bachelor's degree or higher.
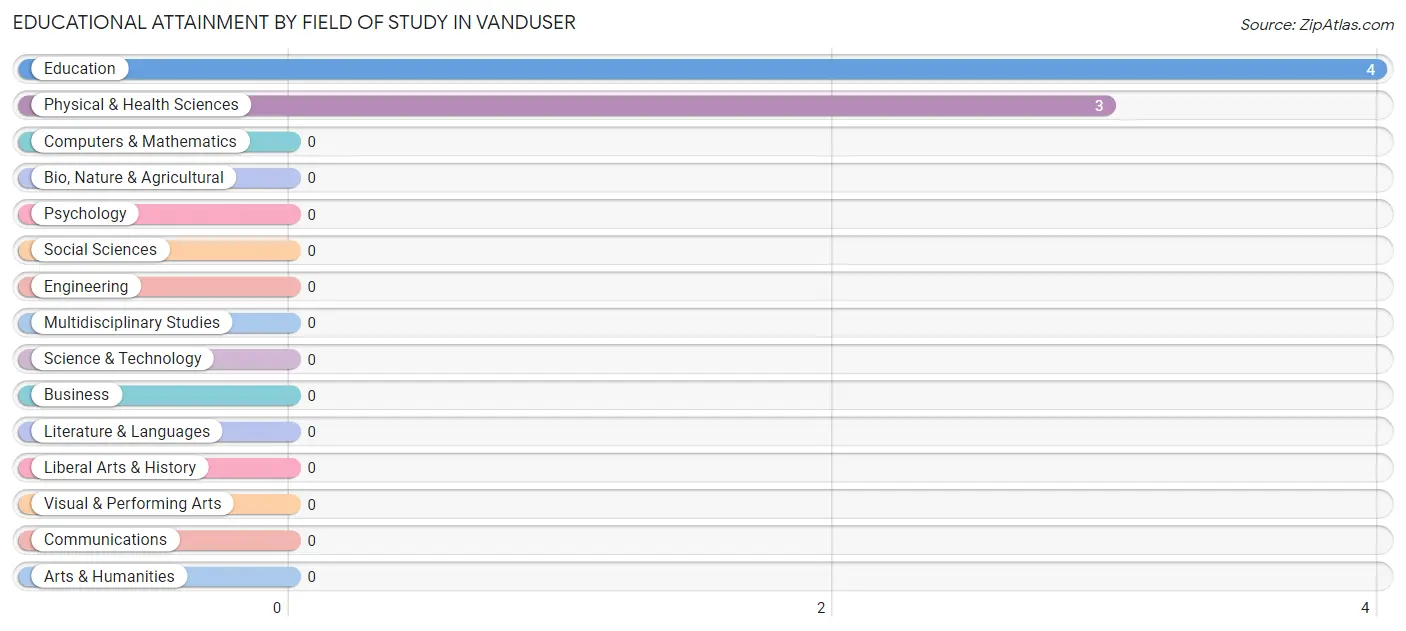
| Field of Study | # Graduates | % Graduates |
| Computers & Mathematics | 0 | 0.0% |
| Bio, Nature & Agricultural | 0 | 0.0% |
| Physical & Health Sciences | 3 | 42.9% |
| Psychology | 0 | 0.0% |
| Social Sciences | 0 | 0.0% |
| Engineering | 0 | 0.0% |
| Multidisciplinary Studies | 0 | 0.0% |
| Science & Technology | 0 | 0.0% |
| Business | 0 | 0.0% |
| Education | 4 | 57.1% |
| Literature & Languages | 0 | 0.0% |
| Liberal Arts & History | 0 | 0.0% |
| Visual & Performing Arts | 0 | 0.0% |
| Communications | 0 | 0.0% |
| Arts & Humanities | 0 | 0.0% |
| Total | 7 | 100.0% |
Transportation & Commute in Vanduser
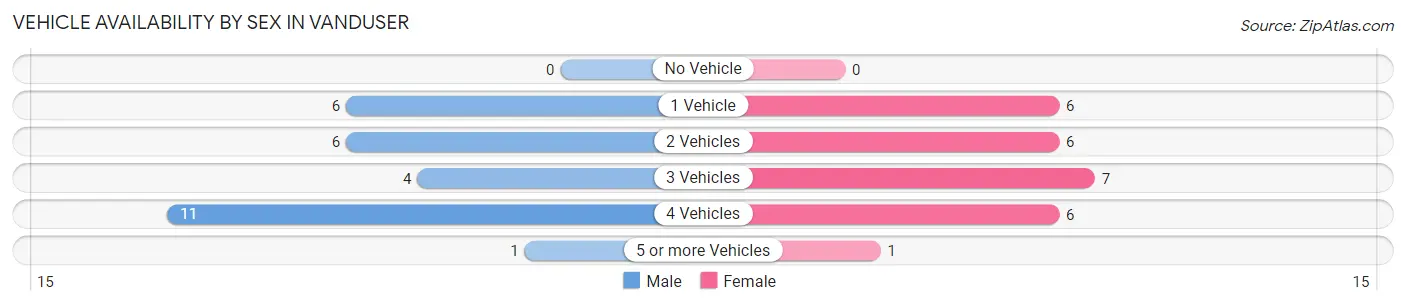
Vehicle Availability by Sex in Vanduser
The most prevalent vehicle ownership categories in Vanduser are males with 4 vehicles (11, accounting for 39.3%) and females with 4 vehicles (6, making up 42.3%).
| Vehicles Available | Male | Female |
| No Vehicle | 0 (0.0%) | 0 (0.0%) |
| 1 Vehicle | 6 (21.4%) | 6 (23.1%) |
| 2 Vehicles | 6 (21.4%) | 6 (23.1%) |
| 3 Vehicles | 4 (14.3%) | 7 (26.9%) |
| 4 Vehicles | 11 (39.3%) | 6 (23.1%) |
| 5 or more Vehicles | 1 (3.6%) | 1 (3.8%) |
| Total | 28 (100.0%) | 26 (100.0%) |
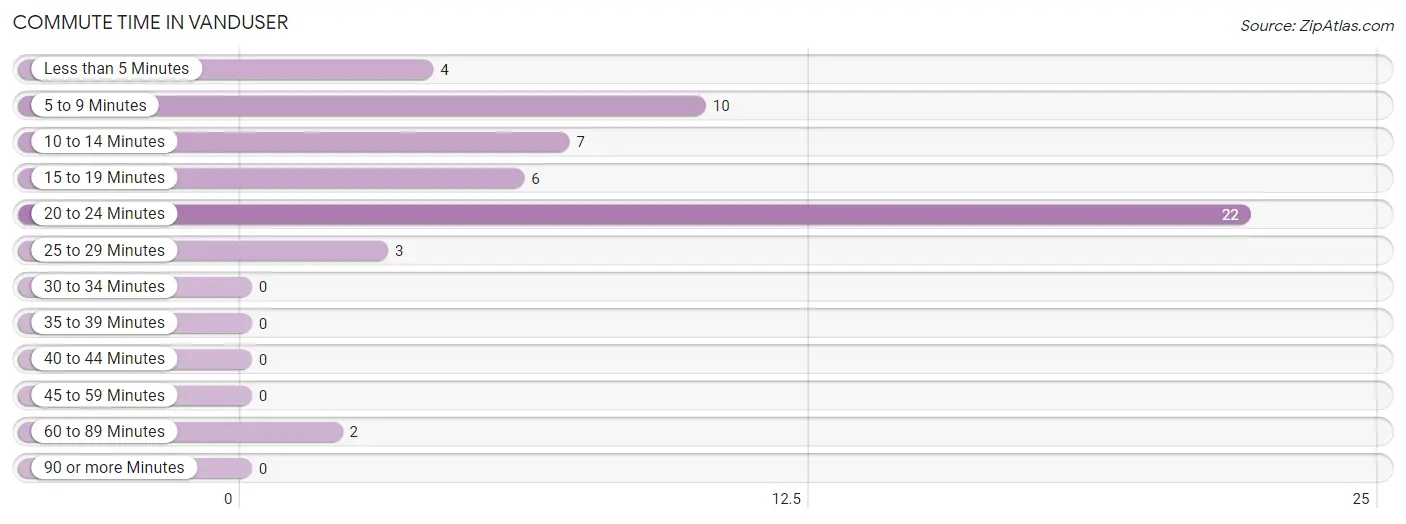
Commute Time in Vanduser
The most frequently occuring commute durations in Vanduser are 20 to 24 minutes (22 commuters, 40.7%), 5 to 9 minutes (10 commuters, 18.5%), and 10 to 14 minutes (7 commuters, 13.0%).
| Commute Time | # Commuters | % Commuters |
| Less than 5 Minutes | 4 | 7.4% |
| 5 to 9 Minutes | 10 | 18.5% |
| 10 to 14 Minutes | 7 | 13.0% |
| 15 to 19 Minutes | 6 | 11.1% |
| 20 to 24 Minutes | 22 | 40.7% |
| 25 to 29 Minutes | 3 | 5.6% |
| 30 to 34 Minutes | 0 | 0.0% |
| 35 to 39 Minutes | 0 | 0.0% |
| 40 to 44 Minutes | 0 | 0.0% |
| 45 to 59 Minutes | 0 | 0.0% |
| 60 to 89 Minutes | 2 | 3.7% |
| 90 or more Minutes | 0 | 0.0% |
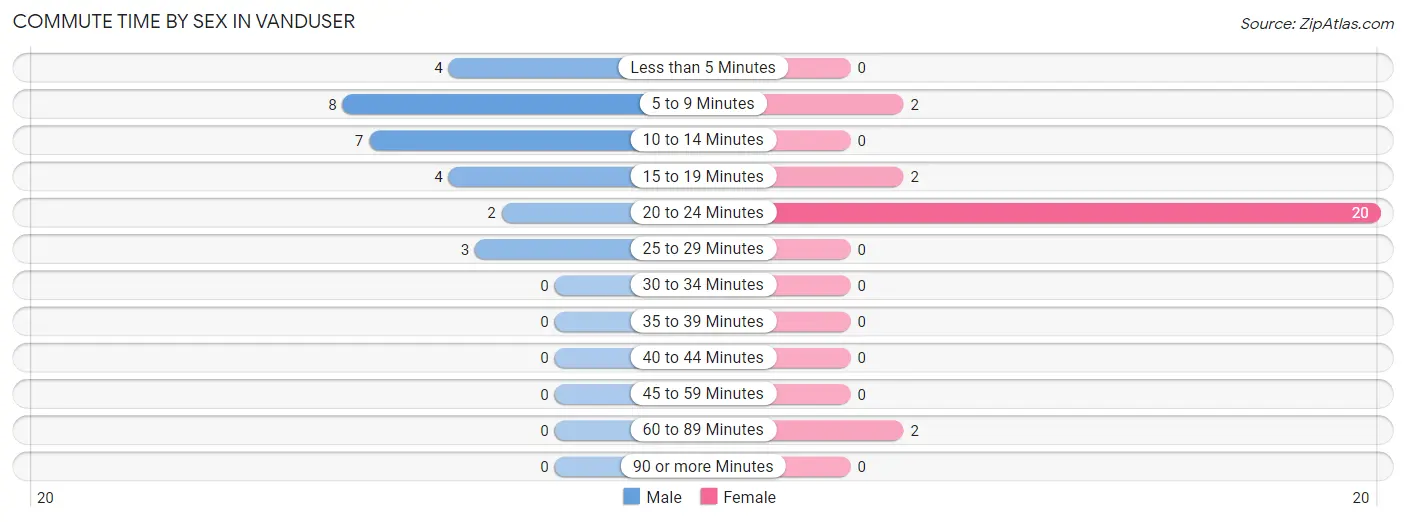
Commute Time by Sex in Vanduser
The most common commute times in Vanduser are 5 to 9 minutes (8 commuters, 28.6%) for males and 20 to 24 minutes (20 commuters, 76.9%) for females.
| Commute Time | Male | Female |
| Less than 5 Minutes | 4 (14.3%) | 0 (0.0%) |
| 5 to 9 Minutes | 8 (28.6%) | 2 (7.7%) |
| 10 to 14 Minutes | 7 (25.0%) | 0 (0.0%) |
| 15 to 19 Minutes | 4 (14.3%) | 2 (7.7%) |
| 20 to 24 Minutes | 2 (7.1%) | 20 (76.9%) |
| 25 to 29 Minutes | 3 (10.7%) | 0 (0.0%) |
| 30 to 34 Minutes | 0 (0.0%) | 0 (0.0%) |
| 35 to 39 Minutes | 0 (0.0%) | 0 (0.0%) |
| 40 to 44 Minutes | 0 (0.0%) | 0 (0.0%) |
| 45 to 59 Minutes | 0 (0.0%) | 0 (0.0%) |
| 60 to 89 Minutes | 0 (0.0%) | 2 (7.7%) |
| 90 or more Minutes | 0 (0.0%) | 0 (0.0%) |
Time of Departure to Work by Sex in Vanduser
The most frequent times of departure to work in Vanduser are 6:30 AM to 6:59 AM (11, 39.3%) for males and 7:00 AM to 7:29 AM (14, 53.8%) for females.
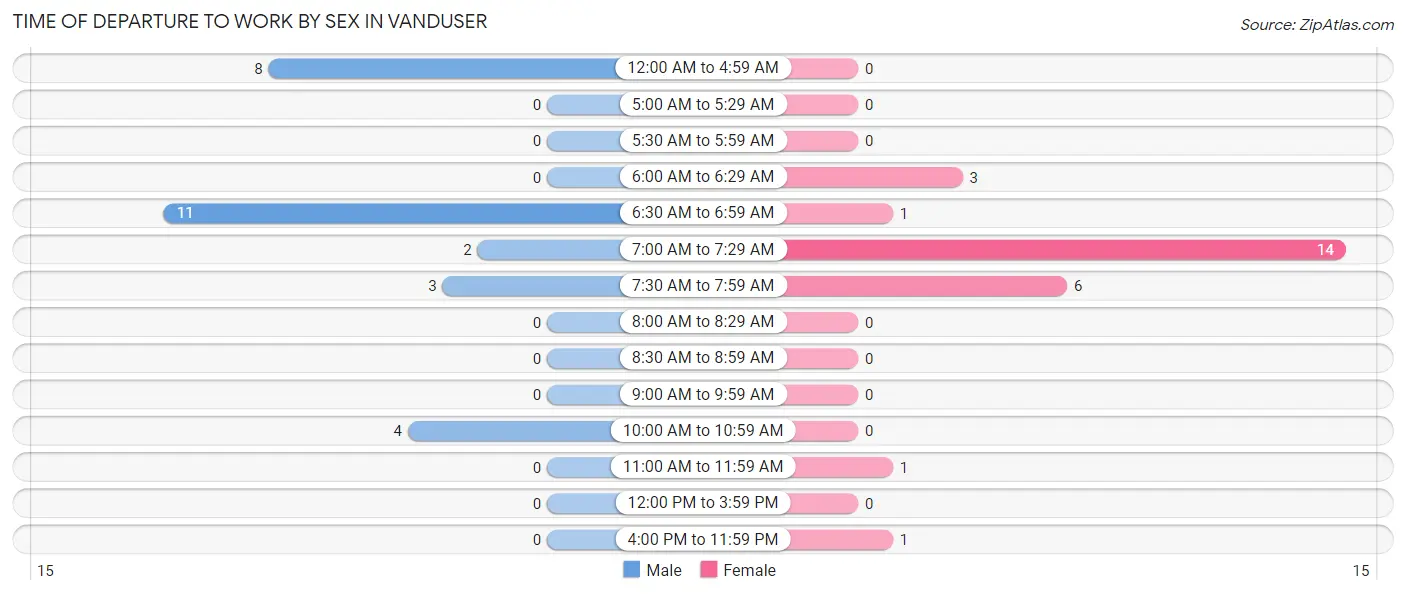
| Time of Departure | Male | Female |
| 12:00 AM to 4:59 AM | 8 (28.6%) | 0 (0.0%) |
| 5:00 AM to 5:29 AM | 0 (0.0%) | 0 (0.0%) |
| 5:30 AM to 5:59 AM | 0 (0.0%) | 0 (0.0%) |
| 6:00 AM to 6:29 AM | 0 (0.0%) | 3 (11.5%) |
| 6:30 AM to 6:59 AM | 11 (39.3%) | 1 (3.8%) |
| 7:00 AM to 7:29 AM | 2 (7.1%) | 14 (53.8%) |
| 7:30 AM to 7:59 AM | 3 (10.7%) | 6 (23.1%) |
| 8:00 AM to 8:29 AM | 0 (0.0%) | 0 (0.0%) |
| 8:30 AM to 8:59 AM | 0 (0.0%) | 0 (0.0%) |
| 9:00 AM to 9:59 AM | 0 (0.0%) | 0 (0.0%) |
| 10:00 AM to 10:59 AM | 4 (14.3%) | 0 (0.0%) |
| 11:00 AM to 11:59 AM | 0 (0.0%) | 1 (3.8%) |
| 12:00 PM to 3:59 PM | 0 (0.0%) | 0 (0.0%) |
| 4:00 PM to 11:59 PM | 0 (0.0%) | 1 (3.8%) |
| Total | 28 (100.0%) | 26 (100.0%) |
Housing Occupancy in Vanduser
Occupancy by Ownership in Vanduser
Of the total 60 dwellings in Vanduser, owner-occupied units account for 50 (83.3%), while renter-occupied units make up 10 (16.7%).
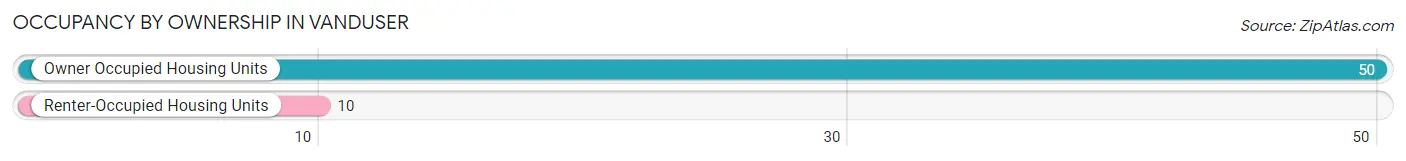
| Occupancy | # Housing Units | % Housing Units |
| Owner Occupied Housing Units | 50 | 83.3% |
| Renter-Occupied Housing Units | 10 | 16.7% |
| Total Occupied Housing Units | 60 | 100.0% |
Occupancy by Household Size in Vanduser
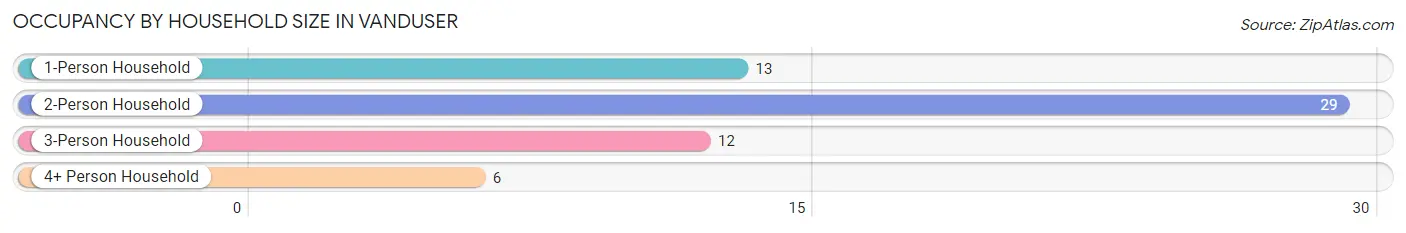
| Household Size | # Housing Units | % Housing Units |
| 1-Person Household | 13 | 21.7% |
| 2-Person Household | 29 | 48.3% |
| 3-Person Household | 12 | 20.0% |
| 4+ Person Household | 6 | 10.0% |
| Total Housing Units | 60 | 100.0% |
Occupancy by Ownership by Household Size in Vanduser
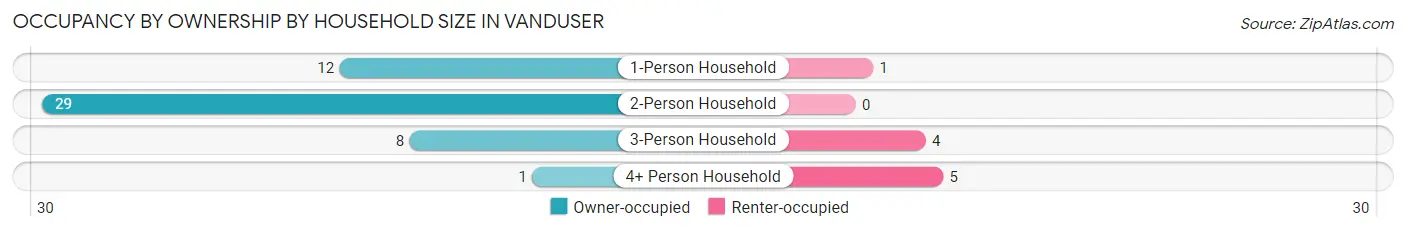
| Household Size | Owner-occupied | Renter-occupied |
| 1-Person Household | 12 (92.3%) | 1 (7.7%) |
| 2-Person Household | 29 (100.0%) | 0 (0.0%) |
| 3-Person Household | 8 (66.7%) | 4 (33.3%) |
| 4+ Person Household | 1 (16.7%) | 5 (83.3%) |
| Total Housing Units | 50 (83.3%) | 10 (16.7%) |
Occupancy by Educational Attainment in Vanduser
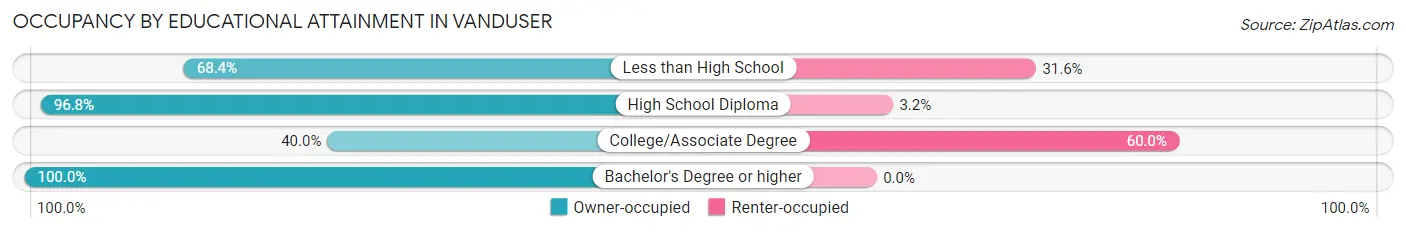
| Household Size | Owner-occupied | Renter-occupied |
| Less than High School | 13 (68.4%) | 6 (31.6%) |
| High School Diploma | 30 (96.8%) | 1 (3.2%) |
| College/Associate Degree | 2 (40.0%) | 3 (60.0%) |
| Bachelor's Degree or higher | 5 (100.0%) | 0 (0.0%) |
Occupancy by Age of Householder in Vanduser
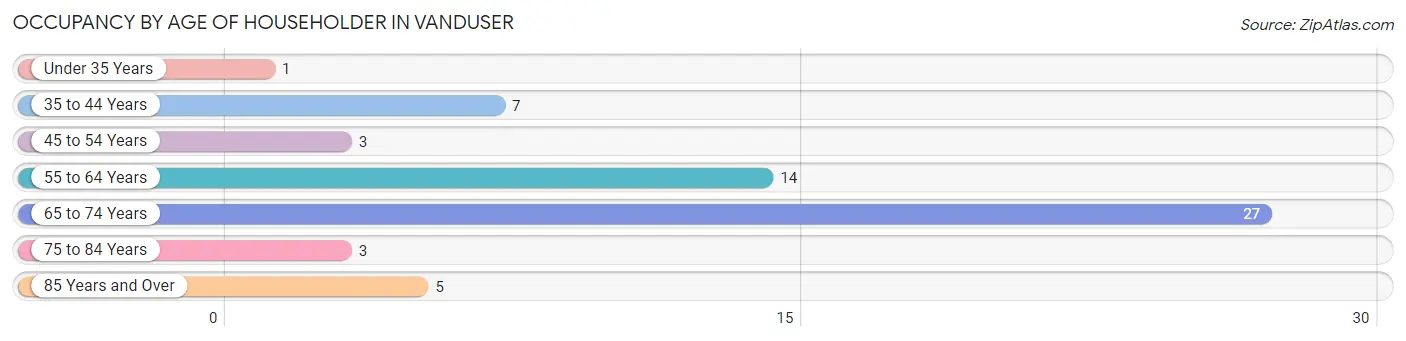
| Age Bracket | # Households | % Households |
| Under 35 Years | 1 | 1.7% |
| 35 to 44 Years | 7 | 11.7% |
| 45 to 54 Years | 3 | 5.0% |
| 55 to 64 Years | 14 | 23.3% |
| 65 to 74 Years | 27 | 45.0% |
| 75 to 84 Years | 3 | 5.0% |
| 85 Years and Over | 5 | 8.3% |
| Total | 60 | 100.0% |
Housing Finances in Vanduser
Median Income by Occupancy in Vanduser
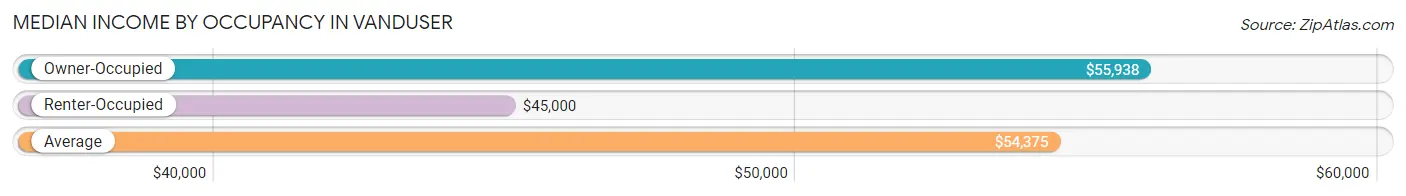
| Occupancy Type | # Households | Median Income |
| Owner-Occupied | 50 (83.3%) | $55,938 |
| Renter-Occupied | 10 (16.7%) | $45,000 |
| Average | 60 (100.0%) | $54,375 |
Occupancy by Householder Income Bracket in Vanduser
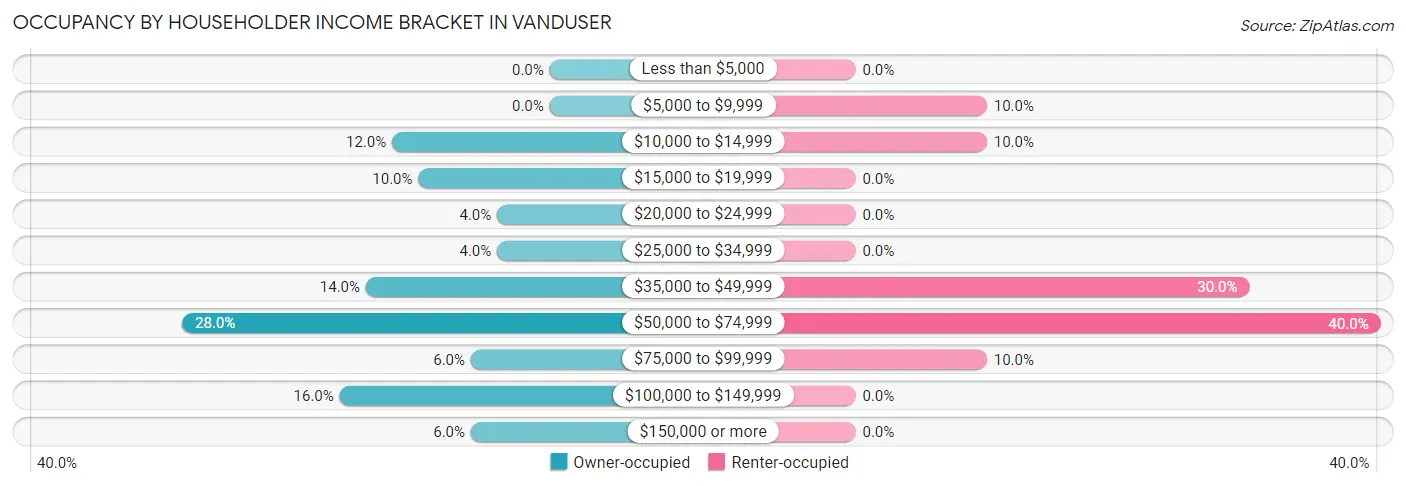
| Income Bracket | Owner-occupied | Renter-occupied |
| Less than $5,000 | 0 (0.0%) | 0 (0.0%) |
| $5,000 to $9,999 | 0 (0.0%) | 1 (10.0%) |
| $10,000 to $14,999 | 6 (12.0%) | 1 (10.0%) |
| $15,000 to $19,999 | 5 (10.0%) | 0 (0.0%) |
| $20,000 to $24,999 | 2 (4.0%) | 0 (0.0%) |
| $25,000 to $34,999 | 2 (4.0%) | 0 (0.0%) |
| $35,000 to $49,999 | 7 (14.0%) | 3 (30.0%) |
| $50,000 to $74,999 | 14 (28.0%) | 4 (40.0%) |
| $75,000 to $99,999 | 3 (6.0%) | 1 (10.0%) |
| $100,000 to $149,999 | 8 (16.0%) | 0 (0.0%) |
| $150,000 or more | 3 (6.0%) | 0 (0.0%) |
| Total | 50 (100.0%) | 10 (100.0%) |
Monthly Housing Cost Tiers in Vanduser
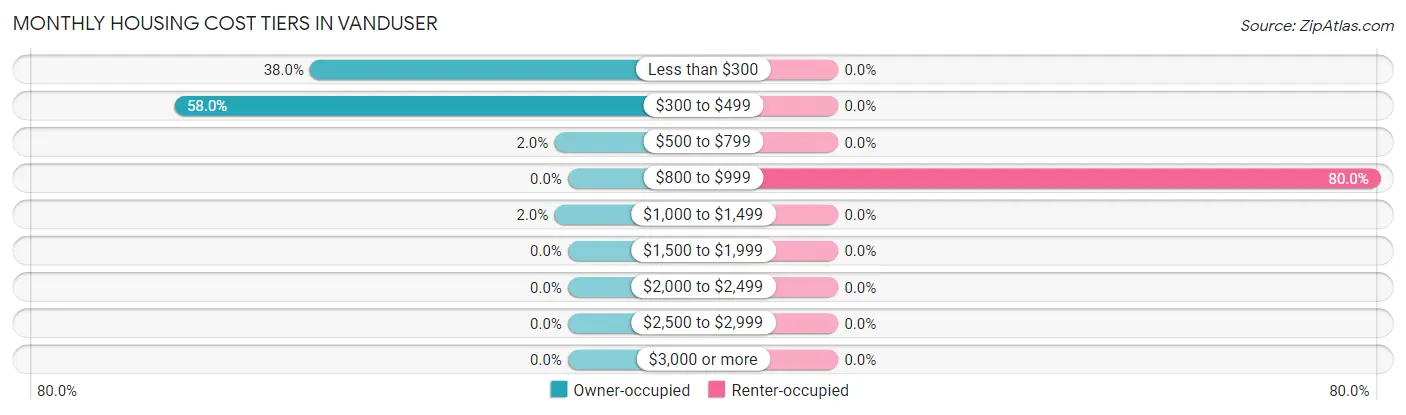
| Monthly Cost | Owner-occupied | Renter-occupied |
| Less than $300 | 19 (38.0%) | 0 (0.0%) |
| $300 to $499 | 29 (58.0%) | 0 (0.0%) |
| $500 to $799 | 1 (2.0%) | 0 (0.0%) |
| $800 to $999 | 0 (0.0%) | 8 (80.0%) |
| $1,000 to $1,499 | 1 (2.0%) | 0 (0.0%) |
| $1,500 to $1,999 | 0 (0.0%) | 0 (0.0%) |
| $2,000 to $2,499 | 0 (0.0%) | 0 (0.0%) |
| $2,500 to $2,999 | 0 (0.0%) | 0 (0.0%) |
| $3,000 or more | 0 (0.0%) | 0 (0.0%) |
| Total | 50 (100.0%) | 10 (100.0%) |
Physical Housing Characteristics in Vanduser
Housing Structures in Vanduser
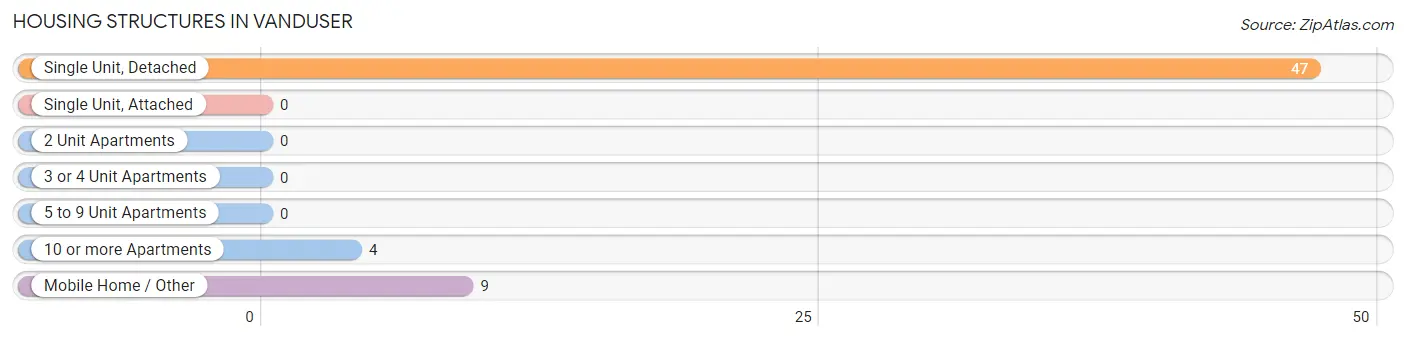
| Structure Type | # Housing Units | % Housing Units |
| Single Unit, Detached | 47 | 78.3% |
| Single Unit, Attached | 0 | 0.0% |
| 2 Unit Apartments | 0 | 0.0% |
| 3 or 4 Unit Apartments | 0 | 0.0% |
| 5 to 9 Unit Apartments | 0 | 0.0% |
| 10 or more Apartments | 4 | 6.7% |
| Mobile Home / Other | 9 | 15.0% |
| Total | 60 | 100.0% |
Housing Structures by Occupancy in Vanduser
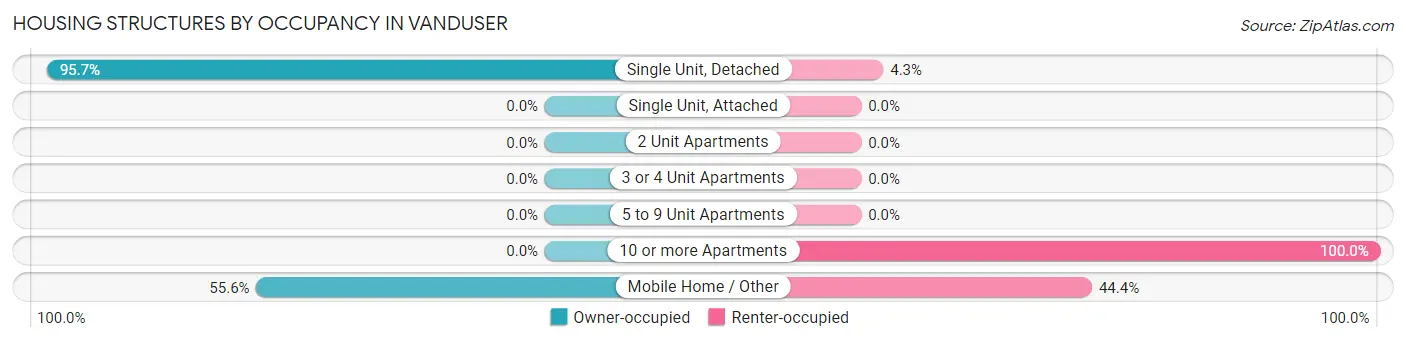
| Structure Type | Owner-occupied | Renter-occupied |
| Single Unit, Detached | 45 (95.7%) | 2 (4.3%) |
| Single Unit, Attached | 0 (0.0%) | 0 (0.0%) |
| 2 Unit Apartments | 0 (0.0%) | 0 (0.0%) |
| 3 or 4 Unit Apartments | 0 (0.0%) | 0 (0.0%) |
| 5 to 9 Unit Apartments | 0 (0.0%) | 0 (0.0%) |
| 10 or more Apartments | 0 (0.0%) | 4 (100.0%) |
| Mobile Home / Other | 5 (55.6%) | 4 (44.4%) |
| Total | 50 (83.3%) | 10 (16.7%) |
Housing Structures by Number of Rooms in Vanduser
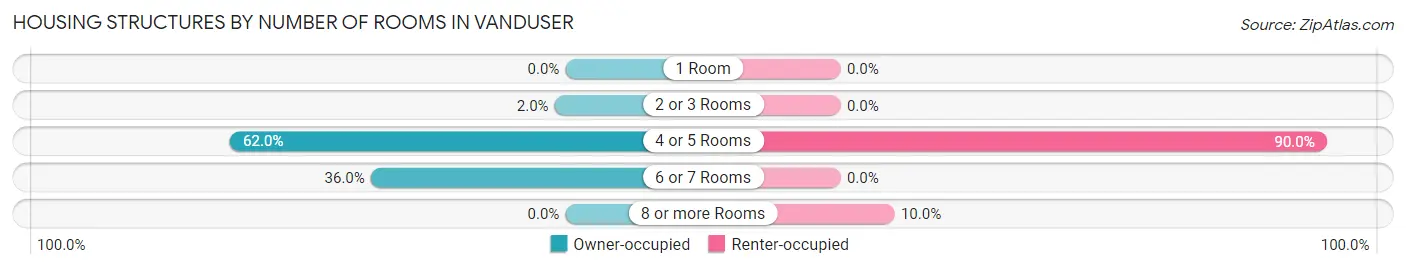
| Number of Rooms | Owner-occupied | Renter-occupied |
| 1 Room | 0 (0.0%) | 0 (0.0%) |
| 2 or 3 Rooms | 1 (2.0%) | 0 (0.0%) |
| 4 or 5 Rooms | 31 (62.0%) | 9 (90.0%) |
| 6 or 7 Rooms | 18 (36.0%) | 0 (0.0%) |
| 8 or more Rooms | 0 (0.0%) | 1 (10.0%) |
| Total | 50 (100.0%) | 10 (100.0%) |
Housing Structure by Heating Type in Vanduser
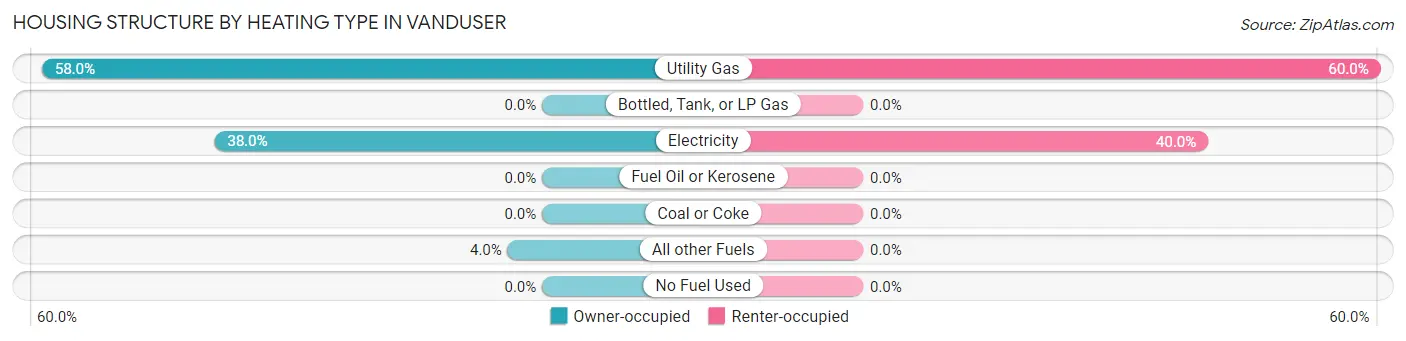
| Heating Type | Owner-occupied | Renter-occupied |
| Utility Gas | 29 (58.0%) | 6 (60.0%) |
| Bottled, Tank, or LP Gas | 0 (0.0%) | 0 (0.0%) |
| Electricity | 19 (38.0%) | 4 (40.0%) |
| Fuel Oil or Kerosene | 0 (0.0%) | 0 (0.0%) |
| Coal or Coke | 0 (0.0%) | 0 (0.0%) |
| All other Fuels | 2 (4.0%) | 0 (0.0%) |
| No Fuel Used | 0 (0.0%) | 0 (0.0%) |
| Total | 50 (100.0%) | 10 (100.0%) |
Household Vehicle Usage in Vanduser
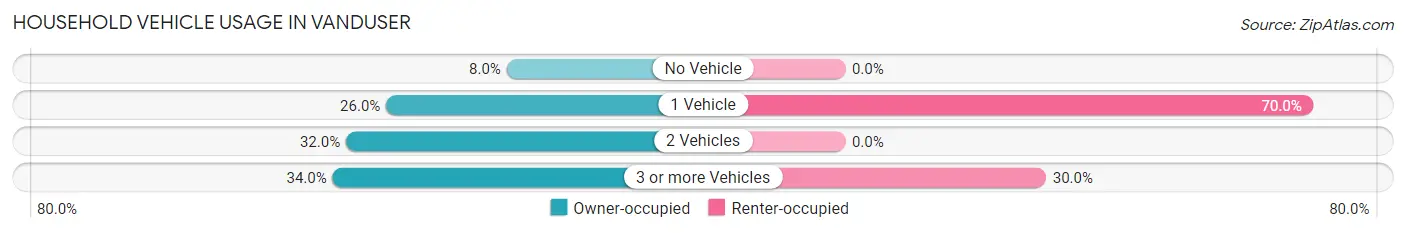
| Vehicles per Household | Owner-occupied | Renter-occupied |
| No Vehicle | 4 (8.0%) | 0 (0.0%) |
| 1 Vehicle | 13 (26.0%) | 7 (70.0%) |
| 2 Vehicles | 16 (32.0%) | 0 (0.0%) |
| 3 or more Vehicles | 17 (34.0%) | 3 (30.0%) |
| Total | 50 (100.0%) | 10 (100.0%) |
Real Estate & Mortgages in Vanduser
Real Estate and Mortgage Overview in Vanduser
| Characteristic | Without Mortgage | With Mortgage |
| Housing Units | 50 | 0 |
| Median Property Value | $61,100 | $0 |
| Median Household Income | $55,938 | $0 |
| Monthly Housing Costs | $327 | $0 |
| Real Estate Taxes | $600 | $0 |
Property Value by Mortgage Status in Vanduser
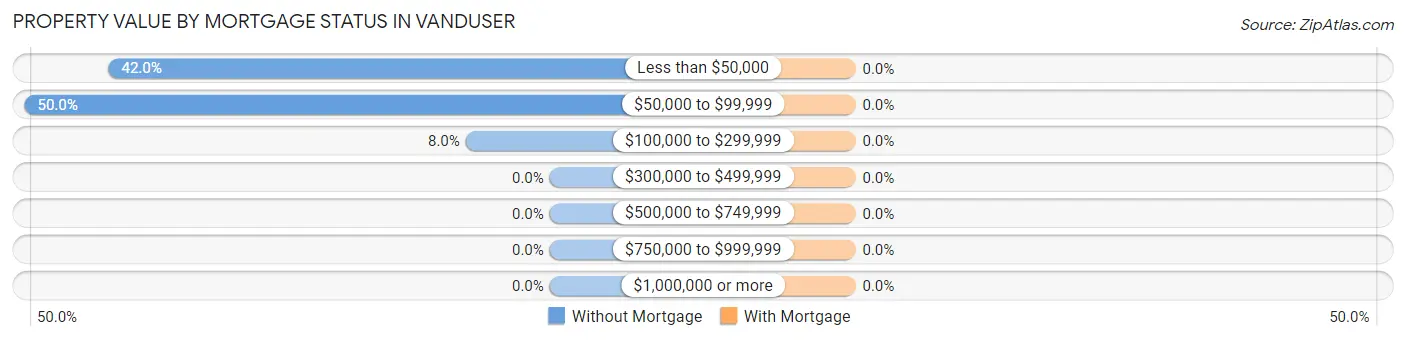
| Property Value | Without Mortgage | With Mortgage |
| Less than $50,000 | 21 (42.0%) | 0 (0.0%) |
| $50,000 to $99,999 | 25 (50.0%) | 0 (0.0%) |
| $100,000 to $299,999 | 4 (8.0%) | 0 (0.0%) |
| $300,000 to $499,999 | 0 (0.0%) | 0 (0.0%) |
| $500,000 to $749,999 | 0 (0.0%) | 0 (0.0%) |
| $750,000 to $999,999 | 0 (0.0%) | 0 (0.0%) |
| $1,000,000 or more | 0 (0.0%) | 0 (0.0%) |
| Total | 50 (100.0%) | 0 (0.0%) |
Household Income by Mortgage Status in Vanduser
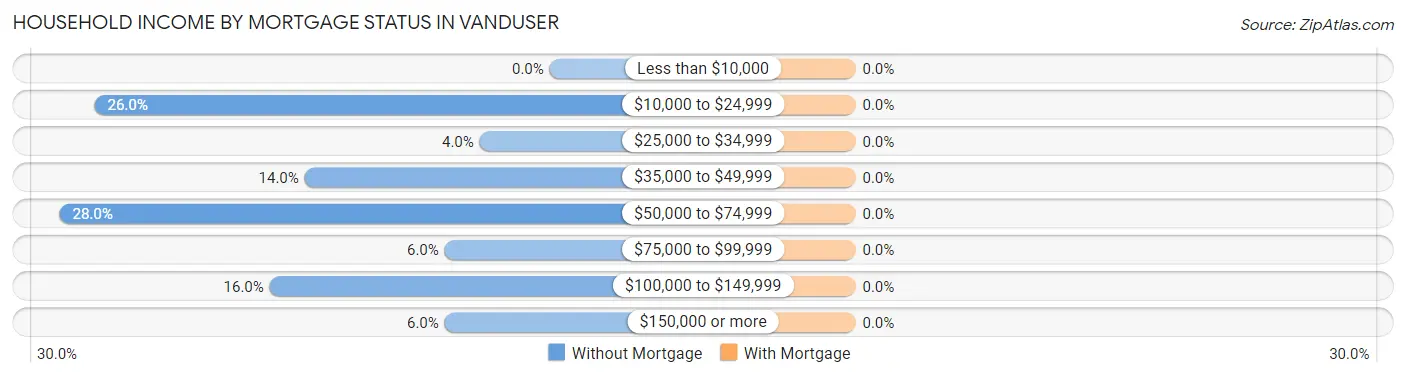
| Household Income | Without Mortgage | With Mortgage |
| Less than $10,000 | 0 (0.0%) | 0 (0.0%) |
| $10,000 to $24,999 | 13 (26.0%) | 0 (0.0%) |
| $25,000 to $34,999 | 2 (4.0%) | 0 (0.0%) |
| $35,000 to $49,999 | 7 (14.0%) | 0 (0.0%) |
| $50,000 to $74,999 | 14 (28.0%) | 0 (0.0%) |
| $75,000 to $99,999 | 3 (6.0%) | 0 (0.0%) |
| $100,000 to $149,999 | 8 (16.0%) | 0 (0.0%) |
| $150,000 or more | 3 (6.0%) | 0 (0.0%) |
| Total | 50 (100.0%) | 0 (0.0%) |
Property Value to Household Income Ratio in Vanduser
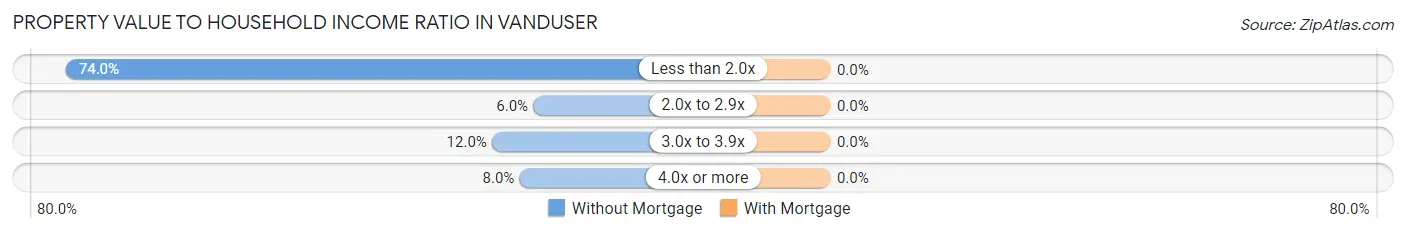
| Value-to-Income Ratio | Without Mortgage | With Mortgage |
| Less than 2.0x | 37 (74.0%) | 0 (0.0%) |
| 2.0x to 2.9x | 3 (6.0%) | 0 (0.0%) |
| 3.0x to 3.9x | 6 (12.0%) | 0 (0.0%) |
| 4.0x or more | 4 (8.0%) | 0 (0.0%) |
| Total | 50 (100.0%) | 0 (0.0%) |
Real Estate Taxes by Mortgage Status in Vanduser
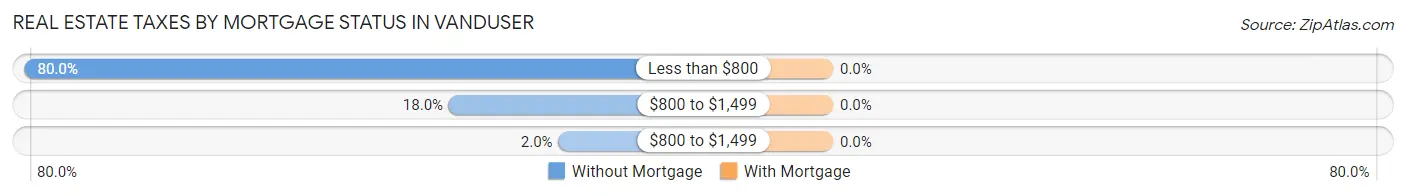
| Property Taxes | Without Mortgage | With Mortgage |
| Less than $800 | 40 (80.0%) | 0 (0.0%) |
| $800 to $1,499 | 9 (18.0%) | 0 (0.0%) |
| $800 to $1,499 | 1 (2.0%) | 0 (0.0%) |
| Total | 50 (100.0%) | 0 (0.0%) |
Health & Disability in Vanduser
Health Insurance Coverage by Age in Vanduser
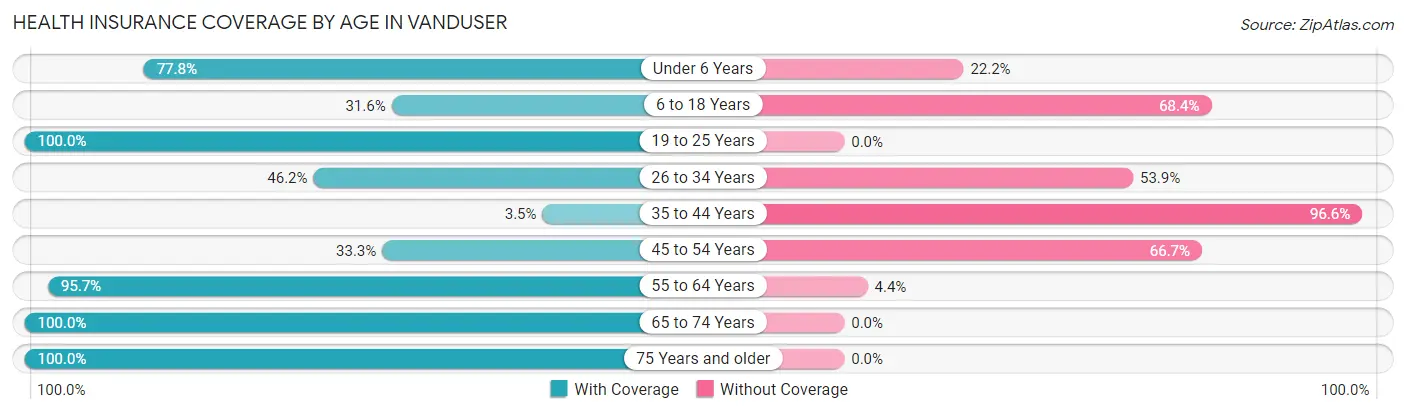
| Age Bracket | With Coverage | Without Coverage |
| Under 6 Years | 7 (77.8%) | 2 (22.2%) |
| 6 to 18 Years | 6 (31.6%) | 13 (68.4%) |
| 19 to 25 Years | 10 (100.0%) | 0 (0.0%) |
| 26 to 34 Years | 12 (46.2%) | 14 (53.8%) |
| 35 to 44 Years | 1 (3.5%) | 28 (96.6%) |
| 45 to 54 Years | 2 (33.3%) | 4 (66.7%) |
| 55 to 64 Years | 22 (95.7%) | 1 (4.3%) |
| 65 to 74 Years | 45 (100.0%) | 0 (0.0%) |
| 75 Years and older | 10 (100.0%) | 0 (0.0%) |
| Total | 115 (65.0%) | 62 (35.0%) |
Health Insurance Coverage by Citizenship Status in Vanduser
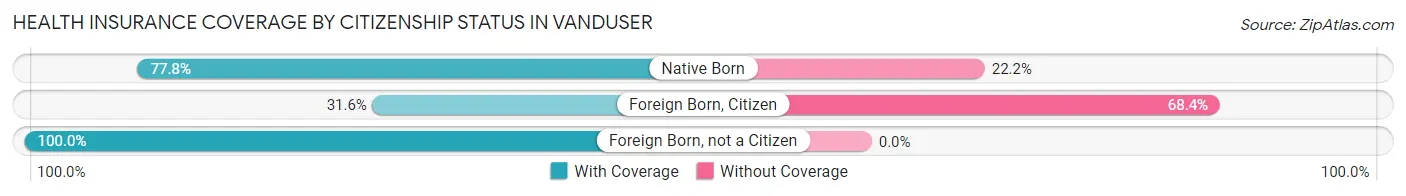
| Citizenship Status | With Coverage | Without Coverage |
| Native Born | 7 (77.8%) | 2 (22.2%) |
| Foreign Born, Citizen | 6 (31.6%) | 13 (68.4%) |
| Foreign Born, not a Citizen | 10 (100.0%) | 0 (0.0%) |
Health Insurance Coverage by Household Income in Vanduser
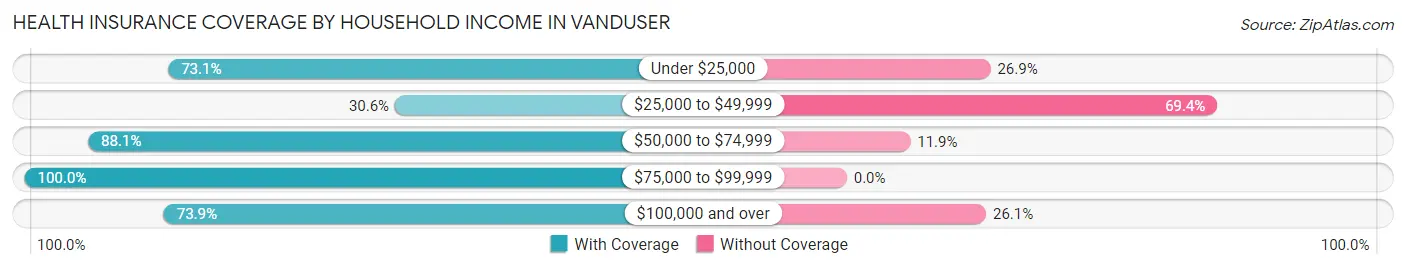
| Household Income | With Coverage | Without Coverage |
| Under $25,000 | 19 (73.1%) | 7 (26.9%) |
| $25,000 to $49,999 | 15 (30.6%) | 34 (69.4%) |
| $50,000 to $74,999 | 37 (88.1%) | 5 (11.9%) |
| $75,000 to $99,999 | 9 (100.0%) | 0 (0.0%) |
| $100,000 and over | 17 (73.9%) | 6 (26.1%) |
Public vs Private Health Insurance Coverage by Age in Vanduser
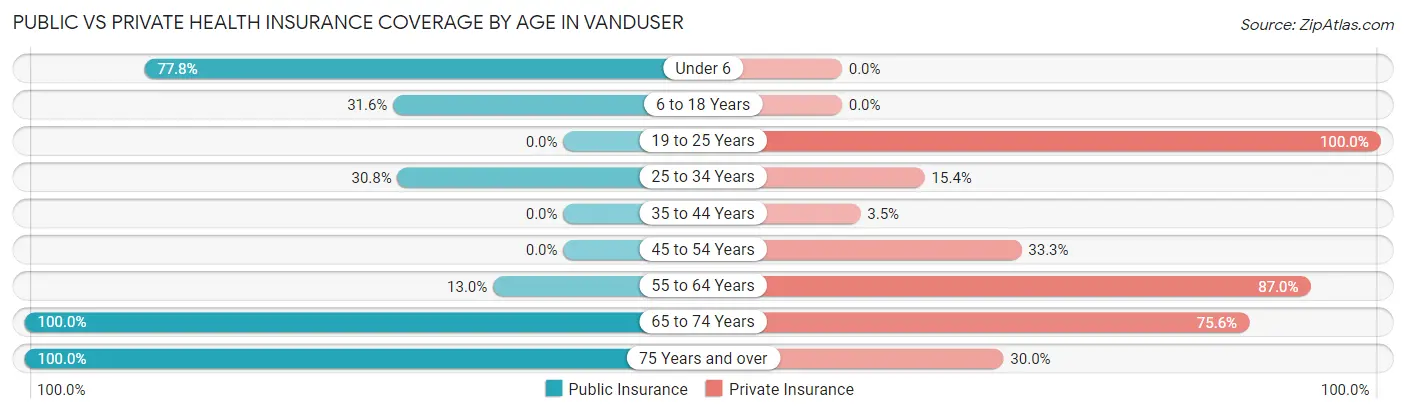
| Age Bracket | Public Insurance | Private Insurance |
| Under 6 | 7 (77.8%) | 0 (0.0%) |
| 6 to 18 Years | 6 (31.6%) | 0 (0.0%) |
| 19 to 25 Years | 0 (0.0%) | 10 (100.0%) |
| 25 to 34 Years | 8 (30.8%) | 4 (15.4%) |
| 35 to 44 Years | 0 (0.0%) | 1 (3.5%) |
| 45 to 54 Years | 0 (0.0%) | 2 (33.3%) |
| 55 to 64 Years | 3 (13.0%) | 20 (87.0%) |
| 65 to 74 Years | 45 (100.0%) | 34 (75.6%) |
| 75 Years and over | 10 (100.0%) | 3 (30.0%) |
| Total | 79 (44.6%) | 74 (41.8%) |
Disability Status by Sex by Age in Vanduser
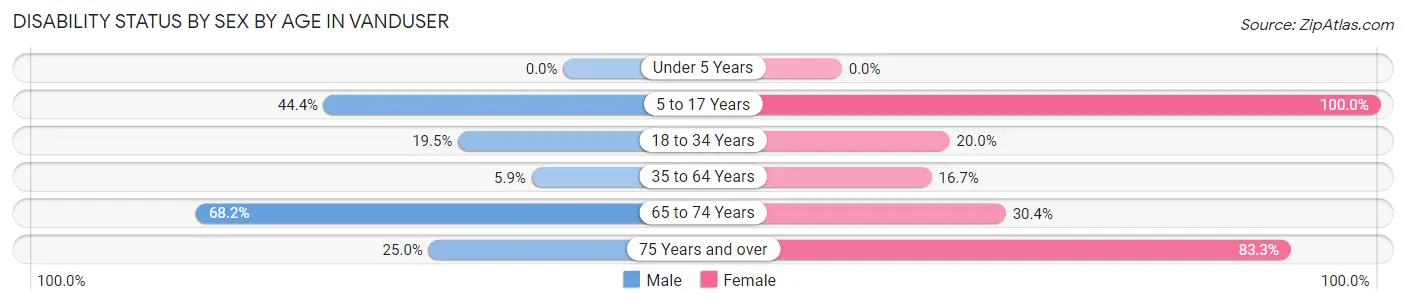
| Age Bracket | Male | Female |
| Under 5 Years | 0 (0.0%) | 0 (0.0%) |
| 5 to 17 Years | 4 (44.4%) | 1 (100.0%) |
| 18 to 34 Years | 8 (19.5%) | 1 (20.0%) |
| 35 to 64 Years | 2 (5.9%) | 4 (16.7%) |
| 65 to 74 Years | 15 (68.2%) | 7 (30.4%) |
| 75 Years and over | 1 (25.0%) | 5 (83.3%) |
Disability Class by Sex by Age in Vanduser
Disability Class: Hearing Difficulty
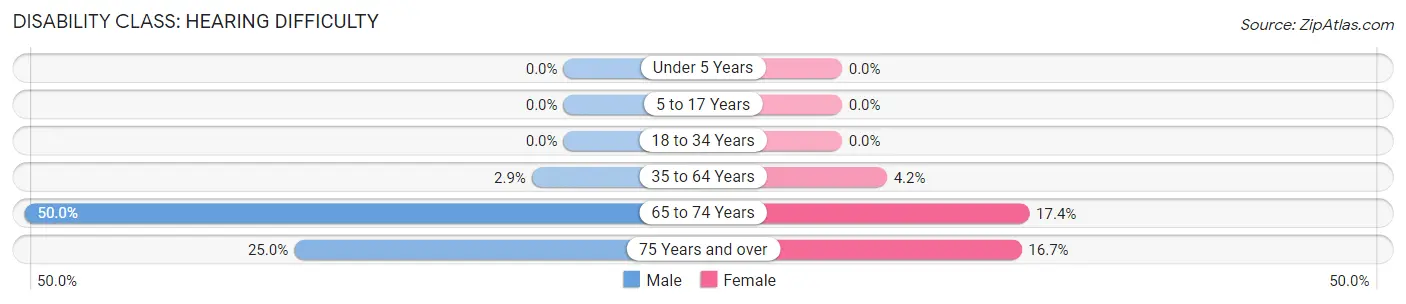
| Age Bracket | Male | Female |
| Under 5 Years | 0 (0.0%) | 0 (0.0%) |
| 5 to 17 Years | 0 (0.0%) | 0 (0.0%) |
| 18 to 34 Years | 0 (0.0%) | 0 (0.0%) |
| 35 to 64 Years | 1 (2.9%) | 1 (4.2%) |
| 65 to 74 Years | 11 (50.0%) | 4 (17.4%) |
| 75 Years and over | 1 (25.0%) | 1 (16.7%) |
Disability Class: Vision Difficulty
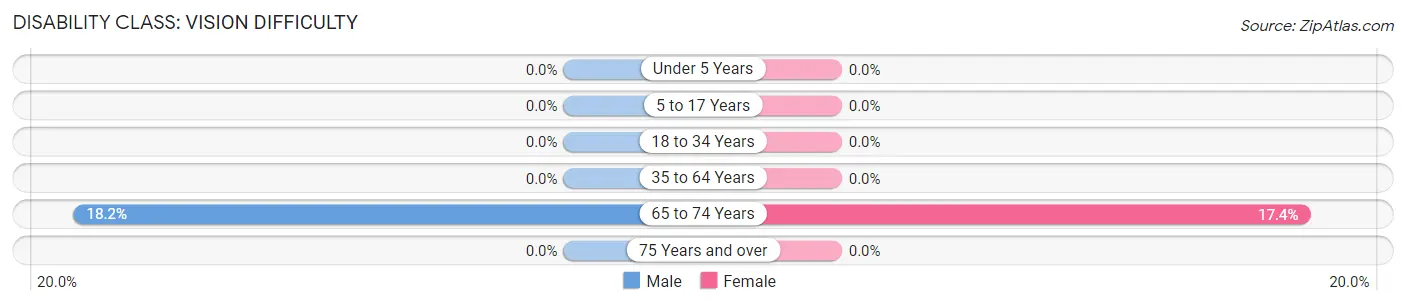
| Age Bracket | Male | Female |
| Under 5 Years | 0 (0.0%) | 0 (0.0%) |
| 5 to 17 Years | 0 (0.0%) | 0 (0.0%) |
| 18 to 34 Years | 0 (0.0%) | 0 (0.0%) |
| 35 to 64 Years | 0 (0.0%) | 0 (0.0%) |
| 65 to 74 Years | 4 (18.2%) | 4 (17.4%) |
| 75 Years and over | 0 (0.0%) | 0 (0.0%) |
Disability Class: Cognitive Difficulty
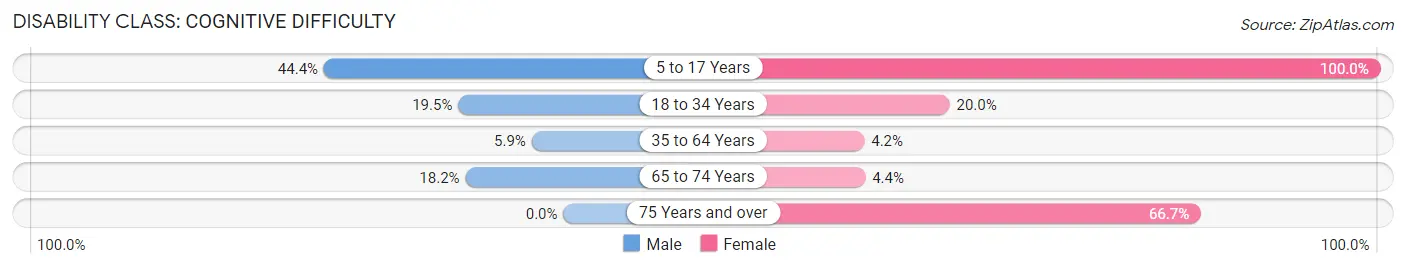
| Age Bracket | Male | Female |
| 5 to 17 Years | 4 (44.4%) | 1 (100.0%) |
| 18 to 34 Years | 8 (19.5%) | 1 (20.0%) |
| 35 to 64 Years | 2 (5.9%) | 1 (4.2%) |
| 65 to 74 Years | 4 (18.2%) | 1 (4.3%) |
| 75 Years and over | 0 (0.0%) | 4 (66.7%) |
Disability Class: Ambulatory Difficulty
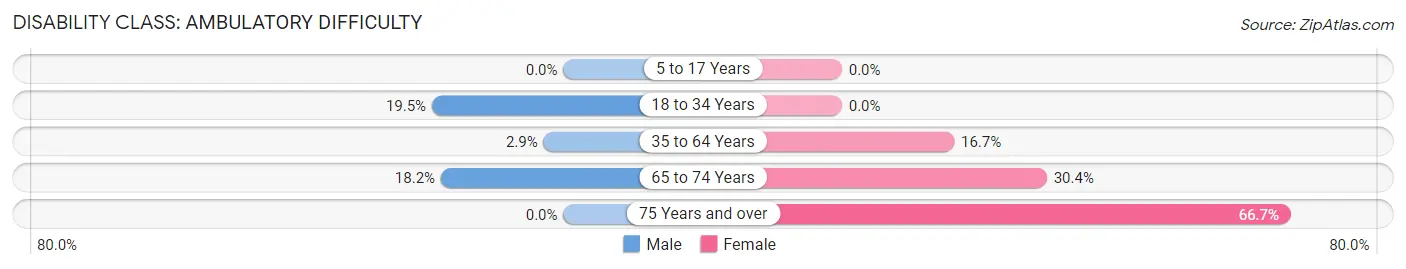
| Age Bracket | Male | Female |
| 5 to 17 Years | 0 (0.0%) | 0 (0.0%) |
| 18 to 34 Years | 8 (19.5%) | 0 (0.0%) |
| 35 to 64 Years | 1 (2.9%) | 4 (16.7%) |
| 65 to 74 Years | 4 (18.2%) | 7 (30.4%) |
| 75 Years and over | 0 (0.0%) | 4 (66.7%) |
Disability Class: Self-Care Difficulty
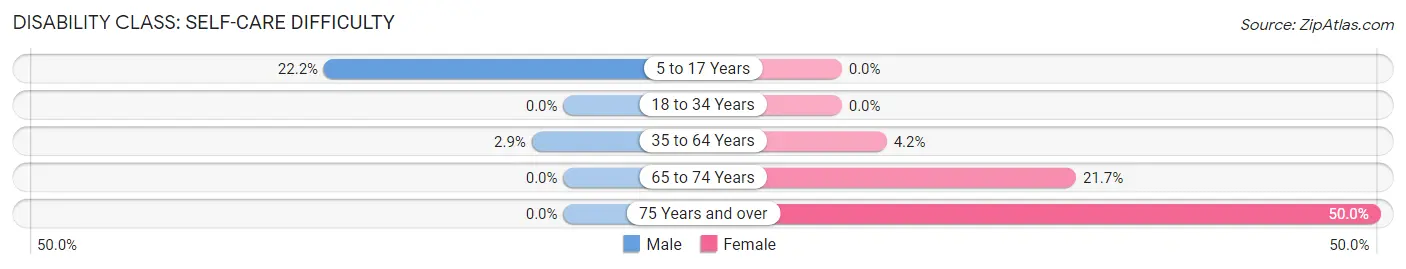
| Age Bracket | Male | Female |
| 5 to 17 Years | 2 (22.2%) | 0 (0.0%) |
| 18 to 34 Years | 0 (0.0%) | 0 (0.0%) |
| 35 to 64 Years | 1 (2.9%) | 1 (4.2%) |
| 65 to 74 Years | 0 (0.0%) | 5 (21.7%) |
| 75 Years and over | 0 (0.0%) | 3 (50.0%) |
Technology Access in Vanduser
Computing Device Access in Vanduser
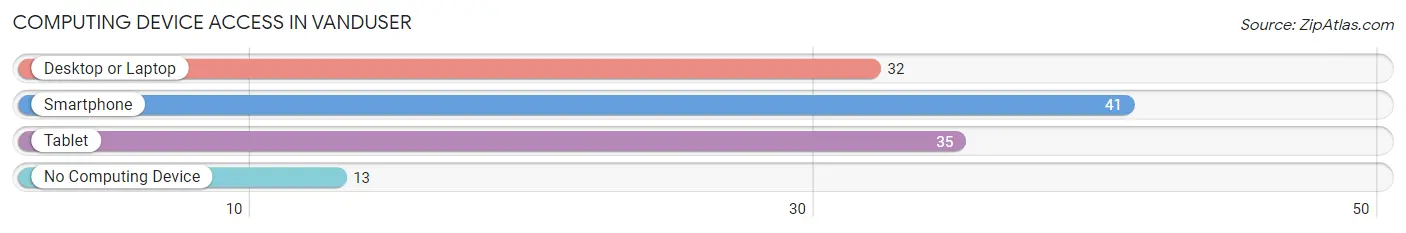
| Device Type | # Households | % Households |
| Desktop or Laptop | 32 | 53.3% |
| Smartphone | 41 | 68.3% |
| Tablet | 35 | 58.3% |
| No Computing Device | 13 | 21.7% |
| Total | 60 | 100.0% |
Internet Access in Vanduser
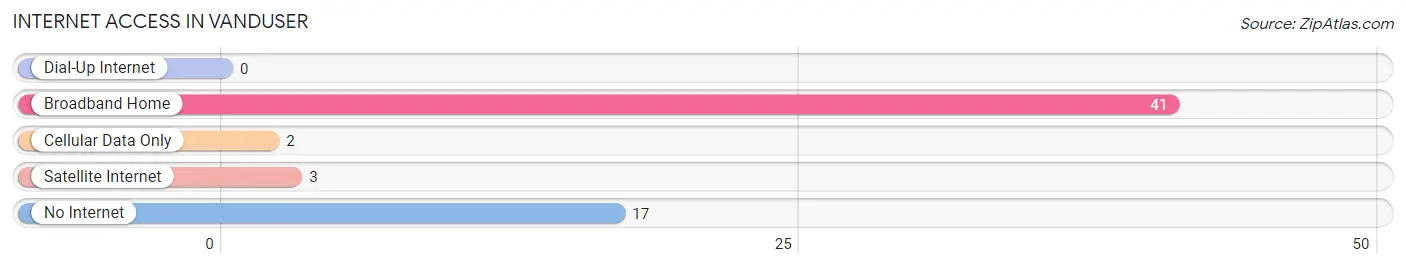
| Internet Type | # Households | % Households |
| Dial-Up Internet | 0 | 0.0% |
| Broadband Home | 41 | 68.3% |
| Cellular Data Only | 2 | 3.3% |
| Satellite Internet | 3 | 5.0% |
| No Internet | 17 | 28.3% |
| Total | 60 | 100.0% |
Vanduser Summary
Vanduser is a small unincorporated community located in Scott County, Missouri. It is situated in the southeastern corner of the state, approximately 10 miles south of Sikeston and 8 miles north of East Prairie. The population of Vanduser was estimated to be around 200 people in 2000.
Geography
Vanduser is located in the southeastern corner of Scott County, Missouri. It is situated in the Bootheel region of the state, which is known for its flat terrain and rich soil. The town is located along the banks of the St. Francis River, which provides a natural border between Missouri and Arkansas. The town is surrounded by farmland and is located near the intersection of State Highway 77 and County Road 517.
Climate
Vanduser has a humid subtropical climate, with hot, humid summers and mild winters. The average annual temperature is around 64°F, with an average high of around 90°F in the summer and an average low of around 40°F in the winter. The average annual precipitation is around 45 inches, with most of the rain falling in the spring and summer months.
Demographics
As of the 2000 census, the population of Vanduser was estimated to be around 200 people. The racial makeup of the town was 97.5% White, 0.5% African American, 0.5% Native American, and 1.5% from two or more races. The median household income was $25,000, and the median family income was $30,000.
Economy
Vanduser is a small, rural community with a primarily agricultural economy. The town is home to several farms, which produce a variety of crops, including corn, soybeans, and cotton. The town also has a few small businesses, including a gas station, a convenience store, and a few restaurants.
History
Vanduser was founded in the late 1800s by a group of settlers from Tennessee. The town was named after one of the settlers, William Vanduser. The town grew slowly over the years, and by the early 1900s, it had become a thriving agricultural community. The town was home to several churches, a school, and a post office.
In the late 20th century, the town began to decline as many of its residents moved away in search of better economic opportunities. Today, Vanduser is a small, quiet community with a population of around 200 people. Despite its small size, the town still retains its rural charm and is a popular destination for visitors looking to experience the beauty of the Missouri countryside.
Common Questions
What is Per Capita Income in Vanduser?
Per Capita income in Vanduser is $19,482.
What is the Median Family Income in Vanduser?
Median Family Income in Vanduser is $55,781.
What is the Median Household income in Vanduser?
Median Household Income in Vanduser is $54,375.
What is Inequality or Gini Index in Vanduser?
Inequality or Gini Index in Vanduser is 0.39.
What is the Total Population of Vanduser?
Total Population of Vanduser is 182.
What is the Total Male Population of Vanduser?
Total Male Population of Vanduser is 116.
What is the Total Female Population of Vanduser?
Total Female Population of Vanduser is 66.
What is the Ratio of Males per 100 Females in Vanduser?
There are 175.76 Males per 100 Females in Vanduser.
What is the Ratio of Females per 100 Males in Vanduser?
There are 56.90 Females per 100 Males in Vanduser.
What is the Median Population Age in Vanduser?
Median Population Age in Vanduser is 39.7 Years.
What is the Average Family Size in Vanduser
Average Family Size in Vanduser is 2.8 People.
What is the Average Household Size in Vanduser
Average Household Size in Vanduser is 2.5 People.
How Large is the Labor Force in Vanduser?
There are 73 People in the Labor Forcein in Vanduser.
What is the Percentage of People in the Labor Force in Vanduser?
43.7% of People are in the Labor Force in Vanduser.
What is the Unemployment Rate in Vanduser?
Unemployment Rate in Vanduser is 12.3%.