Winchester, MO Map & Demographics
Winchester Map
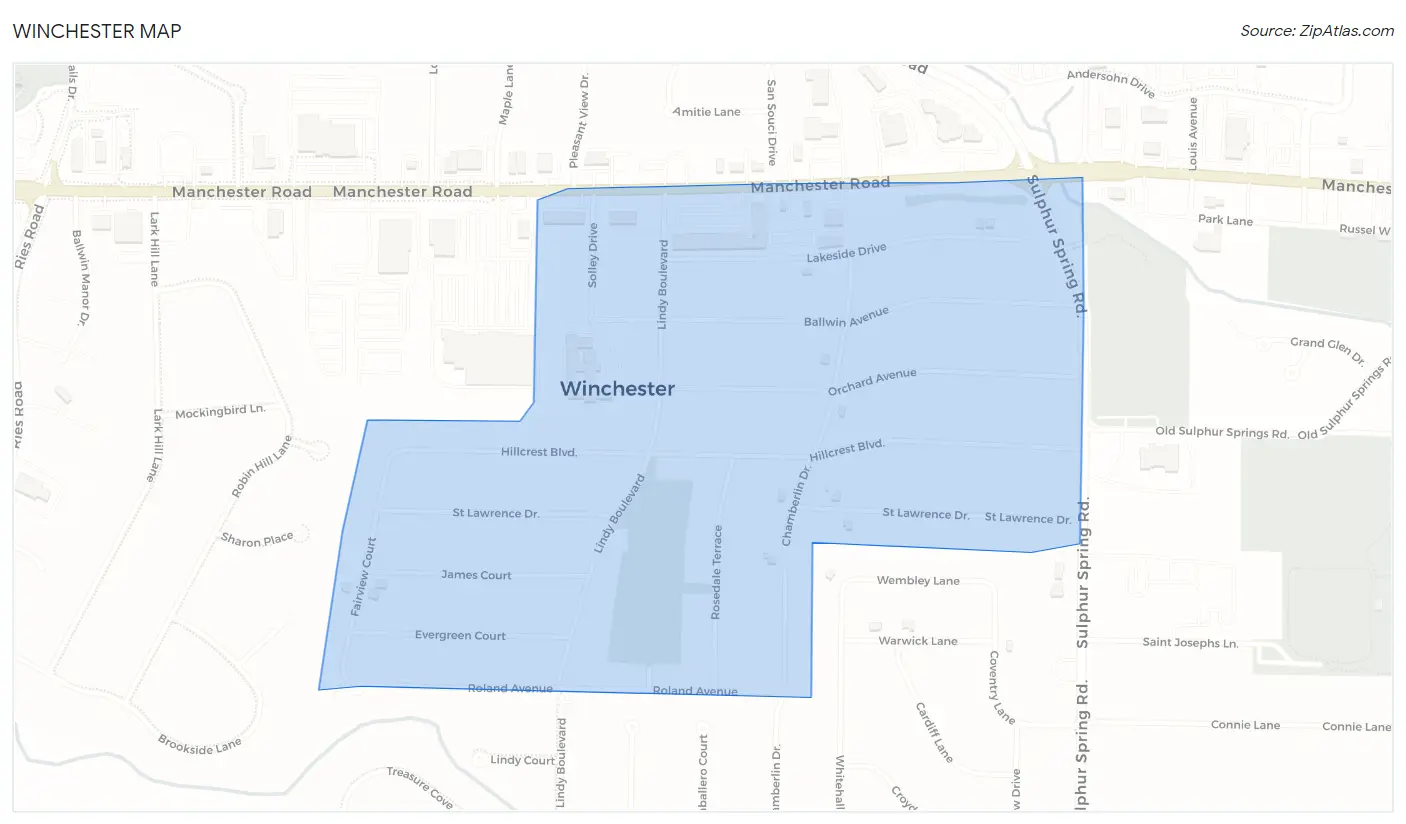
Winchester Overview
$31,034
PER CAPITA INCOME
$86,063
AVG FAMILY INCOME
$82,163
AVG HOUSEHOLD INCOME
4.2%
WAGE / INCOME GAP [ % ]
95.8¢/ $1
WAGE / INCOME GAP [ $ ]
0.29
INEQUALITY / GINI INDEX
1,977
TOTAL POPULATION
1,053
MALE POPULATION
924
FEMALE POPULATION
113.96
MALES / 100 FEMALES
87.75
FEMALES / 100 MALES
38.6
MEDIAN AGE
3.2
AVG FAMILY SIZE
2.7
AVG HOUSEHOLD SIZE
1,264
LABOR FORCE [ PEOPLE ]
77.0%
PERCENT IN LABOR FORCE
3.1%
UNEMPLOYMENT RATE
Income in Winchester
Income Overview in Winchester
Per Capita Income in Winchester is $31,034, while median incomes of families and households are $86,063 and $82,163 respectively.
| Characteristic | Number | Measure |
| Per Capita Income | 1,977 | $31,034 |
| Median Family Income | 501 | $86,063 |
| Mean Family Income | 501 | $95,594 |
| Median Household Income | 699 | $82,163 |
| Mean Household Income | 699 | $89,162 |
| Income Deficit | 501 | $0 |
| Wage / Income Gap (%) | 1,977 | 4.19% |
| Wage / Income Gap ($) | 1,977 | 95.81¢ per $1 |
| Gini / Inequality Index | 1,977 | 0.29 |
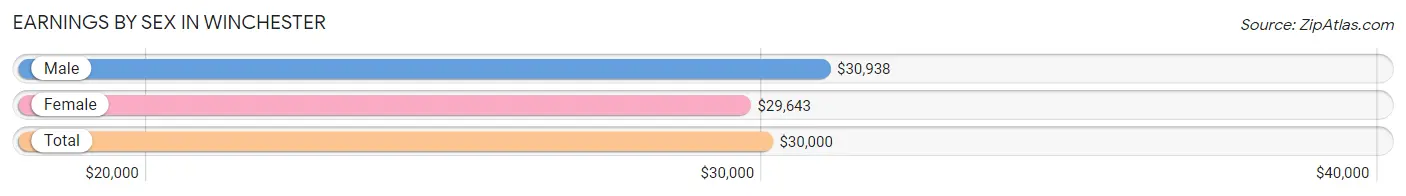
Earnings by Sex in Winchester
Average Earnings in Winchester are $30,000, $30,938 for men and $29,643 for women, a difference of 4.2%.
| Sex | Number | Average Earnings |
| Male | 660 (51.8%) | $30,938 |
| Female | 614 (48.2%) | $29,643 |
| Total | 1,274 (100.0%) | $30,000 |
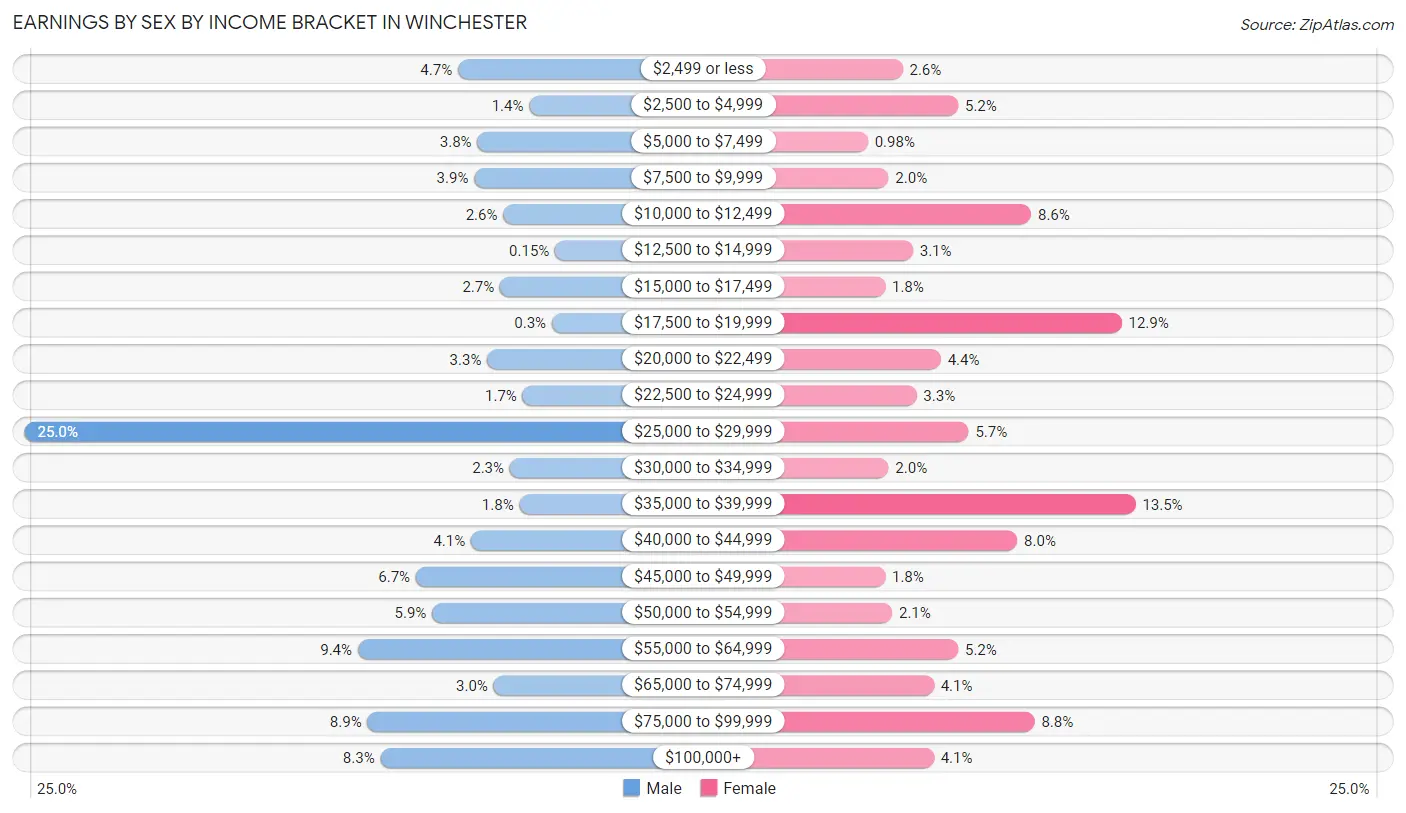
Earnings by Sex by Income Bracket in Winchester
The most common earnings brackets in Winchester are $25,000 to $29,999 for men (165 | 25.0%) and $35,000 to $39,999 for women (83 | 13.5%).
| Income | Male | Female |
| $2,499 or less | 31 (4.7%) | 16 (2.6%) |
| $2,500 to $4,999 | 9 (1.4%) | 32 (5.2%) |
| $5,000 to $7,499 | 25 (3.8%) | 6 (1.0%) |
| $7,500 to $9,999 | 26 (3.9%) | 12 (1.9%) |
| $10,000 to $12,499 | 17 (2.6%) | 53 (8.6%) |
| $12,500 to $14,999 | 1 (0.2%) | 19 (3.1%) |
| $15,000 to $17,499 | 18 (2.7%) | 11 (1.8%) |
| $17,500 to $19,999 | 2 (0.3%) | 79 (12.9%) |
| $20,000 to $22,499 | 22 (3.3%) | 27 (4.4%) |
| $22,500 to $24,999 | 11 (1.7%) | 20 (3.3%) |
| $25,000 to $29,999 | 165 (25.0%) | 35 (5.7%) |
| $30,000 to $34,999 | 15 (2.3%) | 12 (1.9%) |
| $35,000 to $39,999 | 12 (1.8%) | 83 (13.5%) |
| $40,000 to $44,999 | 27 (4.1%) | 49 (8.0%) |
| $45,000 to $49,999 | 44 (6.7%) | 11 (1.8%) |
| $50,000 to $54,999 | 39 (5.9%) | 13 (2.1%) |
| $55,000 to $64,999 | 62 (9.4%) | 32 (5.2%) |
| $65,000 to $74,999 | 20 (3.0%) | 25 (4.1%) |
| $75,000 to $99,999 | 59 (8.9%) | 54 (8.8%) |
| $100,000+ | 55 (8.3%) | 25 (4.1%) |
| Total | 660 (100.0%) | 614 (100.0%) |
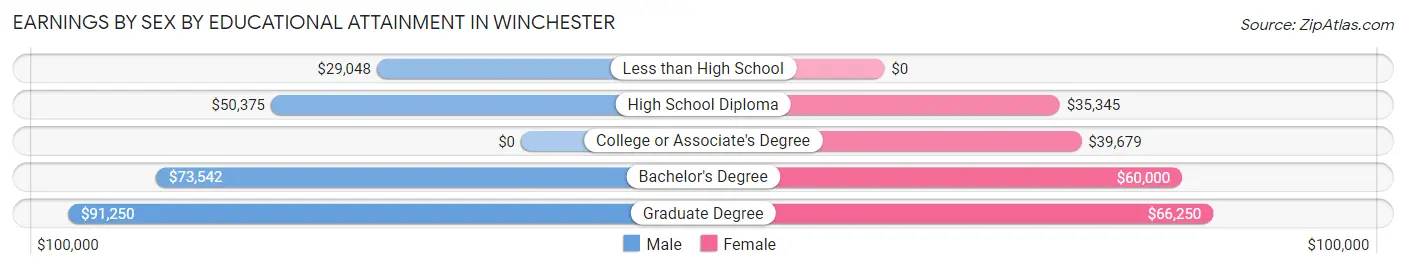
Earnings by Sex by Educational Attainment in Winchester
Average earnings in Winchester are $41,667 for men and $39,940 for women, a difference of 4.1%. Men with an educational attainment of graduate degree enjoy the highest average annual earnings of $91,250, while those with less than high school education earn the least with $29,048. Women with an educational attainment of graduate degree earn the most with the average annual earnings of $66,250, while those with high school diploma education have the smallest earnings of $35,345.
| Educational Attainment | Male Income | Female Income |
| Less than High School | $29,048 | $0 |
| High School Diploma | $50,375 | $35,345 |
| College or Associate's Degree | - | - |
| Bachelor's Degree | $73,542 | $60,000 |
| Graduate Degree | $91,250 | $66,250 |
| Total | $41,667 | $39,940 |
Family Income in Winchester
Family Income Brackets in Winchester
According to the Winchester family income data, there are 170 families falling into the $75,000 to $99,999 income range, which is the most common income bracket and makes up 33.9% of all families. Conversely, the $15,000 to $24,999 income bracket is the least frequent group with only 5 families (1.0%) belonging to this category.
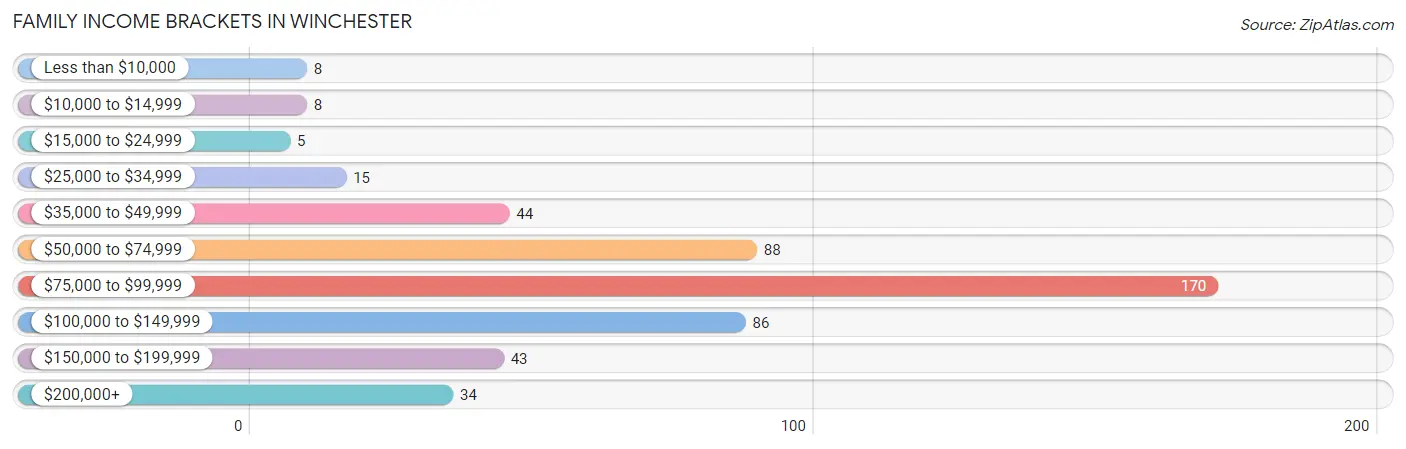
| Income Bracket | # Families | % Families |
| Less than $10,000 | 8 | 1.6% |
| $10,000 to $14,999 | 8 | 1.6% |
| $15,000 to $24,999 | 5 | 1.0% |
| $25,000 to $34,999 | 15 | 3.0% |
| $35,000 to $49,999 | 44 | 8.8% |
| $50,000 to $74,999 | 88 | 17.6% |
| $75,000 to $99,999 | 170 | 33.9% |
| $100,000 to $149,999 | 86 | 17.2% |
| $150,000 to $199,999 | 43 | 8.6% |
| $200,000+ | 34 | 6.8% |
Family Income by Famaliy Size in Winchester
5-person families (29 | 5.8%) account for the highest median family income in Winchester with $141,307 per family, while 3-person families (115 | 23.0%) have the highest median income of $34,534 per family member.
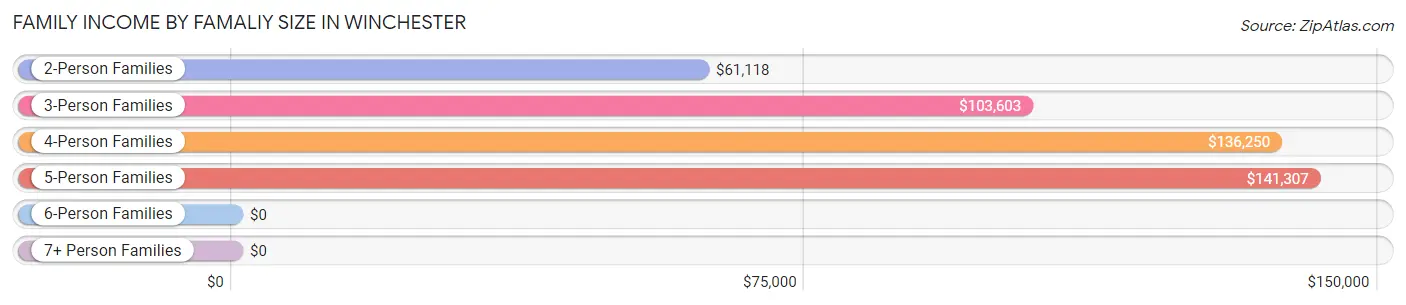
| Income Bracket | # Families | Median Income |
| 2-Person Families | 193 (38.5%) | $61,118 |
| 3-Person Families | 115 (23.0%) | $103,603 |
| 4-Person Families | 38 (7.6%) | $136,250 |
| 5-Person Families | 29 (5.8%) | $141,307 |
| 6-Person Families | 21 (4.2%) | $0 |
| 7+ Person Families | 105 (21.0%) | $0 |
| Total | 501 (100.0%) | $86,063 |
Family Income by Number of Earners in Winchester
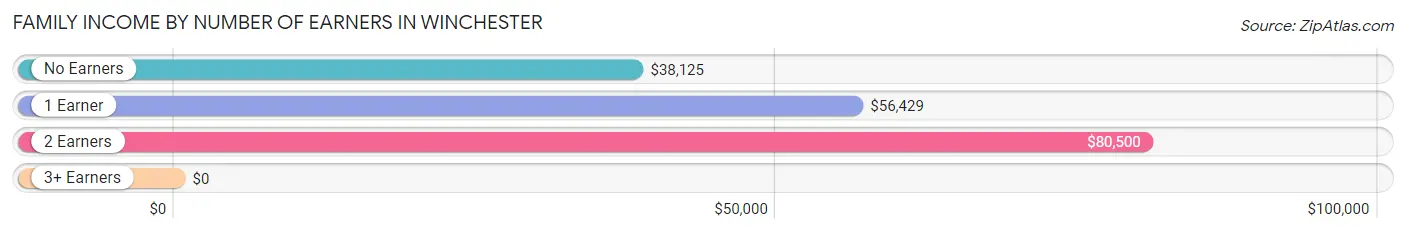
| Number of Earners | # Families | Median Income |
| No Earners | 36 (7.2%) | $38,125 |
| 1 Earner | 84 (16.8%) | $56,429 |
| 2 Earners | 174 (34.7%) | $80,500 |
| 3+ Earners | 207 (41.3%) | $0 |
| Total | 501 (100.0%) | $86,063 |
Household Income in Winchester
Household Income Brackets in Winchester
With 203 households falling in the category, the $75,000 to $99,999 income range is the most frequent in Winchester, accounting for 29.0% of all households.
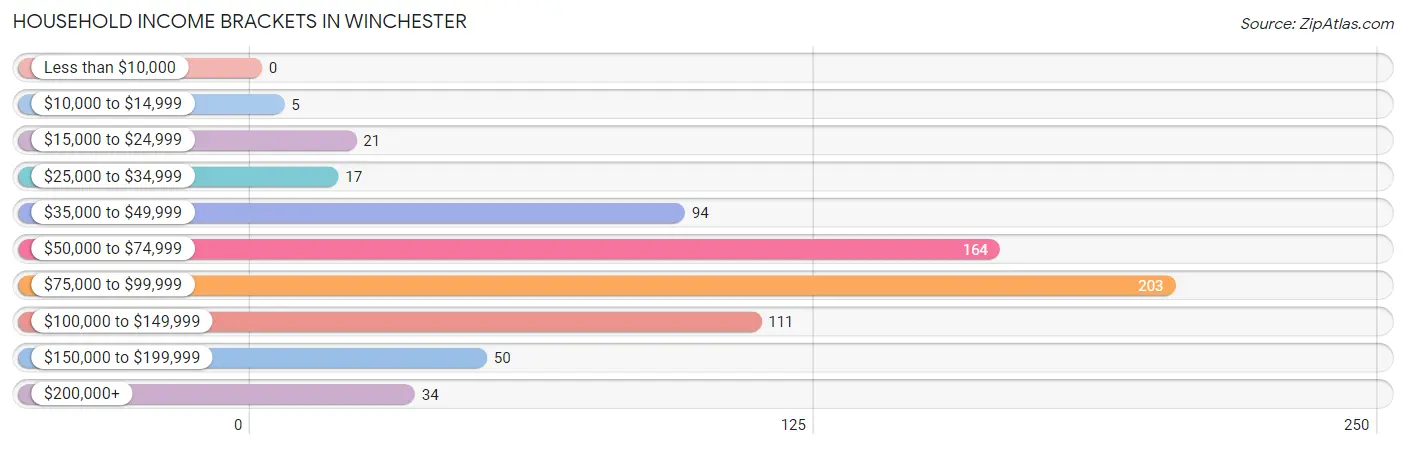
| Income Bracket | # Households | % Households |
| Less than $10,000 | 0 | 0.0% |
| $10,000 to $14,999 | 5 | 0.7% |
| $15,000 to $24,999 | 21 | 3.0% |
| $25,000 to $34,999 | 17 | 2.4% |
| $35,000 to $49,999 | 94 | 13.4% |
| $50,000 to $74,999 | 164 | 23.5% |
| $75,000 to $99,999 | 203 | 29.0% |
| $100,000 to $149,999 | 111 | 15.9% |
| $150,000 to $199,999 | 50 | 7.2% |
| $200,000+ | 34 | 4.9% |
Household Income by Householder Age in Winchester
The median household income in Winchester is $82,163, with the highest median household income of $86,127 found in the 25 to 44 years age bracket for the primary householder. A total of 220 households (31.5%) fall into this category. Meanwhile, the 15 to 24 years age bracket for the primary householder has the lowest median household income of $56,953, with 41 households (5.9%) in this group.
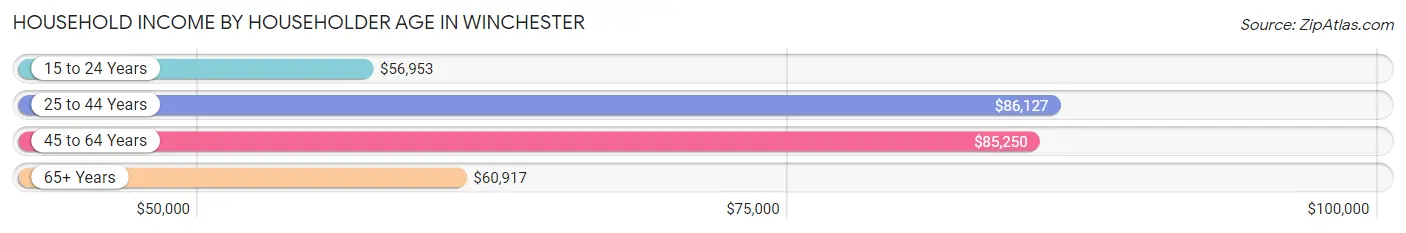
| Income Bracket | # Households | Median Income |
| 15 to 24 Years | 41 (5.9%) | $56,953 |
| 25 to 44 Years | 220 (31.5%) | $86,127 |
| 45 to 64 Years | 303 (43.3%) | $85,250 |
| 65+ Years | 135 (19.3%) | $60,917 |
| Total | 699 (100.0%) | $82,163 |
Poverty in Winchester
Income Below Poverty by Sex and Age in Winchester
With 1.6% poverty level for males and 6.4% for females among the residents of Winchester, under 5 year old males and 5 year old females are the most vulnerable to poverty, with 9 males (52.9%) and 3 females (100.0%) in their respective age groups living below the poverty level.
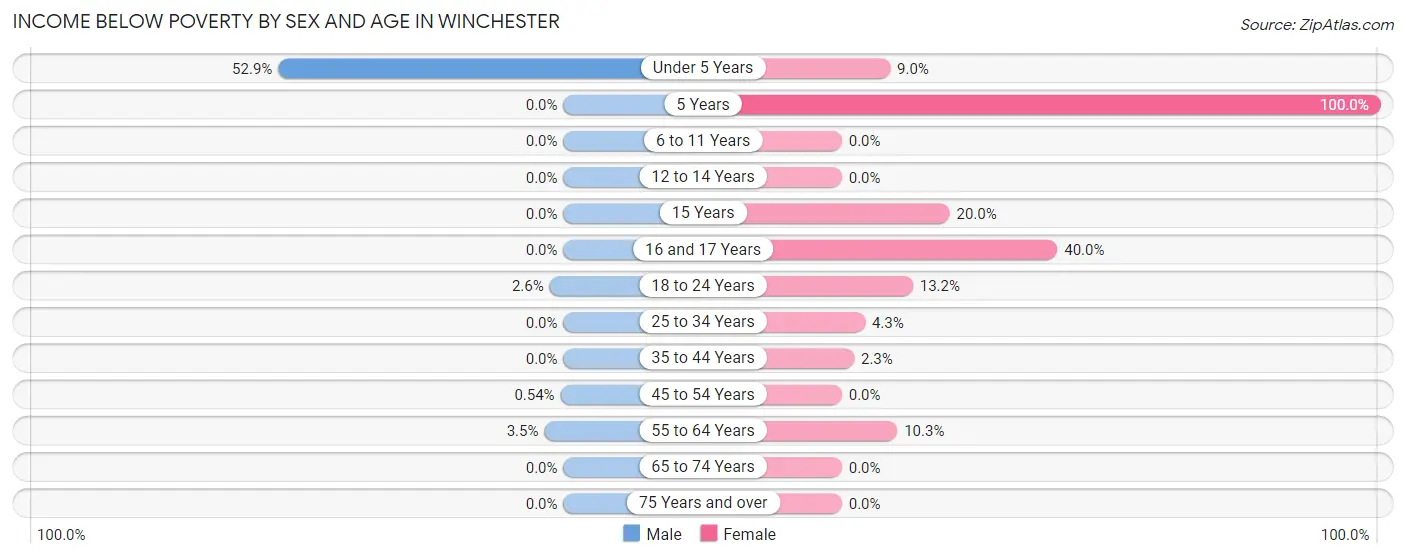
| Age Bracket | Male | Female |
| Under 5 Years | 9 (52.9%) | 7 (9.0%) |
| 5 Years | 0 (0.0%) | 3 (100.0%) |
| 6 to 11 Years | 0 (0.0%) | 0 (0.0%) |
| 12 to 14 Years | 0 (0.0%) | 0 (0.0%) |
| 15 Years | 0 (0.0%) | 1 (20.0%) |
| 16 and 17 Years | 0 (0.0%) | 2 (40.0%) |
| 18 to 24 Years | 4 (2.6%) | 29 (13.2%) |
| 25 to 34 Years | 0 (0.0%) | 4 (4.3%) |
| 35 to 44 Years | 0 (0.0%) | 3 (2.3%) |
| 45 to 54 Years | 1 (0.5%) | 0 (0.0%) |
| 55 to 64 Years | 3 (3.5%) | 7 (10.3%) |
| 65 to 74 Years | 0 (0.0%) | 0 (0.0%) |
| 75 Years and over | 0 (0.0%) | 0 (0.0%) |
| Total | 17 (1.6%) | 56 (6.4%) |
Income Above Poverty by Sex and Age in Winchester
According to the poverty statistics in Winchester, males aged 5 years and females aged 6 to 11 years are the age groups that are most secure financially, with 100.0% of males and 100.0% of females in these age groups living above the poverty line.
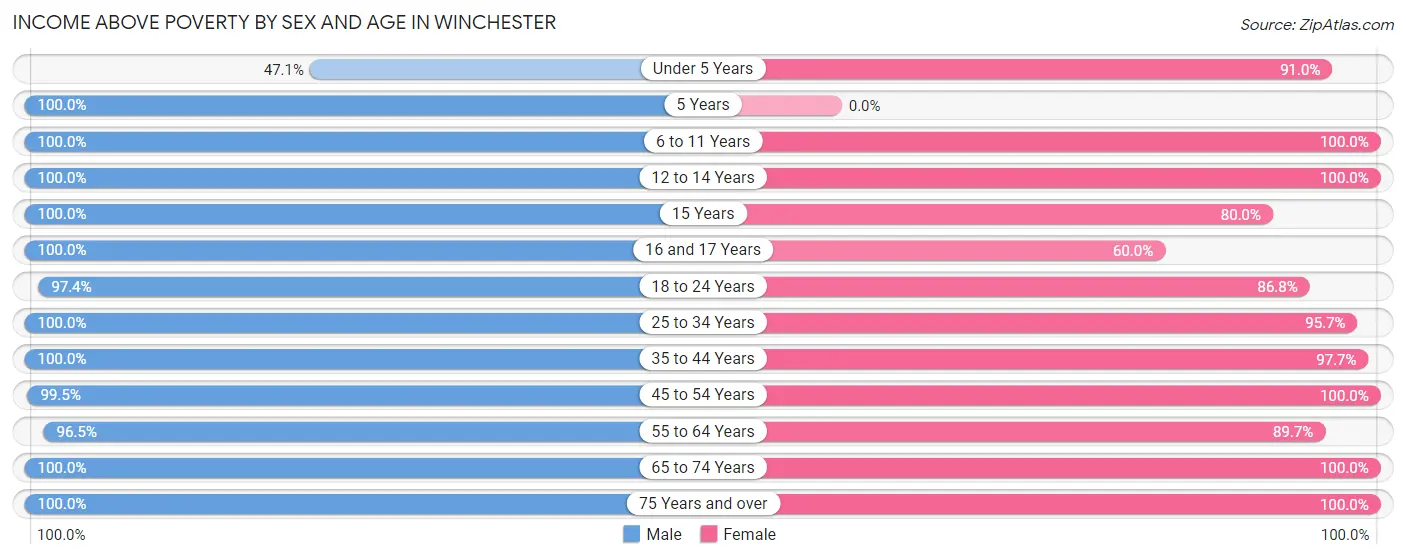
| Age Bracket | Male | Female |
| Under 5 Years | 8 (47.1%) | 71 (91.0%) |
| 5 Years | 14 (100.0%) | 0 (0.0%) |
| 6 to 11 Years | 115 (100.0%) | 15 (100.0%) |
| 12 to 14 Years | 31 (100.0%) | 4 (100.0%) |
| 15 Years | 50 (100.0%) | 4 (80.0%) |
| 16 and 17 Years | 57 (100.0%) | 3 (60.0%) |
| 18 to 24 Years | 152 (97.4%) | 191 (86.8%) |
| 25 to 34 Years | 90 (100.0%) | 89 (95.7%) |
| 35 to 44 Years | 158 (100.0%) | 129 (97.7%) |
| 45 to 54 Years | 184 (99.5%) | 138 (100.0%) |
| 55 to 64 Years | 82 (96.5%) | 61 (89.7%) |
| 65 to 74 Years | 38 (100.0%) | 63 (100.0%) |
| 75 Years and over | 42 (100.0%) | 45 (100.0%) |
| Total | 1,021 (98.4%) | 813 (93.6%) |
Income Below Poverty Among Married-Couple Families in Winchester
The poverty statistics for married-couple families in Winchester show that 0.8% or 3 of the total 378 families live below the poverty line. Families with no children have the highest poverty rate of 1.5%, comprising of 3 families. On the other hand, families with 1 or 2 children have the lowest poverty rate of 0.0%, which includes 0 families.
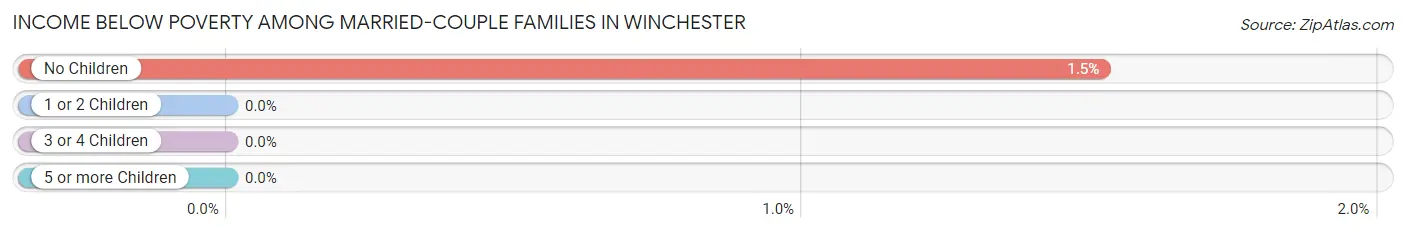
| Children | Above Poverty | Below Poverty |
| No Children | 194 (98.5%) | 3 (1.5%) |
| 1 or 2 Children | 56 (100.0%) | 0 (0.0%) |
| 3 or 4 Children | 122 (100.0%) | 0 (0.0%) |
| 5 or more Children | 3 (100.0%) | 0 (0.0%) |
| Total | 375 (99.2%) | 3 (0.8%) |
Income Below Poverty Among Single-Parent Households in Winchester
According to the poverty data in Winchester, 8.9% or 4 single-father households and 15.4% or 12 single-mother households are living below the poverty line. Among single-father households, those with 1 or 2 children have the highest poverty rate, with 4 households (44.4%) experiencing poverty. Likewise, among single-mother households, those with 3 or 4 children have the highest poverty rate, with 4 households (100.0%) falling below the poverty line.
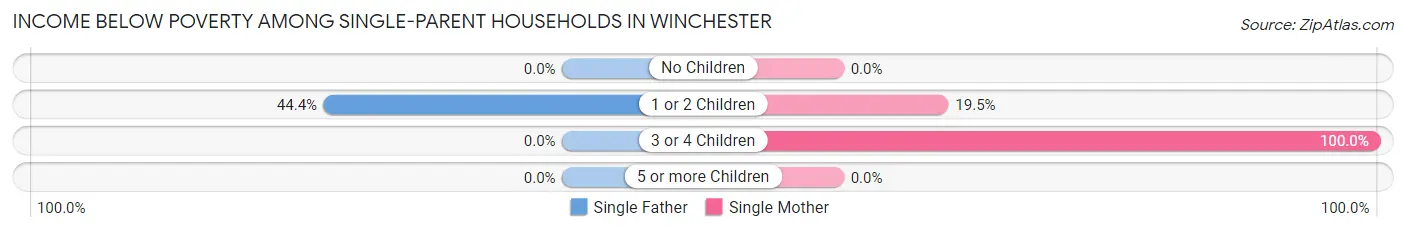
| Children | Single Father | Single Mother |
| No Children | 0 (0.0%) | 0 (0.0%) |
| 1 or 2 Children | 4 (44.4%) | 8 (19.5%) |
| 3 or 4 Children | 0 (0.0%) | 4 (100.0%) |
| 5 or more Children | 0 (0.0%) | 0 (0.0%) |
| Total | 4 (8.9%) | 12 (15.4%) |
Income Below Poverty Among Married-Couple vs Single-Parent Households in Winchester
The poverty data for Winchester shows that 3 of the married-couple family households (0.8%) and 16 of the single-parent households (13.0%) are living below the poverty level. Within the married-couple family households, those with no children have the highest poverty rate, with 3 households (1.5%) falling below the poverty line. Among the single-parent households, those with 3 or 4 children have the highest poverty rate, with 4 household (100.0%) living below poverty.
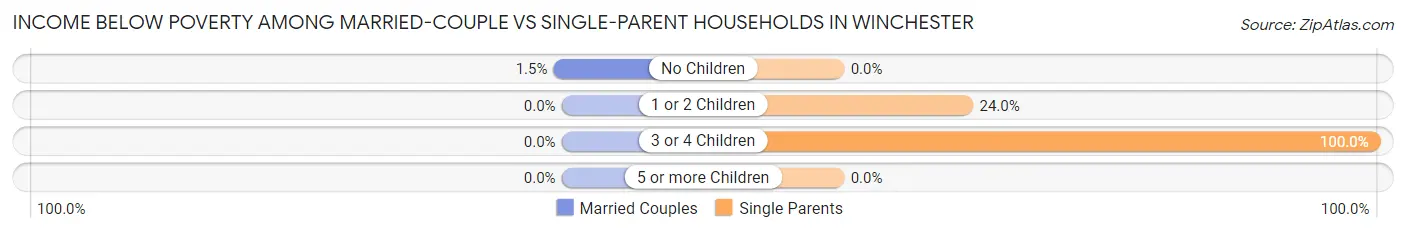
| Children | Married-Couple Families | Single-Parent Households |
| No Children | 3 (1.5%) | 0 (0.0%) |
| 1 or 2 Children | 0 (0.0%) | 12 (24.0%) |
| 3 or 4 Children | 0 (0.0%) | 4 (100.0%) |
| 5 or more Children | 0 (0.0%) | 0 (0.0%) |
| Total | 3 (0.8%) | 16 (13.0%) |
Race in Winchester
The most populous races in Winchester are White / Caucasian (1,143 | 57.8%), Two or more Races (711 | 36.0%), and Hispanic or Latino (511 | 25.9%).
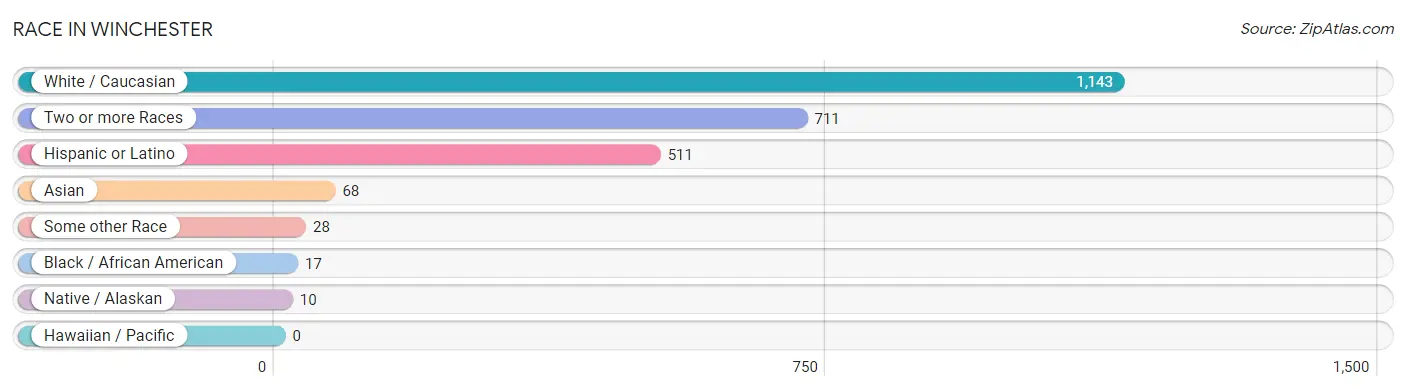
| Race | # Population | % Population |
| Asian | 68 | 3.4% |
| Black / African American | 17 | 0.9% |
| Hawaiian / Pacific | 0 | 0.0% |
| Hispanic or Latino | 511 | 25.9% |
| Native / Alaskan | 10 | 0.5% |
| White / Caucasian | 1,143 | 57.8% |
| Two or more Races | 711 | 36.0% |
| Some other Race | 28 | 1.4% |
| Total | 1,977 | 100.0% |
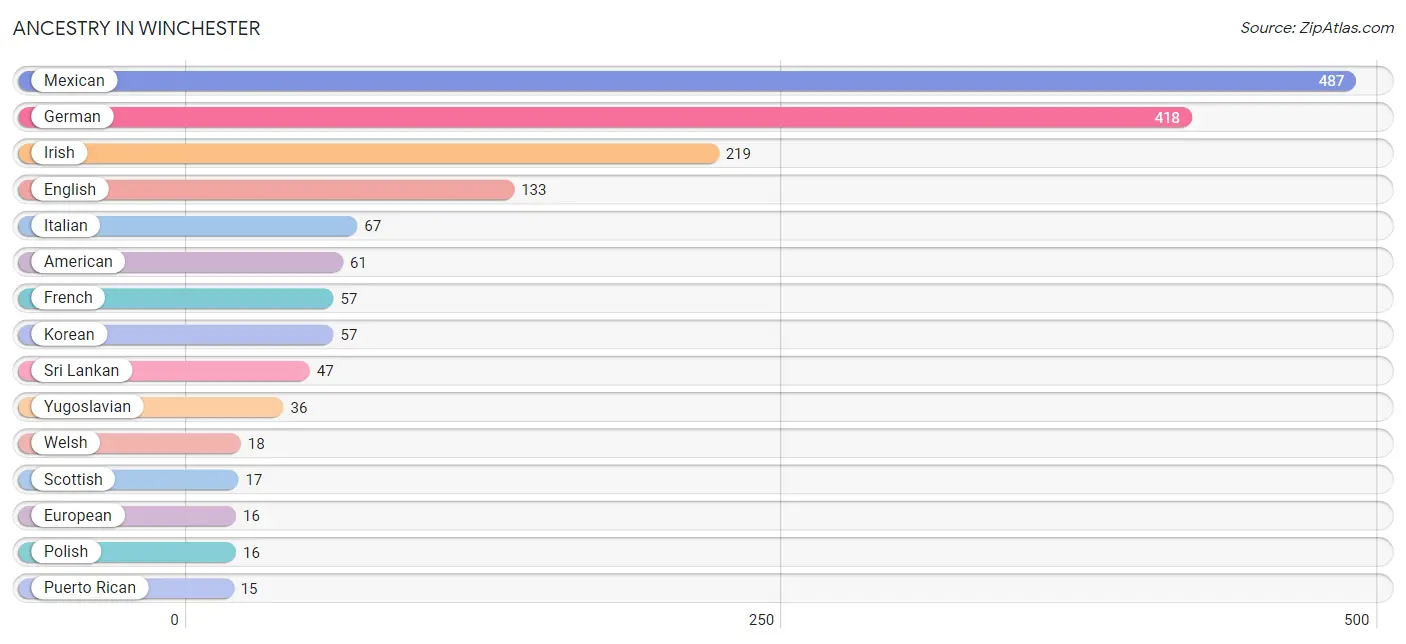
Ancestry in Winchester
The most populous ancestries reported in Winchester are Mexican (487 | 24.6%), German (418 | 21.1%), Irish (219 | 11.1%), English (133 | 6.7%), and Italian (67 | 3.4%), together accounting for 67.0% of all Winchester residents.
| Ancestry | # Population | % Population |
| African | 8 | 0.4% |
| American | 61 | 3.1% |
| Arab | 3 | 0.2% |
| Austrian | 3 | 0.2% |
| Bhutanese | 4 | 0.2% |
| British | 5 | 0.3% |
| Central American | 9 | 0.5% |
| Croatian | 2 | 0.1% |
| Czech | 7 | 0.4% |
| Dutch | 9 | 0.5% |
| Egyptian | 3 | 0.2% |
| English | 133 | 6.7% |
| European | 16 | 0.8% |
| French | 57 | 2.9% |
| German | 418 | 21.1% |
| Guatemalan | 9 | 0.5% |
| Hungarian | 3 | 0.2% |
| Indian (Asian) | 5 | 0.3% |
| Irish | 219 | 11.1% |
| Italian | 67 | 3.4% |
| Korean | 57 | 2.9% |
| Macedonian | 9 | 0.5% |
| Mexican | 487 | 24.6% |
| Norwegian | 4 | 0.2% |
| Pakistani | 3 | 0.2% |
| Polish | 16 | 0.8% |
| Potawatomi | 6 | 0.3% |
| Puerto Rican | 15 | 0.8% |
| Romanian | 9 | 0.5% |
| Scotch-Irish | 12 | 0.6% |
| Scottish | 17 | 0.9% |
| Sri Lankan | 47 | 2.4% |
| Subsaharan African | 8 | 0.4% |
| Swedish | 11 | 0.6% |
| Swiss | 7 | 0.4% |
| Welsh | 18 | 0.9% |
| Yugoslavian | 36 | 1.8% | View All 37 Rows |
Immigrants in Winchester
The most numerous immigrant groups reported in Winchester came from Central America (263 | 13.3%), Latin America (263 | 13.3%), Mexico (259 | 13.1%), Asia (68 | 3.4%), and South Eastern Asia (68 | 3.4%), together accounting for 46.6% of all Winchester residents.
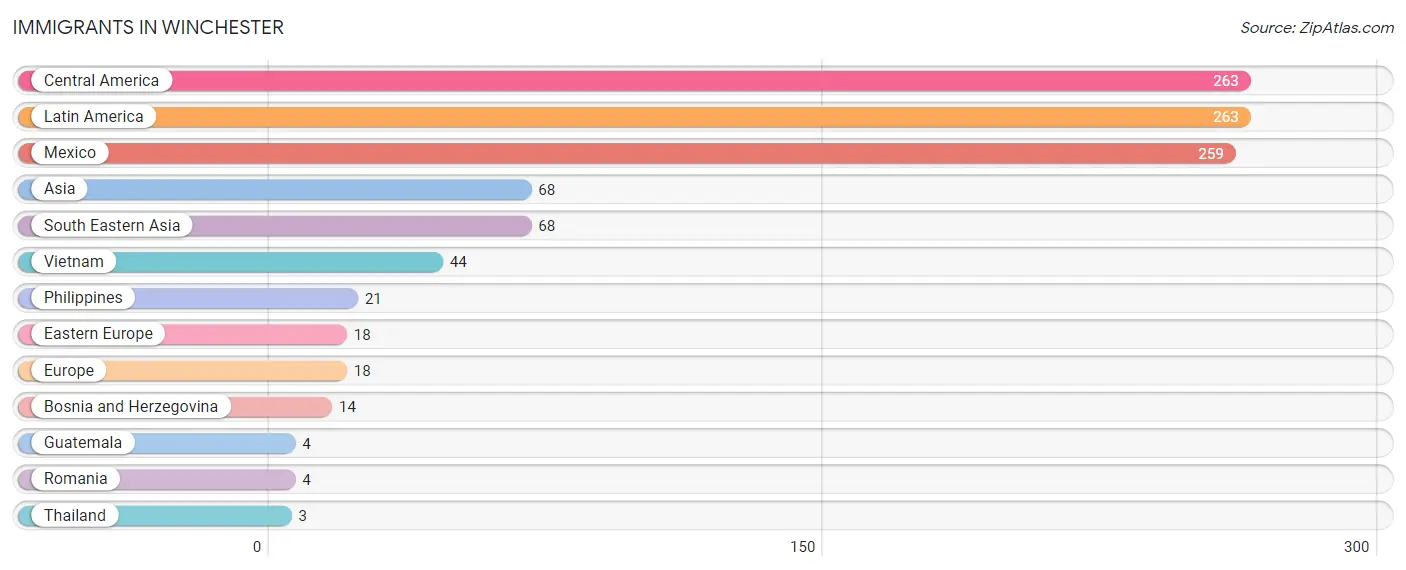
| Immigration Origin | # Population | % Population |
| Asia | 68 | 3.4% |
| Bosnia and Herzegovina | 14 | 0.7% |
| Central America | 263 | 13.3% |
| Eastern Europe | 18 | 0.9% |
| Europe | 18 | 0.9% |
| Guatemala | 4 | 0.2% |
| Latin America | 263 | 13.3% |
| Mexico | 259 | 13.1% |
| Philippines | 21 | 1.1% |
| Romania | 4 | 0.2% |
| South Eastern Asia | 68 | 3.4% |
| Thailand | 3 | 0.2% |
| Vietnam | 44 | 2.2% | View All 13 Rows |
Sex and Age in Winchester
Sex and Age in Winchester
The most populous age groups in Winchester are 15 to 19 Years (161 | 15.3%) for men and 20 to 24 Years (190 | 20.6%) for women.
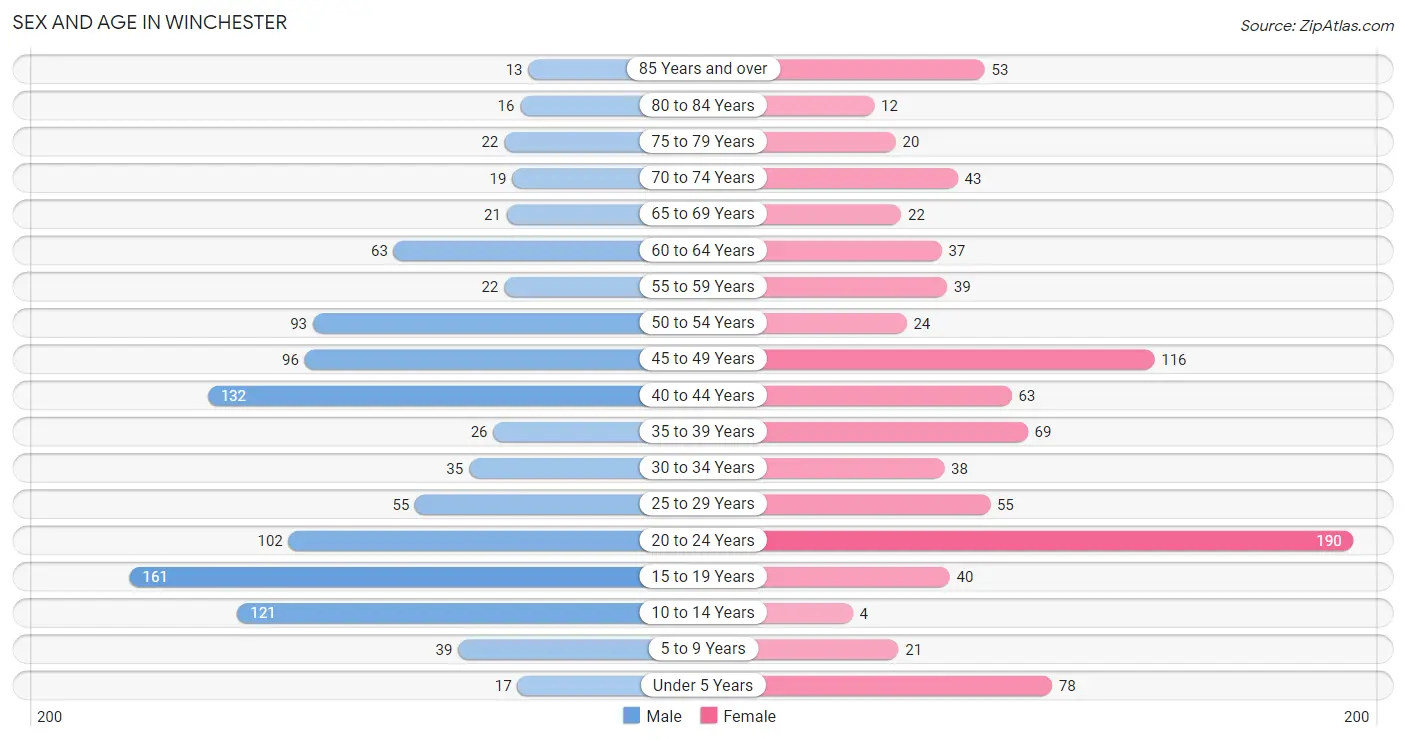
| Age Bracket | Male | Female |
| Under 5 Years | 17 (1.6%) | 78 (8.4%) |
| 5 to 9 Years | 39 (3.7%) | 21 (2.3%) |
| 10 to 14 Years | 121 (11.5%) | 4 (0.4%) |
| 15 to 19 Years | 161 (15.3%) | 40 (4.3%) |
| 20 to 24 Years | 102 (9.7%) | 190 (20.6%) |
| 25 to 29 Years | 55 (5.2%) | 55 (5.9%) |
| 30 to 34 Years | 35 (3.3%) | 38 (4.1%) |
| 35 to 39 Years | 26 (2.5%) | 69 (7.5%) |
| 40 to 44 Years | 132 (12.5%) | 63 (6.8%) |
| 45 to 49 Years | 96 (9.1%) | 116 (12.6%) |
| 50 to 54 Years | 93 (8.8%) | 24 (2.6%) |
| 55 to 59 Years | 22 (2.1%) | 39 (4.2%) |
| 60 to 64 Years | 63 (6.0%) | 37 (4.0%) |
| 65 to 69 Years | 21 (2.0%) | 22 (2.4%) |
| 70 to 74 Years | 19 (1.8%) | 43 (4.6%) |
| 75 to 79 Years | 22 (2.1%) | 20 (2.2%) |
| 80 to 84 Years | 16 (1.5%) | 12 (1.3%) |
| 85 Years and over | 13 (1.2%) | 53 (5.7%) |
| Total | 1,053 (100.0%) | 924 (100.0%) |
Families and Households in Winchester
Median Family Size in Winchester
The median family size in Winchester is 3.24 persons per family, with married-couple families (378 | 75.4%) accounting for the largest median family size of 3.39 persons per family. On the other hand, single female/mother families (78 | 15.6%) represent the smallest median family size with 2.47 persons per family.
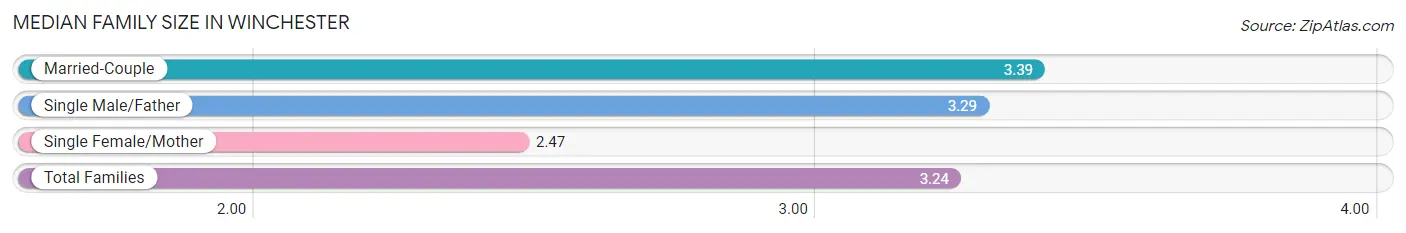
| Family Type | # Families | Family Size |
| Married-Couple | 378 (75.4%) | 3.39 |
| Single Male/Father | 45 (9.0%) | 3.29 |
| Single Female/Mother | 78 (15.6%) | 2.47 |
| Total Families | 501 (100.0%) | 3.24 |
Median Household Size in Winchester
The median household size in Winchester is 2.73 persons per household, with single male/father households (45 | 6.4%) accounting for the largest median household size of 3.6 persons per household. non-family households (198 | 28.3%) represent the smallest median household size with 1.10 persons per household.
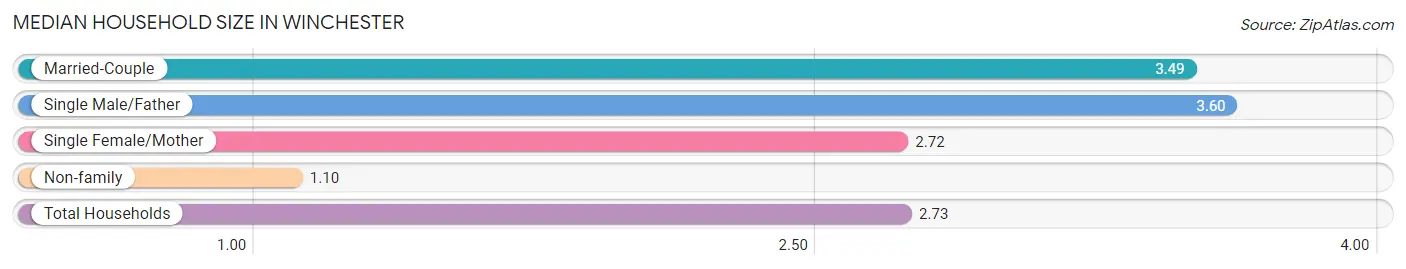
| Household Type | # Households | Household Size |
| Married-Couple | 378 (54.1%) | 3.49 |
| Single Male/Father | 45 (6.4%) | 3.60 |
| Single Female/Mother | 78 (11.2%) | 2.72 |
| Non-family | 198 (28.3%) | 1.10 |
| Total Households | 699 (100.0%) | 2.73 |
Household Size by Marriage Status in Winchester
Out of a total of 699 households in Winchester, 501 (71.7%) are family households, while 198 (28.3%) are nonfamily households. The most numerous type of family households are 2-person households, comprising 173, and the most common type of nonfamily households are 1-person households, comprising 178.
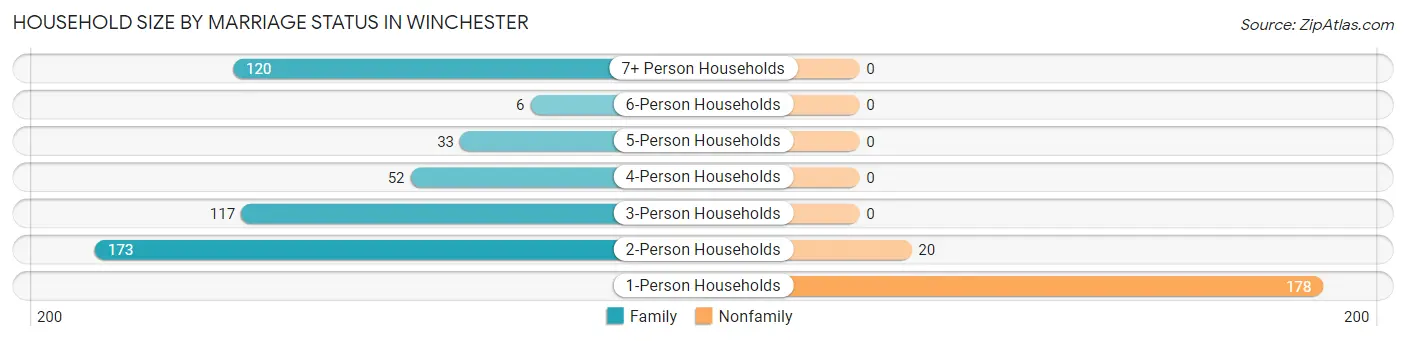
| Household Size | Family Households | Nonfamily Households |
| 1-Person Households | - | 178 (25.5%) |
| 2-Person Households | 173 (24.7%) | 20 (2.9%) |
| 3-Person Households | 117 (16.7%) | 0 (0.0%) |
| 4-Person Households | 52 (7.4%) | 0 (0.0%) |
| 5-Person Households | 33 (4.7%) | 0 (0.0%) |
| 6-Person Households | 6 (0.9%) | 0 (0.0%) |
| 7+ Person Households | 120 (17.2%) | 0 (0.0%) |
| Total | 501 (71.7%) | 198 (28.3%) |
Female Fertility in Winchester
Fertility by Age in Winchester
Average fertility rate in Winchester is 35.0 births per 1,000 women. Women in the age bracket of 20 to 34 years have the highest fertility rate with 71.0 births per 1,000 women. Women in the age bracket of 20 to 34 years acount for 100.0% of all women with births.
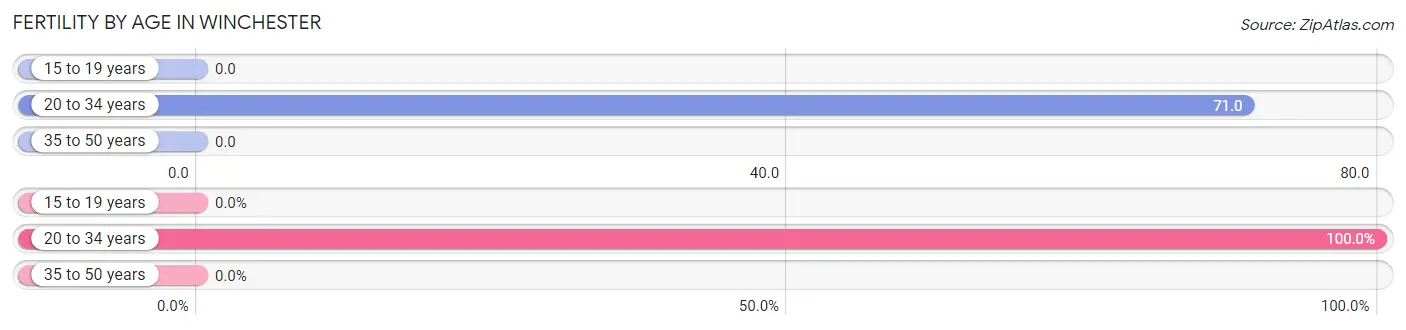
| Age Bracket | Women with Births | Births / 1,000 Women |
| 15 to 19 years | 0 (0.0%) | 0.0 |
| 20 to 34 years | 20 (100.0%) | 71.0 |
| 35 to 50 years | 0 (0.0%) | 0.0 |
| Total | 20 (100.0%) | 35.0 |
Fertility by Age by Marriage Status in Winchester
60.0% of women with births (20) in Winchester are married. The highest percentage of unmarried women with births falls into 20 to 34 years age bracket with 40.0% of them unmarried at the time of birth, while the lowest percentage of unmarried women with births belong to 20 to 34 years age bracket with 40.0% of them unmarried.
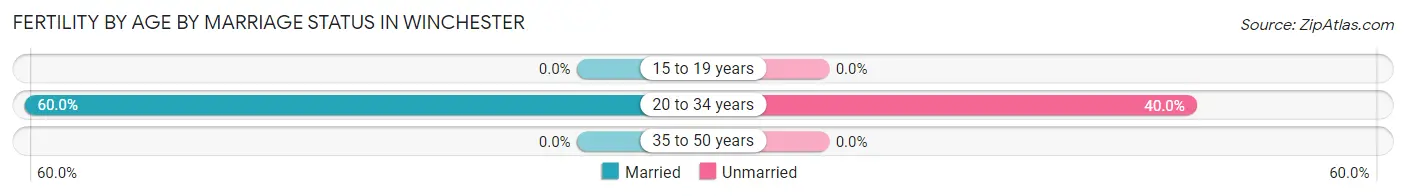
| Age Bracket | Married | Unmarried |
| 15 to 19 years | 0 (0.0%) | 0 (0.0%) |
| 20 to 34 years | 12 (60.0%) | 8 (40.0%) |
| 35 to 50 years | 0 (0.0%) | 0 (0.0%) |
| Total | 12 (60.0%) | 8 (40.0%) |
Fertility by Education in Winchester
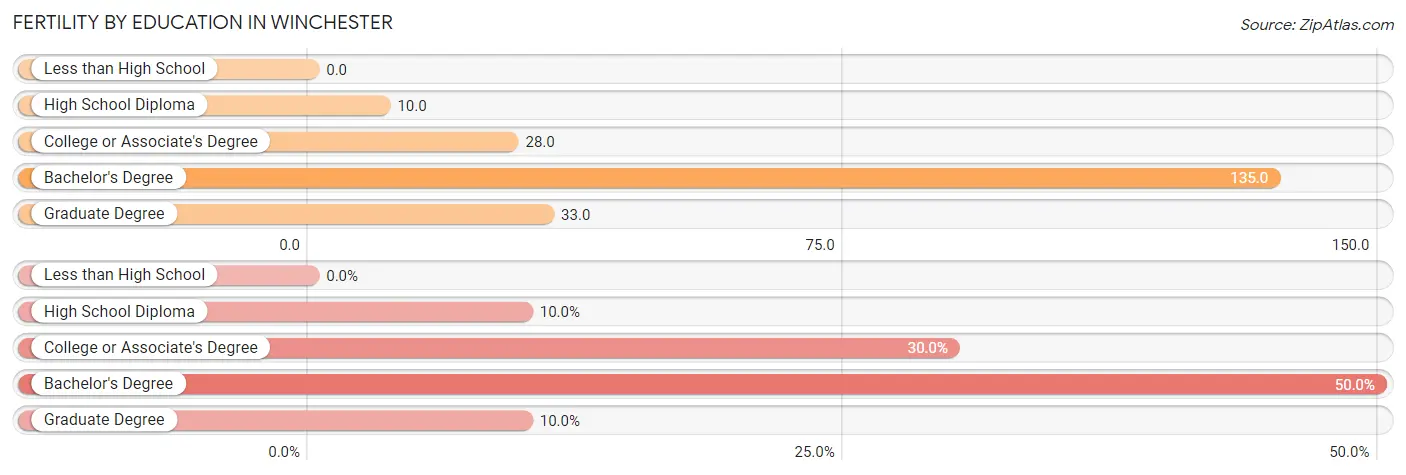
| Educational Attainment | Women with Births | Births / 1,000 Women |
| Less than High School | 0 (0.0%) | 0.0 |
| High School Diploma | 2 (10.0%) | 10.0 |
| College or Associate's Degree | 6 (30.0%) | 28.0 |
| Bachelor's Degree | 10 (50.0%) | 135.0 |
| Graduate Degree | 2 (10.0%) | 33.0 |
| Total | 20 (100.0%) | 35.0 |
Fertility by Education by Marriage Status in Winchester
40.0% of women with births in Winchester are unmarried. Women with the educational attainment of high school diploma are most likely to be married with 100.0% of them married at childbirth, while women with the educational attainment of college or associate's degree are least likely to be married with 66.7% of them unmarried at childbirth.
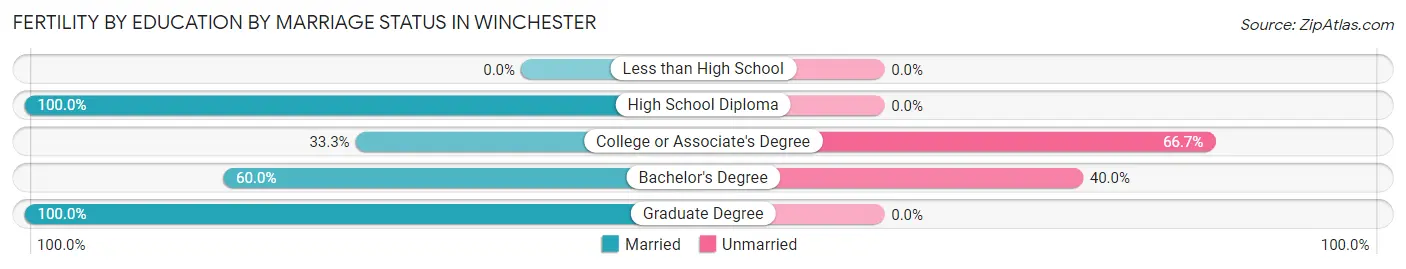
| Educational Attainment | Married | Unmarried |
| Less than High School | 0 (0.0%) | 0 (0.0%) |
| High School Diploma | 2 (100.0%) | 0 (0.0%) |
| College or Associate's Degree | 2 (33.3%) | 4 (66.7%) |
| Bachelor's Degree | 6 (60.0%) | 4 (40.0%) |
| Graduate Degree | 2 (100.0%) | 0 (0.0%) |
| Total | 12 (60.0%) | 8 (40.0%) |
Employment Characteristics in Winchester
Employment by Class of Employer in Winchester
Among the 1,222 employed individuals in Winchester, private company employees (976 | 79.9%), not-for-profit organizations (110 | 9.0%), and local government employees (46 | 3.8%) make up the most common classes of employment.
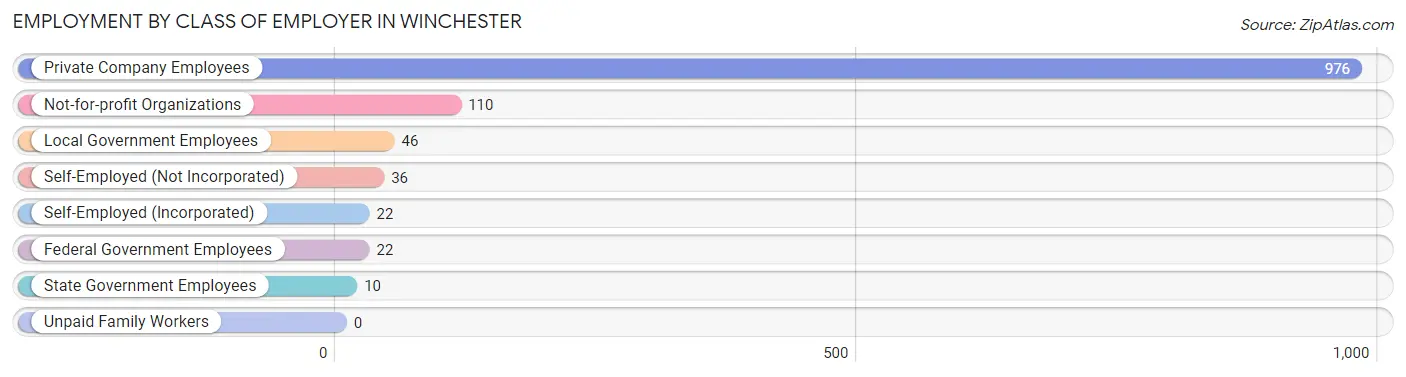
| Employer Class | # Employees | % Employees |
| Private Company Employees | 976 | 79.9% |
| Self-Employed (Incorporated) | 22 | 1.8% |
| Self-Employed (Not Incorporated) | 36 | 2.9% |
| Not-for-profit Organizations | 110 | 9.0% |
| Local Government Employees | 46 | 3.8% |
| State Government Employees | 10 | 0.8% |
| Federal Government Employees | 22 | 1.8% |
| Unpaid Family Workers | 0 | 0.0% |
| Total | 1,222 | 100.0% |
Employment Status by Age in Winchester
According to the labor force statistics for Winchester, out of the total population over 16 years of age (1,642), 77.0% or 1,264 individuals are in the labor force, with 3.1% or 39 of them unemployed. The age group with the highest labor force participation rate is 30 to 34 years, with 100.0% or 73 individuals in the labor force. Within the labor force, the 75 years and over age range has the highest percentage of unemployed individuals, with 20.0% or 3 of them being unemployed.
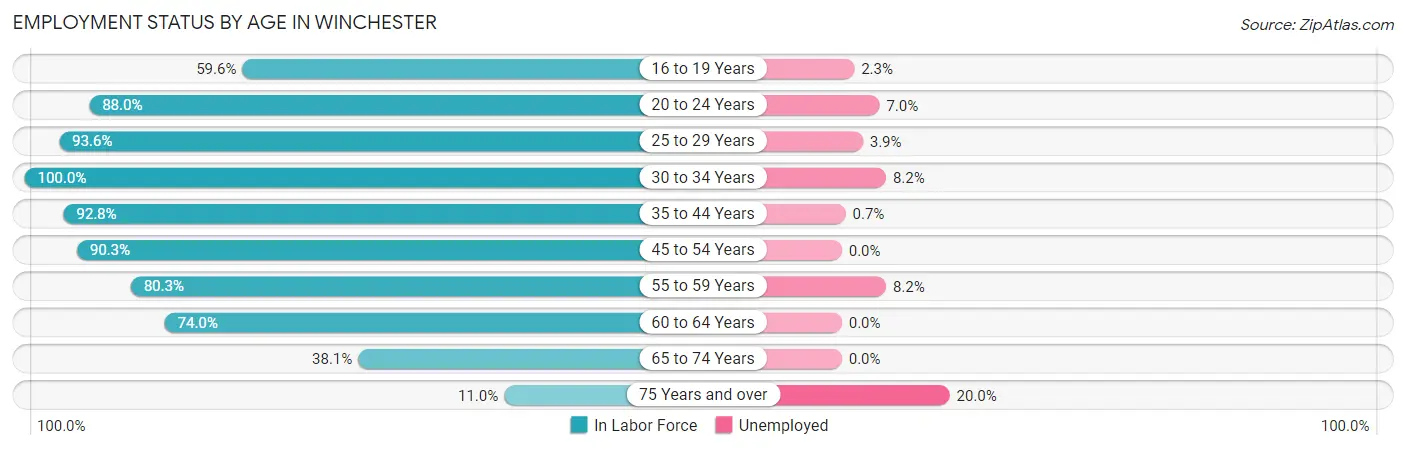
| Age Bracket | In Labor Force | Unemployed |
| 16 to 19 Years | 87 (59.6%) | 2 (2.3%) |
| 20 to 24 Years | 257 (88.0%) | 18 (7.0%) |
| 25 to 29 Years | 103 (93.6%) | 4 (3.9%) |
| 30 to 34 Years | 73 (100.0%) | 6 (8.2%) |
| 35 to 44 Years | 269 (92.8%) | 2 (0.7%) |
| 45 to 54 Years | 297 (90.3%) | 0 (0.0%) |
| 55 to 59 Years | 49 (80.3%) | 4 (8.2%) |
| 60 to 64 Years | 74 (74.0%) | 0 (0.0%) |
| 65 to 74 Years | 40 (38.1%) | 0 (0.0%) |
| 75 Years and over | 15 (11.0%) | 3 (20.0%) |
| Total | 1,264 (77.0%) | 39 (3.1%) |
Employment Status by Educational Attainment in Winchester
According to labor force statistics for Winchester, 89.8% of individuals (865) out of the total population between 25 and 64 years of age (963) are in the labor force, with 1.9% or 16 of them being unemployed. The group with the highest labor force participation rate are those with the educational attainment of bachelor's degree or higher, with 97.7% or 217 individuals in the labor force. Within the labor force, individuals with less than high school education have the highest percentage of unemployment, with 6.1% or 4 of them being unemployed.
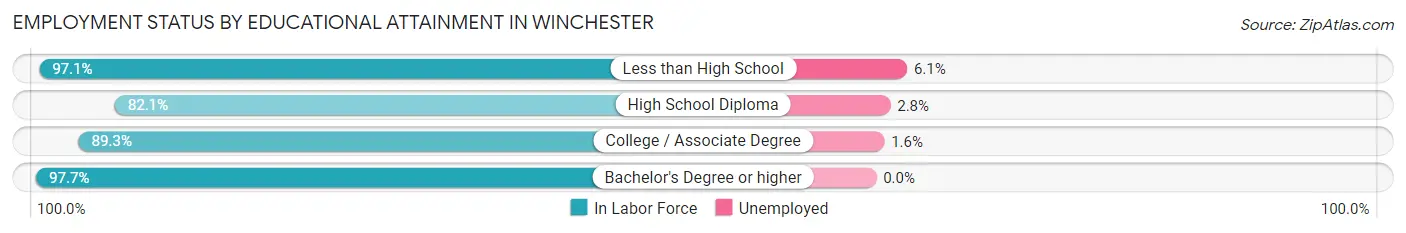
| Educational Attainment | In Labor Force | Unemployed |
| Less than High School | 66 (97.1%) | 4 (6.1%) |
| High School Diploma | 215 (82.1%) | 7 (2.8%) |
| College / Associate Degree | 367 (89.3%) | 7 (1.6%) |
| Bachelor's Degree or higher | 217 (97.7%) | 0 (0.0%) |
| Total | 865 (89.8%) | 18 (1.9%) |
Employment Occupations by Sex in Winchester
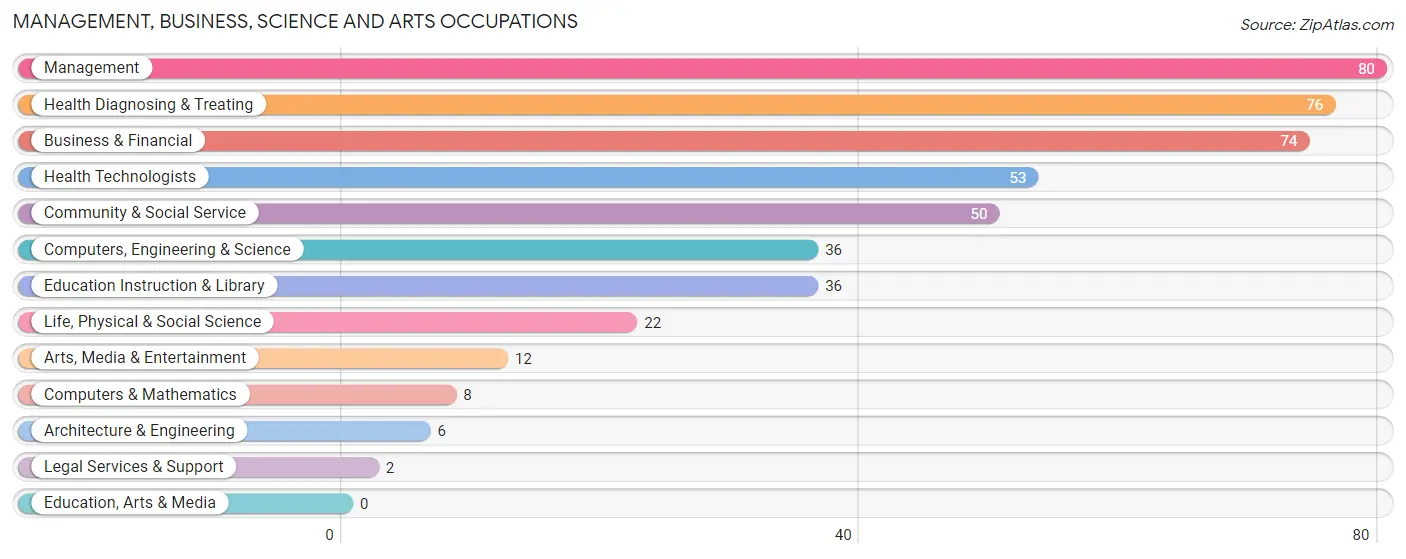
Management, Business, Science and Arts Occupations
The most common Management, Business, Science and Arts occupations in Winchester are Management (80 | 6.5%), Health Diagnosing & Treating (76 | 6.2%), Business & Financial (74 | 6.0%), Health Technologists (53 | 4.3%), and Community & Social Service (50 | 4.1%).
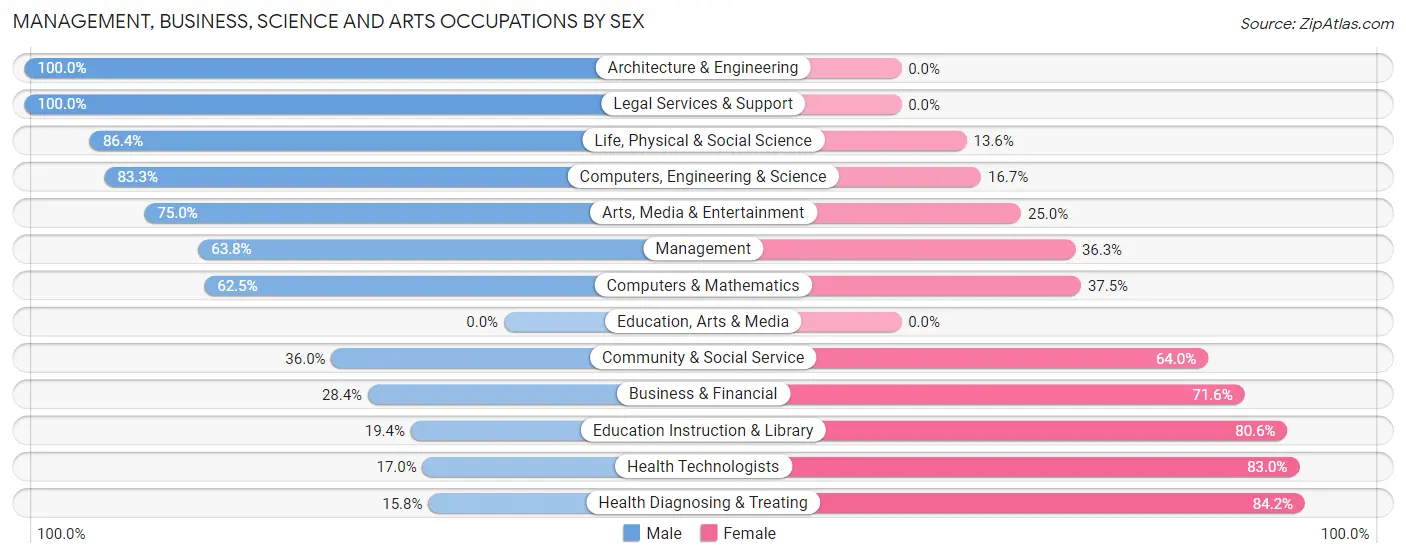
Management, Business, Science and Arts Occupations by Sex
Within the Management, Business, Science and Arts occupations in Winchester, the most male-oriented occupations are Architecture & Engineering (100.0%), Legal Services & Support (100.0%), and Life, Physical & Social Science (86.4%), while the most female-oriented occupations are Health Diagnosing & Treating (84.2%), Health Technologists (83.0%), and Education Instruction & Library (80.6%).
| Occupation | Male | Female |
| Management | 51 (63.7%) | 29 (36.2%) |
| Business & Financial | 21 (28.4%) | 53 (71.6%) |
| Computers, Engineering & Science | 30 (83.3%) | 6 (16.7%) |
| Computers & Mathematics | 5 (62.5%) | 3 (37.5%) |
| Architecture & Engineering | 6 (100.0%) | 0 (0.0%) |
| Life, Physical & Social Science | 19 (86.4%) | 3 (13.6%) |
| Community & Social Service | 18 (36.0%) | 32 (64.0%) |
| Education, Arts & Media | 0 (0.0%) | 0 (0.0%) |
| Legal Services & Support | 2 (100.0%) | 0 (0.0%) |
| Education Instruction & Library | 7 (19.4%) | 29 (80.6%) |
| Arts, Media & Entertainment | 9 (75.0%) | 3 (25.0%) |
| Health Diagnosing & Treating | 12 (15.8%) | 64 (84.2%) |
| Health Technologists | 9 (17.0%) | 44 (83.0%) |
| Total (Category) | 132 (41.8%) | 184 (58.2%) |
| Total (Overall) | 644 (52.7%) | 579 (47.3%) |
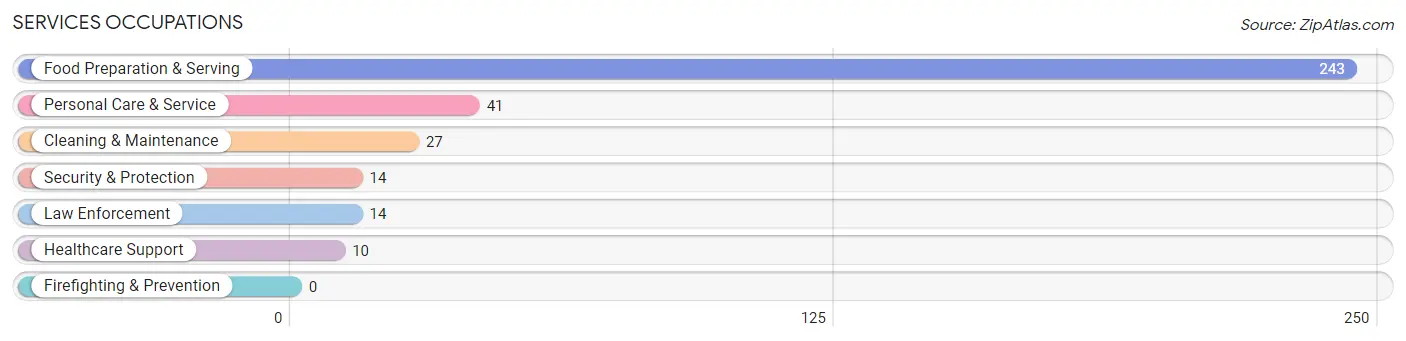
Services Occupations
The most common Services occupations in Winchester are Food Preparation & Serving (243 | 19.9%), Personal Care & Service (41 | 3.4%), Cleaning & Maintenance (27 | 2.2%), Security & Protection (14 | 1.1%), and Law Enforcement (14 | 1.1%).
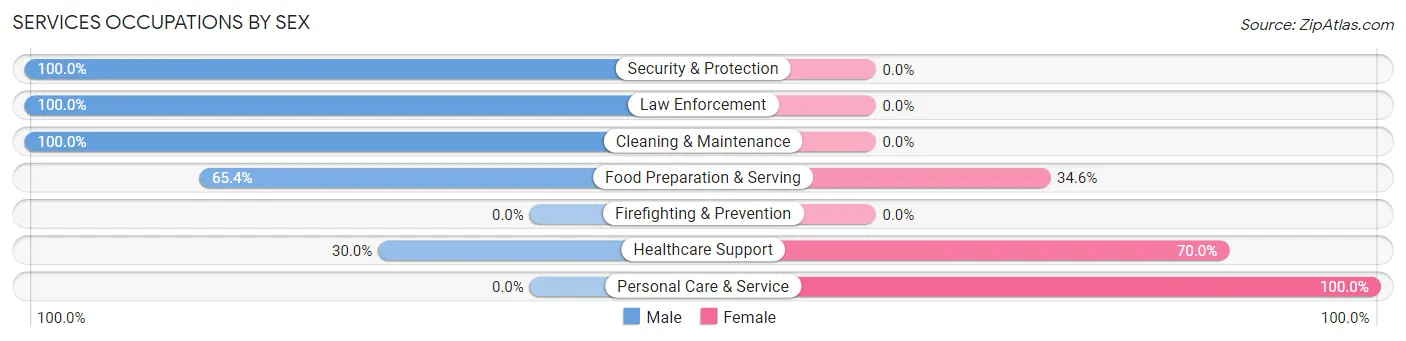
Services Occupations by Sex
Within the Services occupations in Winchester, the most male-oriented occupations are Security & Protection (100.0%), Law Enforcement (100.0%), and Cleaning & Maintenance (100.0%), while the most female-oriented occupations are Personal Care & Service (100.0%), Healthcare Support (70.0%), and Food Preparation & Serving (34.6%).
| Occupation | Male | Female |
| Healthcare Support | 3 (30.0%) | 7 (70.0%) |
| Security & Protection | 14 (100.0%) | 0 (0.0%) |
| Firefighting & Prevention | 0 (0.0%) | 0 (0.0%) |
| Law Enforcement | 14 (100.0%) | 0 (0.0%) |
| Food Preparation & Serving | 159 (65.4%) | 84 (34.6%) |
| Cleaning & Maintenance | 27 (100.0%) | 0 (0.0%) |
| Personal Care & Service | 0 (0.0%) | 41 (100.0%) |
| Total (Category) | 203 (60.6%) | 132 (39.4%) |
| Total (Overall) | 644 (52.7%) | 579 (47.3%) |
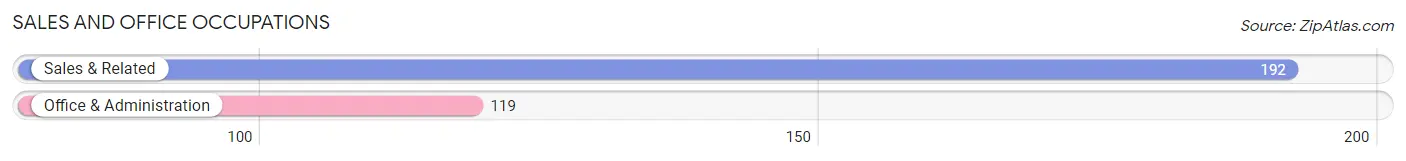
Sales and Office Occupations
The most common Sales and Office occupations in Winchester are Sales & Related (192 | 15.7%), and Office & Administration (119 | 9.7%).
Sales and Office Occupations by Sex
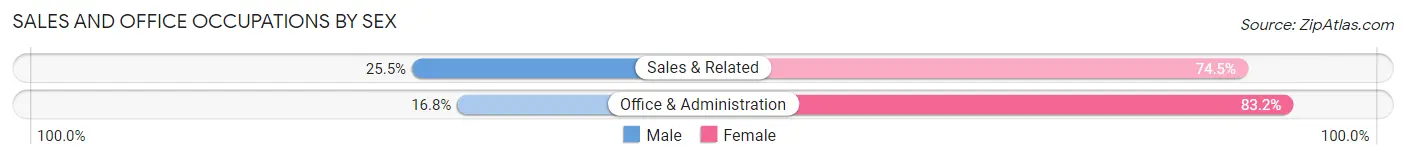
| Occupation | Male | Female |
| Sales & Related | 49 (25.5%) | 143 (74.5%) |
| Office & Administration | 20 (16.8%) | 99 (83.2%) |
| Total (Category) | 69 (22.2%) | 242 (77.8%) |
| Total (Overall) | 644 (52.7%) | 579 (47.3%) |
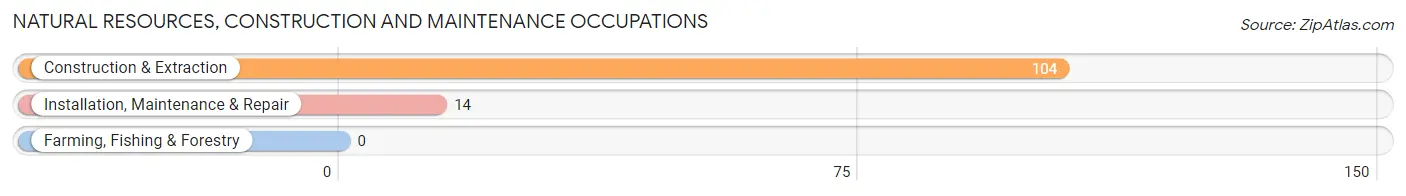
Natural Resources, Construction and Maintenance Occupations
The most common Natural Resources, Construction and Maintenance occupations in Winchester are Construction & Extraction (104 | 8.5%), and Installation, Maintenance & Repair (14 | 1.1%).
Natural Resources, Construction and Maintenance Occupations by Sex
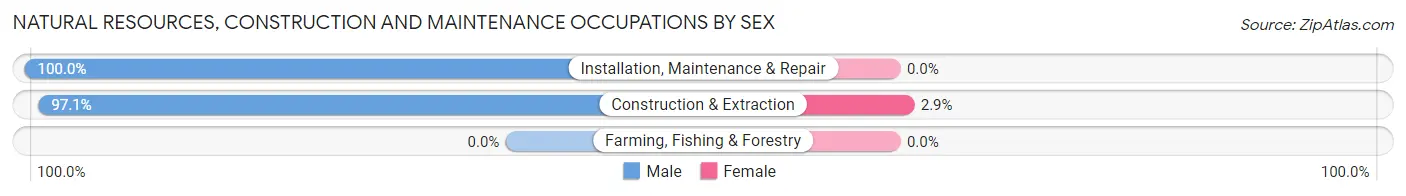
| Occupation | Male | Female |
| Farming, Fishing & Forestry | 0 (0.0%) | 0 (0.0%) |
| Construction & Extraction | 101 (97.1%) | 3 (2.9%) |
| Installation, Maintenance & Repair | 14 (100.0%) | 0 (0.0%) |
| Total (Category) | 115 (97.5%) | 3 (2.5%) |
| Total (Overall) | 644 (52.7%) | 579 (47.3%) |
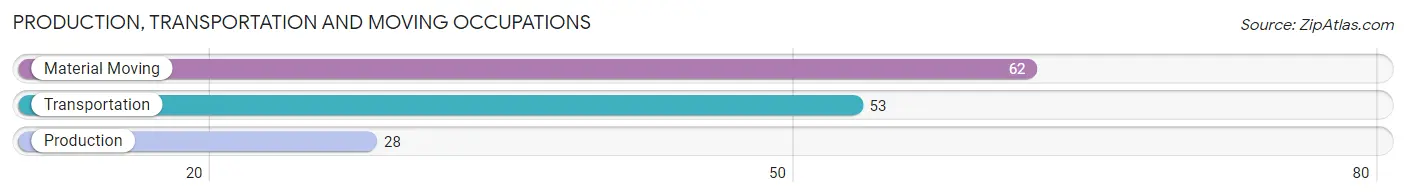
Production, Transportation and Moving Occupations
The most common Production, Transportation and Moving occupations in Winchester are Material Moving (62 | 5.1%), Transportation (53 | 4.3%), and Production (28 | 2.3%).
Production, Transportation and Moving Occupations by Sex
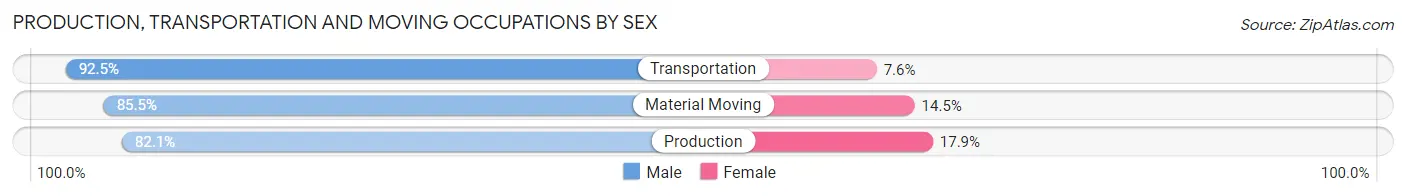
| Occupation | Male | Female |
| Production | 23 (82.1%) | 5 (17.9%) |
| Transportation | 49 (92.4%) | 4 (7.5%) |
| Material Moving | 53 (85.5%) | 9 (14.5%) |
| Total (Category) | 125 (87.4%) | 18 (12.6%) |
| Total (Overall) | 644 (52.7%) | 579 (47.3%) |
Employment Industries by Sex in Winchester
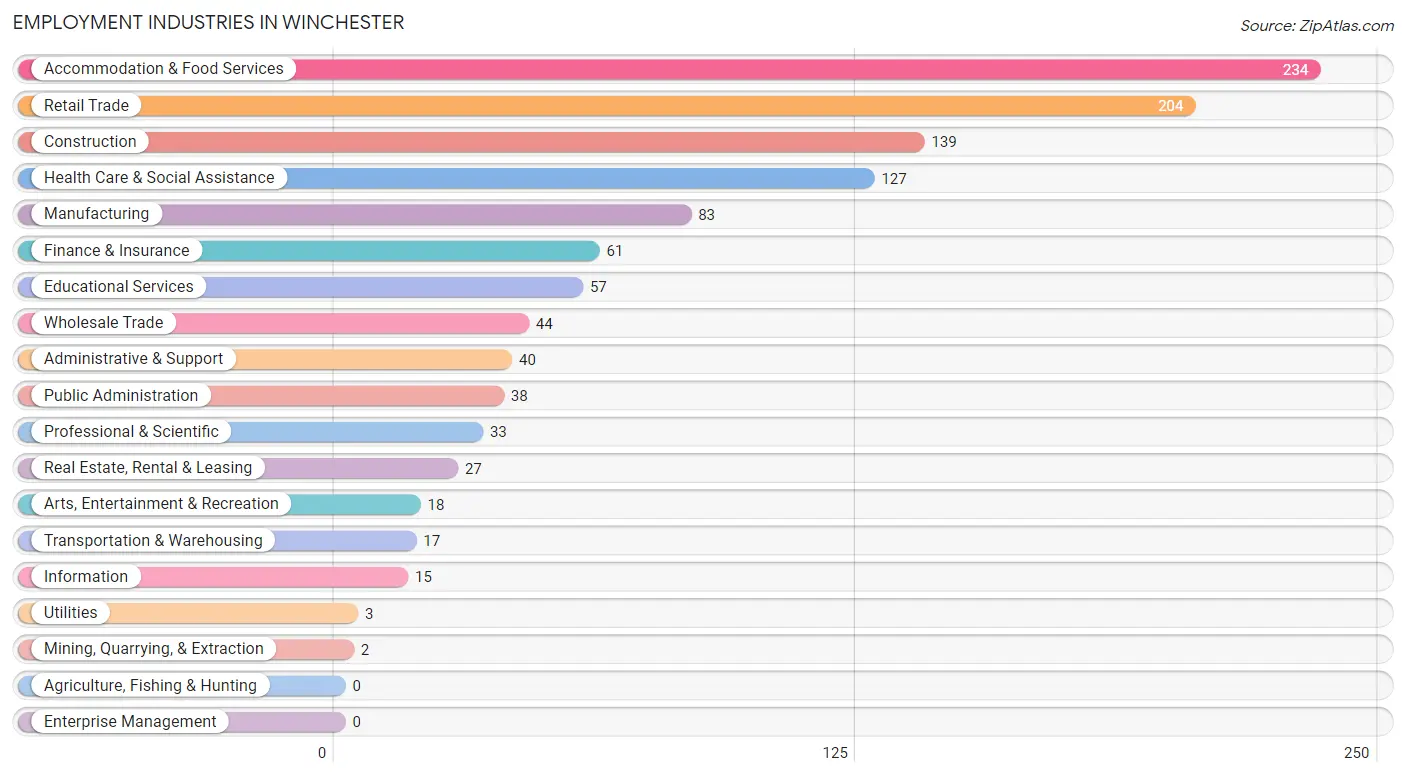
Employment Industries in Winchester
The major employment industries in Winchester include Accommodation & Food Services (234 | 19.1%), Retail Trade (204 | 16.7%), Construction (139 | 11.4%), Health Care & Social Assistance (127 | 10.4%), and Manufacturing (83 | 6.8%).
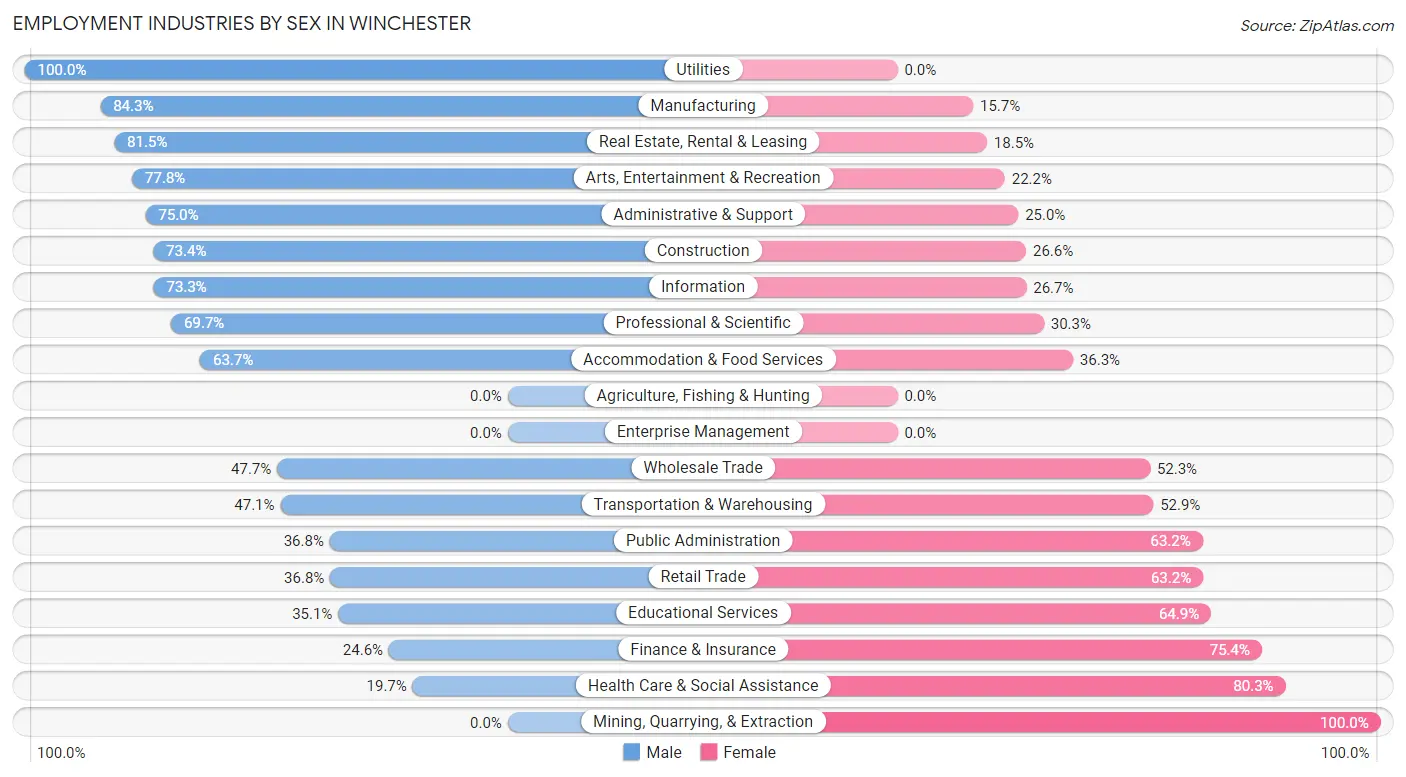
Employment Industries by Sex in Winchester
The Winchester industries that see more men than women are Utilities (100.0%), Manufacturing (84.3%), and Real Estate, Rental & Leasing (81.5%), whereas the industries that tend to have a higher number of women are Mining, Quarrying, & Extraction (100.0%), Health Care & Social Assistance (80.3%), and Finance & Insurance (75.4%).
| Industry | Male | Female |
| Agriculture, Fishing & Hunting | 0 (0.0%) | 0 (0.0%) |
| Mining, Quarrying, & Extraction | 0 (0.0%) | 2 (100.0%) |
| Construction | 102 (73.4%) | 37 (26.6%) |
| Manufacturing | 70 (84.3%) | 13 (15.7%) |
| Wholesale Trade | 21 (47.7%) | 23 (52.3%) |
| Retail Trade | 75 (36.8%) | 129 (63.2%) |
| Transportation & Warehousing | 8 (47.1%) | 9 (52.9%) |
| Utilities | 3 (100.0%) | 0 (0.0%) |
| Information | 11 (73.3%) | 4 (26.7%) |
| Finance & Insurance | 15 (24.6%) | 46 (75.4%) |
| Real Estate, Rental & Leasing | 22 (81.5%) | 5 (18.5%) |
| Professional & Scientific | 23 (69.7%) | 10 (30.3%) |
| Enterprise Management | 0 (0.0%) | 0 (0.0%) |
| Administrative & Support | 30 (75.0%) | 10 (25.0%) |
| Educational Services | 20 (35.1%) | 37 (64.9%) |
| Health Care & Social Assistance | 25 (19.7%) | 102 (80.3%) |
| Arts, Entertainment & Recreation | 14 (77.8%) | 4 (22.2%) |
| Accommodation & Food Services | 149 (63.7%) | 85 (36.3%) |
| Public Administration | 14 (36.8%) | 24 (63.2%) |
| Total | 644 (52.7%) | 579 (47.3%) |
Education in Winchester
School Enrollment in Winchester
The most common levels of schooling among the 485 students in Winchester are college / undergraduate (158 | 32.6%), high school (143 | 29.5%), and elementary school (106 | 21.9%).
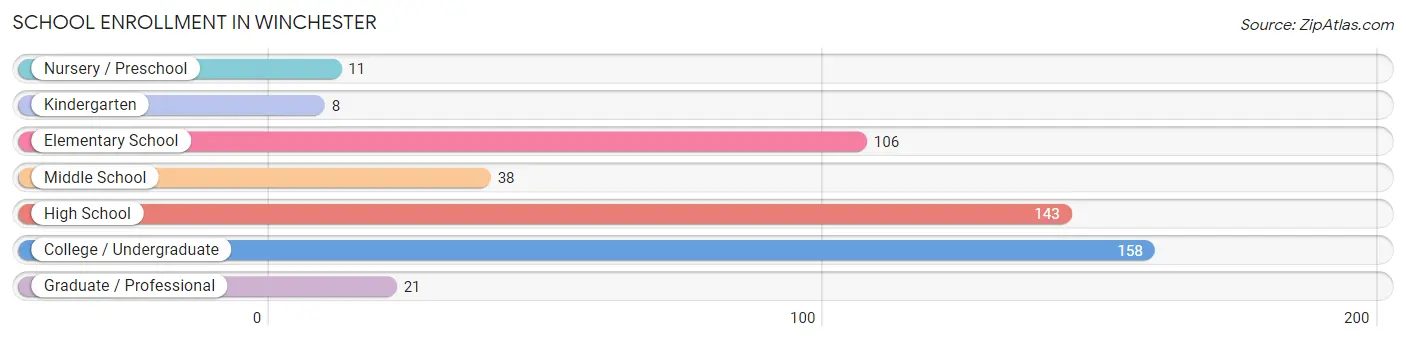
| School Level | # Students | % Students |
| Nursery / Preschool | 11 | 2.3% |
| Kindergarten | 8 | 1.7% |
| Elementary School | 106 | 21.9% |
| Middle School | 38 | 7.8% |
| High School | 143 | 29.5% |
| College / Undergraduate | 158 | 32.6% |
| Graduate / Professional | 21 | 4.3% |
| Total | 485 | 100.0% |
School Enrollment by Age by Funding Source in Winchester
Out of a total of 485 students who are enrolled in schools in Winchester, 86 (17.7%) attend a private institution, while the remaining 399 (82.3%) are enrolled in public schools. The age group of 3 to 4 year olds has the highest likelihood of being enrolled in private schools, with 8 (100.0% in the age bracket) enrolled. Conversely, the age group of 15 to 17 year olds has the lowest likelihood of being enrolled in a private school, with 117 (100.0% in the age bracket) attending a public institution.
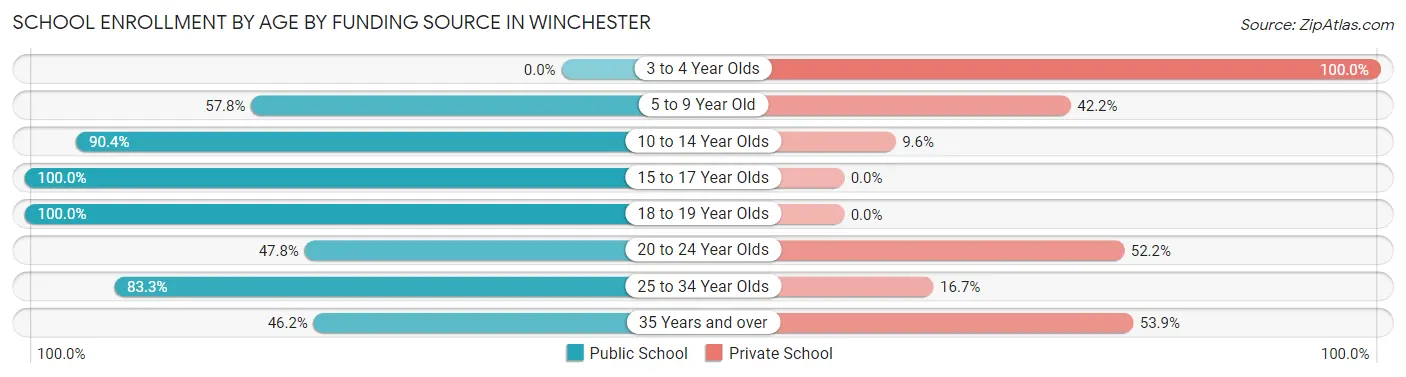
| Age Bracket | Public School | Private School |
| 3 to 4 Year Olds | 0 (0.0%) | 8 (100.0%) |
| 5 to 9 Year Old | 26 (57.8%) | 19 (42.2%) |
| 10 to 14 Year Olds | 113 (90.4%) | 12 (9.6%) |
| 15 to 17 Year Olds | 117 (100.0%) | 0 (0.0%) |
| 18 to 19 Year Olds | 84 (100.0%) | 0 (0.0%) |
| 20 to 24 Year Olds | 33 (47.8%) | 36 (52.2%) |
| 25 to 34 Year Olds | 20 (83.3%) | 4 (16.7%) |
| 35 Years and over | 6 (46.2%) | 7 (53.8%) |
| Total | 399 (82.3%) | 86 (17.7%) |
Educational Attainment by Field of Study in Winchester
Business (70 | 25.9%), education (32 | 11.8%), science & technology (29 | 10.7%), visual & performing arts (27 | 10.0%), and social sciences (22 | 8.2%) are the most common fields of study among 270 individuals in Winchester who have obtained a bachelor's degree or higher.
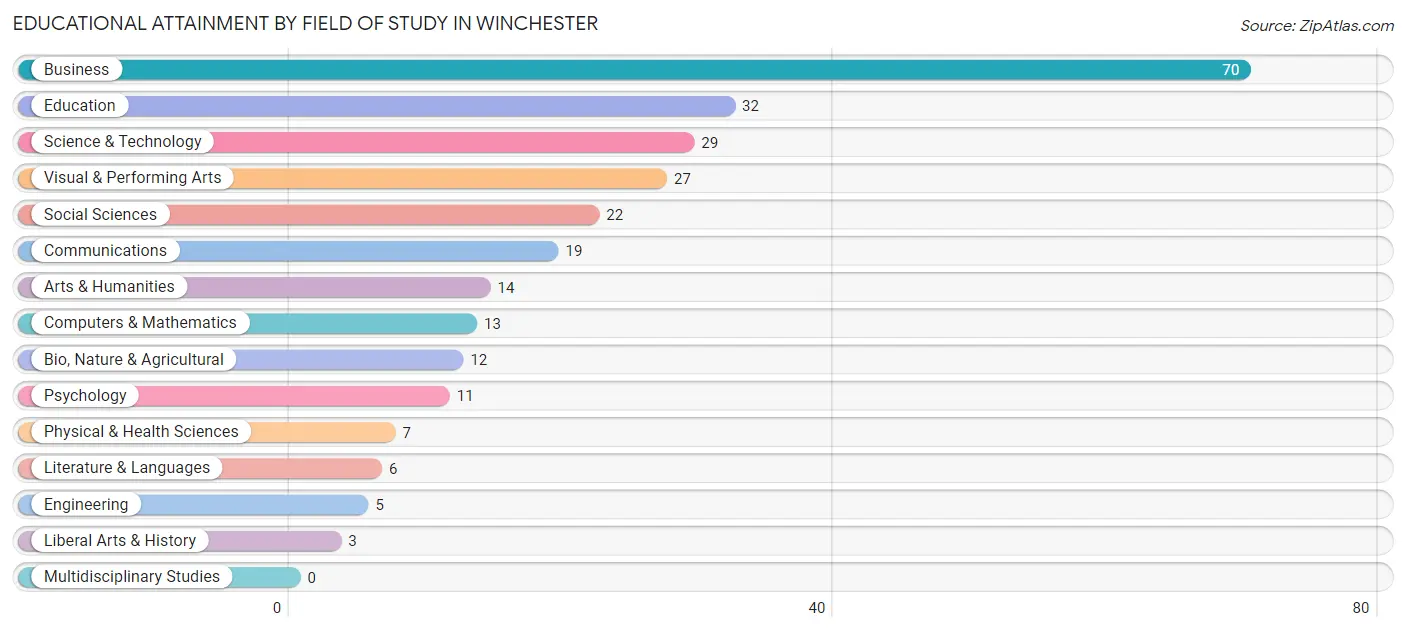
| Field of Study | # Graduates | % Graduates |
| Computers & Mathematics | 13 | 4.8% |
| Bio, Nature & Agricultural | 12 | 4.4% |
| Physical & Health Sciences | 7 | 2.6% |
| Psychology | 11 | 4.1% |
| Social Sciences | 22 | 8.2% |
| Engineering | 5 | 1.8% |
| Multidisciplinary Studies | 0 | 0.0% |
| Science & Technology | 29 | 10.7% |
| Business | 70 | 25.9% |
| Education | 32 | 11.8% |
| Literature & Languages | 6 | 2.2% |
| Liberal Arts & History | 3 | 1.1% |
| Visual & Performing Arts | 27 | 10.0% |
| Communications | 19 | 7.0% |
| Arts & Humanities | 14 | 5.2% |
| Total | 270 | 100.0% |
Transportation & Commute in Winchester
Vehicle Availability by Sex in Winchester
The most prevalent vehicle ownership categories in Winchester are males with 3 vehicles (251, accounting for 38.9%) and females with 3 vehicles (212, making up 43.6%).
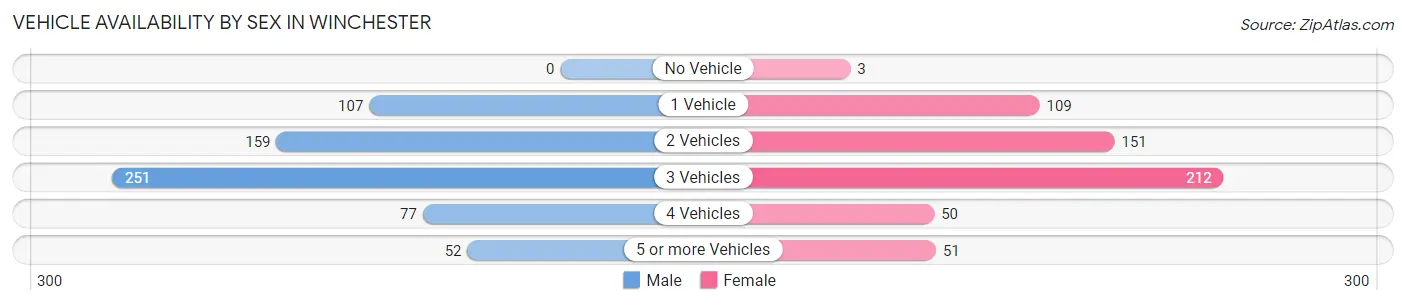
| Vehicles Available | Male | Female |
| No Vehicle | 0 (0.0%) | 3 (0.5%) |
| 1 Vehicle | 107 (16.6%) | 109 (18.9%) |
| 2 Vehicles | 159 (24.6%) | 151 (26.2%) |
| 3 Vehicles | 251 (38.9%) | 212 (36.8%) |
| 4 Vehicles | 77 (11.9%) | 50 (8.7%) |
| 5 or more Vehicles | 52 (8.1%) | 51 (8.8%) |
| Total | 646 (100.0%) | 576 (100.0%) |
Commute Time in Winchester
The most frequently occuring commute durations in Winchester are 10 to 14 minutes (364 commuters, 32.0%), 30 to 34 minutes (210 commuters, 18.4%), and 20 to 24 minutes (172 commuters, 15.1%).
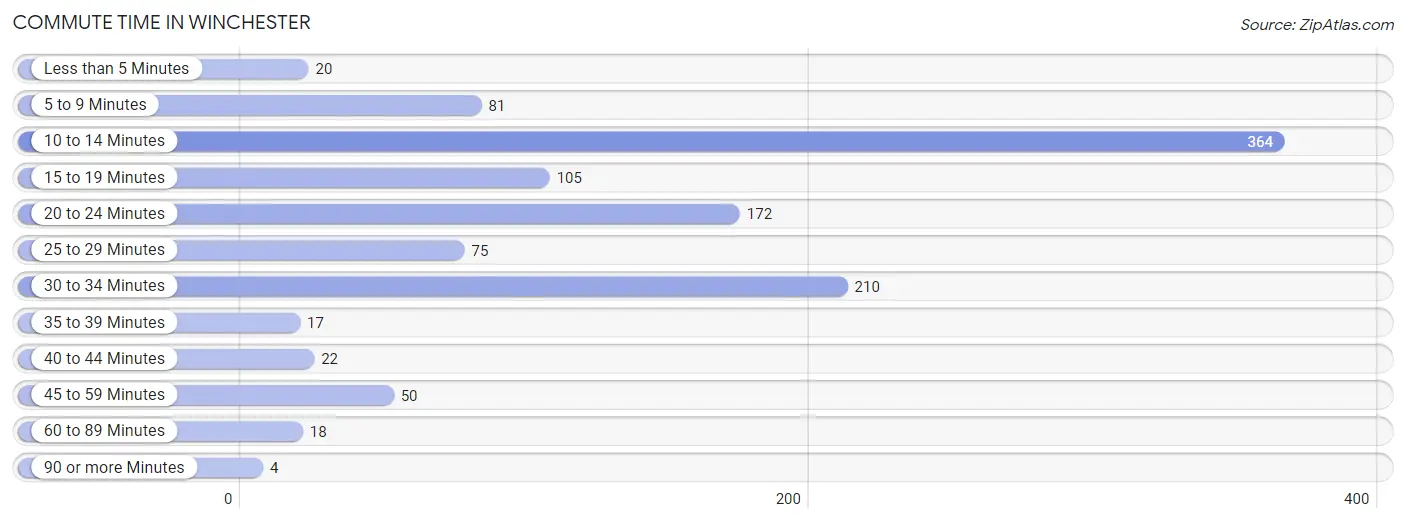
| Commute Time | # Commuters | % Commuters |
| Less than 5 Minutes | 20 | 1.8% |
| 5 to 9 Minutes | 81 | 7.1% |
| 10 to 14 Minutes | 364 | 32.0% |
| 15 to 19 Minutes | 105 | 9.2% |
| 20 to 24 Minutes | 172 | 15.1% |
| 25 to 29 Minutes | 75 | 6.6% |
| 30 to 34 Minutes | 210 | 18.4% |
| 35 to 39 Minutes | 17 | 1.5% |
| 40 to 44 Minutes | 22 | 1.9% |
| 45 to 59 Minutes | 50 | 4.4% |
| 60 to 89 Minutes | 18 | 1.6% |
| 90 or more Minutes | 4 | 0.4% |
Commute Time by Sex in Winchester
The most common commute times in Winchester are 10 to 14 minutes (210 commuters, 33.2%) for males and 10 to 14 minutes (154 commuters, 30.5%) for females.
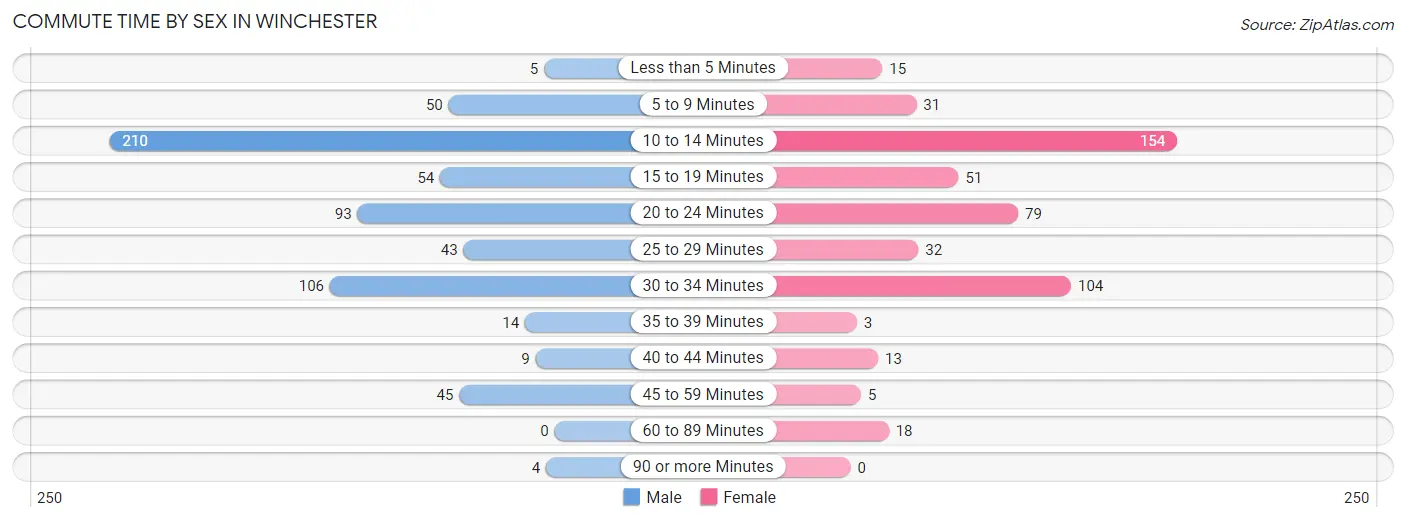
| Commute Time | Male | Female |
| Less than 5 Minutes | 5 (0.8%) | 15 (3.0%) |
| 5 to 9 Minutes | 50 (7.9%) | 31 (6.1%) |
| 10 to 14 Minutes | 210 (33.2%) | 154 (30.5%) |
| 15 to 19 Minutes | 54 (8.5%) | 51 (10.1%) |
| 20 to 24 Minutes | 93 (14.7%) | 79 (15.6%) |
| 25 to 29 Minutes | 43 (6.8%) | 32 (6.3%) |
| 30 to 34 Minutes | 106 (16.8%) | 104 (20.6%) |
| 35 to 39 Minutes | 14 (2.2%) | 3 (0.6%) |
| 40 to 44 Minutes | 9 (1.4%) | 13 (2.6%) |
| 45 to 59 Minutes | 45 (7.1%) | 5 (1.0%) |
| 60 to 89 Minutes | 0 (0.0%) | 18 (3.6%) |
| 90 or more Minutes | 4 (0.6%) | 0 (0.0%) |
Time of Departure to Work by Sex in Winchester
The most frequent times of departure to work in Winchester are 10:00 AM to 10:59 AM (128, 20.2%) for males and 7:00 AM to 7:29 AM (142, 28.1%) for females.
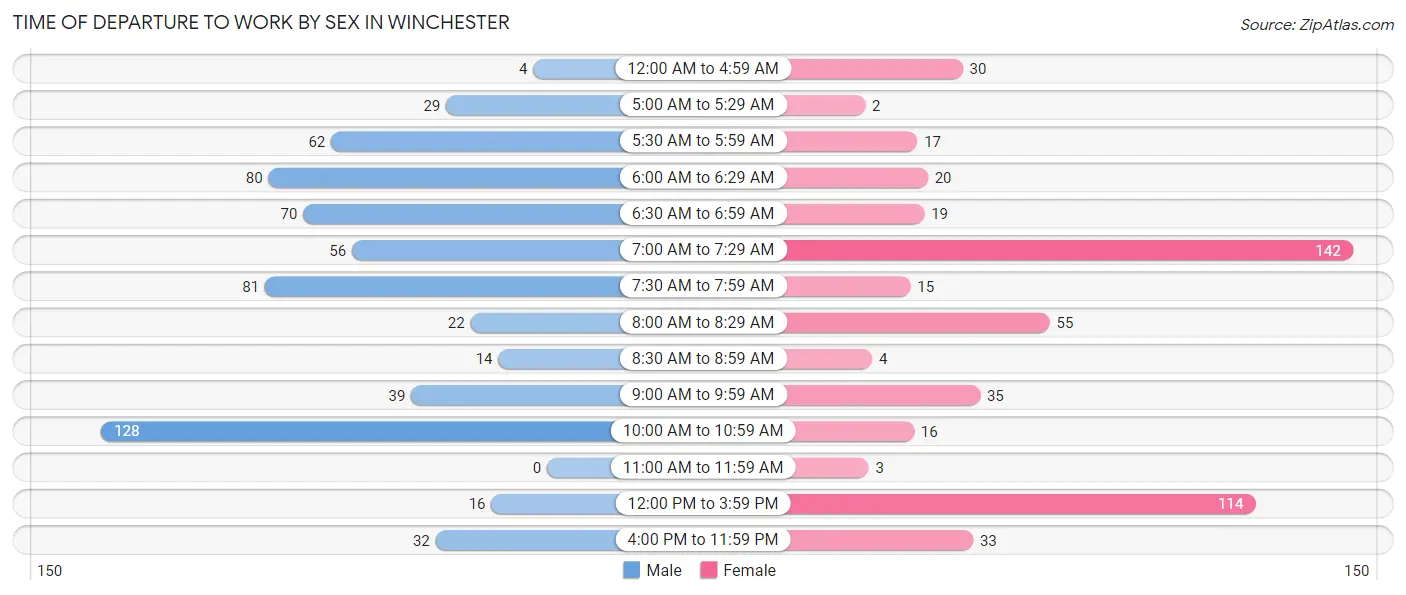
| Time of Departure | Male | Female |
| 12:00 AM to 4:59 AM | 4 (0.6%) | 30 (5.9%) |
| 5:00 AM to 5:29 AM | 29 (4.6%) | 2 (0.4%) |
| 5:30 AM to 5:59 AM | 62 (9.8%) | 17 (3.4%) |
| 6:00 AM to 6:29 AM | 80 (12.6%) | 20 (4.0%) |
| 6:30 AM to 6:59 AM | 70 (11.1%) | 19 (3.8%) |
| 7:00 AM to 7:29 AM | 56 (8.8%) | 142 (28.1%) |
| 7:30 AM to 7:59 AM | 81 (12.8%) | 15 (3.0%) |
| 8:00 AM to 8:29 AM | 22 (3.5%) | 55 (10.9%) |
| 8:30 AM to 8:59 AM | 14 (2.2%) | 4 (0.8%) |
| 9:00 AM to 9:59 AM | 39 (6.2%) | 35 (6.9%) |
| 10:00 AM to 10:59 AM | 128 (20.2%) | 16 (3.2%) |
| 11:00 AM to 11:59 AM | 0 (0.0%) | 3 (0.6%) |
| 12:00 PM to 3:59 PM | 16 (2.5%) | 114 (22.6%) |
| 4:00 PM to 11:59 PM | 32 (5.1%) | 33 (6.5%) |
| Total | 633 (100.0%) | 505 (100.0%) |
Housing Occupancy in Winchester
Occupancy by Ownership in Winchester
Of the total 699 dwellings in Winchester, owner-occupied units account for 573 (82.0%), while renter-occupied units make up 126 (18.0%).
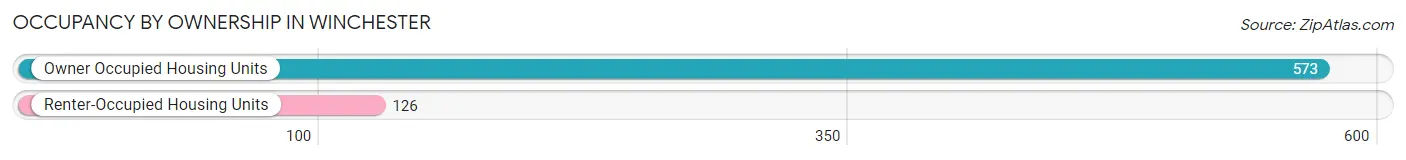
| Occupancy | # Housing Units | % Housing Units |
| Owner Occupied Housing Units | 573 | 82.0% |
| Renter-Occupied Housing Units | 126 | 18.0% |
| Total Occupied Housing Units | 699 | 100.0% |
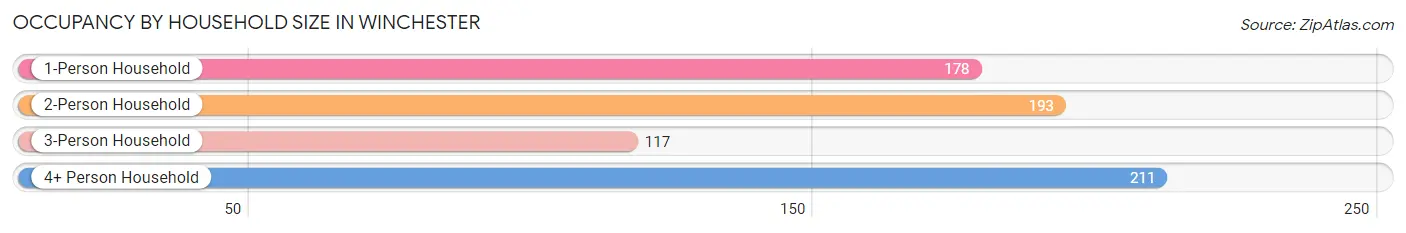
Occupancy by Household Size in Winchester
| Household Size | # Housing Units | % Housing Units |
| 1-Person Household | 178 | 25.5% |
| 2-Person Household | 193 | 27.6% |
| 3-Person Household | 117 | 16.7% |
| 4+ Person Household | 211 | 30.2% |
| Total Housing Units | 699 | 100.0% |
Occupancy by Ownership by Household Size in Winchester
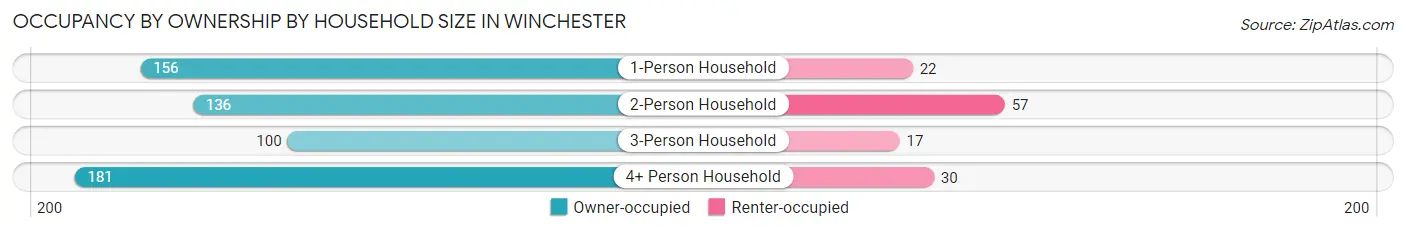
| Household Size | Owner-occupied | Renter-occupied |
| 1-Person Household | 156 (87.6%) | 22 (12.4%) |
| 2-Person Household | 136 (70.5%) | 57 (29.5%) |
| 3-Person Household | 100 (85.5%) | 17 (14.5%) |
| 4+ Person Household | 181 (85.8%) | 30 (14.2%) |
| Total Housing Units | 573 (82.0%) | 126 (18.0%) |
Occupancy by Educational Attainment in Winchester
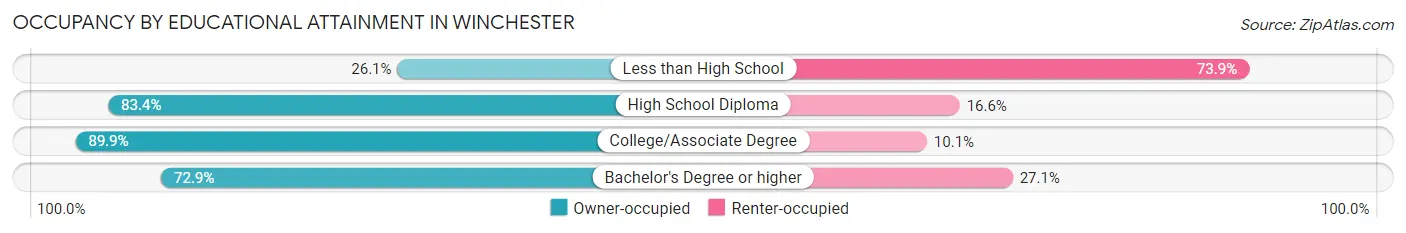
| Household Size | Owner-occupied | Renter-occupied |
| Less than High School | 6 (26.1%) | 17 (73.9%) |
| High School Diploma | 131 (83.4%) | 26 (16.6%) |
| College/Associate Degree | 304 (89.9%) | 34 (10.1%) |
| Bachelor's Degree or higher | 132 (72.9%) | 49 (27.1%) |
Occupancy by Age of Householder in Winchester
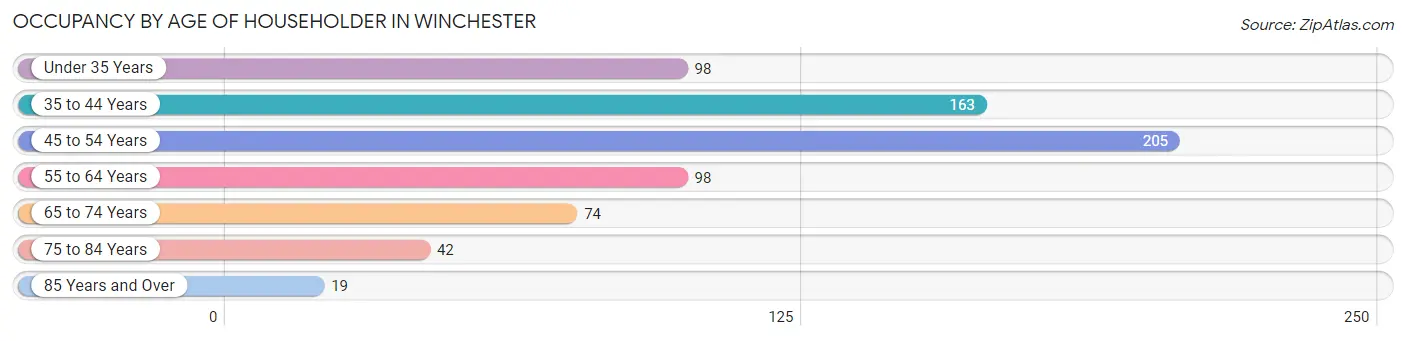
| Age Bracket | # Households | % Households |
| Under 35 Years | 98 | 14.0% |
| 35 to 44 Years | 163 | 23.3% |
| 45 to 54 Years | 205 | 29.3% |
| 55 to 64 Years | 98 | 14.0% |
| 65 to 74 Years | 74 | 10.6% |
| 75 to 84 Years | 42 | 6.0% |
| 85 Years and Over | 19 | 2.7% |
| Total | 699 | 100.0% |
Housing Finances in Winchester
Median Income by Occupancy in Winchester
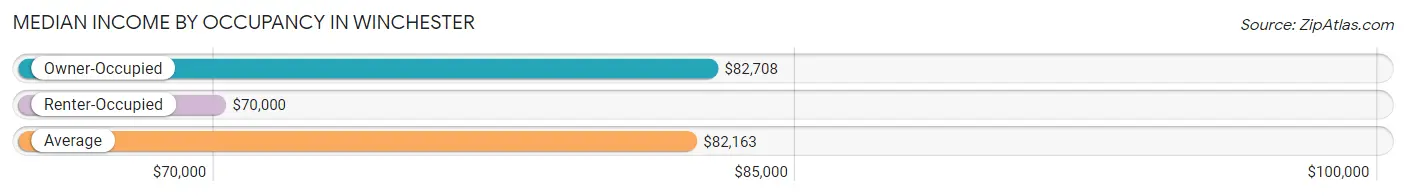
| Occupancy Type | # Households | Median Income |
| Owner-Occupied | 573 (82.0%) | $82,708 |
| Renter-Occupied | 126 (18.0%) | $70,000 |
| Average | 699 (100.0%) | $82,163 |
Occupancy by Householder Income Bracket in Winchester
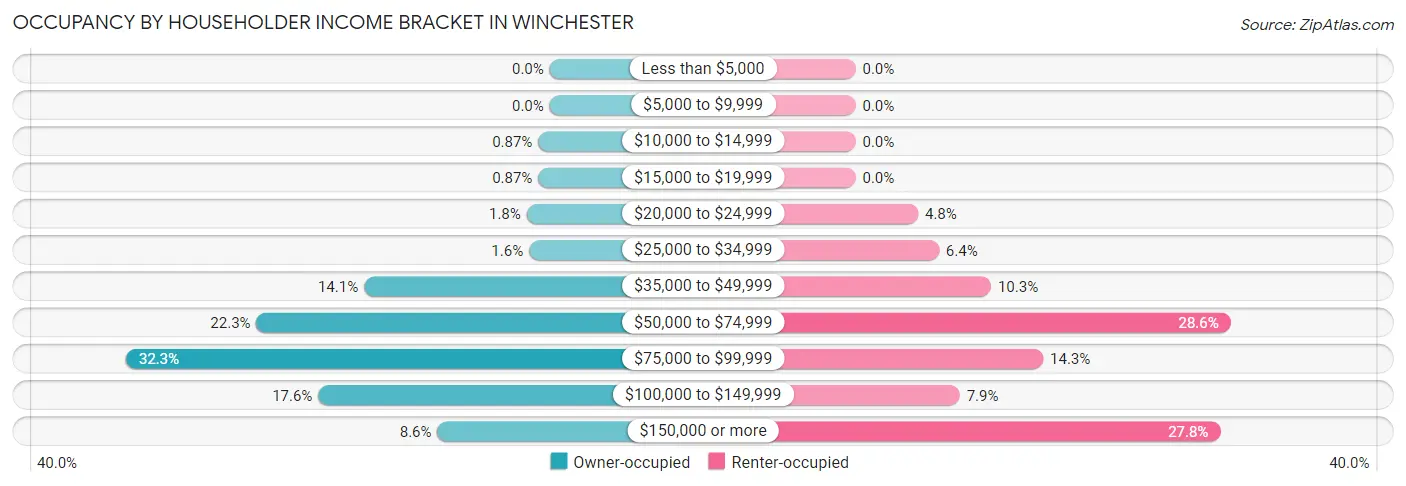
| Income Bracket | Owner-occupied | Renter-occupied |
| Less than $5,000 | 0 (0.0%) | 0 (0.0%) |
| $5,000 to $9,999 | 0 (0.0%) | 0 (0.0%) |
| $10,000 to $14,999 | 5 (0.9%) | 0 (0.0%) |
| $15,000 to $19,999 | 5 (0.9%) | 0 (0.0%) |
| $20,000 to $24,999 | 10 (1.8%) | 6 (4.8%) |
| $25,000 to $34,999 | 9 (1.6%) | 8 (6.4%) |
| $35,000 to $49,999 | 81 (14.1%) | 13 (10.3%) |
| $50,000 to $74,999 | 128 (22.3%) | 36 (28.6%) |
| $75,000 to $99,999 | 185 (32.3%) | 18 (14.3%) |
| $100,000 to $149,999 | 101 (17.6%) | 10 (7.9%) |
| $150,000 or more | 49 (8.6%) | 35 (27.8%) |
| Total | 573 (100.0%) | 126 (100.0%) |
Monthly Housing Cost Tiers in Winchester
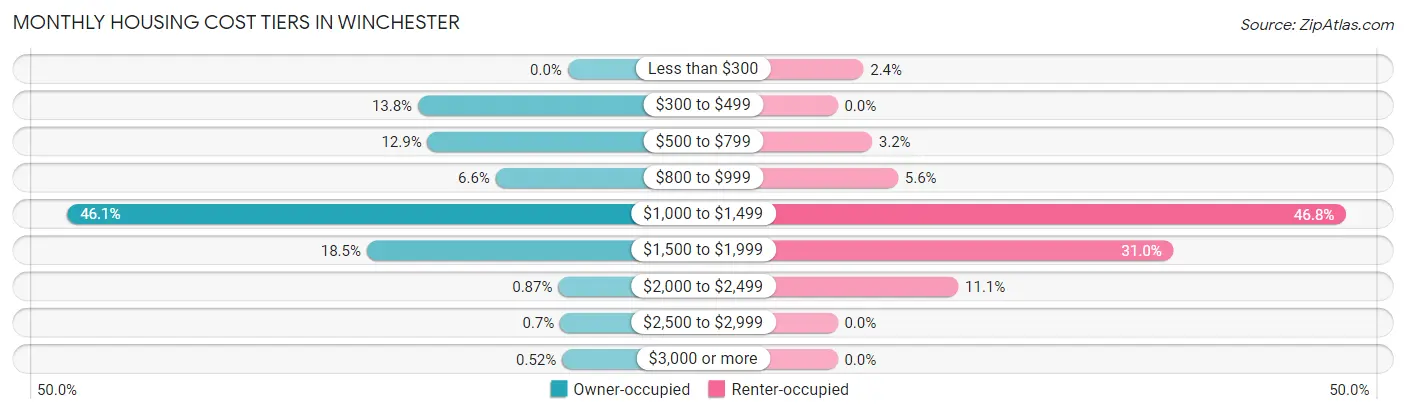
| Monthly Cost | Owner-occupied | Renter-occupied |
| Less than $300 | 0 (0.0%) | 3 (2.4%) |
| $300 to $499 | 79 (13.8%) | 0 (0.0%) |
| $500 to $799 | 74 (12.9%) | 4 (3.2%) |
| $800 to $999 | 38 (6.6%) | 7 (5.6%) |
| $1,000 to $1,499 | 264 (46.1%) | 59 (46.8%) |
| $1,500 to $1,999 | 106 (18.5%) | 39 (30.9%) |
| $2,000 to $2,499 | 5 (0.9%) | 14 (11.1%) |
| $2,500 to $2,999 | 4 (0.7%) | 0 (0.0%) |
| $3,000 or more | 3 (0.5%) | 0 (0.0%) |
| Total | 573 (100.0%) | 126 (100.0%) |
Physical Housing Characteristics in Winchester
Housing Structures in Winchester
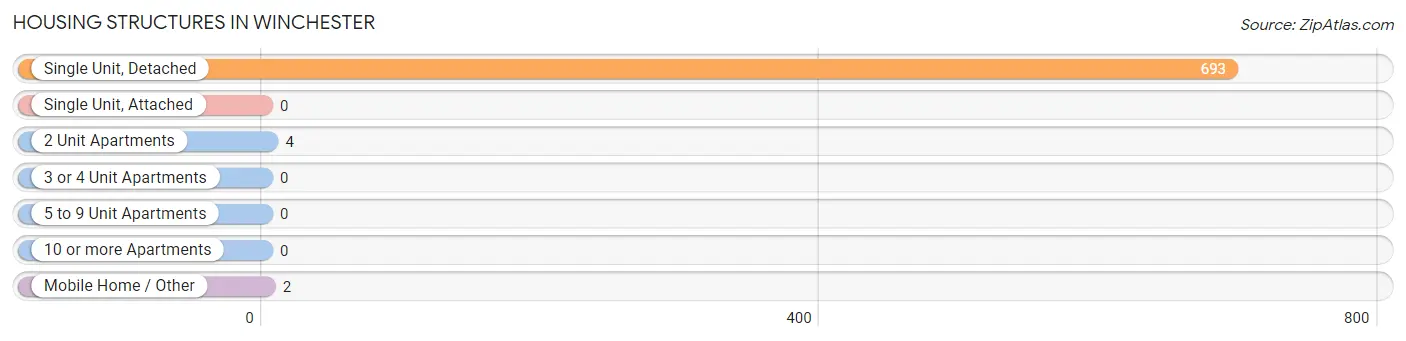
| Structure Type | # Housing Units | % Housing Units |
| Single Unit, Detached | 693 | 99.1% |
| Single Unit, Attached | 0 | 0.0% |
| 2 Unit Apartments | 4 | 0.6% |
| 3 or 4 Unit Apartments | 0 | 0.0% |
| 5 to 9 Unit Apartments | 0 | 0.0% |
| 10 or more Apartments | 0 | 0.0% |
| Mobile Home / Other | 2 | 0.3% |
| Total | 699 | 100.0% |
Housing Structures by Occupancy in Winchester
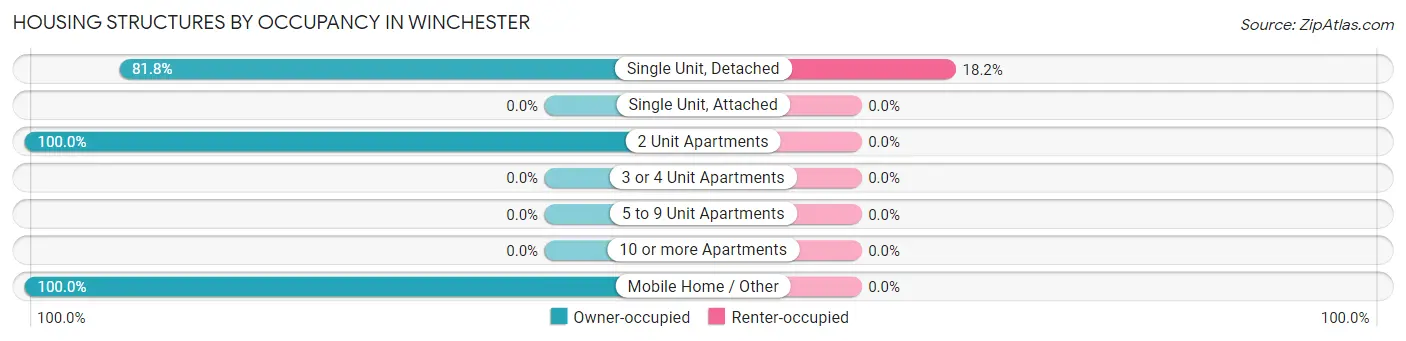
| Structure Type | Owner-occupied | Renter-occupied |
| Single Unit, Detached | 567 (81.8%) | 126 (18.2%) |
| Single Unit, Attached | 0 (0.0%) | 0 (0.0%) |
| 2 Unit Apartments | 4 (100.0%) | 0 (0.0%) |
| 3 or 4 Unit Apartments | 0 (0.0%) | 0 (0.0%) |
| 5 to 9 Unit Apartments | 0 (0.0%) | 0 (0.0%) |
| 10 or more Apartments | 0 (0.0%) | 0 (0.0%) |
| Mobile Home / Other | 2 (100.0%) | 0 (0.0%) |
| Total | 573 (82.0%) | 126 (18.0%) |
Housing Structures by Number of Rooms in Winchester
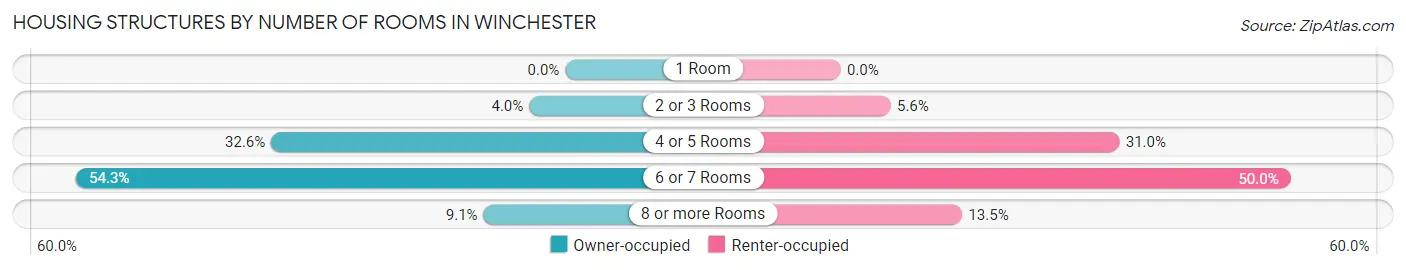
| Number of Rooms | Owner-occupied | Renter-occupied |
| 1 Room | 0 (0.0%) | 0 (0.0%) |
| 2 or 3 Rooms | 23 (4.0%) | 7 (5.6%) |
| 4 or 5 Rooms | 187 (32.6%) | 39 (30.9%) |
| 6 or 7 Rooms | 311 (54.3%) | 63 (50.0%) |
| 8 or more Rooms | 52 (9.1%) | 17 (13.5%) |
| Total | 573 (100.0%) | 126 (100.0%) |
Housing Structure by Heating Type in Winchester
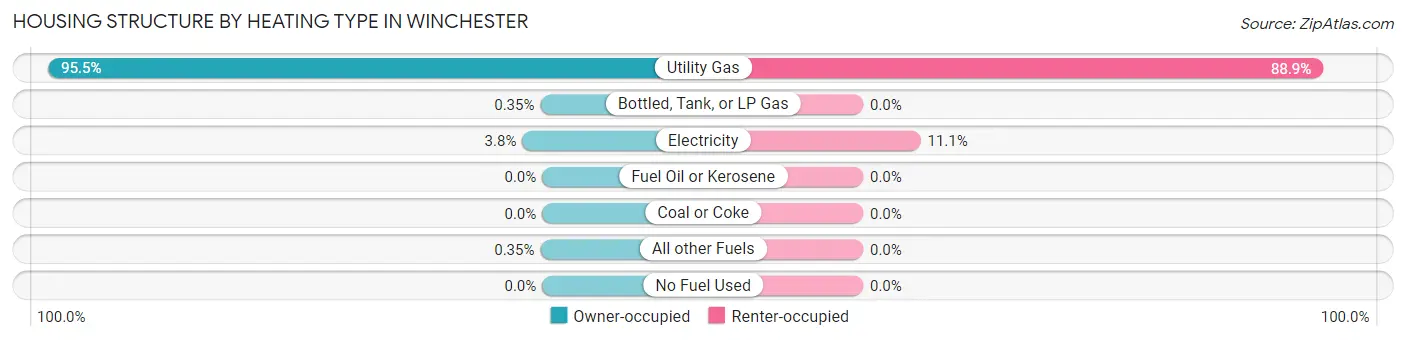
| Heating Type | Owner-occupied | Renter-occupied |
| Utility Gas | 547 (95.5%) | 112 (88.9%) |
| Bottled, Tank, or LP Gas | 2 (0.4%) | 0 (0.0%) |
| Electricity | 22 (3.8%) | 14 (11.1%) |
| Fuel Oil or Kerosene | 0 (0.0%) | 0 (0.0%) |
| Coal or Coke | 0 (0.0%) | 0 (0.0%) |
| All other Fuels | 2 (0.4%) | 0 (0.0%) |
| No Fuel Used | 0 (0.0%) | 0 (0.0%) |
| Total | 573 (100.0%) | 126 (100.0%) |
Household Vehicle Usage in Winchester
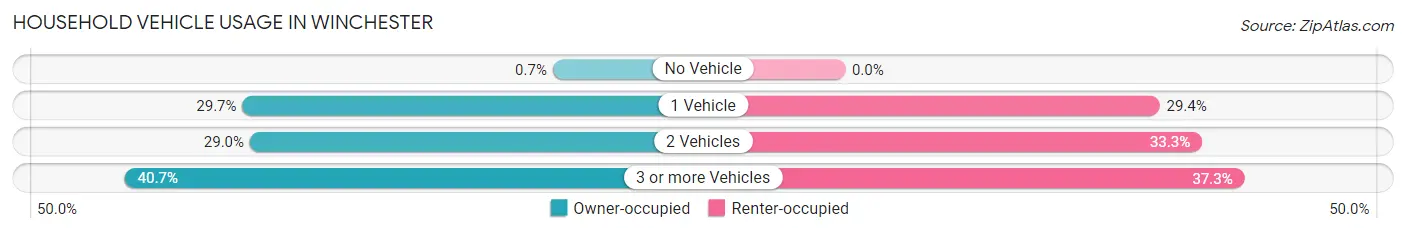
| Vehicles per Household | Owner-occupied | Renter-occupied |
| No Vehicle | 4 (0.7%) | 0 (0.0%) |
| 1 Vehicle | 170 (29.7%) | 37 (29.4%) |
| 2 Vehicles | 166 (29.0%) | 42 (33.3%) |
| 3 or more Vehicles | 233 (40.7%) | 47 (37.3%) |
| Total | 573 (100.0%) | 126 (100.0%) |
Real Estate & Mortgages in Winchester
Real Estate and Mortgage Overview in Winchester
| Characteristic | Without Mortgage | With Mortgage |
| Housing Units | 138 | 435 |
| Median Property Value | $163,200 | $188,500 |
| Median Household Income | $60,833 | $39 |
| Monthly Housing Costs | $494 | $3 |
| Real Estate Taxes | $2,400 | $4 |
Property Value by Mortgage Status in Winchester
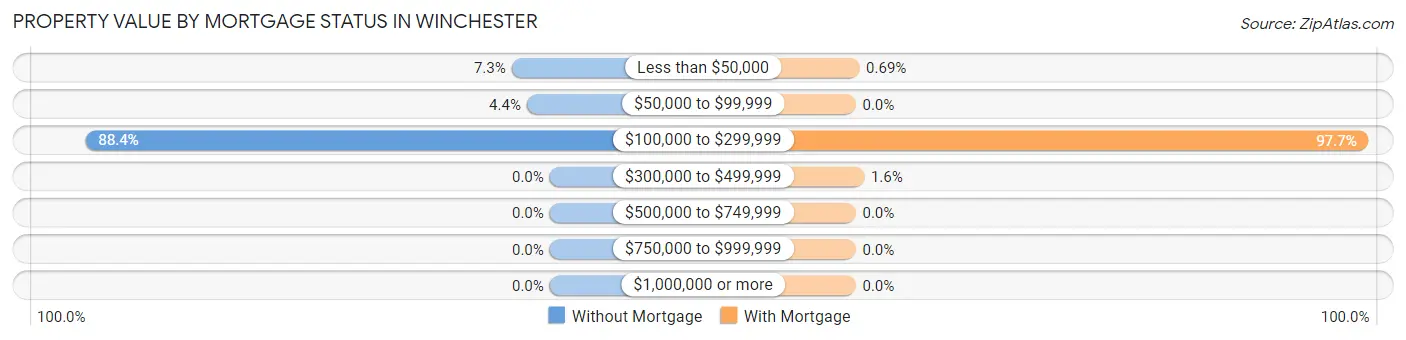
| Property Value | Without Mortgage | With Mortgage |
| Less than $50,000 | 10 (7.2%) | 3 (0.7%) |
| $50,000 to $99,999 | 6 (4.3%) | 0 (0.0%) |
| $100,000 to $299,999 | 122 (88.4%) | 425 (97.7%) |
| $300,000 to $499,999 | 0 (0.0%) | 7 (1.6%) |
| $500,000 to $749,999 | 0 (0.0%) | 0 (0.0%) |
| $750,000 to $999,999 | 0 (0.0%) | 0 (0.0%) |
| $1,000,000 or more | 0 (0.0%) | 0 (0.0%) |
| Total | 138 (100.0%) | 435 (100.0%) |
Household Income by Mortgage Status in Winchester
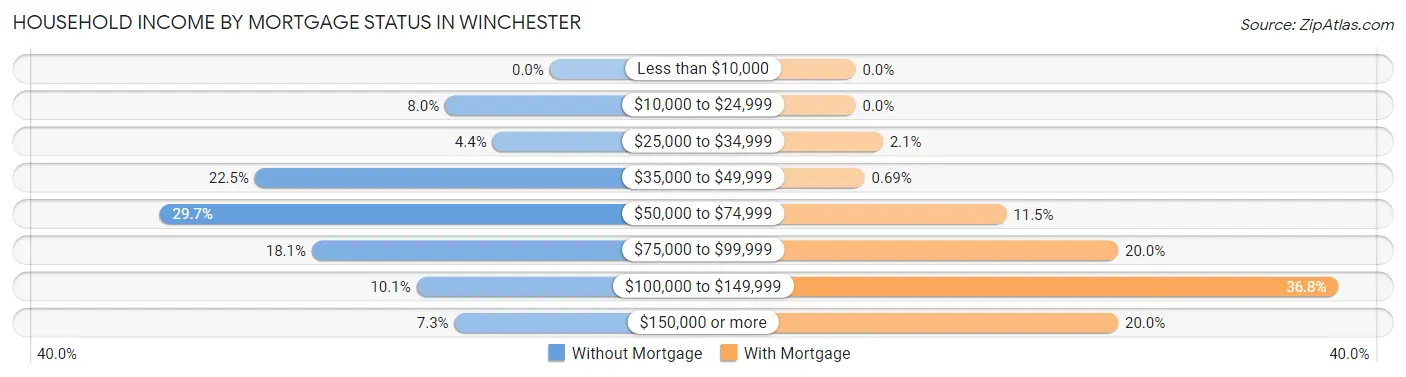
| Household Income | Without Mortgage | With Mortgage |
| Less than $10,000 | 0 (0.0%) | 0 (0.0%) |
| $10,000 to $24,999 | 11 (8.0%) | 0 (0.0%) |
| $25,000 to $34,999 | 6 (4.3%) | 9 (2.1%) |
| $35,000 to $49,999 | 31 (22.5%) | 3 (0.7%) |
| $50,000 to $74,999 | 41 (29.7%) | 50 (11.5%) |
| $75,000 to $99,999 | 25 (18.1%) | 87 (20.0%) |
| $100,000 to $149,999 | 14 (10.1%) | 160 (36.8%) |
| $150,000 or more | 10 (7.2%) | 87 (20.0%) |
| Total | 138 (100.0%) | 435 (100.0%) |
Property Value to Household Income Ratio in Winchester
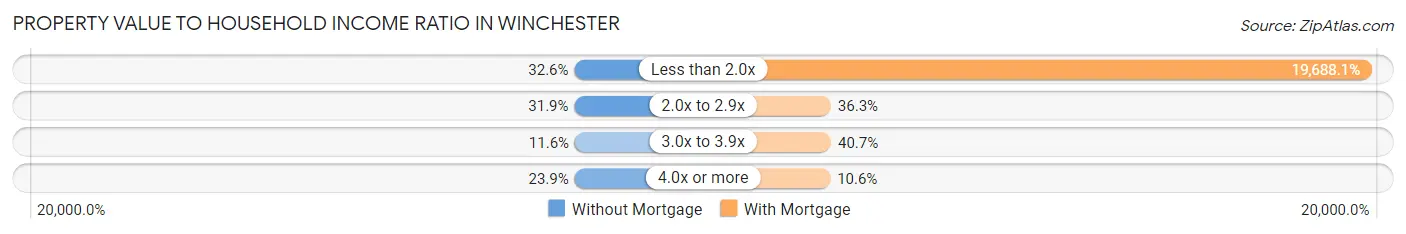
| Value-to-Income Ratio | Without Mortgage | With Mortgage |
| Less than 2.0x | 45 (32.6%) | 85,643 (19,688.1%) |
| 2.0x to 2.9x | 44 (31.9%) | 158 (36.3%) |
| 3.0x to 3.9x | 16 (11.6%) | 177 (40.7%) |
| 4.0x or more | 33 (23.9%) | 46 (10.6%) |
| Total | 138 (100.0%) | 435 (100.0%) |
Real Estate Taxes by Mortgage Status in Winchester
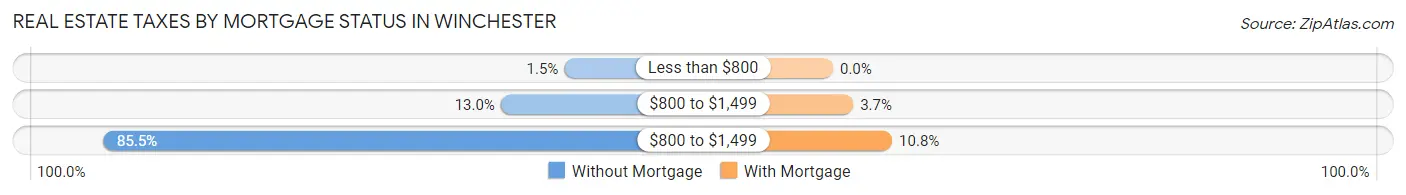
| Property Taxes | Without Mortgage | With Mortgage |
| Less than $800 | 2 (1.5%) | 0 (0.0%) |
| $800 to $1,499 | 18 (13.0%) | 16 (3.7%) |
| $800 to $1,499 | 118 (85.5%) | 47 (10.8%) |
| Total | 138 (100.0%) | 435 (100.0%) |
Health & Disability in Winchester
Health Insurance Coverage by Age in Winchester
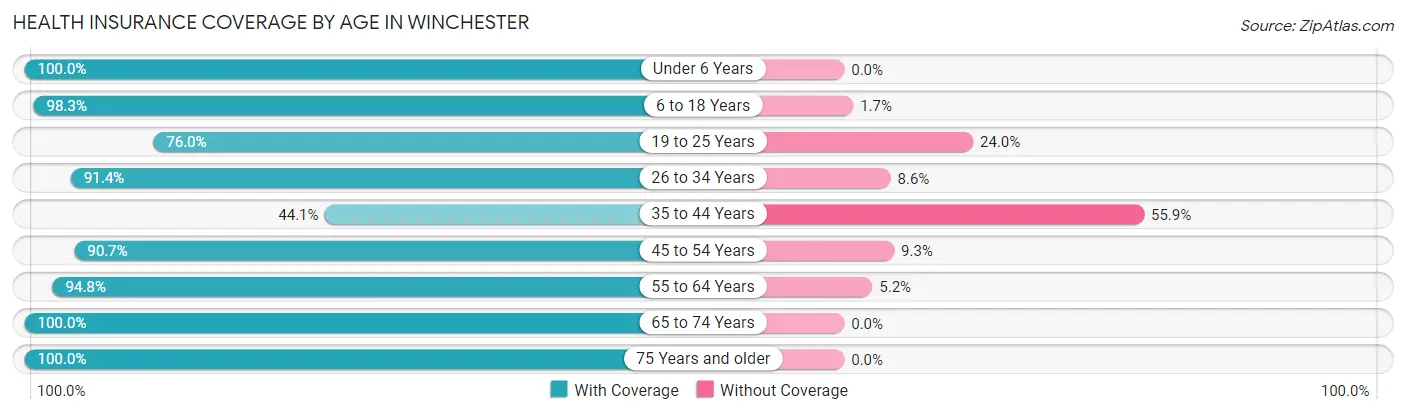
| Age Bracket | With Coverage | Without Coverage |
| Under 6 Years | 112 (100.0%) | 0 (0.0%) |
| 6 to 18 Years | 294 (98.3%) | 5 (1.7%) |
| 19 to 25 Years | 291 (76.0%) | 92 (24.0%) |
| 26 to 34 Years | 148 (91.4%) | 14 (8.6%) |
| 35 to 44 Years | 127 (44.1%) | 161 (55.9%) |
| 45 to 54 Years | 293 (90.7%) | 30 (9.3%) |
| 55 to 64 Years | 145 (94.8%) | 8 (5.2%) |
| 65 to 74 Years | 101 (100.0%) | 0 (0.0%) |
| 75 Years and older | 87 (100.0%) | 0 (0.0%) |
| Total | 1,598 (83.8%) | 310 (16.3%) |
Health Insurance Coverage by Citizenship Status in Winchester
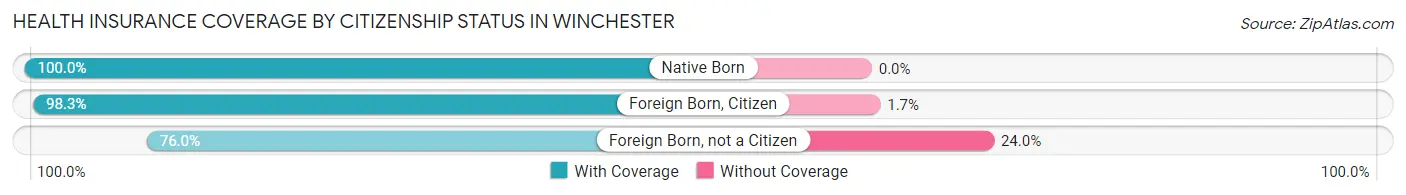
| Citizenship Status | With Coverage | Without Coverage |
| Native Born | 112 (100.0%) | 0 (0.0%) |
| Foreign Born, Citizen | 294 (98.3%) | 5 (1.7%) |
| Foreign Born, not a Citizen | 291 (76.0%) | 92 (24.0%) |
Health Insurance Coverage by Household Income in Winchester
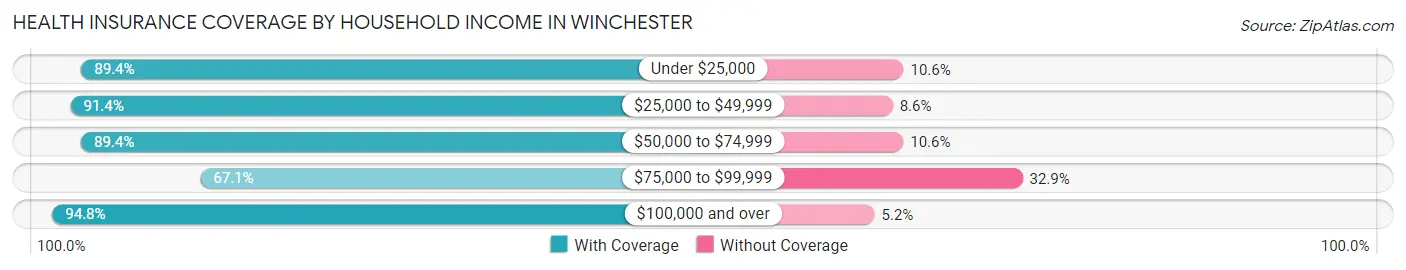
| Household Income | With Coverage | Without Coverage |
| Under $25,000 | 42 (89.4%) | 5 (10.6%) |
| $25,000 to $49,999 | 191 (91.4%) | 18 (8.6%) |
| $50,000 to $74,999 | 262 (89.4%) | 31 (10.6%) |
| $75,000 to $99,999 | 448 (67.1%) | 220 (32.9%) |
| $100,000 and over | 655 (94.8%) | 36 (5.2%) |
Public vs Private Health Insurance Coverage by Age in Winchester
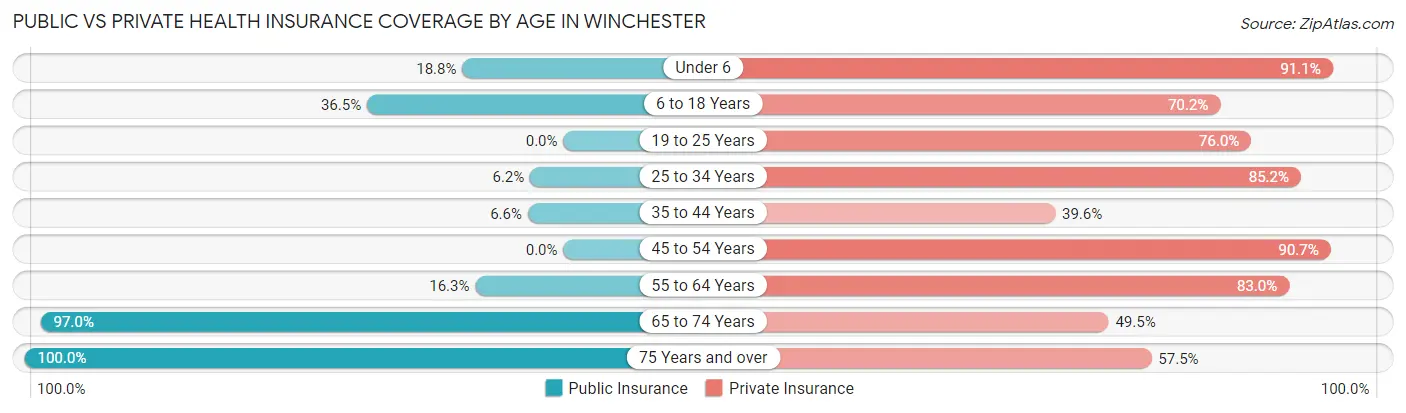
| Age Bracket | Public Insurance | Private Insurance |
| Under 6 | 21 (18.8%) | 102 (91.1%) |
| 6 to 18 Years | 109 (36.4%) | 210 (70.2%) |
| 19 to 25 Years | 0 (0.0%) | 291 (76.0%) |
| 25 to 34 Years | 10 (6.2%) | 138 (85.2%) |
| 35 to 44 Years | 19 (6.6%) | 114 (39.6%) |
| 45 to 54 Years | 0 (0.0%) | 293 (90.7%) |
| 55 to 64 Years | 25 (16.3%) | 127 (83.0%) |
| 65 to 74 Years | 98 (97.0%) | 50 (49.5%) |
| 75 Years and over | 87 (100.0%) | 50 (57.5%) |
| Total | 369 (19.3%) | 1,375 (72.1%) |
Disability Status by Sex by Age in Winchester
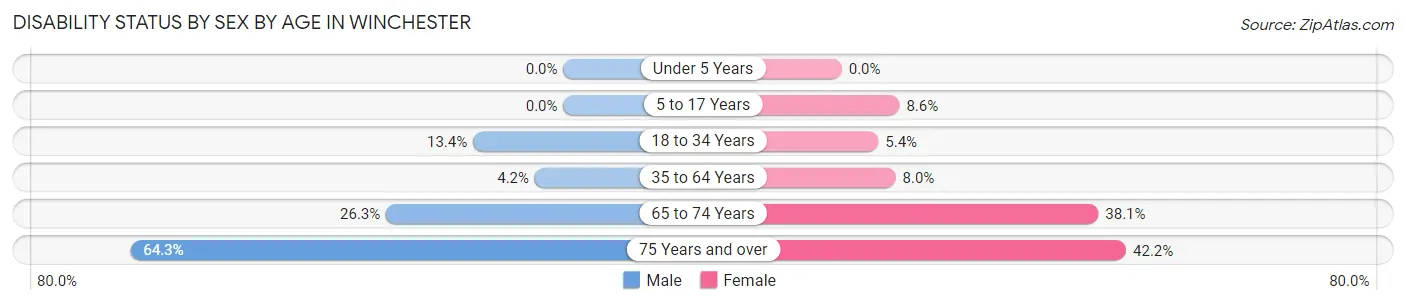
| Age Bracket | Male | Female |
| Under 5 Years | 0 (0.0%) | 0 (0.0%) |
| 5 to 17 Years | 0 (0.0%) | 3 (8.6%) |
| 18 to 34 Years | 33 (13.4%) | 17 (5.4%) |
| 35 to 64 Years | 18 (4.2%) | 27 (8.0%) |
| 65 to 74 Years | 10 (26.3%) | 24 (38.1%) |
| 75 Years and over | 27 (64.3%) | 19 (42.2%) |
Disability Class by Sex by Age in Winchester
Disability Class: Hearing Difficulty
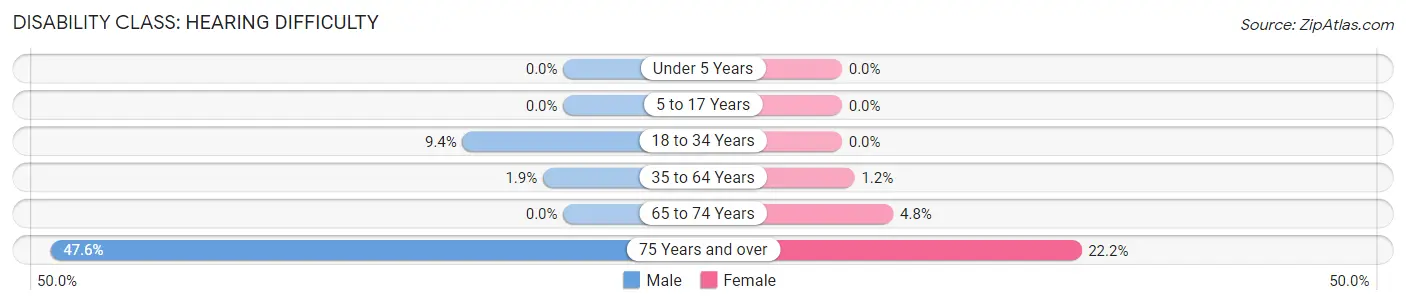
| Age Bracket | Male | Female |
| Under 5 Years | 0 (0.0%) | 0 (0.0%) |
| 5 to 17 Years | 0 (0.0%) | 0 (0.0%) |
| 18 to 34 Years | 23 (9.3%) | 0 (0.0%) |
| 35 to 64 Years | 8 (1.9%) | 4 (1.2%) |
| 65 to 74 Years | 0 (0.0%) | 3 (4.8%) |
| 75 Years and over | 20 (47.6%) | 10 (22.2%) |
Disability Class: Vision Difficulty
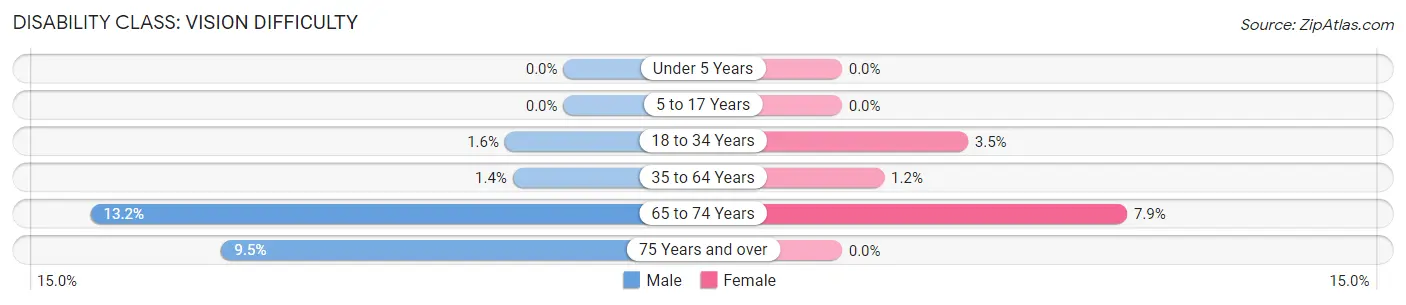
| Age Bracket | Male | Female |
| Under 5 Years | 0 (0.0%) | 0 (0.0%) |
| 5 to 17 Years | 0 (0.0%) | 0 (0.0%) |
| 18 to 34 Years | 4 (1.6%) | 11 (3.5%) |
| 35 to 64 Years | 6 (1.4%) | 4 (1.2%) |
| 65 to 74 Years | 5 (13.2%) | 5 (7.9%) |
| 75 Years and over | 4 (9.5%) | 0 (0.0%) |
Disability Class: Cognitive Difficulty
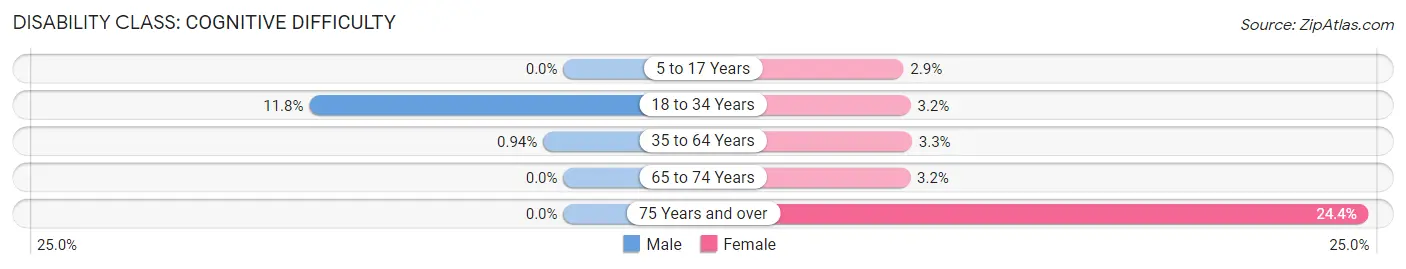
| Age Bracket | Male | Female |
| 5 to 17 Years | 0 (0.0%) | 1 (2.9%) |
| 18 to 34 Years | 29 (11.8%) | 10 (3.2%) |
| 35 to 64 Years | 4 (0.9%) | 11 (3.3%) |
| 65 to 74 Years | 0 (0.0%) | 2 (3.2%) |
| 75 Years and over | 0 (0.0%) | 11 (24.4%) |
Disability Class: Ambulatory Difficulty
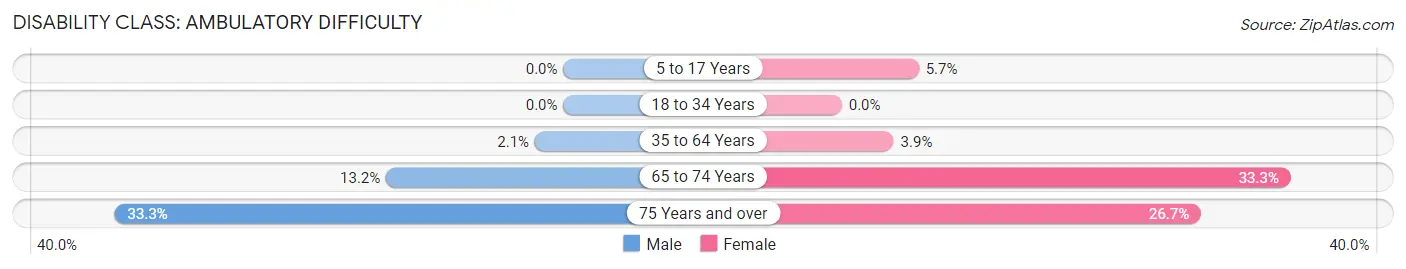
| Age Bracket | Male | Female |
| 5 to 17 Years | 0 (0.0%) | 2 (5.7%) |
| 18 to 34 Years | 0 (0.0%) | 0 (0.0%) |
| 35 to 64 Years | 9 (2.1%) | 13 (3.8%) |
| 65 to 74 Years | 5 (13.2%) | 21 (33.3%) |
| 75 Years and over | 14 (33.3%) | 12 (26.7%) |
Disability Class: Self-Care Difficulty
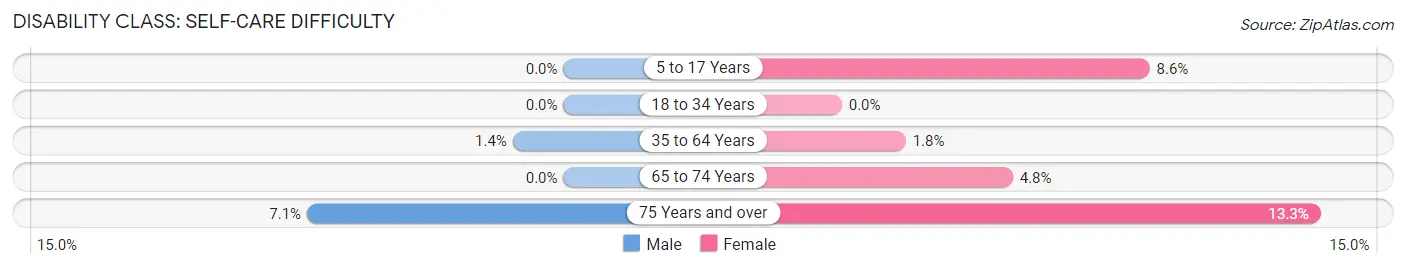
| Age Bracket | Male | Female |
| 5 to 17 Years | 0 (0.0%) | 3 (8.6%) |
| 18 to 34 Years | 0 (0.0%) | 0 (0.0%) |
| 35 to 64 Years | 6 (1.4%) | 6 (1.8%) |
| 65 to 74 Years | 0 (0.0%) | 3 (4.8%) |
| 75 Years and over | 3 (7.1%) | 6 (13.3%) |
Technology Access in Winchester
Computing Device Access in Winchester
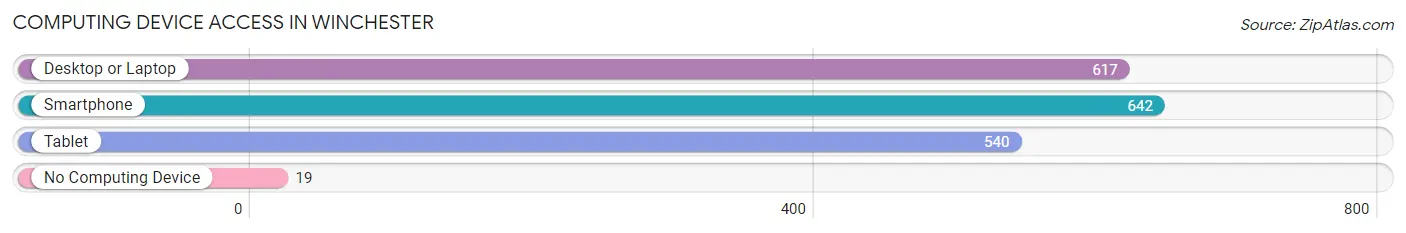
| Device Type | # Households | % Households |
| Desktop or Laptop | 617 | 88.3% |
| Smartphone | 642 | 91.8% |
| Tablet | 540 | 77.2% |
| No Computing Device | 19 | 2.7% |
| Total | 699 | 100.0% |
Internet Access in Winchester
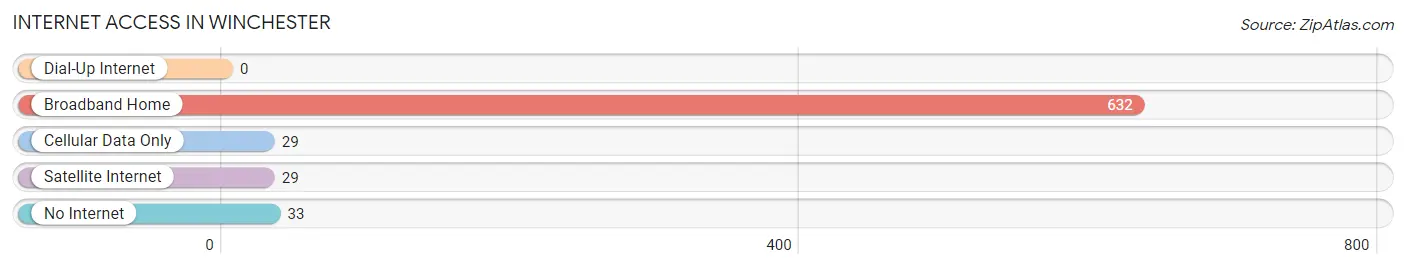
| Internet Type | # Households | % Households |
| Dial-Up Internet | 0 | 0.0% |
| Broadband Home | 632 | 90.4% |
| Cellular Data Only | 29 | 4.2% |
| Satellite Internet | 29 | 4.2% |
| No Internet | 33 | 4.7% |
| Total | 699 | 100.0% |
Winchester Summary
Winchester, Missouri is a small town located in the northeast corner of the state, just south of the Iowa border. It is part of the Hannibal-LaGrange University district and is home to a population of just over 1,000 people. The town was founded in 1837 and has a rich history of farming, industry, and education.
Geography
Winchester is located in Marion County, Missouri, in the northeast corner of the state. It is situated on the banks of the Mississippi River, just south of the Iowa border. The town is surrounded by rolling hills and farmland, and is located about 30 miles from the nearest major city, Hannibal.
The climate in Winchester is typical of the Midwest, with hot summers and cold winters. The average temperature in the summer is around 80 degrees Fahrenheit, while the average temperature in the winter is around 30 degrees Fahrenheit. The town receives an average of 40 inches of precipitation each year, with most of it falling in the spring and summer months.
Economy
The economy of Winchester is largely based on agriculture and industry. The town is home to several large farms, which produce a variety of crops, including corn, soybeans, and wheat. The town also has several small businesses, including a grocery store, a hardware store, and a few restaurants.
The town is also home to a number of manufacturing companies, including a plastics factory and a furniture factory. These companies provide jobs for many of the town's residents.
Demographics
As of the 2010 census, the population of Winchester was 1,072. The racial makeup of the town was 97.3% White, 0.7% African American, 0.2% Native American, 0.2% Asian, 0.1% Pacific Islander, and 1.5% from other races. The median household income was $37,917, and the median family income was $45,625.
Education
Winchester is part of the Hannibal-LaGrange University district. The town is home to a public elementary school, a middle school, and a high school. The town also has a private Christian school, which serves students in grades K-12.
Conclusion
Winchester, Missouri is a small town with a rich history and a strong economy. The town is home to a variety of businesses and industries, and is part of the Hannibal-LaGrange University district. The town has a population of just over 1,000 people, and the median household income is $37,917. Winchester is a great place to live and work, and is a great example of a small town in the Midwest.
Common Questions
What is Per Capita Income in Winchester?
Per Capita income in Winchester is $31,034.
What is the Median Family Income in Winchester?
Median Family Income in Winchester is $86,063.
What is the Median Household income in Winchester?
Median Household Income in Winchester is $82,163.
What is Income or Wage Gap in Winchester?
Income or Wage Gap in Winchester is 4.2%.
Women in Winchester earn 95.8 cents for every dollar earned by a man.
What is Inequality or Gini Index in Winchester?
Inequality or Gini Index in Winchester is 0.29.
What is the Total Population of Winchester?
Total Population of Winchester is 1,977.
What is the Total Male Population of Winchester?
Total Male Population of Winchester is 1,053.
What is the Total Female Population of Winchester?
Total Female Population of Winchester is 924.
What is the Ratio of Males per 100 Females in Winchester?
There are 113.96 Males per 100 Females in Winchester.
What is the Ratio of Females per 100 Males in Winchester?
There are 87.75 Females per 100 Males in Winchester.
What is the Median Population Age in Winchester?
Median Population Age in Winchester is 38.6 Years.
What is the Average Family Size in Winchester
Average Family Size in Winchester is 3.2 People.
What is the Average Household Size in Winchester
Average Household Size in Winchester is 2.7 People.
How Large is the Labor Force in Winchester?
There are 1,264 People in the Labor Forcein in Winchester.
What is the Percentage of People in the Labor Force in Winchester?
77.0% of People are in the Labor Force in Winchester.
What is the Unemployment Rate in Winchester?
Unemployment Rate in Winchester is 3.1%.