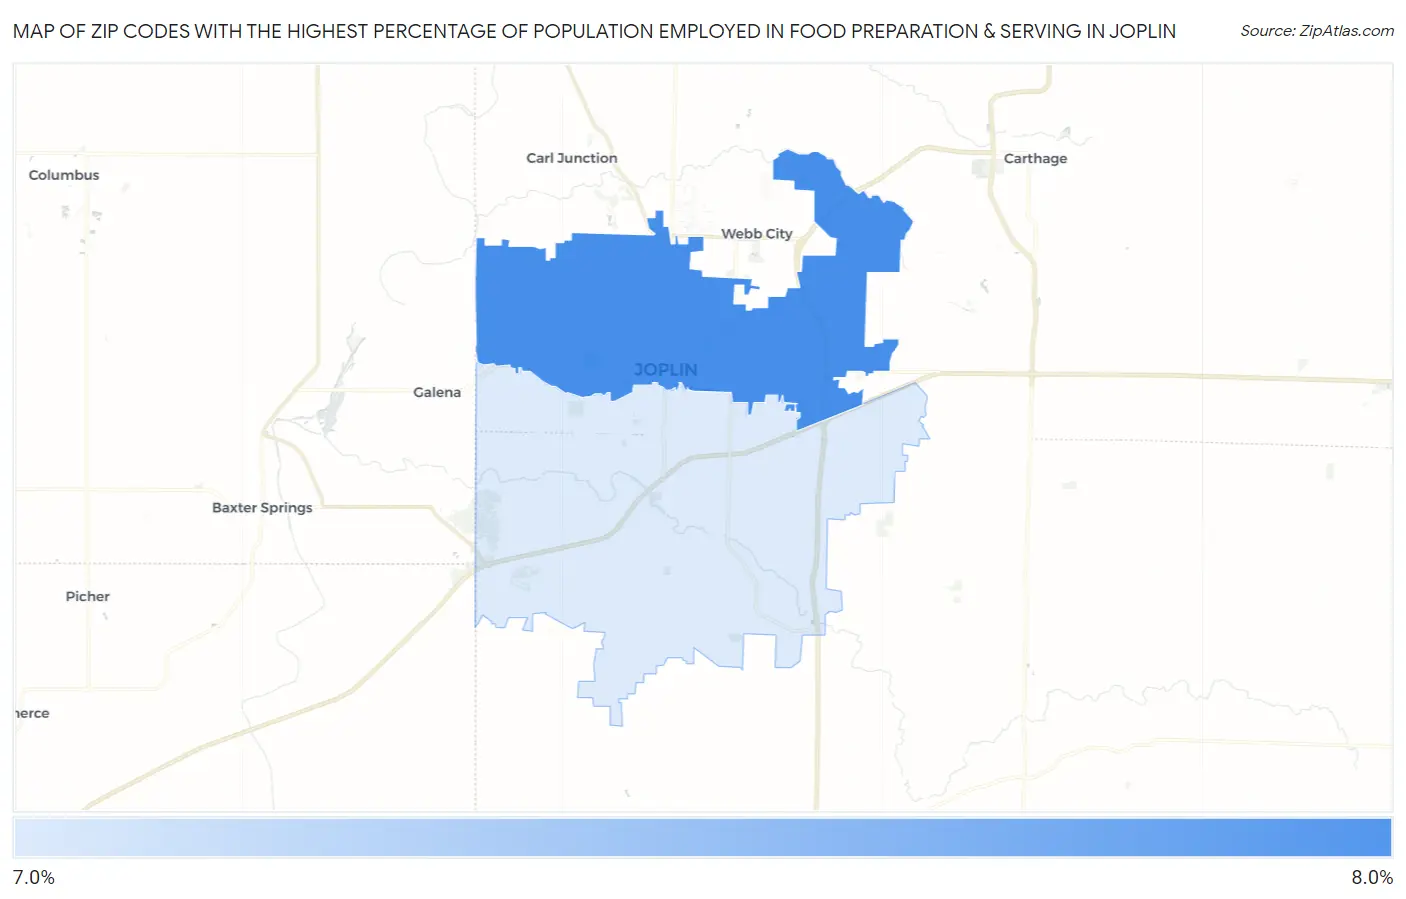
Zip Codes with the Highest Percentage of Population Employed in Food Preparation & Serving in Joplin, MO
RELATED REPORTS & OPTIONS
Food Preparation & Serving
Joplin
Compare Zip Codes
Map of Zip Codes with the Highest Percentage of Population Employed in Food Preparation & Serving in Joplin
7.1%
7.9%
Zip Codes with the Highest Percentage of Population Employed in Food Preparation & Serving in Joplin, MO
| Zip Code | % Employed | vs State | vs National | |
| 1. | 64801 | 7.9% | 5.2%(+2.69)#154 | 5.3%(+2.64)#4,852 |
| 2. | 64804 | 7.1% | 5.2%(+1.90)#206 | 5.3%(+1.85)#6,264 |
1
Common Questions
What are the Top Zip Codes with the Highest Percentage of Population Employed in Food Preparation & Serving in Joplin, MO?
Top Zip Codes with the Highest Percentage of Population Employed in Food Preparation & Serving in Joplin, MO are:
What zip code has the Highest Percentage of Population Employed in Food Preparation & Serving in Joplin, MO?
64801 has the Highest Percentage of Population Employed in Food Preparation & Serving in Joplin, MO with 7.9%.
What is the Percentage of Population Employed in Food Preparation & Serving in Joplin, MO?
Percentage of Population Employed in Food Preparation & Serving in Joplin is 8.5%.
What is the Percentage of Population Employed in Food Preparation & Serving in Missouri?
Percentage of Population Employed in Food Preparation & Serving in Missouri is 5.2%.
What is the Percentage of Population Employed in Food Preparation & Serving in the United States?
Percentage of Population Employed in Food Preparation & Serving in the United States is 5.3%.