Hillsdale, MO Map & Demographics
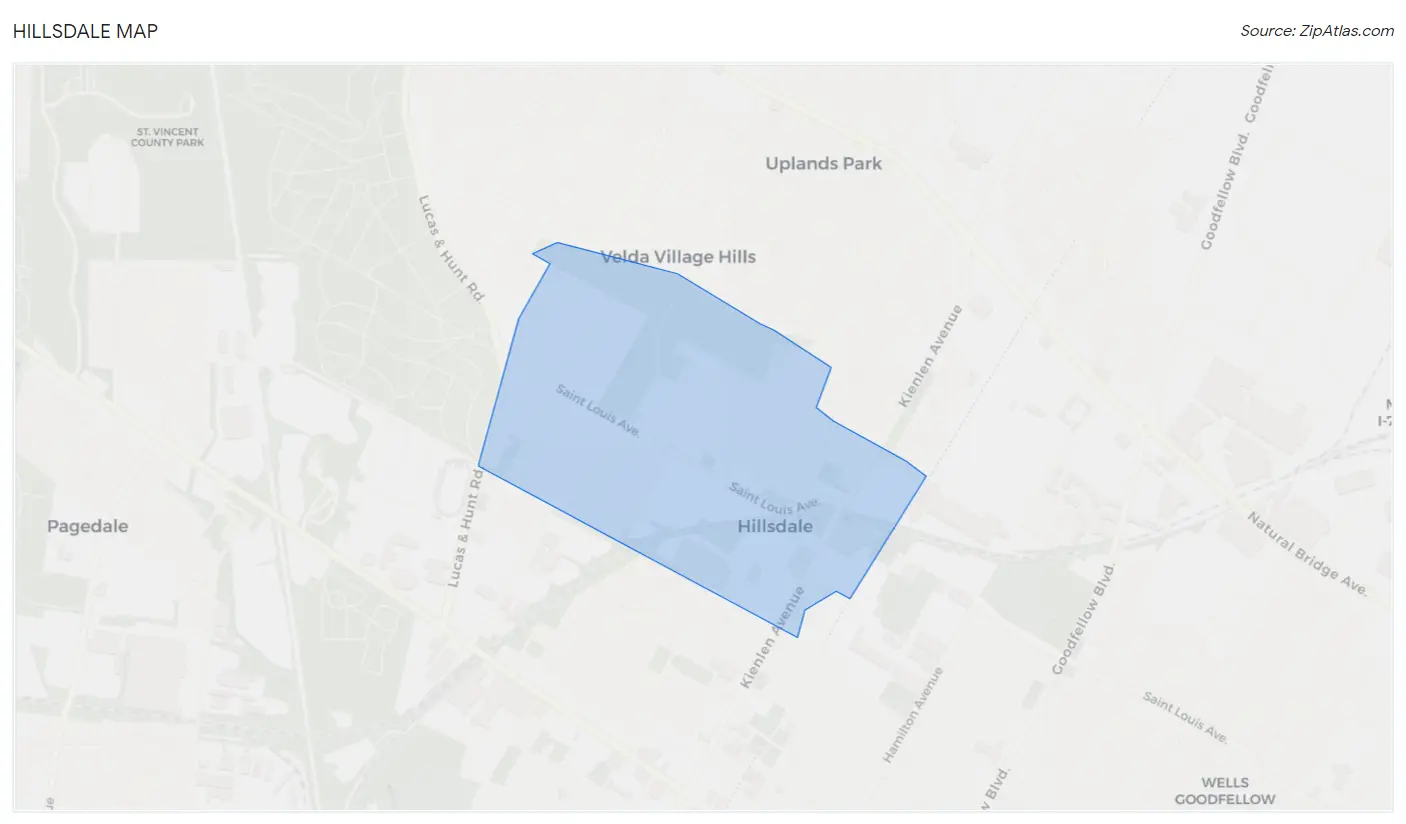
Hillsdale Map
Hillsdale Overview
$15,336
PER CAPITA INCOME
$39,750
AVG FAMILY INCOME
$35,735
AVG HOUSEHOLD INCOME
6.2%
WAGE / INCOME GAP [ % ]
93.8¢/ $1
WAGE / INCOME GAP [ $ ]
0.38
INEQUALITY / GINI INDEX
1,070
TOTAL POPULATION
476
MALE POPULATION
594
FEMALE POPULATION
80.13
MALES / 100 FEMALES
124.79
FEMALES / 100 MALES
24.9
MEDIAN AGE
3.6
AVG FAMILY SIZE
2.9
AVG HOUSEHOLD SIZE
515
LABOR FORCE [ PEOPLE ]
74.2%
PERCENT IN LABOR FORCE
3.1%
UNEMPLOYMENT RATE
Hillsdale Area Codes
Income in Hillsdale
Income Overview in Hillsdale
Per Capita Income in Hillsdale is $15,336, while median incomes of families and households are $39,750 and $35,735 respectively.
| Characteristic | Number | Measure |
| Per Capita Income | 1,070 | $15,336 |
| Median Family Income | 257 | $39,750 |
| Mean Family Income | 257 | $46,189 |
| Median Household Income | 368 | $35,735 |
| Mean Household Income | 368 | $41,448 |
| Income Deficit | 257 | $0 |
| Wage / Income Gap (%) | 1,070 | 6.21% |
| Wage / Income Gap ($) | 1,070 | 93.79¢ per $1 |
| Gini / Inequality Index | 1,070 | 0.38 |
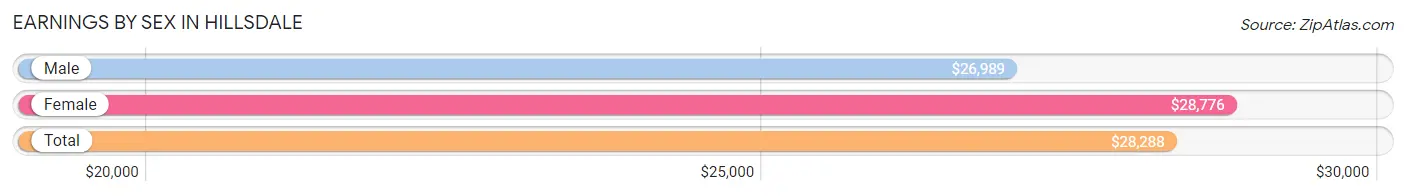
Earnings by Sex in Hillsdale
Average Earnings in Hillsdale are $28,288, $26,989 for men and $28,776 for women, a difference of 6.2%.
| Sex | Number | Average Earnings |
| Male | 197 (38.9%) | $26,989 |
| Female | 310 (61.1%) | $28,776 |
| Total | 507 (100.0%) | $28,288 |
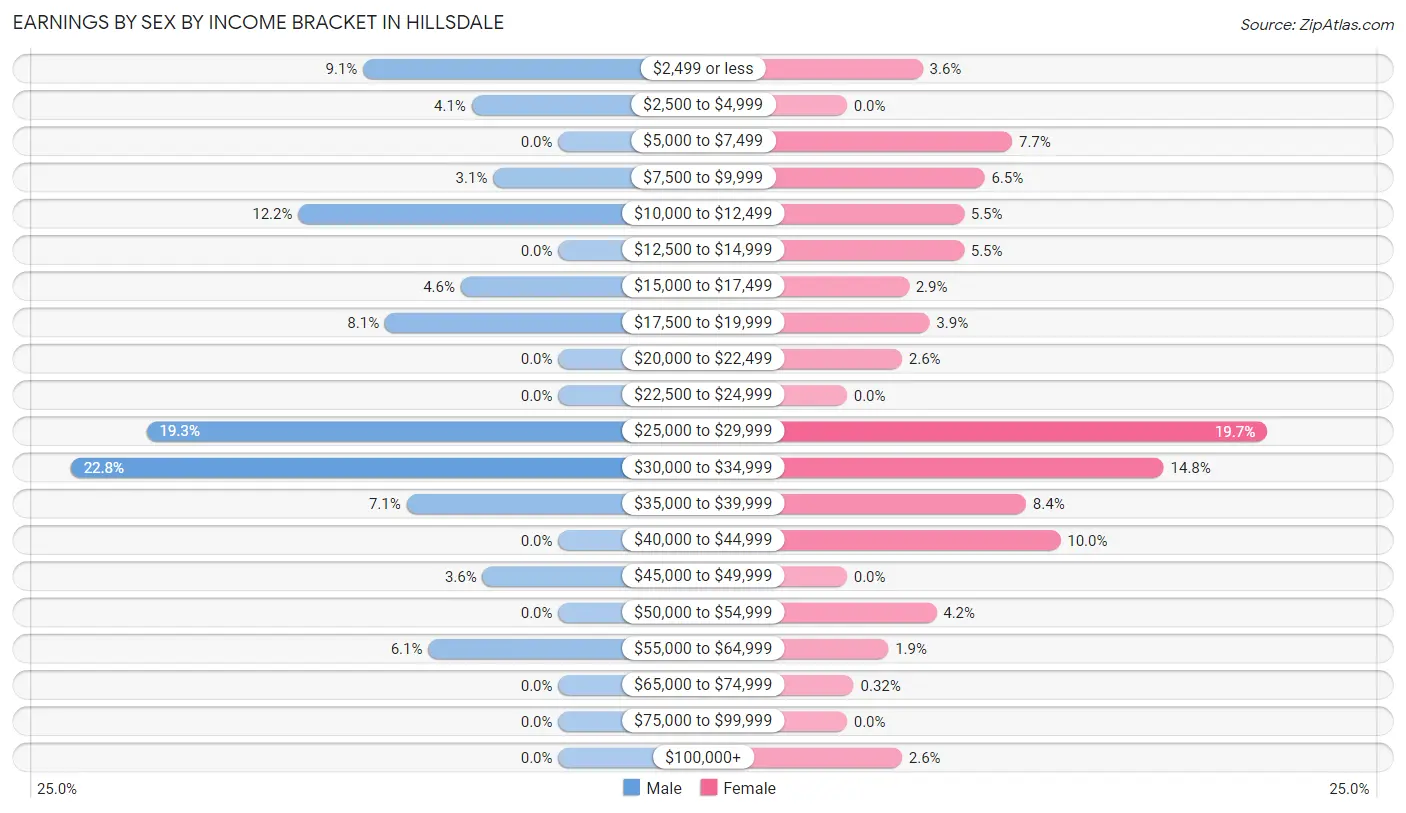
Earnings by Sex by Income Bracket in Hillsdale
The most common earnings brackets in Hillsdale are $30,000 to $34,999 for men (45 | 22.8%) and $25,000 to $29,999 for women (61 | 19.7%).
| Income | Male | Female |
| $2,499 or less | 18 (9.1%) | 11 (3.5%) |
| $2,500 to $4,999 | 8 (4.1%) | 0 (0.0%) |
| $5,000 to $7,499 | 0 (0.0%) | 24 (7.7%) |
| $7,500 to $9,999 | 6 (3.0%) | 20 (6.5%) |
| $10,000 to $12,499 | 24 (12.2%) | 17 (5.5%) |
| $12,500 to $14,999 | 0 (0.0%) | 17 (5.5%) |
| $15,000 to $17,499 | 9 (4.6%) | 9 (2.9%) |
| $17,500 to $19,999 | 16 (8.1%) | 12 (3.9%) |
| $20,000 to $22,499 | 0 (0.0%) | 8 (2.6%) |
| $22,500 to $24,999 | 0 (0.0%) | 0 (0.0%) |
| $25,000 to $29,999 | 38 (19.3%) | 61 (19.7%) |
| $30,000 to $34,999 | 45 (22.8%) | 46 (14.8%) |
| $35,000 to $39,999 | 14 (7.1%) | 26 (8.4%) |
| $40,000 to $44,999 | 0 (0.0%) | 31 (10.0%) |
| $45,000 to $49,999 | 7 (3.5%) | 0 (0.0%) |
| $50,000 to $54,999 | 0 (0.0%) | 13 (4.2%) |
| $55,000 to $64,999 | 12 (6.1%) | 6 (1.9%) |
| $65,000 to $74,999 | 0 (0.0%) | 1 (0.3%) |
| $75,000 to $99,999 | 0 (0.0%) | 0 (0.0%) |
| $100,000+ | 0 (0.0%) | 8 (2.6%) |
| Total | 197 (100.0%) | 310 (100.0%) |
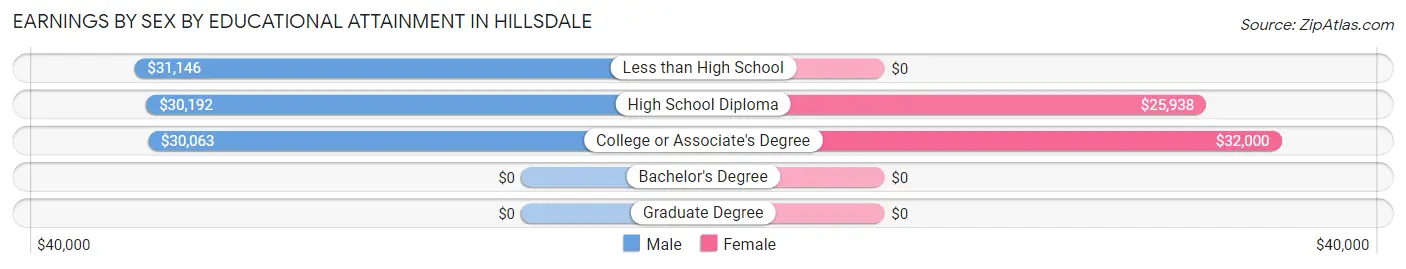
Earnings by Sex by Educational Attainment in Hillsdale
Average earnings in Hillsdale are $30,278 for men and $28,836 for women, a difference of 4.8%. Men with an educational attainment of less than high school enjoy the highest average annual earnings of $31,146, while those with college or associate's degree education earn the least with $30,063. Women with an educational attainment of college or associate's degree earn the most with the average annual earnings of $32,000, while those with high school diploma education have the smallest earnings of $25,938.
| Educational Attainment | Male Income | Female Income |
| Less than High School | $31,146 | $0 |
| High School Diploma | $30,192 | $25,938 |
| College or Associate's Degree | $30,063 | $32,000 |
| Bachelor's Degree | - | - |
| Graduate Degree | - | - |
| Total | $30,278 | $28,836 |
Family Income in Hillsdale
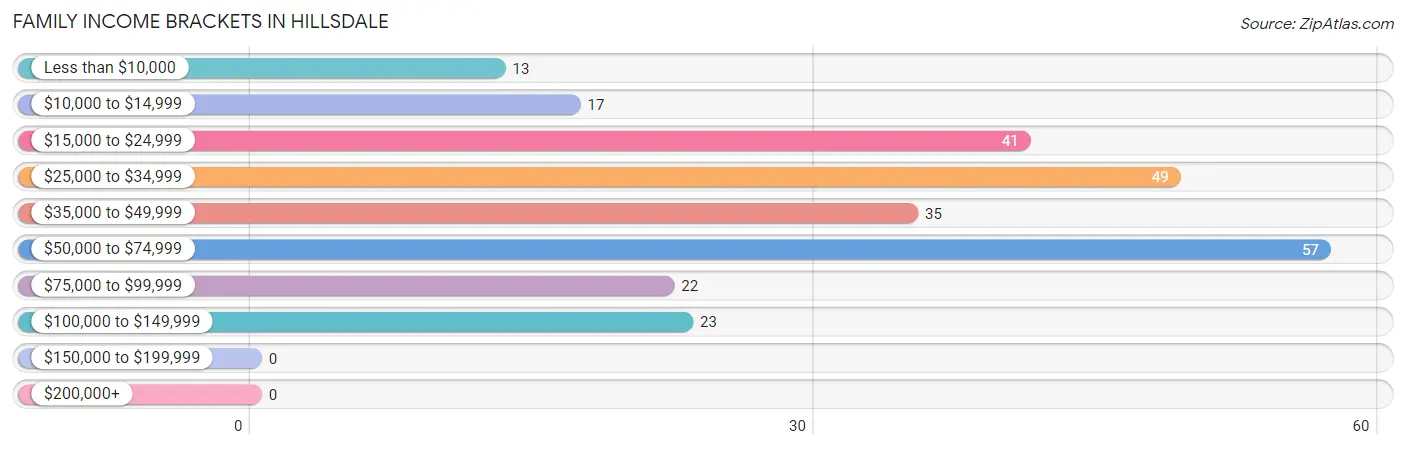
Family Income Brackets in Hillsdale
According to the Hillsdale family income data, there are 57 families falling into the $50,000 to $74,999 income range, which is the most common income bracket and makes up 22.2% of all families.
| Income Bracket | # Families | % Families |
| Less than $10,000 | 13 | 5.1% |
| $10,000 to $14,999 | 17 | 6.6% |
| $15,000 to $24,999 | 41 | 16.0% |
| $25,000 to $34,999 | 49 | 19.1% |
| $35,000 to $49,999 | 35 | 13.6% |
| $50,000 to $74,999 | 57 | 22.2% |
| $75,000 to $99,999 | 22 | 8.6% |
| $100,000 to $149,999 | 23 | 8.9% |
| $150,000 to $199,999 | 0 | 0.0% |
| $200,000+ | 0 | 0.0% |
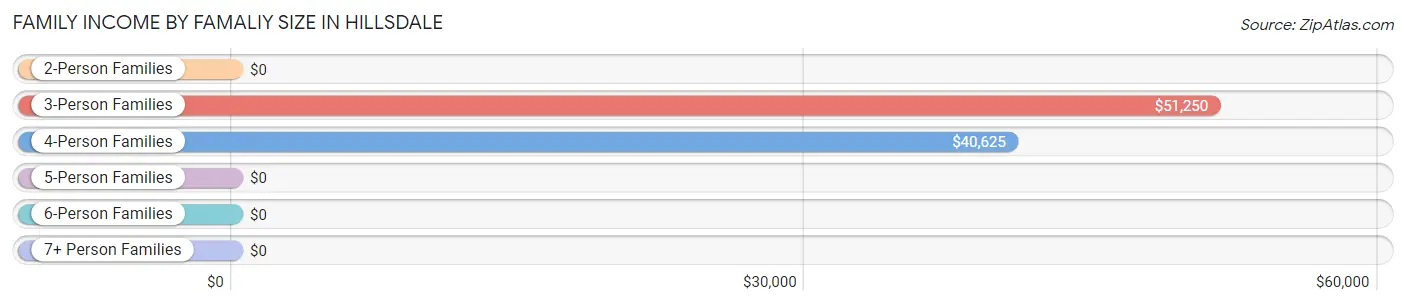
Family Income by Famaliy Size in Hillsdale
3-person families (44 | 17.1%) account for the highest median family income in Hillsdale with $51,250 per family, while 3-person families (44 | 17.1%) have the highest median income of $17,083 per family member.
| Income Bracket | # Families | Median Income |
| 2-Person Families | 65 (25.3%) | $0 |
| 3-Person Families | 44 (17.1%) | $51,250 |
| 4-Person Families | 148 (57.6%) | $40,625 |
| 5-Person Families | 0 (0.0%) | $0 |
| 6-Person Families | 0 (0.0%) | $0 |
| 7+ Person Families | 0 (0.0%) | $0 |
| Total | 257 (100.0%) | $39,750 |
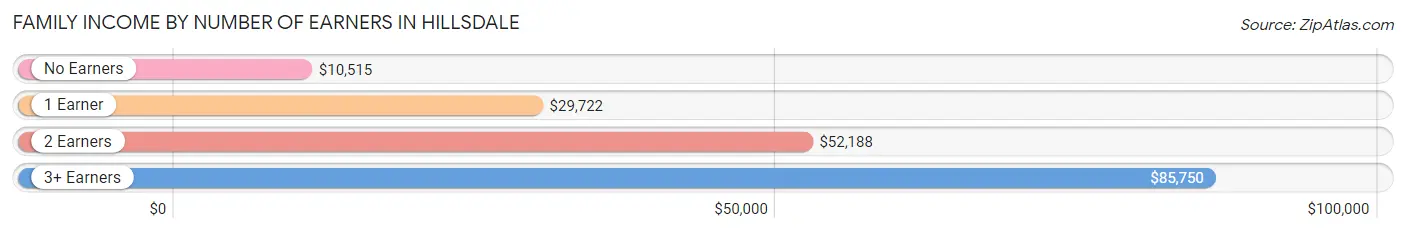
Family Income by Number of Earners in Hillsdale
The median family income in Hillsdale is $39,750, with families comprising 3+ earners (31) having the highest median family income of $85,750, while families with no earners (33) have the lowest median family income of $10,515, accounting for 12.1% and 12.8% of families, respectively.
| Number of Earners | # Families | Median Income |
| No Earners | 33 (12.8%) | $10,515 |
| 1 Earner | 116 (45.1%) | $29,722 |
| 2 Earners | 77 (30.0%) | $52,188 |
| 3+ Earners | 31 (12.1%) | $85,750 |
| Total | 257 (100.0%) | $39,750 |
Household Income in Hillsdale
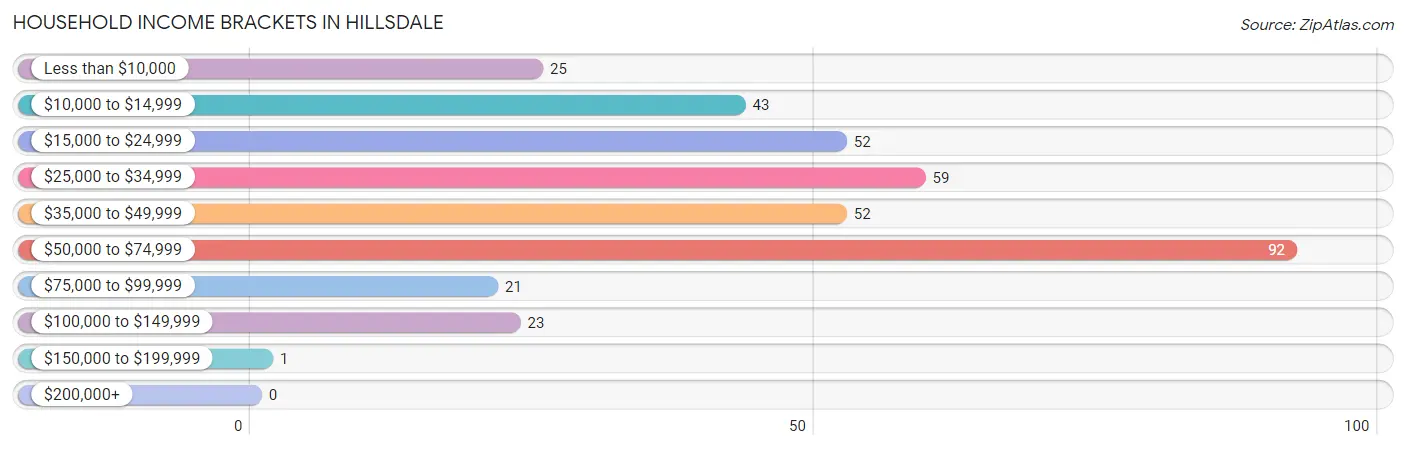
Household Income Brackets in Hillsdale
With 92 households falling in the category, the $50,000 to $74,999 income range is the most frequent in Hillsdale, accounting for 25.0% of all households.
| Income Bracket | # Households | % Households |
| Less than $10,000 | 25 | 6.8% |
| $10,000 to $14,999 | 43 | 11.7% |
| $15,000 to $24,999 | 52 | 14.1% |
| $25,000 to $34,999 | 59 | 16.0% |
| $35,000 to $49,999 | 52 | 14.1% |
| $50,000 to $74,999 | 92 | 25.0% |
| $75,000 to $99,999 | 21 | 5.7% |
| $100,000 to $149,999 | 23 | 6.3% |
| $150,000 to $199,999 | 1 | 0.3% |
| $200,000+ | 0 | 0.0% |
Household Income by Householder Age in Hillsdale
The median household income in Hillsdale is $35,735, with the highest median household income of $38,000 found in the 25 to 44 years age bracket for the primary householder. A total of 176 households (47.8%) fall into this category. Meanwhile, the 15 to 24 years age bracket for the primary householder has the lowest median household income of $0, with 14 households (3.8%) in this group.
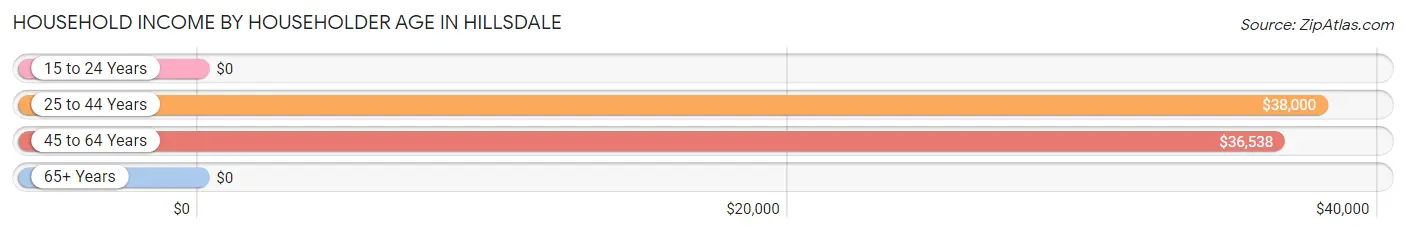
| Income Bracket | # Households | Median Income |
| 15 to 24 Years | 14 (3.8%) | $0 |
| 25 to 44 Years | 176 (47.8%) | $38,000 |
| 45 to 64 Years | 130 (35.3%) | $36,538 |
| 65+ Years | 48 (13.0%) | $0 |
| Total | 368 (100.0%) | $35,735 |
Poverty in Hillsdale
Income Below Poverty by Sex and Age in Hillsdale
With 28.6% poverty level for males and 39.6% for females among the residents of Hillsdale, 35 to 44 year old males and 15 year old females are the most vulnerable to poverty, with 22 males (84.6%) and 18 females (100.0%) in their respective age groups living below the poverty level.
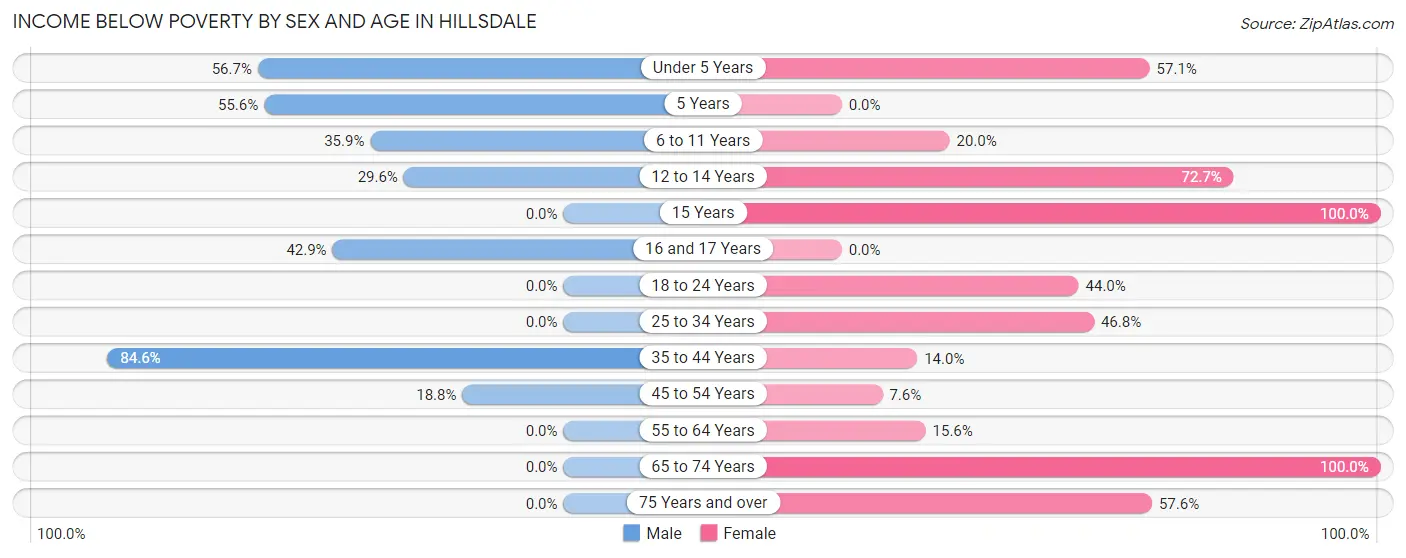
| Age Bracket | Male | Female |
| Under 5 Years | 59 (56.7%) | 40 (57.1%) |
| 5 Years | 10 (55.6%) | 0 (0.0%) |
| 6 to 11 Years | 19 (35.8%) | 10 (20.0%) |
| 12 to 14 Years | 8 (29.6%) | 8 (72.7%) |
| 15 Years | 0 (0.0%) | 18 (100.0%) |
| 16 and 17 Years | 9 (42.9%) | 0 (0.0%) |
| 18 to 24 Years | 0 (0.0%) | 40 (44.0%) |
| 25 to 34 Years | 0 (0.0%) | 66 (46.8%) |
| 35 to 44 Years | 22 (84.6%) | 7 (14.0%) |
| 45 to 54 Years | 9 (18.8%) | 4 (7.5%) |
| 55 to 64 Years | 0 (0.0%) | 7 (15.6%) |
| 65 to 74 Years | 0 (0.0%) | 13 (100.0%) |
| 75 Years and over | 0 (0.0%) | 19 (57.6%) |
| Total | 136 (28.6%) | 232 (39.6%) |
Income Above Poverty by Sex and Age in Hillsdale
According to the poverty statistics in Hillsdale, males aged 15 years and females aged 16 and 17 years are the age groups that are most secure financially, with 100.0% of males and 100.0% of females in these age groups living above the poverty line.
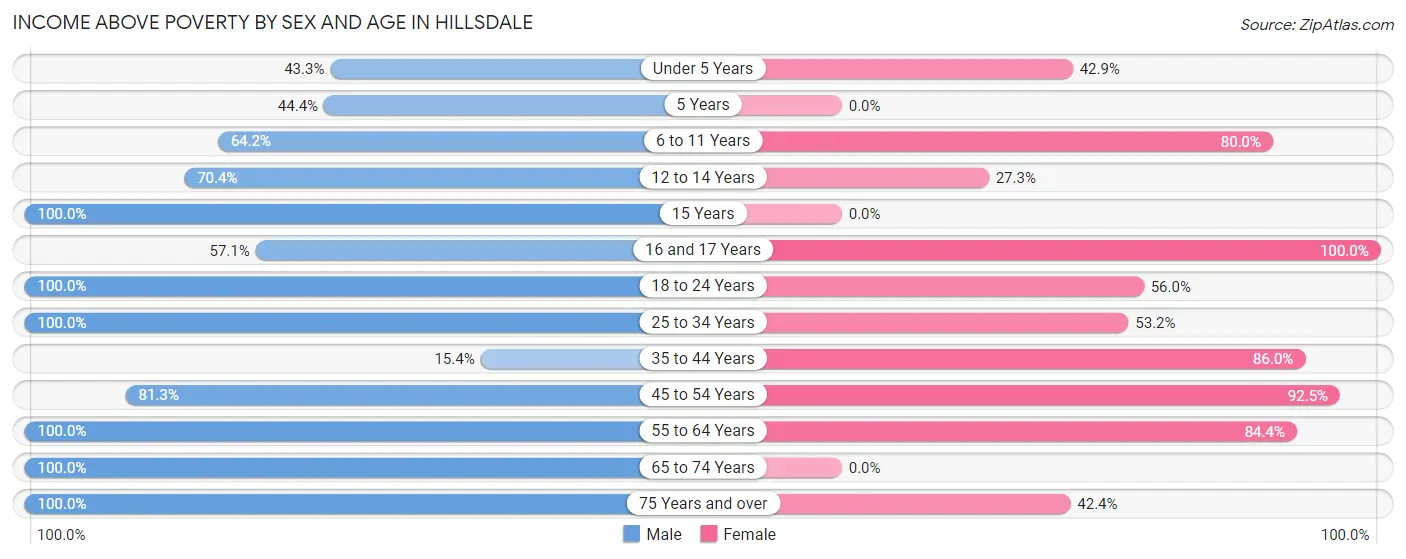
| Age Bracket | Male | Female |
| Under 5 Years | 45 (43.3%) | 30 (42.9%) |
| 5 Years | 8 (44.4%) | 0 (0.0%) |
| 6 to 11 Years | 34 (64.1%) | 40 (80.0%) |
| 12 to 14 Years | 19 (70.4%) | 3 (27.3%) |
| 15 Years | 17 (100.0%) | 0 (0.0%) |
| 16 and 17 Years | 12 (57.1%) | 11 (100.0%) |
| 18 to 24 Years | 39 (100.0%) | 51 (56.0%) |
| 25 to 34 Years | 93 (100.0%) | 75 (53.2%) |
| 35 to 44 Years | 4 (15.4%) | 43 (86.0%) |
| 45 to 54 Years | 39 (81.2%) | 49 (92.4%) |
| 55 to 64 Years | 22 (100.0%) | 38 (84.4%) |
| 65 to 74 Years | 5 (100.0%) | 0 (0.0%) |
| 75 Years and over | 3 (100.0%) | 14 (42.4%) |
| Total | 340 (71.4%) | 354 (60.4%) |
Income Below Poverty Among Married-Couple Families in Hillsdale
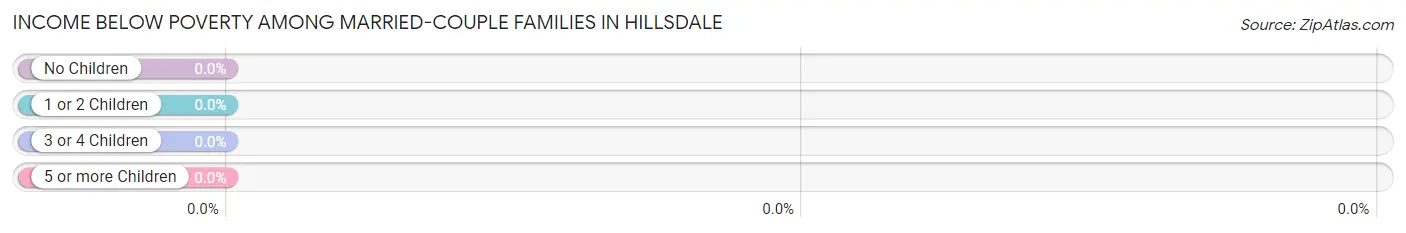
| Children | Above Poverty | Below Poverty |
| No Children | 15 (100.0%) | 0 (0.0%) |
| 1 or 2 Children | 37 (100.0%) | 0 (0.0%) |
| 3 or 4 Children | 0 (0.0%) | 0 (0.0%) |
| 5 or more Children | 0 (0.0%) | 0 (0.0%) |
| Total | 52 (100.0%) | 0 (0.0%) |
Income Below Poverty Among Single-Parent Households in Hillsdale
According to the poverty data in Hillsdale, 42.4% or 14 single-father households and 39.5% or 68 single-mother households are living below the poverty line. Among single-father households, those with 1 or 2 children have the highest poverty rate, with 14 households (100.0%) experiencing poverty. Likewise, among single-mother households, those with 3 or 4 children have the highest poverty rate, with 26 households (49.1%) falling below the poverty line.
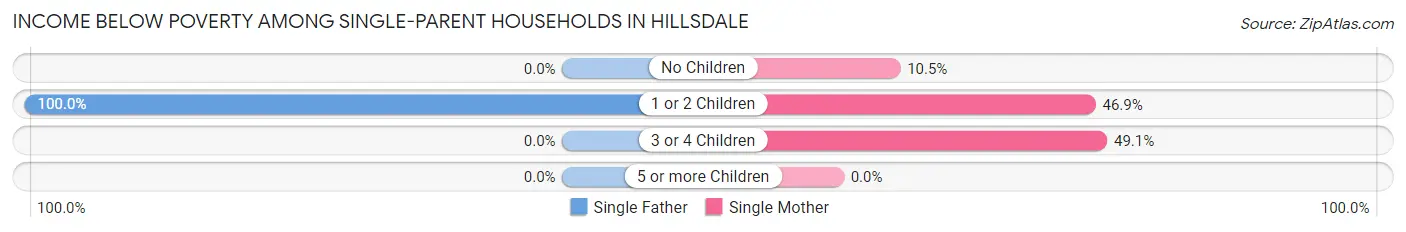
| Children | Single Father | Single Mother |
| No Children | 0 (0.0%) | 4 (10.5%) |
| 1 or 2 Children | 14 (100.0%) | 38 (46.9%) |
| 3 or 4 Children | 0 (0.0%) | 26 (49.1%) |
| 5 or more Children | 0 (0.0%) | 0 (0.0%) |
| Total | 14 (42.4%) | 68 (39.5%) |
Income Below Poverty Among Married-Couple vs Single-Parent Households in Hillsdale
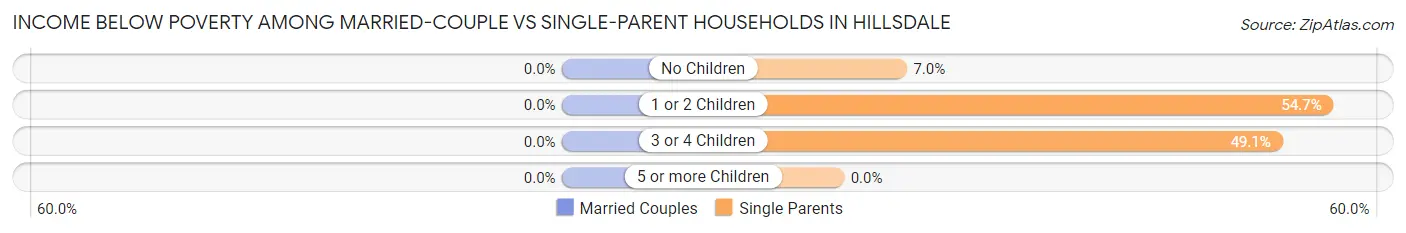
| Children | Married-Couple Families | Single-Parent Households |
| No Children | 0 (0.0%) | 4 (7.0%) |
| 1 or 2 Children | 0 (0.0%) | 52 (54.7%) |
| 3 or 4 Children | 0 (0.0%) | 26 (49.1%) |
| 5 or more Children | 0 (0.0%) | 0 (0.0%) |
| Total | 0 (0.0%) | 82 (40.0%) |
Race in Hillsdale
The most populous races in Hillsdale are Black / African American (1,044 | 97.6%), Two or more Races (16 | 1.5%), and White / Caucasian (7 | 0.6%).
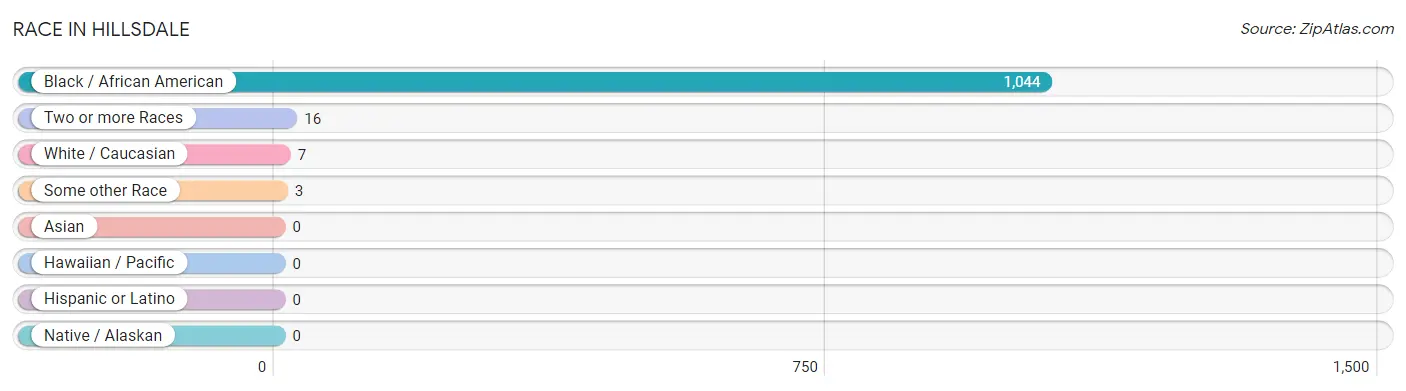
| Race | # Population | % Population |
| Asian | 0 | 0.0% |
| Black / African American | 1,044 | 97.6% |
| Hawaiian / Pacific | 0 | 0.0% |
| Hispanic or Latino | 0 | 0.0% |
| Native / Alaskan | 0 | 0.0% |
| White / Caucasian | 7 | 0.6% |
| Two or more Races | 16 | 1.5% |
| Some other Race | 3 | 0.3% |
| Total | 1,070 | 100.0% |
Ancestry in Hillsdale
The most populous ancestries reported in Hillsdale are American (83 | 7.8%), and Cherokee (9 | 0.8%), together accounting for 8.6% of all Hillsdale residents.
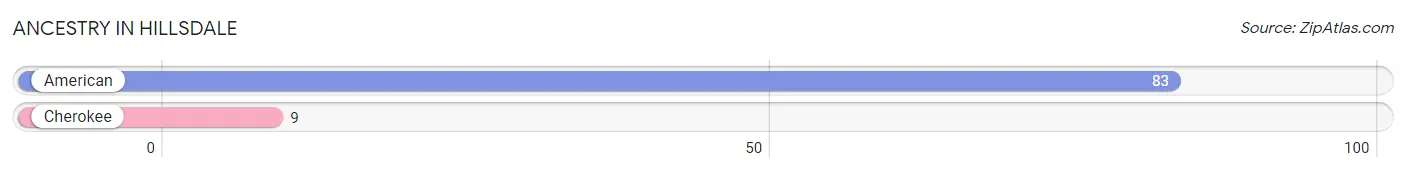
| Ancestry | # Population | % Population |
| American | 83 | 7.8% |
| Cherokee | 9 | 0.8% | View All 2 Rows |
Immigrants in Hillsdale

| Immigration Origin | # Population | % Population | View All 0 Rows |
Sex and Age in Hillsdale
Sex and Age in Hillsdale
The most populous age groups in Hillsdale are Under 5 Years (104 | 21.8%) for men and 20 to 24 Years (91 | 15.3%) for women.
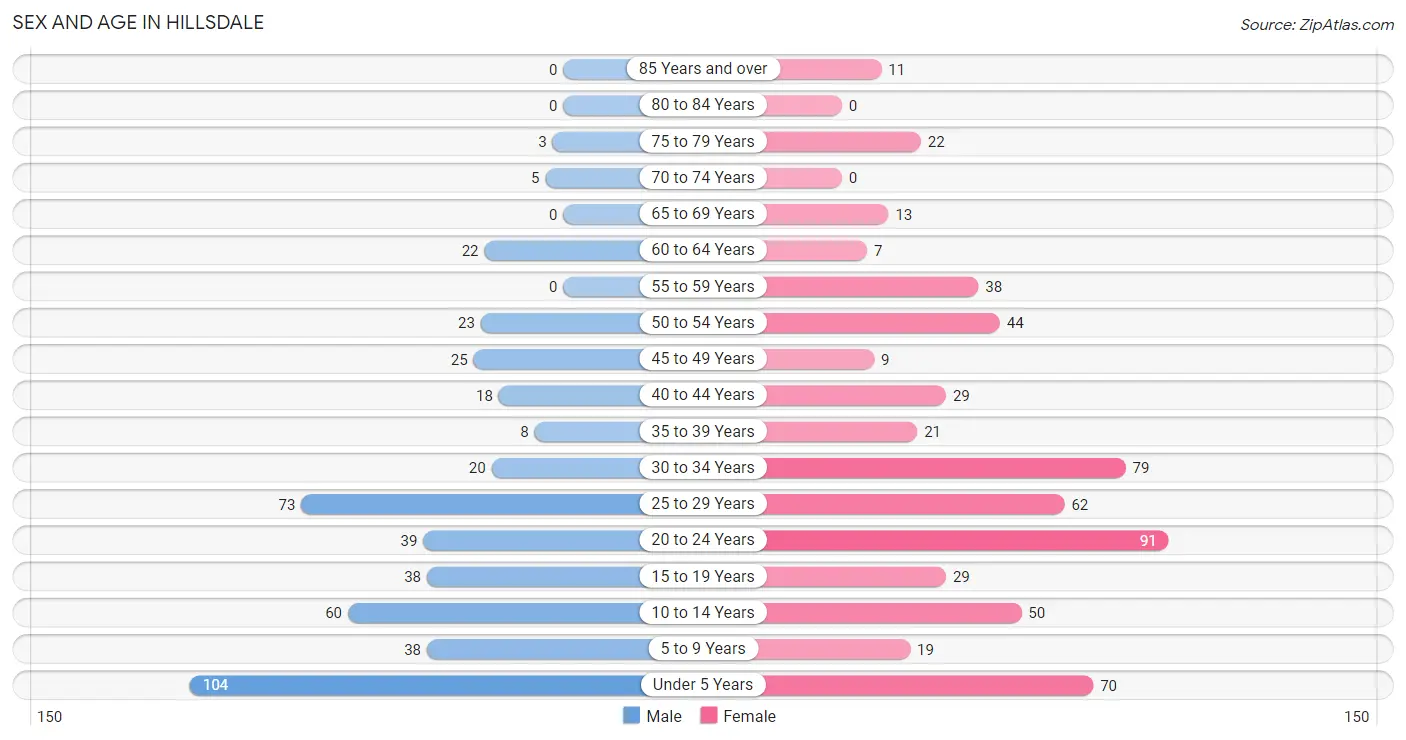
| Age Bracket | Male | Female |
| Under 5 Years | 104 (21.8%) | 70 (11.8%) |
| 5 to 9 Years | 38 (8.0%) | 19 (3.2%) |
| 10 to 14 Years | 60 (12.6%) | 50 (8.4%) |
| 15 to 19 Years | 38 (8.0%) | 29 (4.9%) |
| 20 to 24 Years | 39 (8.2%) | 91 (15.3%) |
| 25 to 29 Years | 73 (15.3%) | 62 (10.4%) |
| 30 to 34 Years | 20 (4.2%) | 79 (13.3%) |
| 35 to 39 Years | 8 (1.7%) | 21 (3.5%) |
| 40 to 44 Years | 18 (3.8%) | 29 (4.9%) |
| 45 to 49 Years | 25 (5.2%) | 9 (1.5%) |
| 50 to 54 Years | 23 (4.8%) | 44 (7.4%) |
| 55 to 59 Years | 0 (0.0%) | 38 (6.4%) |
| 60 to 64 Years | 22 (4.6%) | 7 (1.2%) |
| 65 to 69 Years | 0 (0.0%) | 13 (2.2%) |
| 70 to 74 Years | 5 (1.1%) | 0 (0.0%) |
| 75 to 79 Years | 3 (0.6%) | 22 (3.7%) |
| 80 to 84 Years | 0 (0.0%) | 0 (0.0%) |
| 85 Years and over | 0 (0.0%) | 11 (1.8%) |
| Total | 476 (100.0%) | 594 (100.0%) |
Families and Households in Hillsdale
Median Family Size in Hillsdale
The median family size in Hillsdale is 3.65 persons per family, with single male/father families (33 | 12.8%) accounting for the largest median family size of 3.7 persons per family. On the other hand, married-couple families (52 | 20.2%) represent the smallest median family size with 3.54 persons per family.
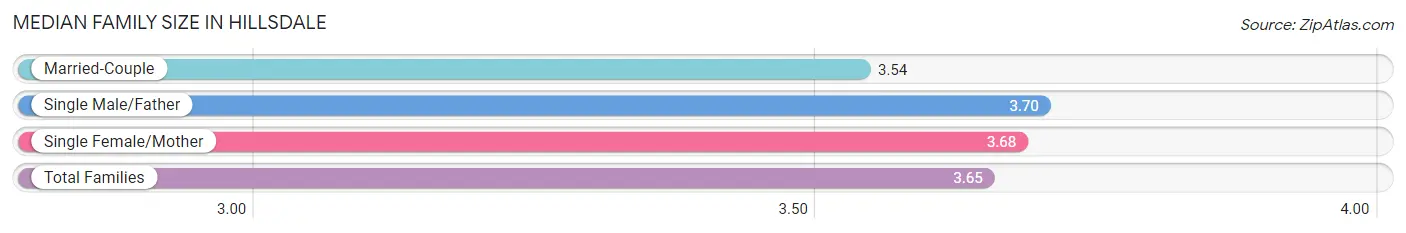
| Family Type | # Families | Family Size |
| Married-Couple | 52 (20.2%) | 3.54 |
| Single Male/Father | 33 (12.8%) | 3.70 |
| Single Female/Mother | 172 (66.9%) | 3.68 |
| Total Families | 257 (100.0%) | 3.65 |
Median Household Size in Hillsdale
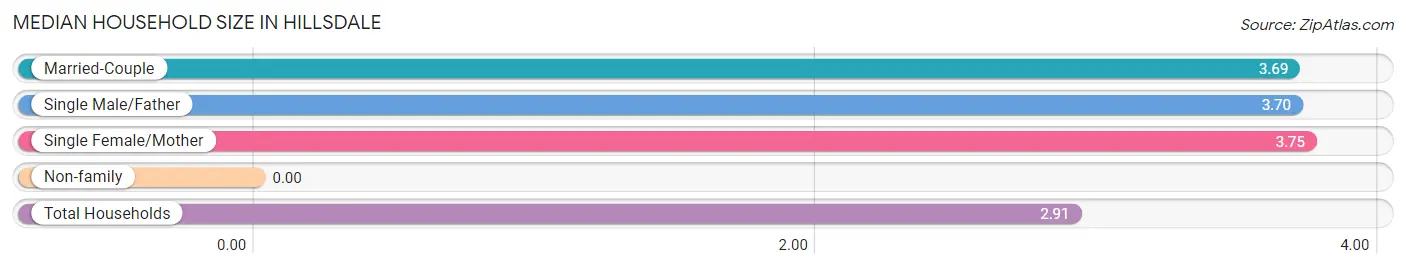
| Household Type | # Households | Household Size |
| Married-Couple | 52 (14.1%) | 3.69 |
| Single Male/Father | 33 (9.0%) | 3.70 |
| Single Female/Mother | 172 (46.7%) | 3.75 |
| Non-family | 111 (30.2%) | - |
| Total Households | 368 (100.0%) | 2.91 |
Household Size by Marriage Status in Hillsdale
Out of a total of 368 households in Hillsdale, 257 (69.8%) are family households, while 111 (30.2%) are nonfamily households. The most numerous type of family households are 4-person households, comprising 149, and the most common type of nonfamily households are 1-person households, comprising 111.
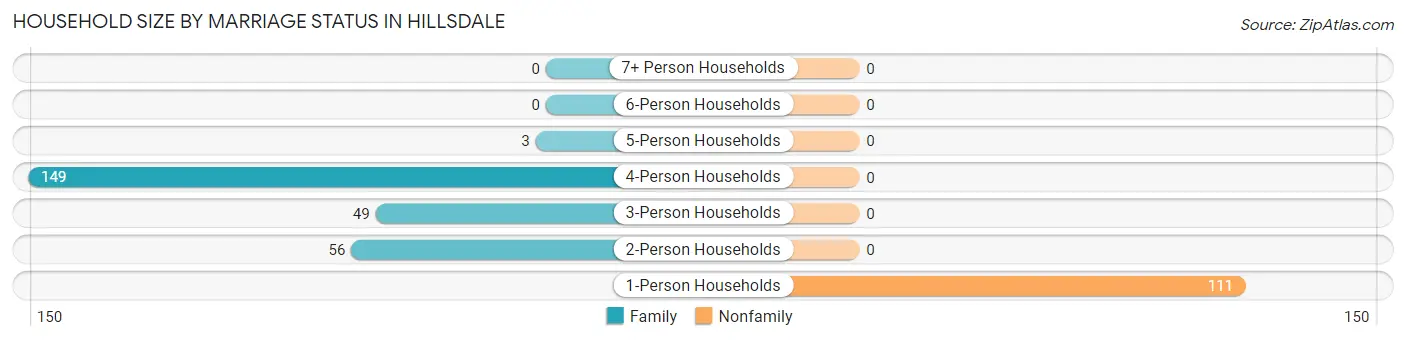
| Household Size | Family Households | Nonfamily Households |
| 1-Person Households | - | 111 (30.2%) |
| 2-Person Households | 56 (15.2%) | 0 (0.0%) |
| 3-Person Households | 49 (13.3%) | 0 (0.0%) |
| 4-Person Households | 149 (40.5%) | 0 (0.0%) |
| 5-Person Households | 3 (0.8%) | 0 (0.0%) |
| 6-Person Households | 0 (0.0%) | 0 (0.0%) |
| 7+ Person Households | 0 (0.0%) | 0 (0.0%) |
| Total | 257 (69.8%) | 111 (30.2%) |
Female Fertility in Hillsdale
Fertility by Age in Hillsdale
Average fertility rate in Hillsdale is 157.0 births per 1,000 women. Women in the age bracket of 20 to 34 years have the highest fertility rate with 228.0 births per 1,000 women. Women in the age bracket of 20 to 34 years acount for 100.0% of all women with births.
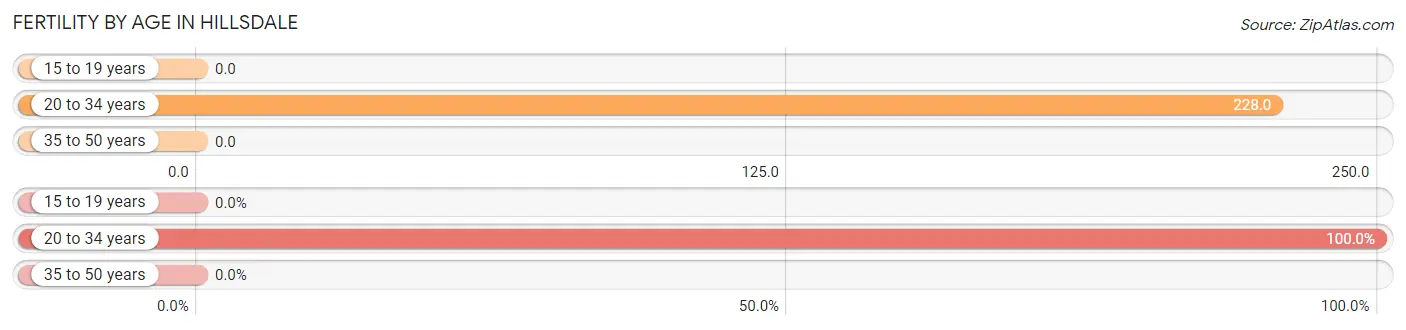
| Age Bracket | Women with Births | Births / 1,000 Women |
| 15 to 19 years | 0 (0.0%) | 0.0 |
| 20 to 34 years | 53 (100.0%) | 228.0 |
| 35 to 50 years | 0 (0.0%) | 0.0 |
| Total | 53 (100.0%) | 157.0 |
Fertility by Age by Marriage Status in Hillsdale
26.4% of women with births (53) in Hillsdale are married. The highest percentage of unmarried women with births falls into 20 to 34 years age bracket with 73.6% of them unmarried at the time of birth, while the lowest percentage of unmarried women with births belong to 20 to 34 years age bracket with 73.6% of them unmarried.
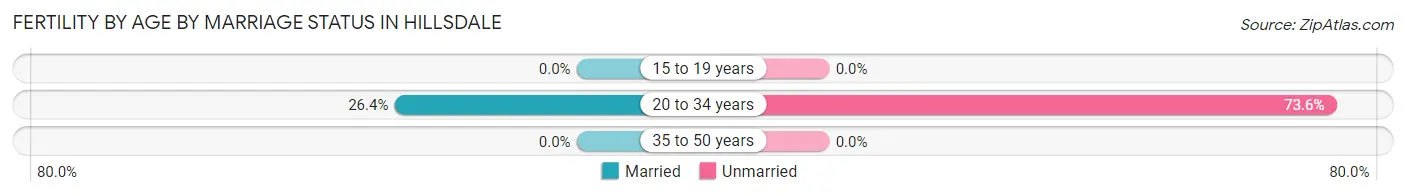
| Age Bracket | Married | Unmarried |
| 15 to 19 years | 0 (0.0%) | 0 (0.0%) |
| 20 to 34 years | 14 (26.4%) | 39 (73.6%) |
| 35 to 50 years | 0 (0.0%) | 0 (0.0%) |
| Total | 14 (26.4%) | 39 (73.6%) |
Fertility by Education in Hillsdale
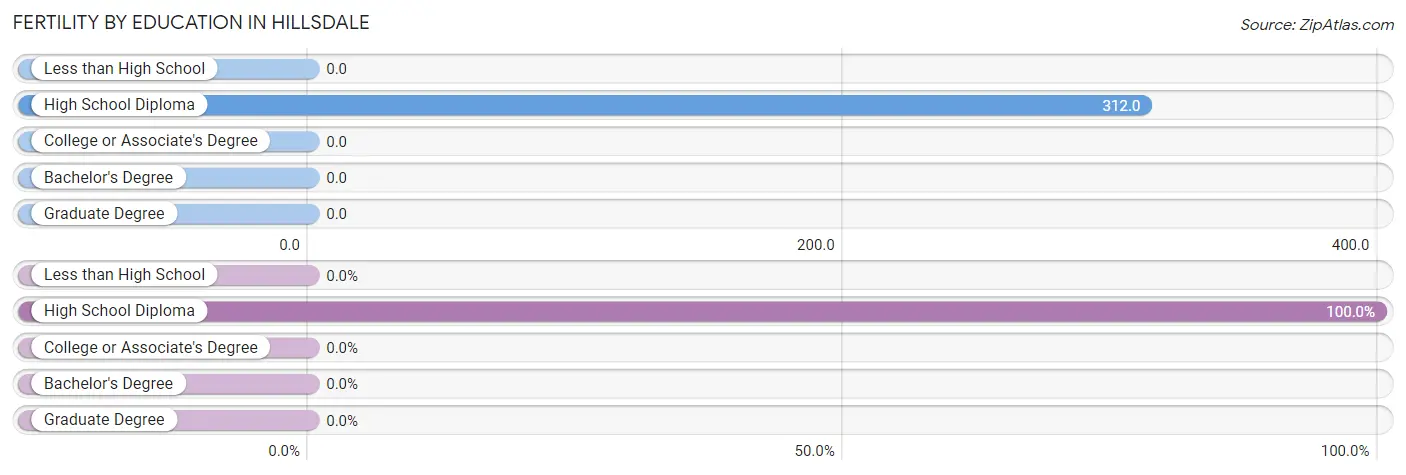
| Educational Attainment | Women with Births | Births / 1,000 Women |
| Less than High School | 0 (0.0%) | 0.0 |
| High School Diploma | 53 (100.0%) | 312.0 |
| College or Associate's Degree | 0 (0.0%) | 0.0 |
| Bachelor's Degree | 0 (0.0%) | 0.0 |
| Graduate Degree | 0 (0.0%) | 0.0 |
| Total | 53 (100.0%) | 157.0 |
Fertility by Education by Marriage Status in Hillsdale
73.6% of women with births in Hillsdale are unmarried. Women with the educational attainment of high school diploma are most likely to be married with 26.4% of them married at childbirth, while women with the educational attainment of high school diploma are least likely to be married with 73.6% of them unmarried at childbirth.
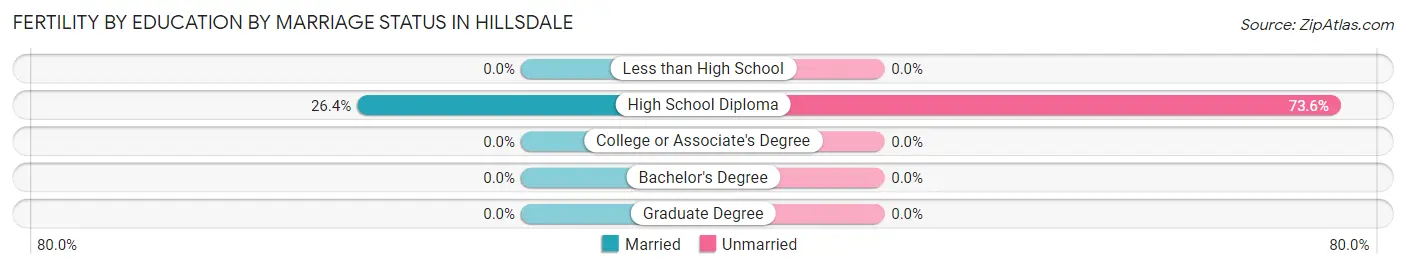
| Educational Attainment | Married | Unmarried |
| Less than High School | 0 (0.0%) | 0 (0.0%) |
| High School Diploma | 14 (26.4%) | 39 (73.6%) |
| College or Associate's Degree | 0 (0.0%) | 0 (0.0%) |
| Bachelor's Degree | 0 (0.0%) | 0 (0.0%) |
| Graduate Degree | 0 (0.0%) | 0 (0.0%) |
| Total | 14 (26.4%) | 39 (73.6%) |
Employment Characteristics in Hillsdale
Employment by Class of Employer in Hillsdale
Among the 475 employed individuals in Hillsdale, private company employees (387 | 81.5%), not-for-profit organizations (34 | 7.2%), and local government employees (26 | 5.5%) make up the most common classes of employment.
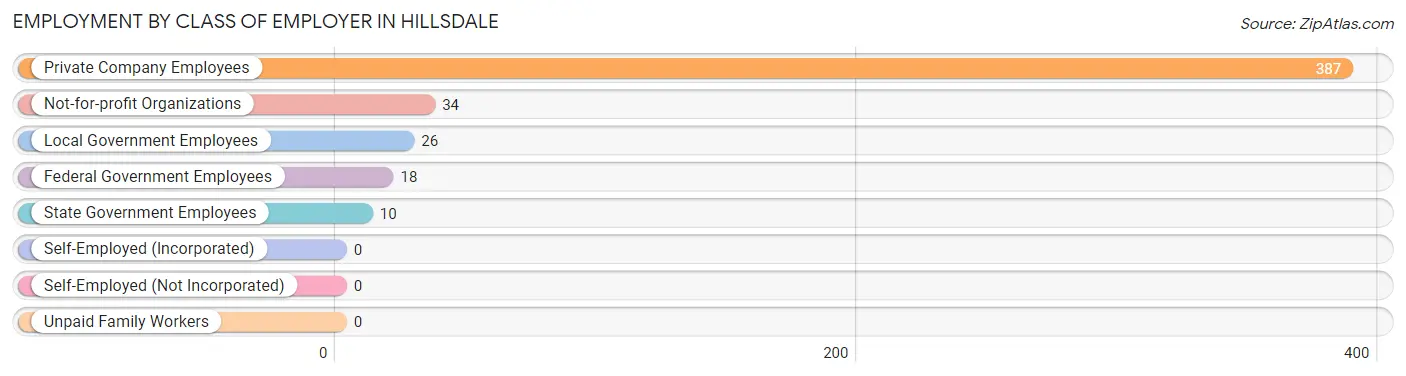
| Employer Class | # Employees | % Employees |
| Private Company Employees | 387 | 81.5% |
| Self-Employed (Incorporated) | 0 | 0.0% |
| Self-Employed (Not Incorporated) | 0 | 0.0% |
| Not-for-profit Organizations | 34 | 7.2% |
| Local Government Employees | 26 | 5.5% |
| State Government Employees | 10 | 2.1% |
| Federal Government Employees | 18 | 3.8% |
| Unpaid Family Workers | 0 | 0.0% |
| Total | 475 | 100.0% |
Employment Status by Age in Hillsdale
According to the labor force statistics for Hillsdale, out of the total population over 16 years of age (694), 74.2% or 515 individuals are in the labor force, with 3.1% or 16 of them unemployed. The age group with the highest labor force participation rate is 25 to 29 years, with 95.6% or 129 individuals in the labor force. Within the labor force, the 35 to 44 years age range has the highest percentage of unemployed individuals, with 26.9% or 14 of them being unemployed.
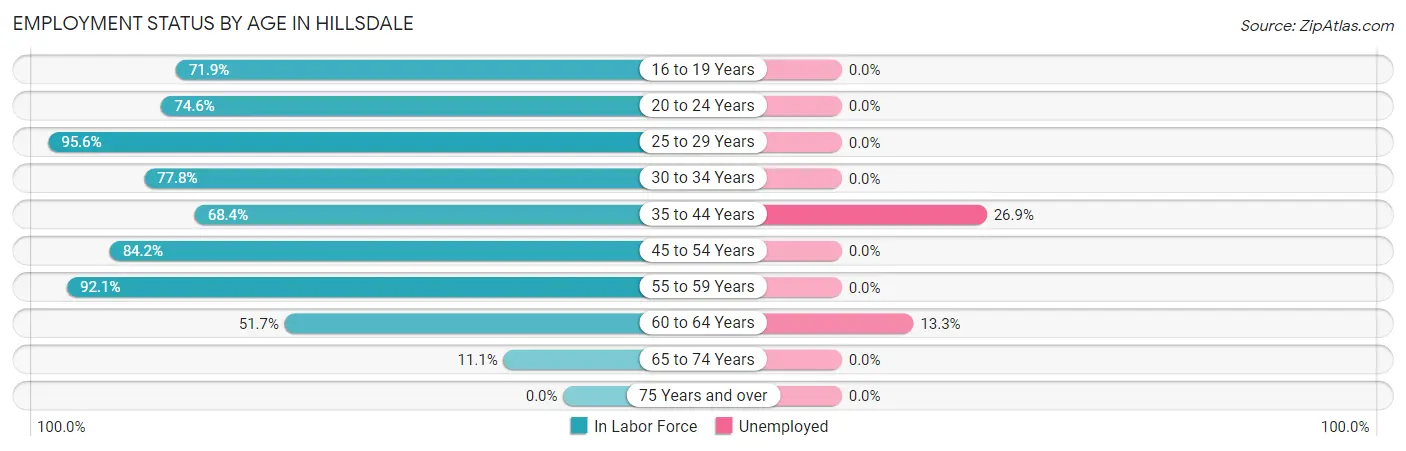
| Age Bracket | In Labor Force | Unemployed |
| 16 to 19 Years | 23 (71.9%) | 0 (0.0%) |
| 20 to 24 Years | 97 (74.6%) | 0 (0.0%) |
| 25 to 29 Years | 129 (95.6%) | 0 (0.0%) |
| 30 to 34 Years | 77 (77.8%) | 0 (0.0%) |
| 35 to 44 Years | 52 (68.4%) | 14 (26.9%) |
| 45 to 54 Years | 85 (84.2%) | 0 (0.0%) |
| 55 to 59 Years | 35 (92.1%) | 0 (0.0%) |
| 60 to 64 Years | 15 (51.7%) | 2 (13.3%) |
| 65 to 74 Years | 2 (11.1%) | 0 (0.0%) |
| 75 Years and over | 0 (0.0%) | 0 (0.0%) |
| Total | 515 (74.2%) | 16 (3.1%) |
Employment Status by Educational Attainment in Hillsdale
According to labor force statistics for Hillsdale, 82.2% of individuals (393) out of the total population between 25 and 64 years of age (478) are in the labor force, with 4.1% or 16 of them being unemployed. The group with the highest labor force participation rate are those with the educational attainment of bachelor's degree or higher, with 100.0% or 27 individuals in the labor force. Within the labor force, individuals with college / associate degree education have the highest percentage of unemployment, with 9.0% or 14 of them being unemployed.
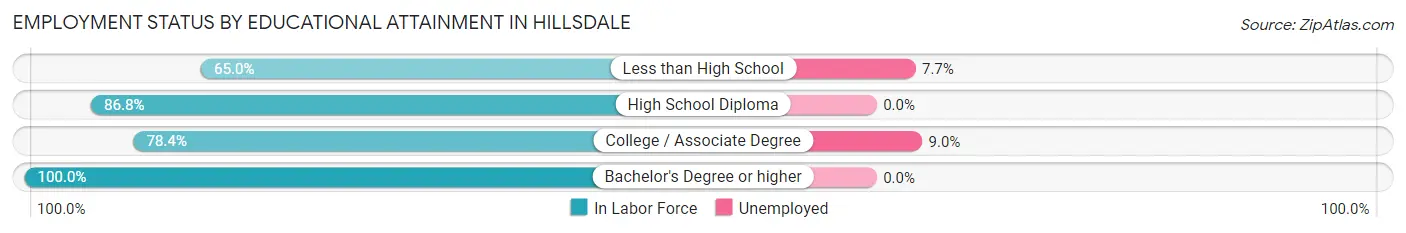
| Educational Attainment | In Labor Force | Unemployed |
| Less than High School | 26 (65.0%) | 3 (7.7%) |
| High School Diploma | 184 (86.8%) | 0 (0.0%) |
| College / Associate Degree | 156 (78.4%) | 18 (9.0%) |
| Bachelor's Degree or higher | 27 (100.0%) | 0 (0.0%) |
| Total | 393 (82.2%) | 20 (4.1%) |
Employment Occupations by Sex in Hillsdale
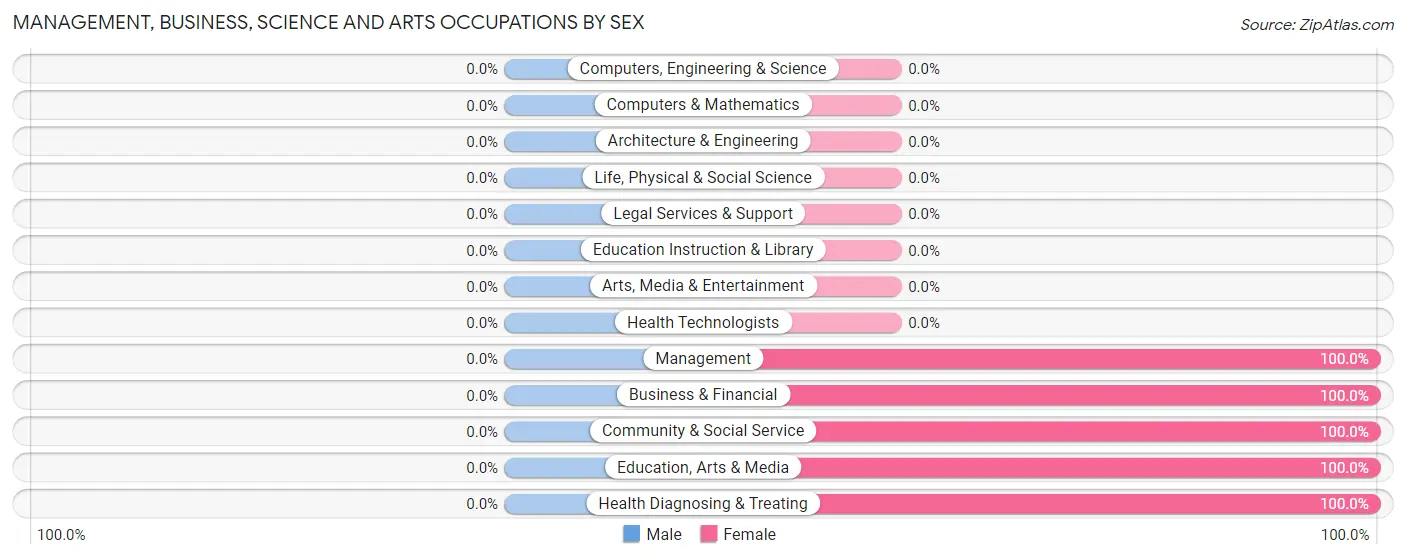
Management, Business, Science and Arts Occupations
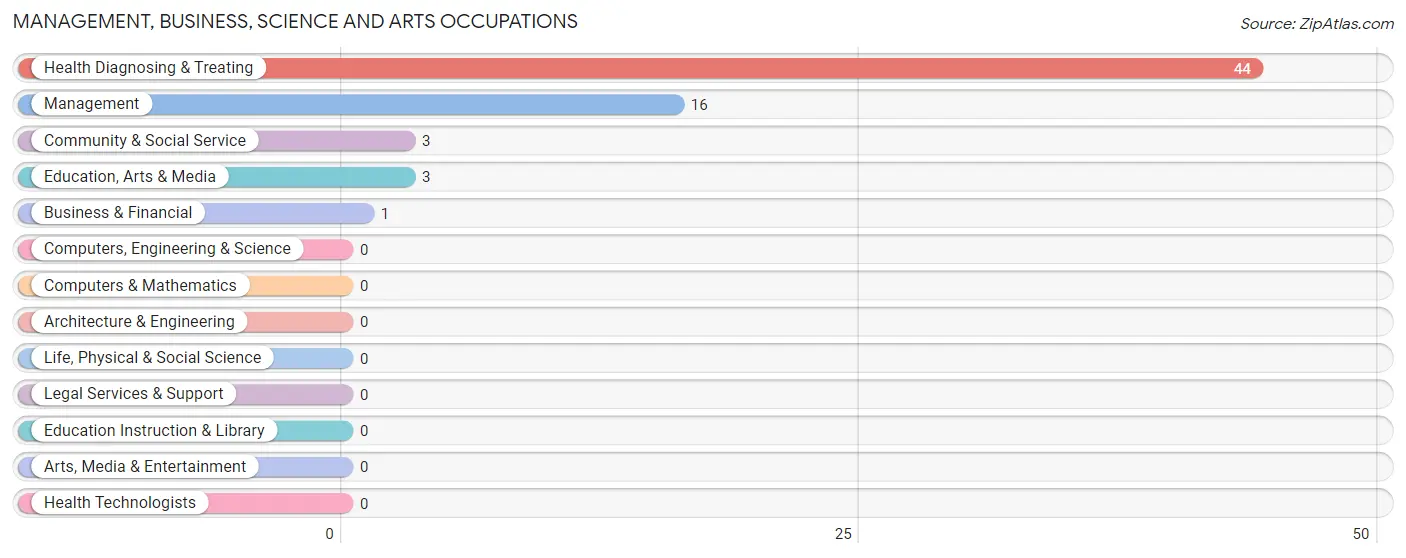
The most common Management, Business, Science and Arts occupations in Hillsdale are Health Diagnosing & Treating (44 | 8.8%), Management (16 | 3.2%), Community & Social Service (3 | 0.6%), Education, Arts & Media (3 | 0.6%), and Business & Financial (1 | 0.2%).
Management, Business, Science and Arts Occupations by Sex
| Occupation | Male | Female |
| Management | 0 (0.0%) | 16 (100.0%) |
| Business & Financial | 0 (0.0%) | 1 (100.0%) |
| Computers, Engineering & Science | 0 (0.0%) | 0 (0.0%) |
| Computers & Mathematics | 0 (0.0%) | 0 (0.0%) |
| Architecture & Engineering | 0 (0.0%) | 0 (0.0%) |
| Life, Physical & Social Science | 0 (0.0%) | 0 (0.0%) |
| Community & Social Service | 0 (0.0%) | 3 (100.0%) |
| Education, Arts & Media | 0 (0.0%) | 3 (100.0%) |
| Legal Services & Support | 0 (0.0%) | 0 (0.0%) |
| Education Instruction & Library | 0 (0.0%) | 0 (0.0%) |
| Arts, Media & Entertainment | 0 (0.0%) | 0 (0.0%) |
| Health Diagnosing & Treating | 0 (0.0%) | 44 (100.0%) |
| Health Technologists | 0 (0.0%) | 0 (0.0%) |
| Total (Category) | 0 (0.0%) | 64 (100.0%) |
| Total (Overall) | 192 (38.5%) | 307 (61.5%) |
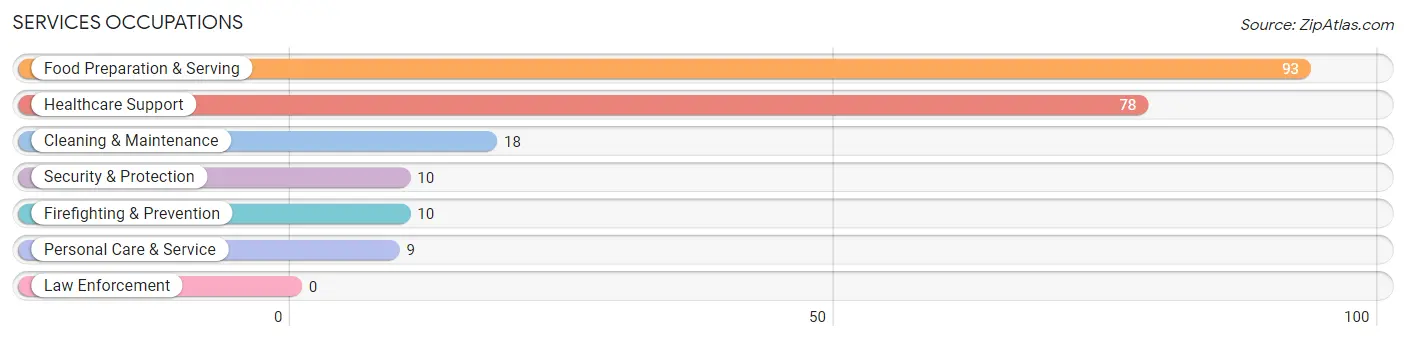
Services Occupations
The most common Services occupations in Hillsdale are Food Preparation & Serving (93 | 18.6%), Healthcare Support (78 | 15.6%), Cleaning & Maintenance (18 | 3.6%), Security & Protection (10 | 2.0%), and Firefighting & Prevention (10 | 2.0%).
Services Occupations by Sex
Within the Services occupations in Hillsdale, the most male-oriented occupations are Security & Protection (100.0%), Firefighting & Prevention (100.0%), and Food Preparation & Serving (60.2%), while the most female-oriented occupations are Healthcare Support (100.0%), Personal Care & Service (100.0%), and Cleaning & Maintenance (61.1%).
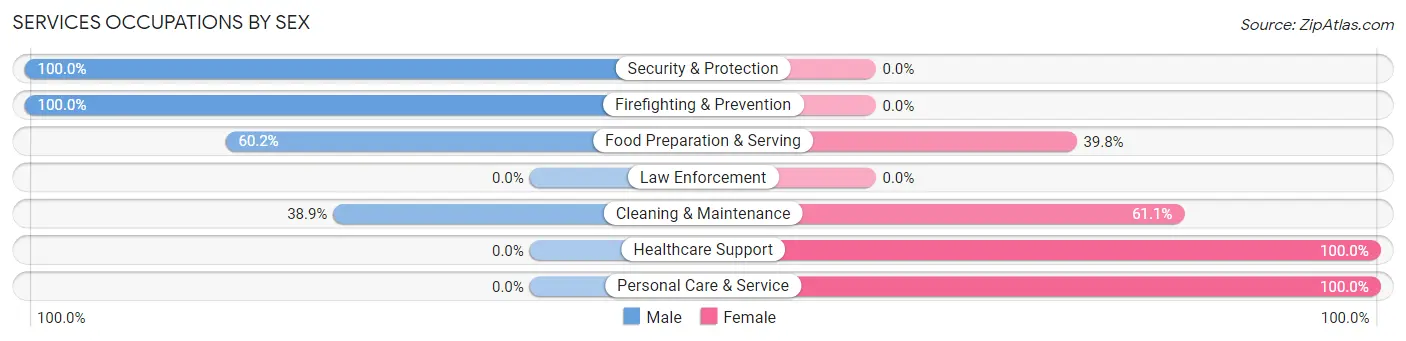
| Occupation | Male | Female |
| Healthcare Support | 0 (0.0%) | 78 (100.0%) |
| Security & Protection | 10 (100.0%) | 0 (0.0%) |
| Firefighting & Prevention | 10 (100.0%) | 0 (0.0%) |
| Law Enforcement | 0 (0.0%) | 0 (0.0%) |
| Food Preparation & Serving | 56 (60.2%) | 37 (39.8%) |
| Cleaning & Maintenance | 7 (38.9%) | 11 (61.1%) |
| Personal Care & Service | 0 (0.0%) | 9 (100.0%) |
| Total (Category) | 73 (35.1%) | 135 (64.9%) |
| Total (Overall) | 192 (38.5%) | 307 (61.5%) |
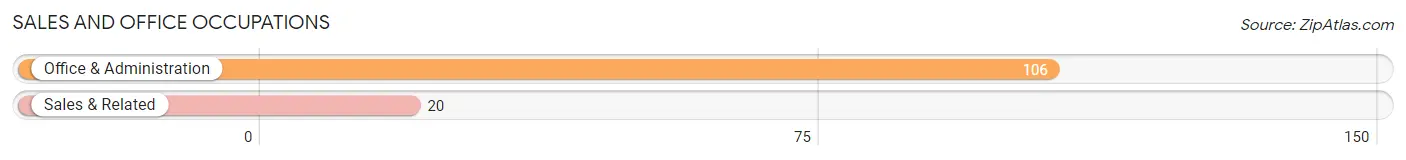
Sales and Office Occupations
The most common Sales and Office occupations in Hillsdale are Office & Administration (106 | 21.2%), and Sales & Related (20 | 4.0%).
Sales and Office Occupations by Sex
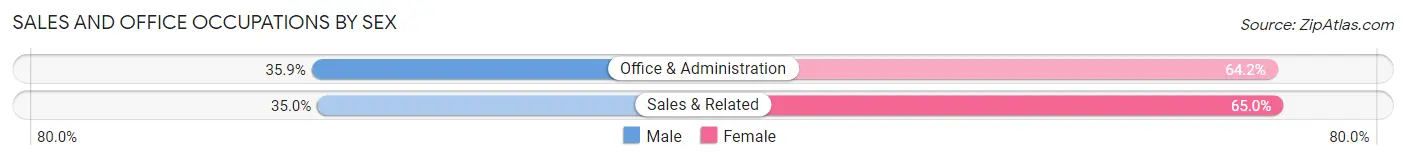
| Occupation | Male | Female |
| Sales & Related | 7 (35.0%) | 13 (65.0%) |
| Office & Administration | 38 (35.8%) | 68 (64.1%) |
| Total (Category) | 45 (35.7%) | 81 (64.3%) |
| Total (Overall) | 192 (38.5%) | 307 (61.5%) |
Natural Resources, Construction and Maintenance Occupations
The most common Natural Resources, Construction and Maintenance occupations in Hillsdale are , and Construction & Extraction (10 | 2.0%).
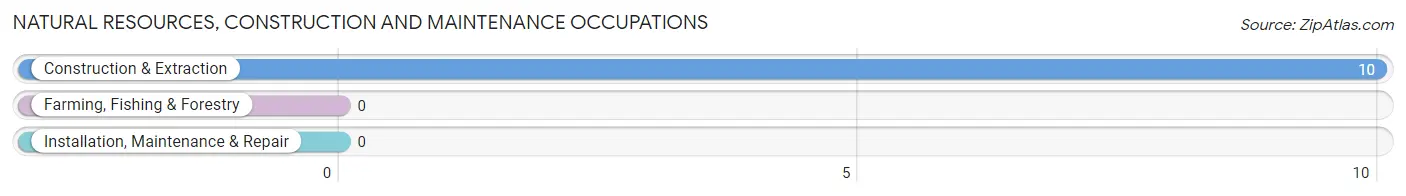
Natural Resources, Construction and Maintenance Occupations by Sex
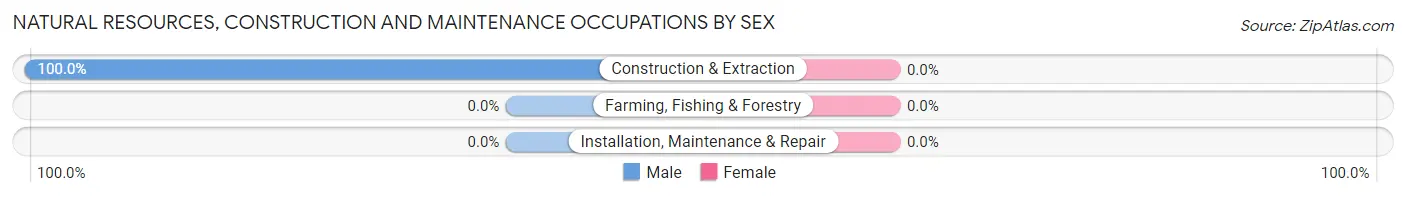
| Occupation | Male | Female |
| Farming, Fishing & Forestry | 0 (0.0%) | 0 (0.0%) |
| Construction & Extraction | 10 (100.0%) | 0 (0.0%) |
| Installation, Maintenance & Repair | 0 (0.0%) | 0 (0.0%) |
| Total (Category) | 10 (100.0%) | 0 (0.0%) |
| Total (Overall) | 192 (38.5%) | 307 (61.5%) |
Production, Transportation and Moving Occupations
The most common Production, Transportation and Moving occupations in Hillsdale are Material Moving (59 | 11.8%), Production (22 | 4.4%), and Transportation (10 | 2.0%).
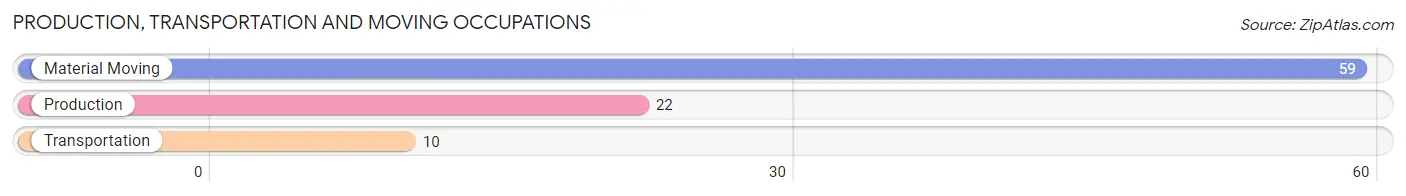
Production, Transportation and Moving Occupations by Sex
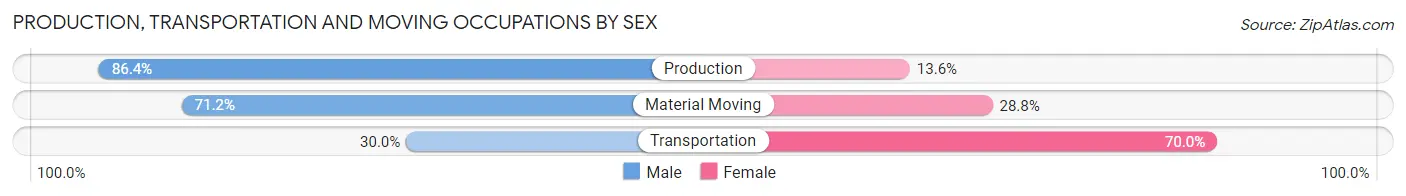
| Occupation | Male | Female |
| Production | 19 (86.4%) | 3 (13.6%) |
| Transportation | 3 (30.0%) | 7 (70.0%) |
| Material Moving | 42 (71.2%) | 17 (28.8%) |
| Total (Category) | 64 (70.3%) | 27 (29.7%) |
| Total (Overall) | 192 (38.5%) | 307 (61.5%) |
Employment Industries by Sex in Hillsdale
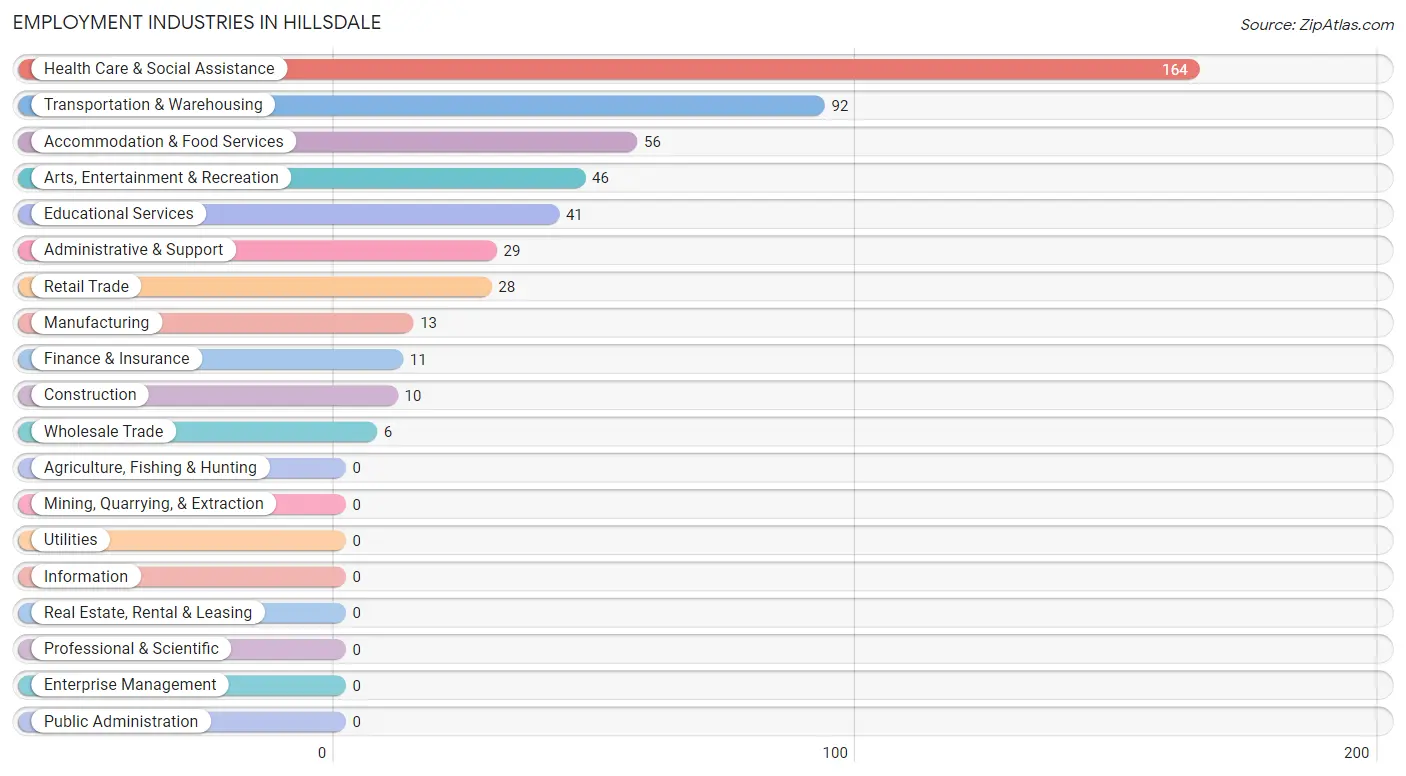
Employment Industries in Hillsdale
The major employment industries in Hillsdale include Health Care & Social Assistance (164 | 32.9%), Transportation & Warehousing (92 | 18.4%), Accommodation & Food Services (56 | 11.2%), Arts, Entertainment & Recreation (46 | 9.2%), and Educational Services (41 | 8.2%).
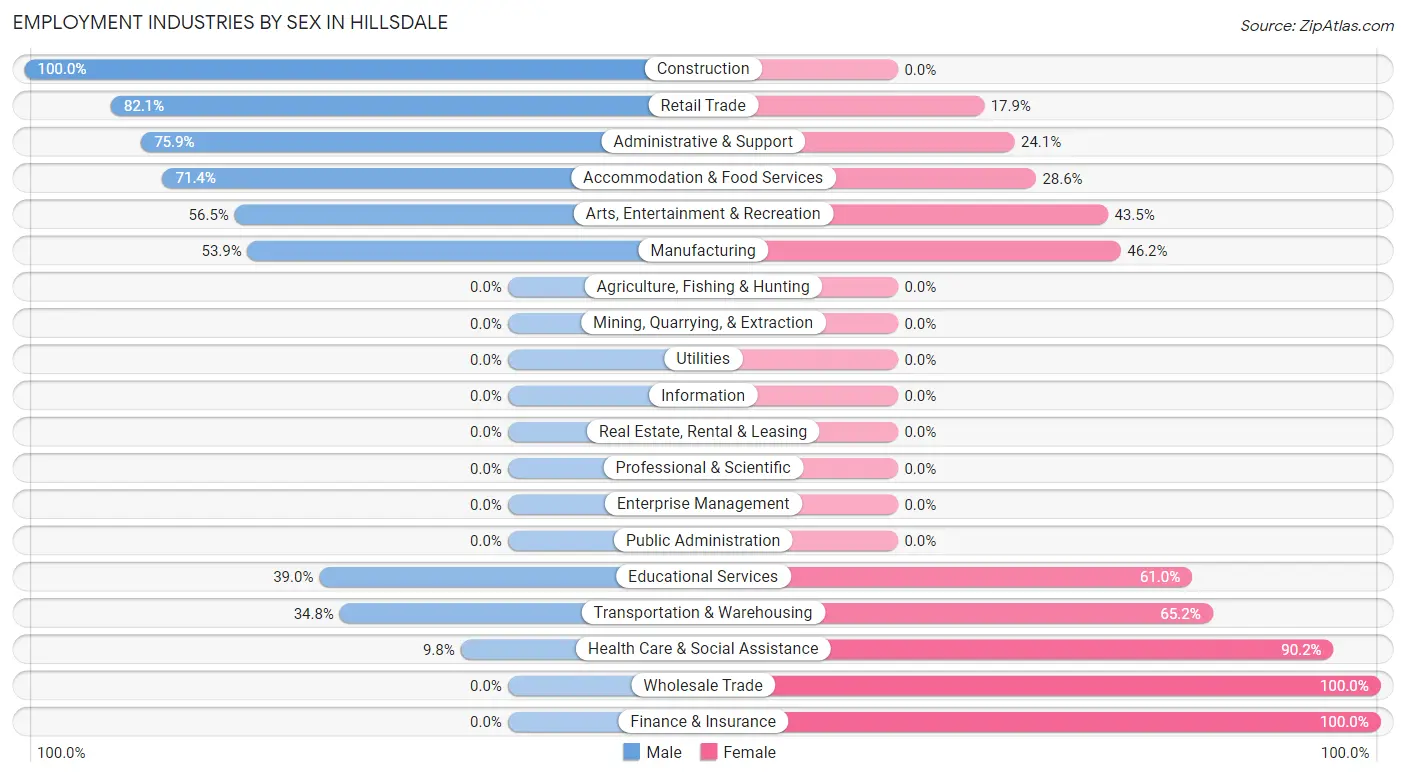
Employment Industries by Sex in Hillsdale
The Hillsdale industries that see more men than women are Construction (100.0%), Retail Trade (82.1%), and Administrative & Support (75.9%), whereas the industries that tend to have a higher number of women are Wholesale Trade (100.0%), Finance & Insurance (100.0%), and Health Care & Social Assistance (90.2%).
| Industry | Male | Female |
| Agriculture, Fishing & Hunting | 0 (0.0%) | 0 (0.0%) |
| Mining, Quarrying, & Extraction | 0 (0.0%) | 0 (0.0%) |
| Construction | 10 (100.0%) | 0 (0.0%) |
| Manufacturing | 7 (53.8%) | 6 (46.2%) |
| Wholesale Trade | 0 (0.0%) | 6 (100.0%) |
| Retail Trade | 23 (82.1%) | 5 (17.9%) |
| Transportation & Warehousing | 32 (34.8%) | 60 (65.2%) |
| Utilities | 0 (0.0%) | 0 (0.0%) |
| Information | 0 (0.0%) | 0 (0.0%) |
| Finance & Insurance | 0 (0.0%) | 11 (100.0%) |
| Real Estate, Rental & Leasing | 0 (0.0%) | 0 (0.0%) |
| Professional & Scientific | 0 (0.0%) | 0 (0.0%) |
| Enterprise Management | 0 (0.0%) | 0 (0.0%) |
| Administrative & Support | 22 (75.9%) | 7 (24.1%) |
| Educational Services | 16 (39.0%) | 25 (61.0%) |
| Health Care & Social Assistance | 16 (9.8%) | 148 (90.2%) |
| Arts, Entertainment & Recreation | 26 (56.5%) | 20 (43.5%) |
| Accommodation & Food Services | 40 (71.4%) | 16 (28.6%) |
| Public Administration | 0 (0.0%) | 0 (0.0%) |
| Total | 192 (38.5%) | 307 (61.5%) |
Education in Hillsdale
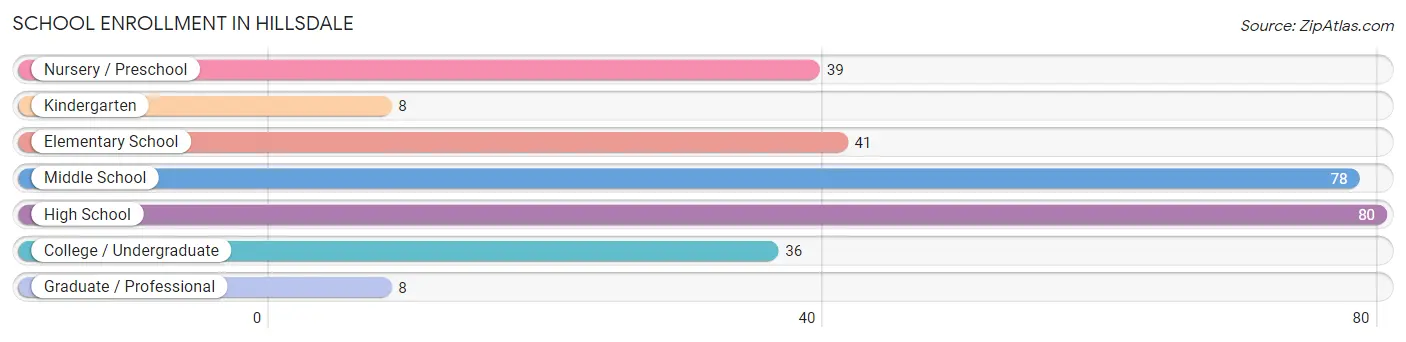
School Enrollment in Hillsdale
The most common levels of schooling among the 290 students in Hillsdale are high school (80 | 27.6%), middle school (78 | 26.9%), and elementary school (41 | 14.1%).
| School Level | # Students | % Students |
| Nursery / Preschool | 39 | 13.5% |
| Kindergarten | 8 | 2.8% |
| Elementary School | 41 | 14.1% |
| Middle School | 78 | 26.9% |
| High School | 80 | 27.6% |
| College / Undergraduate | 36 | 12.4% |
| Graduate / Professional | 8 | 2.8% |
| Total | 290 | 100.0% |
School Enrollment by Age by Funding Source in Hillsdale
Out of a total of 290 students who are enrolled in schools in Hillsdale, 55 (19.0%) attend a private institution, while the remaining 235 (81.0%) are enrolled in public schools. The age group of 20 to 24 year olds has the highest likelihood of being enrolled in private schools, with 13 (100.0% in the age bracket) enrolled. Conversely, the age group of 3 to 4 year olds has the lowest likelihood of being enrolled in a private school, with 21 (100.0% in the age bracket) attending a public institution.
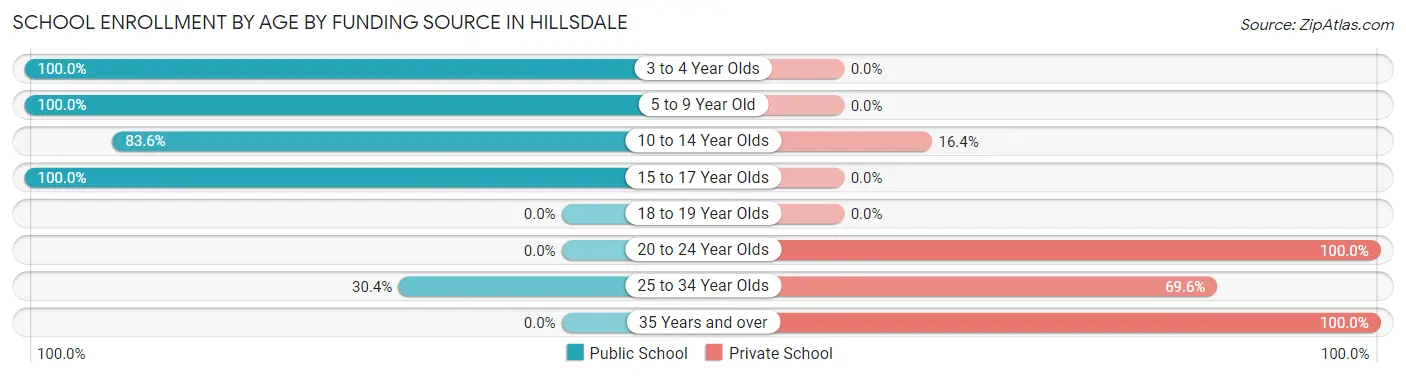
| Age Bracket | Public School | Private School |
| 3 to 4 Year Olds | 21 (100.0%) | 0 (0.0%) |
| 5 to 9 Year Old | 57 (100.0%) | 0 (0.0%) |
| 10 to 14 Year Olds | 92 (83.6%) | 18 (16.4%) |
| 15 to 17 Year Olds | 58 (100.0%) | 0 (0.0%) |
| 18 to 19 Year Olds | 0 (0.0%) | 0 (0.0%) |
| 20 to 24 Year Olds | 0 (0.0%) | 13 (100.0%) |
| 25 to 34 Year Olds | 7 (30.4%) | 16 (69.6%) |
| 35 Years and over | 0 (0.0%) | 8 (100.0%) |
| Total | 235 (81.0%) | 55 (19.0%) |
Educational Attainment by Field of Study in Hillsdale
Education (12 | 30.8%), science & technology (9 | 23.1%), business (9 | 23.1%), and arts & humanities (9 | 23.1%) are the most common fields of study among 39 individuals in Hillsdale who have obtained a bachelor's degree or higher.
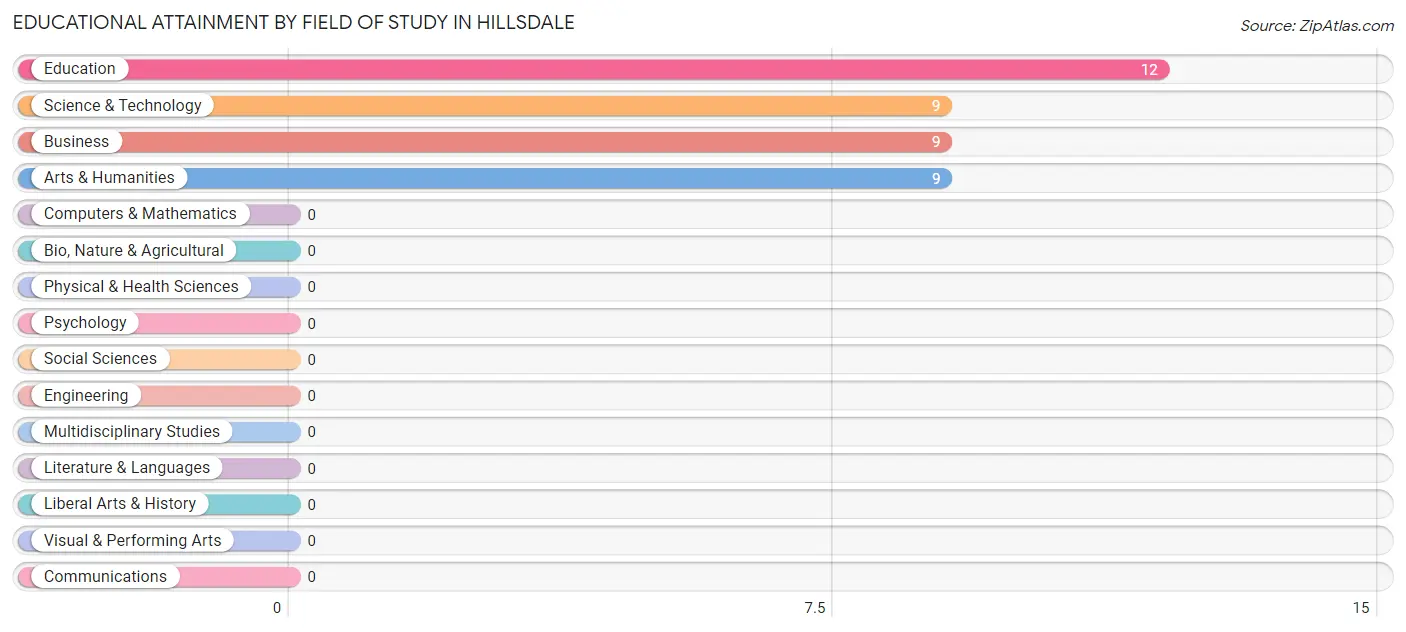
| Field of Study | # Graduates | % Graduates |
| Computers & Mathematics | 0 | 0.0% |
| Bio, Nature & Agricultural | 0 | 0.0% |
| Physical & Health Sciences | 0 | 0.0% |
| Psychology | 0 | 0.0% |
| Social Sciences | 0 | 0.0% |
| Engineering | 0 | 0.0% |
| Multidisciplinary Studies | 0 | 0.0% |
| Science & Technology | 9 | 23.1% |
| Business | 9 | 23.1% |
| Education | 12 | 30.8% |
| Literature & Languages | 0 | 0.0% |
| Liberal Arts & History | 0 | 0.0% |
| Visual & Performing Arts | 0 | 0.0% |
| Communications | 0 | 0.0% |
| Arts & Humanities | 9 | 23.1% |
| Total | 39 | 100.0% |
Transportation & Commute in Hillsdale
Vehicle Availability by Sex in Hillsdale
The most prevalent vehicle ownership categories in Hillsdale are males with 1 vehicle (123, accounting for 67.6%) and females with 1 vehicle (228, making up 42.0%).
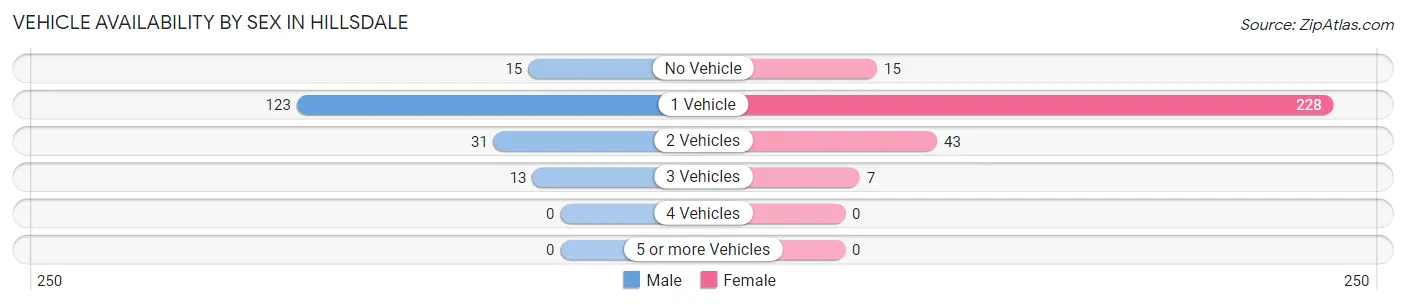
| Vehicles Available | Male | Female |
| No Vehicle | 15 (8.2%) | 15 (5.1%) |
| 1 Vehicle | 123 (67.6%) | 228 (77.8%) |
| 2 Vehicles | 31 (17.0%) | 43 (14.7%) |
| 3 Vehicles | 13 (7.1%) | 7 (2.4%) |
| 4 Vehicles | 0 (0.0%) | 0 (0.0%) |
| 5 or more Vehicles | 0 (0.0%) | 0 (0.0%) |
| Total | 182 (100.0%) | 293 (100.0%) |
Commute Time in Hillsdale
The most frequently occuring commute durations in Hillsdale are 20 to 24 minutes (136 commuters, 30.0%), 30 to 34 minutes (105 commuters, 23.2%), and 15 to 19 minutes (87 commuters, 19.2%).
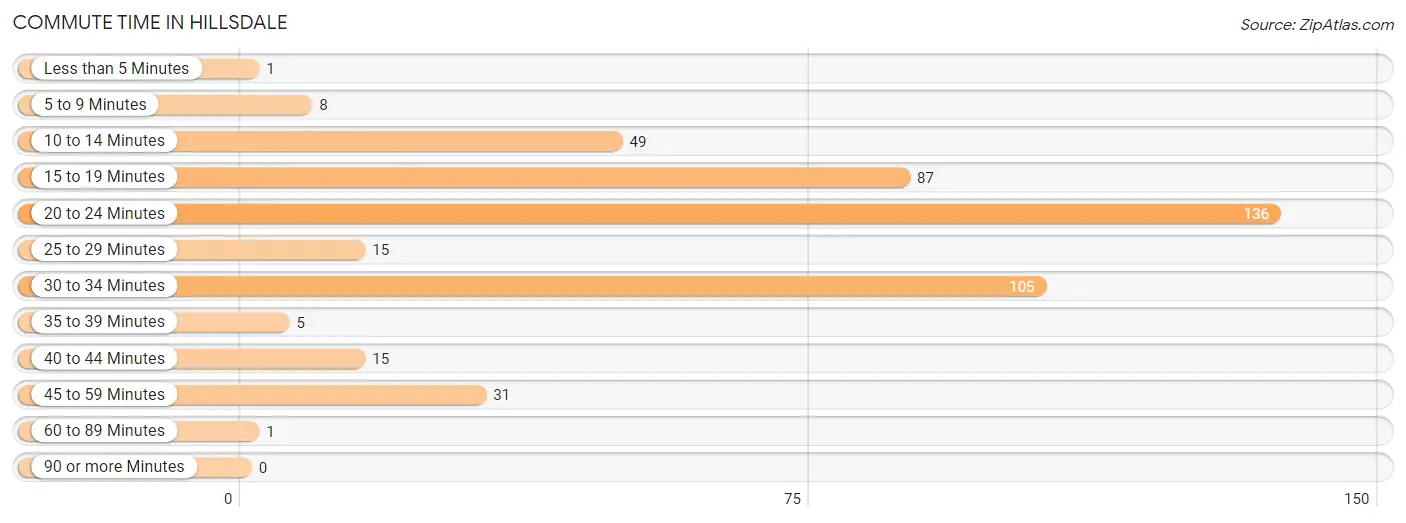
| Commute Time | # Commuters | % Commuters |
| Less than 5 Minutes | 1 | 0.2% |
| 5 to 9 Minutes | 8 | 1.8% |
| 10 to 14 Minutes | 49 | 10.8% |
| 15 to 19 Minutes | 87 | 19.2% |
| 20 to 24 Minutes | 136 | 30.0% |
| 25 to 29 Minutes | 15 | 3.3% |
| 30 to 34 Minutes | 105 | 23.2% |
| 35 to 39 Minutes | 5 | 1.1% |
| 40 to 44 Minutes | 15 | 3.3% |
| 45 to 59 Minutes | 31 | 6.8% |
| 60 to 89 Minutes | 1 | 0.2% |
| 90 or more Minutes | 0 | 0.0% |
Commute Time by Sex in Hillsdale
The most common commute times in Hillsdale are 30 to 34 minutes (65 commuters, 35.7%) for males and 20 to 24 minutes (76 commuters, 28.0%) for females.
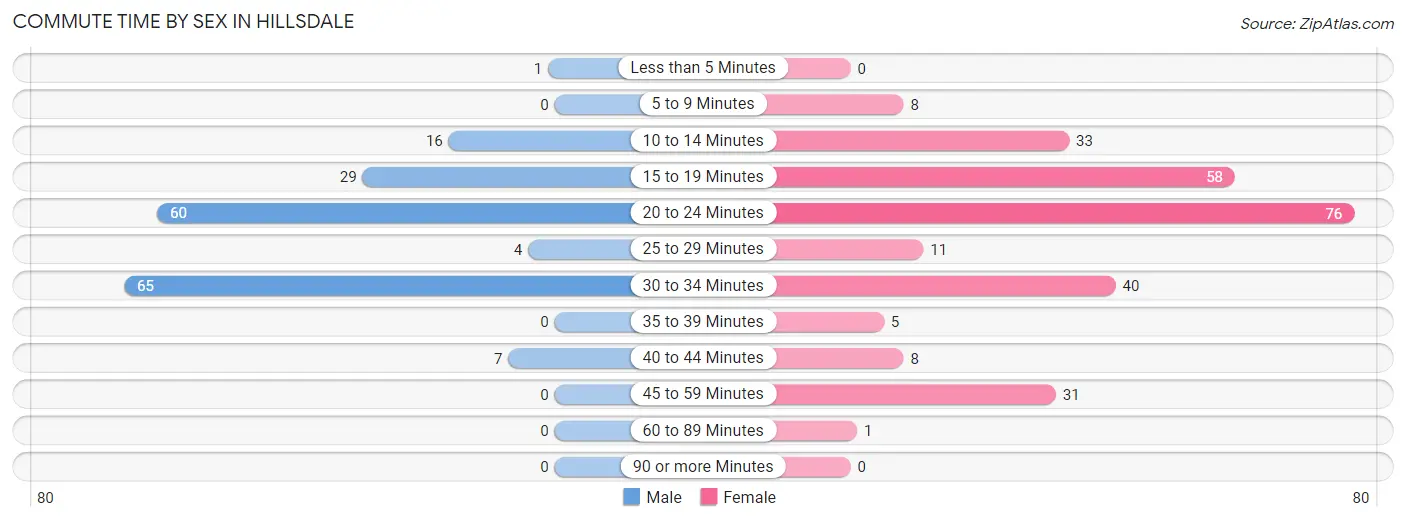
| Commute Time | Male | Female |
| Less than 5 Minutes | 1 (0.5%) | 0 (0.0%) |
| 5 to 9 Minutes | 0 (0.0%) | 8 (2.9%) |
| 10 to 14 Minutes | 16 (8.8%) | 33 (12.2%) |
| 15 to 19 Minutes | 29 (15.9%) | 58 (21.4%) |
| 20 to 24 Minutes | 60 (33.0%) | 76 (28.0%) |
| 25 to 29 Minutes | 4 (2.2%) | 11 (4.1%) |
| 30 to 34 Minutes | 65 (35.7%) | 40 (14.8%) |
| 35 to 39 Minutes | 0 (0.0%) | 5 (1.8%) |
| 40 to 44 Minutes | 7 (3.8%) | 8 (2.9%) |
| 45 to 59 Minutes | 0 (0.0%) | 31 (11.4%) |
| 60 to 89 Minutes | 0 (0.0%) | 1 (0.4%) |
| 90 or more Minutes | 0 (0.0%) | 0 (0.0%) |
Time of Departure to Work by Sex in Hillsdale
The most frequent times of departure to work in Hillsdale are 4:00 PM to 11:59 PM (56, 30.8%) for males and 8:30 AM to 8:59 AM (62, 22.9%) for females.
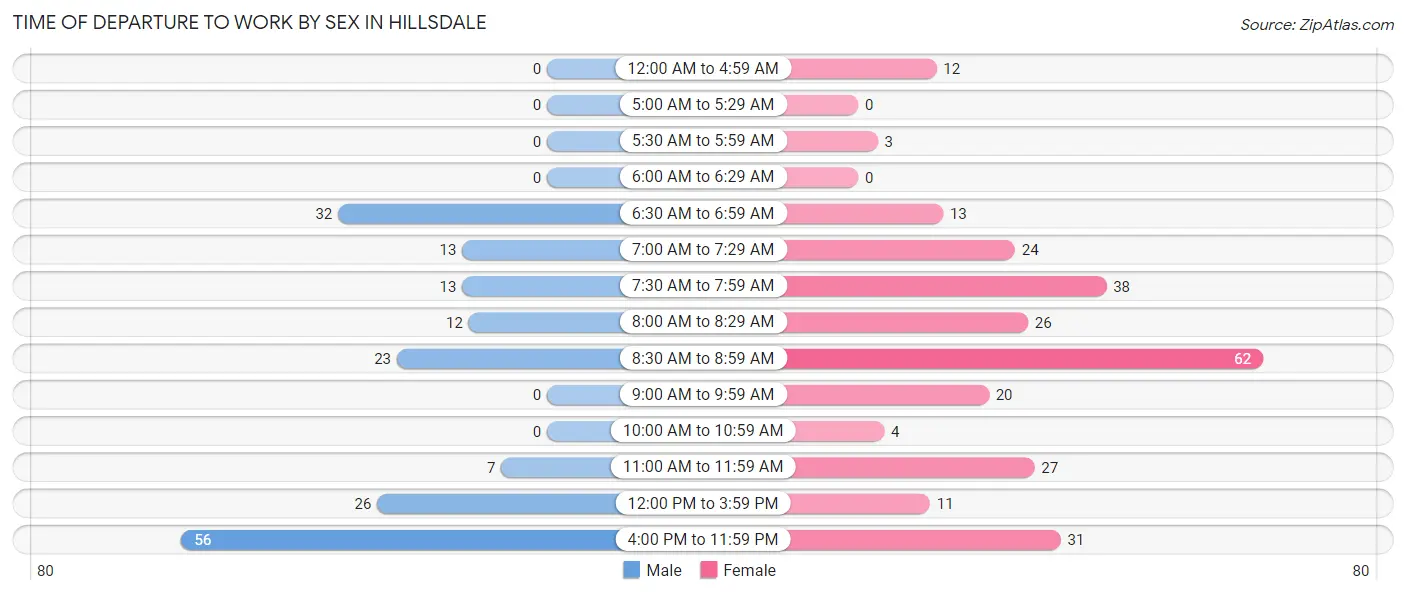
| Time of Departure | Male | Female |
| 12:00 AM to 4:59 AM | 0 (0.0%) | 12 (4.4%) |
| 5:00 AM to 5:29 AM | 0 (0.0%) | 0 (0.0%) |
| 5:30 AM to 5:59 AM | 0 (0.0%) | 3 (1.1%) |
| 6:00 AM to 6:29 AM | 0 (0.0%) | 0 (0.0%) |
| 6:30 AM to 6:59 AM | 32 (17.6%) | 13 (4.8%) |
| 7:00 AM to 7:29 AM | 13 (7.1%) | 24 (8.9%) |
| 7:30 AM to 7:59 AM | 13 (7.1%) | 38 (14.0%) |
| 8:00 AM to 8:29 AM | 12 (6.6%) | 26 (9.6%) |
| 8:30 AM to 8:59 AM | 23 (12.6%) | 62 (22.9%) |
| 9:00 AM to 9:59 AM | 0 (0.0%) | 20 (7.4%) |
| 10:00 AM to 10:59 AM | 0 (0.0%) | 4 (1.5%) |
| 11:00 AM to 11:59 AM | 7 (3.8%) | 27 (10.0%) |
| 12:00 PM to 3:59 PM | 26 (14.3%) | 11 (4.1%) |
| 4:00 PM to 11:59 PM | 56 (30.8%) | 31 (11.4%) |
| Total | 182 (100.0%) | 271 (100.0%) |
Housing Occupancy in Hillsdale
Occupancy by Ownership in Hillsdale
Of the total 368 dwellings in Hillsdale, owner-occupied units account for 94 (25.5%), while renter-occupied units make up 274 (74.5%).
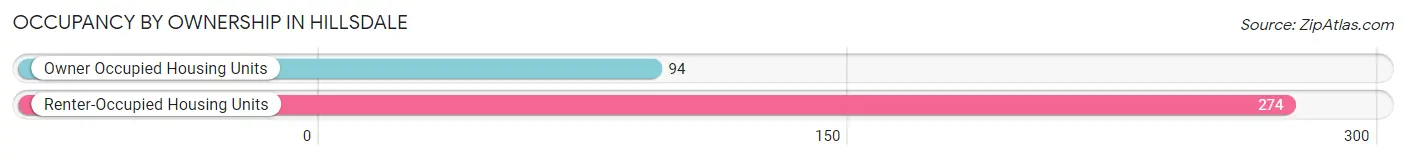
| Occupancy | # Housing Units | % Housing Units |
| Owner Occupied Housing Units | 94 | 25.5% |
| Renter-Occupied Housing Units | 274 | 74.5% |
| Total Occupied Housing Units | 368 | 100.0% |
Occupancy by Household Size in Hillsdale
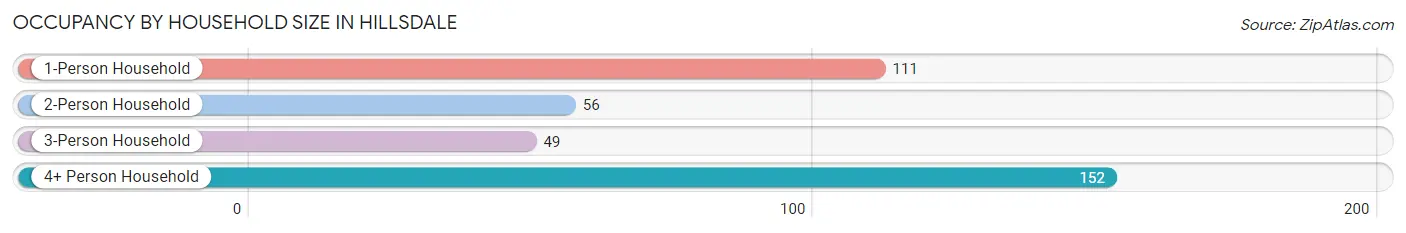
| Household Size | # Housing Units | % Housing Units |
| 1-Person Household | 111 | 30.2% |
| 2-Person Household | 56 | 15.2% |
| 3-Person Household | 49 | 13.3% |
| 4+ Person Household | 152 | 41.3% |
| Total Housing Units | 368 | 100.0% |
Occupancy by Ownership by Household Size in Hillsdale
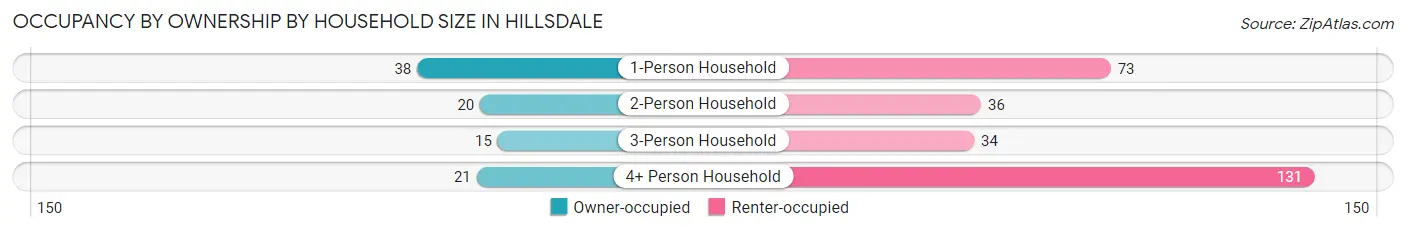
| Household Size | Owner-occupied | Renter-occupied |
| 1-Person Household | 38 (34.2%) | 73 (65.8%) |
| 2-Person Household | 20 (35.7%) | 36 (64.3%) |
| 3-Person Household | 15 (30.6%) | 34 (69.4%) |
| 4+ Person Household | 21 (13.8%) | 131 (86.2%) |
| Total Housing Units | 94 (25.5%) | 274 (74.5%) |
Occupancy by Educational Attainment in Hillsdale
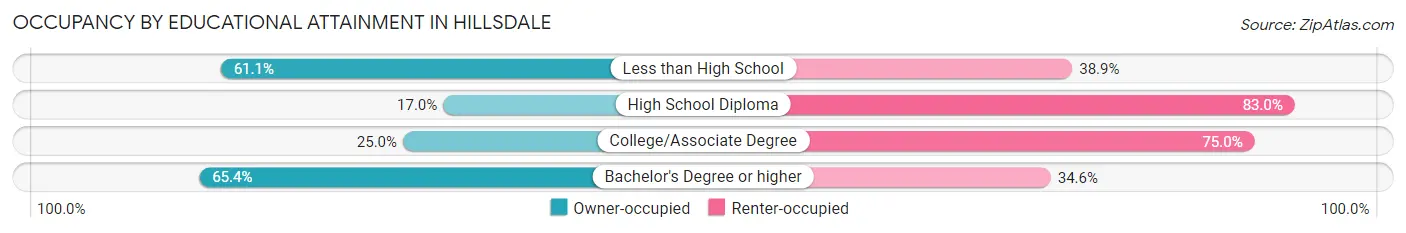
| Household Size | Owner-occupied | Renter-occupied |
| Less than High School | 11 (61.1%) | 7 (38.9%) |
| High School Diploma | 32 (17.0%) | 156 (83.0%) |
| College/Associate Degree | 34 (25.0%) | 102 (75.0%) |
| Bachelor's Degree or higher | 17 (65.4%) | 9 (34.6%) |
Occupancy by Age of Householder in Hillsdale
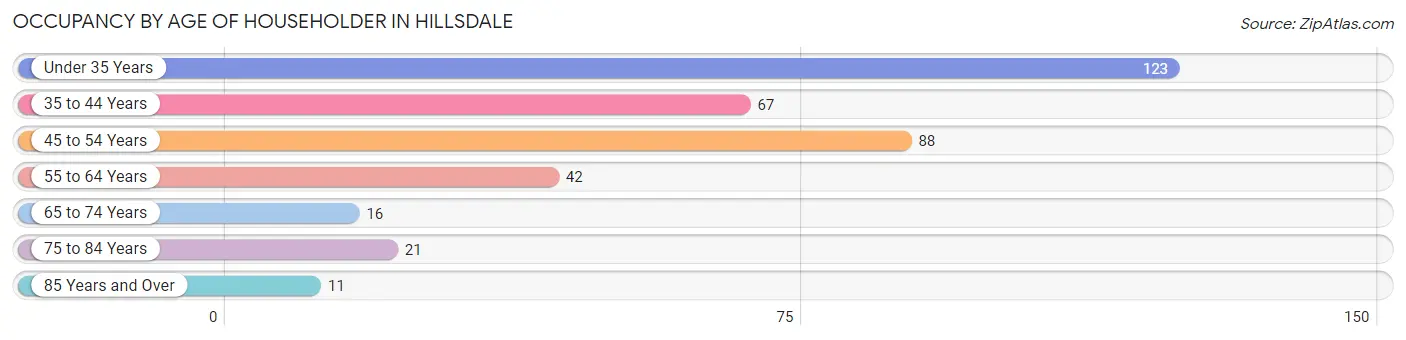
| Age Bracket | # Households | % Households |
| Under 35 Years | 123 | 33.4% |
| 35 to 44 Years | 67 | 18.2% |
| 45 to 54 Years | 88 | 23.9% |
| 55 to 64 Years | 42 | 11.4% |
| 65 to 74 Years | 16 | 4.3% |
| 75 to 84 Years | 21 | 5.7% |
| 85 Years and Over | 11 | 3.0% |
| Total | 368 | 100.0% |
Housing Finances in Hillsdale
Median Income by Occupancy in Hillsdale
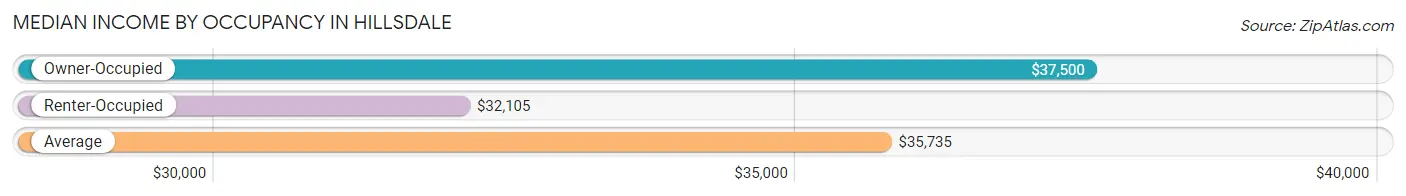
| Occupancy Type | # Households | Median Income |
| Owner-Occupied | 94 (25.5%) | $37,500 |
| Renter-Occupied | 274 (74.5%) | $32,105 |
| Average | 368 (100.0%) | $35,735 |
Occupancy by Householder Income Bracket in Hillsdale
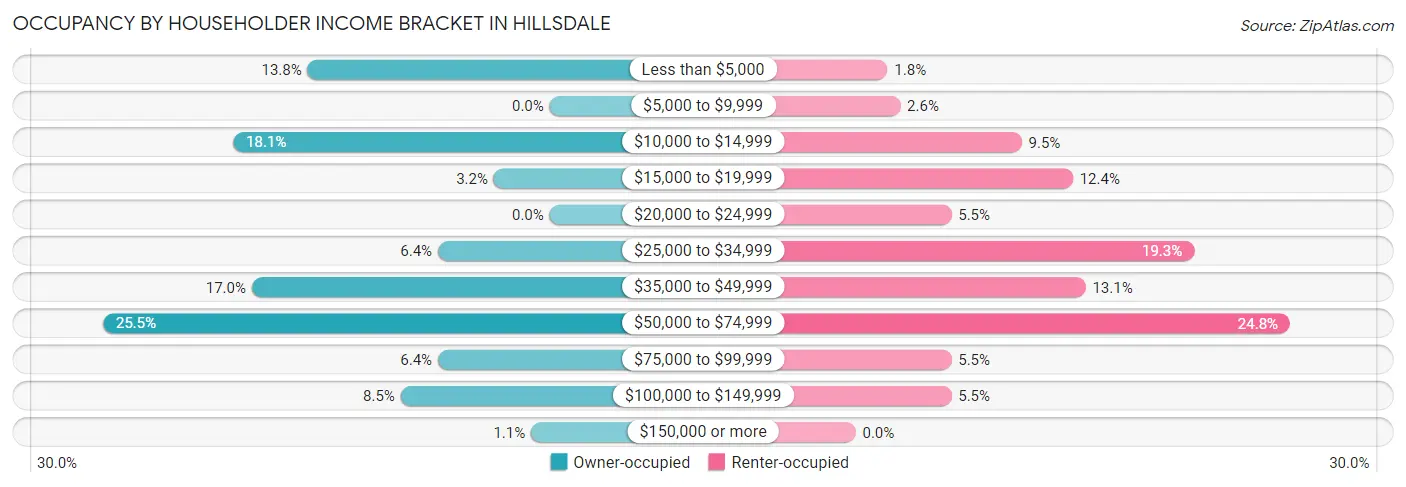
| Income Bracket | Owner-occupied | Renter-occupied |
| Less than $5,000 | 13 (13.8%) | 5 (1.8%) |
| $5,000 to $9,999 | 0 (0.0%) | 7 (2.5%) |
| $10,000 to $14,999 | 17 (18.1%) | 26 (9.5%) |
| $15,000 to $19,999 | 3 (3.2%) | 34 (12.4%) |
| $20,000 to $24,999 | 0 (0.0%) | 15 (5.5%) |
| $25,000 to $34,999 | 6 (6.4%) | 53 (19.3%) |
| $35,000 to $49,999 | 16 (17.0%) | 36 (13.1%) |
| $50,000 to $74,999 | 24 (25.5%) | 68 (24.8%) |
| $75,000 to $99,999 | 6 (6.4%) | 15 (5.5%) |
| $100,000 to $149,999 | 8 (8.5%) | 15 (5.5%) |
| $150,000 or more | 1 (1.1%) | 0 (0.0%) |
| Total | 94 (100.0%) | 274 (100.0%) |
Monthly Housing Cost Tiers in Hillsdale
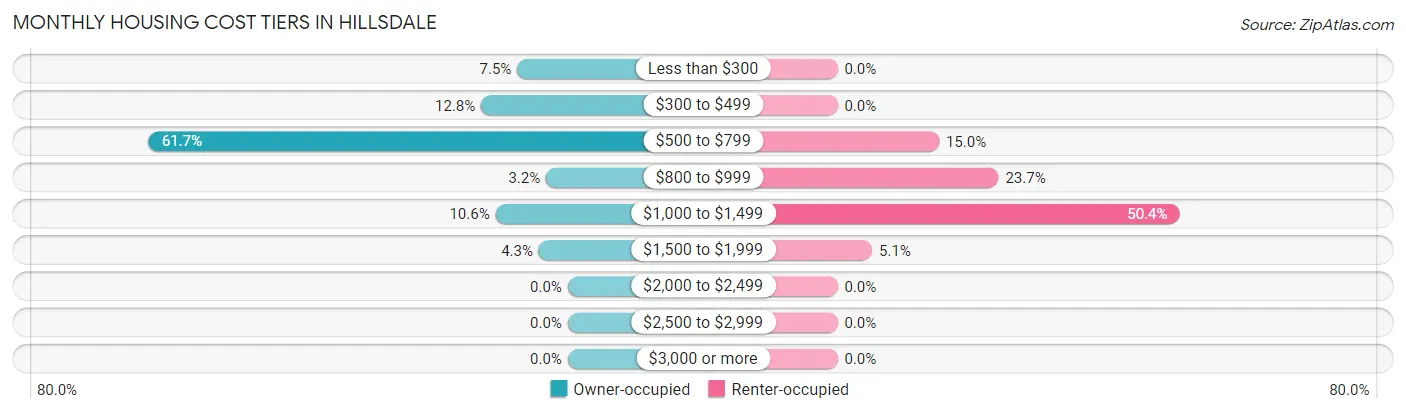
| Monthly Cost | Owner-occupied | Renter-occupied |
| Less than $300 | 7 (7.4%) | 0 (0.0%) |
| $300 to $499 | 12 (12.8%) | 0 (0.0%) |
| $500 to $799 | 58 (61.7%) | 41 (15.0%) |
| $800 to $999 | 3 (3.2%) | 65 (23.7%) |
| $1,000 to $1,499 | 10 (10.6%) | 138 (50.4%) |
| $1,500 to $1,999 | 4 (4.3%) | 14 (5.1%) |
| $2,000 to $2,499 | 0 (0.0%) | 0 (0.0%) |
| $2,500 to $2,999 | 0 (0.0%) | 0 (0.0%) |
| $3,000 or more | 0 (0.0%) | 0 (0.0%) |
| Total | 94 (100.0%) | 274 (100.0%) |
Physical Housing Characteristics in Hillsdale
Housing Structures in Hillsdale
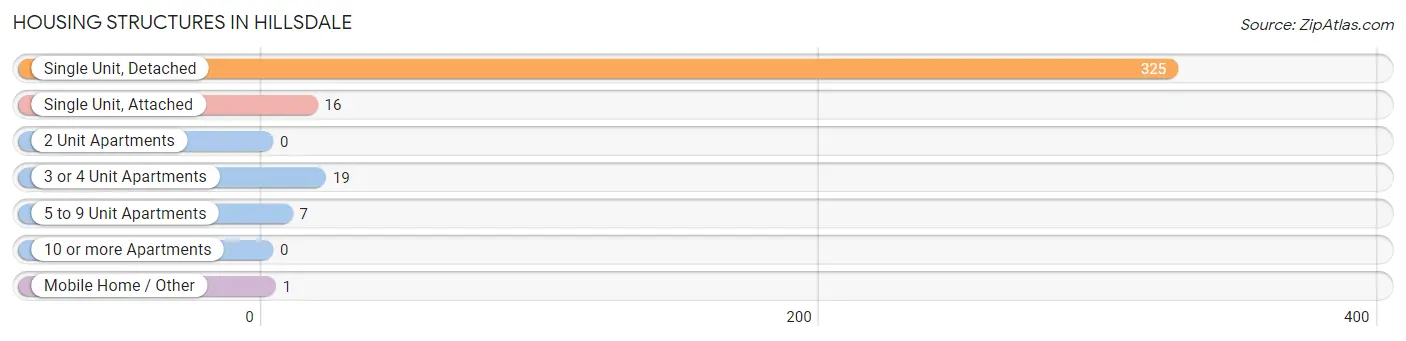
| Structure Type | # Housing Units | % Housing Units |
| Single Unit, Detached | 325 | 88.3% |
| Single Unit, Attached | 16 | 4.3% |
| 2 Unit Apartments | 0 | 0.0% |
| 3 or 4 Unit Apartments | 19 | 5.2% |
| 5 to 9 Unit Apartments | 7 | 1.9% |
| 10 or more Apartments | 0 | 0.0% |
| Mobile Home / Other | 1 | 0.3% |
| Total | 368 | 100.0% |
Housing Structures by Occupancy in Hillsdale
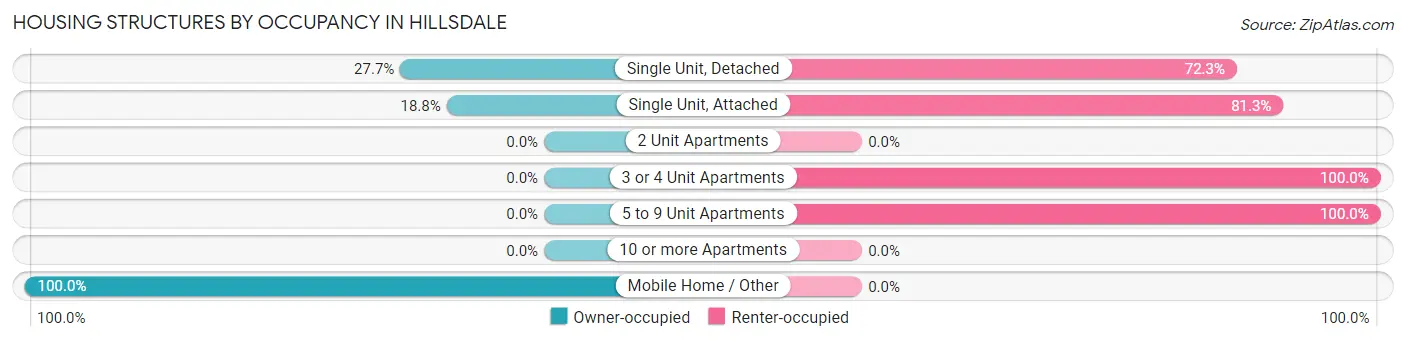
| Structure Type | Owner-occupied | Renter-occupied |
| Single Unit, Detached | 90 (27.7%) | 235 (72.3%) |
| Single Unit, Attached | 3 (18.8%) | 13 (81.2%) |
| 2 Unit Apartments | 0 (0.0%) | 0 (0.0%) |
| 3 or 4 Unit Apartments | 0 (0.0%) | 19 (100.0%) |
| 5 to 9 Unit Apartments | 0 (0.0%) | 7 (100.0%) |
| 10 or more Apartments | 0 (0.0%) | 0 (0.0%) |
| Mobile Home / Other | 1 (100.0%) | 0 (0.0%) |
| Total | 94 (25.5%) | 274 (74.5%) |
Housing Structures by Number of Rooms in Hillsdale
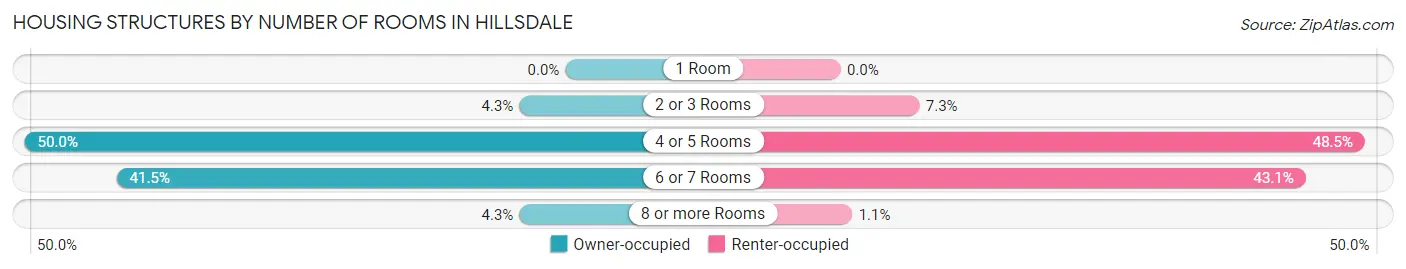
| Number of Rooms | Owner-occupied | Renter-occupied |
| 1 Room | 0 (0.0%) | 0 (0.0%) |
| 2 or 3 Rooms | 4 (4.3%) | 20 (7.3%) |
| 4 or 5 Rooms | 47 (50.0%) | 133 (48.5%) |
| 6 or 7 Rooms | 39 (41.5%) | 118 (43.1%) |
| 8 or more Rooms | 4 (4.3%) | 3 (1.1%) |
| Total | 94 (100.0%) | 274 (100.0%) |
Housing Structure by Heating Type in Hillsdale
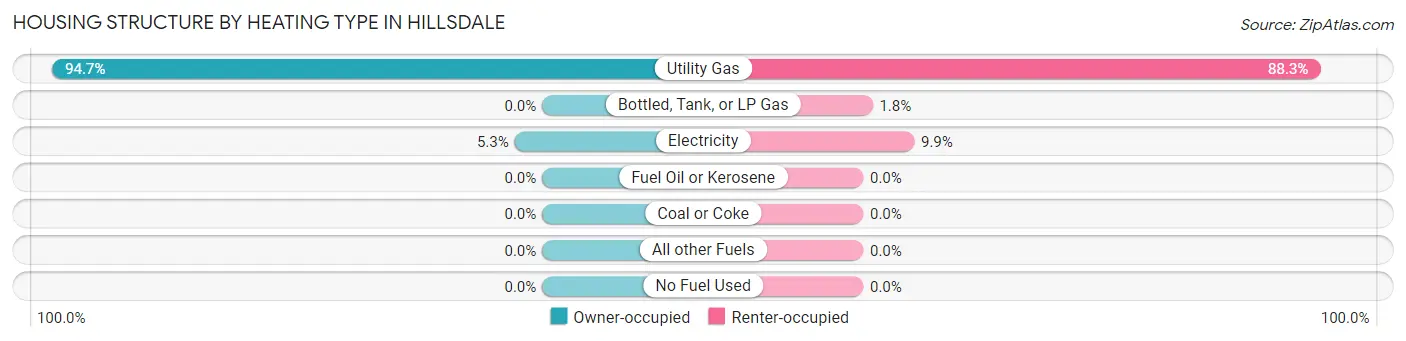
| Heating Type | Owner-occupied | Renter-occupied |
| Utility Gas | 89 (94.7%) | 242 (88.3%) |
| Bottled, Tank, or LP Gas | 0 (0.0%) | 5 (1.8%) |
| Electricity | 5 (5.3%) | 27 (9.9%) |
| Fuel Oil or Kerosene | 0 (0.0%) | 0 (0.0%) |
| Coal or Coke | 0 (0.0%) | 0 (0.0%) |
| All other Fuels | 0 (0.0%) | 0 (0.0%) |
| No Fuel Used | 0 (0.0%) | 0 (0.0%) |
| Total | 94 (100.0%) | 274 (100.0%) |
Household Vehicle Usage in Hillsdale
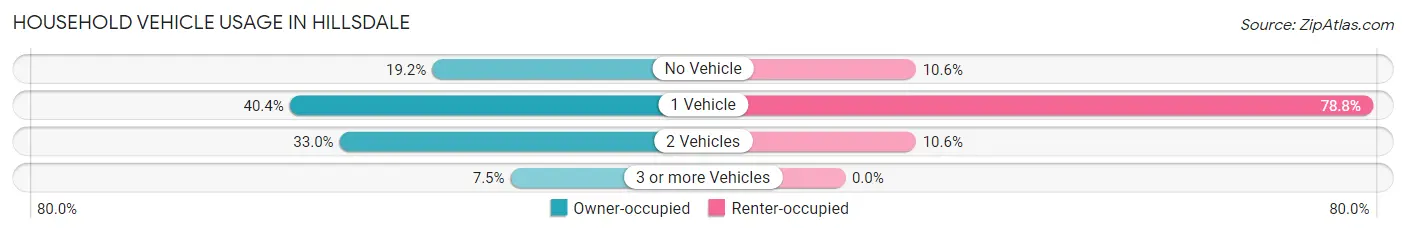
| Vehicles per Household | Owner-occupied | Renter-occupied |
| No Vehicle | 18 (19.2%) | 29 (10.6%) |
| 1 Vehicle | 38 (40.4%) | 216 (78.8%) |
| 2 Vehicles | 31 (33.0%) | 29 (10.6%) |
| 3 or more Vehicles | 7 (7.4%) | 0 (0.0%) |
| Total | 94 (100.0%) | 274 (100.0%) |
Real Estate & Mortgages in Hillsdale
Real Estate and Mortgage Overview in Hillsdale
| Characteristic | Without Mortgage | With Mortgage |
| Housing Units | 39 | 55 |
| Median Property Value | - | - |
| Median Household Income | - | - |
| Monthly Housing Costs | $507 | $0 |
| Real Estate Taxes | $775 | $0 |
Property Value by Mortgage Status in Hillsdale
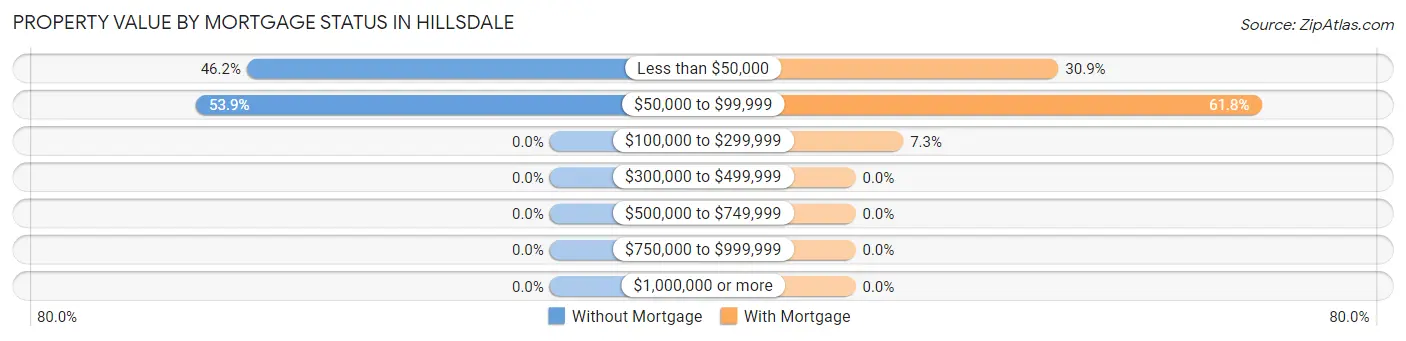
| Property Value | Without Mortgage | With Mortgage |
| Less than $50,000 | 18 (46.2%) | 17 (30.9%) |
| $50,000 to $99,999 | 21 (53.8%) | 34 (61.8%) |
| $100,000 to $299,999 | 0 (0.0%) | 4 (7.3%) |
| $300,000 to $499,999 | 0 (0.0%) | 0 (0.0%) |
| $500,000 to $749,999 | 0 (0.0%) | 0 (0.0%) |
| $750,000 to $999,999 | 0 (0.0%) | 0 (0.0%) |
| $1,000,000 or more | 0 (0.0%) | 0 (0.0%) |
| Total | 39 (100.0%) | 55 (100.0%) |
Household Income by Mortgage Status in Hillsdale
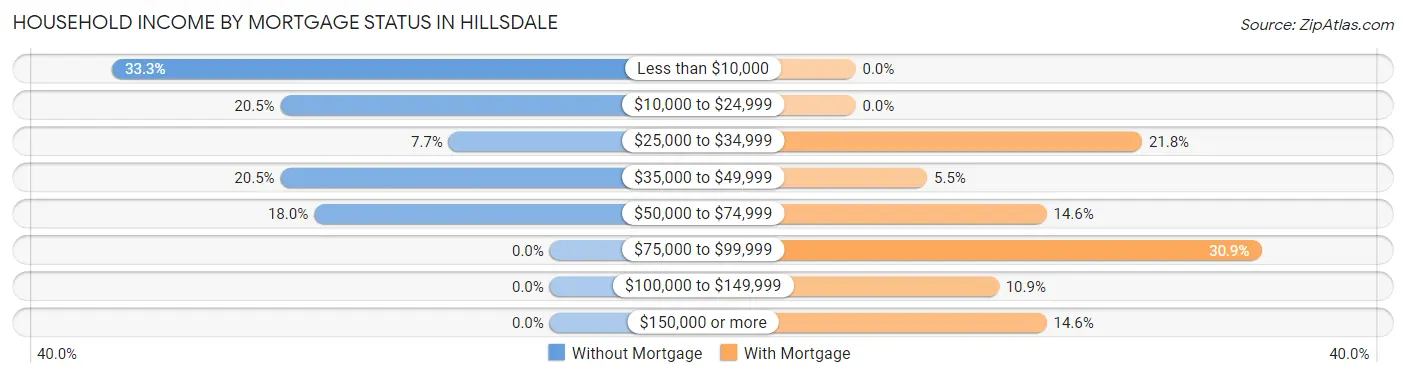
| Household Income | Without Mortgage | With Mortgage |
| Less than $10,000 | 13 (33.3%) | 0 (0.0%) |
| $10,000 to $24,999 | 8 (20.5%) | 0 (0.0%) |
| $25,000 to $34,999 | 3 (7.7%) | 12 (21.8%) |
| $35,000 to $49,999 | 8 (20.5%) | 3 (5.4%) |
| $50,000 to $74,999 | 7 (17.9%) | 8 (14.5%) |
| $75,000 to $99,999 | 0 (0.0%) | 17 (30.9%) |
| $100,000 to $149,999 | 0 (0.0%) | 6 (10.9%) |
| $150,000 or more | 0 (0.0%) | 8 (14.5%) |
| Total | 39 (100.0%) | 55 (100.0%) |
Property Value to Household Income Ratio in Hillsdale
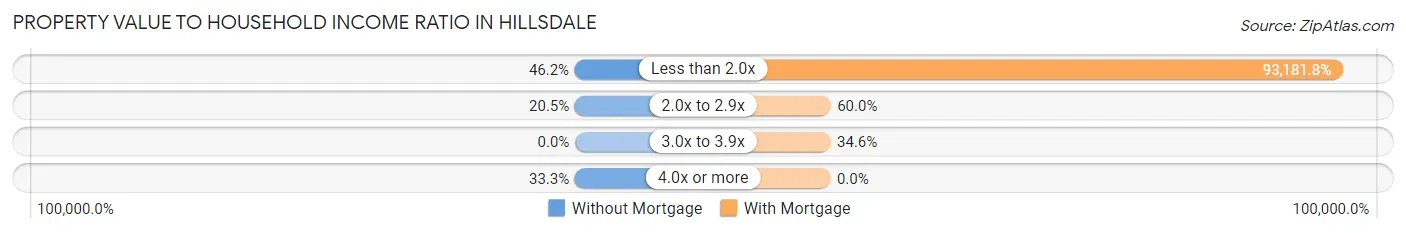
| Value-to-Income Ratio | Without Mortgage | With Mortgage |
| Less than 2.0x | 18 (46.2%) | 51,250 (93,181.8%) |
| 2.0x to 2.9x | 8 (20.5%) | 33 (60.0%) |
| 3.0x to 3.9x | 0 (0.0%) | 19 (34.5%) |
| 4.0x or more | 13 (33.3%) | 0 (0.0%) |
| Total | 39 (100.0%) | 55 (100.0%) |
Real Estate Taxes by Mortgage Status in Hillsdale
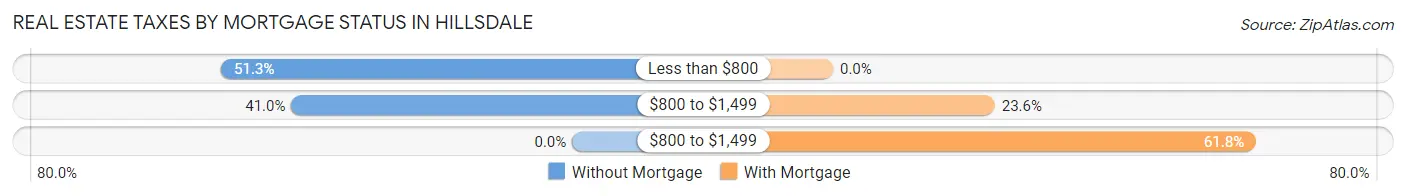
| Property Taxes | Without Mortgage | With Mortgage |
| Less than $800 | 20 (51.3%) | 0 (0.0%) |
| $800 to $1,499 | 16 (41.0%) | 13 (23.6%) |
| $800 to $1,499 | 0 (0.0%) | 34 (61.8%) |
| Total | 39 (100.0%) | 55 (100.0%) |
Health & Disability in Hillsdale
Health Insurance Coverage by Age in Hillsdale
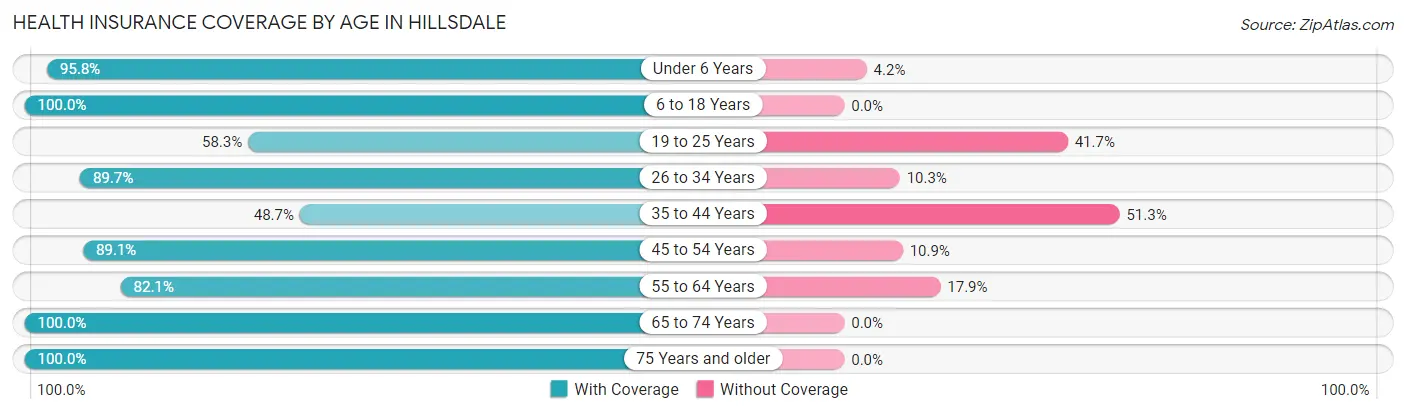
| Age Bracket | With Coverage | Without Coverage |
| Under 6 Years | 184 (95.8%) | 8 (4.2%) |
| 6 to 18 Years | 216 (100.0%) | 0 (0.0%) |
| 19 to 25 Years | 105 (58.3%) | 75 (41.7%) |
| 26 to 34 Years | 165 (89.7%) | 19 (10.3%) |
| 35 to 44 Years | 37 (48.7%) | 39 (51.3%) |
| 45 to 54 Years | 90 (89.1%) | 11 (10.9%) |
| 55 to 64 Years | 55 (82.1%) | 12 (17.9%) |
| 65 to 74 Years | 18 (100.0%) | 0 (0.0%) |
| 75 Years and older | 36 (100.0%) | 0 (0.0%) |
| Total | 906 (84.7%) | 164 (15.3%) |
Health Insurance Coverage by Citizenship Status in Hillsdale
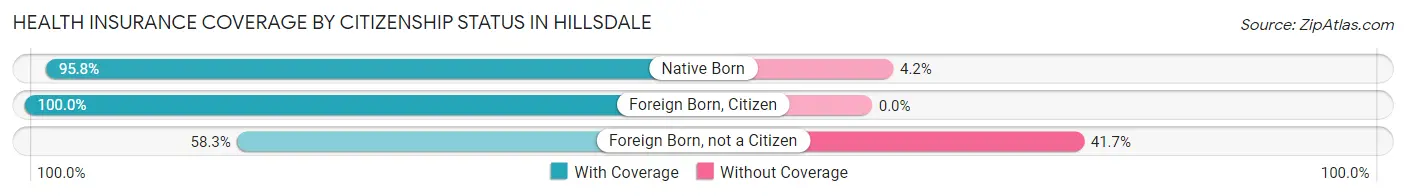
| Citizenship Status | With Coverage | Without Coverage |
| Native Born | 184 (95.8%) | 8 (4.2%) |
| Foreign Born, Citizen | 216 (100.0%) | 0 (0.0%) |
| Foreign Born, not a Citizen | 105 (58.3%) | 75 (41.7%) |
Health Insurance Coverage by Household Income in Hillsdale
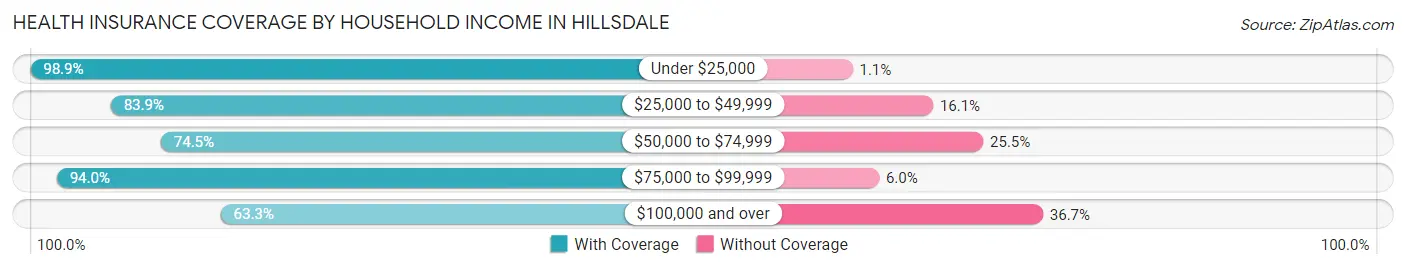
| Household Income | With Coverage | Without Coverage |
| Under $25,000 | 277 (98.9%) | 3 (1.1%) |
| $25,000 to $49,999 | 317 (83.9%) | 61 (16.1%) |
| $50,000 to $74,999 | 172 (74.5%) | 59 (25.5%) |
| $75,000 to $99,999 | 78 (94.0%) | 5 (6.0%) |
| $100,000 and over | 62 (63.3%) | 36 (36.7%) |
Public vs Private Health Insurance Coverage by Age in Hillsdale
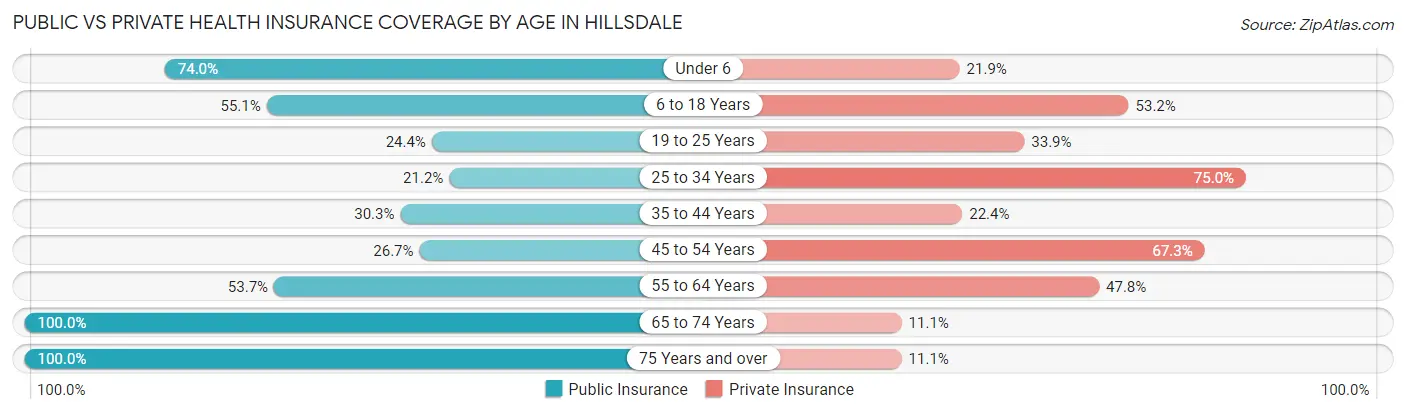
| Age Bracket | Public Insurance | Private Insurance |
| Under 6 | 142 (74.0%) | 42 (21.9%) |
| 6 to 18 Years | 119 (55.1%) | 115 (53.2%) |
| 19 to 25 Years | 44 (24.4%) | 61 (33.9%) |
| 25 to 34 Years | 39 (21.2%) | 138 (75.0%) |
| 35 to 44 Years | 23 (30.3%) | 17 (22.4%) |
| 45 to 54 Years | 27 (26.7%) | 68 (67.3%) |
| 55 to 64 Years | 36 (53.7%) | 32 (47.8%) |
| 65 to 74 Years | 18 (100.0%) | 2 (11.1%) |
| 75 Years and over | 36 (100.0%) | 4 (11.1%) |
| Total | 484 (45.2%) | 479 (44.8%) |
Disability Status by Sex by Age in Hillsdale
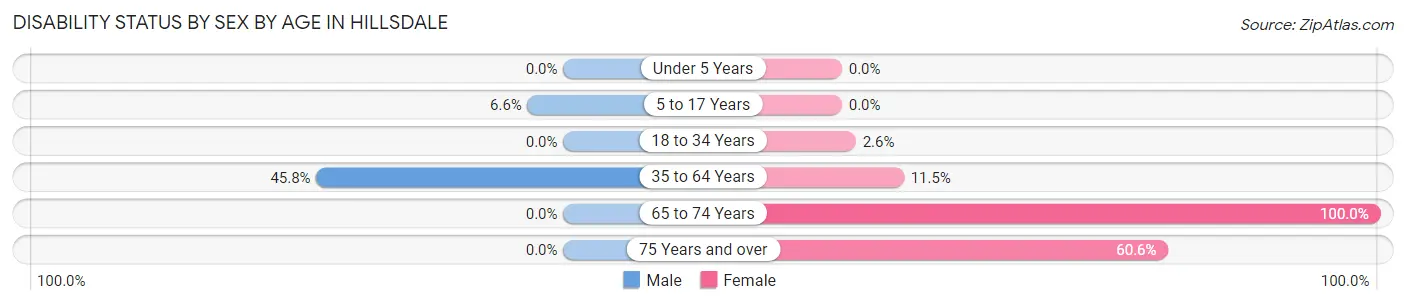
| Age Bracket | Male | Female |
| Under 5 Years | 0 (0.0%) | 0 (0.0%) |
| 5 to 17 Years | 9 (6.6%) | 0 (0.0%) |
| 18 to 34 Years | 0 (0.0%) | 6 (2.6%) |
| 35 to 64 Years | 44 (45.8%) | 17 (11.5%) |
| 65 to 74 Years | 0 (0.0%) | 13 (100.0%) |
| 75 Years and over | 0 (0.0%) | 20 (60.6%) |
Disability Class by Sex by Age in Hillsdale
Disability Class: Hearing Difficulty
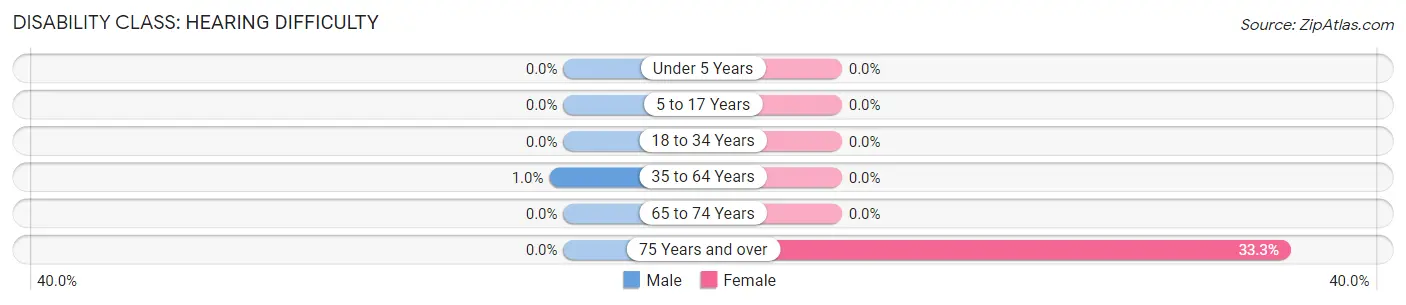
| Age Bracket | Male | Female |
| Under 5 Years | 0 (0.0%) | 0 (0.0%) |
| 5 to 17 Years | 0 (0.0%) | 0 (0.0%) |
| 18 to 34 Years | 0 (0.0%) | 0 (0.0%) |
| 35 to 64 Years | 1 (1.0%) | 0 (0.0%) |
| 65 to 74 Years | 0 (0.0%) | 0 (0.0%) |
| 75 Years and over | 0 (0.0%) | 11 (33.3%) |
Disability Class: Vision Difficulty
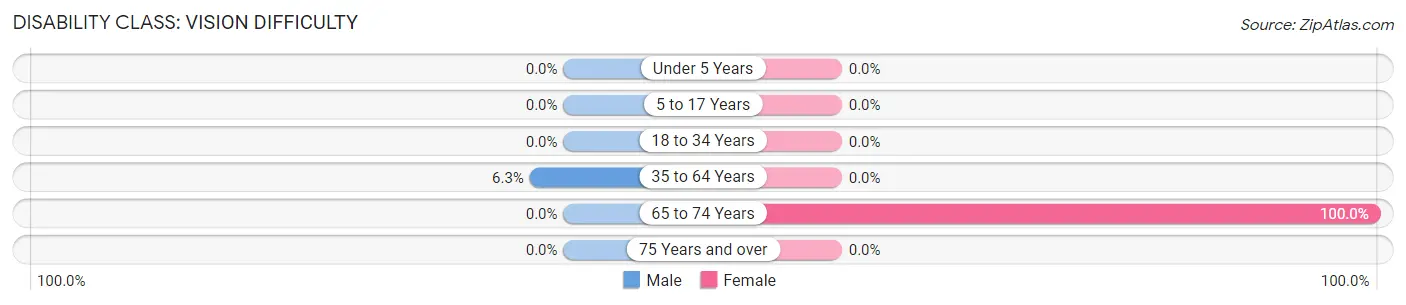
| Age Bracket | Male | Female |
| Under 5 Years | 0 (0.0%) | 0 (0.0%) |
| 5 to 17 Years | 0 (0.0%) | 0 (0.0%) |
| 18 to 34 Years | 0 (0.0%) | 0 (0.0%) |
| 35 to 64 Years | 6 (6.2%) | 0 (0.0%) |
| 65 to 74 Years | 0 (0.0%) | 13 (100.0%) |
| 75 Years and over | 0 (0.0%) | 0 (0.0%) |
Disability Class: Cognitive Difficulty
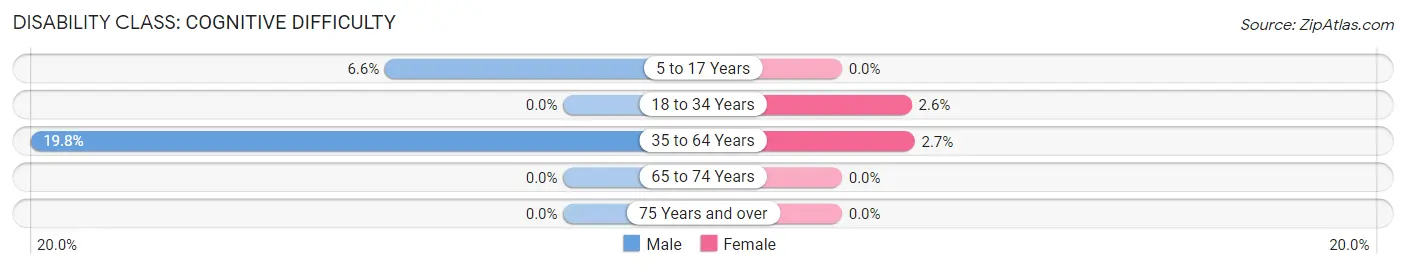
| Age Bracket | Male | Female |
| 5 to 17 Years | 9 (6.6%) | 0 (0.0%) |
| 18 to 34 Years | 0 (0.0%) | 6 (2.6%) |
| 35 to 64 Years | 19 (19.8%) | 4 (2.7%) |
| 65 to 74 Years | 0 (0.0%) | 0 (0.0%) |
| 75 Years and over | 0 (0.0%) | 0 (0.0%) |
Disability Class: Ambulatory Difficulty
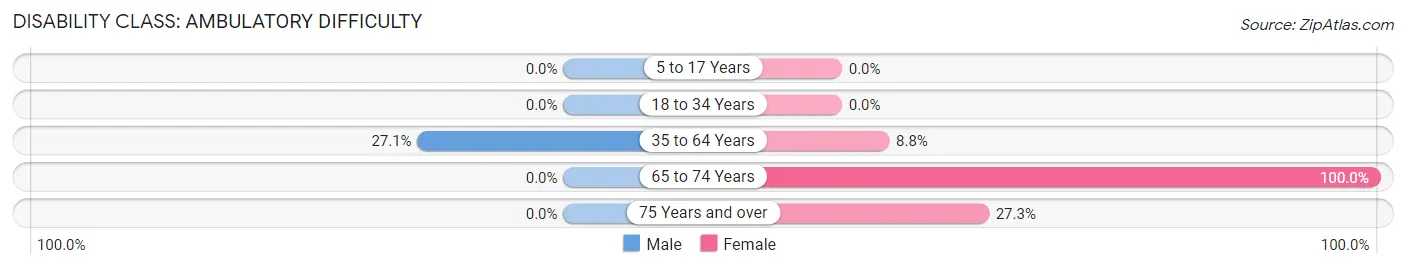
| Age Bracket | Male | Female |
| 5 to 17 Years | 0 (0.0%) | 0 (0.0%) |
| 18 to 34 Years | 0 (0.0%) | 0 (0.0%) |
| 35 to 64 Years | 26 (27.1%) | 13 (8.8%) |
| 65 to 74 Years | 0 (0.0%) | 13 (100.0%) |
| 75 Years and over | 0 (0.0%) | 9 (27.3%) |
Disability Class: Self-Care Difficulty
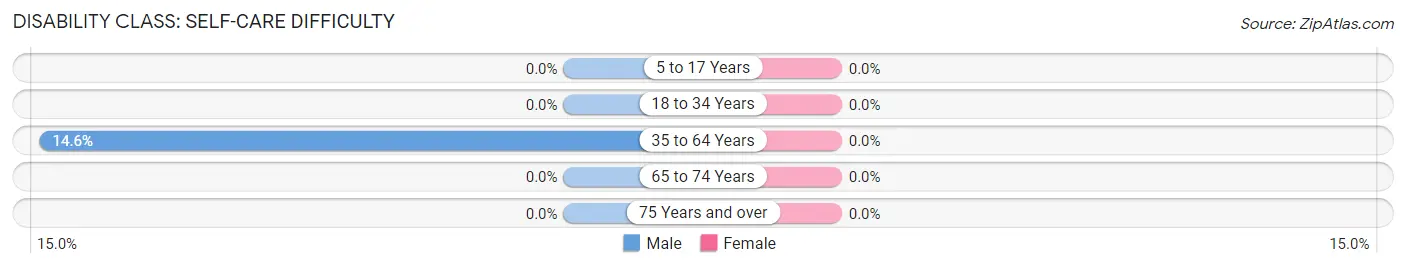
| Age Bracket | Male | Female |
| 5 to 17 Years | 0 (0.0%) | 0 (0.0%) |
| 18 to 34 Years | 0 (0.0%) | 0 (0.0%) |
| 35 to 64 Years | 14 (14.6%) | 0 (0.0%) |
| 65 to 74 Years | 0 (0.0%) | 0 (0.0%) |
| 75 Years and over | 0 (0.0%) | 0 (0.0%) |
Technology Access in Hillsdale
Computing Device Access in Hillsdale
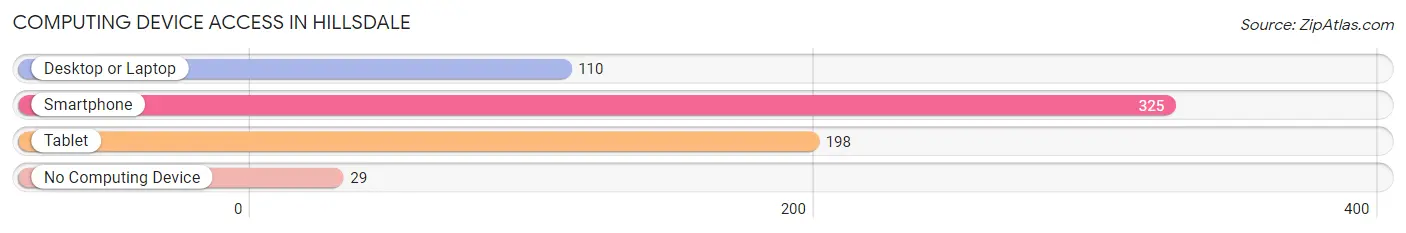
| Device Type | # Households | % Households |
| Desktop or Laptop | 110 | 29.9% |
| Smartphone | 325 | 88.3% |
| Tablet | 198 | 53.8% |
| No Computing Device | 29 | 7.9% |
| Total | 368 | 100.0% |
Internet Access in Hillsdale
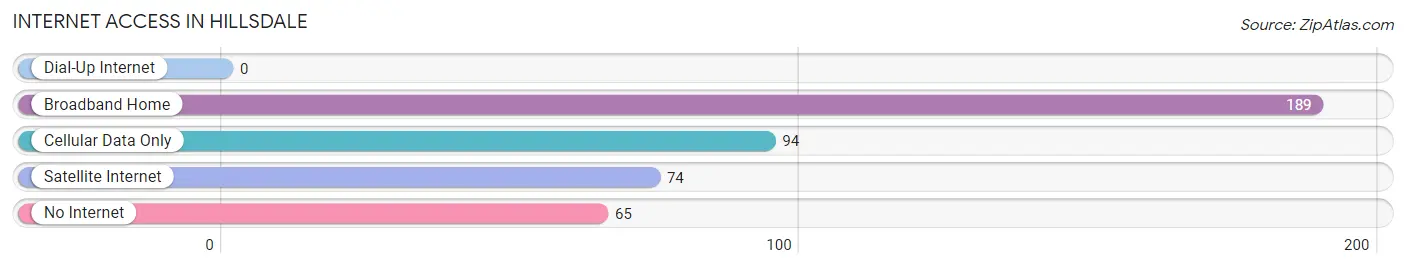
| Internet Type | # Households | % Households |
| Dial-Up Internet | 0 | 0.0% |
| Broadband Home | 189 | 51.4% |
| Cellular Data Only | 94 | 25.5% |
| Satellite Internet | 74 | 20.1% |
| No Internet | 65 | 17.7% |
| Total | 368 | 100.0% |
Hillsdale Summary
Hillsdale is a small city located in St. Louis County, Missouri. It is situated on the banks of the Meramec River, about 20 miles southwest of downtown St. Louis. The city has a population of approximately 2,500 people and is part of the Greater St. Louis metropolitan area.
History
Hillsdale was founded in 1837 by a group of settlers from Kentucky. The town was named after the hills that surrounded it. The first post office was established in 1845 and the first school was built in 1848. The town was incorporated in 1876.
In the late 19th century, Hillsdale was a thriving agricultural community. The town was known for its production of tobacco, corn, wheat, and hay. The town also had a number of small businesses, including a blacksmith shop, a general store, and a hotel.
In the early 20th century, the town began to decline as the railroad bypassed it and the population began to move away. The town was nearly abandoned by the 1950s. In the late 20th century, the town began to experience a resurgence as people began to move back to the area.
Geography
Hillsdale is located in St. Louis County, Missouri. It is situated on the banks of the Meramec River, about 20 miles southwest of downtown St. Louis. The city has a total area of 1.2 square miles, all of which is land.
The city is located in the Ozark Plateau region of Missouri. The terrain is mostly rolling hills and valleys, with some flat areas. The climate is humid subtropical, with hot, humid summers and cold, wet winters.
Economy
Hillsdale’s economy is largely based on agriculture and tourism. The town is home to several small businesses, including a winery, a brewery, and a distillery. The town also has a number of antique stores and art galleries.
The town is also home to a number of small manufacturing companies, including a furniture manufacturer and a metal fabrication company. The town is also home to a number of small service businesses, including a landscaping company and a plumbing company.
Demographics
As of the 2010 census, Hillsdale had a population of 2,500 people. The racial makeup of the town was 95.2% White, 1.2% African American, 0.4% Native American, 0.4% Asian, 0.2% Pacific Islander, and 2.6% from other races. Hispanic or Latino of any race were 3.2% of the population.
The median household income in Hillsdale was $45,000, and the median family income was $50,000. The per capita income was $20,000. About 10.2% of families and 12.2% of the population were below the poverty line, including 16.2% of those under age 18 and 8.2% of those age 65 or over.
Common Questions
What is Per Capita Income in Hillsdale?
Per Capita income in Hillsdale is $15,336.
What is the Median Family Income in Hillsdale?
Median Family Income in Hillsdale is $39,750.
What is the Median Household income in Hillsdale?
Median Household Income in Hillsdale is $35,735.
What is Income or Wage Gap in Hillsdale?
Income or Wage Gap in Hillsdale is 6.2%.
Women in Hillsdale earn 93.8 cents for every dollar earned by a man.
What is Inequality or Gini Index in Hillsdale?
Inequality or Gini Index in Hillsdale is 0.38.
What is the Total Population of Hillsdale?
Total Population of Hillsdale is 1,070.
What is the Total Male Population of Hillsdale?
Total Male Population of Hillsdale is 476.
What is the Total Female Population of Hillsdale?
Total Female Population of Hillsdale is 594.
What is the Ratio of Males per 100 Females in Hillsdale?
There are 80.13 Males per 100 Females in Hillsdale.
What is the Ratio of Females per 100 Males in Hillsdale?
There are 124.79 Females per 100 Males in Hillsdale.
What is the Median Population Age in Hillsdale?
Median Population Age in Hillsdale is 24.9 Years.
What is the Average Family Size in Hillsdale
Average Family Size in Hillsdale is 3.6 People.
What is the Average Household Size in Hillsdale
Average Household Size in Hillsdale is 2.9 People.
How Large is the Labor Force in Hillsdale?
There are 515 People in the Labor Forcein in Hillsdale.
What is the Percentage of People in the Labor Force in Hillsdale?
74.2% of People are in the Labor Force in Hillsdale.
What is the Unemployment Rate in Hillsdale?
Unemployment Rate in Hillsdale is 3.1%.