Hays, KS Map & Demographics
Hays Map
Hays Overview
$32,508
PER CAPITA INCOME
$85,272
AVG FAMILY INCOME
$55,349
AVG HOUSEHOLD INCOME
23.5%
WAGE / INCOME GAP [ % ]
76.5¢/ $1
WAGE / INCOME GAP [ $ ]
0.46
INEQUALITY / GINI INDEX
21,111
TOTAL POPULATION
10,652
MALE POPULATION
10,459
FEMALE POPULATION
101.85
MALES / 100 FEMALES
98.19
FEMALES / 100 MALES
30.6
MEDIAN AGE
2.9
AVG FAMILY SIZE
2.3
AVG HOUSEHOLD SIZE
12,692
LABOR FORCE [ PEOPLE ]
73.2%
PERCENT IN LABOR FORCE
3.5%
UNEMPLOYMENT RATE
Hays Zip Codes
Hays Area Codes
Income in Hays
Income Overview in Hays
Per Capita Income in Hays is $32,508, while median incomes of families and households are $85,272 and $55,349 respectively.
| Characteristic | Number | Measure |
| Per Capita Income | 21,111 | $32,508 |
| Median Family Income | 4,658 | $85,272 |
| Mean Family Income | 4,658 | $100,320 |
| Median Household Income | 8,739 | $55,349 |
| Mean Household Income | 8,739 | $76,943 |
| Income Deficit | 4,658 | $0 |
| Wage / Income Gap (%) | 21,111 | 23.54% |
| Wage / Income Gap ($) | 21,111 | 76.46¢ per $1 |
| Gini / Inequality Index | 21,111 | 0.46 |
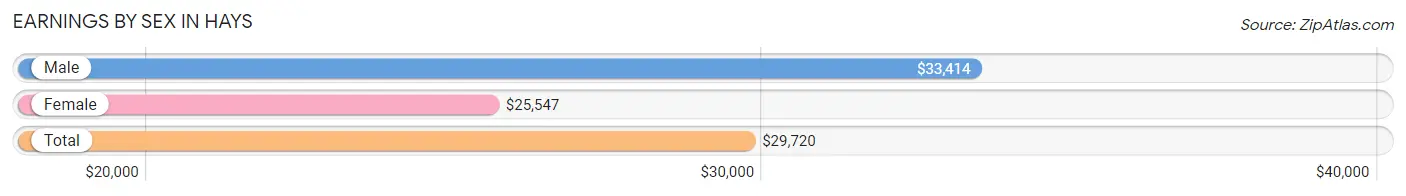
Earnings by Sex in Hays
Average Earnings in Hays are $29,720, $33,414 for men and $25,547 for women, a difference of 23.5%.
| Sex | Number | Average Earnings |
| Male | 7,342 (54.8%) | $33,414 |
| Female | 6,049 (45.2%) | $25,547 |
| Total | 13,391 (100.0%) | $29,720 |
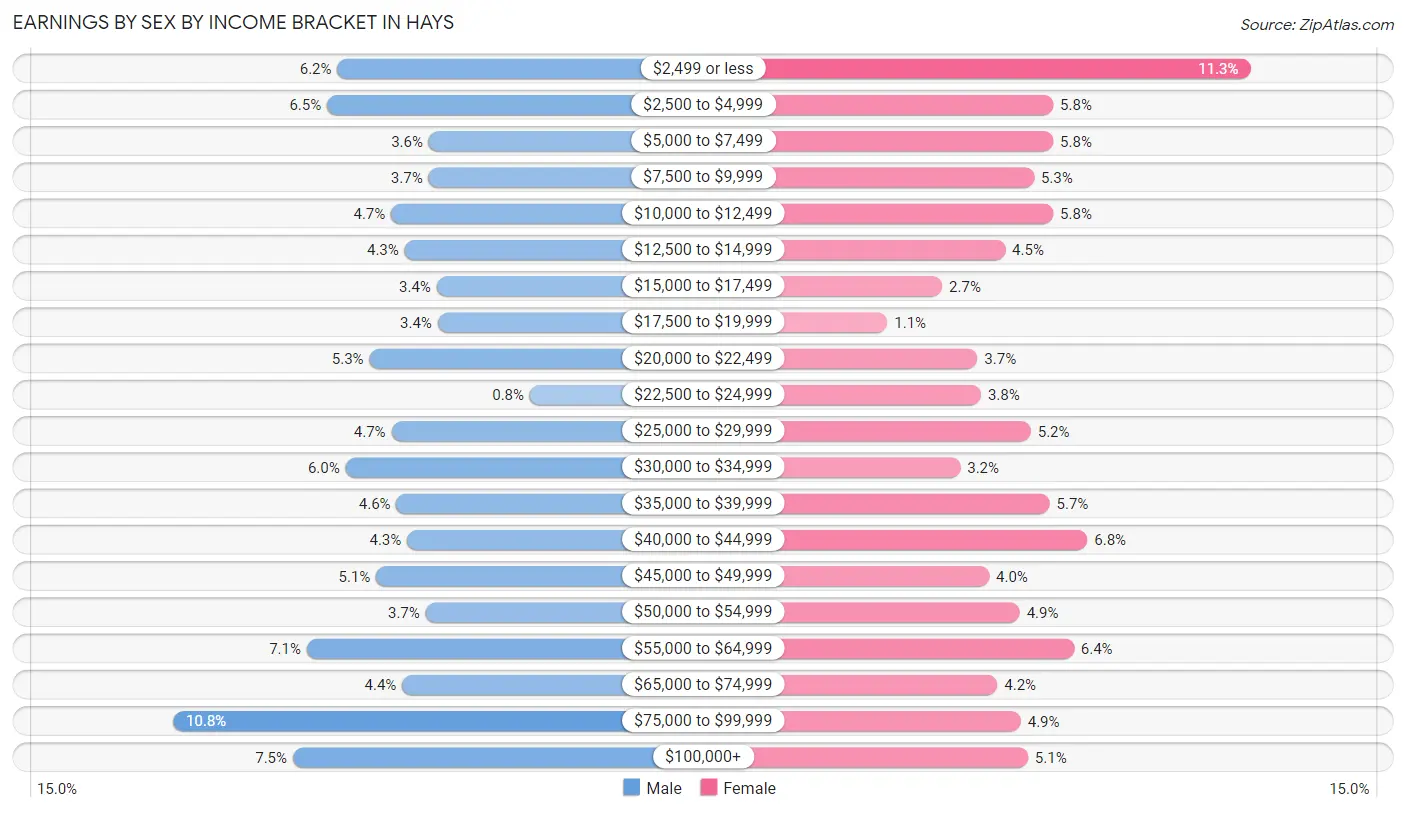
Earnings by Sex by Income Bracket in Hays
The most common earnings brackets in Hays are $75,000 to $99,999 for men (795 | 10.8%) and $2,499 or less for women (686 | 11.3%).
| Income | Male | Female |
| $2,499 or less | 456 (6.2%) | 686 (11.3%) |
| $2,500 to $4,999 | 477 (6.5%) | 351 (5.8%) |
| $5,000 to $7,499 | 267 (3.6%) | 351 (5.8%) |
| $7,500 to $9,999 | 268 (3.6%) | 318 (5.3%) |
| $10,000 to $12,499 | 345 (4.7%) | 351 (5.8%) |
| $12,500 to $14,999 | 317 (4.3%) | 269 (4.4%) |
| $15,000 to $17,499 | 251 (3.4%) | 162 (2.7%) |
| $17,500 to $19,999 | 249 (3.4%) | 69 (1.1%) |
| $20,000 to $22,499 | 390 (5.3%) | 222 (3.7%) |
| $22,500 to $24,999 | 59 (0.8%) | 228 (3.8%) |
| $25,000 to $29,999 | 344 (4.7%) | 313 (5.2%) |
| $30,000 to $34,999 | 439 (6.0%) | 193 (3.2%) |
| $35,000 to $39,999 | 334 (4.5%) | 345 (5.7%) |
| $40,000 to $44,999 | 312 (4.3%) | 409 (6.8%) |
| $45,000 to $49,999 | 376 (5.1%) | 242 (4.0%) |
| $50,000 to $54,999 | 274 (3.7%) | 294 (4.9%) |
| $55,000 to $64,999 | 519 (7.1%) | 386 (6.4%) |
| $65,000 to $74,999 | 322 (4.4%) | 256 (4.2%) |
| $75,000 to $99,999 | 795 (10.8%) | 296 (4.9%) |
| $100,000+ | 548 (7.5%) | 308 (5.1%) |
| Total | 7,342 (100.0%) | 6,049 (100.0%) |
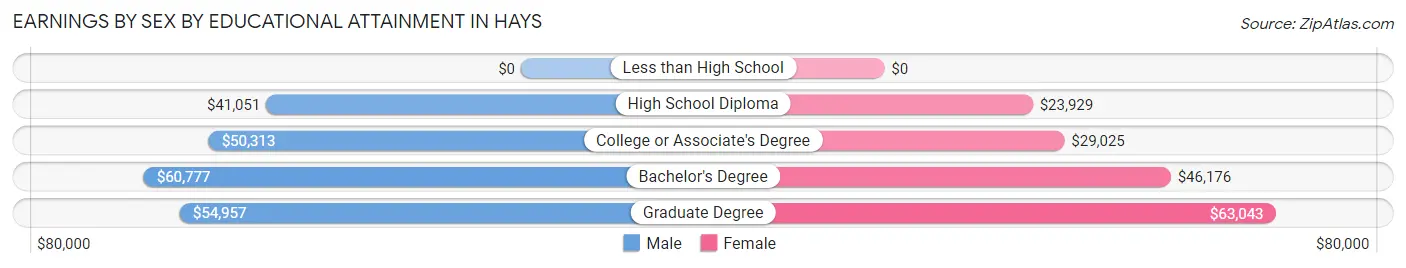
Earnings by Sex by Educational Attainment in Hays
Average earnings in Hays are $50,043 for men and $42,250 for women, a difference of 15.6%. Men with an educational attainment of bachelor's degree enjoy the highest average annual earnings of $60,777, while those with high school diploma education earn the least with $41,051. Women with an educational attainment of graduate degree earn the most with the average annual earnings of $63,043, while those with high school diploma education have the smallest earnings of $23,929.
| Educational Attainment | Male Income | Female Income |
| Less than High School | - | - |
| High School Diploma | $41,051 | $23,929 |
| College or Associate's Degree | $50,313 | $29,025 |
| Bachelor's Degree | $60,777 | $46,176 |
| Graduate Degree | $54,957 | $63,043 |
| Total | $50,043 | $42,250 |
Family Income in Hays
Family Income Brackets in Hays
According to the Hays family income data, there are 1,146 families falling into the $100,000 to $149,999 income range, which is the most common income bracket and makes up 24.6% of all families. Conversely, the $10,000 to $14,999 income bracket is the least frequent group with only 19 families (0.4%) belonging to this category.
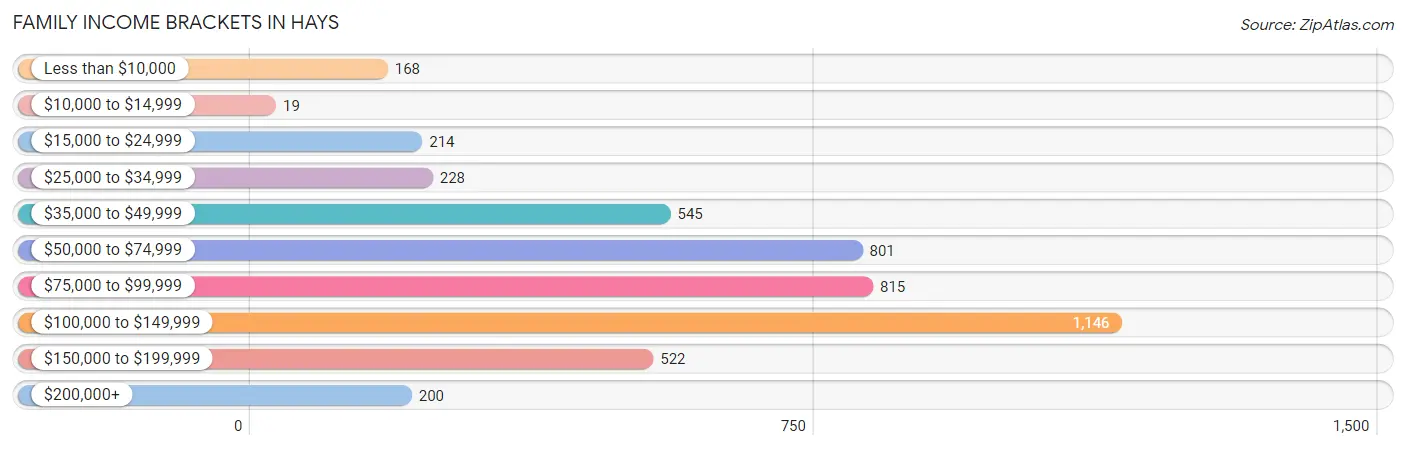
| Income Bracket | # Families | % Families |
| Less than $10,000 | 168 | 3.6% |
| $10,000 to $14,999 | 19 | 0.4% |
| $15,000 to $24,999 | 214 | 4.6% |
| $25,000 to $34,999 | 228 | 4.9% |
| $35,000 to $49,999 | 545 | 11.7% |
| $50,000 to $74,999 | 801 | 17.2% |
| $75,000 to $99,999 | 815 | 17.5% |
| $100,000 to $149,999 | 1,146 | 24.6% |
| $150,000 to $199,999 | 522 | 11.2% |
| $200,000+ | 200 | 4.3% |
Family Income by Famaliy Size in Hays
5-person families (432 | 9.3%) account for the highest median family income in Hays with $123,929 per family, while 3-person families (1,052 | 22.6%) have the highest median income of $33,604 per family member.
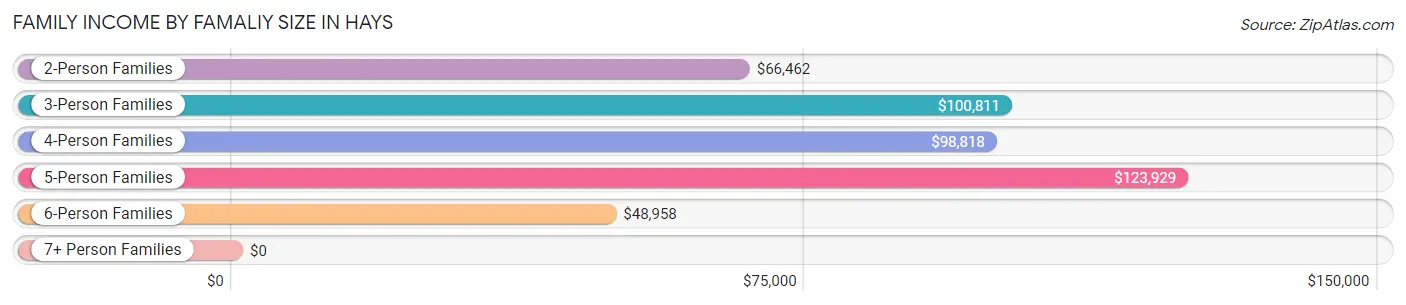
| Income Bracket | # Families | Median Income |
| 2-Person Families | 2,222 (47.7%) | $66,462 |
| 3-Person Families | 1,052 (22.6%) | $100,811 |
| 4-Person Families | 791 (17.0%) | $98,818 |
| 5-Person Families | 432 (9.3%) | $123,929 |
| 6-Person Families | 91 (1.9%) | $48,958 |
| 7+ Person Families | 70 (1.5%) | $0 |
| Total | 4,658 (100.0%) | $85,272 |
Family Income by Number of Earners in Hays
The median family income in Hays is $85,272, with families comprising 2 earners (2,077) having the highest median family income of $108,234, while families with no earners (572) have the lowest median family income of $41,676, accounting for 44.6% and 12.3% of families, respectively.
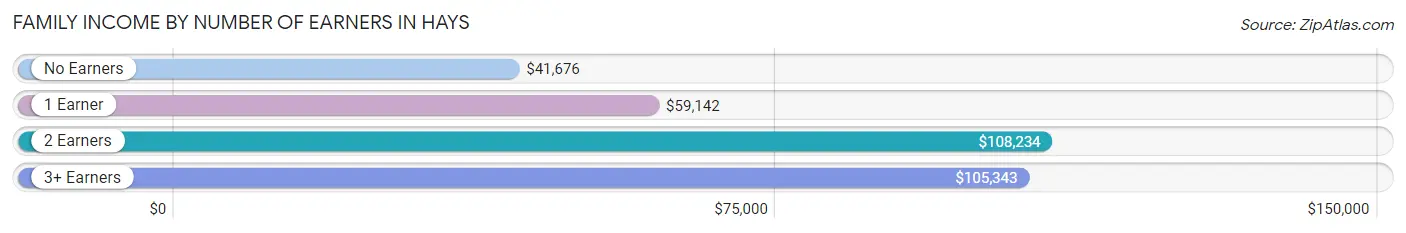
| Number of Earners | # Families | Median Income |
| No Earners | 572 (12.3%) | $41,676 |
| 1 Earner | 1,489 (32.0%) | $59,142 |
| 2 Earners | 2,077 (44.6%) | $108,234 |
| 3+ Earners | 520 (11.2%) | $105,343 |
| Total | 4,658 (100.0%) | $85,272 |
Household Income in Hays
Household Income Brackets in Hays
With 1,416 households falling in the category, the $50,000 to $74,999 income range is the most frequent in Hays, accounting for 16.2% of all households. In contrast, only 245 households (2.8%) fall into the $200,000+ income bracket, making it the least populous group.
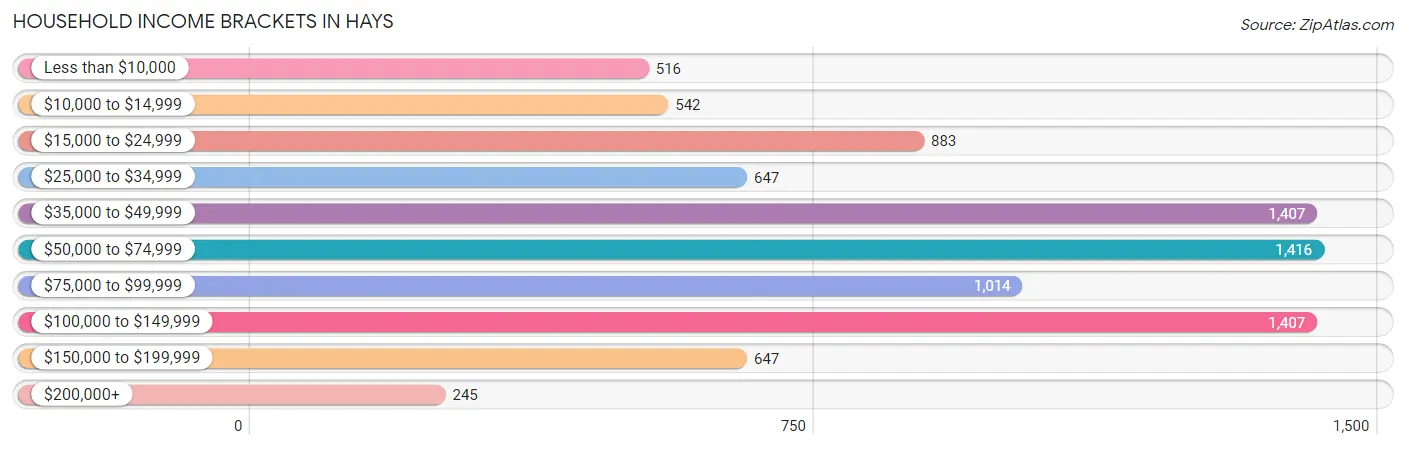
| Income Bracket | # Households | % Households |
| Less than $10,000 | 516 | 5.9% |
| $10,000 to $14,999 | 542 | 6.2% |
| $15,000 to $24,999 | 883 | 10.1% |
| $25,000 to $34,999 | 647 | 7.4% |
| $35,000 to $49,999 | 1,407 | 16.1% |
| $50,000 to $74,999 | 1,416 | 16.2% |
| $75,000 to $99,999 | 1,014 | 11.6% |
| $100,000 to $149,999 | 1,407 | 16.1% |
| $150,000 to $199,999 | 647 | 7.4% |
| $200,000+ | 245 | 2.8% |
Household Income by Householder Age in Hays
The median household income in Hays is $55,349, with the highest median household income of $84,901 found in the 25 to 44 years age bracket for the primary householder. A total of 2,977 households (34.1%) fall into this category. Meanwhile, the 15 to 24 years age bracket for the primary householder has the lowest median household income of $34,365, with 1,489 households (17.0%) in this group.
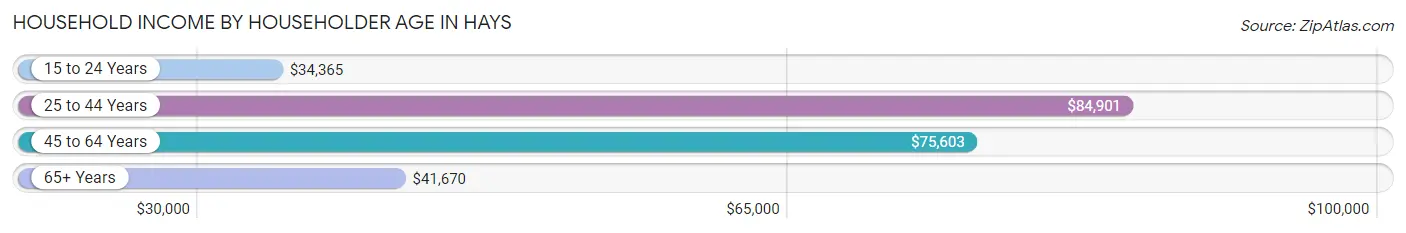
| Income Bracket | # Households | Median Income |
| 15 to 24 Years | 1,489 (17.0%) | $34,365 |
| 25 to 44 Years | 2,977 (34.1%) | $84,901 |
| 45 to 64 Years | 2,131 (24.4%) | $75,603 |
| 65+ Years | 2,142 (24.5%) | $41,670 |
| Total | 8,739 (100.0%) | $55,349 |
Poverty in Hays
Income Below Poverty by Sex and Age in Hays
With 16.9% poverty level for males and 17.4% for females among the residents of Hays, 18 to 24 year old males and 18 to 24 year old females are the most vulnerable to poverty, with 863 males (43.7%) and 854 females (48.4%) in their respective age groups living below the poverty level.
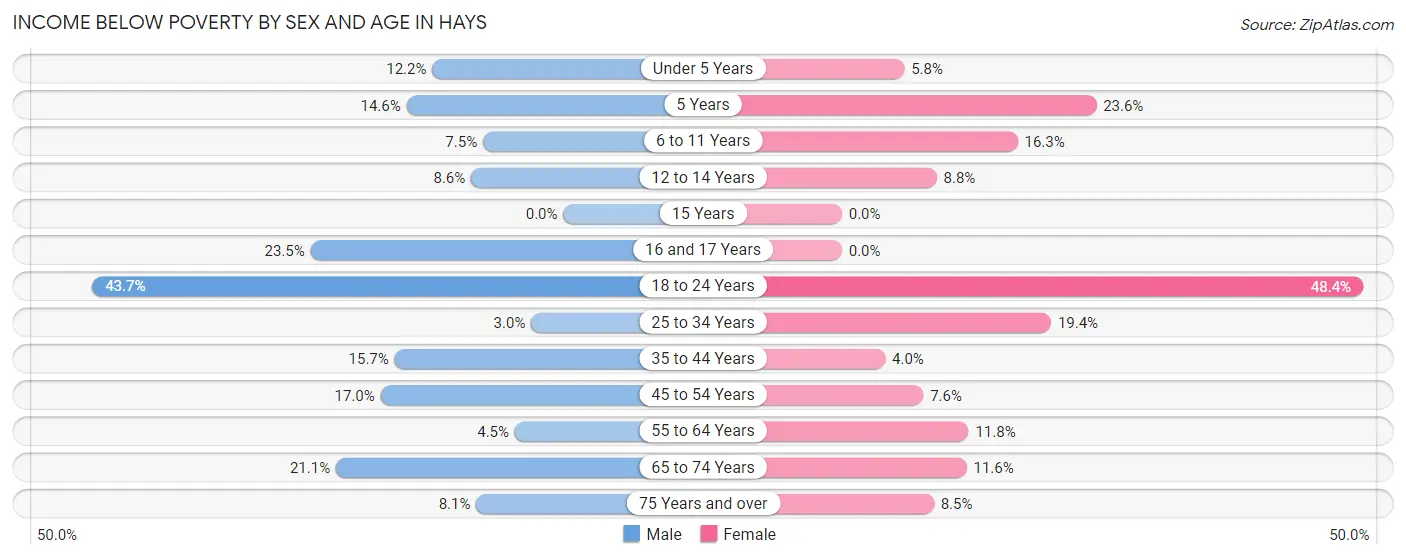
| Age Bracket | Male | Female |
| Under 5 Years | 58 (12.2%) | 35 (5.8%) |
| 5 Years | 16 (14.5%) | 17 (23.6%) |
| 6 to 11 Years | 58 (7.5%) | 107 (16.3%) |
| 12 to 14 Years | 31 (8.6%) | 38 (8.8%) |
| 15 Years | 0 (0.0%) | 0 (0.0%) |
| 16 and 17 Years | 19 (23.5%) | 0 (0.0%) |
| 18 to 24 Years | 863 (43.7%) | 854 (48.4%) |
| 25 to 34 Years | 48 (3.0%) | 251 (19.4%) |
| 35 to 44 Years | 182 (15.7%) | 50 (4.0%) |
| 45 to 54 Years | 154 (17.0%) | 65 (7.6%) |
| 55 to 64 Years | 41 (4.5%) | 117 (11.8%) |
| 65 to 74 Years | 176 (21.1%) | 116 (11.6%) |
| 75 Years and over | 47 (8.1%) | 58 (8.5%) |
| Total | 1,693 (16.9%) | 1,708 (17.4%) |
Income Above Poverty by Sex and Age in Hays
According to the poverty statistics in Hays, males aged 15 years and females aged 15 years are the age groups that are most secure financially, with 100.0% of males and 100.0% of females in these age groups living above the poverty line.
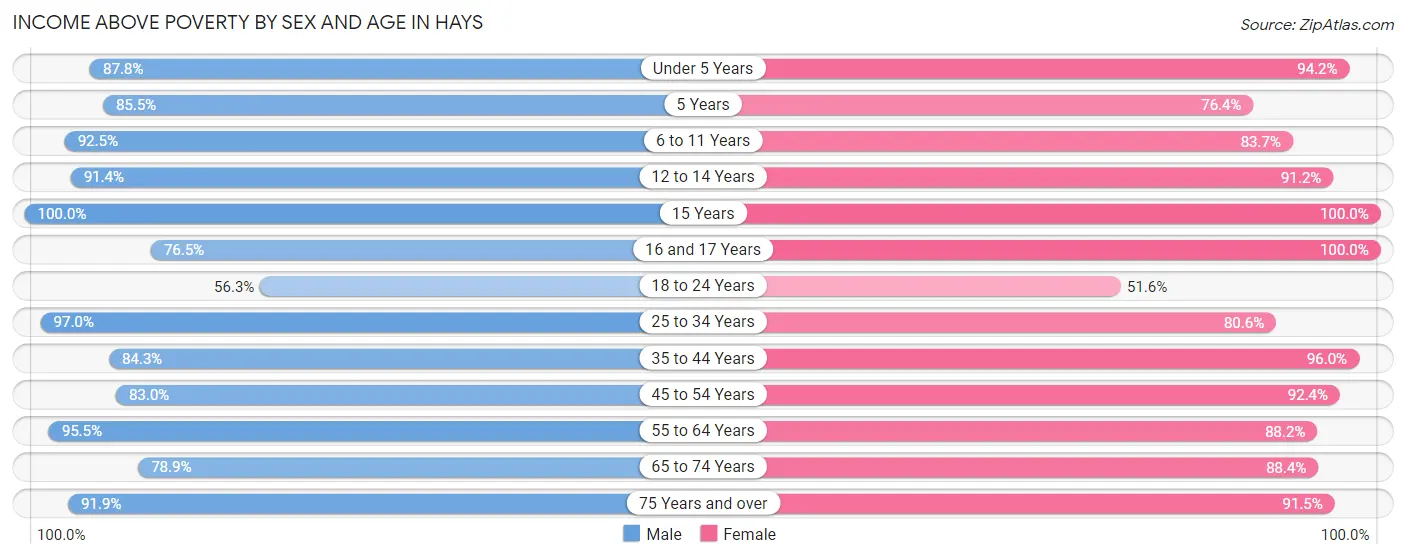
| Age Bracket | Male | Female |
| Under 5 Years | 419 (87.8%) | 570 (94.2%) |
| 5 Years | 94 (85.5%) | 55 (76.4%) |
| 6 to 11 Years | 719 (92.5%) | 549 (83.7%) |
| 12 to 14 Years | 331 (91.4%) | 394 (91.2%) |
| 15 Years | 242 (100.0%) | 39 (100.0%) |
| 16 and 17 Years | 62 (76.5%) | 182 (100.0%) |
| 18 to 24 Years | 1,111 (56.3%) | 912 (51.6%) |
| 25 to 34 Years | 1,563 (97.0%) | 1,042 (80.6%) |
| 35 to 44 Years | 980 (84.3%) | 1,195 (96.0%) |
| 45 to 54 Years | 754 (83.0%) | 795 (92.4%) |
| 55 to 64 Years | 870 (95.5%) | 878 (88.2%) |
| 65 to 74 Years | 658 (78.9%) | 886 (88.4%) |
| 75 Years and over | 535 (91.9%) | 622 (91.5%) |
| Total | 8,338 (83.1%) | 8,119 (82.6%) |
Income Below Poverty Among Married-Couple Families in Hays
The poverty statistics for married-couple families in Hays show that 3.2% or 123 of the total 3,837 families live below the poverty line. Families with 1 or 2 children have the highest poverty rate of 3.4%, comprising of 44 families. On the other hand, families with 5 or more children have the lowest poverty rate of 0.0%, which includes 0 families.
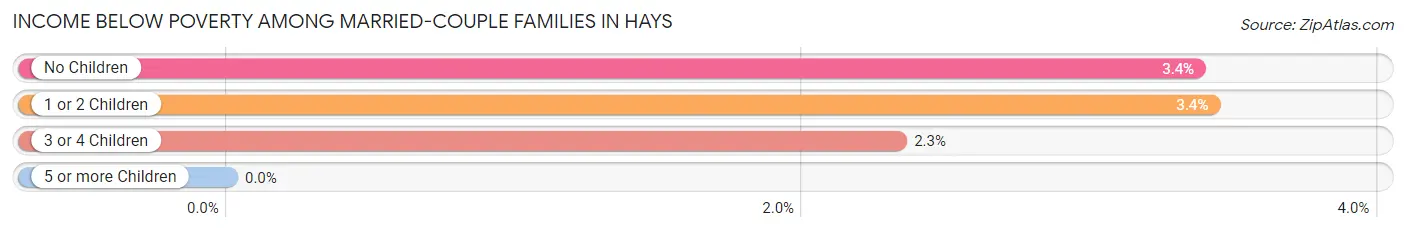
| Children | Above Poverty | Below Poverty |
| No Children | 1,980 (96.6%) | 69 (3.4%) |
| 1 or 2 Children | 1,244 (96.6%) | 44 (3.4%) |
| 3 or 4 Children | 420 (97.7%) | 10 (2.3%) |
| 5 or more Children | 70 (100.0%) | 0 (0.0%) |
| Total | 3,714 (96.8%) | 123 (3.2%) |
Income Below Poverty Among Single-Parent Households in Hays
According to the poverty data in Hays, 10.7% or 17 single-father households and 31.1% or 206 single-mother households are living below the poverty line. Among single-father households, those with 1 or 2 children have the highest poverty rate, with 17 households (22.4%) experiencing poverty. Likewise, among single-mother households, those with 1 or 2 children have the highest poverty rate, with 174 households (38.5%) falling below the poverty line.
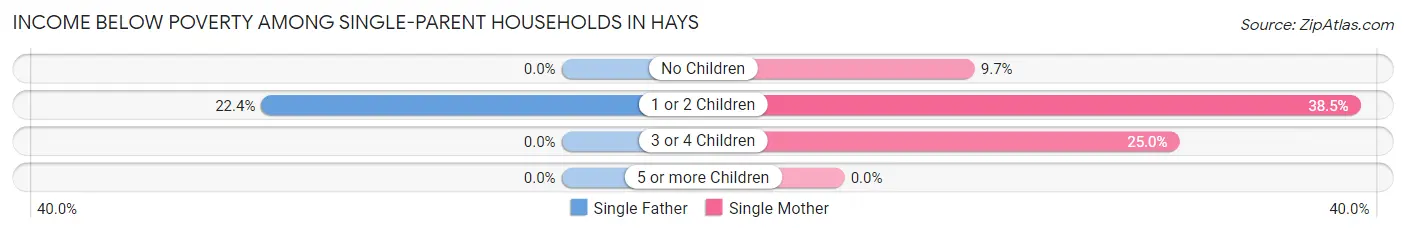
| Children | Single Father | Single Mother |
| No Children | 0 (0.0%) | 13 (9.7%) |
| 1 or 2 Children | 17 (22.4%) | 174 (38.5%) |
| 3 or 4 Children | 0 (0.0%) | 19 (25.0%) |
| 5 or more Children | 0 (0.0%) | 0 (0.0%) |
| Total | 17 (10.7%) | 206 (31.1%) |
Income Below Poverty Among Married-Couple vs Single-Parent Households in Hays
The poverty data for Hays shows that 123 of the married-couple family households (3.2%) and 223 of the single-parent households (27.2%) are living below the poverty level. Within the married-couple family households, those with 1 or 2 children have the highest poverty rate, with 44 households (3.4%) falling below the poverty line. Among the single-parent households, those with 1 or 2 children have the highest poverty rate, with 191 household (36.2%) living below poverty.
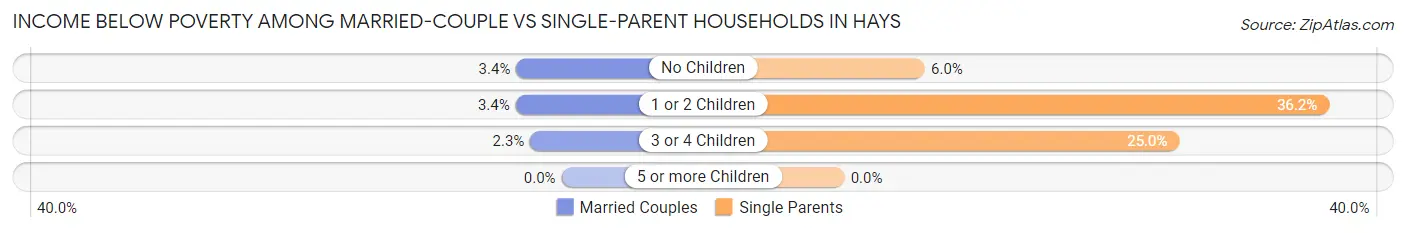
| Children | Married-Couple Families | Single-Parent Households |
| No Children | 69 (3.4%) | 13 (6.0%) |
| 1 or 2 Children | 44 (3.4%) | 191 (36.2%) |
| 3 or 4 Children | 10 (2.3%) | 19 (25.0%) |
| 5 or more Children | 0 (0.0%) | 0 (0.0%) |
| Total | 123 (3.2%) | 223 (27.2%) |
Race in Hays
The most populous races in Hays are White / Caucasian (19,186 | 90.9%), Hispanic or Latino (1,319 | 6.2%), and Two or more Races (962 | 4.6%).
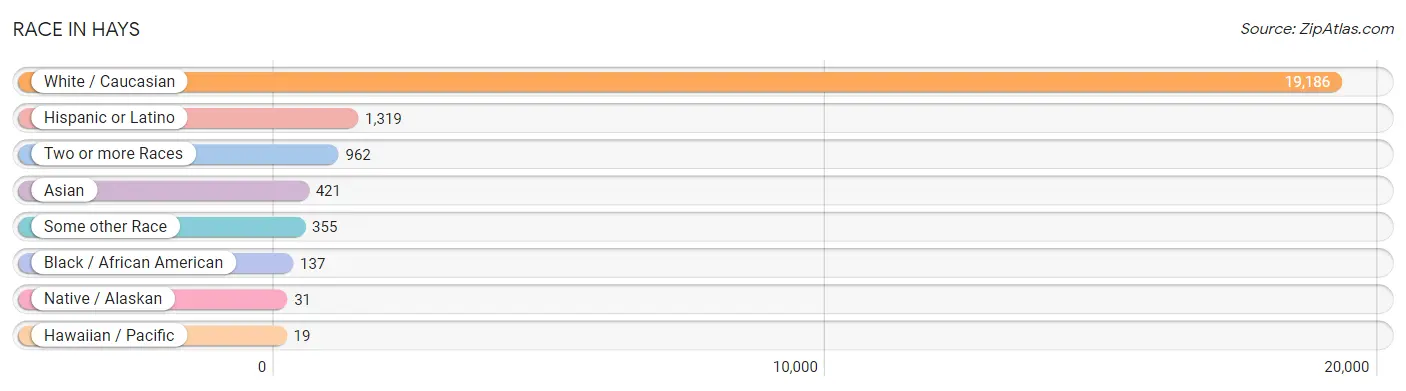
| Race | # Population | % Population |
| Asian | 421 | 2.0% |
| Black / African American | 137 | 0.6% |
| Hawaiian / Pacific | 19 | 0.1% |
| Hispanic or Latino | 1,319 | 6.2% |
| Native / Alaskan | 31 | 0.2% |
| White / Caucasian | 19,186 | 90.9% |
| Two or more Races | 962 | 4.6% |
| Some other Race | 355 | 1.7% |
| Total | 21,111 | 100.0% |
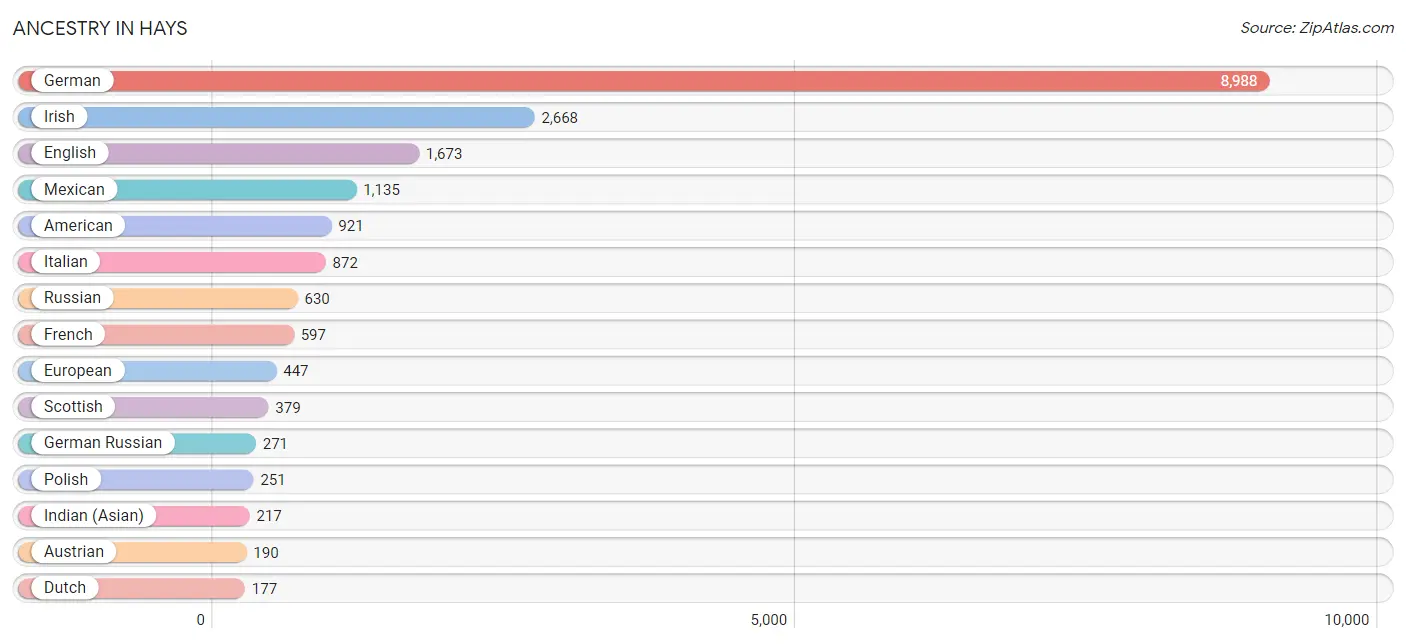
Ancestry in Hays
The most populous ancestries reported in Hays are German (8,988 | 42.6%), Irish (2,668 | 12.6%), English (1,673 | 7.9%), Mexican (1,135 | 5.4%), and American (921 | 4.4%), together accounting for 72.9% of all Hays residents.
| Ancestry | # Population | % Population |
| African | 17 | 0.1% |
| American | 921 | 4.4% |
| Apache | 5 | 0.0% |
| Austrian | 190 | 0.9% |
| Belgian | 57 | 0.3% |
| Bhutanese | 27 | 0.1% |
| Blackfeet | 91 | 0.4% |
| British | 7 | 0.0% |
| Burmese | 24 | 0.1% |
| Canadian | 12 | 0.1% |
| Central American | 23 | 0.1% |
| Cherokee | 169 | 0.8% |
| Choctaw | 9 | 0.0% |
| Colombian | 44 | 0.2% |
| Costa Rican | 23 | 0.1% |
| Creek | 5 | 0.0% |
| Czech | 51 | 0.2% |
| Czechoslovakian | 66 | 0.3% |
| Danish | 133 | 0.6% |
| Dutch | 177 | 0.8% |
| Eastern European | 52 | 0.3% |
| English | 1,673 | 7.9% |
| European | 447 | 2.1% |
| Finnish | 112 | 0.5% |
| French | 597 | 2.8% |
| French Canadian | 113 | 0.5% |
| German | 8,988 | 42.6% |
| German Russian | 271 | 1.3% |
| Greek | 45 | 0.2% |
| Indian (Asian) | 217 | 1.0% |
| Iranian | 13 | 0.1% |
| Irish | 2,668 | 12.6% |
| Italian | 872 | 4.1% |
| Korean | 97 | 0.5% |
| Lithuanian | 78 | 0.4% |
| Malaysian | 16 | 0.1% |
| Mexican | 1,135 | 5.4% |
| Navajo | 27 | 0.1% |
| Nigerian | 33 | 0.2% |
| Northern European | 78 | 0.4% |
| Norwegian | 99 | 0.5% |
| Pennsylvania German | 44 | 0.2% |
| Polish | 251 | 1.2% |
| Puget Sound Salish | 16 | 0.1% |
| Russian | 630 | 3.0% |
| Scandinavian | 22 | 0.1% |
| Scotch-Irish | 75 | 0.4% |
| Scottish | 379 | 1.8% |
| Senegalese | 2 | 0.0% |
| Slovak | 45 | 0.2% |
| South American | 44 | 0.2% |
| Spaniard | 15 | 0.1% |
| Spanish | 61 | 0.3% |
| Sri Lankan | 10 | 0.1% |
| Subsaharan African | 67 | 0.3% |
| Sudanese | 13 | 0.1% |
| Swedish | 161 | 0.8% |
| Swiss | 47 | 0.2% |
| Thai | 124 | 0.6% |
| Tlingit-Haida | 30 | 0.1% |
| Turkish | 6 | 0.0% |
| Ukrainian | 23 | 0.1% |
| Welsh | 130 | 0.6% | View All 63 Rows |
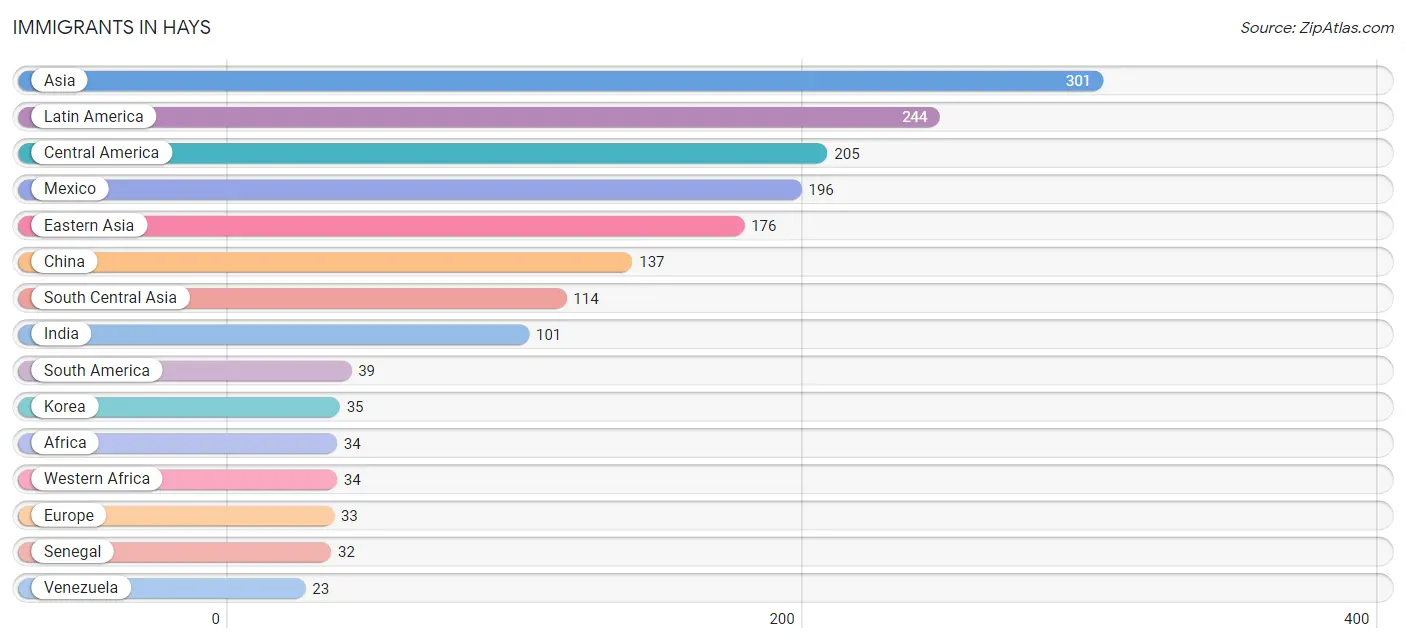
Immigrants in Hays
The most numerous immigrant groups reported in Hays came from Asia (301 | 1.4%), Latin America (244 | 1.2%), Central America (205 | 1.0%), Mexico (196 | 0.9%), and Eastern Asia (176 | 0.8%), together accounting for 5.3% of all Hays residents.
| Immigration Origin | # Population | % Population |
| Africa | 34 | 0.2% |
| Asia | 301 | 1.4% |
| Belize | 9 | 0.0% |
| Central America | 205 | 1.0% |
| China | 137 | 0.6% |
| Colombia | 16 | 0.1% |
| Eastern Asia | 176 | 0.8% |
| Europe | 33 | 0.2% |
| Germany | 5 | 0.0% |
| India | 101 | 0.5% |
| Iran | 13 | 0.1% |
| Italy | 2 | 0.0% |
| Japan | 4 | 0.0% |
| Korea | 35 | 0.2% |
| Latin America | 244 | 1.2% |
| Mexico | 196 | 0.9% |
| Netherlands | 6 | 0.0% |
| Northern Europe | 20 | 0.1% |
| Senegal | 32 | 0.2% |
| South America | 39 | 0.2% |
| South Central Asia | 114 | 0.5% |
| Southern Europe | 2 | 0.0% |
| Turkey | 11 | 0.1% |
| Venezuela | 23 | 0.1% |
| Western Africa | 34 | 0.2% |
| Western Asia | 11 | 0.1% |
| Western Europe | 11 | 0.1% | View All 27 Rows |
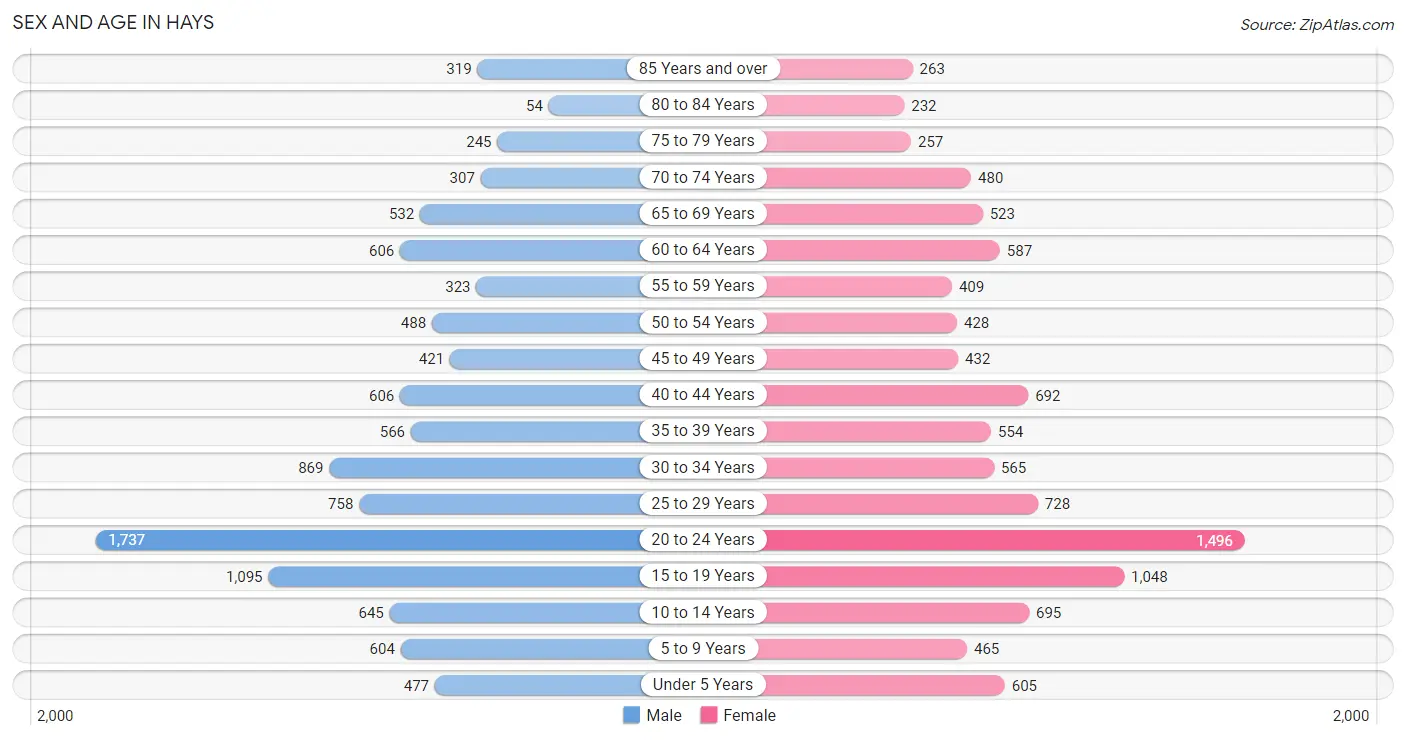
Sex and Age in Hays
Sex and Age in Hays
The most populous age groups in Hays are 20 to 24 Years (1,737 | 16.3%) for men and 20 to 24 Years (1,496 | 14.3%) for women.
| Age Bracket | Male | Female |
| Under 5 Years | 477 (4.5%) | 605 (5.8%) |
| 5 to 9 Years | 604 (5.7%) | 465 (4.4%) |
| 10 to 14 Years | 645 (6.1%) | 695 (6.6%) |
| 15 to 19 Years | 1,095 (10.3%) | 1,048 (10.0%) |
| 20 to 24 Years | 1,737 (16.3%) | 1,496 (14.3%) |
| 25 to 29 Years | 758 (7.1%) | 728 (7.0%) |
| 30 to 34 Years | 869 (8.2%) | 565 (5.4%) |
| 35 to 39 Years | 566 (5.3%) | 554 (5.3%) |
| 40 to 44 Years | 606 (5.7%) | 692 (6.6%) |
| 45 to 49 Years | 421 (4.0%) | 432 (4.1%) |
| 50 to 54 Years | 488 (4.6%) | 428 (4.1%) |
| 55 to 59 Years | 323 (3.0%) | 409 (3.9%) |
| 60 to 64 Years | 606 (5.7%) | 587 (5.6%) |
| 65 to 69 Years | 532 (5.0%) | 523 (5.0%) |
| 70 to 74 Years | 307 (2.9%) | 480 (4.6%) |
| 75 to 79 Years | 245 (2.3%) | 257 (2.5%) |
| 80 to 84 Years | 54 (0.5%) | 232 (2.2%) |
| 85 Years and over | 319 (3.0%) | 263 (2.5%) |
| Total | 10,652 (100.0%) | 10,459 (100.0%) |
Families and Households in Hays
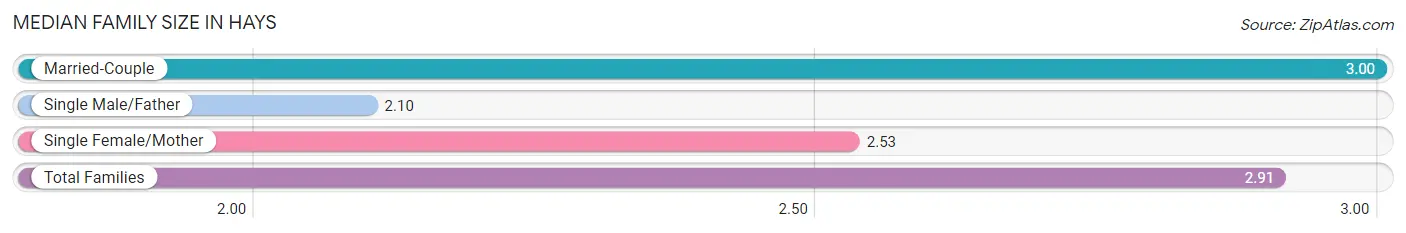
Median Family Size in Hays
The median family size in Hays is 2.91 persons per family, with married-couple families (3,837 | 82.4%) accounting for the largest median family size of 3 persons per family. On the other hand, single male/father families (159 | 3.4%) represent the smallest median family size with 2.10 persons per family.
| Family Type | # Families | Family Size |
| Married-Couple | 3,837 (82.4%) | 3.00 |
| Single Male/Father | 159 (3.4%) | 2.10 |
| Single Female/Mother | 662 (14.2%) | 2.53 |
| Total Families | 4,658 (100.0%) | 2.91 |
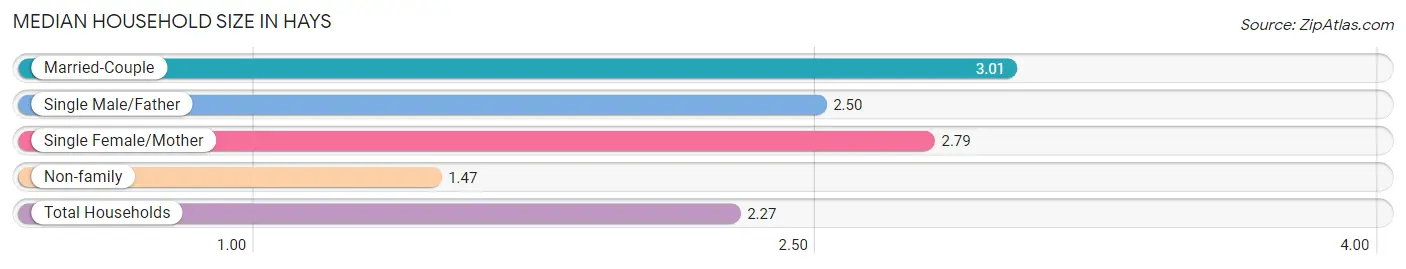
Median Household Size in Hays
The median household size in Hays is 2.27 persons per household, with married-couple households (3,837 | 43.9%) accounting for the largest median household size of 3.01 persons per household. non-family households (4,081 | 46.7%) represent the smallest median household size with 1.47 persons per household.
| Household Type | # Households | Household Size |
| Married-Couple | 3,837 (43.9%) | 3.01 |
| Single Male/Father | 159 (1.8%) | 2.50 |
| Single Female/Mother | 662 (7.6%) | 2.79 |
| Non-family | 4,081 (46.7%) | 1.47 |
| Total Households | 8,739 (100.0%) | 2.27 |
Household Size by Marriage Status in Hays
Out of a total of 8,739 households in Hays, 4,658 (53.3%) are family households, while 4,081 (46.7%) are nonfamily households. The most numerous type of family households are 2-person households, comprising 2,057, and the most common type of nonfamily households are 1-person households, comprising 2,852.
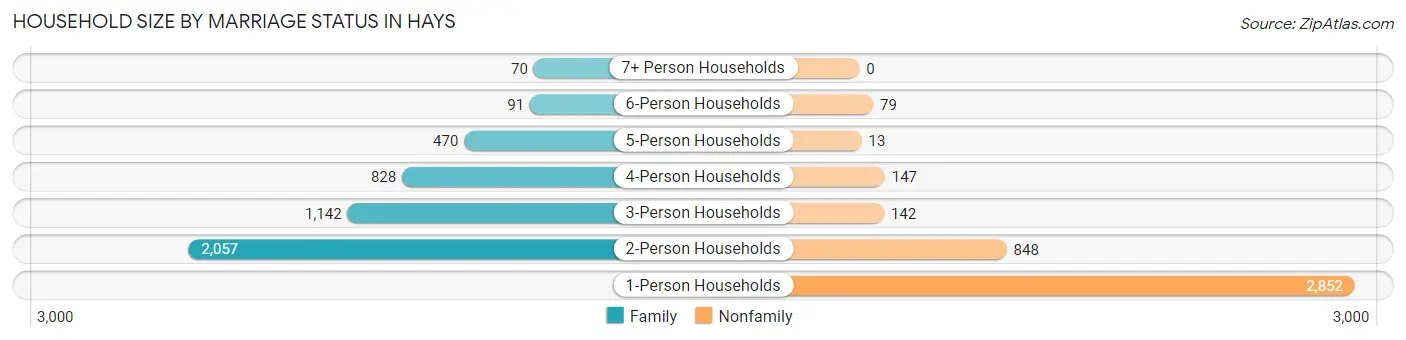
| Household Size | Family Households | Nonfamily Households |
| 1-Person Households | - | 2,852 (32.6%) |
| 2-Person Households | 2,057 (23.5%) | 848 (9.7%) |
| 3-Person Households | 1,142 (13.1%) | 142 (1.6%) |
| 4-Person Households | 828 (9.5%) | 147 (1.7%) |
| 5-Person Households | 470 (5.4%) | 13 (0.2%) |
| 6-Person Households | 91 (1.0%) | 79 (0.9%) |
| 7+ Person Households | 70 (0.8%) | 0 (0.0%) |
| Total | 4,658 (53.3%) | 4,081 (46.7%) |
Female Fertility in Hays
Fertility by Age in Hays
Average fertility rate in Hays is 48.0 births per 1,000 women. Women in the age bracket of 20 to 34 years have the highest fertility rate with 76.0 births per 1,000 women. Women in the age bracket of 20 to 34 years acount for 78.7% of all women with births.

| Age Bracket | Women with Births | Births / 1,000 Women |
| 15 to 19 years | 0 (0.0%) | 0.0 |
| 20 to 34 years | 211 (78.7%) | 76.0 |
| 35 to 50 years | 57 (21.3%) | 32.0 |
| Total | 268 (100.0%) | 48.0 |
Fertility by Age by Marriage Status in Hays
71.3% of women with births (268) in Hays are married. The highest percentage of unmarried women with births falls into 20 to 34 years age bracket with 36.5% of them unmarried at the time of birth, while the lowest percentage of unmarried women with births belong to 35 to 50 years age bracket with 0.0% of them unmarried.
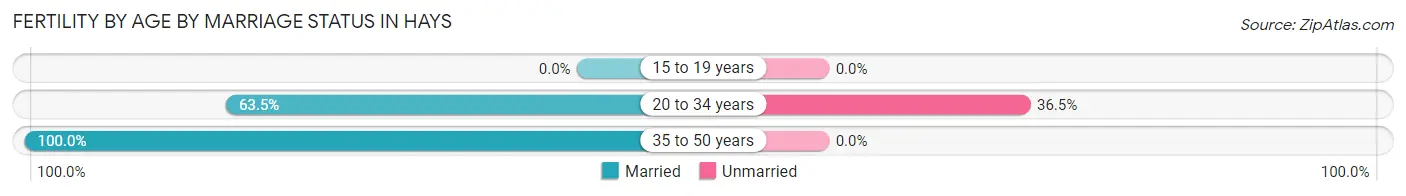
| Age Bracket | Married | Unmarried |
| 15 to 19 years | 0 (0.0%) | 0 (0.0%) |
| 20 to 34 years | 134 (63.5%) | 77 (36.5%) |
| 35 to 50 years | 57 (100.0%) | 0 (0.0%) |
| Total | 191 (71.3%) | 77 (28.7%) |
Fertility by Education in Hays
Average fertility rate in Hays is 48.0 births per 1,000 women. Women with the education attainment of high school diploma have the highest fertility rate of 137.0 births per 1,000 women, while women with the education attainment of college or associate's degree have the lowest fertility at 17.0 births per 1,000 women. Women with the education attainment of high school diploma represent 38.8% of all women with births.
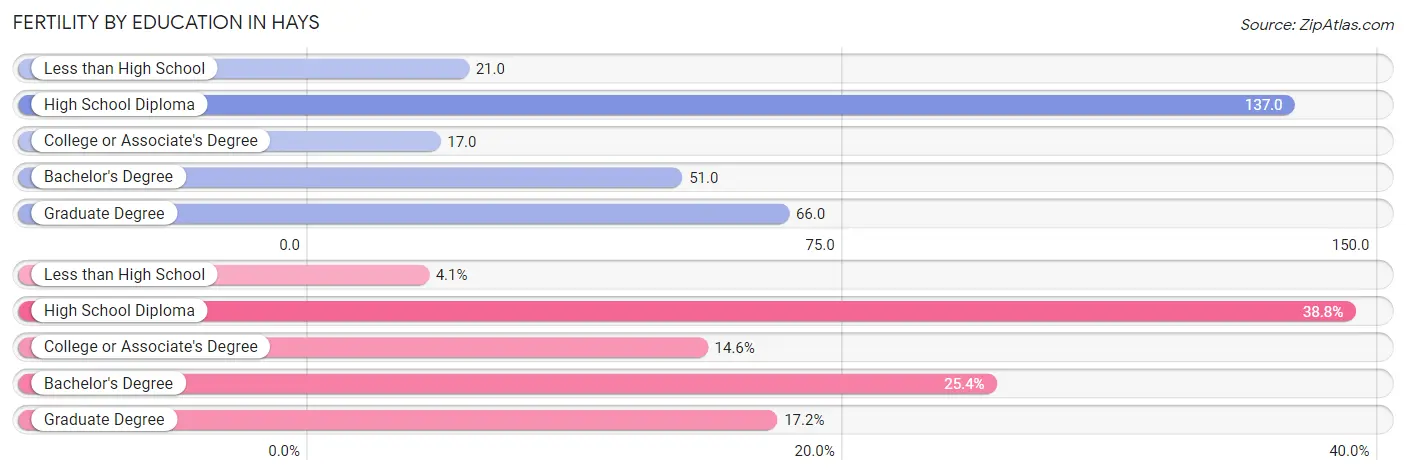
| Educational Attainment | Women with Births | Births / 1,000 Women |
| Less than High School | 11 (4.1%) | 21.0 |
| High School Diploma | 104 (38.8%) | 137.0 |
| College or Associate's Degree | 39 (14.5%) | 17.0 |
| Bachelor's Degree | 68 (25.4%) | 51.0 |
| Graduate Degree | 46 (17.2%) | 66.0 |
| Total | 268 (100.0%) | 48.0 |
Fertility by Education by Marriage Status in Hays
28.7% of women with births in Hays are unmarried. Women with the educational attainment of college or associate's degree are most likely to be married with 100.0% of them married at childbirth, while women with the educational attainment of less than high school are least likely to be married with 100.0% of them unmarried at childbirth.
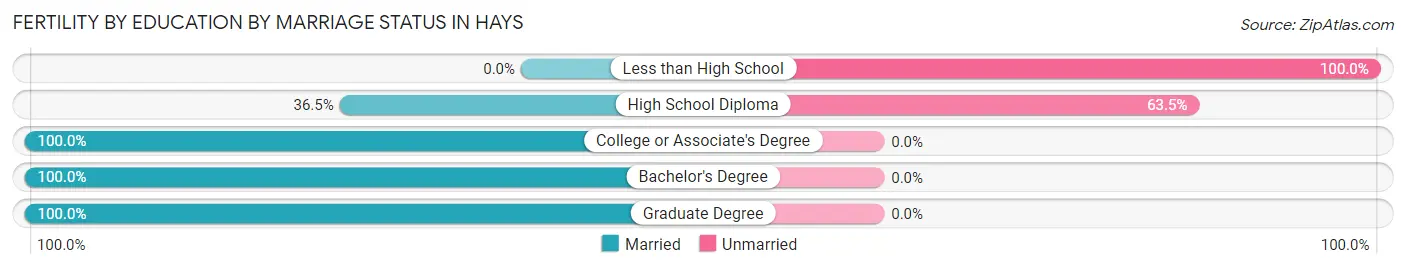
| Educational Attainment | Married | Unmarried |
| Less than High School | 0 (0.0%) | 11 (100.0%) |
| High School Diploma | 38 (36.5%) | 66 (63.5%) |
| College or Associate's Degree | 39 (100.0%) | 0 (0.0%) |
| Bachelor's Degree | 68 (100.0%) | 0 (0.0%) |
| Graduate Degree | 46 (100.0%) | 0 (0.0%) |
| Total | 191 (71.3%) | 77 (28.7%) |
Employment Characteristics in Hays
Employment by Class of Employer in Hays
Among the 12,004 employed individuals in Hays, private company employees (6,796 | 56.6%), state government employees (1,540 | 12.8%), and not-for-profit organizations (1,512 | 12.6%) make up the most common classes of employment.
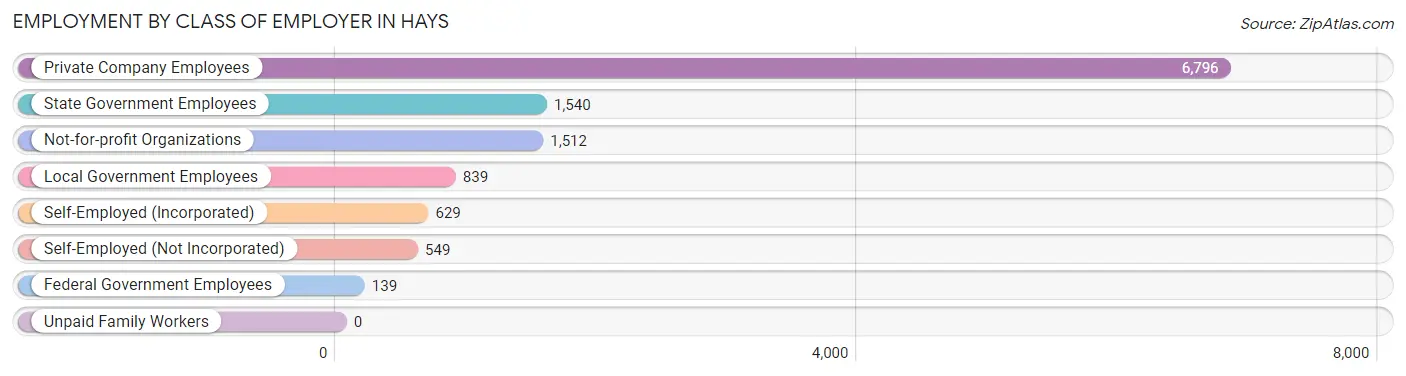
| Employer Class | # Employees | % Employees |
| Private Company Employees | 6,796 | 56.6% |
| Self-Employed (Incorporated) | 629 | 5.2% |
| Self-Employed (Not Incorporated) | 549 | 4.6% |
| Not-for-profit Organizations | 1,512 | 12.6% |
| Local Government Employees | 839 | 7.0% |
| State Government Employees | 1,540 | 12.8% |
| Federal Government Employees | 139 | 1.2% |
| Unpaid Family Workers | 0 | 0.0% |
| Total | 12,004 | 100.0% |
Employment Status by Age in Hays
According to the labor force statistics for Hays, out of the total population over 16 years of age (17,339), 73.2% or 12,692 individuals are in the labor force, with 3.5% or 444 of them unemployed. The age group with the highest labor force participation rate is 25 to 29 years, with 96.8% or 1,438 individuals in the labor force. Within the labor force, the 65 to 74 years age range has the highest percentage of unemployed individuals, with 19.3% or 101 of them being unemployed.
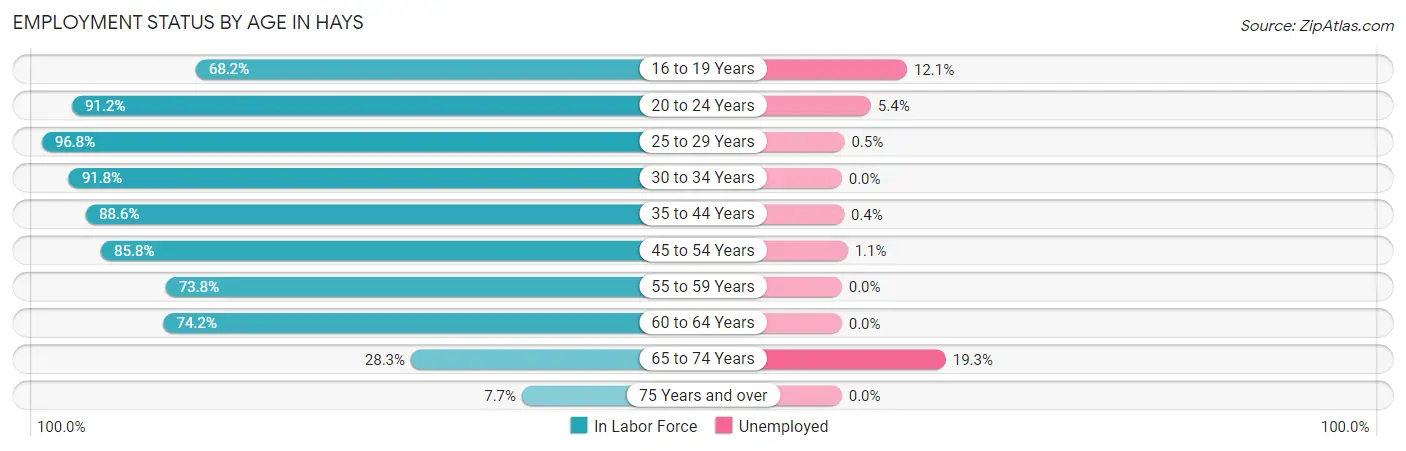
| Age Bracket | In Labor Force | Unemployed |
| 16 to 19 Years | 1,270 (68.2%) | 154 (12.1%) |
| 20 to 24 Years | 2,948 (91.2%) | 159 (5.4%) |
| 25 to 29 Years | 1,438 (96.8%) | 7 (0.5%) |
| 30 to 34 Years | 1,316 (91.8%) | 0 (0.0%) |
| 35 to 44 Years | 2,142 (88.6%) | 9 (0.4%) |
| 45 to 54 Years | 1,518 (85.8%) | 17 (1.1%) |
| 55 to 59 Years | 540 (73.8%) | 0 (0.0%) |
| 60 to 64 Years | 885 (74.2%) | 0 (0.0%) |
| 65 to 74 Years | 521 (28.3%) | 101 (19.3%) |
| 75 Years and over | 105 (7.7%) | 0 (0.0%) |
| Total | 12,692 (73.2%) | 444 (3.5%) |
Employment Status by Educational Attainment in Hays
According to labor force statistics for Hays, 86.8% of individuals (7,840) out of the total population between 25 and 64 years of age (9,032) are in the labor force, with 0.4% or 31 of them being unemployed. The group with the highest labor force participation rate are those with the educational attainment of bachelor's degree or higher, with 95.2% or 3,952 individuals in the labor force. Within the labor force, individuals with high school diploma education have the highest percentage of unemployment, with 0.7% or 10 of them being unemployed.
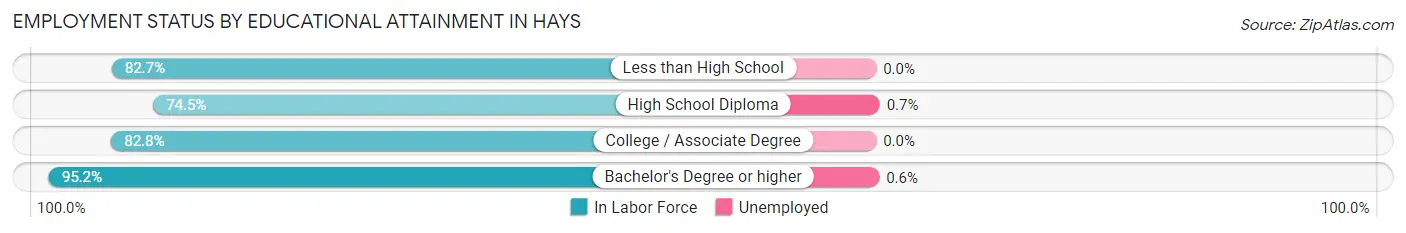
| Educational Attainment | In Labor Force | Unemployed |
| Less than High School | 311 (82.7%) | 0 (0.0%) |
| High School Diploma | 1,379 (74.5%) | 13 (0.7%) |
| College / Associate Degree | 2,198 (82.8%) | 0 (0.0%) |
| Bachelor's Degree or higher | 3,952 (95.2%) | 25 (0.6%) |
| Total | 7,840 (86.8%) | 36 (0.4%) |
Employment Occupations by Sex in Hays
Management, Business, Science and Arts Occupations
The most common Management, Business, Science and Arts occupations in Hays are Community & Social Service (2,168 | 17.7%), Education Instruction & Library (1,441 | 11.8%), Management (1,243 | 10.2%), Health Diagnosing & Treating (709 | 5.8%), and Business & Financial (512 | 4.2%).
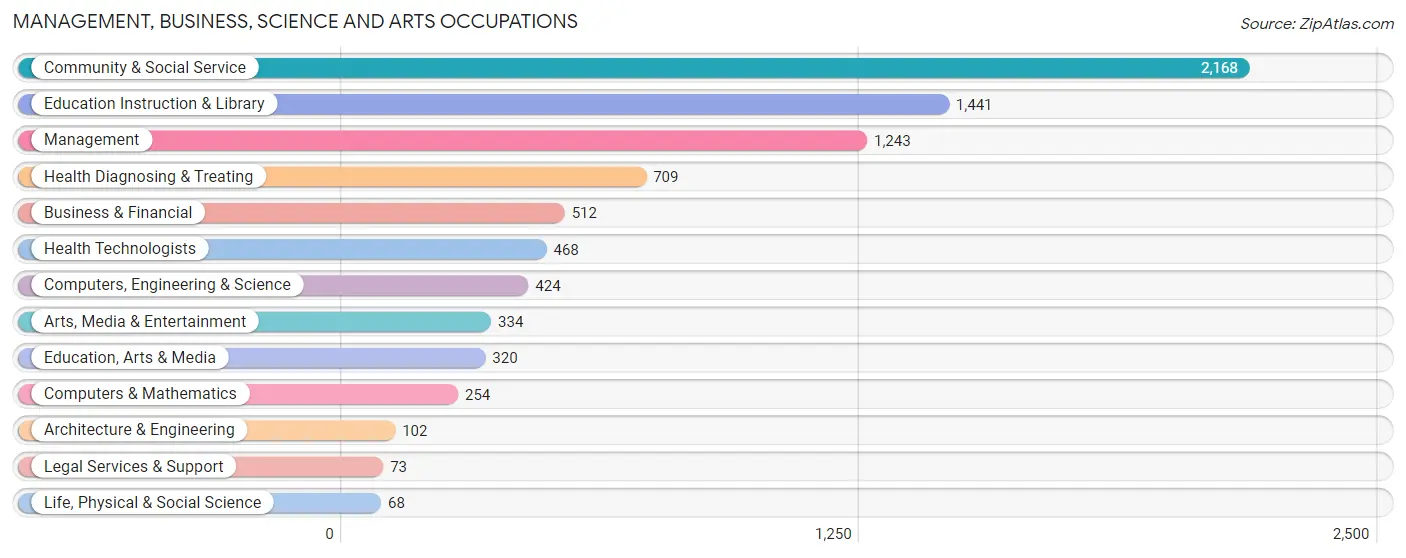
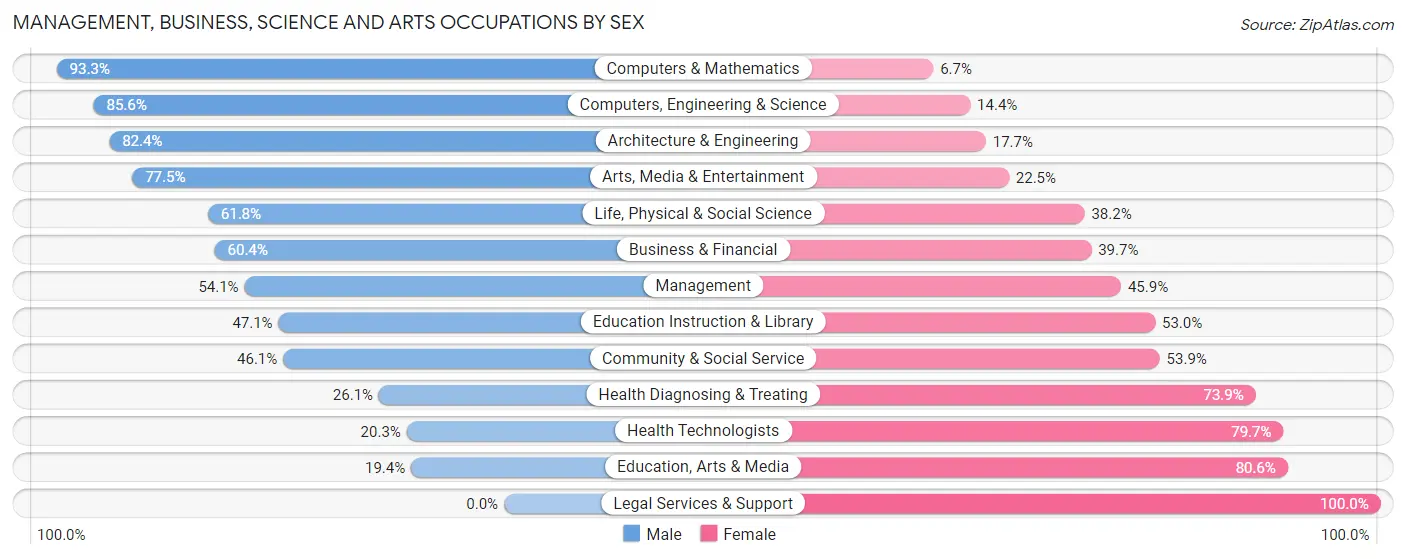
Management, Business, Science and Arts Occupations by Sex
Within the Management, Business, Science and Arts occupations in Hays, the most male-oriented occupations are Computers & Mathematics (93.3%), Computers, Engineering & Science (85.6%), and Architecture & Engineering (82.4%), while the most female-oriented occupations are Legal Services & Support (100.0%), Education, Arts & Media (80.6%), and Health Technologists (79.7%).
| Occupation | Male | Female |
| Management | 673 (54.1%) | 570 (45.9%) |
| Business & Financial | 309 (60.4%) | 203 (39.7%) |
| Computers, Engineering & Science | 363 (85.6%) | 61 (14.4%) |
| Computers & Mathematics | 237 (93.3%) | 17 (6.7%) |
| Architecture & Engineering | 84 (82.4%) | 18 (17.6%) |
| Life, Physical & Social Science | 42 (61.8%) | 26 (38.2%) |
| Community & Social Service | 999 (46.1%) | 1,169 (53.9%) |
| Education, Arts & Media | 62 (19.4%) | 258 (80.6%) |
| Legal Services & Support | 0 (0.0%) | 73 (100.0%) |
| Education Instruction & Library | 678 (47.0%) | 763 (52.9%) |
| Arts, Media & Entertainment | 259 (77.5%) | 75 (22.5%) |
| Health Diagnosing & Treating | 185 (26.1%) | 524 (73.9%) |
| Health Technologists | 95 (20.3%) | 373 (79.7%) |
| Total (Category) | 2,529 (50.0%) | 2,527 (50.0%) |
| Total (Overall) | 6,688 (54.6%) | 5,551 (45.4%) |
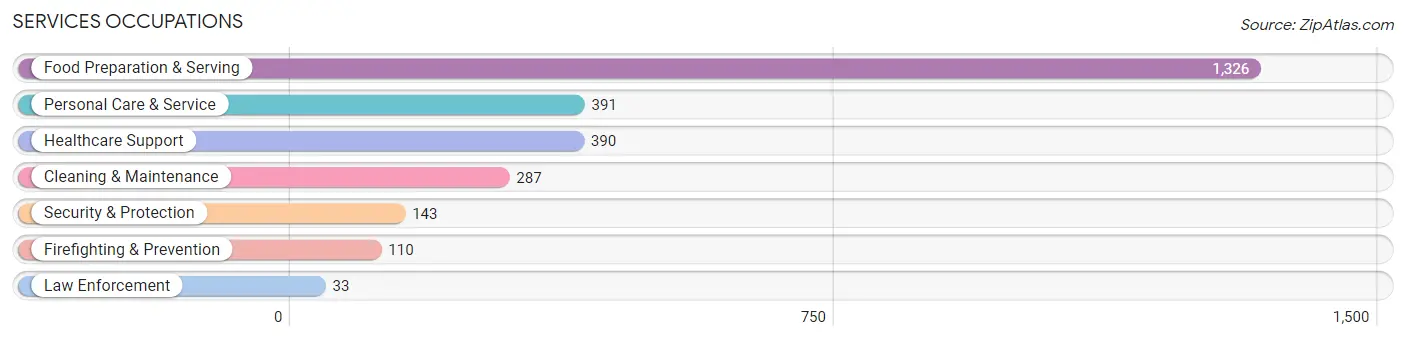
Services Occupations
The most common Services occupations in Hays are Food Preparation & Serving (1,326 | 10.8%), Personal Care & Service (391 | 3.2%), Healthcare Support (390 | 3.2%), Cleaning & Maintenance (287 | 2.3%), and Security & Protection (143 | 1.2%).
Services Occupations by Sex
Within the Services occupations in Hays, the most male-oriented occupations are Law Enforcement (100.0%), Security & Protection (90.9%), and Firefighting & Prevention (88.2%), while the most female-oriented occupations are Personal Care & Service (72.1%), Healthcare Support (68.2%), and Cleaning & Maintenance (65.8%).
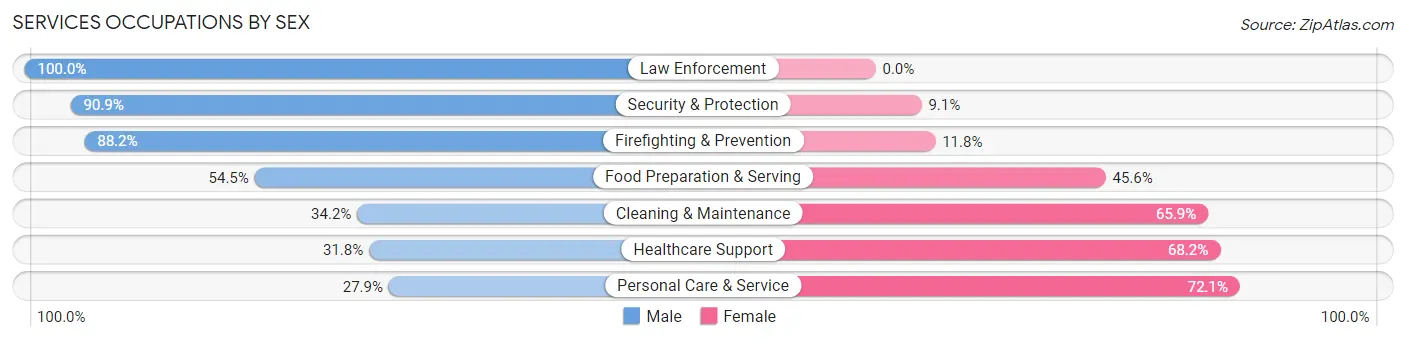
| Occupation | Male | Female |
| Healthcare Support | 124 (31.8%) | 266 (68.2%) |
| Security & Protection | 130 (90.9%) | 13 (9.1%) |
| Firefighting & Prevention | 97 (88.2%) | 13 (11.8%) |
| Law Enforcement | 33 (100.0%) | 0 (0.0%) |
| Food Preparation & Serving | 722 (54.4%) | 604 (45.6%) |
| Cleaning & Maintenance | 98 (34.2%) | 189 (65.8%) |
| Personal Care & Service | 109 (27.9%) | 282 (72.1%) |
| Total (Category) | 1,183 (46.6%) | 1,354 (53.4%) |
| Total (Overall) | 6,688 (54.6%) | 5,551 (45.4%) |
Sales and Office Occupations
The most common Sales and Office occupations in Hays are Office & Administration (1,299 | 10.6%), and Sales & Related (1,262 | 10.3%).

Sales and Office Occupations by Sex
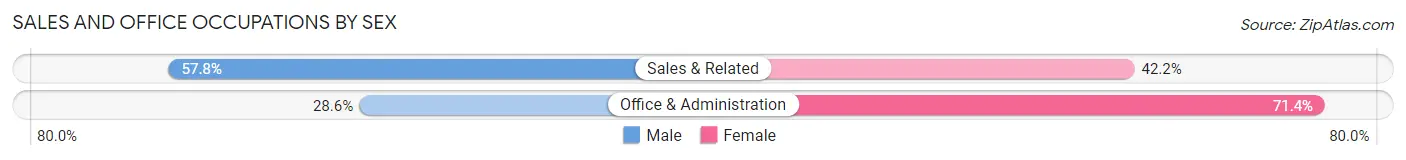
| Occupation | Male | Female |
| Sales & Related | 730 (57.8%) | 532 (42.2%) |
| Office & Administration | 371 (28.6%) | 928 (71.4%) |
| Total (Category) | 1,101 (43.0%) | 1,460 (57.0%) |
| Total (Overall) | 6,688 (54.6%) | 5,551 (45.4%) |
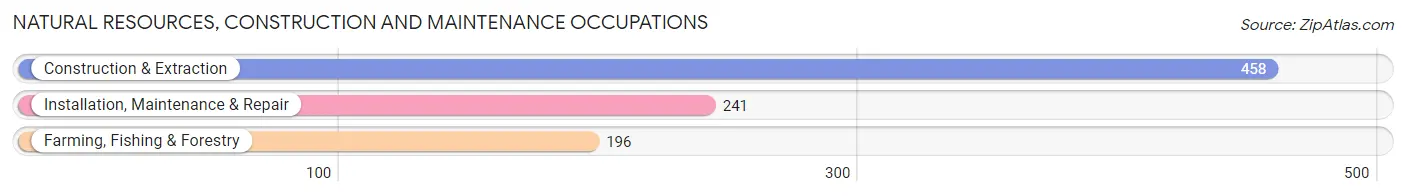
Natural Resources, Construction and Maintenance Occupations
The most common Natural Resources, Construction and Maintenance occupations in Hays are Construction & Extraction (458 | 3.7%), Installation, Maintenance & Repair (241 | 2.0%), and Farming, Fishing & Forestry (196 | 1.6%).
Natural Resources, Construction and Maintenance Occupations by Sex
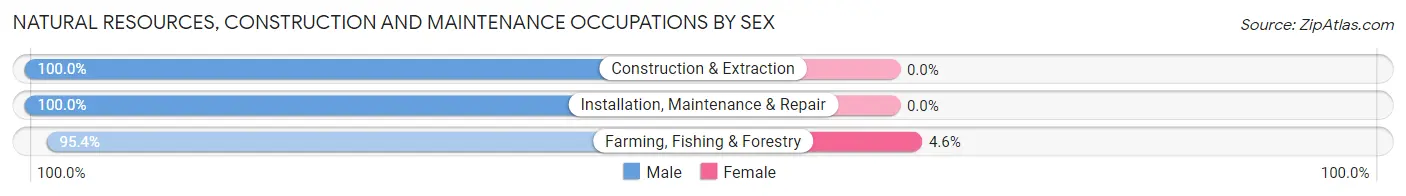
| Occupation | Male | Female |
| Farming, Fishing & Forestry | 187 (95.4%) | 9 (4.6%) |
| Construction & Extraction | 458 (100.0%) | 0 (0.0%) |
| Installation, Maintenance & Repair | 241 (100.0%) | 0 (0.0%) |
| Total (Category) | 886 (99.0%) | 9 (1.0%) |
| Total (Overall) | 6,688 (54.6%) | 5,551 (45.4%) |
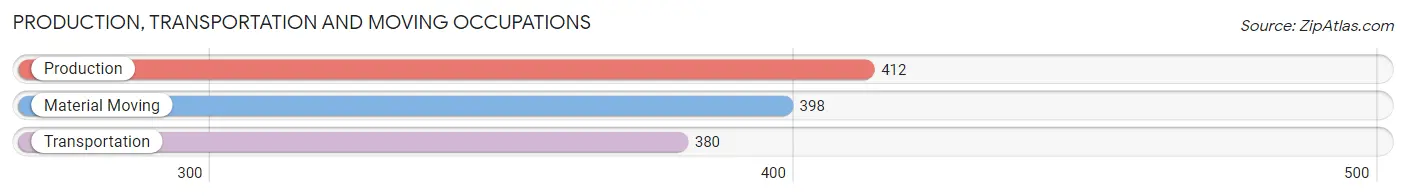
Production, Transportation and Moving Occupations
The most common Production, Transportation and Moving occupations in Hays are Production (412 | 3.4%), Material Moving (398 | 3.3%), and Transportation (380 | 3.1%).
Production, Transportation and Moving Occupations by Sex
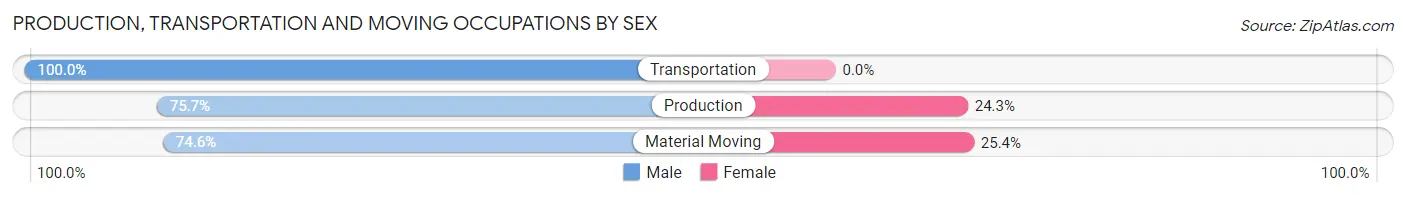
| Occupation | Male | Female |
| Production | 312 (75.7%) | 100 (24.3%) |
| Transportation | 380 (100.0%) | 0 (0.0%) |
| Material Moving | 297 (74.6%) | 101 (25.4%) |
| Total (Category) | 989 (83.1%) | 201 (16.9%) |
| Total (Overall) | 6,688 (54.6%) | 5,551 (45.4%) |
Employment Industries by Sex in Hays
Employment Industries in Hays
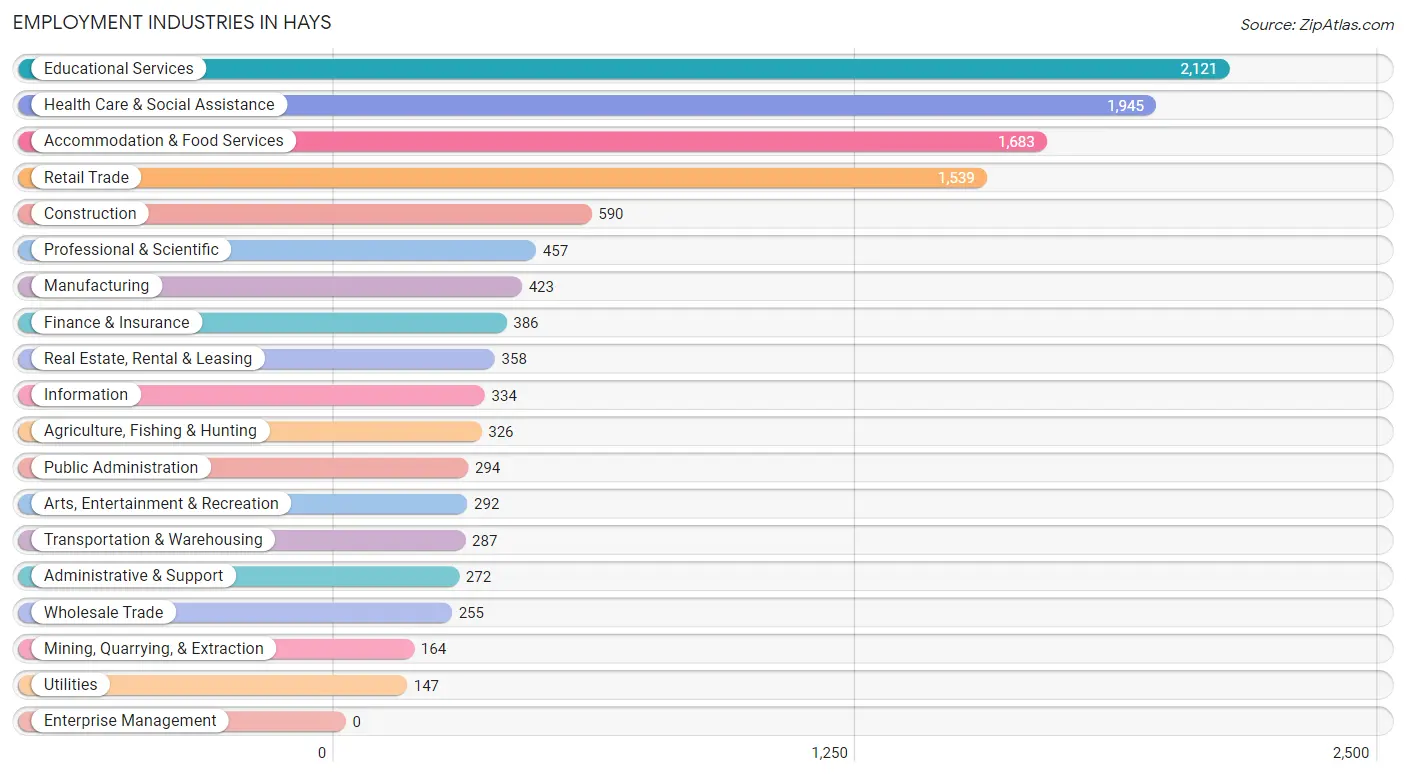
The major employment industries in Hays include Educational Services (2,121 | 17.3%), Health Care & Social Assistance (1,945 | 15.9%), Accommodation & Food Services (1,683 | 13.8%), Retail Trade (1,539 | 12.6%), and Construction (590 | 4.8%).
Employment Industries by Sex in Hays
The Hays industries that see more men than women are Construction (100.0%), Agriculture, Fishing & Hunting (97.2%), and Mining, Quarrying, & Extraction (96.3%), whereas the industries that tend to have a higher number of women are Health Care & Social Assistance (75.5%), Finance & Insurance (60.6%), and Real Estate, Rental & Leasing (58.1%).

| Industry | Male | Female |
| Agriculture, Fishing & Hunting | 317 (97.2%) | 9 (2.8%) |
| Mining, Quarrying, & Extraction | 158 (96.3%) | 6 (3.7%) |
| Construction | 590 (100.0%) | 0 (0.0%) |
| Manufacturing | 322 (76.1%) | 101 (23.9%) |
| Wholesale Trade | 165 (64.7%) | 90 (35.3%) |
| Retail Trade | 999 (64.9%) | 540 (35.1%) |
| Transportation & Warehousing | 255 (88.8%) | 32 (11.2%) |
| Utilities | 93 (63.3%) | 54 (36.7%) |
| Information | 242 (72.5%) | 92 (27.5%) |
| Finance & Insurance | 152 (39.4%) | 234 (60.6%) |
| Real Estate, Rental & Leasing | 150 (41.9%) | 208 (58.1%) |
| Professional & Scientific | 272 (59.5%) | 185 (40.5%) |
| Enterprise Management | 0 (0.0%) | 0 (0.0%) |
| Administrative & Support | 159 (58.5%) | 113 (41.5%) |
| Educational Services | 946 (44.6%) | 1,175 (55.4%) |
| Health Care & Social Assistance | 477 (24.5%) | 1,468 (75.5%) |
| Arts, Entertainment & Recreation | 138 (47.3%) | 154 (52.7%) |
| Accommodation & Food Services | 903 (53.6%) | 780 (46.4%) |
| Public Administration | 168 (57.1%) | 126 (42.9%) |
| Total | 6,688 (54.6%) | 5,551 (45.4%) |
Education in Hays
School Enrollment in Hays
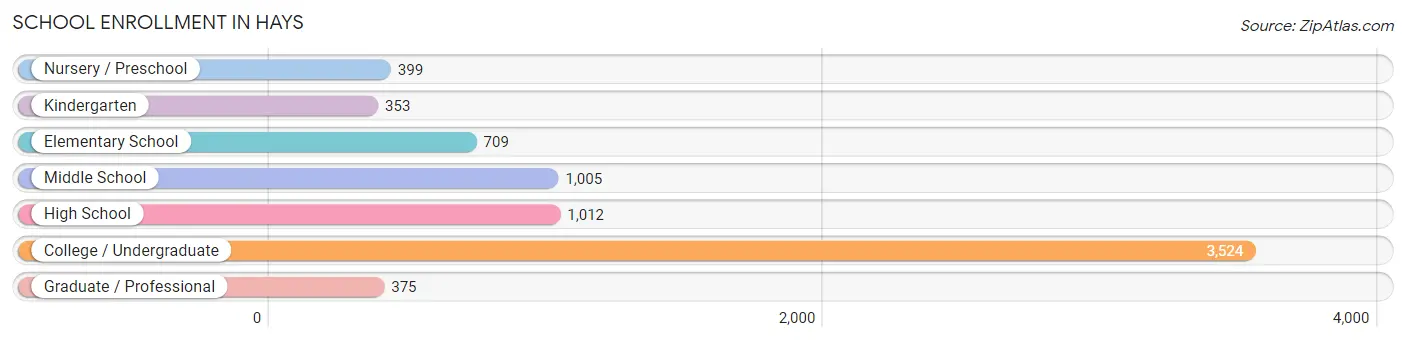
The most common levels of schooling among the 7,377 students in Hays are college / undergraduate (3,524 | 47.8%), high school (1,012 | 13.7%), and middle school (1,005 | 13.6%).
| School Level | # Students | % Students |
| Nursery / Preschool | 399 | 5.4% |
| Kindergarten | 353 | 4.8% |
| Elementary School | 709 | 9.6% |
| Middle School | 1,005 | 13.6% |
| High School | 1,012 | 13.7% |
| College / Undergraduate | 3,524 | 47.8% |
| Graduate / Professional | 375 | 5.1% |
| Total | 7,377 | 100.0% |
School Enrollment by Age by Funding Source in Hays
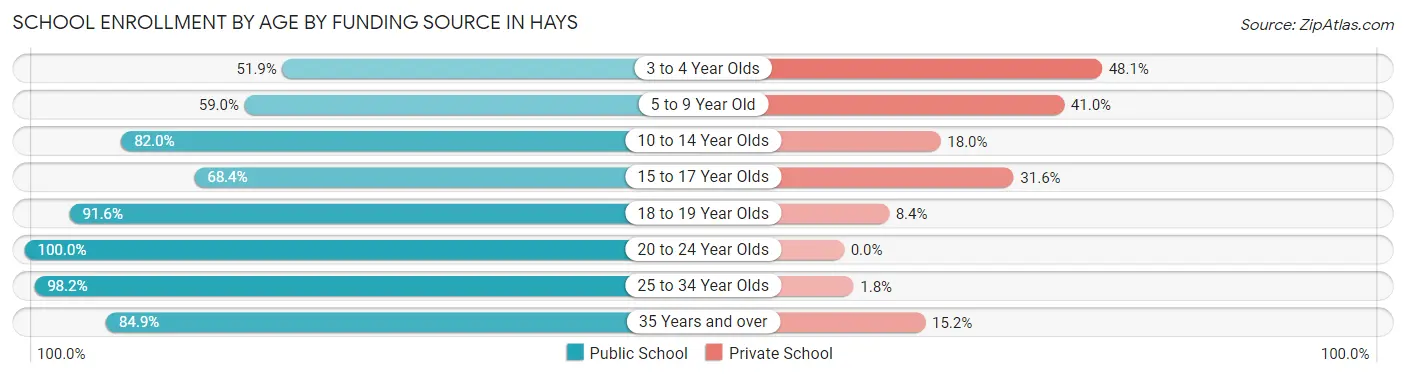
Out of a total of 7,377 students who are enrolled in schools in Hays, 1,136 (15.4%) attend a private institution, while the remaining 6,241 (84.6%) are enrolled in public schools. The age group of 3 to 4 year olds has the highest likelihood of being enrolled in private schools, with 149 (48.1% in the age bracket) enrolled. Conversely, the age group of 20 to 24 year olds has the lowest likelihood of being enrolled in a private school, with 2,211 (100.0% in the age bracket) attending a public institution.
| Age Bracket | Public School | Private School |
| 3 to 4 Year Olds | 161 (51.9%) | 149 (48.1%) |
| 5 to 9 Year Old | 624 (59.0%) | 434 (41.0%) |
| 10 to 14 Year Olds | 1,070 (82.0%) | 235 (18.0%) |
| 15 to 17 Year Olds | 372 (68.4%) | 172 (31.6%) |
| 18 to 19 Year Olds | 1,278 (91.6%) | 117 (8.4%) |
| 20 to 24 Year Olds | 2,211 (100.0%) | 0 (0.0%) |
| 25 to 34 Year Olds | 382 (98.2%) | 7 (1.8%) |
| 35 Years and over | 140 (84.9%) | 25 (15.1%) |
| Total | 6,241 (84.6%) | 1,136 (15.4%) |
Educational Attainment by Field of Study in Hays
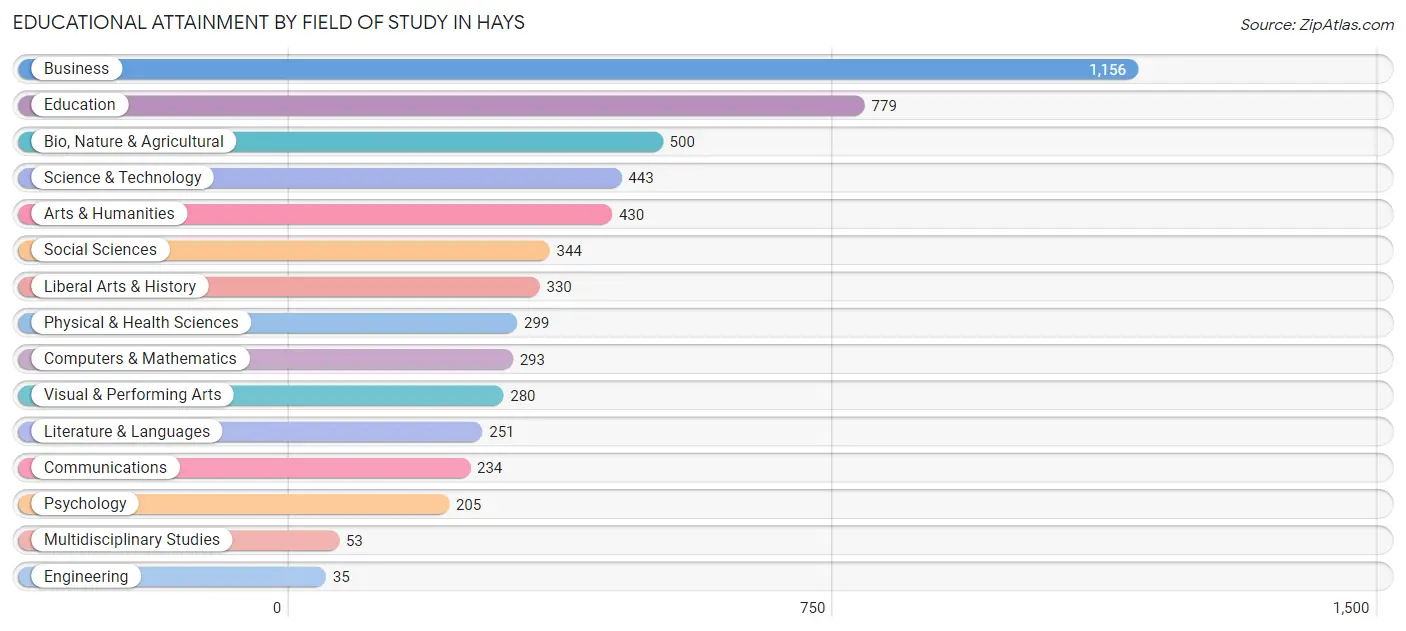
Business (1,156 | 20.5%), education (779 | 13.8%), bio, nature & agricultural (500 | 8.9%), science & technology (443 | 7.9%), and arts & humanities (430 | 7.6%) are the most common fields of study among 5,632 individuals in Hays who have obtained a bachelor's degree or higher.
| Field of Study | # Graduates | % Graduates |
| Computers & Mathematics | 293 | 5.2% |
| Bio, Nature & Agricultural | 500 | 8.9% |
| Physical & Health Sciences | 299 | 5.3% |
| Psychology | 205 | 3.6% |
| Social Sciences | 344 | 6.1% |
| Engineering | 35 | 0.6% |
| Multidisciplinary Studies | 53 | 0.9% |
| Science & Technology | 443 | 7.9% |
| Business | 1,156 | 20.5% |
| Education | 779 | 13.8% |
| Literature & Languages | 251 | 4.5% |
| Liberal Arts & History | 330 | 5.9% |
| Visual & Performing Arts | 280 | 5.0% |
| Communications | 234 | 4.2% |
| Arts & Humanities | 430 | 7.6% |
| Total | 5,632 | 100.0% |
Transportation & Commute in Hays
Vehicle Availability by Sex in Hays
The most prevalent vehicle ownership categories in Hays are males with 2 vehicles (2,555, accounting for 40.7%) and females with 2 vehicles (2,235, making up 50.5%).
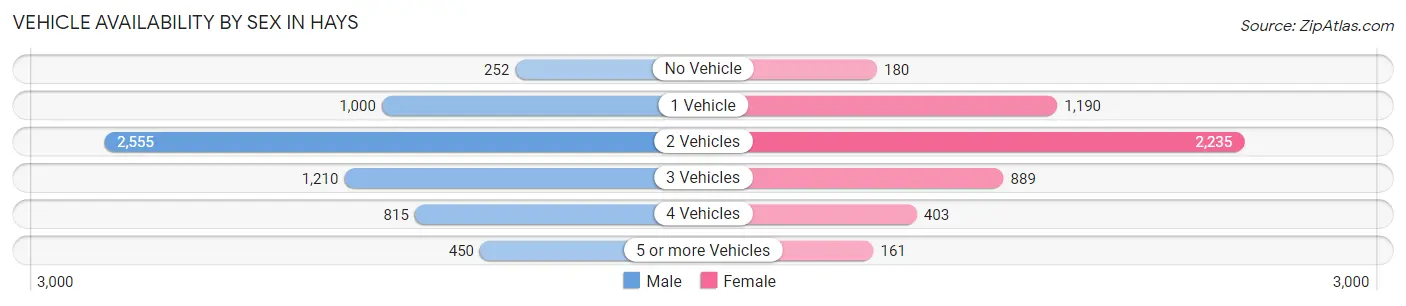
| Vehicles Available | Male | Female |
| No Vehicle | 252 (4.0%) | 180 (3.6%) |
| 1 Vehicle | 1,000 (15.9%) | 1,190 (23.5%) |
| 2 Vehicles | 2,555 (40.7%) | 2,235 (44.2%) |
| 3 Vehicles | 1,210 (19.3%) | 889 (17.6%) |
| 4 Vehicles | 815 (13.0%) | 403 (8.0%) |
| 5 or more Vehicles | 450 (7.2%) | 161 (3.2%) |
| Total | 6,282 (100.0%) | 5,058 (100.0%) |
Commute Time in Hays
The most frequently occuring commute durations in Hays are 5 to 9 minutes (5,462 commuters, 47.8%), 10 to 14 minutes (2,506 commuters, 21.9%), and less than 5 minutes (1,326 commuters, 11.6%).
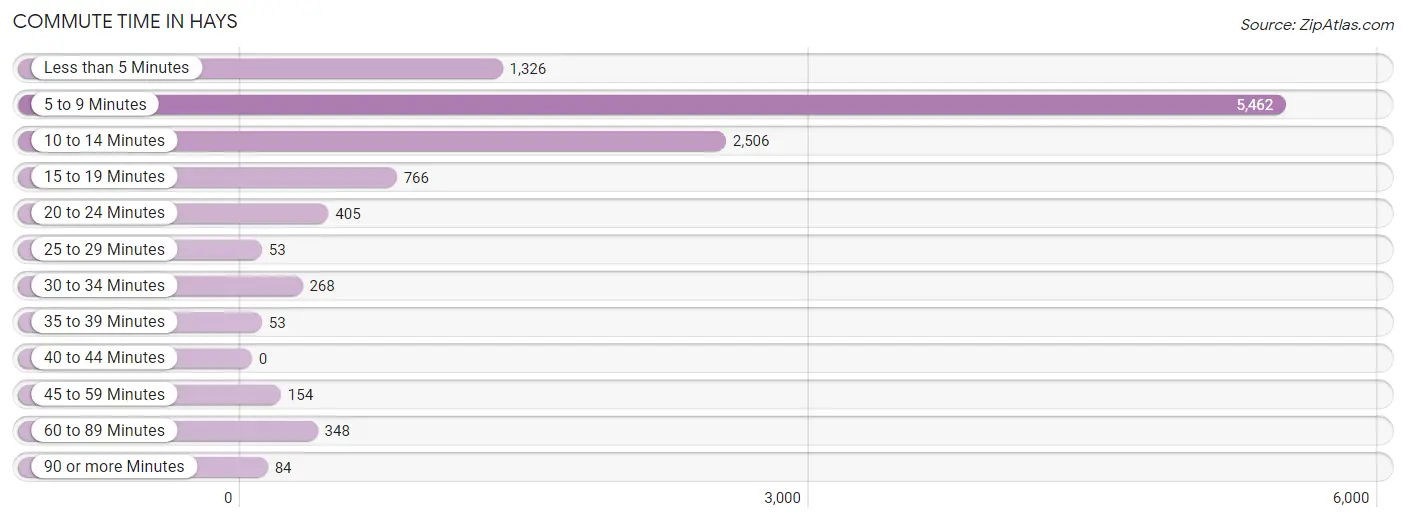
| Commute Time | # Commuters | % Commuters |
| Less than 5 Minutes | 1,326 | 11.6% |
| 5 to 9 Minutes | 5,462 | 47.8% |
| 10 to 14 Minutes | 2,506 | 21.9% |
| 15 to 19 Minutes | 766 | 6.7% |
| 20 to 24 Minutes | 405 | 3.5% |
| 25 to 29 Minutes | 53 | 0.5% |
| 30 to 34 Minutes | 268 | 2.4% |
| 35 to 39 Minutes | 53 | 0.5% |
| 40 to 44 Minutes | 0 | 0.0% |
| 45 to 59 Minutes | 154 | 1.3% |
| 60 to 89 Minutes | 348 | 3.0% |
| 90 or more Minutes | 84 | 0.7% |
Commute Time by Sex in Hays
The most common commute times in Hays are 5 to 9 minutes (2,770 commuters, 44.2%) for males and 5 to 9 minutes (2,692 commuters, 52.1%) for females.
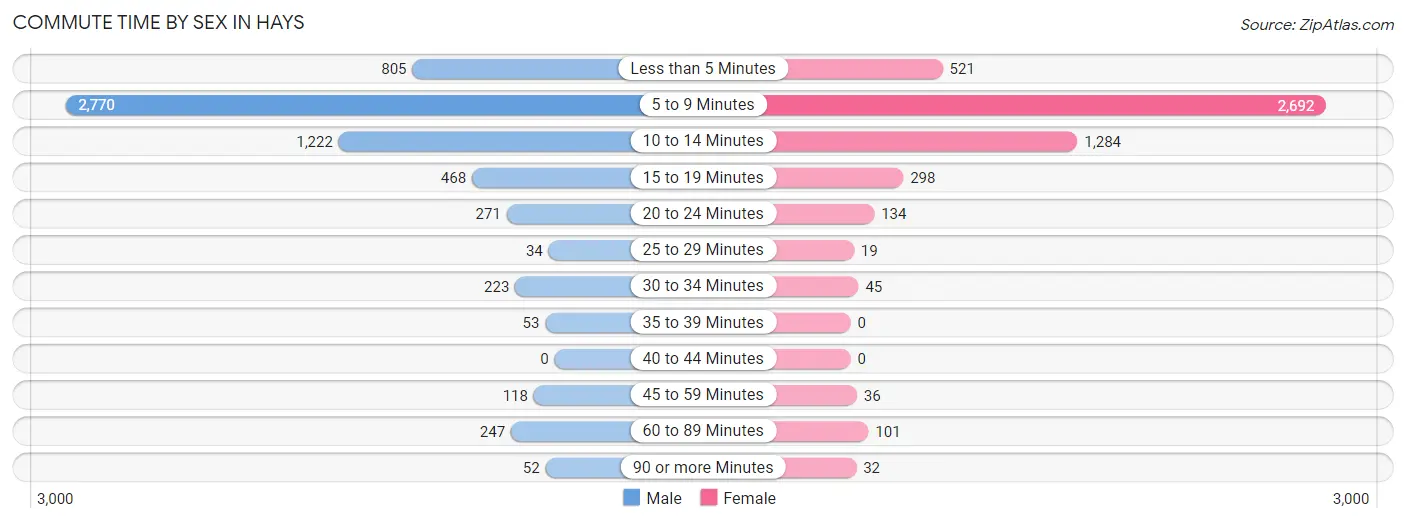
| Commute Time | Male | Female |
| Less than 5 Minutes | 805 (12.9%) | 521 (10.1%) |
| 5 to 9 Minutes | 2,770 (44.2%) | 2,692 (52.1%) |
| 10 to 14 Minutes | 1,222 (19.5%) | 1,284 (24.9%) |
| 15 to 19 Minutes | 468 (7.5%) | 298 (5.8%) |
| 20 to 24 Minutes | 271 (4.3%) | 134 (2.6%) |
| 25 to 29 Minutes | 34 (0.5%) | 19 (0.4%) |
| 30 to 34 Minutes | 223 (3.6%) | 45 (0.9%) |
| 35 to 39 Minutes | 53 (0.9%) | 0 (0.0%) |
| 40 to 44 Minutes | 0 (0.0%) | 0 (0.0%) |
| 45 to 59 Minutes | 118 (1.9%) | 36 (0.7%) |
| 60 to 89 Minutes | 247 (3.9%) | 101 (2.0%) |
| 90 or more Minutes | 52 (0.8%) | 32 (0.6%) |
Time of Departure to Work by Sex in Hays
The most frequent times of departure to work in Hays are 7:30 AM to 7:59 AM (1,252, 20.0%) for males and 7:30 AM to 7:59 AM (1,543, 29.9%) for females.
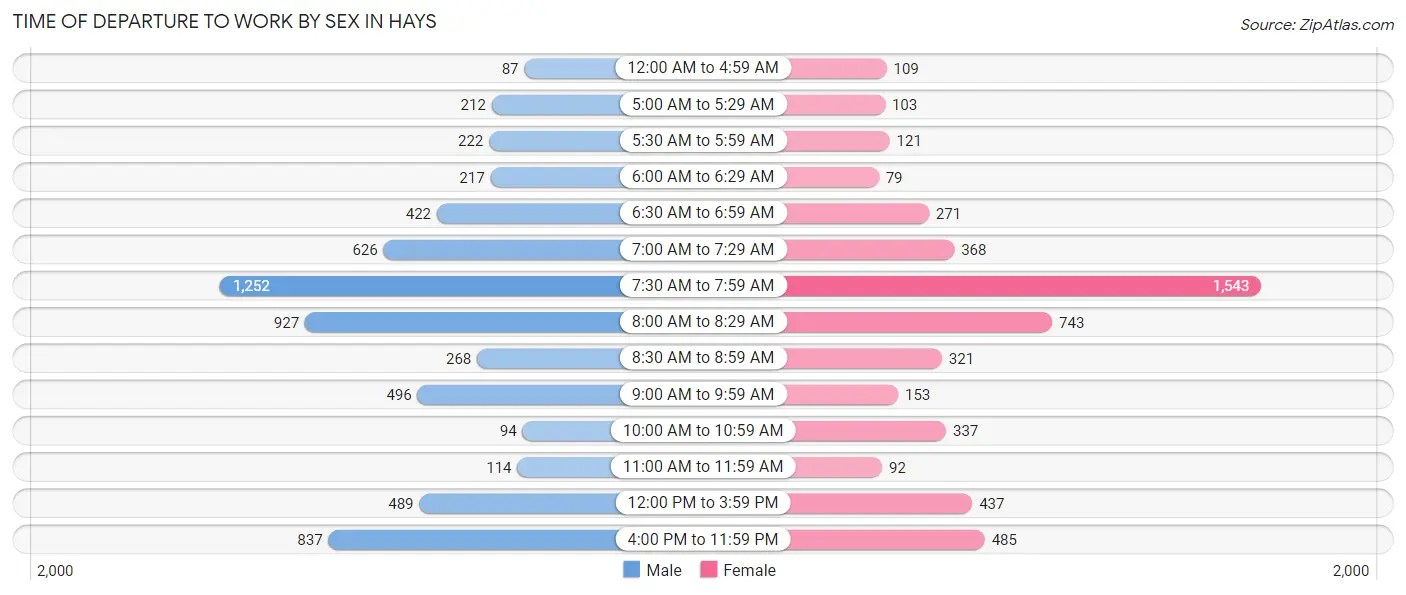
| Time of Departure | Male | Female |
| 12:00 AM to 4:59 AM | 87 (1.4%) | 109 (2.1%) |
| 5:00 AM to 5:29 AM | 212 (3.4%) | 103 (2.0%) |
| 5:30 AM to 5:59 AM | 222 (3.5%) | 121 (2.3%) |
| 6:00 AM to 6:29 AM | 217 (3.5%) | 79 (1.5%) |
| 6:30 AM to 6:59 AM | 422 (6.7%) | 271 (5.2%) |
| 7:00 AM to 7:29 AM | 626 (10.0%) | 368 (7.1%) |
| 7:30 AM to 7:59 AM | 1,252 (20.0%) | 1,543 (29.9%) |
| 8:00 AM to 8:29 AM | 927 (14.8%) | 743 (14.4%) |
| 8:30 AM to 8:59 AM | 268 (4.3%) | 321 (6.2%) |
| 9:00 AM to 9:59 AM | 496 (7.9%) | 153 (3.0%) |
| 10:00 AM to 10:59 AM | 94 (1.5%) | 337 (6.5%) |
| 11:00 AM to 11:59 AM | 114 (1.8%) | 92 (1.8%) |
| 12:00 PM to 3:59 PM | 489 (7.8%) | 437 (8.5%) |
| 4:00 PM to 11:59 PM | 837 (13.4%) | 485 (9.4%) |
| Total | 6,263 (100.0%) | 5,162 (100.0%) |
Housing Occupancy in Hays
Occupancy by Ownership in Hays
Of the total 8,739 dwellings in Hays, owner-occupied units account for 4,994 (57.2%), while renter-occupied units make up 3,745 (42.8%).
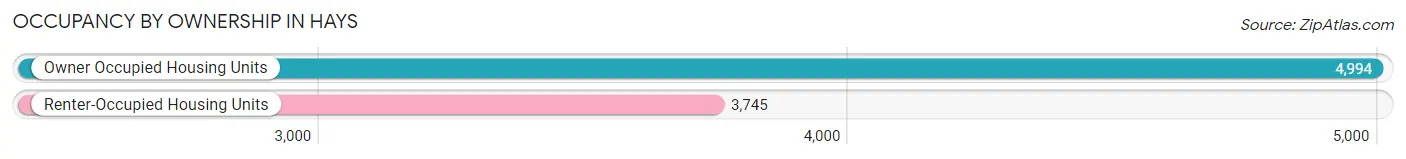
| Occupancy | # Housing Units | % Housing Units |
| Owner Occupied Housing Units | 4,994 | 57.2% |
| Renter-Occupied Housing Units | 3,745 | 42.8% |
| Total Occupied Housing Units | 8,739 | 100.0% |
Occupancy by Household Size in Hays
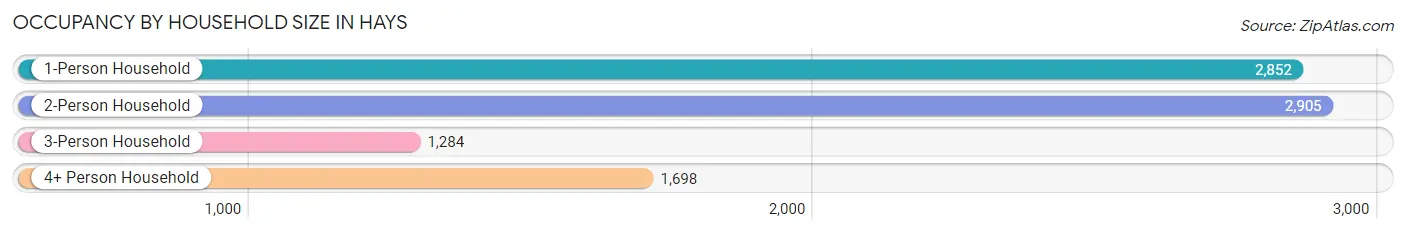
| Household Size | # Housing Units | % Housing Units |
| 1-Person Household | 2,852 | 32.6% |
| 2-Person Household | 2,905 | 33.2% |
| 3-Person Household | 1,284 | 14.7% |
| 4+ Person Household | 1,698 | 19.4% |
| Total Housing Units | 8,739 | 100.0% |
Occupancy by Ownership by Household Size in Hays
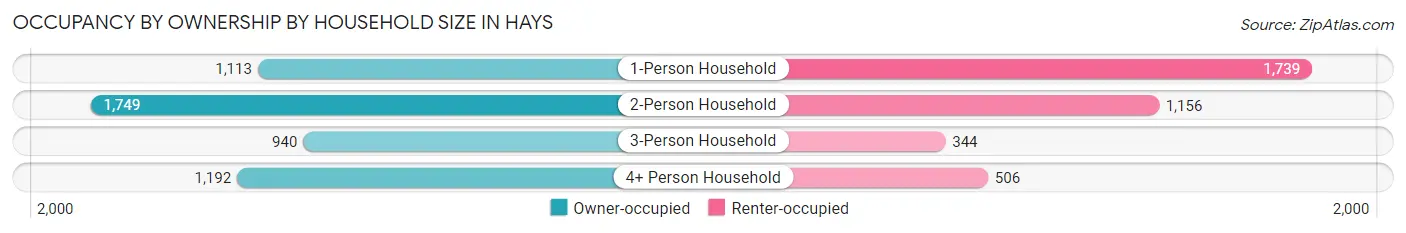
| Household Size | Owner-occupied | Renter-occupied |
| 1-Person Household | 1,113 (39.0%) | 1,739 (61.0%) |
| 2-Person Household | 1,749 (60.2%) | 1,156 (39.8%) |
| 3-Person Household | 940 (73.2%) | 344 (26.8%) |
| 4+ Person Household | 1,192 (70.2%) | 506 (29.8%) |
| Total Housing Units | 4,994 (57.2%) | 3,745 (42.8%) |
Occupancy by Educational Attainment in Hays
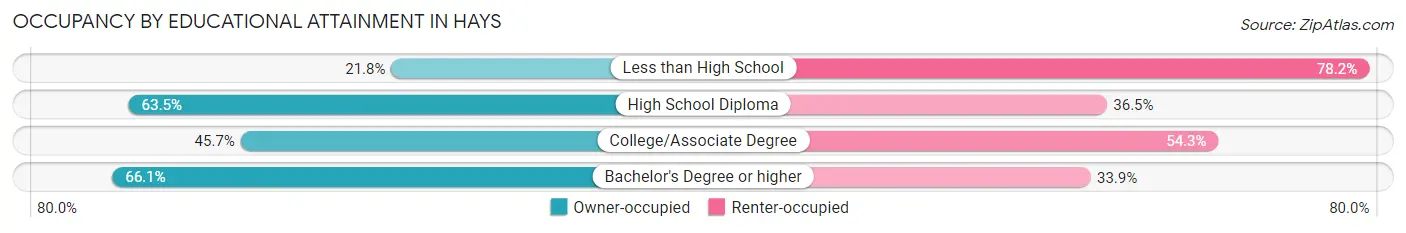
| Household Size | Owner-occupied | Renter-occupied |
| Less than High School | 76 (21.8%) | 272 (78.2%) |
| High School Diploma | 1,061 (63.5%) | 610 (36.5%) |
| College/Associate Degree | 1,311 (45.7%) | 1,556 (54.3%) |
| Bachelor's Degree or higher | 2,546 (66.1%) | 1,307 (33.9%) |
Occupancy by Age of Householder in Hays
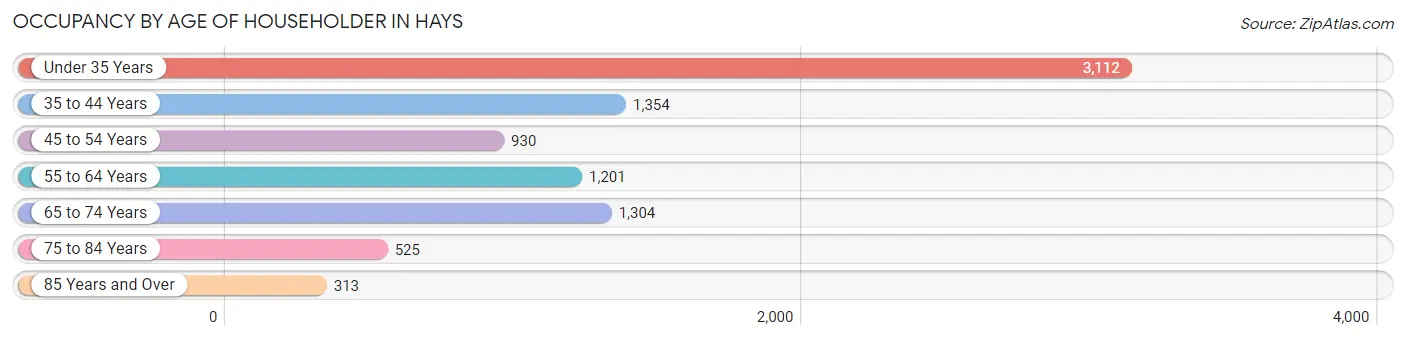
| Age Bracket | # Households | % Households |
| Under 35 Years | 3,112 | 35.6% |
| 35 to 44 Years | 1,354 | 15.5% |
| 45 to 54 Years | 930 | 10.6% |
| 55 to 64 Years | 1,201 | 13.7% |
| 65 to 74 Years | 1,304 | 14.9% |
| 75 to 84 Years | 525 | 6.0% |
| 85 Years and Over | 313 | 3.6% |
| Total | 8,739 | 100.0% |
Housing Finances in Hays
Median Income by Occupancy in Hays
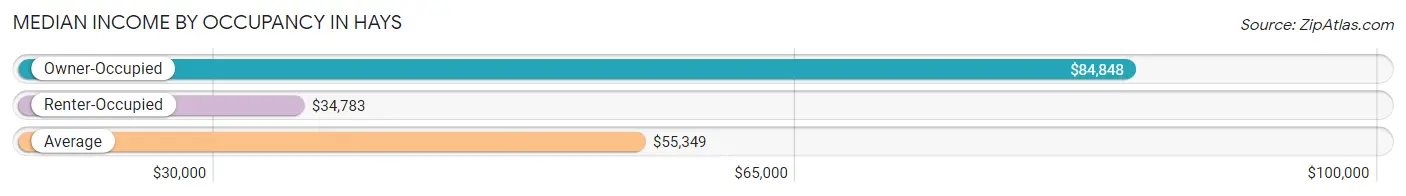
| Occupancy Type | # Households | Median Income |
| Owner-Occupied | 4,994 (57.2%) | $84,848 |
| Renter-Occupied | 3,745 (42.8%) | $34,783 |
| Average | 8,739 (100.0%) | $55,349 |
Occupancy by Householder Income Bracket in Hays
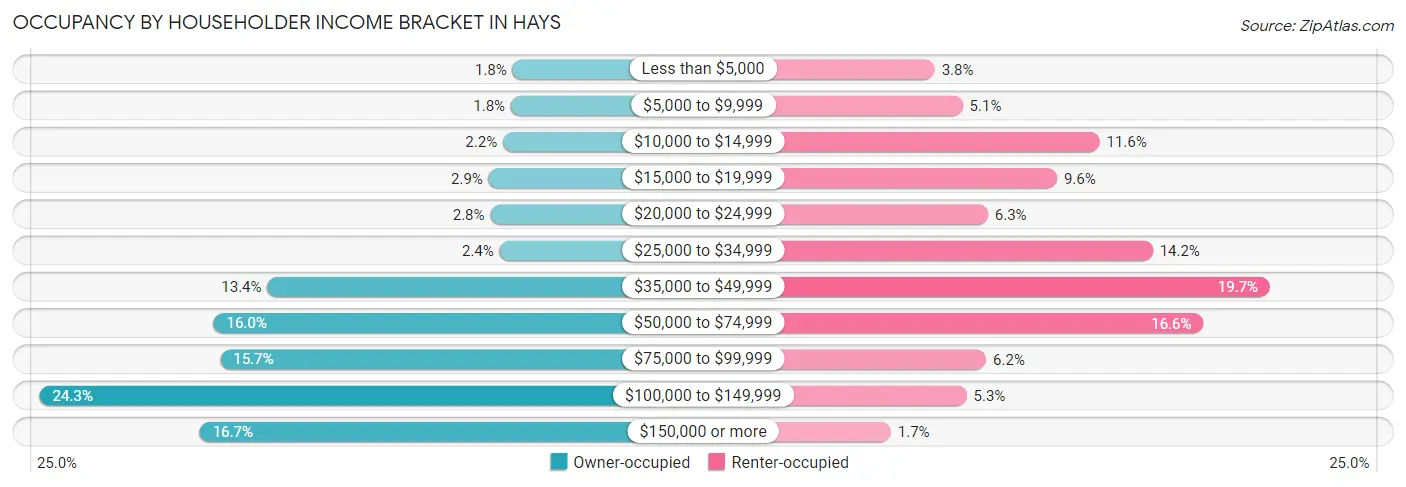
| Income Bracket | Owner-occupied | Renter-occupied |
| Less than $5,000 | 88 (1.8%) | 141 (3.8%) |
| $5,000 to $9,999 | 92 (1.8%) | 191 (5.1%) |
| $10,000 to $14,999 | 111 (2.2%) | 435 (11.6%) |
| $15,000 to $19,999 | 145 (2.9%) | 359 (9.6%) |
| $20,000 to $24,999 | 141 (2.8%) | 236 (6.3%) |
| $25,000 to $34,999 | 119 (2.4%) | 530 (14.1%) |
| $35,000 to $49,999 | 671 (13.4%) | 739 (19.7%) |
| $50,000 to $74,999 | 799 (16.0%) | 620 (16.6%) |
| $75,000 to $99,999 | 783 (15.7%) | 233 (6.2%) |
| $100,000 to $149,999 | 1,213 (24.3%) | 198 (5.3%) |
| $150,000 or more | 832 (16.7%) | 63 (1.7%) |
| Total | 4,994 (100.0%) | 3,745 (100.0%) |
Monthly Housing Cost Tiers in Hays
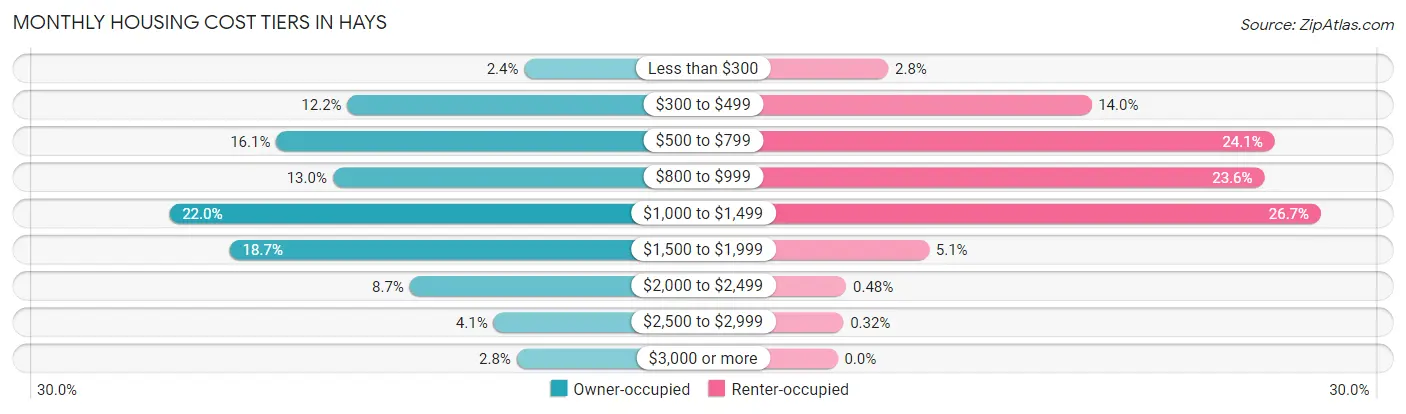
| Monthly Cost | Owner-occupied | Renter-occupied |
| Less than $300 | 120 (2.4%) | 105 (2.8%) |
| $300 to $499 | 608 (12.2%) | 525 (14.0%) |
| $500 to $799 | 804 (16.1%) | 904 (24.1%) |
| $800 to $999 | 648 (13.0%) | 883 (23.6%) |
| $1,000 to $1,499 | 1,099 (22.0%) | 1,000 (26.7%) |
| $1,500 to $1,999 | 933 (18.7%) | 189 (5.1%) |
| $2,000 to $2,499 | 436 (8.7%) | 18 (0.5%) |
| $2,500 to $2,999 | 205 (4.1%) | 12 (0.3%) |
| $3,000 or more | 141 (2.8%) | 0 (0.0%) |
| Total | 4,994 (100.0%) | 3,745 (100.0%) |
Physical Housing Characteristics in Hays
Housing Structures in Hays
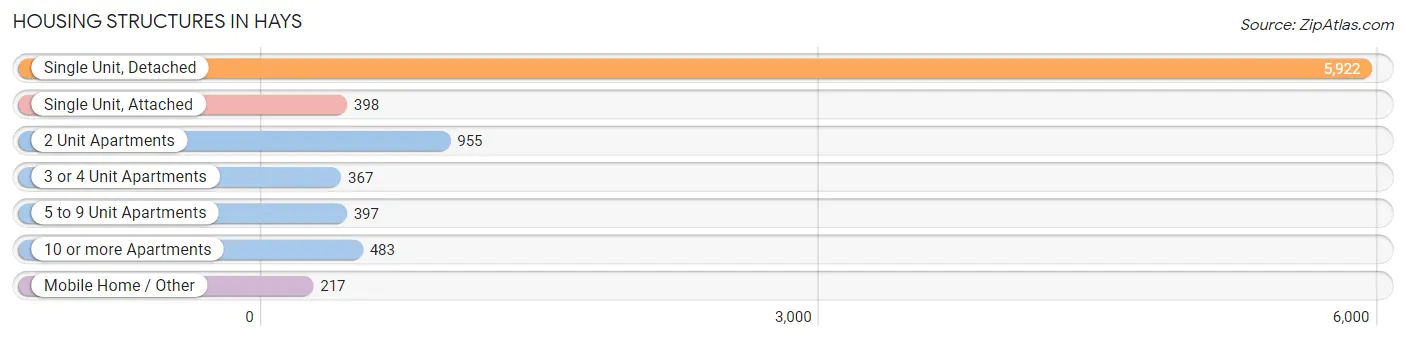
| Structure Type | # Housing Units | % Housing Units |
| Single Unit, Detached | 5,922 | 67.8% |
| Single Unit, Attached | 398 | 4.5% |
| 2 Unit Apartments | 955 | 10.9% |
| 3 or 4 Unit Apartments | 367 | 4.2% |
| 5 to 9 Unit Apartments | 397 | 4.5% |
| 10 or more Apartments | 483 | 5.5% |
| Mobile Home / Other | 217 | 2.5% |
| Total | 8,739 | 100.0% |
Housing Structures by Occupancy in Hays
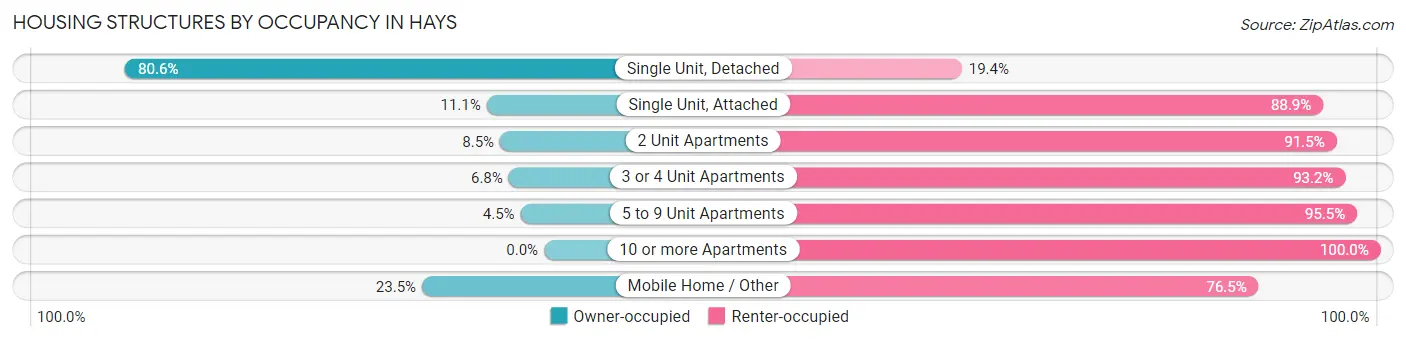
| Structure Type | Owner-occupied | Renter-occupied |
| Single Unit, Detached | 4,775 (80.6%) | 1,147 (19.4%) |
| Single Unit, Attached | 44 (11.1%) | 354 (88.9%) |
| 2 Unit Apartments | 81 (8.5%) | 874 (91.5%) |
| 3 or 4 Unit Apartments | 25 (6.8%) | 342 (93.2%) |
| 5 to 9 Unit Apartments | 18 (4.5%) | 379 (95.5%) |
| 10 or more Apartments | 0 (0.0%) | 483 (100.0%) |
| Mobile Home / Other | 51 (23.5%) | 166 (76.5%) |
| Total | 4,994 (57.2%) | 3,745 (42.8%) |
Housing Structures by Number of Rooms in Hays
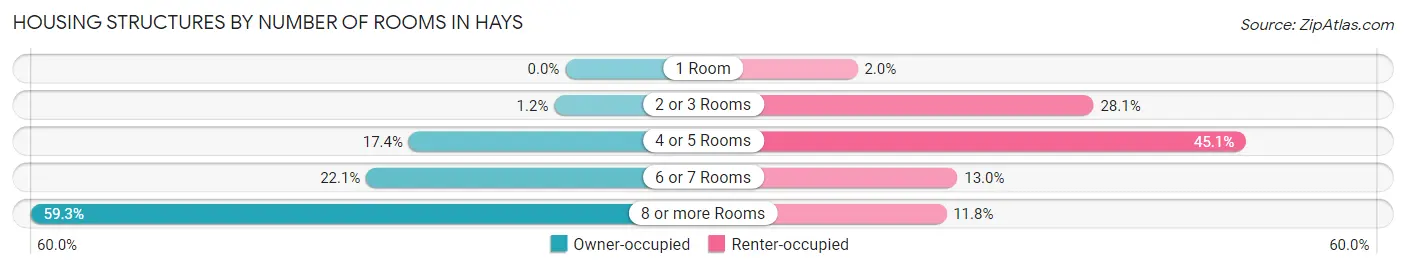
| Number of Rooms | Owner-occupied | Renter-occupied |
| 1 Room | 0 (0.0%) | 73 (1.9%) |
| 2 or 3 Rooms | 61 (1.2%) | 1,054 (28.1%) |
| 4 or 5 Rooms | 867 (17.4%) | 1,688 (45.1%) |
| 6 or 7 Rooms | 1,103 (22.1%) | 488 (13.0%) |
| 8 or more Rooms | 2,963 (59.3%) | 442 (11.8%) |
| Total | 4,994 (100.0%) | 3,745 (100.0%) |
Housing Structure by Heating Type in Hays
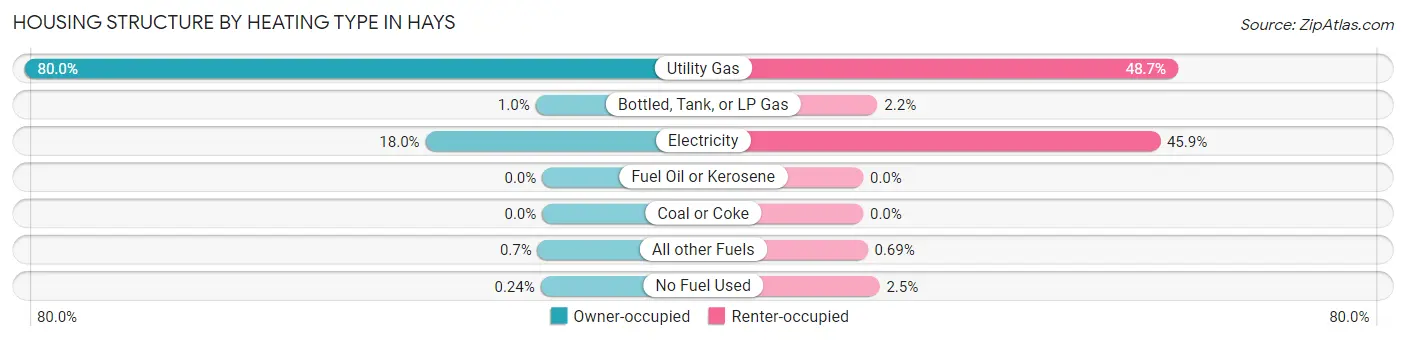
| Heating Type | Owner-occupied | Renter-occupied |
| Utility Gas | 3,995 (80.0%) | 1,822 (48.6%) |
| Bottled, Tank, or LP Gas | 51 (1.0%) | 83 (2.2%) |
| Electricity | 901 (18.0%) | 1,719 (45.9%) |
| Fuel Oil or Kerosene | 0 (0.0%) | 0 (0.0%) |
| Coal or Coke | 0 (0.0%) | 0 (0.0%) |
| All other Fuels | 35 (0.7%) | 26 (0.7%) |
| No Fuel Used | 12 (0.2%) | 95 (2.5%) |
| Total | 4,994 (100.0%) | 3,745 (100.0%) |
Household Vehicle Usage in Hays
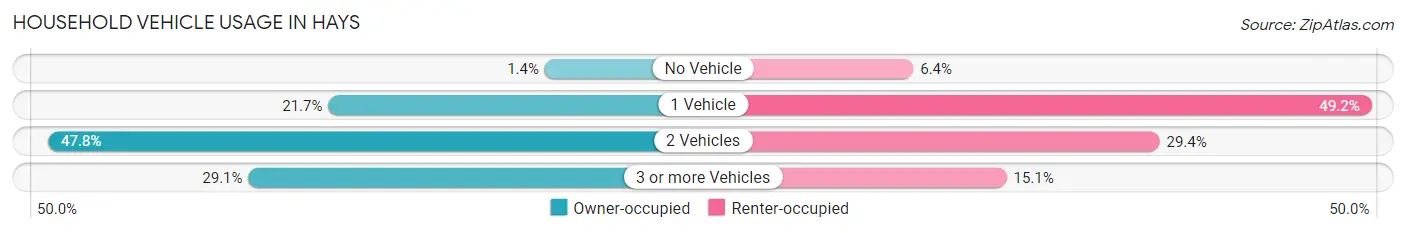
| Vehicles per Household | Owner-occupied | Renter-occupied |
| No Vehicle | 72 (1.4%) | 239 (6.4%) |
| 1 Vehicle | 1,081 (21.6%) | 1,841 (49.2%) |
| 2 Vehicles | 2,387 (47.8%) | 1,100 (29.4%) |
| 3 or more Vehicles | 1,454 (29.1%) | 565 (15.1%) |
| Total | 4,994 (100.0%) | 3,745 (100.0%) |
Real Estate & Mortgages in Hays
Real Estate and Mortgage Overview in Hays
| Characteristic | Without Mortgage | With Mortgage |
| Housing Units | 1,907 | 3,087 |
| Median Property Value | $205,300 | $214,500 |
| Median Household Income | $57,850 | $624 |
| Monthly Housing Costs | $570 | $141 |
| Real Estate Taxes | $2,548 | $78 |
Property Value by Mortgage Status in Hays
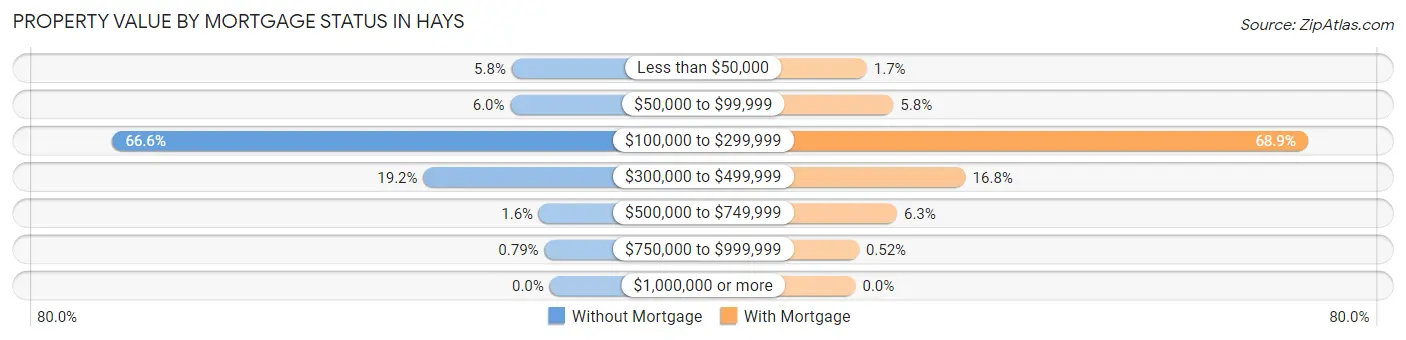
| Property Value | Without Mortgage | With Mortgage |
| Less than $50,000 | 110 (5.8%) | 53 (1.7%) |
| $50,000 to $99,999 | 114 (6.0%) | 178 (5.8%) |
| $100,000 to $299,999 | 1,270 (66.6%) | 2,127 (68.9%) |
| $300,000 to $499,999 | 367 (19.2%) | 518 (16.8%) |
| $500,000 to $749,999 | 31 (1.6%) | 195 (6.3%) |
| $750,000 to $999,999 | 15 (0.8%) | 16 (0.5%) |
| $1,000,000 or more | 0 (0.0%) | 0 (0.0%) |
| Total | 1,907 (100.0%) | 3,087 (100.0%) |
Household Income by Mortgage Status in Hays
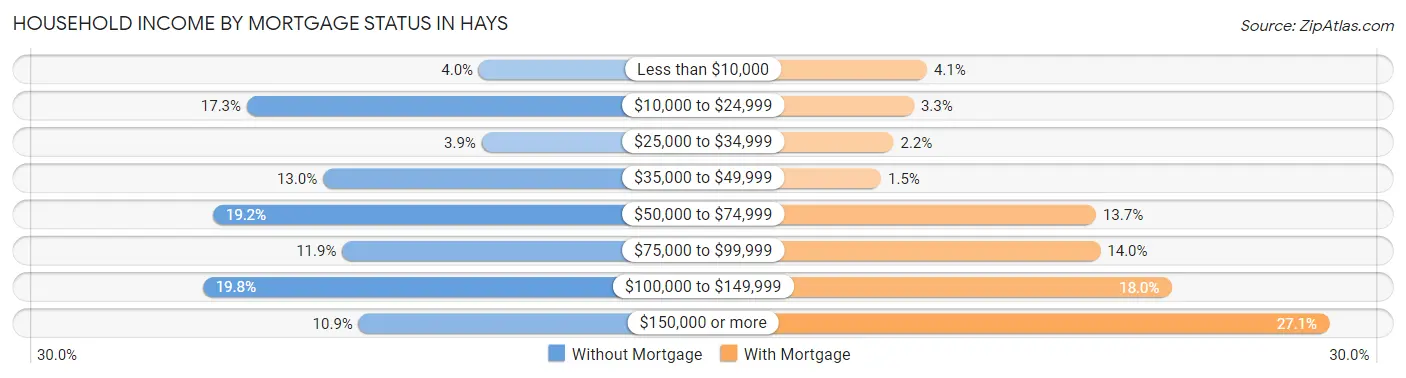
| Household Income | Without Mortgage | With Mortgage |
| Less than $10,000 | 77 (4.0%) | 126 (4.1%) |
| $10,000 to $24,999 | 330 (17.3%) | 103 (3.3%) |
| $25,000 to $34,999 | 74 (3.9%) | 67 (2.2%) |
| $35,000 to $49,999 | 247 (13.0%) | 45 (1.5%) |
| $50,000 to $74,999 | 367 (19.2%) | 424 (13.7%) |
| $75,000 to $99,999 | 226 (11.8%) | 432 (14.0%) |
| $100,000 to $149,999 | 378 (19.8%) | 557 (18.0%) |
| $150,000 or more | 208 (10.9%) | 835 (27.1%) |
| Total | 1,907 (100.0%) | 3,087 (100.0%) |
Property Value to Household Income Ratio in Hays
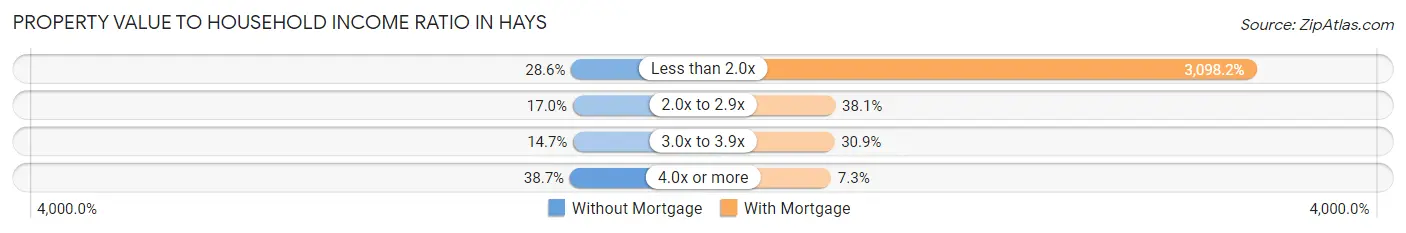
| Value-to-Income Ratio | Without Mortgage | With Mortgage |
| Less than 2.0x | 546 (28.6%) | 95,642 (3,098.2%) |
| 2.0x to 2.9x | 325 (17.0%) | 1,175 (38.1%) |
| 3.0x to 3.9x | 280 (14.7%) | 955 (30.9%) |
| 4.0x or more | 738 (38.7%) | 225 (7.3%) |
| Total | 1,907 (100.0%) | 3,087 (100.0%) |
Real Estate Taxes by Mortgage Status in Hays
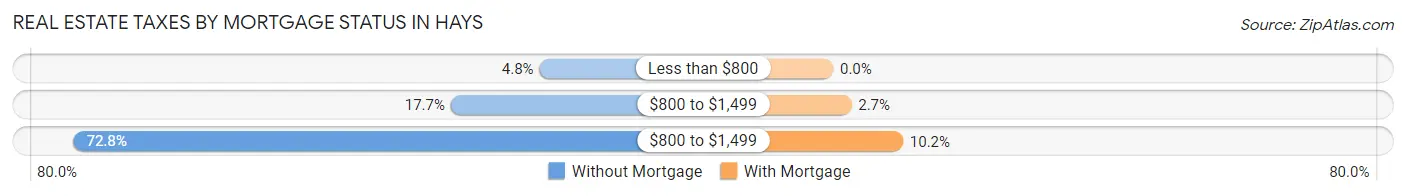
| Property Taxes | Without Mortgage | With Mortgage |
| Less than $800 | 91 (4.8%) | 0 (0.0%) |
| $800 to $1,499 | 338 (17.7%) | 82 (2.7%) |
| $800 to $1,499 | 1,389 (72.8%) | 315 (10.2%) |
| Total | 1,907 (100.0%) | 3,087 (100.0%) |
Health & Disability in Hays
Health Insurance Coverage by Age in Hays
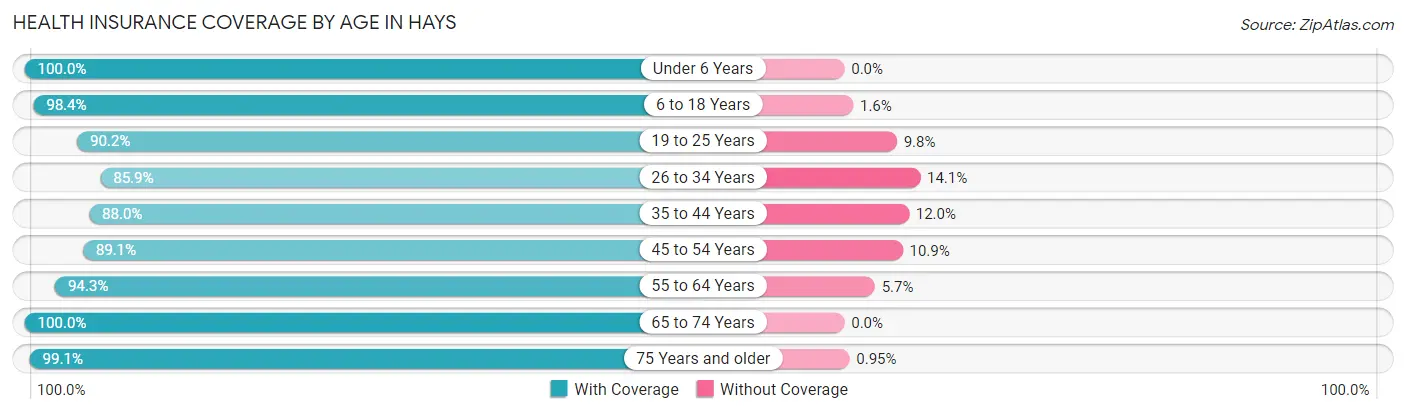
| Age Bracket | With Coverage | Without Coverage |
| Under 6 Years | 1,264 (100.0%) | 0 (0.0%) |
| 6 to 18 Years | 3,322 (98.4%) | 55 (1.6%) |
| 19 to 25 Years | 4,169 (90.2%) | 452 (9.8%) |
| 26 to 34 Years | 2,160 (85.9%) | 355 (14.1%) |
| 35 to 44 Years | 2,120 (88.0%) | 290 (12.0%) |
| 45 to 54 Years | 1,576 (89.1%) | 192 (10.9%) |
| 55 to 64 Years | 1,798 (94.3%) | 108 (5.7%) |
| 65 to 74 Years | 1,836 (100.0%) | 0 (0.0%) |
| 75 Years and older | 1,250 (99.1%) | 12 (0.9%) |
| Total | 19,495 (93.0%) | 1,464 (7.0%) |
Health Insurance Coverage by Citizenship Status in Hays
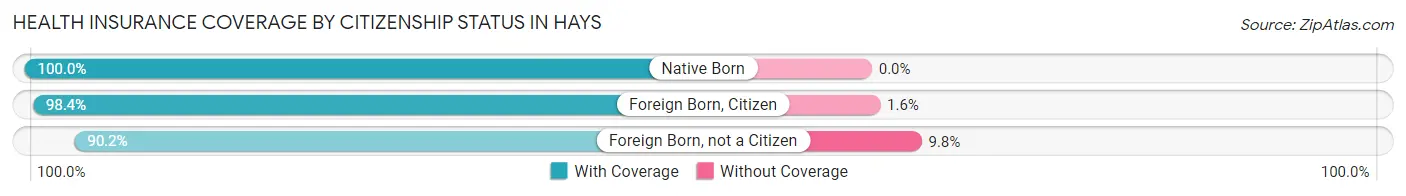
| Citizenship Status | With Coverage | Without Coverage |
| Native Born | 1,264 (100.0%) | 0 (0.0%) |
| Foreign Born, Citizen | 3,322 (98.4%) | 55 (1.6%) |
| Foreign Born, not a Citizen | 4,169 (90.2%) | 452 (9.8%) |
Health Insurance Coverage by Household Income in Hays
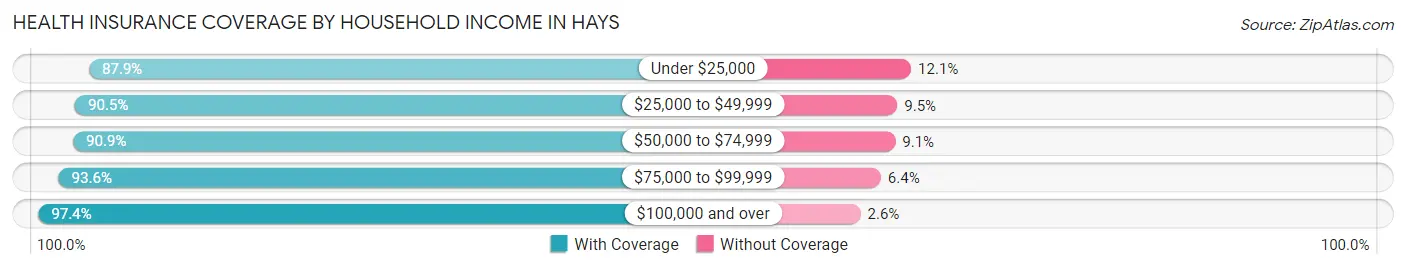
| Household Income | With Coverage | Without Coverage |
| Under $25,000 | 2,429 (87.9%) | 333 (12.1%) |
| $25,000 to $49,999 | 3,489 (90.5%) | 365 (9.5%) |
| $50,000 to $74,999 | 3,258 (90.9%) | 326 (9.1%) |
| $75,000 to $99,999 | 2,650 (93.6%) | 181 (6.4%) |
| $100,000 and over | 6,596 (97.4%) | 175 (2.6%) |
Public vs Private Health Insurance Coverage by Age in Hays
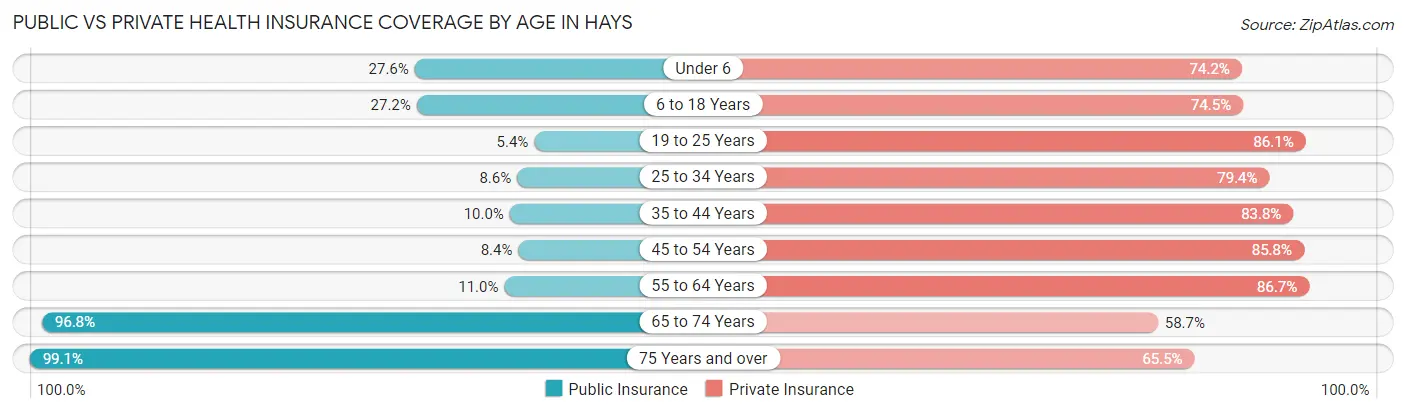
| Age Bracket | Public Insurance | Private Insurance |
| Under 6 | 349 (27.6%) | 938 (74.2%) |
| 6 to 18 Years | 920 (27.2%) | 2,515 (74.5%) |
| 19 to 25 Years | 250 (5.4%) | 3,977 (86.1%) |
| 25 to 34 Years | 216 (8.6%) | 1,996 (79.4%) |
| 35 to 44 Years | 240 (10.0%) | 2,019 (83.8%) |
| 45 to 54 Years | 148 (8.4%) | 1,516 (85.8%) |
| 55 to 64 Years | 209 (11.0%) | 1,653 (86.7%) |
| 65 to 74 Years | 1,777 (96.8%) | 1,077 (58.7%) |
| 75 Years and over | 1,250 (99.1%) | 826 (65.4%) |
| Total | 5,359 (25.6%) | 16,517 (78.8%) |
Disability Status by Sex by Age in Hays
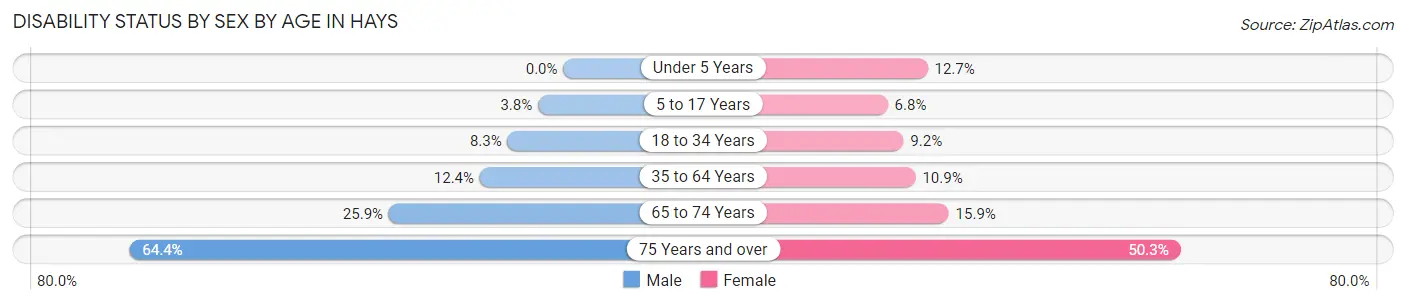
| Age Bracket | Male | Female |
| Under 5 Years | 0 (0.0%) | 77 (12.7%) |
| 5 to 17 Years | 59 (3.7%) | 94 (6.8%) |
| 18 to 34 Years | 342 (8.3%) | 331 (9.1%) |
| 35 to 64 Years | 370 (12.4%) | 339 (10.9%) |
| 65 to 74 Years | 216 (25.9%) | 159 (15.9%) |
| 75 Years and over | 375 (64.4%) | 342 (50.3%) |
Disability Class by Sex by Age in Hays
Disability Class: Hearing Difficulty
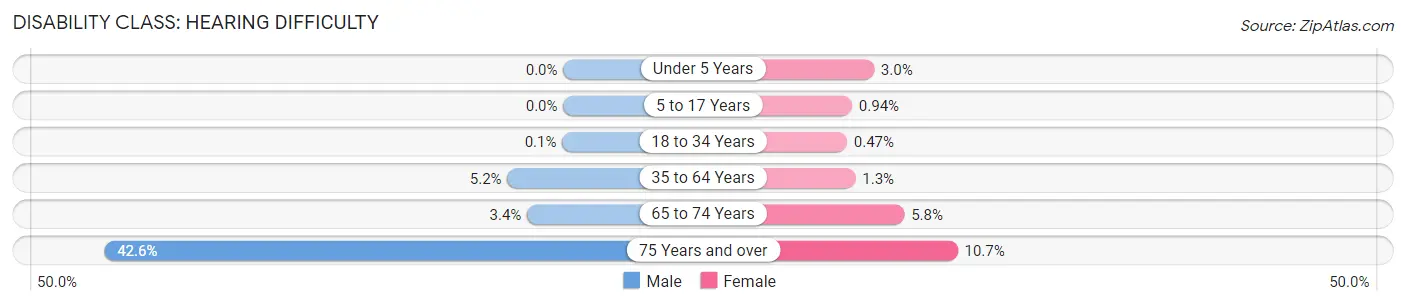
| Age Bracket | Male | Female |
| Under 5 Years | 0 (0.0%) | 18 (3.0%) |
| 5 to 17 Years | 0 (0.0%) | 13 (0.9%) |
| 18 to 34 Years | 4 (0.1%) | 17 (0.5%) |
| 35 to 64 Years | 155 (5.2%) | 39 (1.3%) |
| 65 to 74 Years | 28 (3.4%) | 58 (5.8%) |
| 75 Years and over | 248 (42.6%) | 73 (10.7%) |
Disability Class: Vision Difficulty
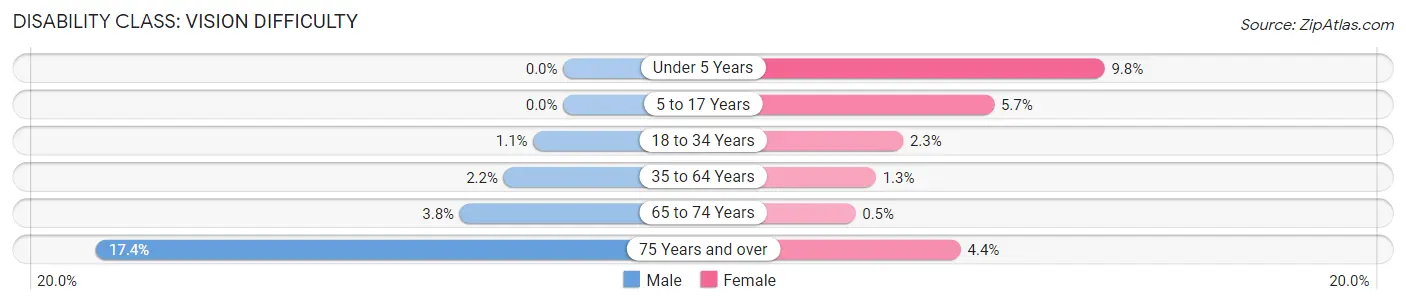
| Age Bracket | Male | Female |
| Under 5 Years | 0 (0.0%) | 59 (9.8%) |
| 5 to 17 Years | 0 (0.0%) | 78 (5.7%) |
| 18 to 34 Years | 46 (1.1%) | 82 (2.3%) |
| 35 to 64 Years | 66 (2.2%) | 39 (1.3%) |
| 65 to 74 Years | 32 (3.8%) | 5 (0.5%) |
| 75 Years and over | 101 (17.3%) | 30 (4.4%) |
Disability Class: Cognitive Difficulty
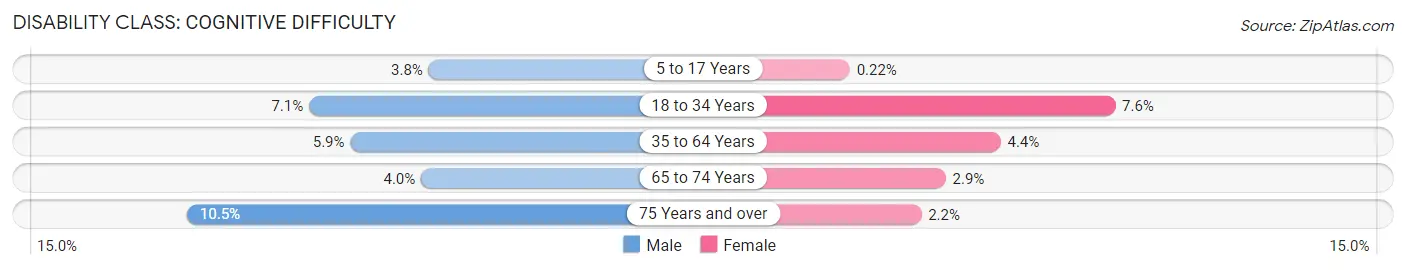
| Age Bracket | Male | Female |
| 5 to 17 Years | 59 (3.7%) | 3 (0.2%) |
| 18 to 34 Years | 292 (7.1%) | 275 (7.6%) |
| 35 to 64 Years | 177 (5.9%) | 137 (4.4%) |
| 65 to 74 Years | 33 (4.0%) | 29 (2.9%) |
| 75 Years and over | 61 (10.5%) | 15 (2.2%) |
Disability Class: Ambulatory Difficulty
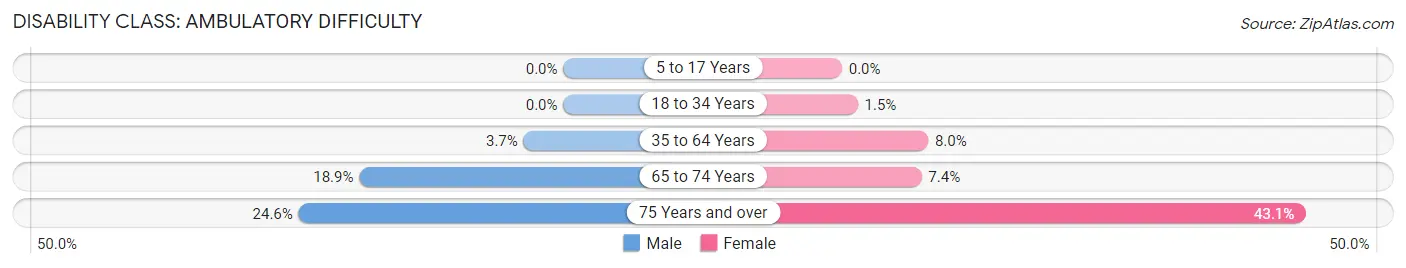
| Age Bracket | Male | Female |
| 5 to 17 Years | 0 (0.0%) | 0 (0.0%) |
| 18 to 34 Years | 0 (0.0%) | 53 (1.5%) |
| 35 to 64 Years | 110 (3.7%) | 248 (8.0%) |
| 65 to 74 Years | 158 (18.9%) | 74 (7.4%) |
| 75 Years and over | 143 (24.6%) | 293 (43.1%) |
Disability Class: Self-Care Difficulty
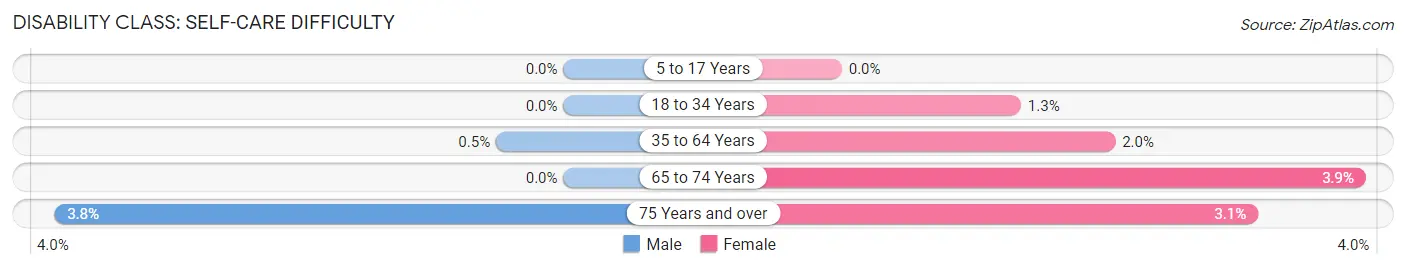
| Age Bracket | Male | Female |
| 5 to 17 Years | 0 (0.0%) | 0 (0.0%) |
| 18 to 34 Years | 0 (0.0%) | 48 (1.3%) |
| 35 to 64 Years | 15 (0.5%) | 63 (2.0%) |
| 65 to 74 Years | 0 (0.0%) | 39 (3.9%) |
| 75 Years and over | 22 (3.8%) | 21 (3.1%) |
Technology Access in Hays
Computing Device Access in Hays
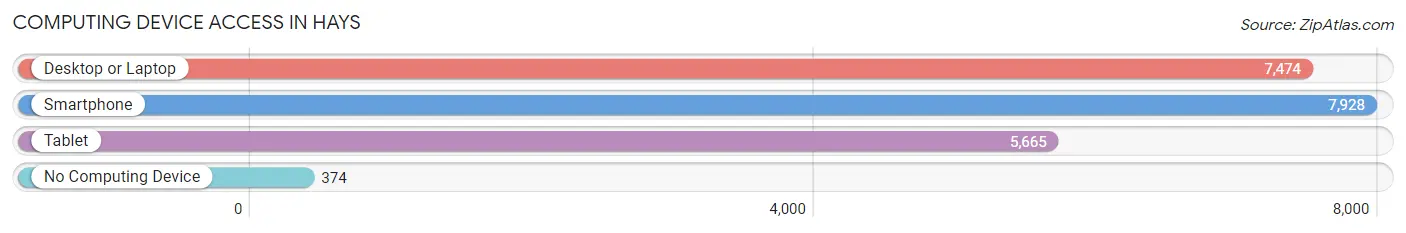
| Device Type | # Households | % Households |
| Desktop or Laptop | 7,474 | 85.5% |
| Smartphone | 7,928 | 90.7% |
| Tablet | 5,665 | 64.8% |
| No Computing Device | 374 | 4.3% |
| Total | 8,739 | 100.0% |
Internet Access in Hays
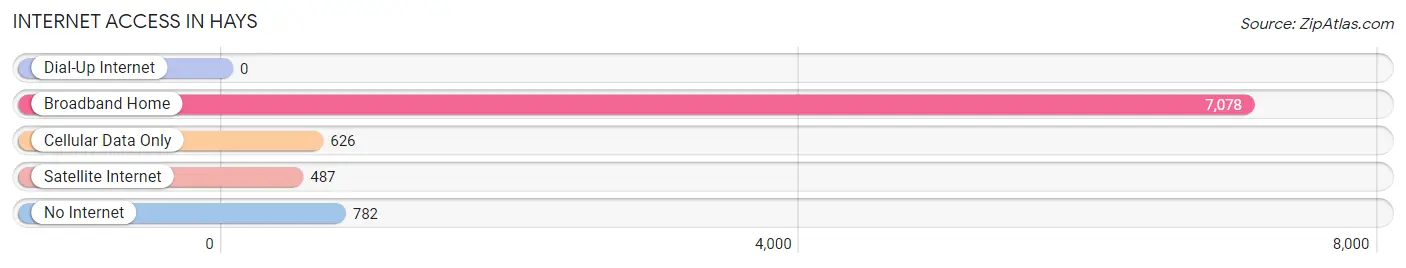
| Internet Type | # Households | % Households |
| Dial-Up Internet | 0 | 0.0% |
| Broadband Home | 7,078 | 81.0% |
| Cellular Data Only | 626 | 7.2% |
| Satellite Internet | 487 | 5.6% |
| No Internet | 782 | 8.9% |
| Total | 8,739 | 100.0% |
Hays Summary
Hays, Kansas is a city located in the western part of the state, in Ellis County. It is the county seat and the largest city in the county. The city is located along the Big Creek, a tributary of the Smoky Hill River. Hays is located approximately 150 miles west of the state capital of Topeka and approximately 200 miles north of Wichita.
History
Hays was founded in 1867 by William Hays, a former Union Army officer. The city was named after him and was incorporated in 1885. The city was originally a stop on the Union Pacific Railroad and was a major shipping point for cattle and other livestock.
In the late 19th century, Hays was a major center for the cattle industry. The city was also home to a large number of German immigrants, who established a number of businesses in the city.
In the early 20th century, Hays was a major center for the oil industry. The city was home to several oil refineries and was a major center for oil production.
Geography
Hays is located in the western part of the state, in Ellis County. The city is located along the Big Creek, a tributary of the Smoky Hill River. The city is located approximately 150 miles west of the state capital of Topeka and approximately 200 miles north of Wichita.
The city has a total area of 8.3 square miles, of which 8.2 square miles is land and 0.1 square miles is water. The city is located at an elevation of 1,845 feet above sea level.
Economy
Hays is a major center for the oil and gas industry. The city is home to several oil refineries and is a major center for oil production. The city is also home to several manufacturing companies, including a large paper mill.
The city is also home to a number of educational institutions, including Fort Hays State University, a public university. The university is the third-largest university in the state and is home to more than 15,000 students.
Demographics
As of the 2010 census, the city had a population of 20,510. The racial makeup of the city was 87.3% White, 5.2% African American, 0.7% Native American, 1.2% Asian, 0.1% Pacific Islander, 3.2% from other races, and 2.4% from two or more races. Hispanic or Latino of any race were 8.3% of the population.
The median income for a household in the city was $37,945, and the median income for a family was $45,945. The per capita income for the city was $19,945. About 11.2% of families and 14.3% of the population were below the poverty line, including 19.2% of those under age 18 and 8.2% of those age 65 or over.
Common Questions
What is Per Capita Income in Hays?
Per Capita income in Hays is $32,508.
What is the Median Family Income in Hays?
Median Family Income in Hays is $85,272.
What is the Median Household income in Hays?
Median Household Income in Hays is $55,349.
What is Income or Wage Gap in Hays?
Income or Wage Gap in Hays is 23.5%.
Women in Hays earn 76.5 cents for every dollar earned by a man.
What is Inequality or Gini Index in Hays?
Inequality or Gini Index in Hays is 0.46.
What is the Total Population of Hays?
Total Population of Hays is 21,111.
What is the Total Male Population of Hays?
Total Male Population of Hays is 10,652.
What is the Total Female Population of Hays?
Total Female Population of Hays is 10,459.
What is the Ratio of Males per 100 Females in Hays?
There are 101.85 Males per 100 Females in Hays.
What is the Ratio of Females per 100 Males in Hays?
There are 98.19 Females per 100 Males in Hays.
What is the Median Population Age in Hays?
Median Population Age in Hays is 30.6 Years.
What is the Average Family Size in Hays
Average Family Size in Hays is 2.9 People.
What is the Average Household Size in Hays
Average Household Size in Hays is 2.3 People.
How Large is the Labor Force in Hays?
There are 12,692 People in the Labor Forcein in Hays.
What is the Percentage of People in the Labor Force in Hays?
73.2% of People are in the Labor Force in Hays.
What is the Unemployment Rate in Hays?
Unemployment Rate in Hays is 3.5%.