Area Code 620 Map & Demographics
Area Code 620 Map
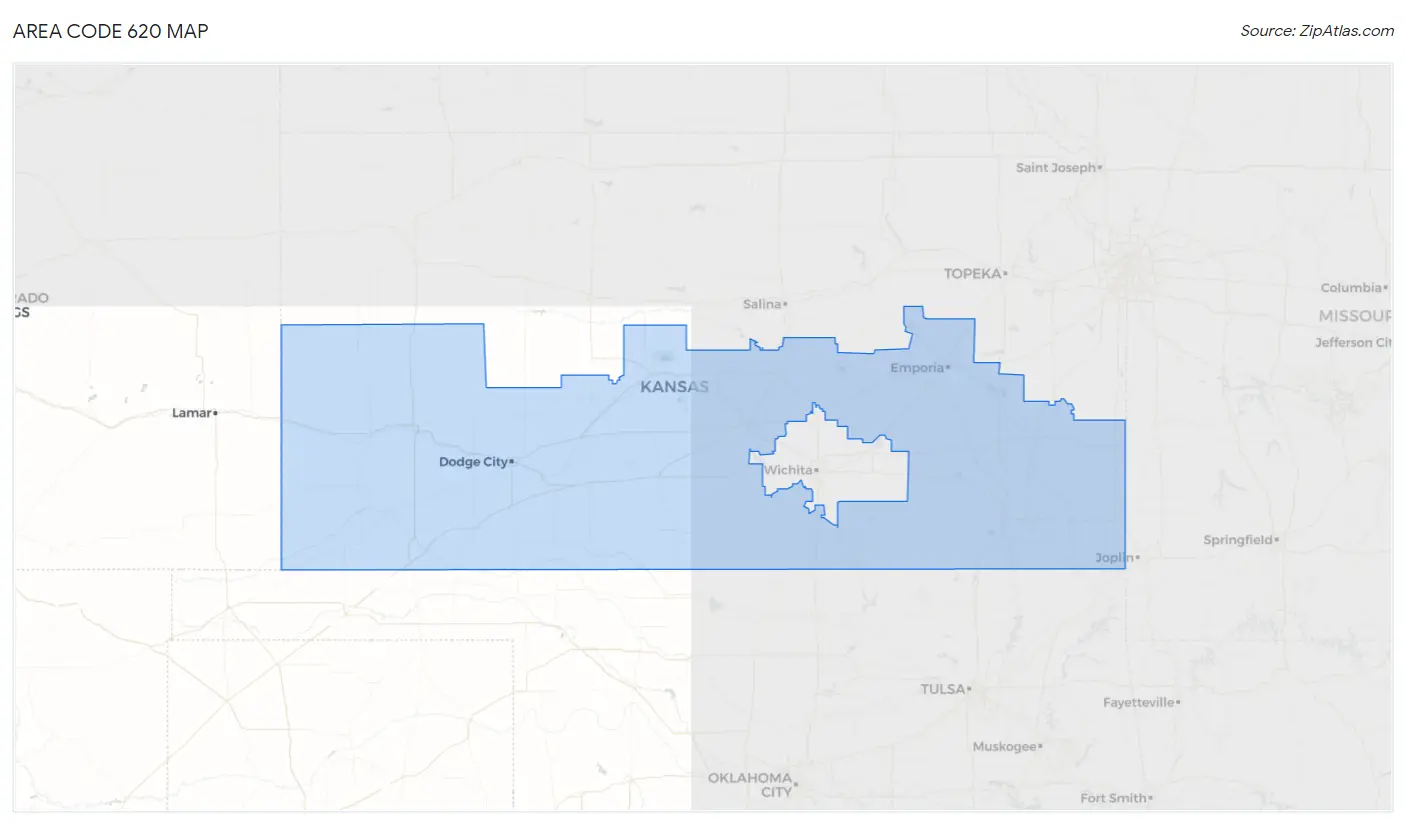
Area Code 620 Overview
$31,958
PER CAPITA INCOME
$76,767
AVG FAMILY INCOME
$61,718
AVG HOUSEHOLD INCOME
34.6%
WAGE / INCOME GAP [ % ]
65.4¢/ $1
WAGE / INCOME GAP [ $ ]
$9,632
FAMILY INCOME DEFICIT
107.06
INEQUALITY / GINI INDEX
616,114
TOTAL POPULATION
311,306
MALE POPULATION
304,808
FEMALE POPULATION
102.13
MALES / 100 FEMALES
97.91
FEMALES / 100 MALES
44.4
MEDIAN AGE
3.1
AVG FAMILY SIZE
2.5
AVG HOUSEHOLD SIZE
291,789
LABOR FORCE [ PEOPLE ]
60.4%
PERCENT IN LABOR FORCE
4.4%
UNEMPLOYMENT RATE
Income in Area Code 620
Income Overview in Area Code 620
Per Capita Income in Area Code 620 is $31,958, while median incomes of families and households are $76,767 and $61,718 respectively.
| Characteristic | Number | Measure |
| Per Capita Income | 616,114 | $31,958 |
| Median Family Income | 152,830 | $76,767 |
| Mean Family Income | 152,830 | $24,035,791 |
| Median Household Income | 239,434 | $61,718 |
| Mean Household Income | 239,434 | $20,679,555 |
| Income Deficit | 152,830 | $9,632 |
| Wage / Income Gap (%) | 616,114 | 34.57% |
| Wage / Income Gap ($) | 616,114 | 65.43¢ per $1 |
| Gini / Inequality Index | 616,114 | 107.06 |
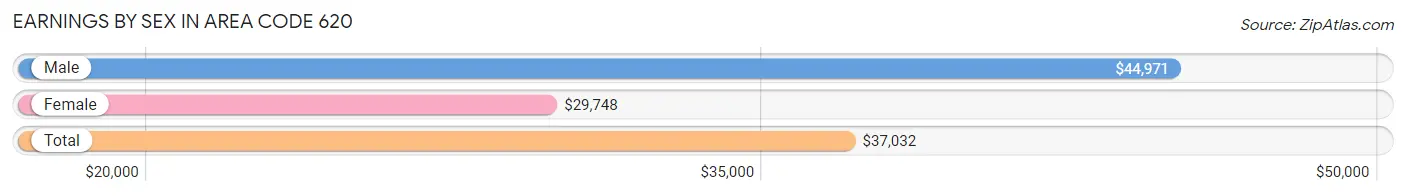
Earnings by Sex in Area Code 620
Average Earnings in Area Code 620 are $37,032, $44,971 for men and $29,748 for women, a difference of 33.9%.
| Sex | Number | Average Earnings |
| Male | 176,632 (54.1%) | $44,971 |
| Female | 149,624 (45.9%) | $29,748 |
| Total | 326,256 (100.0%) | $37,032 |
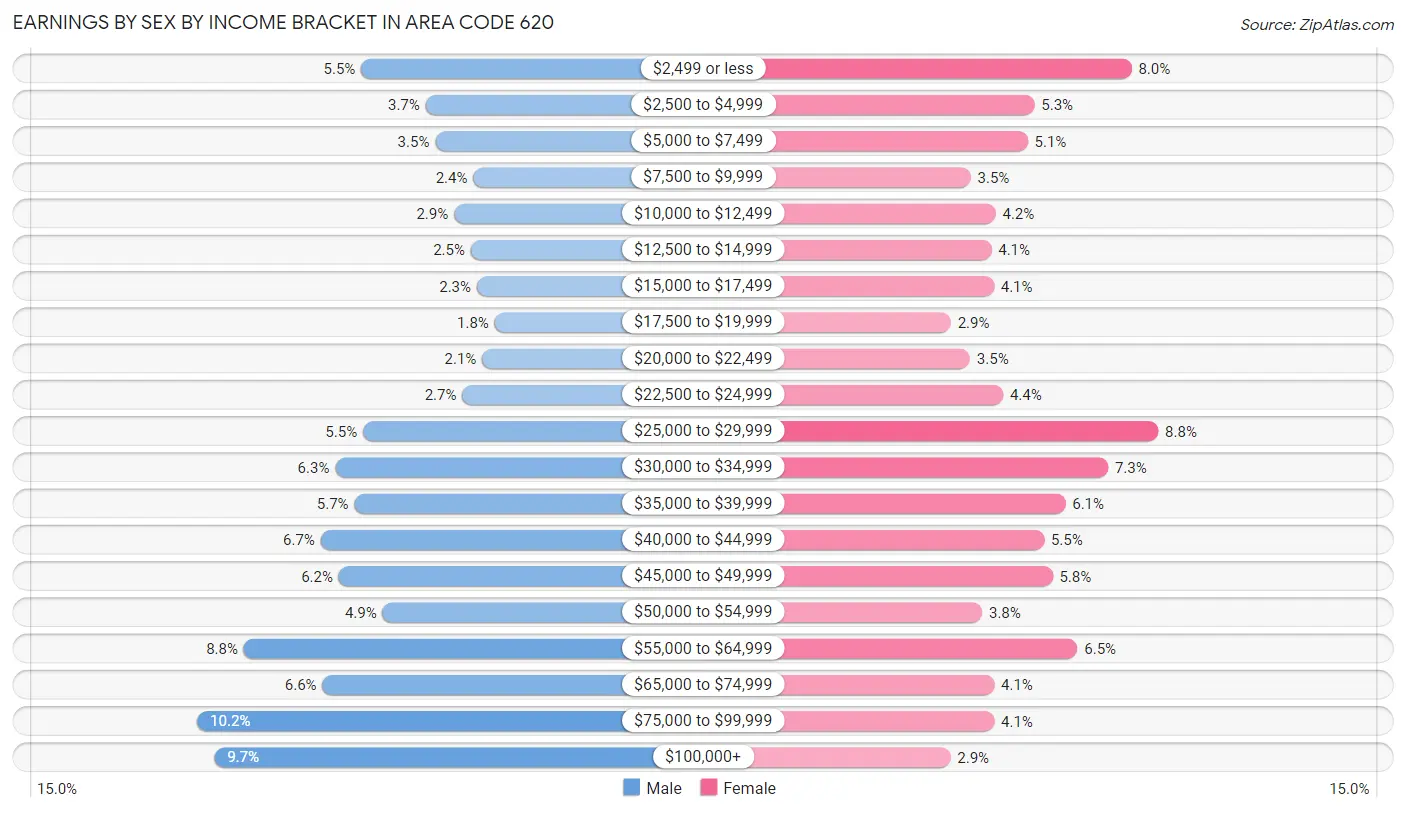
Earnings by Sex by Income Bracket in Area Code 620
The most common earnings brackets in Area Code 620 are $75,000 to $99,999 for men (17,925 | 10.2%) and $25,000 to $29,999 for women (13,098 | 8.7%).
| Income | Male | Female |
| $2,499 or less | 9,785 (5.5%) | 11,972 (8.0%) |
| $2,500 to $4,999 | 6,592 (3.7%) | 7,892 (5.3%) |
| $5,000 to $7,499 | 6,106 (3.5%) | 7,600 (5.1%) |
| $7,500 to $9,999 | 4,230 (2.4%) | 5,207 (3.5%) |
| $10,000 to $12,499 | 5,174 (2.9%) | 6,260 (4.2%) |
| $12,500 to $14,999 | 4,352 (2.5%) | 6,076 (4.1%) |
| $15,000 to $17,499 | 4,044 (2.3%) | 6,186 (4.1%) |
| $17,500 to $19,999 | 3,157 (1.8%) | 4,363 (2.9%) |
| $20,000 to $22,499 | 3,777 (2.1%) | 5,171 (3.5%) |
| $22,500 to $24,999 | 4,766 (2.7%) | 6,565 (4.4%) |
| $25,000 to $29,999 | 9,691 (5.5%) | 13,098 (8.7%) |
| $30,000 to $34,999 | 11,073 (6.3%) | 10,976 (7.3%) |
| $35,000 to $39,999 | 10,122 (5.7%) | 9,188 (6.1%) |
| $40,000 to $44,999 | 11,806 (6.7%) | 8,296 (5.5%) |
| $45,000 to $49,999 | 10,895 (6.2%) | 8,646 (5.8%) |
| $50,000 to $54,999 | 8,723 (4.9%) | 5,681 (3.8%) |
| $55,000 to $64,999 | 15,618 (8.8%) | 9,700 (6.5%) |
| $65,000 to $74,999 | 11,717 (6.6%) | 6,198 (4.1%) |
| $75,000 to $99,999 | 17,925 (10.2%) | 6,200 (4.1%) |
| $100,000+ | 17,079 (9.7%) | 4,349 (2.9%) |
| Total | 176,632 (100.0%) | 149,624 (100.0%) |
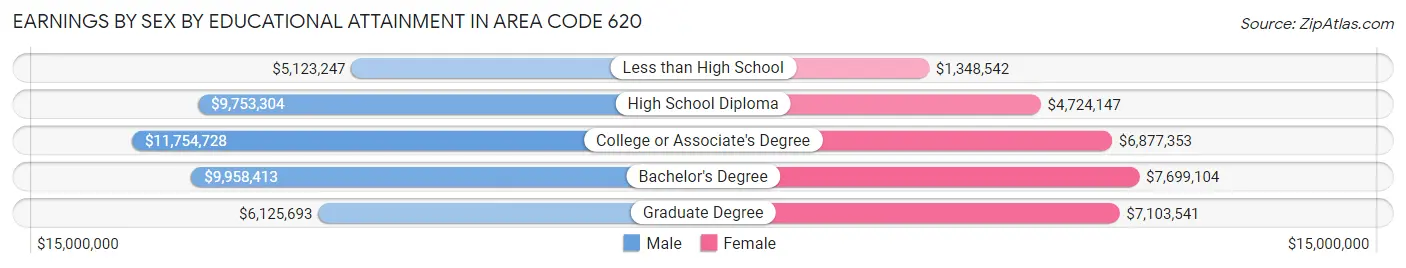
Earnings by Sex by Educational Attainment in Area Code 620
Average earnings in Area Code 620 are $12,173,209 for men and $7,940,368 for women, a difference of 34.8%. Men with an educational attainment of college or associate's degree enjoy the highest average annual earnings of $11,754,728, while those with less than high school education earn the least with $5,123,247. Women with an educational attainment of bachelor's degree earn the most with the average annual earnings of $7,699,104, while those with less than high school education have the smallest earnings of $1,348,542.
| Educational Attainment | Male Income | Female Income |
| Less than High School | $5,123,247 | $1,348,542 |
| High School Diploma | $9,753,304 | $4,724,147 |
| College or Associate's Degree | $11,754,728 | $6,877,353 |
| Bachelor's Degree | $9,958,413 | $7,699,104 |
| Graduate Degree | $6,125,693 | $7,103,541 |
| Total | $12,173,209 | $7,940,368 |
Family Income in Area Code 620
Family Income Brackets in Area Code 620
According to the Area Code 620 family income data, there are 8,746,614 families falling into the $50,000 to $74,999 income range, which is the most common income bracket and makes up 5,723.1% of all families. Conversely, the $10,000 to $14,999 income bracket is the least frequent group with only 785,852 families (514.2%) belonging to this category.
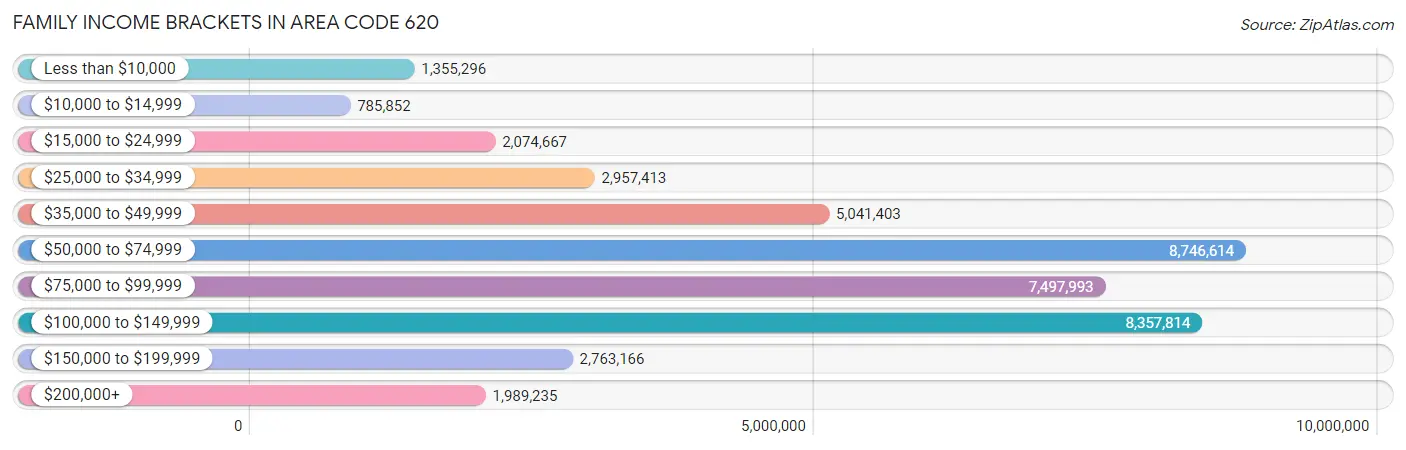
| Income Bracket | # Families | % Families |
| Less than $10,000 | 1,355,296 | 886.8% |
| $10,000 to $14,999 | 785,852 | 514.2% |
| $15,000 to $24,999 | 2,074,667 | 1,357.5% |
| $25,000 to $34,999 | 2,957,413 | 1,935.1% |
| $35,000 to $49,999 | 5,041,403 | 3,298.7% |
| $50,000 to $74,999 | 8,746,614 | 5,723.1% |
| $75,000 to $99,999 | 7,497,993 | 4,906.1% |
| $100,000 to $149,999 | 8,357,814 | 5,468.7% |
| $150,000 to $199,999 | 2,763,166 | 1,808.0% |
| $200,000+ | 1,989,235 | 1,301.6% |
Family Income by Famaliy Size in Area Code 620
7+ person families (2,456 | 1.6%) account for the highest median family income in Area Code 620 with $108,168 per family, while 2-person families (78,841 | 51.6%) have the highest median income of $37,377 per family member.
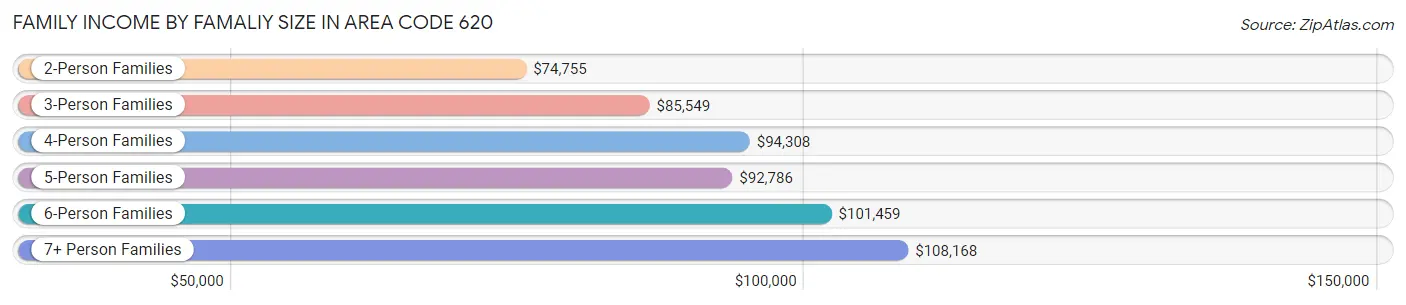
| Income Bracket | # Families | Median Income |
| 2-Person Families | 78,841 (51.6%) | $74,755 |
| 3-Person Families | 28,937 (18.9%) | $85,549 |
| 4-Person Families | 24,408 (16.0%) | $94,308 |
| 5-Person Families | 12,773 (8.4%) | $92,786 |
| 6-Person Families | 5,415 (3.5%) | $101,459 |
| 7+ Person Families | 2,456 (1.6%) | $108,168 |
| Total | 152,830 (100.0%) | $76,767 |
Family Income by Number of Earners in Area Code 620
The median family income in Area Code 620 is $76,767, with families comprising 3+ earners (16,243) having the highest median family income of $119,581, while families with no earners (21,250) have the lowest median family income of $50,319, accounting for 10.6% and 13.9% of families, respectively.
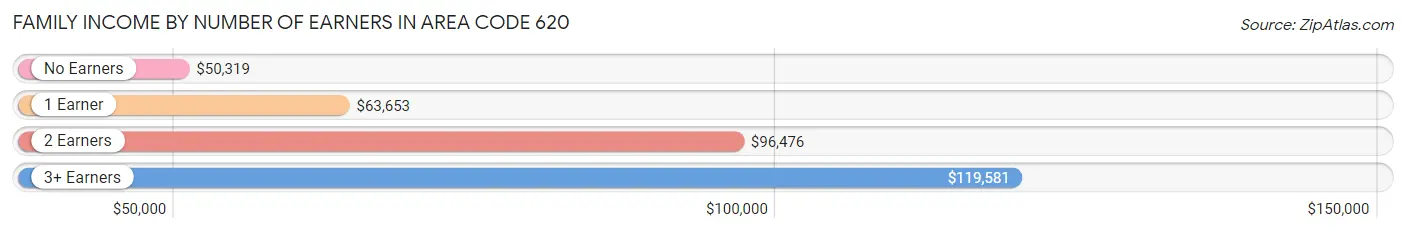
| Number of Earners | # Families | Median Income |
| No Earners | 21,250 (13.9%) | $50,319 |
| 1 Earner | 48,681 (31.9%) | $63,653 |
| 2 Earners | 66,656 (43.6%) | $96,476 |
| 3+ Earners | 16,243 (10.6%) | $119,581 |
| Total | 152,830 (100.0%) | $76,767 |
Household Income in Area Code 620
Household Income Brackets in Area Code 620
With 13,118,110 households falling in the category, the $50,000 to $74,999 income range is the most frequent in Area Code 620, accounting for 5,478.8% of all households. In contrast, only 2,417,086 households (1,009.5%) fall into the $200,000+ income bracket, making it the least populous group.
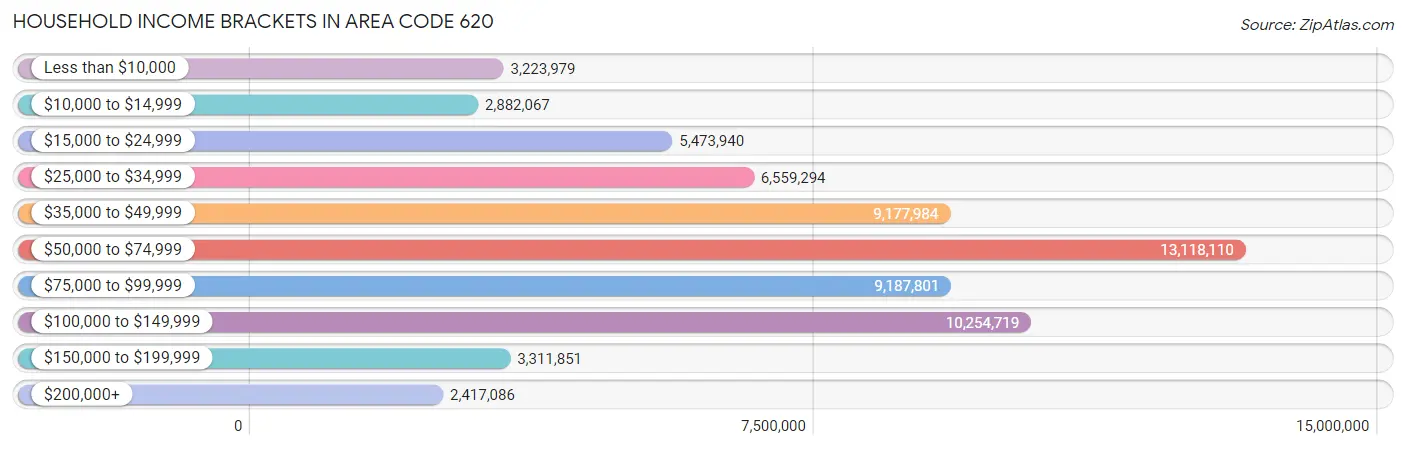
| Income Bracket | # Households | % Households |
| Less than $10,000 | 3,223,979 | 1,346.5% |
| $10,000 to $14,999 | 2,882,067 | 1,203.7% |
| $15,000 to $24,999 | 5,473,940 | 2,286.2% |
| $25,000 to $34,999 | 6,559,294 | 2,739.5% |
| $35,000 to $49,999 | 9,177,984 | 3,833.2% |
| $50,000 to $74,999 | 13,118,110 | 5,478.8% |
| $75,000 to $99,999 | 9,187,801 | 3,837.3% |
| $100,000 to $149,999 | 10,254,719 | 4,282.9% |
| $150,000 to $199,999 | 3,311,851 | 1,383.2% |
| $200,000+ | 2,417,086 | 1,009.5% |
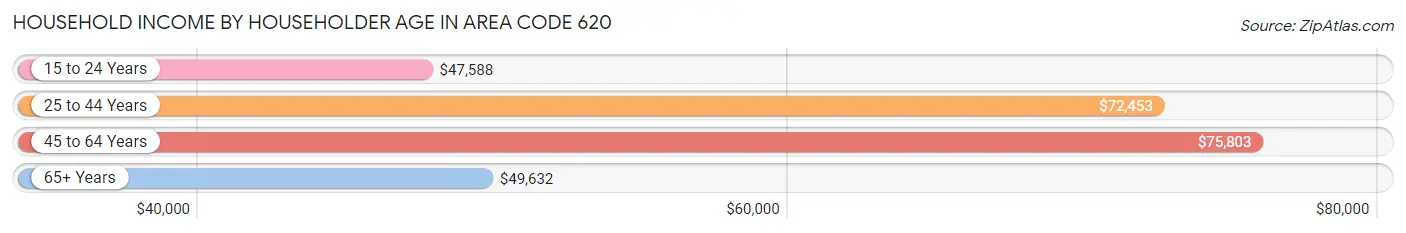
Household Income by Householder Age in Area Code 620
The median household income in Area Code 620 is $61,718, with the highest median household income of $75,803 found in the 45 to 64 years age bracket for the primary householder. A total of 83,906 households (35.0%) fall into this category. Meanwhile, the 15 to 24 years age bracket for the primary householder has the lowest median household income of $47,588, with 14,594 households (6.1%) in this group.
| Income Bracket | # Households | Median Income |
| 15 to 24 Years | 14,594 (6.1%) | $47,588 |
| 25 to 44 Years | 69,936 (29.2%) | $72,453 |
| 45 to 64 Years | 83,906 (35.0%) | $75,803 |
| 65+ Years | 70,998 (29.6%) | $49,632 |
| Total | 239,434 (100.0%) | $61,718 |
Poverty in Area Code 620
Income Below Poverty by Sex and Age in Area Code 620
With 11.5% poverty level for males and 15.2% for females among the residents of Area Code 620, 18 to 24 year old males and 18 to 24 year old females are the most vulnerable to poverty, with 5,858 males (20.7%) and 8,102 females (31.7%) in their respective age groups living below the poverty level.
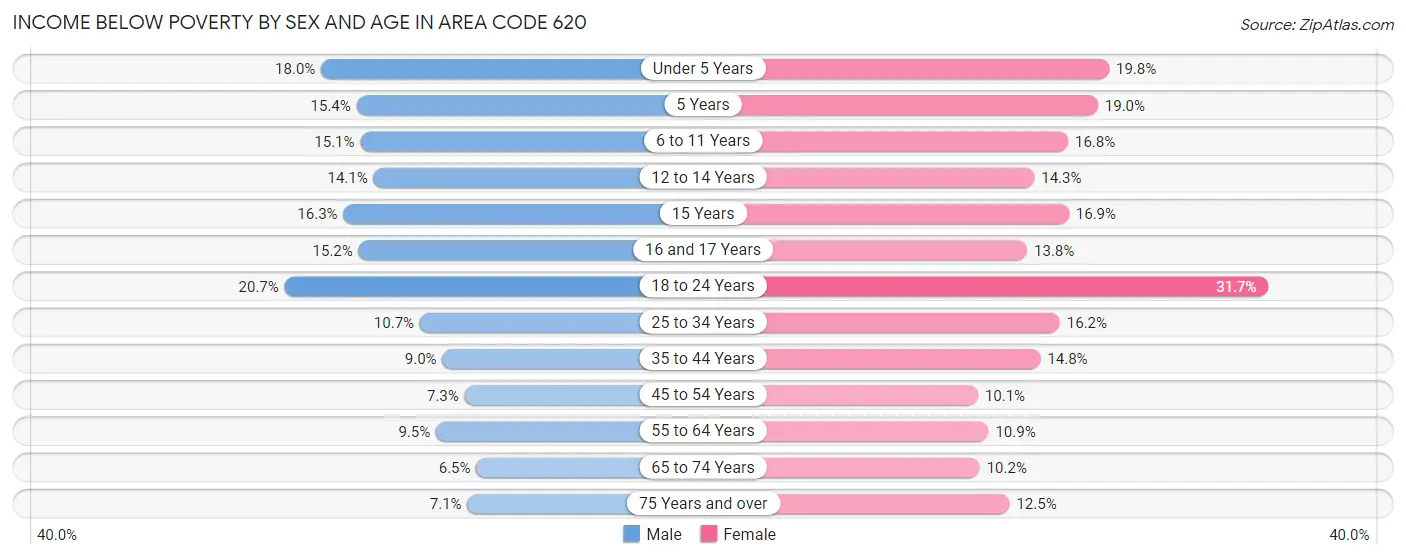
| Age Bracket | Male | Female |
| Under 5 Years | 3,466 (18.0%) | 3,444 (19.8%) |
| 5 Years | 660 (15.3%) | 792 (19.0%) |
| 6 to 11 Years | 3,873 (15.1%) | 4,069 (16.8%) |
| 12 to 14 Years | 1,970 (14.1%) | 1,831 (14.3%) |
| 15 Years | 653 (16.3%) | 711 (16.9%) |
| 16 and 17 Years | 1,436 (15.2%) | 1,158 (13.8%) |
| 18 to 24 Years | 5,858 (20.7%) | 8,102 (31.7%) |
| 25 to 34 Years | 3,794 (10.6%) | 5,479 (16.2%) |
| 35 to 44 Years | 3,192 (9.0%) | 5,033 (14.7%) |
| 45 to 54 Years | 2,454 (7.3%) | 3,357 (10.1%) |
| 55 to 64 Years | 3,823 (9.5%) | 4,362 (10.9%) |
| 65 to 74 Years | 1,951 (6.5%) | 3,222 (10.2%) |
| 75 Years and over | 1,286 (7.1%) | 3,231 (12.4%) |
| Total | 34,416 (11.5%) | 44,791 (15.2%) |
Income Above Poverty by Sex and Age in Area Code 620
According to the poverty statistics in Area Code 620, males aged 65 to 74 years and females aged 45 to 54 years are the age groups that are most secure financially, with 93.5% of males and 89.9% of females in these age groups living above the poverty line.
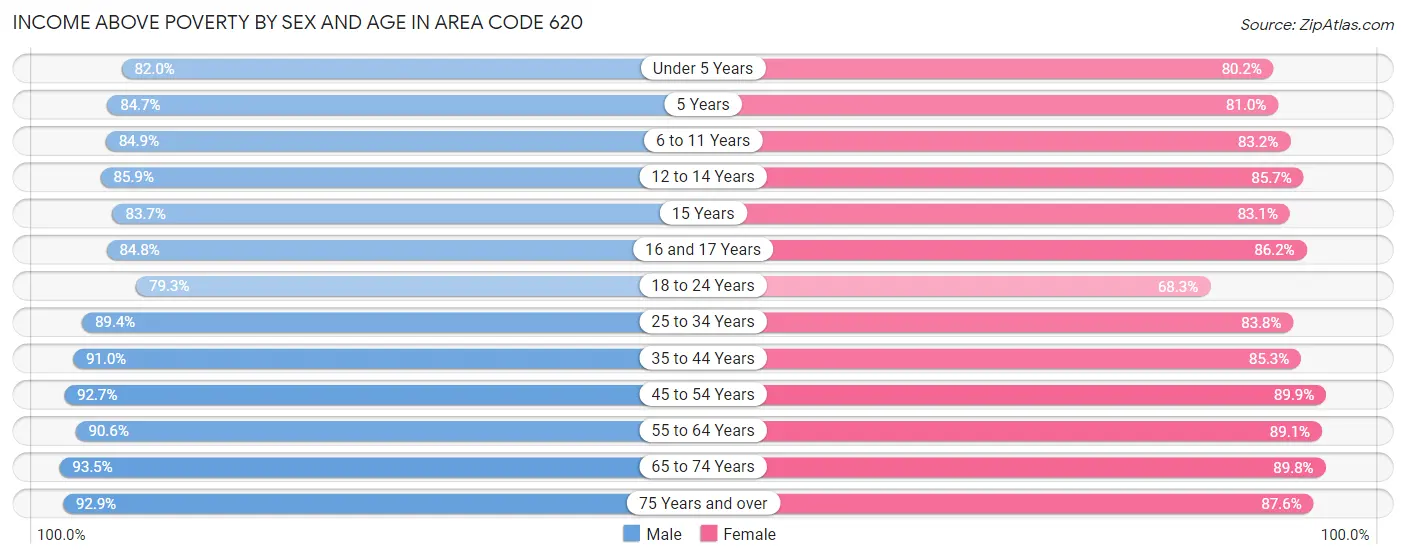
| Age Bracket | Male | Female |
| Under 5 Years | 15,810 (82.0%) | 13,913 (80.2%) |
| 5 Years | 3,640 (84.7%) | 3,375 (81.0%) |
| 6 to 11 Years | 21,821 (84.9%) | 20,151 (83.2%) |
| 12 to 14 Years | 12,010 (85.9%) | 10,979 (85.7%) |
| 15 Years | 3,346 (83.7%) | 3,507 (83.1%) |
| 16 and 17 Years | 8,011 (84.8%) | 7,259 (86.2%) |
| 18 to 24 Years | 22,440 (79.3%) | 17,477 (68.3%) |
| 25 to 34 Years | 31,841 (89.3%) | 28,359 (83.8%) |
| 35 to 44 Years | 32,336 (91.0%) | 29,081 (85.3%) |
| 45 to 54 Years | 31,034 (92.7%) | 29,834 (89.9%) |
| 55 to 64 Years | 36,637 (90.5%) | 35,696 (89.1%) |
| 65 to 74 Years | 28,271 (93.5%) | 28,240 (89.8%) |
| 75 Years and over | 16,768 (92.9%) | 22,714 (87.5%) |
| Total | 263,965 (88.5%) | 250,585 (84.8%) |
Income Below Poverty Among Married-Couple Families in Area Code 620
The poverty statistics for married-couple families in Area Code 620 show that 5.0% or 5,836 of the total 117,345 families live below the poverty line. Families with 5 or more children have the highest poverty rate of 37.2%, comprising of 484 families. On the other hand, families with no children have the lowest poverty rate of 4.1%, which includes 2,909 families.
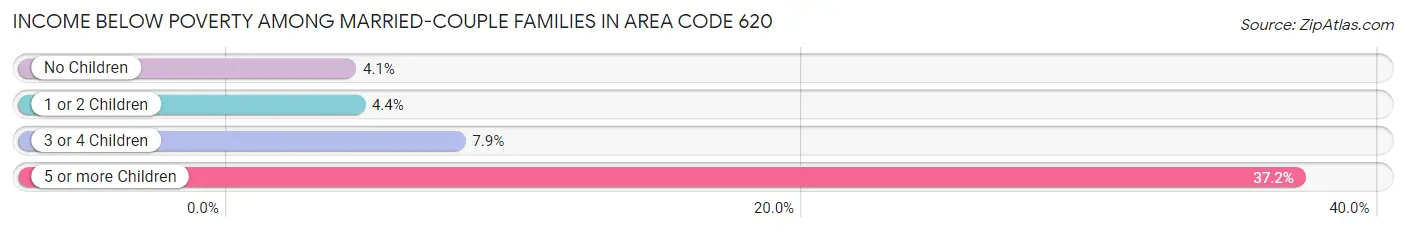
| Children | Above Poverty | Below Poverty |
| No Children | 67,850 (95.9%) | 2,909 (4.1%) |
| 1 or 2 Children | 31,280 (95.6%) | 1,448 (4.4%) |
| 3 or 4 Children | 11,561 (92.1%) | 995 (7.9%) |
| 5 or more Children | 818 (62.8%) | 484 (37.2%) |
| Total | 111,509 (95.0%) | 5,836 (5.0%) |
Income Below Poverty Among Single-Parent Households in Area Code 620
According to the poverty data in Area Code 620, 12.8% or 1,447 single-father households and 28.8% or 6,953 single-mother households are living below the poverty line. Among single-father households, those with 3 or 4 children have the highest poverty rate, with 295 households (23.4%) experiencing poverty. Likewise, among single-mother households, those with 5 or more children have the highest poverty rate, with 281 households (77.2%) falling below the poverty line.
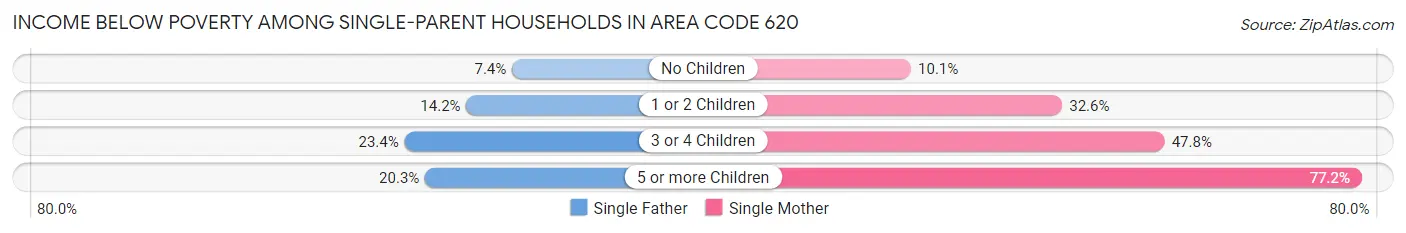
| Children | Single Father | Single Mother |
| No Children | 303 (7.4%) | 721 (10.1%) |
| 1 or 2 Children | 836 (14.2%) | 4,254 (32.6%) |
| 3 or 4 Children | 295 (23.4%) | 1,697 (47.8%) |
| 5 or more Children | 13 (20.3%) | 281 (77.2%) |
| Total | 1,447 (12.8%) | 6,953 (28.8%) |
Income Below Poverty Among Married-Couple vs Single-Parent Households in Area Code 620
The poverty data for Area Code 620 shows that 5,836 of the married-couple family households (5.0%) and 8,400 of the single-parent households (23.7%) are living below the poverty level. Within the married-couple family households, those with 5 or more children have the highest poverty rate, with 484 households (37.2%) falling below the poverty line. Among the single-parent households, those with 5 or more children have the highest poverty rate, with 294 household (68.7%) living below poverty.
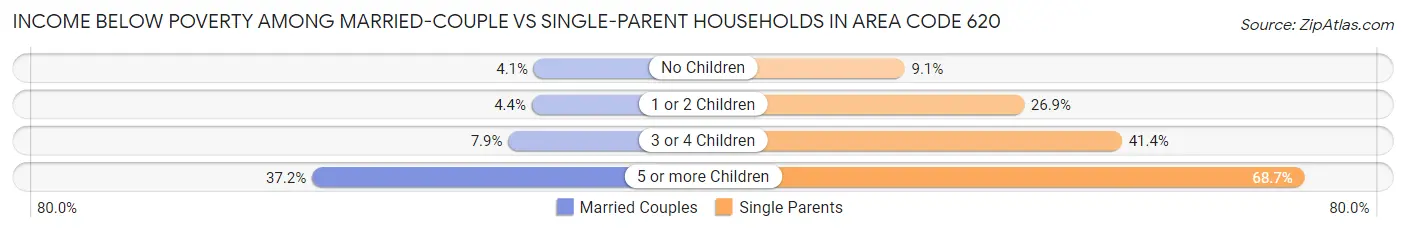
| Children | Married-Couple Families | Single-Parent Households |
| No Children | 2,909 (4.1%) | 1,024 (9.1%) |
| 1 or 2 Children | 1,448 (4.4%) | 5,090 (26.9%) |
| 3 or 4 Children | 995 (7.9%) | 1,992 (41.4%) |
| 5 or more Children | 484 (37.2%) | 294 (68.7%) |
| Total | 5,836 (5.0%) | 8,400 (23.7%) |
Race in Area Code 620
The most populous races in Area Code 620 are White / Caucasian (514,275 | 83.5%), Hispanic or Latino (107,471 | 17.4%), and Two or more Races (51,227 | 8.3%).
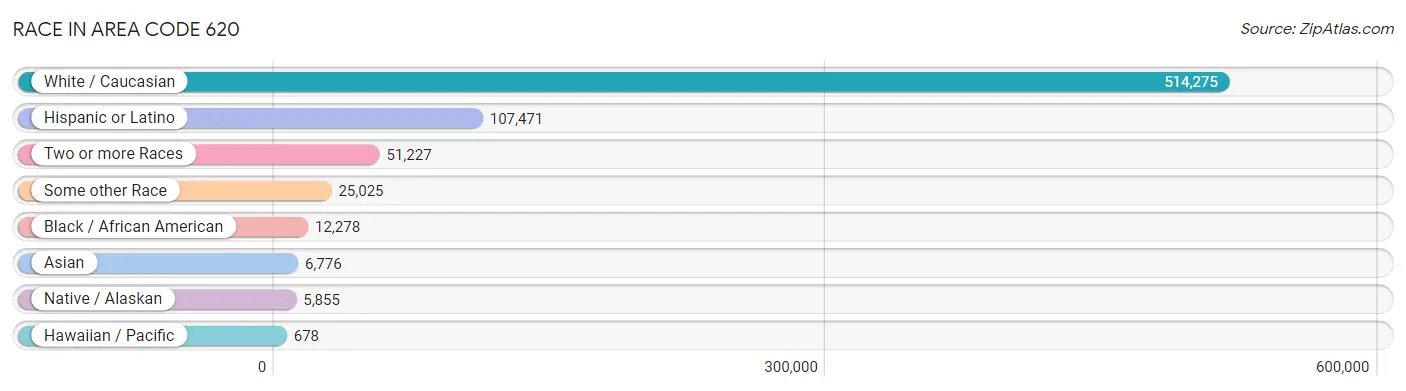
| Race | # Population | % Population |
| Asian | 6,776 | 1.1% |
| Black / African American | 12,278 | 2.0% |
| Hawaiian / Pacific | 678 | 0.1% |
| Hispanic or Latino | 107,471 | 17.4% |
| Native / Alaskan | 5,855 | 0.9% |
| White / Caucasian | 514,275 | 83.5% |
| Two or more Races | 51,227 | 8.3% |
| Some other Race | 25,025 | 4.1% |
| Total | 616,114 | 100.0% |
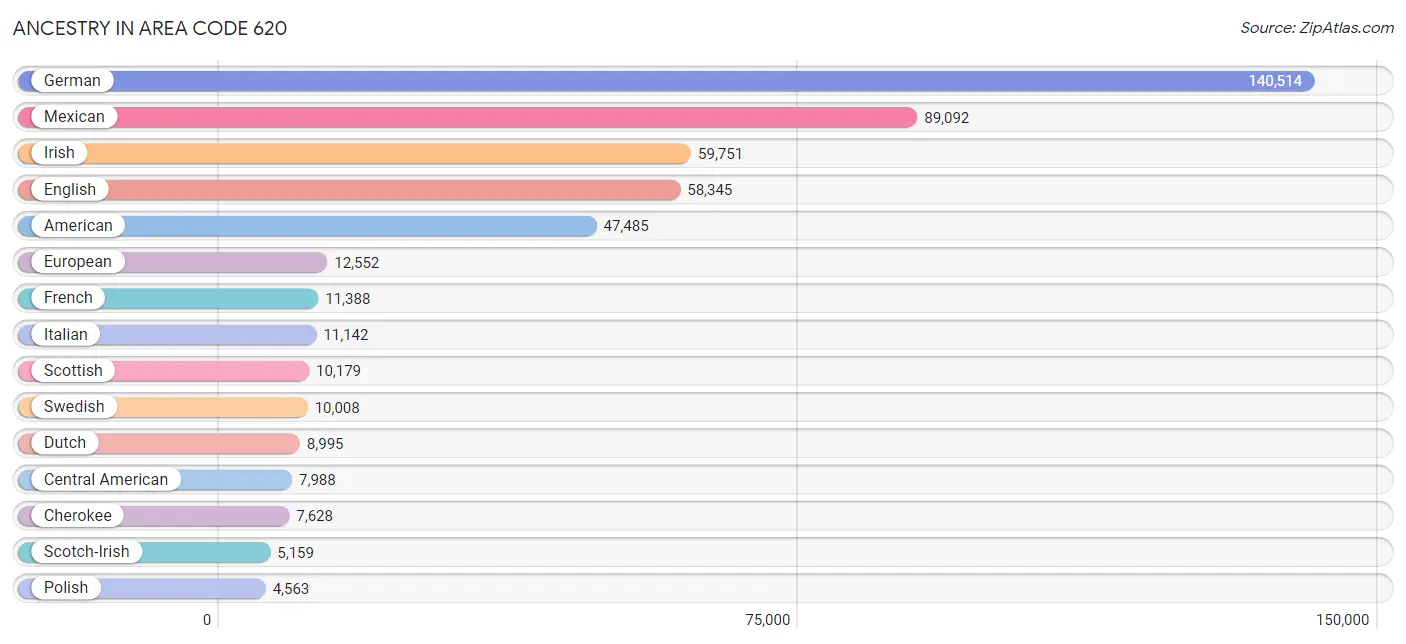
Ancestry in Area Code 620
The most populous ancestries reported in Area Code 620 are German (140,514 | 22.8%), Mexican (89,092 | 14.5%), Irish (59,751 | 9.7%), English (58,345 | 9.5%), and American (47,485 | 7.7%), together accounting for 64.1% of all Area Code 620 residents.
| Ancestry | # Population | % Population |
| African | 688 | 0.1% |
| Alaska Native | 9 | 0.0% |
| Albanian | 2 | 0.0% |
| Aleut | 5 | 0.0% |
| Alsatian | 17 | 0.0% |
| American | 47,485 | 7.7% |
| Apache | 366 | 0.1% |
| Arab | 612 | 0.1% |
| Argentinean | 439 | 0.1% |
| Armenian | 45 | 0.0% |
| Australian | 77 | 0.0% |
| Austrian | 1,190 | 0.2% |
| Bahamian | 2 | 0.0% |
| Bangladeshi | 109 | 0.0% |
| Basque | 39 | 0.0% |
| Belgian | 376 | 0.1% |
| Belizean | 5 | 0.0% |
| Bhutanese | 861 | 0.1% |
| Blackfeet | 494 | 0.1% |
| Bolivian | 61 | 0.0% |
| Brazilian | 181 | 0.0% |
| British | 2,656 | 0.4% |
| Bulgarian | 4 | 0.0% |
| Burmese | 456 | 0.1% |
| Cajun | 82 | 0.0% |
| Cambodian | 17 | 0.0% |
| Canadian | 544 | 0.1% |
| Cape Verdean | 10 | 0.0% |
| Celtic | 78 | 0.0% |
| Central American | 7,988 | 1.3% |
| Central American Indian | 600 | 0.1% |
| Cherokee | 7,628 | 1.2% |
| Cheyenne | 35 | 0.0% |
| Chickasaw | 305 | 0.1% |
| Chilean | 25 | 0.0% |
| Chinese | 6 | 0.0% |
| Chippewa | 84 | 0.0% |
| Choctaw | 996 | 0.2% |
| Colombian | 436 | 0.1% |
| Comanche | 115 | 0.0% |
| Costa Rican | 25 | 0.0% |
| Creek | 324 | 0.1% |
| Croatian | 112 | 0.0% |
| Crow | 15 | 0.0% |
| Cuban | 1,024 | 0.2% |
| Cypriot | 10 | 0.0% |
| Czech | 3,329 | 0.5% |
| Czechoslovakian | 546 | 0.1% |
| Danish | 2,102 | 0.3% |
| Delaware | 418 | 0.1% |
| Dominican | 200 | 0.0% |
| Dutch | 8,995 | 1.5% |
| Dutch West Indian | 23 | 0.0% |
| Eastern European | 528 | 0.1% |
| Ecuadorian | 28 | 0.0% |
| Egyptian | 3 | 0.0% |
| English | 58,345 | 9.5% |
| Ethiopian | 58 | 0.0% |
| European | 12,552 | 2.0% |
| Filipino | 29 | 0.0% |
| Finnish | 360 | 0.1% |
| French | 11,388 | 1.8% |
| French American Indian | 115 | 0.0% |
| French Canadian | 1,097 | 0.2% |
| German | 140,514 | 22.8% |
| German Russian | 219 | 0.0% |
| Ghanaian | 84 | 0.0% |
| Greek | 527 | 0.1% |
| Guamanian / Chamorro | 202 | 0.0% |
| Guatemalan | 4,519 | 0.7% |
| Haitian | 539 | 0.1% |
| Honduran | 392 | 0.1% |
| Hopi | 31 | 0.0% |
| Hungarian | 619 | 0.1% |
| Icelander | 3 | 0.0% |
| Indian (Asian) | 932 | 0.2% |
| Indonesian | 543 | 0.1% |
| Iranian | 94 | 0.0% |
| Irish | 59,751 | 9.7% |
| Iroquois | 239 | 0.0% |
| Israeli | 4 | 0.0% |
| Italian | 11,142 | 1.8% |
| Jamaican | 147 | 0.0% |
| Japanese | 159 | 0.0% |
| Jordanian | 29 | 0.0% |
| Kenyan | 119 | 0.0% |
| Kiowa | 27 | 0.0% |
| Korean | 2,038 | 0.3% |
| Laotian | 19 | 0.0% |
| Latvian | 88 | 0.0% |
| Lebanese | 474 | 0.1% |
| Lithuanian | 115 | 0.0% |
| Lumbee | 11 | 0.0% |
| Luxembourger | 21 | 0.0% |
| Malaysian | 570 | 0.1% |
| Maltese | 4 | 0.0% |
| Mexican | 89,092 | 14.5% |
| Mexican American Indian | 812 | 0.1% |
| Mongolian | 40 | 0.0% |
| Moroccan | 18 | 0.0% |
| Native Hawaiian | 150 | 0.0% |
| Navajo | 319 | 0.1% |
| Nicaraguan | 141 | 0.0% |
| Nigerian | 93 | 0.0% |
| Northern European | 415 | 0.1% |
| Norwegian | 3,373 | 0.5% |
| Osage | 670 | 0.1% |
| Ottawa | 3 | 0.0% |
| Pakistani | 288 | 0.1% |
| Palestinian | 43 | 0.0% |
| Panamanian | 93 | 0.0% |
| Paraguayan | 91 | 0.0% |
| Pennsylvania German | 843 | 0.1% |
| Peruvian | 208 | 0.0% |
| Polish | 4,563 | 0.7% |
| Portuguese | 354 | 0.1% |
| Potawatomi | 553 | 0.1% |
| Pueblo | 30 | 0.0% |
| Puerto Rican | 2,433 | 0.4% |
| Puget Sound Salish | 4 | 0.0% |
| Romanian | 65 | 0.0% |
| Russian | 4,016 | 0.6% |
| Salvadoran | 2,818 | 0.5% |
| Samoan | 127 | 0.0% |
| Scandinavian | 1,211 | 0.2% |
| Scotch-Irish | 5,159 | 0.8% |
| Scottish | 10,179 | 1.7% |
| Seminole | 44 | 0.0% |
| Serbian | 34 | 0.0% |
| Shoshone | 58 | 0.0% |
| Sioux | 718 | 0.1% |
| Slavic | 110 | 0.0% |
| Slovak | 231 | 0.0% |
| Slovene | 185 | 0.0% |
| Somali | 562 | 0.1% |
| South African | 68 | 0.0% |
| South American | 1,836 | 0.3% |
| South American Indian | 45 | 0.0% |
| Spaniard | 1,400 | 0.2% |
| Spanish | 1,105 | 0.2% |
| Spanish American | 7 | 0.0% |
| Spanish American Indian | 6 | 0.0% |
| Sri Lankan | 2,505 | 0.4% |
| Subsaharan African | 2,012 | 0.3% |
| Sudanese | 164 | 0.0% |
| Swedish | 10,008 | 1.6% |
| Swiss | 2,951 | 0.5% |
| Syrian | 28 | 0.0% |
| Thai | 780 | 0.1% |
| Tlingit-Haida | 67 | 0.0% |
| Tohono O'Odham | 124 | 0.0% |
| Tongan | 20 | 0.0% |
| Trinidadian and Tobagonian | 1 | 0.0% |
| Tsimshian | 42 | 0.0% |
| Turkish | 19 | 0.0% |
| Ukrainian | 264 | 0.0% |
| Uruguayan | 30 | 0.0% |
| Ute | 45 | 0.0% |
| Venezuelan | 518 | 0.1% |
| Vietnamese | 24 | 0.0% |
| Welsh | 3,276 | 0.5% |
| West Indian | 22 | 0.0% |
| Yaqui | 18 | 0.0% |
| Yugoslavian | 76 | 0.0% |
| Yup'ik | 1 | 0.0% |
| Zimbabwean | 23 | 0.0% | View All 166 Rows |
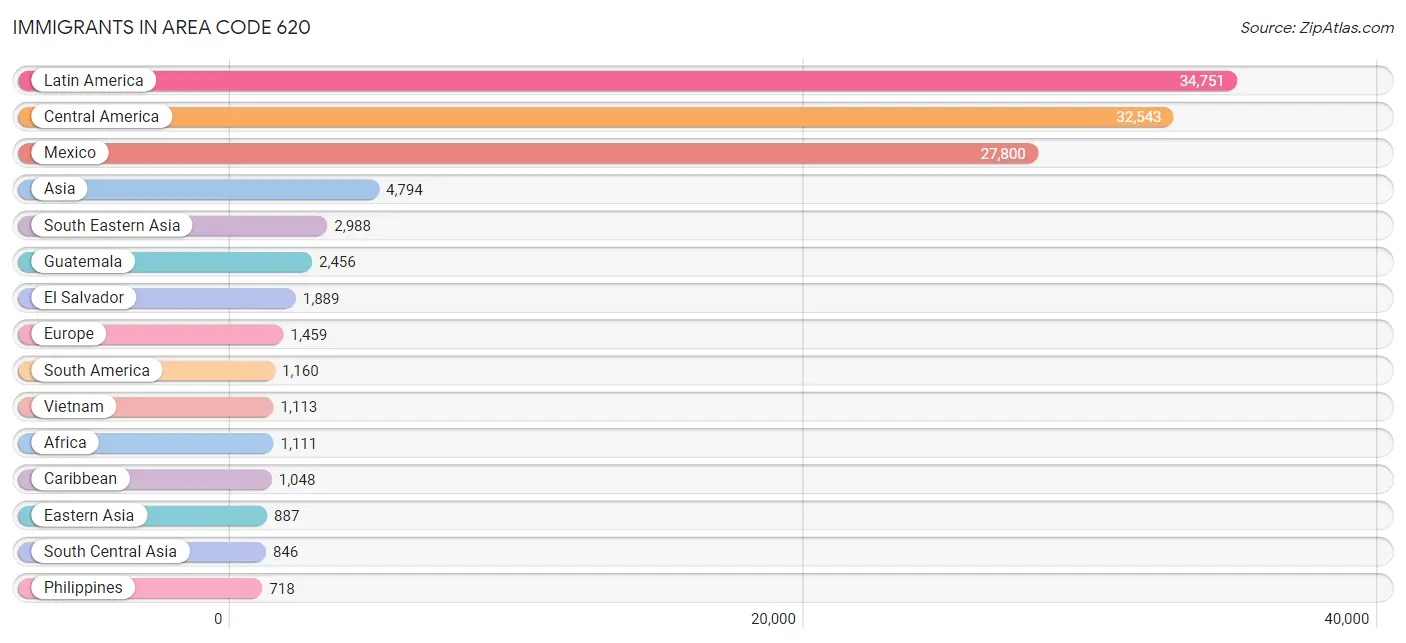
Immigrants in Area Code 620
The most numerous immigrant groups reported in Area Code 620 came from Latin America (34,751 | 5.6%), Central America (32,543 | 5.3%), Mexico (27,800 | 4.5%), Asia (4,794 | 0.8%), and South Eastern Asia (2,988 | 0.5%), together accounting for 16.7% of all Area Code 620 residents.
| Immigration Origin | # Population | % Population |
| Africa | 1,111 | 0.2% |
| Argentina | 12 | 0.0% |
| Asia | 4,794 | 0.8% |
| Australia | 88 | 0.0% |
| Austria | 3 | 0.0% |
| Bahamas | 5 | 0.0% |
| Bangladesh | 61 | 0.0% |
| Belarus | 3 | 0.0% |
| Belize | 5 | 0.0% |
| Bolivia | 44 | 0.0% |
| Brazil | 186 | 0.0% |
| Cambodia | 50 | 0.0% |
| Cameroon | 30 | 0.0% |
| Canada | 417 | 0.1% |
| Caribbean | 1,048 | 0.2% |
| Central America | 32,543 | 5.3% |
| Chile | 17 | 0.0% |
| China | 477 | 0.1% |
| Colombia | 179 | 0.0% |
| Costa Rica | 1 | 0.0% |
| Cuba | 443 | 0.1% |
| Czechoslovakia | 5 | 0.0% |
| Denmark | 7 | 0.0% |
| Dominican Republic | 74 | 0.0% |
| Eastern Africa | 440 | 0.1% |
| Eastern Asia | 887 | 0.1% |
| Eastern Europe | 392 | 0.1% |
| Ecuador | 146 | 0.0% |
| Egypt | 22 | 0.0% |
| El Salvador | 1,889 | 0.3% |
| England | 183 | 0.0% |
| Eritrea | 52 | 0.0% |
| Ethiopia | 64 | 0.0% |
| Europe | 1,459 | 0.2% |
| France | 16 | 0.0% |
| Germany | 477 | 0.1% |
| Guatemala | 2,456 | 0.4% |
| Guyana | 9 | 0.0% |
| Haiti | 439 | 0.1% |
| Honduras | 310 | 0.1% |
| Hong Kong | 1 | 0.0% |
| Hungary | 44 | 0.0% |
| India | 625 | 0.1% |
| Indonesia | 27 | 0.0% |
| Iran | 30 | 0.0% |
| Iraq | 4 | 0.0% |
| Ireland | 15 | 0.0% |
| Italy | 72 | 0.0% |
| Jamaica | 16 | 0.0% |
| Japan | 208 | 0.0% |
| Kazakhstan | 18 | 0.0% |
| Kenya | 35 | 0.0% |
| Korea | 202 | 0.0% |
| Kuwait | 9 | 0.0% |
| Laos | 417 | 0.1% |
| Latin America | 34,751 | 5.6% |
| Latvia | 52 | 0.0% |
| Lebanon | 7 | 0.0% |
| Malaysia | 54 | 0.0% |
| Mexico | 27,800 | 4.5% |
| Micronesia | 259 | 0.0% |
| Middle Africa | 96 | 0.0% |
| Nepal | 51 | 0.0% |
| Netherlands | 41 | 0.0% |
| Nicaragua | 58 | 0.0% |
| Nigeria | 96 | 0.0% |
| Northern Africa | 244 | 0.0% |
| Northern Europe | 363 | 0.1% |
| Norway | 1 | 0.0% |
| Oceania | 393 | 0.1% |
| Pakistan | 53 | 0.0% |
| Panama | 24 | 0.0% |
| Peru | 105 | 0.0% |
| Philippines | 718 | 0.1% |
| Poland | 25 | 0.0% |
| Portugal | 11 | 0.0% |
| Romania | 9 | 0.0% |
| Russia | 164 | 0.0% |
| Scotland | 42 | 0.0% |
| Singapore | 24 | 0.0% |
| Somalia | 255 | 0.0% |
| South Africa | 101 | 0.0% |
| South America | 1,160 | 0.2% |
| South Central Asia | 846 | 0.1% |
| South Eastern Asia | 2,988 | 0.5% |
| Southern Europe | 165 | 0.0% |
| Spain | 82 | 0.0% |
| Sri Lanka | 5 | 0.0% |
| Sudan | 220 | 0.0% |
| Sweden | 16 | 0.0% |
| Taiwan | 71 | 0.0% |
| Thailand | 113 | 0.0% |
| Trinidad and Tobago | 43 | 0.0% |
| Turkey | 19 | 0.0% |
| Ukraine | 89 | 0.0% |
| Uruguay | 13 | 0.0% |
| Venezuela | 361 | 0.1% |
| Vietnam | 1,113 | 0.2% |
| Western Africa | 103 | 0.0% |
| Western Asia | 47 | 0.0% |
| Western Europe | 539 | 0.1% |
| Zaire | 33 | 0.0% |
| Zimbabwe | 23 | 0.0% | View All 103 Rows |
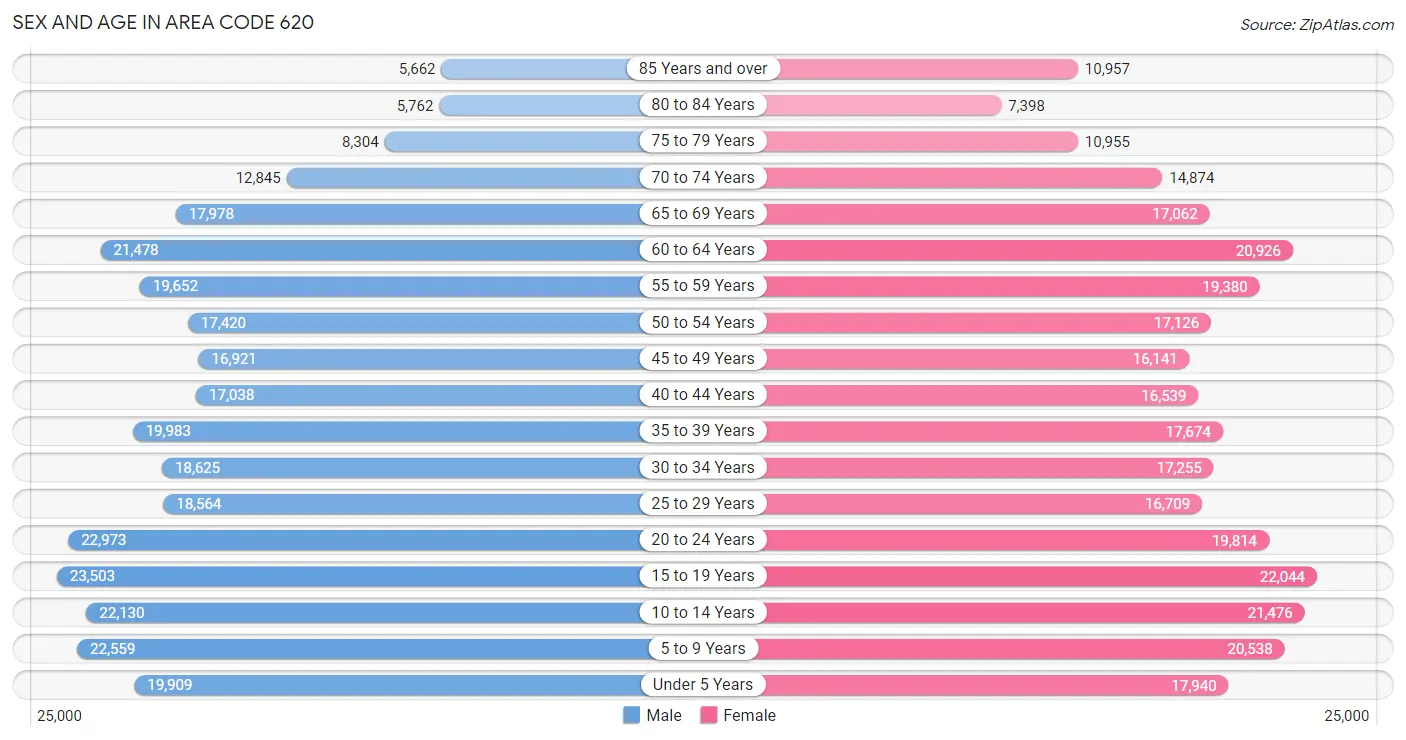
Sex and Age in Area Code 620
Sex and Age in Area Code 620
The most populous age groups in Area Code 620 are 15 to 19 Years (23,503 | 7.5%) for men and 15 to 19 Years (22,044 | 7.2%) for women.
| Age Bracket | Male | Female |
| Under 5 Years | 19,909 (6.4%) | 17,940 (5.9%) |
| 5 to 9 Years | 22,559 (7.2%) | 20,538 (6.7%) |
| 10 to 14 Years | 22,130 (7.1%) | 21,476 (7.0%) |
| 15 to 19 Years | 23,503 (7.5%) | 22,044 (7.2%) |
| 20 to 24 Years | 22,973 (7.4%) | 19,814 (6.5%) |
| 25 to 29 Years | 18,564 (6.0%) | 16,709 (5.5%) |
| 30 to 34 Years | 18,625 (6.0%) | 17,255 (5.7%) |
| 35 to 39 Years | 19,983 (6.4%) | 17,674 (5.8%) |
| 40 to 44 Years | 17,038 (5.5%) | 16,539 (5.4%) |
| 45 to 49 Years | 16,921 (5.4%) | 16,141 (5.3%) |
| 50 to 54 Years | 17,420 (5.6%) | 17,126 (5.6%) |
| 55 to 59 Years | 19,652 (6.3%) | 19,380 (6.4%) |
| 60 to 64 Years | 21,478 (6.9%) | 20,926 (6.9%) |
| 65 to 69 Years | 17,978 (5.8%) | 17,062 (5.6%) |
| 70 to 74 Years | 12,845 (4.1%) | 14,874 (4.9%) |
| 75 to 79 Years | 8,304 (2.7%) | 10,955 (3.6%) |
| 80 to 84 Years | 5,762 (1.8%) | 7,398 (2.4%) |
| 85 Years and over | 5,662 (1.8%) | 10,957 (3.6%) |
| Total | 311,306 (100.0%) | 304,808 (100.0%) |
Families and Households in Area Code 620
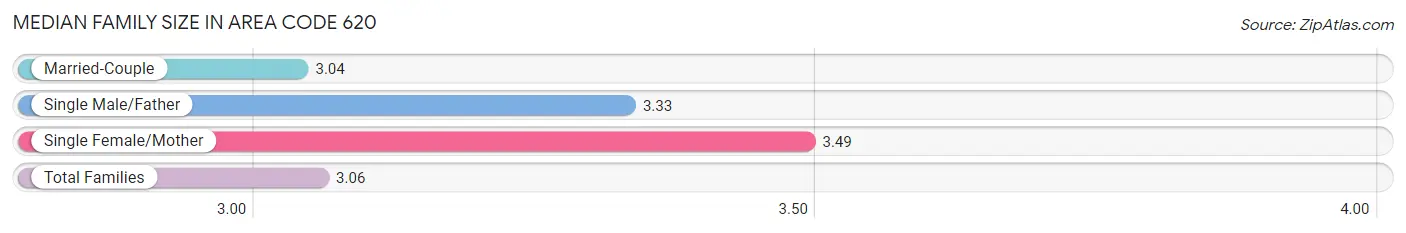
Median Family Size in Area Code 620
The median family size in Area Code 620 is 3.06 persons per family, with single female/mother families (24,144 | 15.8%) accounting for the largest median family size of 3.4905 persons per family. On the other hand, married-couple families (117,345 | 76.8%) represent the smallest median family size with 3.04 persons per family.
| Family Type | # Families | Family Size |
| Married-Couple | 117,345 (76.8%) | 3.04 |
| Single Male/Father | 11,341 (7.4%) | 3.33 |
| Single Female/Mother | 24,144 (15.8%) | 3.49 |
| Total Families | 152,830 (100.0%) | 3.06 |
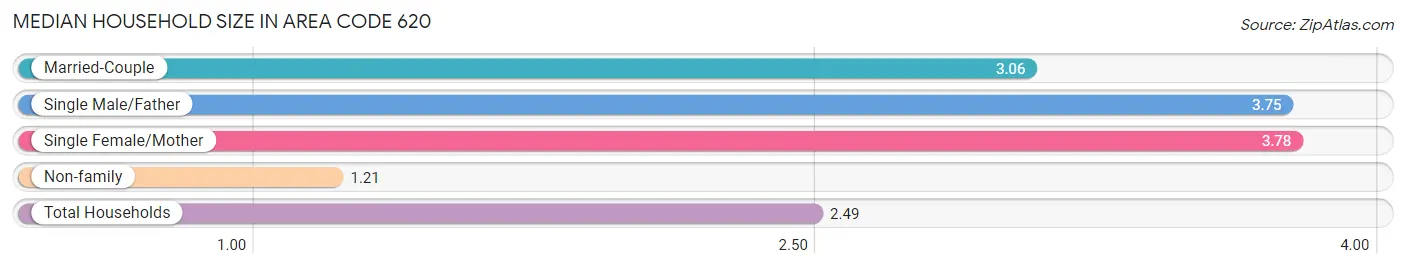
Median Household Size in Area Code 620
The median household size in Area Code 620 is 2.49 persons per household, with single female/mother households (24,144 | 10.1%) accounting for the largest median household size of 3.77579 persons per household. non-family households (86,604 | 36.2%) represent the smallest median household size with 1.21 persons per household.
| Household Type | # Households | Household Size |
| Married-Couple | 117,345 (49.0%) | 3.06 |
| Single Male/Father | 11,341 (4.7%) | 3.75 |
| Single Female/Mother | 24,144 (10.1%) | 3.78 |
| Non-family | 86,604 (36.2%) | 1.21 |
| Total Households | 239,434 (100.0%) | 2.49 |
Household Size by Marriage Status in Area Code 620
Out of a total of 239,434 households in Area Code 620, 152,830 (63.8%) are family households, while 86,604 (36.2%) are nonfamily households. The most numerous type of family households are 2-person households, comprising 74,145, and the most common type of nonfamily households are 1-person households, comprising 73,814.
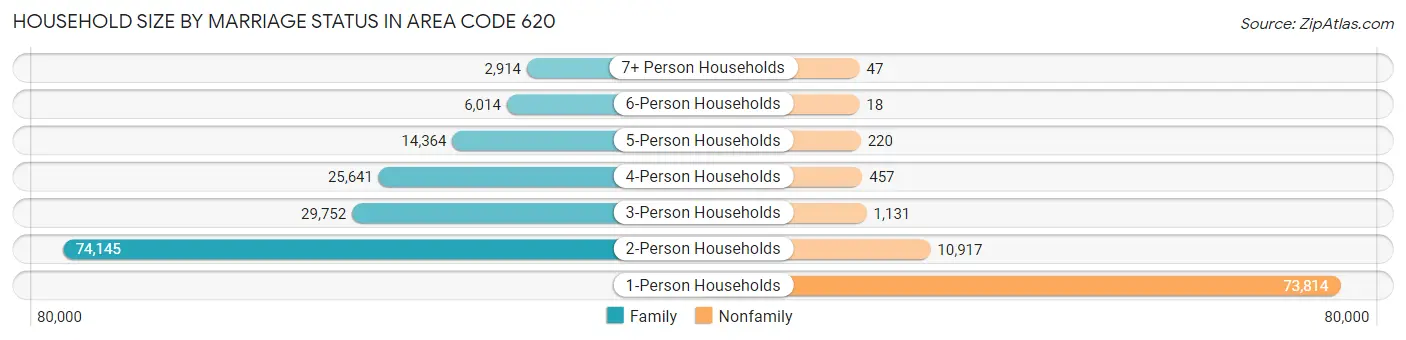
| Household Size | Family Households | Nonfamily Households |
| 1-Person Households | - | 73,814 (30.8%) |
| 2-Person Households | 74,145 (31.0%) | 10,917 (4.6%) |
| 3-Person Households | 29,752 (12.4%) | 1,131 (0.5%) |
| 4-Person Households | 25,641 (10.7%) | 457 (0.2%) |
| 5-Person Households | 14,364 (6.0%) | 220 (0.1%) |
| 6-Person Households | 6,014 (2.5%) | 18 (0.0%) |
| 7+ Person Households | 2,914 (1.2%) | 47 (0.0%) |
| Total | 152,830 (63.8%) | 86,604 (36.2%) |
Female Fertility in Area Code 620
Fertility by Age in Area Code 620
Average fertility rate in Area Code 620 is 93.9 births per 1,000 women. Women in the age bracket of 20 to 34 years have the highest fertility rate with 203.4 births per 1,000 women. Women in the age bracket of 20 to 34 years acount for 76.6% of all women with births.
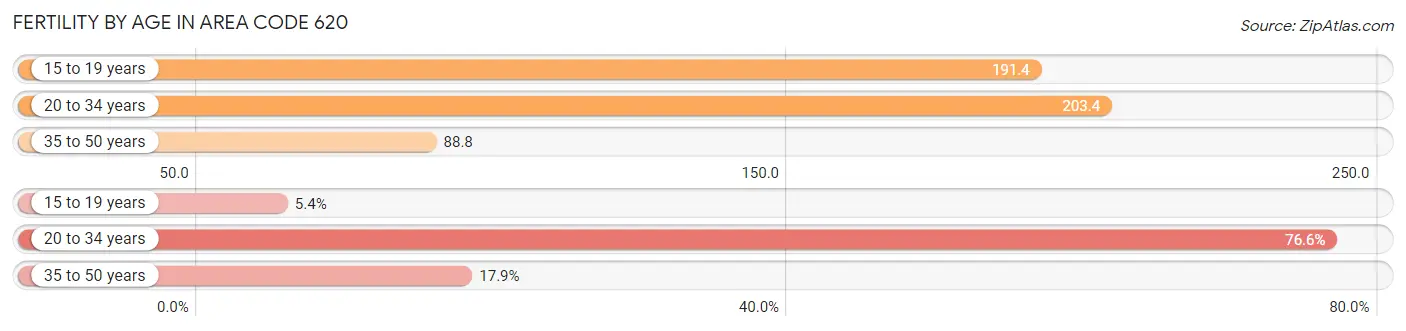
| Age Bracket | Women with Births | Births / 1,000 Women |
| 15 to 19 years | 466 (5.4%) | 191.4 |
| 20 to 34 years | 6,588 (76.6%) | 203.4 |
| 35 to 50 years | 1,542 (17.9%) | 88.8 |
| Total | 8,596 (100.0%) | 93.9 |
Fertility by Age by Marriage Status in Area Code 620
53.5% of women with births (8,596) in Area Code 620 are married. The highest percentage of unmarried women with births falls into 15 to 19 years age bracket with 95.9% of them unmarried at the time of birth, while the lowest percentage of unmarried women with births belong to 20 to 34 years age bracket with 51.5% of them unmarried.
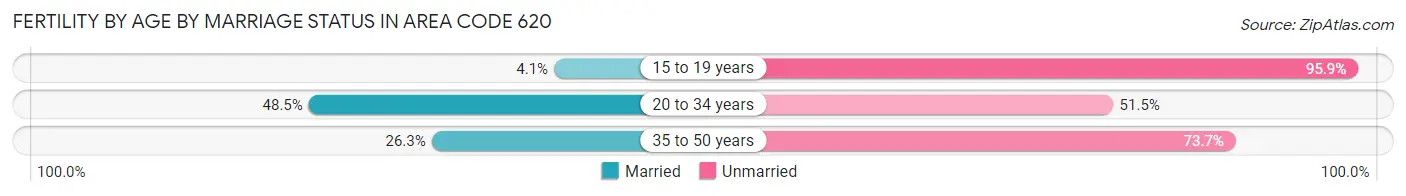
| Age Bracket | Married | Unmarried |
| 15 to 19 years | 19 (4.1%) | 447 (95.9%) |
| 20 to 34 years | 3,198 (48.5%) | 3,390 (51.5%) |
| 35 to 50 years | 405 (26.3%) | 1,137 (73.7%) |
| Total | 4,597 (53.5%) | 3,999 (46.5%) |
Fertility by Education in Area Code 620
Average fertility rate in Area Code 620 is 93.9 births per 1,000 women. Women with the education attainment of graduate degree have the highest fertility rate of 320.0 births per 1,000 women, while women with the education attainment of college or associate's degree have the lowest fertility at 124.1 births per 1,000 women. Women with the education attainment of college or associate's degree represent 33.3% of all women with births.
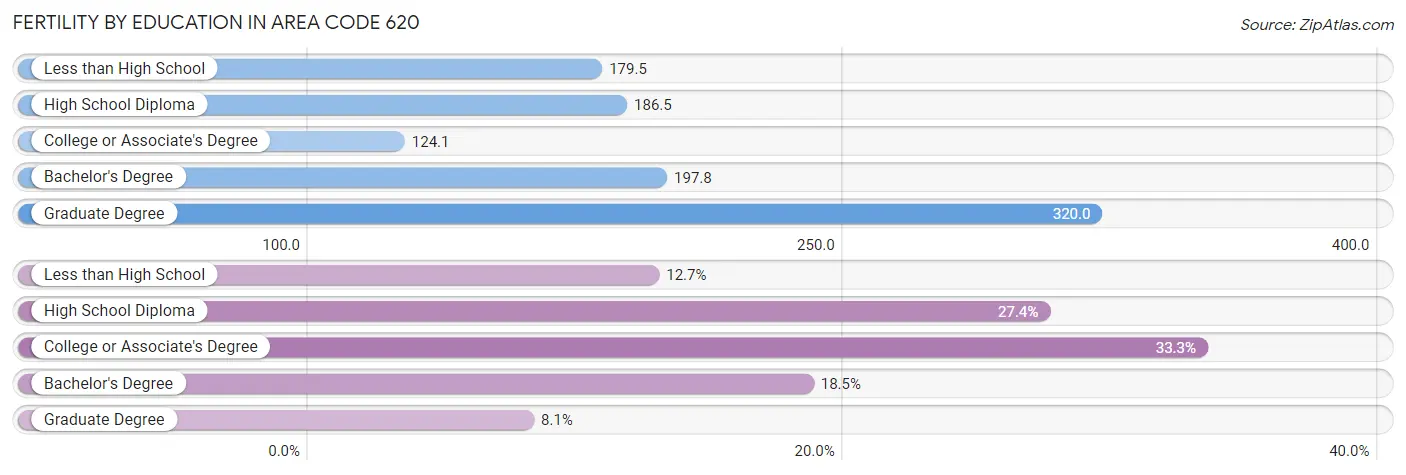
| Educational Attainment | Women with Births | Births / 1,000 Women |
| Less than High School | 1,095 (12.7%) | 179.5 |
| High School Diploma | 2,354 (27.4%) | 186.5 |
| College or Associate's Degree | 2,862 (33.3%) | 124.1 |
| Bachelor's Degree | 1,593 (18.5%) | 197.8 |
| Graduate Degree | 692 (8.1%) | 320.0 |
| Total | 8,596 (100.0%) | 93.9 |
Fertility by Education by Marriage Status in Area Code 620
46.5% of women with births in Area Code 620 are unmarried. Women with the educational attainment of bachelor's degree are most likely to be married with 45.5% of them married at childbirth, while women with the educational attainment of less than high school are least likely to be married with 84.5% of them unmarried at childbirth.
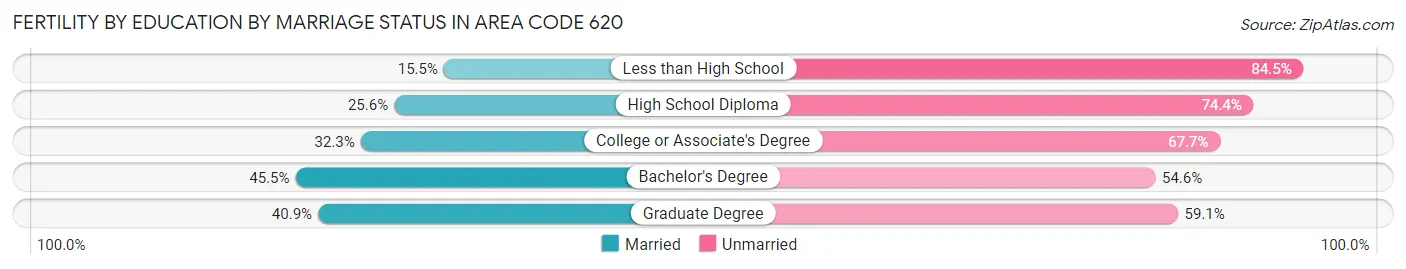
| Educational Attainment | Married | Unmarried |
| Less than High School | 170 (15.5%) | 925 (84.5%) |
| High School Diploma | 602 (25.6%) | 1,752 (74.4%) |
| College or Associate's Degree | 924 (32.3%) | 1,938 (67.7%) |
| Bachelor's Degree | 724 (45.5%) | 869 (54.5%) |
| Graduate Degree | 283 (40.9%) | 409 (59.1%) |
| Total | 4,597 (53.5%) | 3,999 (46.5%) |
Employment Characteristics in Area Code 620
Employment by Class of Employer in Area Code 620
Among the 286,820 employed individuals in Area Code 620, private company employees (183,693 | 64.0%), local government employees (29,436 | 10.3%), and not-for-profit organizations (22,758 | 7.9%) make up the most common classes of employment.
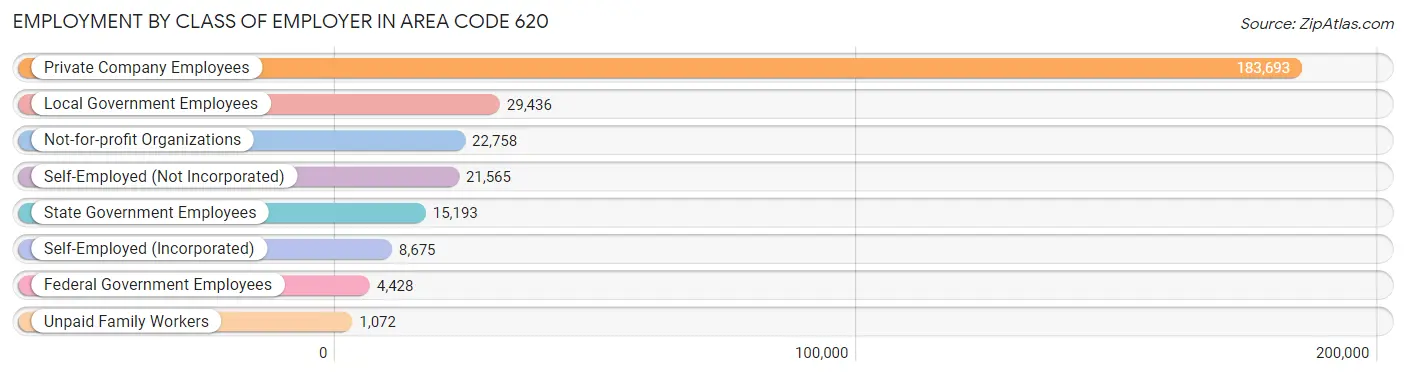
| Employer Class | # Employees | % Employees |
| Private Company Employees | 183,693 | 64.0% |
| Self-Employed (Incorporated) | 8,675 | 3.0% |
| Self-Employed (Not Incorporated) | 21,565 | 7.5% |
| Not-for-profit Organizations | 22,758 | 7.9% |
| Local Government Employees | 29,436 | 10.3% |
| State Government Employees | 15,193 | 5.3% |
| Federal Government Employees | 4,428 | 1.5% |
| Unpaid Family Workers | 1,072 | 0.4% |
| Total | 286,820 | 100.0% |
Employment Status by Age in Area Code 620
According to the labor force statistics for Area Code 620, out of the total population over 16 years of age (483,317), 60.4% or 291,778 individuals are in the labor force, with 4.4% or 12,867 of them unemployed. The age group with the highest labor force participation rate is 25 to 29 years, with 85.0% or 29,993 individuals in the labor force. Within the labor force, the 16 to 19 years age range has the highest percentage of unemployed individuals, with 2,761.0% or 512,469 of them being unemployed.
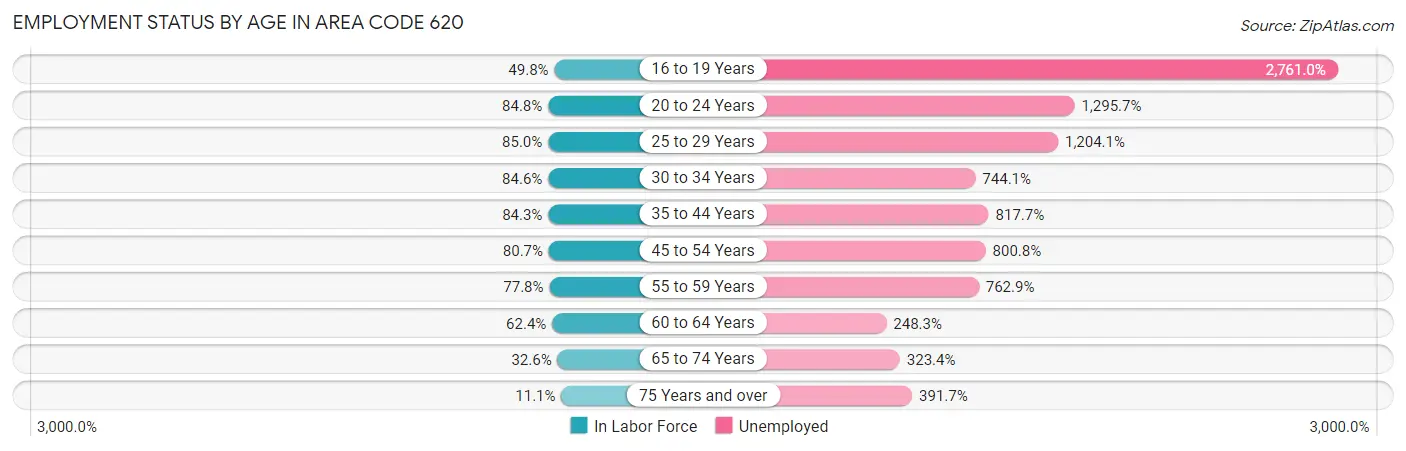
| Age Bracket | In Labor Force | Unemployed |
| 16 to 19 Years | 18,562 (49.8%) | 512,469 (2,761.0%) |
| 20 to 24 Years | 36,277 (84.8%) | 470,015 (1,295.7%) |
| 25 to 29 Years | 29,992 (85.0%) | 361,146 (1,204.1%) |
| 30 to 34 Years | 30,366 (84.6%) | 225,946 (744.1%) |
| 35 to 44 Years | 60,044 (84.3%) | 490,972 (817.7%) |
| 45 to 54 Years | 54,563 (80.7%) | 436,916 (800.8%) |
| 55 to 59 Years | 30,361 (77.8%) | 231,639 (762.9%) |
| 60 to 64 Years | 26,469 (62.4%) | 65,723 (248.3%) |
| 65 to 74 Years | 20,445 (32.6%) | 66,126 (323.4%) |
| 75 Years and over | 5,438 (11.1%) | 21,301 (391.7%) |
| Total | 291,789 (60.4%) | 12,857 (4.4%) |
Employment Status by Educational Attainment in Area Code 620
According to labor force statistics for Area Code 620, 78.0% of individuals (227,374) out of the total population between 25 and 64 years of age (291,431) are in the labor force, with 763.9% or 1,736,910 of them being unemployed. The group with the highest labor force participation rate are those with the educational attainment of bachelor's degree or higher, with 86.0% or 56,129 individuals in the labor force. Within the labor force, individuals with less than high school education have the highest percentage of unemployment, with 1,793.3% or 426,734 of them being unemployed.
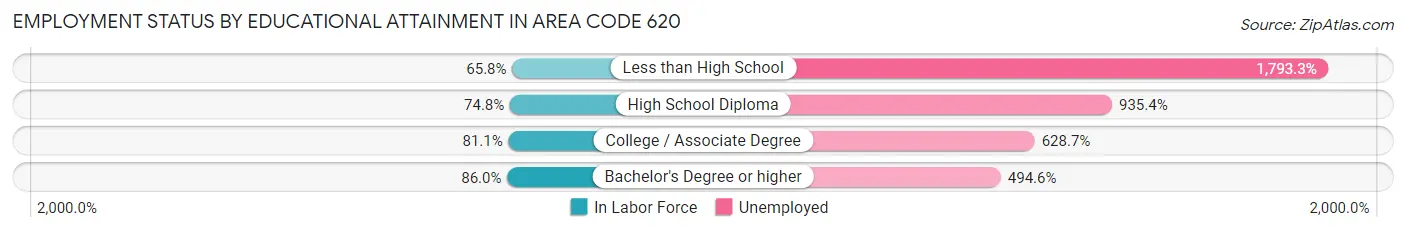
| Educational Attainment | In Labor Force | Unemployed |
| Less than High School | 23,796 (65.8%) | 648,619 (1,793.3%) |
| High School Diploma | 63,190 (74.8%) | 789,805 (935.4%) |
| College / Associate Degree | 85,632 (81.1%) | 663,807 (628.7%) |
| Bachelor's Degree or higher | 56,131 (86.0%) | 322,692 (494.6%) |
| Total | 227,387 (78.0%) | 2,226,241 (763.9%) |
Employment Occupations by Sex in Area Code 620
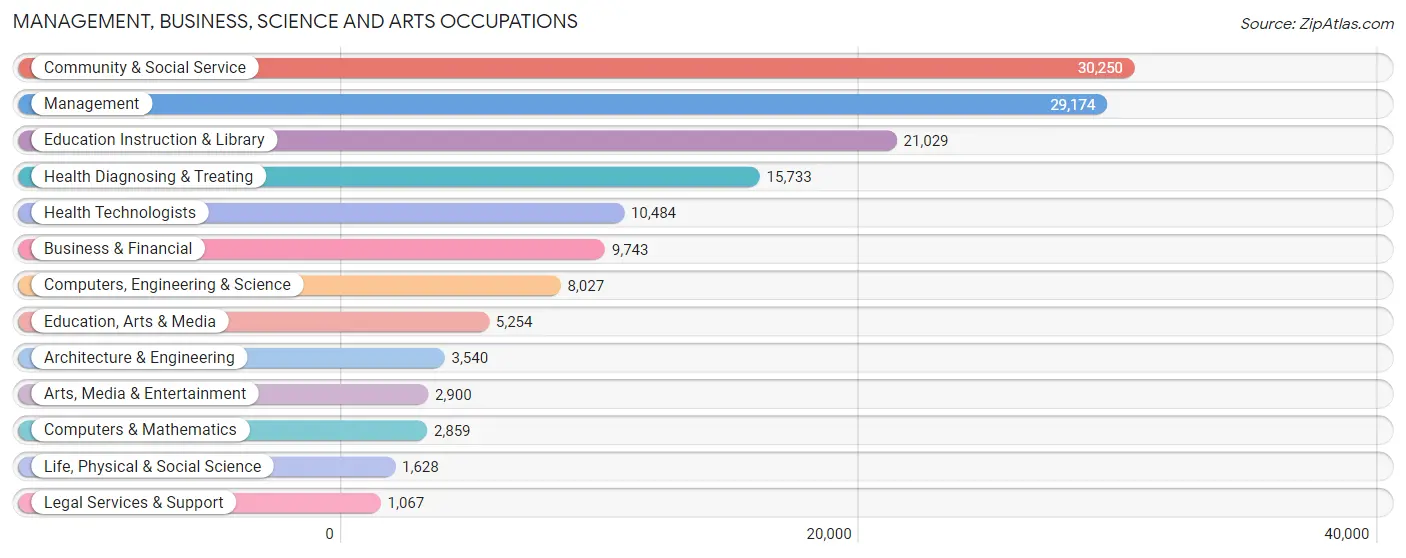
Management, Business, Science and Arts Occupations
The most common Management, Business, Science and Arts occupations in Area Code 620 are Community & Social Service (30,250 | 10.4%), Management (29,174 | 10.0%), Education Instruction & Library (21,029 | 7.2%), Health Diagnosing & Treating (15,733 | 5.4%), and Health Technologists (10,484 | 3.6%).
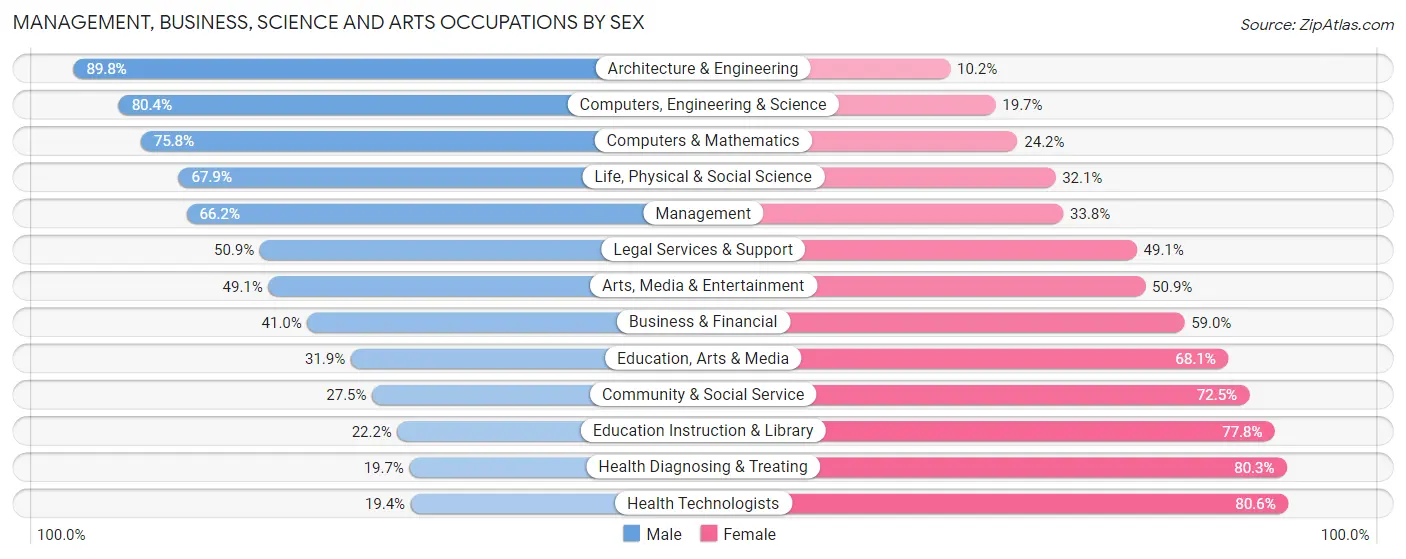
Management, Business, Science and Arts Occupations by Sex
Within the Management, Business, Science and Arts occupations in Area Code 620, the most male-oriented occupations are Architecture & Engineering (89.8%), Computers, Engineering & Science (80.3%), and Computers & Mathematics (75.8%), while the most female-oriented occupations are Health Technologists (80.6%), Health Diagnosing & Treating (80.3%), and Education Instruction & Library (77.8%).
| Occupation | Male | Female |
| Management | 19,320 (66.2%) | 9,854 (33.8%) |
| Business & Financial | 3,991 (41.0%) | 5,752 (59.0%) |
| Computers, Engineering & Science | 6,450 (80.3%) | 1,577 (19.7%) |
| Computers & Mathematics | 2,166 (75.8%) | 693 (24.2%) |
| Architecture & Engineering | 3,179 (89.8%) | 361 (10.2%) |
| Life, Physical & Social Science | 1,105 (67.9%) | 523 (32.1%) |
| Community & Social Service | 8,306 (27.5%) | 21,944 (72.5%) |
| Education, Arts & Media | 1,676 (31.9%) | 3,578 (68.1%) |
| Legal Services & Support | 543 (50.9%) | 524 (49.1%) |
| Education Instruction & Library | 4,663 (22.2%) | 16,366 (77.8%) |
| Arts, Media & Entertainment | 1,424 (49.1%) | 1,476 (50.9%) |
| Health Diagnosing & Treating | 3,095 (19.7%) | 12,638 (80.3%) |
| Health Technologists | 2,035 (19.4%) | 8,449 (80.6%) |
| Total (Category) | 41,162 (44.3%) | 51,765 (55.7%) |
| Total (Overall) | 157,533 (53.9%) | 134,523 (46.1%) |
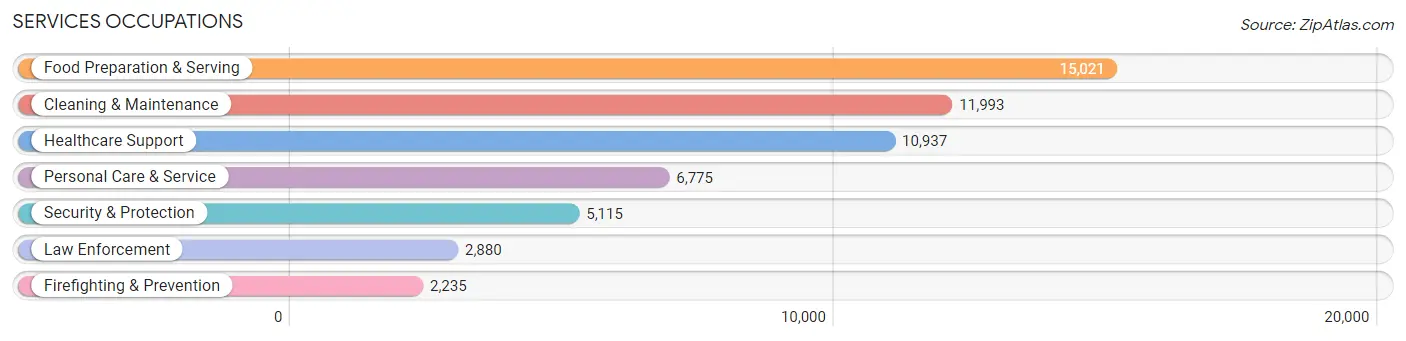
Services Occupations
The most common Services occupations in Area Code 620 are Food Preparation & Serving (15,021 | 5.1%), Cleaning & Maintenance (11,993 | 4.1%), Healthcare Support (10,937 | 3.7%), Personal Care & Service (6,775 | 2.3%), and Security & Protection (5,115 | 1.8%).
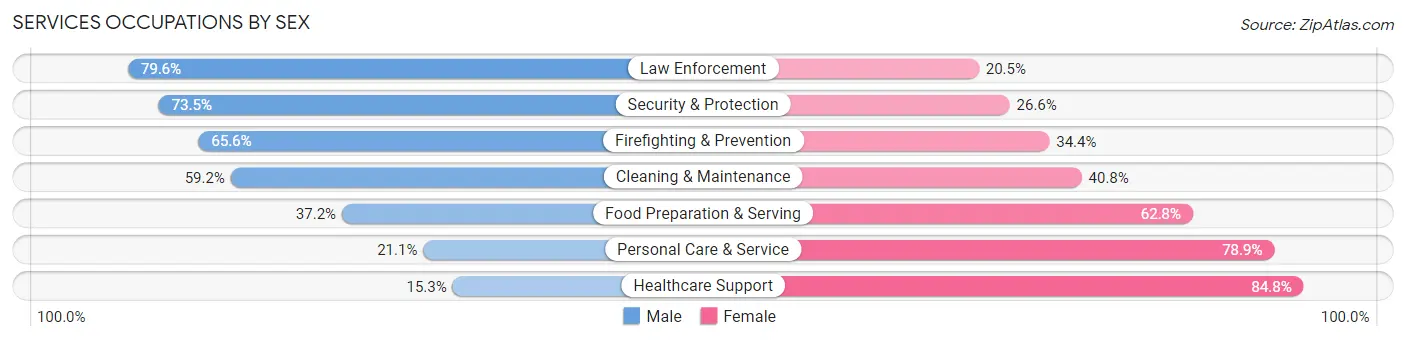
Services Occupations by Sex
Within the Services occupations in Area Code 620, the most male-oriented occupations are Law Enforcement (79.5%), Security & Protection (73.5%), and Firefighting & Prevention (65.6%), while the most female-oriented occupations are Healthcare Support (84.8%), Personal Care & Service (78.9%), and Food Preparation & Serving (62.8%).
| Occupation | Male | Female |
| Healthcare Support | 1,668 (15.2%) | 9,269 (84.8%) |
| Security & Protection | 3,757 (73.5%) | 1,358 (26.6%) |
| Firefighting & Prevention | 1,466 (65.6%) | 769 (34.4%) |
| Law Enforcement | 2,291 (79.5%) | 589 (20.4%) |
| Food Preparation & Serving | 5,584 (37.2%) | 9,437 (62.8%) |
| Cleaning & Maintenance | 7,099 (59.2%) | 4,894 (40.8%) |
| Personal Care & Service | 1,427 (21.1%) | 5,348 (78.9%) |
| Total (Category) | 19,535 (39.2%) | 30,306 (60.8%) |
| Total (Overall) | 157,533 (53.9%) | 134,523 (46.1%) |
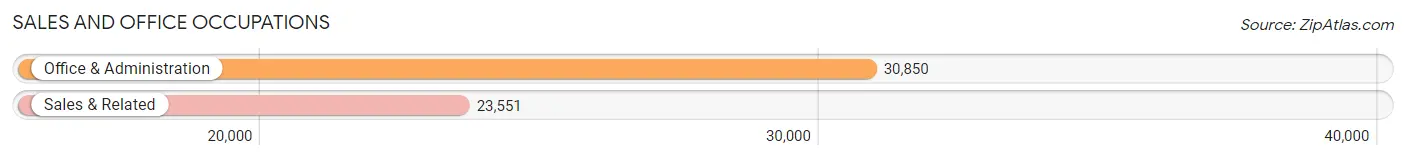
Sales and Office Occupations
The most common Sales and Office occupations in Area Code 620 are Office & Administration (30,850 | 10.6%), and Sales & Related (23,551 | 8.1%).
Sales and Office Occupations by Sex
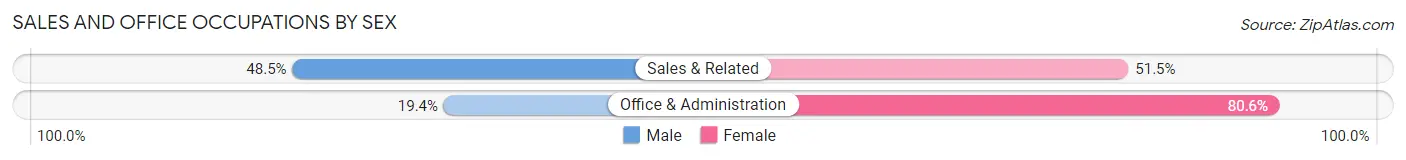
| Occupation | Male | Female |
| Sales & Related | 11,422 (48.5%) | 12,129 (51.5%) |
| Office & Administration | 5,977 (19.4%) | 24,873 (80.6%) |
| Total (Category) | 17,399 (32.0%) | 37,002 (68.0%) |
| Total (Overall) | 157,533 (53.9%) | 134,523 (46.1%) |
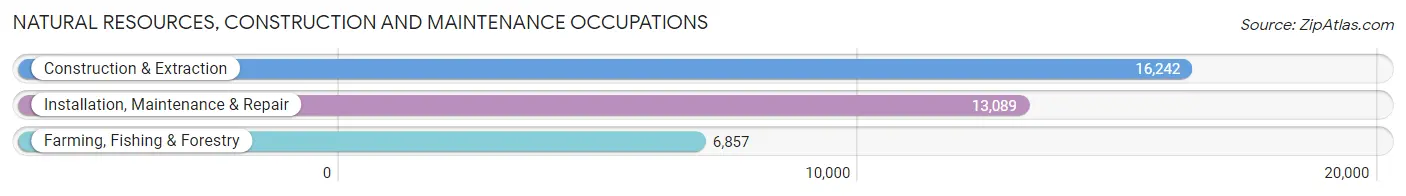
Natural Resources, Construction and Maintenance Occupations
The most common Natural Resources, Construction and Maintenance occupations in Area Code 620 are Construction & Extraction (16,242 | 5.6%), Installation, Maintenance & Repair (13,089 | 4.5%), and Farming, Fishing & Forestry (6,857 | 2.4%).
Natural Resources, Construction and Maintenance Occupations by Sex
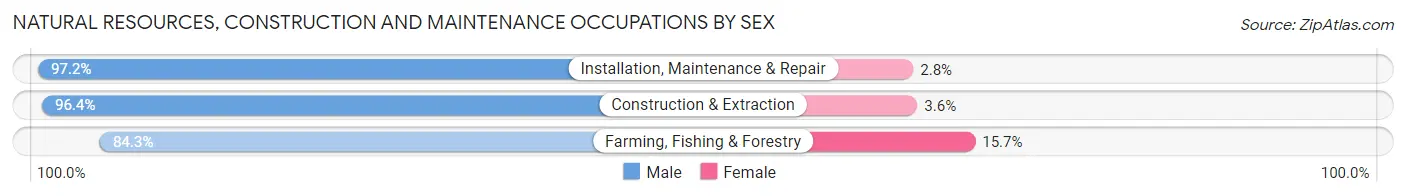
| Occupation | Male | Female |
| Farming, Fishing & Forestry | 5,781 (84.3%) | 1,076 (15.7%) |
| Construction & Extraction | 15,650 (96.4%) | 592 (3.6%) |
| Installation, Maintenance & Repair | 12,724 (97.2%) | 365 (2.8%) |
| Total (Category) | 34,155 (94.4%) | 2,033 (5.6%) |
| Total (Overall) | 157,533 (53.9%) | 134,523 (46.1%) |
Production, Transportation and Moving Occupations
The most common Production, Transportation and Moving occupations in Area Code 620 are Production (30,881 | 10.6%), Material Moving (14,126 | 4.8%), and Transportation (13,692 | 4.7%).
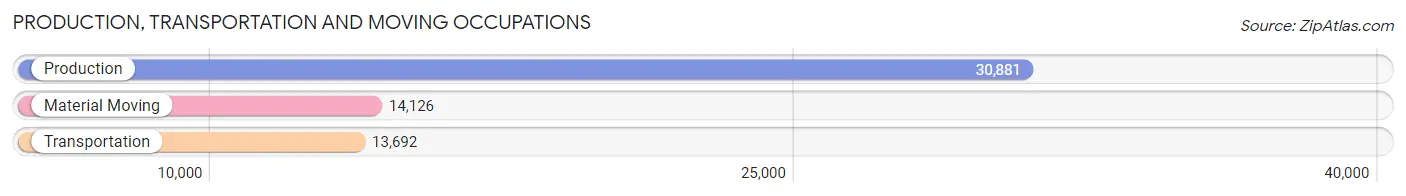
Production, Transportation and Moving Occupations by Sex
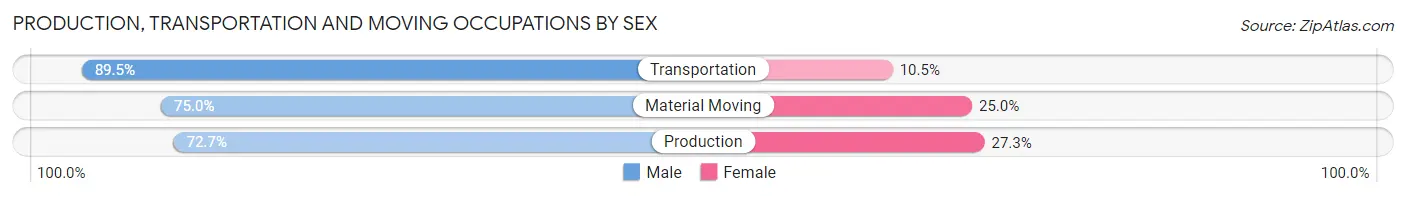
| Occupation | Male | Female |
| Production | 22,437 (72.7%) | 8,444 (27.3%) |
| Transportation | 12,256 (89.5%) | 1,436 (10.5%) |
| Material Moving | 10,589 (75.0%) | 3,537 (25.0%) |
| Total (Category) | 45,282 (77.1%) | 13,417 (22.9%) |
| Total (Overall) | 157,533 (53.9%) | 134,523 (46.1%) |
Employment Industries by Sex in Area Code 620
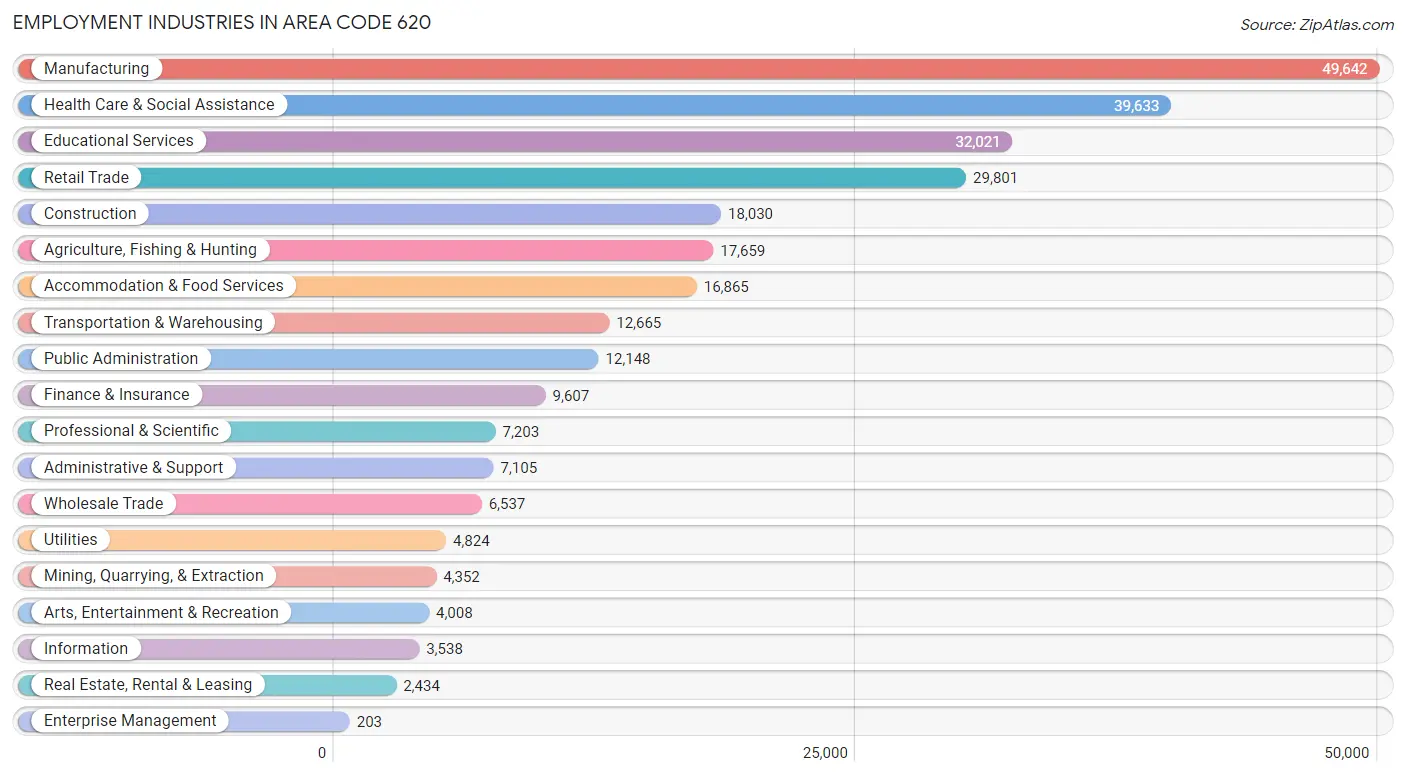
Employment Industries in Area Code 620
The major employment industries in Area Code 620 include Manufacturing (49,642 | 17.0%), Health Care & Social Assistance (39,633 | 13.6%), Educational Services (32,021 | 11.0%), Retail Trade (29,801 | 10.2%), and Construction (18,030 | 6.2%).
Employment Industries by Sex in Area Code 620
The Area Code 620 industries that see more men than women are Construction (91.7%), Mining, Quarrying, & Extraction (91.1%), and Utilities (85.6%), whereas the industries that tend to have a higher number of women are Health Care & Social Assistance (82.1%), Educational Services (71.7%), and Finance & Insurance (68.5%).
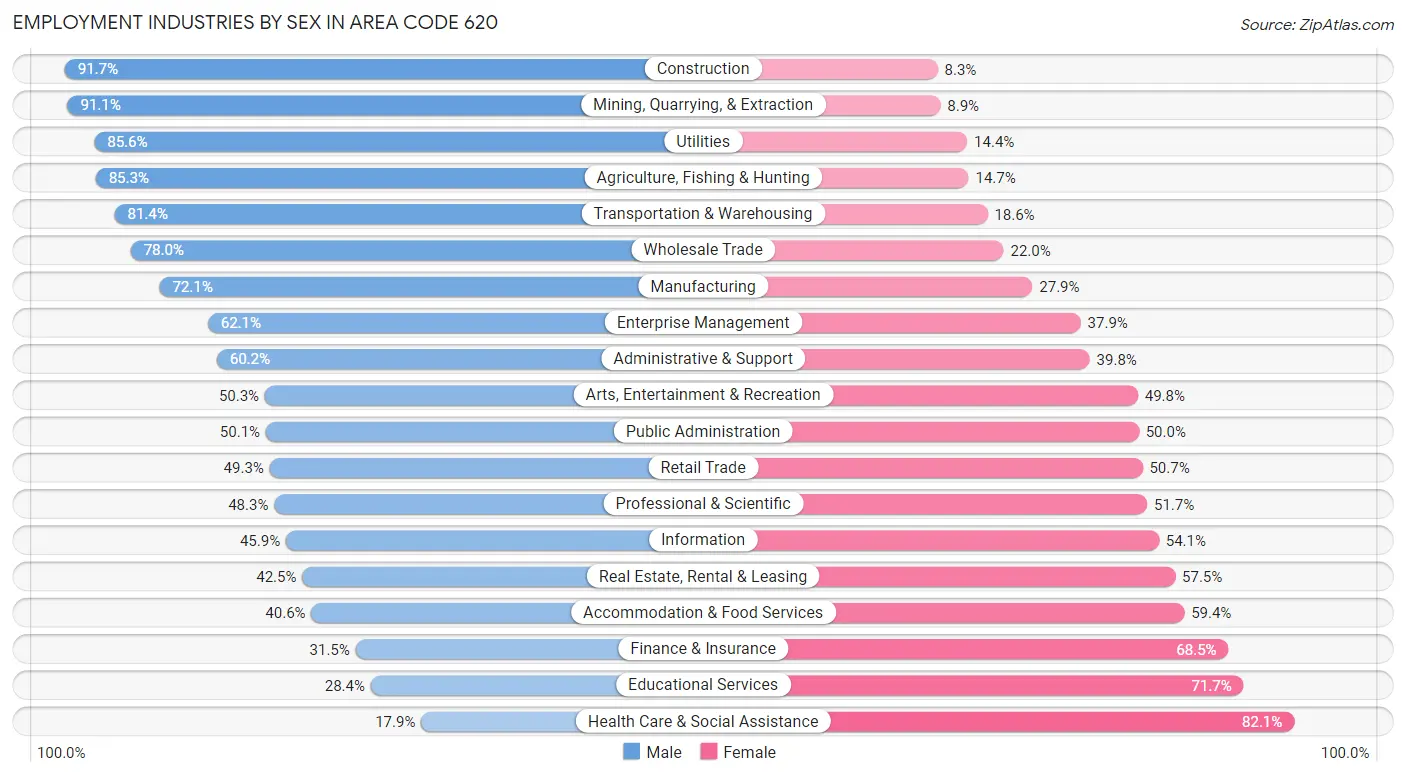
| Industry | Male | Female |
| Agriculture, Fishing & Hunting | 15,059 (85.3%) | 2,600 (14.7%) |
| Mining, Quarrying, & Extraction | 3,965 (91.1%) | 387 (8.9%) |
| Construction | 16,530 (91.7%) | 1,500 (8.3%) |
| Manufacturing | 35,778 (72.1%) | 13,864 (27.9%) |
| Wholesale Trade | 5,101 (78.0%) | 1,436 (22.0%) |
| Retail Trade | 14,687 (49.3%) | 15,114 (50.7%) |
| Transportation & Warehousing | 10,306 (81.4%) | 2,359 (18.6%) |
| Utilities | 4,128 (85.6%) | 696 (14.4%) |
| Information | 1,624 (45.9%) | 1,914 (54.1%) |
| Finance & Insurance | 3,025 (31.5%) | 6,582 (68.5%) |
| Real Estate, Rental & Leasing | 1,035 (42.5%) | 1,399 (57.5%) |
| Professional & Scientific | 3,481 (48.3%) | 3,722 (51.7%) |
| Enterprise Management | 126 (62.1%) | 77 (37.9%) |
| Administrative & Support | 4,278 (60.2%) | 2,827 (39.8%) |
| Educational Services | 9,077 (28.3%) | 22,944 (71.7%) |
| Health Care & Social Assistance | 7,095 (17.9%) | 32,538 (82.1%) |
| Arts, Entertainment & Recreation | 2,014 (50.2%) | 1,994 (49.7%) |
| Accommodation & Food Services | 6,854 (40.6%) | 10,011 (59.4%) |
| Public Administration | 6,080 (50.0%) | 6,068 (49.9%) |
| Total | 157,533 (53.9%) | 134,523 (46.1%) |
Education in Area Code 620
School Enrollment in Area Code 620
The most common levels of schooling among the 155,125 students in Area Code 620 are high school (34,551 | 22.3%), elementary school (34,154 | 22.0%), and middle school (33,971 | 21.9%).
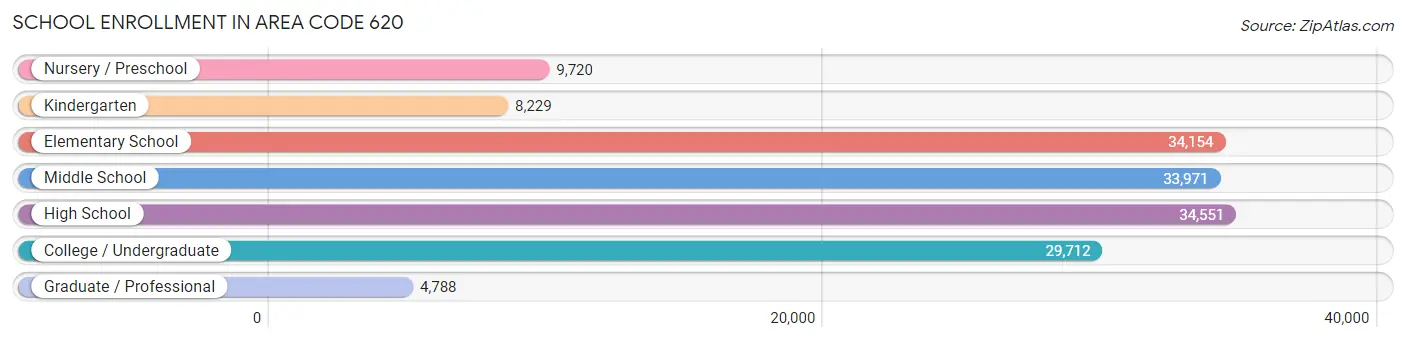
| School Level | # Students | % Students |
| Nursery / Preschool | 9,720 | 6.3% |
| Kindergarten | 8,229 | 5.3% |
| Elementary School | 34,154 | 22.0% |
| Middle School | 33,971 | 21.9% |
| High School | 34,551 | 22.3% |
| College / Undergraduate | 29,712 | 19.2% |
| Graduate / Professional | 4,788 | 3.1% |
| Total | 155,125 | 100.0% |
School Enrollment by Age by Funding Source in Area Code 620
Out of a total of 155,125 students who are enrolled in schools in Area Code 620, 17,832 (11.5%) attend a private institution, while the remaining 137,293 (88.5%) are enrolled in public schools. The age group of 35 years and over has the highest likelihood of being enrolled in private schools, with 1,291 (21.7% in the age bracket) enrolled. Conversely, the age group of 15 to 17 year olds has the lowest likelihood of being enrolled in a private school, with 23,454 (92.9% in the age bracket) attending a public institution.
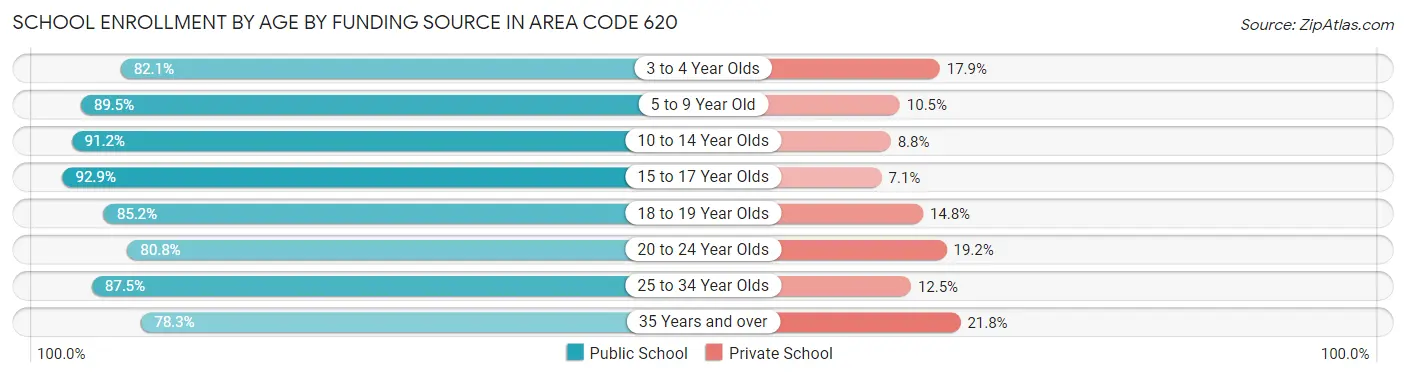
| Age Bracket | Public School | Private School |
| 3 to 4 Year Olds | 5,409 (82.1%) | 1,180 (17.9%) |
| 5 to 9 Year Old | 36,455 (89.5%) | 4,262 (10.5%) |
| 10 to 14 Year Olds | 38,680 (91.2%) | 3,717 (8.8%) |
| 15 to 17 Year Olds | 23,454 (92.9%) | 1,783 (7.1%) |
| 18 to 19 Year Olds | 11,895 (85.2%) | 2,061 (14.8%) |
| 20 to 24 Year Olds | 11,993 (80.8%) | 2,843 (19.2%) |
| 25 to 34 Year Olds | 4,773 (87.5%) | 684 (12.5%) |
| 35 Years and over | 4,645 (78.2%) | 1,291 (21.7%) |
| Total | 137,293 (88.5%) | 17,832 (11.5%) |
Educational Attainment by Field of Study in Area Code 620
Education (23,591 | 24.2%), business (16,671 | 17.1%), science & technology (11,760 | 12.1%), bio, nature & agricultural (10,362 | 10.6%), and arts & humanities (6,583 | 6.8%) are the most common fields of study among 97,426 individuals in Area Code 620 who have obtained a bachelor's degree or higher.
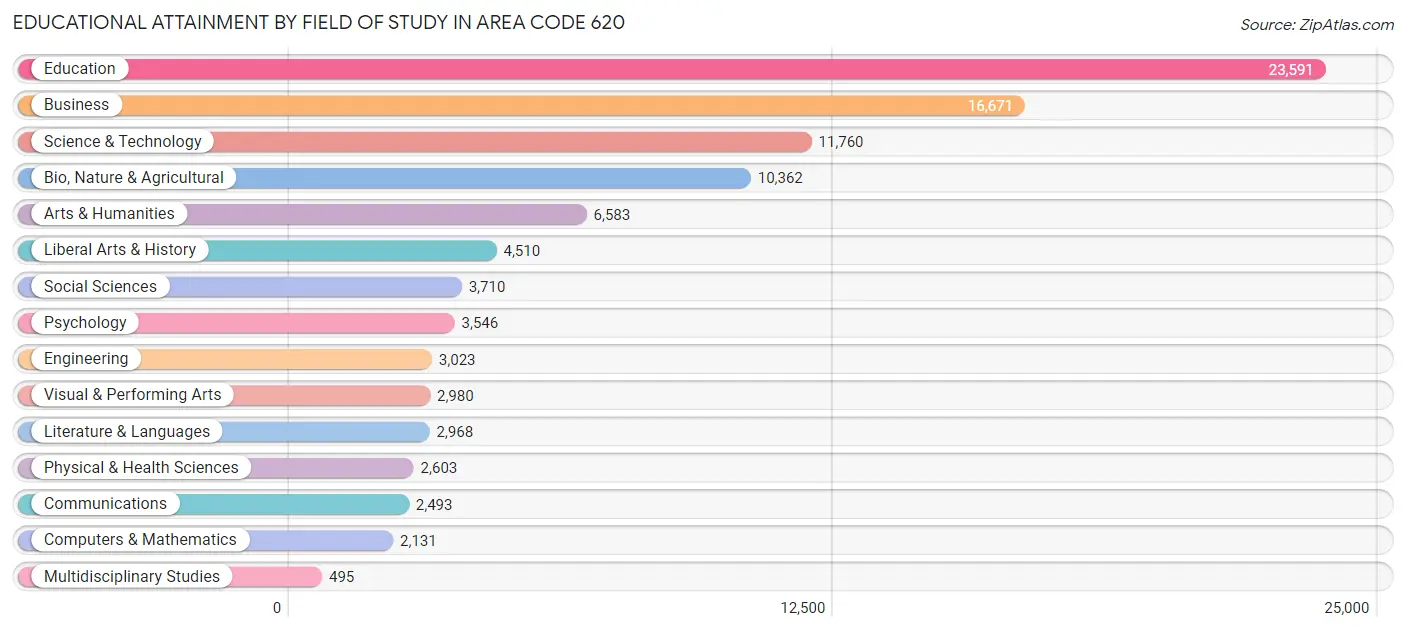
| Field of Study | # Graduates | % Graduates |
| Computers & Mathematics | 2,131 | 2.2% |
| Bio, Nature & Agricultural | 10,362 | 10.6% |
| Physical & Health Sciences | 2,603 | 2.7% |
| Psychology | 3,546 | 3.6% |
| Social Sciences | 3,710 | 3.8% |
| Engineering | 3,023 | 3.1% |
| Multidisciplinary Studies | 495 | 0.5% |
| Science & Technology | 11,760 | 12.1% |
| Business | 16,671 | 17.1% |
| Education | 23,591 | 24.2% |
| Literature & Languages | 2,968 | 3.0% |
| Liberal Arts & History | 4,510 | 4.6% |
| Visual & Performing Arts | 2,980 | 3.1% |
| Communications | 2,493 | 2.6% |
| Arts & Humanities | 6,583 | 6.8% |
| Total | 97,426 | 100.0% |
Transportation & Commute in Area Code 620
Vehicle Availability by Sex in Area Code 620
The most prevalent vehicle ownership categories in Area Code 620 are males with 2 vehicles (56,602, accounting for 36.8%) and females with 2 vehicles (46,207, making up 43.7%).
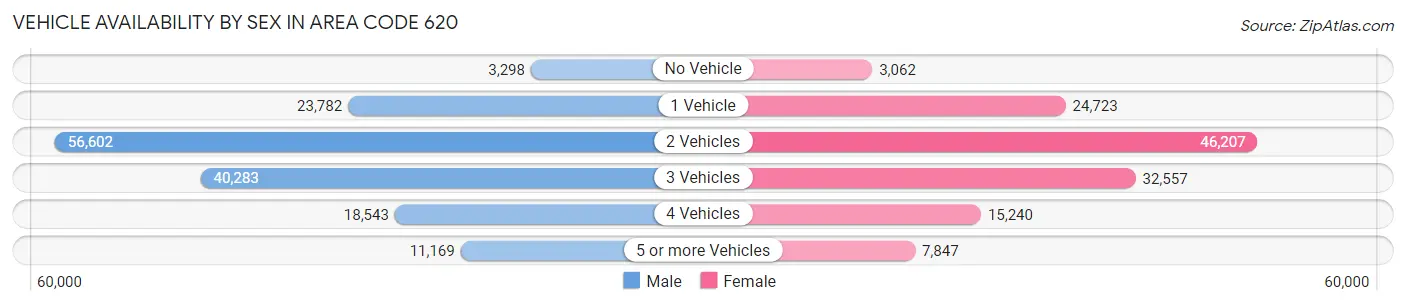
| Vehicles Available | Male | Female |
| No Vehicle | 3,298 (2.1%) | 3,062 (2.4%) |
| 1 Vehicle | 23,782 (15.5%) | 24,723 (19.1%) |
| 2 Vehicles | 56,602 (36.8%) | 46,207 (35.6%) |
| 3 Vehicles | 40,283 (26.2%) | 32,557 (25.1%) |
| 4 Vehicles | 18,543 (12.1%) | 15,240 (11.8%) |
| 5 or more Vehicles | 11,169 (7.3%) | 7,847 (6.0%) |
| Total | 153,677 (100.0%) | 129,636 (100.0%) |
Commute Time in Area Code 620
The most frequently occuring commute durations in Area Code 620 are 5 to 9 minutes (69,029 commuters, 25.4%), 10 to 14 minutes (53,290 commuters, 19.6%), and 15 to 19 minutes (34,986 commuters, 12.9%).
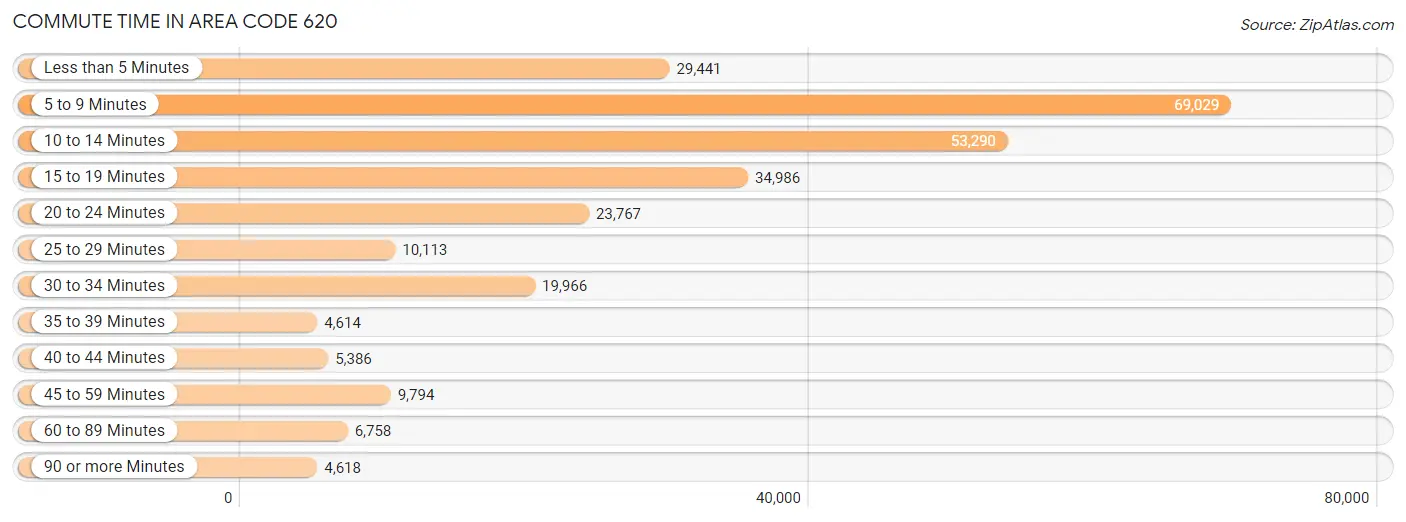
| Commute Time | # Commuters | % Commuters |
| Less than 5 Minutes | 29,441 | 10.8% |
| 5 to 9 Minutes | 69,029 | 25.4% |
| 10 to 14 Minutes | 53,290 | 19.6% |
| 15 to 19 Minutes | 34,986 | 12.9% |
| 20 to 24 Minutes | 23,767 | 8.7% |
| 25 to 29 Minutes | 10,113 | 3.7% |
| 30 to 34 Minutes | 19,966 | 7.3% |
| 35 to 39 Minutes | 4,614 | 1.7% |
| 40 to 44 Minutes | 5,386 | 2.0% |
| 45 to 59 Minutes | 9,794 | 3.6% |
| 60 to 89 Minutes | 6,758 | 2.5% |
| 90 or more Minutes | 4,618 | 1.7% |
Commute Time by Sex in Area Code 620
The most common commute times in Area Code 620 are 5 to 9 minutes (34,123 commuters, 23.0%) for males and 5 to 9 minutes (34,906 commuters, 28.3%) for females.
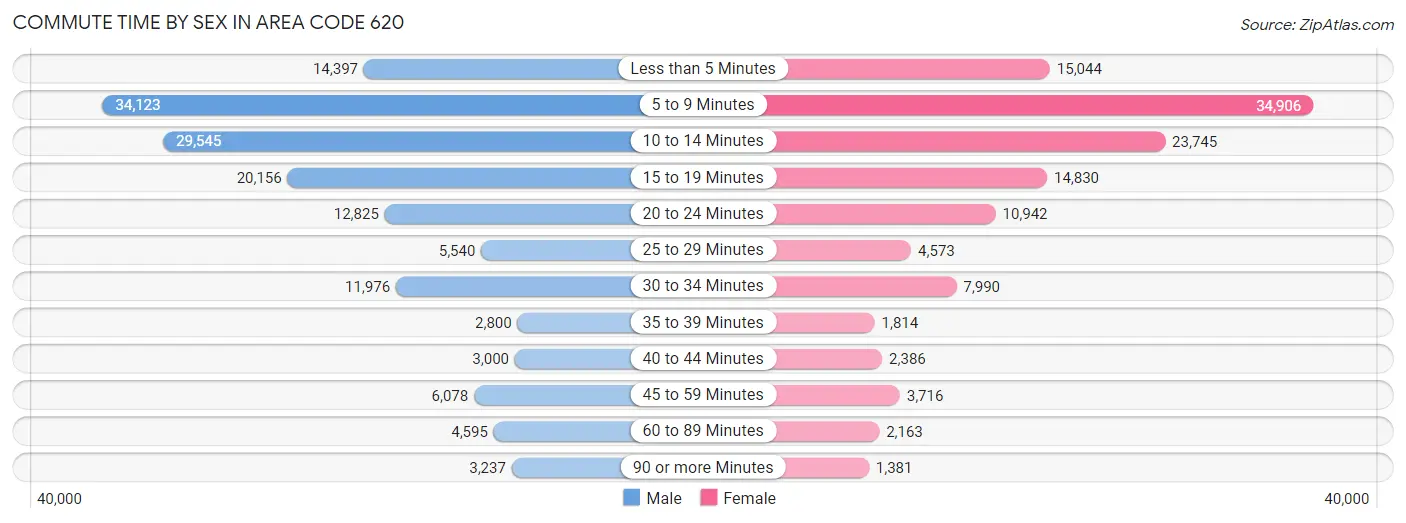
| Commute Time | Male | Female |
| Less than 5 Minutes | 14,397 (9.7%) | 15,044 (12.2%) |
| 5 to 9 Minutes | 34,123 (23.0%) | 34,906 (28.3%) |
| 10 to 14 Minutes | 29,545 (19.9%) | 23,745 (19.2%) |
| 15 to 19 Minutes | 20,156 (13.6%) | 14,830 (12.0%) |
| 20 to 24 Minutes | 12,825 (8.6%) | 10,942 (8.9%) |
| 25 to 29 Minutes | 5,540 (3.7%) | 4,573 (3.7%) |
| 30 to 34 Minutes | 11,976 (8.1%) | 7,990 (6.5%) |
| 35 to 39 Minutes | 2,800 (1.9%) | 1,814 (1.5%) |
| 40 to 44 Minutes | 3,000 (2.0%) | 2,386 (1.9%) |
| 45 to 59 Minutes | 6,078 (4.1%) | 3,716 (3.0%) |
| 60 to 89 Minutes | 4,595 (3.1%) | 2,163 (1.8%) |
| 90 or more Minutes | 3,237 (2.2%) | 1,381 (1.1%) |
Time of Departure to Work by Sex in Area Code 620
The most frequent times of departure to work in Area Code 620 are 7:30 AM to 7:59 AM (22,016, 14.8%) for males and 7:30 AM to 7:59 AM (26,361, 21.3%) for females.
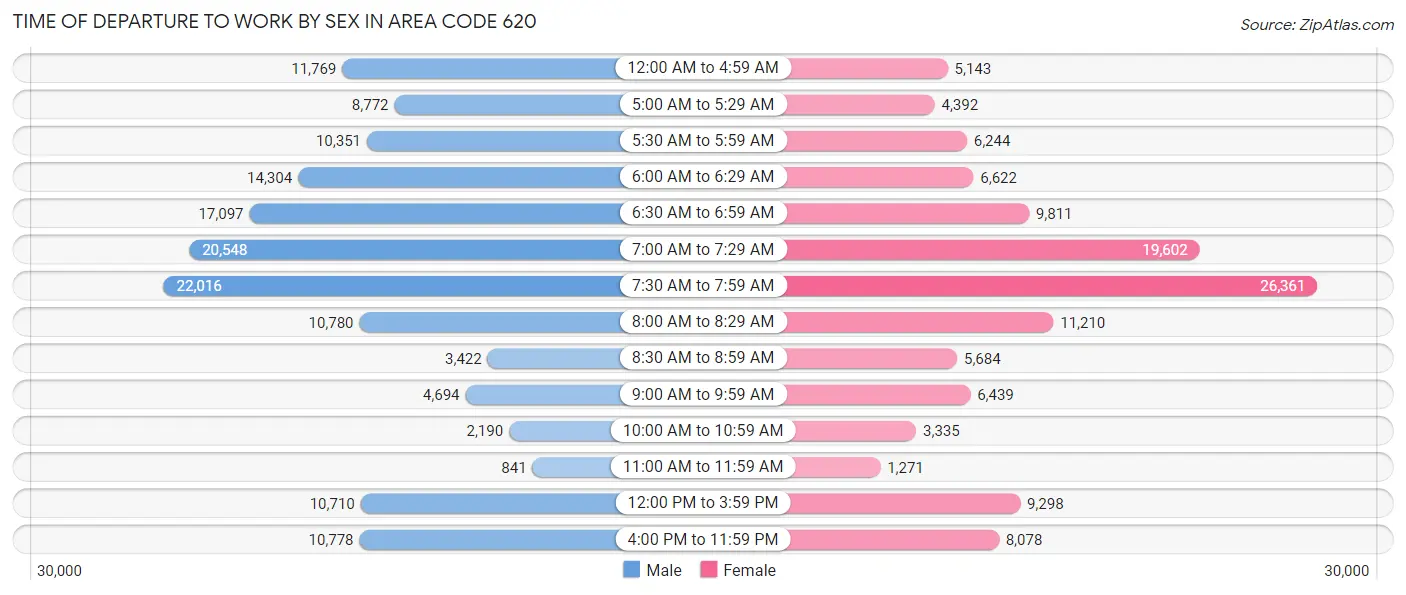
| Time of Departure | Male | Female |
| 12:00 AM to 4:59 AM | 11,769 (7.9%) | 5,143 (4.2%) |
| 5:00 AM to 5:29 AM | 8,772 (5.9%) | 4,392 (3.6%) |
| 5:30 AM to 5:59 AM | 10,351 (7.0%) | 6,244 (5.1%) |
| 6:00 AM to 6:29 AM | 14,304 (9.7%) | 6,622 (5.4%) |
| 6:30 AM to 6:59 AM | 17,097 (11.5%) | 9,811 (7.9%) |
| 7:00 AM to 7:29 AM | 20,548 (13.9%) | 19,602 (15.9%) |
| 7:30 AM to 7:59 AM | 22,016 (14.8%) | 26,361 (21.3%) |
| 8:00 AM to 8:29 AM | 10,780 (7.3%) | 11,210 (9.1%) |
| 8:30 AM to 8:59 AM | 3,422 (2.3%) | 5,684 (4.6%) |
| 9:00 AM to 9:59 AM | 4,694 (3.2%) | 6,439 (5.2%) |
| 10:00 AM to 10:59 AM | 2,190 (1.5%) | 3,335 (2.7%) |
| 11:00 AM to 11:59 AM | 841 (0.6%) | 1,271 (1.0%) |
| 12:00 PM to 3:59 PM | 10,710 (7.2%) | 9,298 (7.5%) |
| 4:00 PM to 11:59 PM | 10,778 (7.3%) | 8,078 (6.5%) |
| Total | 148,272 (100.0%) | 123,490 (100.0%) |
Housing Occupancy in Area Code 620
Occupancy by Ownership in Area Code 620
Of the total 239,434 dwellings in Area Code 620, owner-occupied units account for 168,024 (70.2%), while renter-occupied units make up 71,410 (29.8%).
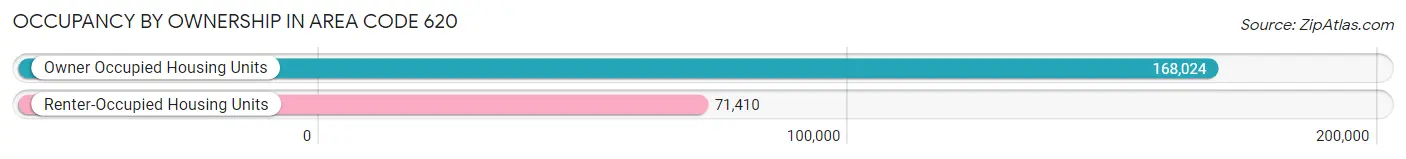
| Occupancy | # Housing Units | % Housing Units |
| Owner Occupied Housing Units | 168,024 | 70.2% |
| Renter-Occupied Housing Units | 71,410 | 29.8% |
| Total Occupied Housing Units | 239,434 | 100.0% |
Occupancy by Household Size in Area Code 620
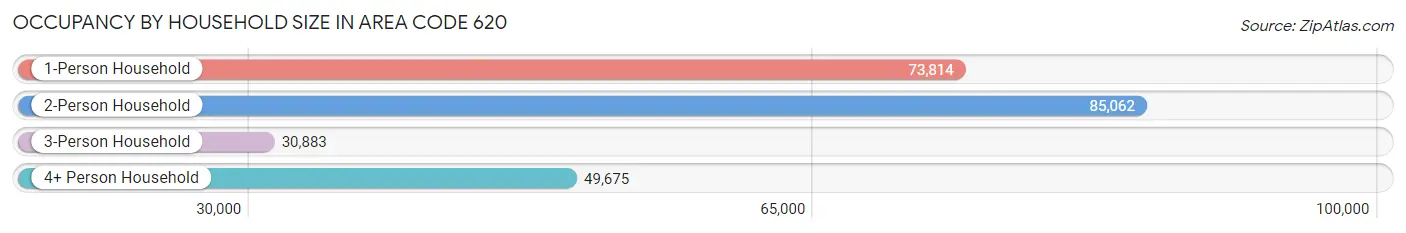
| Household Size | # Housing Units | % Housing Units |
| 1-Person Household | 73,814 | 30.8% |
| 2-Person Household | 85,062 | 35.5% |
| 3-Person Household | 30,883 | 12.9% |
| 4+ Person Household | 49,675 | 20.7% |
| Total Housing Units | 239,434 | 100.0% |
Occupancy by Ownership by Household Size in Area Code 620
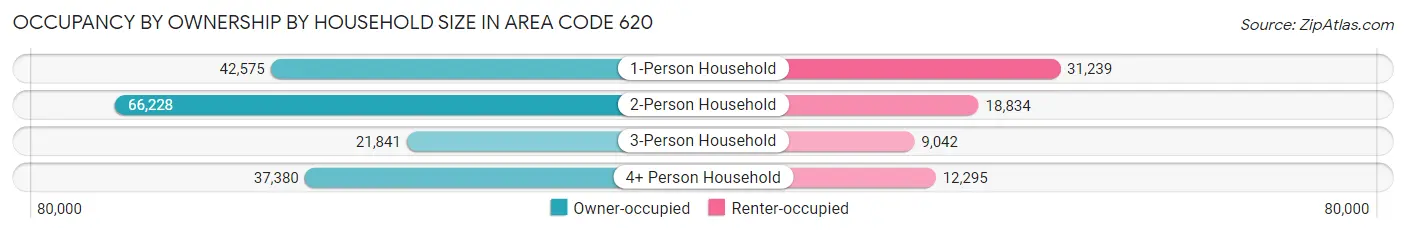
| Household Size | Owner-occupied | Renter-occupied |
| 1-Person Household | 42,575 (57.7%) | 31,239 (42.3%) |
| 2-Person Household | 66,228 (77.9%) | 18,834 (22.1%) |
| 3-Person Household | 21,841 (70.7%) | 9,042 (29.3%) |
| 4+ Person Household | 37,380 (75.2%) | 12,295 (24.7%) |
| Total Housing Units | 168,024 (70.2%) | 71,410 (29.8%) |
Occupancy by Educational Attainment in Area Code 620
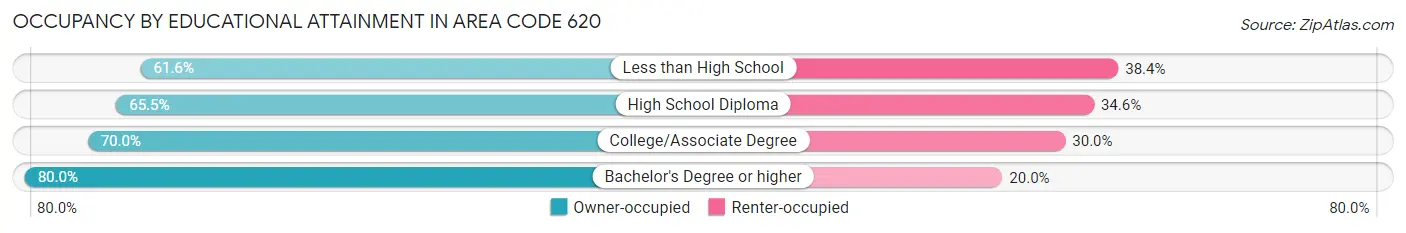
| Household Size | Owner-occupied | Renter-occupied |
| Less than High School | 15,463 (61.6%) | 9,639 (38.4%) |
| High School Diploma | 44,109 (65.4%) | 23,284 (34.5%) |
| College/Associate Degree | 63,588 (70.0%) | 27,260 (30.0%) |
| Bachelor's Degree or higher | 44,864 (80.0%) | 11,227 (20.0%) |
Occupancy by Age of Householder in Area Code 620
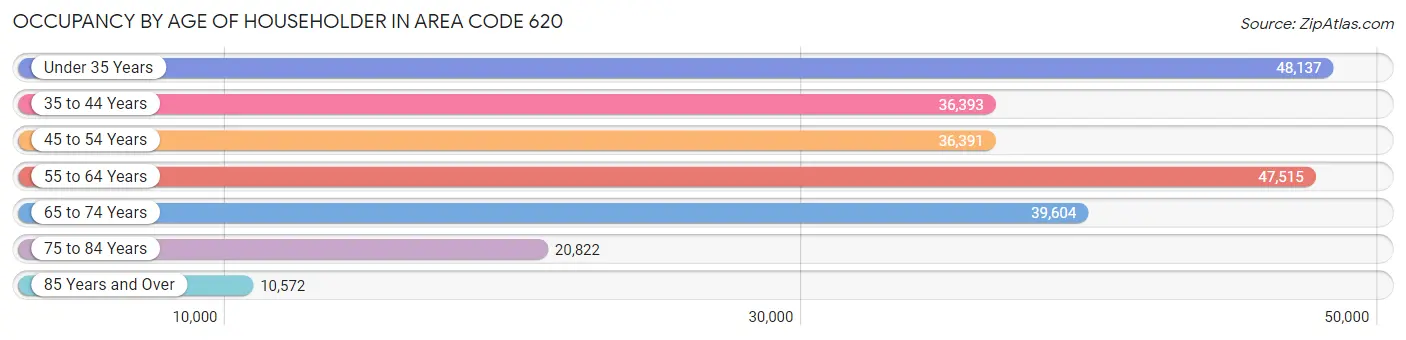
| Age Bracket | # Households | % Households |
| Under 35 Years | 48,137 | 20.1% |
| 35 to 44 Years | 36,393 | 15.2% |
| 45 to 54 Years | 36,391 | 15.2% |
| 55 to 64 Years | 47,515 | 19.8% |
| 65 to 74 Years | 39,604 | 16.5% |
| 75 to 84 Years | 20,822 | 8.7% |
| 85 Years and Over | 10,572 | 4.4% |
| Total | 239,434 | 100.0% |
Housing Finances in Area Code 620
Median Income by Occupancy in Area Code 620
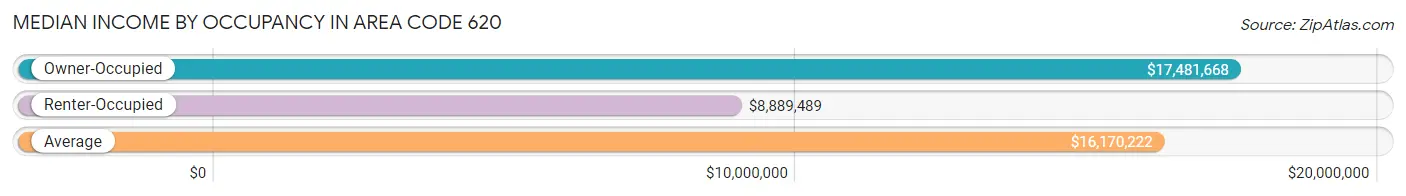
| Occupancy Type | # Households | Median Income |
| Owner-Occupied | 168,024 (70.2%) | $17,481,668 |
| Renter-Occupied | 71,410 (29.8%) | $8,889,489 |
| Average | 239,434 (100.0%) | $16,170,222 |
Occupancy by Householder Income Bracket in Area Code 620
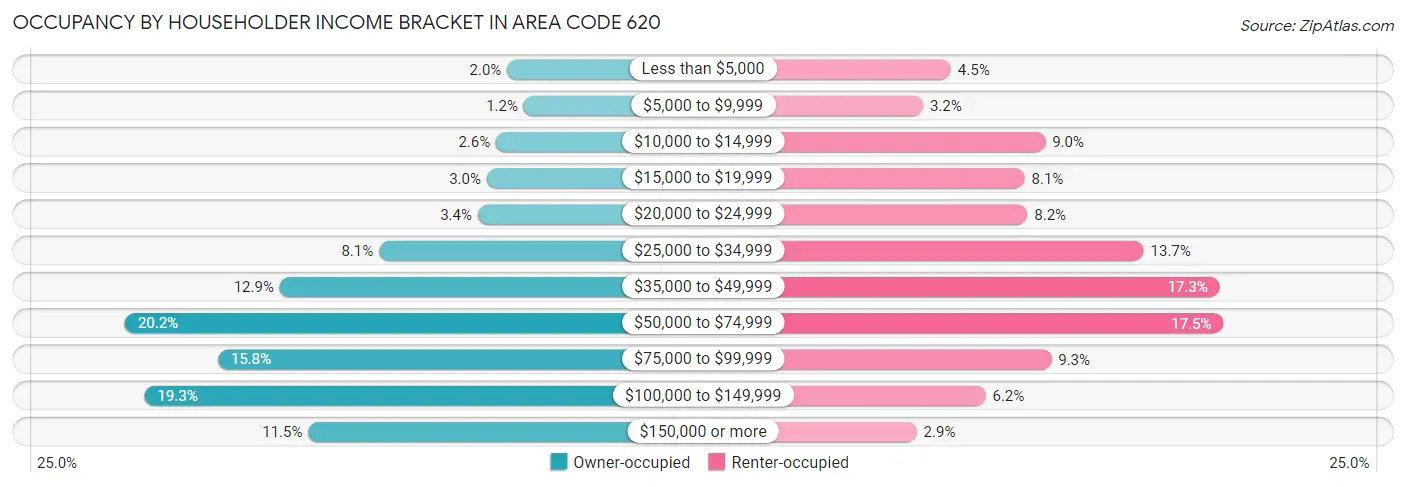
| Income Bracket | Owner-occupied | Renter-occupied |
| Less than $5,000 | 3,402 (2.0%) | 3,241 (4.5%) |
| $5,000 to $9,999 | 2,070 (1.2%) | 2,295 (3.2%) |
| $10,000 to $14,999 | 4,287 (2.5%) | 6,449 (9.0%) |
| $15,000 to $19,999 | 5,031 (3.0%) | 5,745 (8.1%) |
| $20,000 to $24,999 | 5,751 (3.4%) | 5,838 (8.2%) |
| $25,000 to $34,999 | 13,650 (8.1%) | 9,801 (13.7%) |
| $35,000 to $49,999 | 21,594 (12.9%) | 12,384 (17.3%) |
| $50,000 to $74,999 | 33,973 (20.2%) | 12,507 (17.5%) |
| $75,000 to $99,999 | 26,548 (15.8%) | 6,657 (9.3%) |
| $100,000 to $149,999 | 32,405 (19.3%) | 4,418 (6.2%) |
| $150,000 or more | 19,313 (11.5%) | 2,075 (2.9%) |
| Total | 168,024 (100.0%) | 71,410 (100.0%) |
Monthly Housing Cost Tiers in Area Code 620
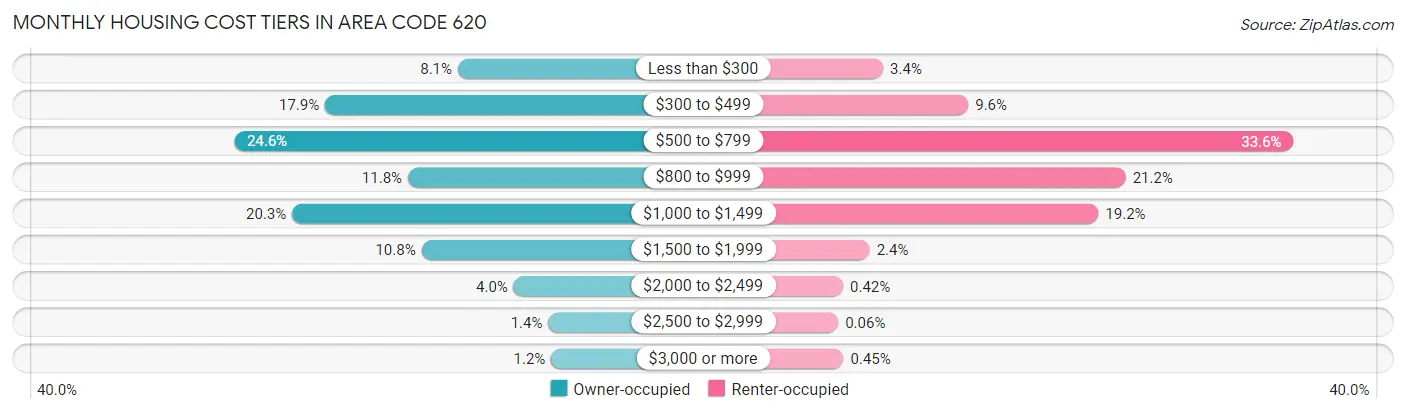
| Monthly Cost | Owner-occupied | Renter-occupied |
| Less than $300 | 13,586 (8.1%) | 2,404 (3.4%) |
| $300 to $499 | 30,026 (17.9%) | 6,886 (9.6%) |
| $500 to $799 | 41,295 (24.6%) | 23,977 (33.6%) |
| $800 to $999 | 19,769 (11.8%) | 15,159 (21.2%) |
| $1,000 to $1,499 | 34,102 (20.3%) | 13,724 (19.2%) |
| $1,500 to $1,999 | 18,100 (10.8%) | 1,698 (2.4%) |
| $2,000 to $2,499 | 6,688 (4.0%) | 299 (0.4%) |
| $2,500 to $2,999 | 2,406 (1.4%) | 42 (0.1%) |
| $3,000 or more | 2,052 (1.2%) | 322 (0.4%) |
| Total | 168,024 (100.0%) | 71,410 (100.0%) |
Physical Housing Characteristics in Area Code 620
Housing Structures in Area Code 620
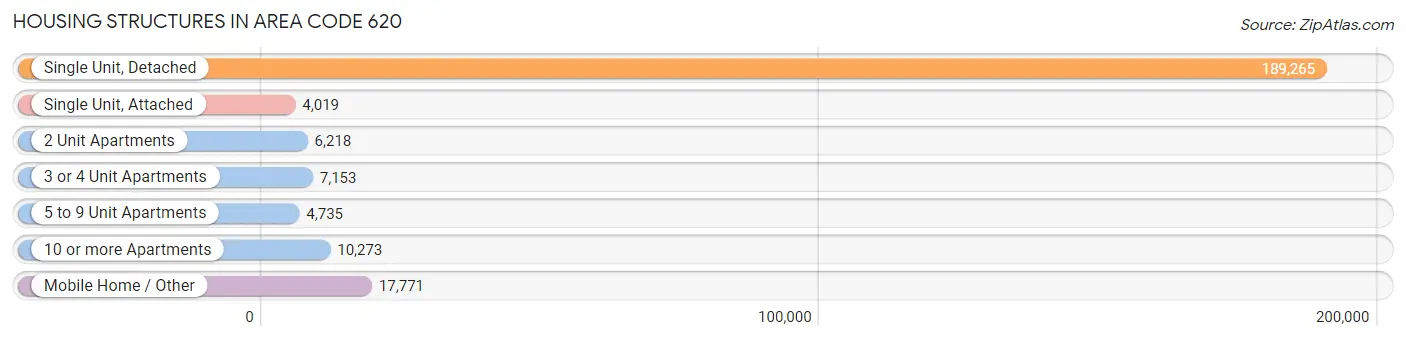
| Structure Type | # Housing Units | % Housing Units |
| Single Unit, Detached | 189,265 | 79.0% |
| Single Unit, Attached | 4,019 | 1.7% |
| 2 Unit Apartments | 6,218 | 2.6% |
| 3 or 4 Unit Apartments | 7,153 | 3.0% |
| 5 to 9 Unit Apartments | 4,735 | 2.0% |
| 10 or more Apartments | 10,273 | 4.3% |
| Mobile Home / Other | 17,771 | 7.4% |
| Total | 239,434 | 100.0% |
Housing Structures by Occupancy in Area Code 620
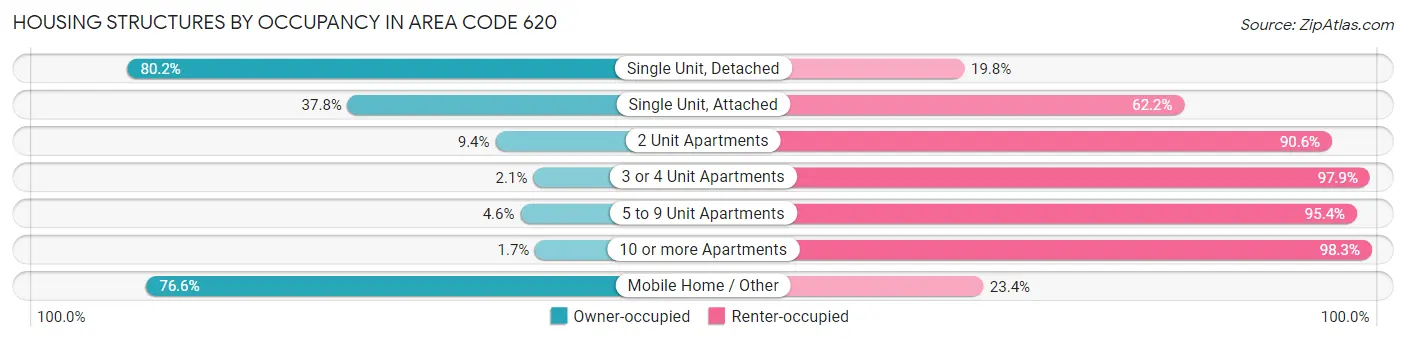
| Structure Type | Owner-occupied | Renter-occupied |
| Single Unit, Detached | 151,779 (80.2%) | 37,486 (19.8%) |
| Single Unit, Attached | 1,519 (37.8%) | 2,500 (62.2%) |
| 2 Unit Apartments | 582 (9.4%) | 5,636 (90.6%) |
| 3 or 4 Unit Apartments | 148 (2.1%) | 7,005 (97.9%) |
| 5 to 9 Unit Apartments | 216 (4.6%) | 4,519 (95.4%) |
| 10 or more Apartments | 174 (1.7%) | 10,099 (98.3%) |
| Mobile Home / Other | 13,606 (76.6%) | 4,165 (23.4%) |
| Total | 168,024 (70.2%) | 71,410 (29.8%) |
Housing Structures by Number of Rooms in Area Code 620
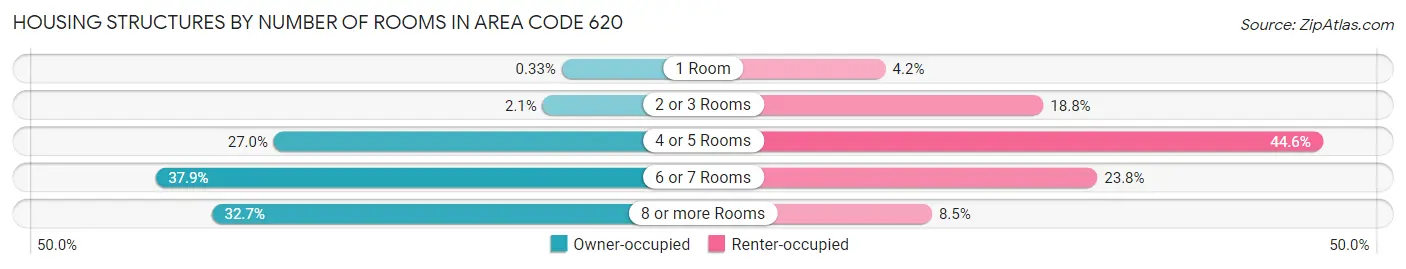
| Number of Rooms | Owner-occupied | Renter-occupied |
| 1 Room | 549 (0.3%) | 3,019 (4.2%) |
| 2 or 3 Rooms | 3,517 (2.1%) | 13,438 (18.8%) |
| 4 or 5 Rooms | 45,280 (27.0%) | 31,877 (44.6%) |
| 6 or 7 Rooms | 63,719 (37.9%) | 17,002 (23.8%) |
| 8 or more Rooms | 54,959 (32.7%) | 6,074 (8.5%) |
| Total | 168,024 (100.0%) | 71,410 (100.0%) |
Housing Structure by Heating Type in Area Code 620
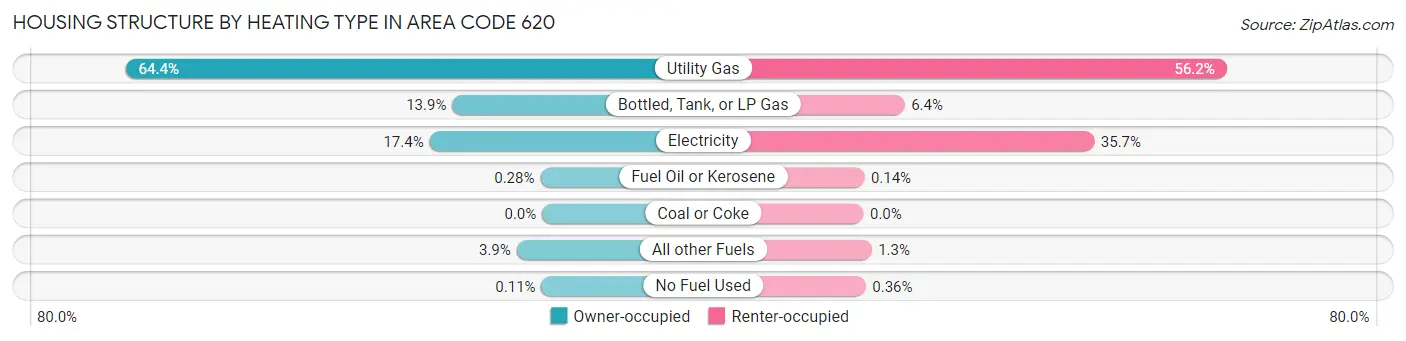
| Heating Type | Owner-occupied | Renter-occupied |
| Utility Gas | 108,155 (64.4%) | 40,123 (56.2%) |
| Bottled, Tank, or LP Gas | 23,344 (13.9%) | 4,545 (6.4%) |
| Electricity | 29,252 (17.4%) | 25,480 (35.7%) |
| Fuel Oil or Kerosene | 466 (0.3%) | 103 (0.1%) |
| Coal or Coke | 2 (0.0%) | 1 (0.0%) |
| All other Fuels | 6,619 (3.9%) | 899 (1.3%) |
| No Fuel Used | 186 (0.1%) | 259 (0.4%) |
| Total | 168,024 (100.0%) | 71,410 (100.0%) |
Household Vehicle Usage in Area Code 620
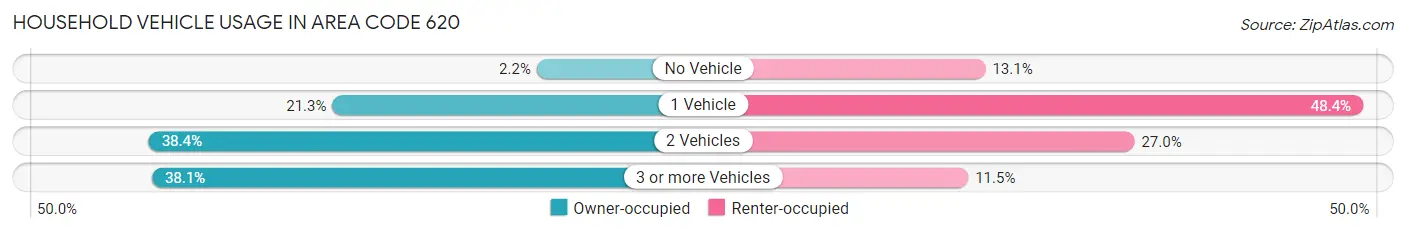
| Vehicles per Household | Owner-occupied | Renter-occupied |
| No Vehicle | 3,678 (2.2%) | 9,367 (13.1%) |
| 1 Vehicle | 35,761 (21.3%) | 34,524 (48.3%) |
| 2 Vehicles | 64,546 (38.4%) | 19,300 (27.0%) |
| 3 or more Vehicles | 64,039 (38.1%) | 8,219 (11.5%) |
| Total | 168,024 (100.0%) | 71,410 (100.0%) |
Real Estate & Mortgages in Area Code 620
Real Estate and Mortgage Overview in Area Code 620
| Characteristic | Without Mortgage | With Mortgage |
| Housing Units | 88,641 | 79,383 |
| Median Property Value | $23,128,500 | $30,551,900 |
| Median Household Income | $14,485,829 | $11,678 |
| Monthly Housing Costs | $124,547 | $1,992 |
| Real Estate Taxes | $361,843 | $1,526 |
Property Value by Mortgage Status in Area Code 620
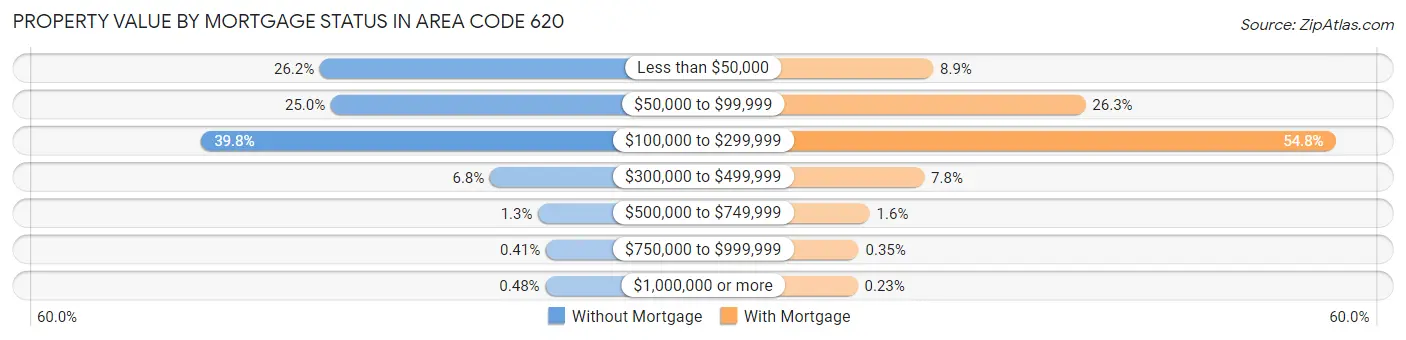
| Property Value | Without Mortgage | With Mortgage |
| Less than $50,000 | 23,252 (26.2%) | 7,036 (8.9%) |
| $50,000 to $99,999 | 22,145 (25.0%) | 20,851 (26.3%) |
| $100,000 to $299,999 | 35,286 (39.8%) | 43,531 (54.8%) |
| $300,000 to $499,999 | 6,026 (6.8%) | 6,227 (7.8%) |
| $500,000 to $749,999 | 1,146 (1.3%) | 1,278 (1.6%) |
| $750,000 to $999,999 | 361 (0.4%) | 274 (0.4%) |
| $1,000,000 or more | 425 (0.5%) | 186 (0.2%) |
| Total | 88,641 (100.0%) | 79,383 (100.0%) |
Household Income by Mortgage Status in Area Code 620
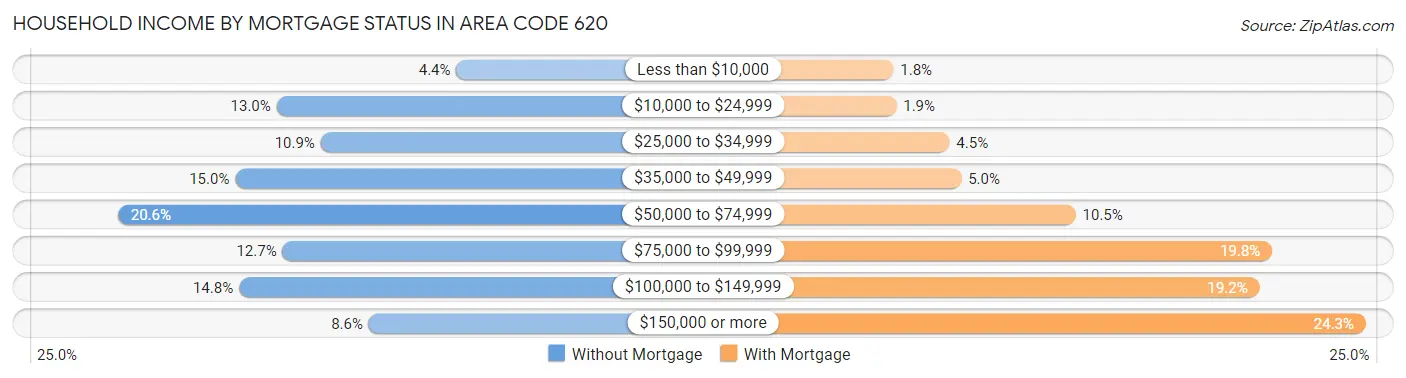
| Household Income | Without Mortgage | With Mortgage |
| Less than $10,000 | 3,934 (4.4%) | 1,429 (1.8%) |
| $10,000 to $24,999 | 11,522 (13.0%) | 1,538 (1.9%) |
| $25,000 to $34,999 | 9,661 (10.9%) | 3,547 (4.5%) |
| $35,000 to $49,999 | 13,273 (15.0%) | 3,989 (5.0%) |
| $50,000 to $74,999 | 18,225 (20.6%) | 8,321 (10.5%) |
| $75,000 to $99,999 | 11,278 (12.7%) | 15,748 (19.8%) |
| $100,000 to $149,999 | 13,113 (14.8%) | 15,270 (19.2%) |
| $150,000 or more | 7,635 (8.6%) | 19,292 (24.3%) |
| Total | 88,641 (100.0%) | 79,383 (100.0%) |
Property Value to Household Income Ratio in Area Code 620
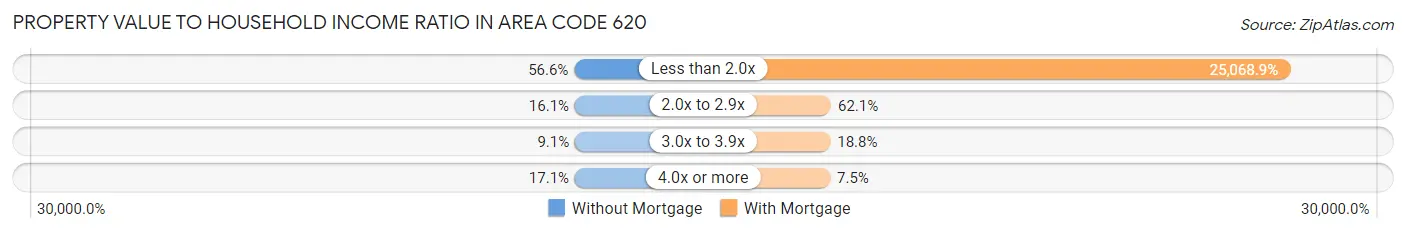
| Value-to-Income Ratio | Without Mortgage | With Mortgage |
| Less than 2.0x | 50,193 (56.6%) | 19,900,447 (25,068.9%) |
| 2.0x to 2.9x | 14,243 (16.1%) | 49,301 (62.1%) |
| 3.0x to 3.9x | 8,085 (9.1%) | 14,951 (18.8%) |
| 4.0x or more | 15,143 (17.1%) | 5,938 (7.5%) |
| Total | 88,641 (100.0%) | 79,383 (100.0%) |
Real Estate Taxes by Mortgage Status in Area Code 620
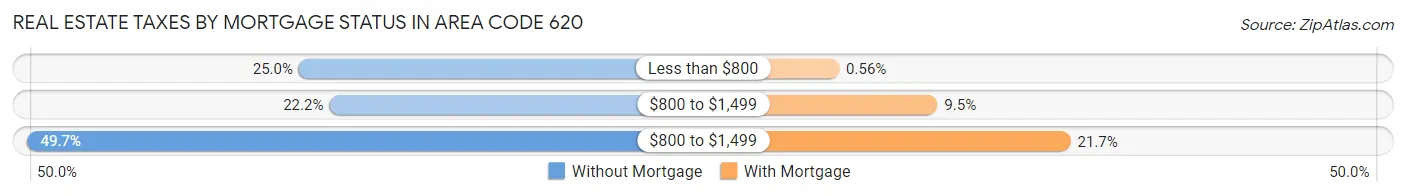
| Property Taxes | Without Mortgage | With Mortgage |
| Less than $800 | 22,129 (25.0%) | 441 (0.6%) |
| $800 to $1,499 | 19,665 (22.2%) | 7,562 (9.5%) |
| $800 to $1,499 | 44,075 (49.7%) | 17,216 (21.7%) |
| Total | 88,641 (100.0%) | 79,383 (100.0%) |
Health & Disability in Area Code 620
Health Insurance Coverage by Age in Area Code 620
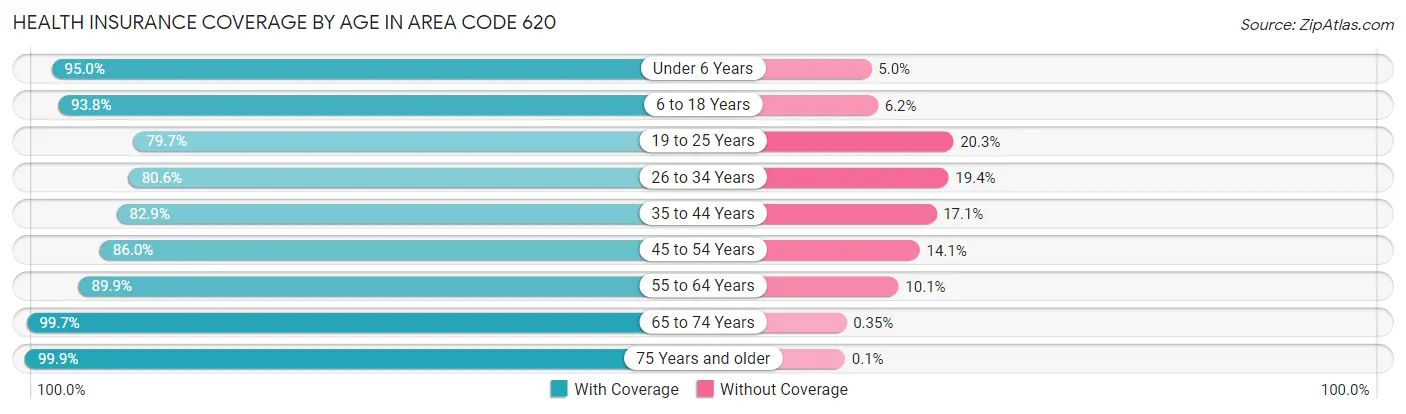
| Age Bracket | With Coverage | Without Coverage |
| Under 6 Years | 44,158 (95.0%) | 2,343 (5.0%) |
| 6 to 18 Years | 106,823 (93.8%) | 7,110 (6.2%) |
| 19 to 25 Years | 46,168 (79.7%) | 11,769 (20.3%) |
| 26 to 34 Years | 50,800 (80.6%) | 12,240 (19.4%) |
| 35 to 44 Years | 57,633 (82.9%) | 11,923 (17.1%) |
| 45 to 54 Years | 57,290 (86.0%) | 9,367 (14.1%) |
| 55 to 64 Years | 72,375 (89.9%) | 8,125 (10.1%) |
| 65 to 74 Years | 61,466 (99.7%) | 218 (0.4%) |
| 75 Years and older | 43,953 (99.9%) | 46 (0.1%) |
| Total | 540,666 (89.5%) | 63,141 (10.5%) |
Health Insurance Coverage by Citizenship Status in Area Code 620
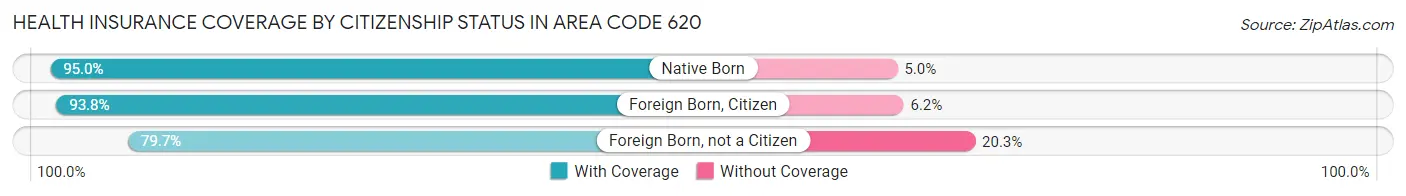
| Citizenship Status | With Coverage | Without Coverage |
| Native Born | 44,158 (95.0%) | 2,343 (5.0%) |
| Foreign Born, Citizen | 106,823 (93.8%) | 7,110 (6.2%) |
| Foreign Born, not a Citizen | 46,168 (79.7%) | 11,769 (20.3%) |
Health Insurance Coverage by Household Income in Area Code 620
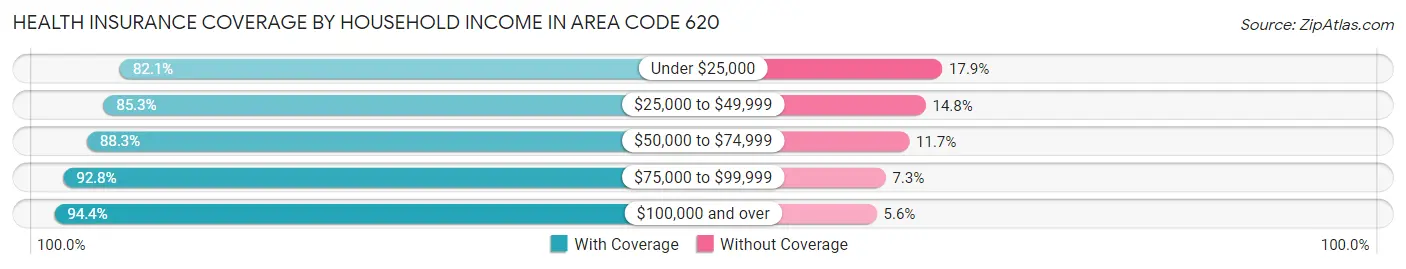
| Household Income | With Coverage | Without Coverage |
| Under $25,000 | 61,029 (82.1%) | 13,267 (17.9%) |
| $25,000 to $49,999 | 101,962 (85.3%) | 17,641 (14.7%) |
| $50,000 to $74,999 | 105,236 (88.3%) | 13,908 (11.7%) |
| $75,000 to $99,999 | 89,941 (92.7%) | 7,026 (7.2%) |
| $100,000 and over | 173,985 (94.4%) | 10,288 (5.6%) |
Public vs Private Health Insurance Coverage by Age in Area Code 620
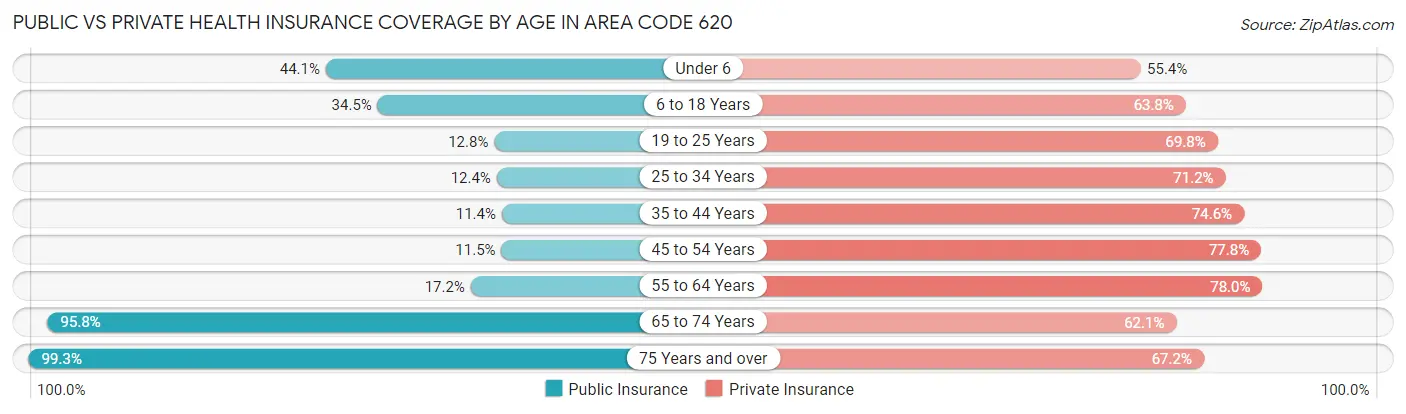
| Age Bracket | Public Insurance | Private Insurance |
| Under 6 | 20,503 (44.1%) | 25,748 (55.4%) |
| 6 to 18 Years | 39,271 (34.5%) | 72,721 (63.8%) |
| 19 to 25 Years | 7,431 (12.8%) | 40,410 (69.8%) |
| 25 to 34 Years | 7,797 (12.4%) | 44,884 (71.2%) |
| 35 to 44 Years | 7,953 (11.4%) | 51,917 (74.6%) |
| 45 to 54 Years | 7,664 (11.5%) | 51,856 (77.8%) |
| 55 to 64 Years | 13,843 (17.2%) | 62,823 (78.0%) |
| 65 to 74 Years | 59,067 (95.8%) | 38,285 (62.1%) |
| 75 Years and over | 43,676 (99.3%) | 29,558 (67.2%) |
| Total | 207,205 (34.3%) | 418,202 (69.3%) |
Disability Status by Sex by Age in Area Code 620
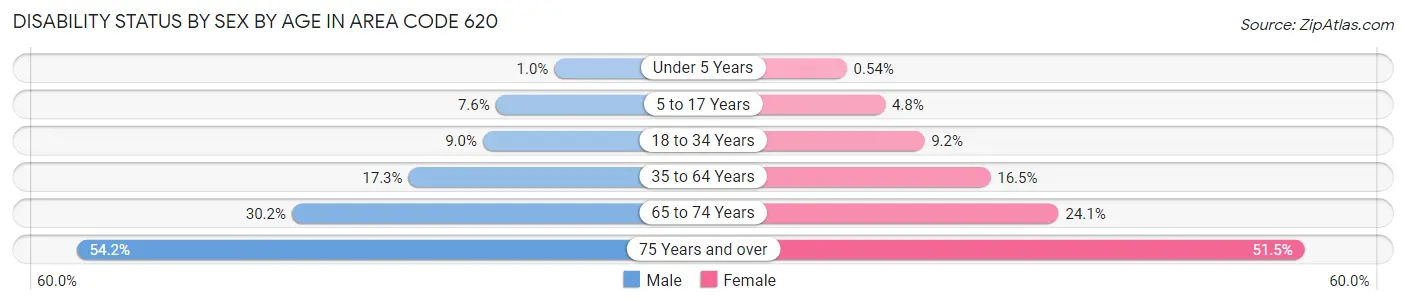
| Age Bracket | Male | Female |
| Under 5 Years | 204 (1.0%) | 96 (0.5%) |
| 5 to 17 Years | 4,387 (7.5%) | 2,627 (4.8%) |
| 18 to 34 Years | 6,080 (9.0%) | 5,785 (9.2%) |
| 35 to 64 Years | 18,885 (17.3%) | 17,746 (16.5%) |
| 65 to 74 Years | 9,138 (30.2%) | 7,596 (24.1%) |
| 75 Years and over | 9,786 (54.2%) | 13,371 (51.5%) |
Disability Class by Sex by Age in Area Code 620
Disability Class: Hearing Difficulty
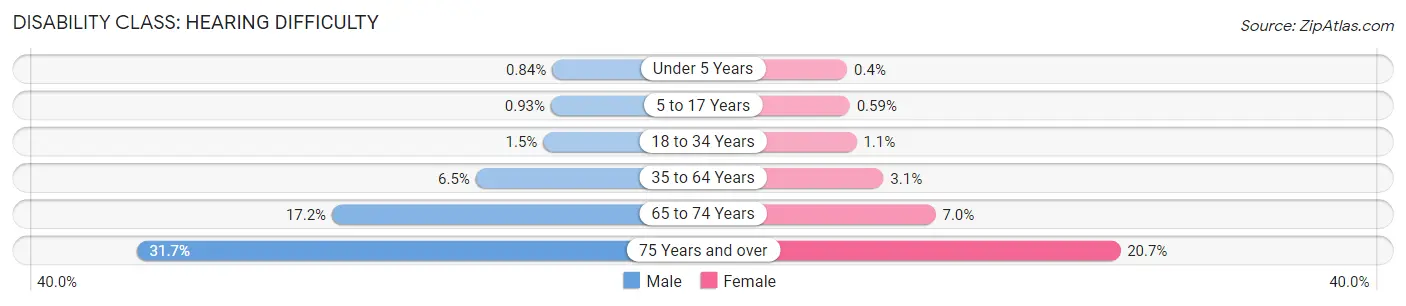
| Age Bracket | Male | Female |
| Under 5 Years | 167 (0.8%) | 72 (0.4%) |
| 5 to 17 Years | 542 (0.9%) | 324 (0.6%) |
| 18 to 34 Years | 1,017 (1.5%) | 686 (1.1%) |
| 35 to 64 Years | 7,117 (6.5%) | 3,317 (3.1%) |
| 65 to 74 Years | 5,193 (17.2%) | 2,190 (7.0%) |
| 75 Years and over | 5,720 (31.7%) | 5,364 (20.7%) |
Disability Class: Vision Difficulty
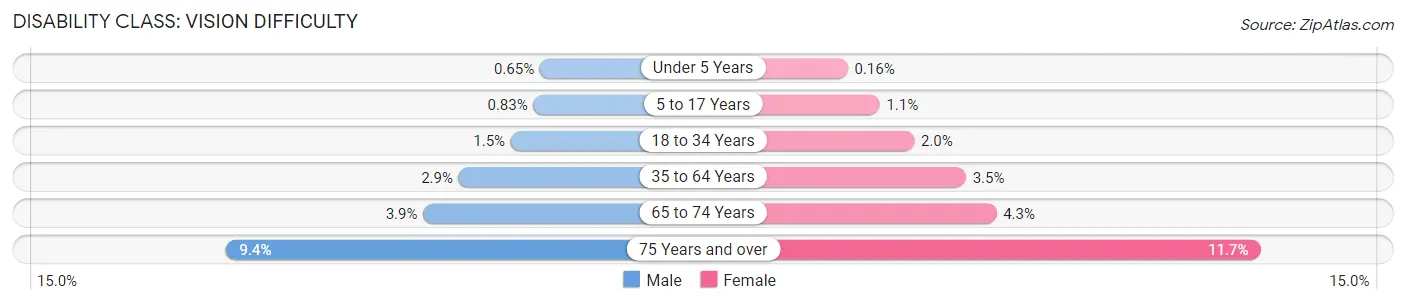
| Age Bracket | Male | Female |
| Under 5 Years | 129 (0.6%) | 28 (0.2%) |
| 5 to 17 Years | 480 (0.8%) | 571 (1.1%) |
| 18 to 34 Years | 987 (1.5%) | 1,264 (2.0%) |
| 35 to 64 Years | 3,180 (2.9%) | 3,700 (3.5%) |
| 65 to 74 Years | 1,179 (3.9%) | 1,352 (4.3%) |
| 75 Years and over | 1,694 (9.4%) | 3,023 (11.7%) |
Disability Class: Cognitive Difficulty
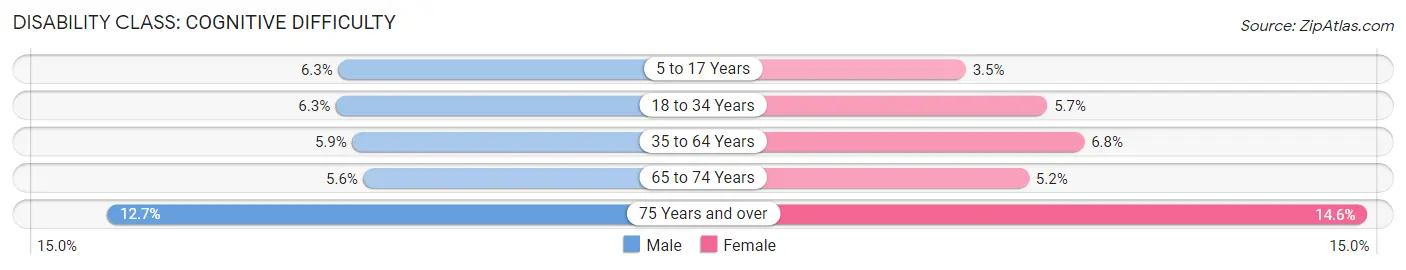
| Age Bracket | Male | Female |
| 5 to 17 Years | 3,638 (6.3%) | 1,883 (3.5%) |
| 18 to 34 Years | 4,289 (6.3%) | 3,608 (5.7%) |
| 35 to 64 Years | 6,420 (5.9%) | 7,240 (6.8%) |
| 65 to 74 Years | 1,680 (5.6%) | 1,638 (5.2%) |
| 75 Years and over | 2,292 (12.7%) | 3,797 (14.6%) |
Disability Class: Ambulatory Difficulty
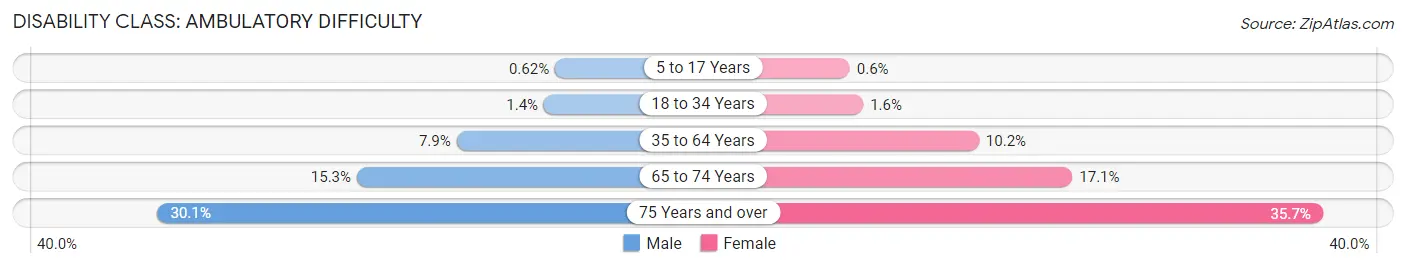
| Age Bracket | Male | Female |
| 5 to 17 Years | 359 (0.6%) | 329 (0.6%) |
| 18 to 34 Years | 976 (1.4%) | 1,001 (1.6%) |
| 35 to 64 Years | 8,680 (7.9%) | 10,921 (10.2%) |
| 65 to 74 Years | 4,633 (15.3%) | 5,385 (17.1%) |
| 75 Years and over | 5,440 (30.1%) | 9,262 (35.7%) |
Disability Class: Self-Care Difficulty
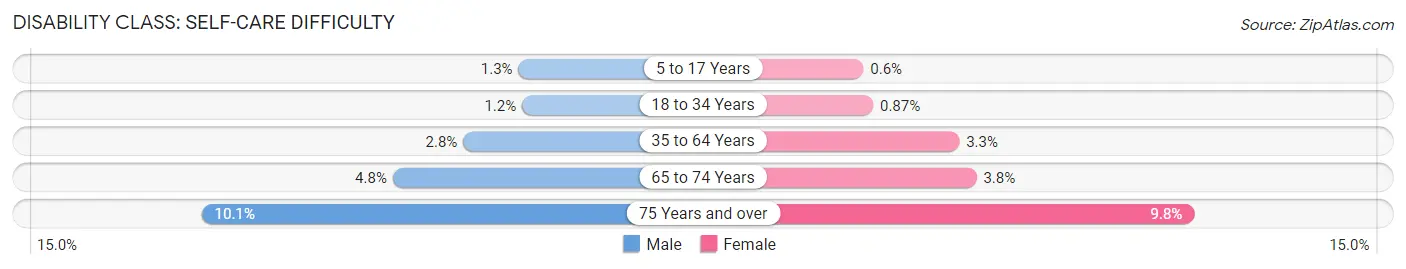
| Age Bracket | Male | Female |
| 5 to 17 Years | 727 (1.3%) | 328 (0.6%) |
| 18 to 34 Years | 777 (1.1%) | 550 (0.9%) |
| 35 to 64 Years | 3,055 (2.8%) | 3,504 (3.3%) |
| 65 to 74 Years | 1,437 (4.8%) | 1,180 (3.7%) |
| 75 Years and over | 1,818 (10.1%) | 2,544 (9.8%) |
Technology Access in Area Code 620
Computing Device Access in Area Code 620
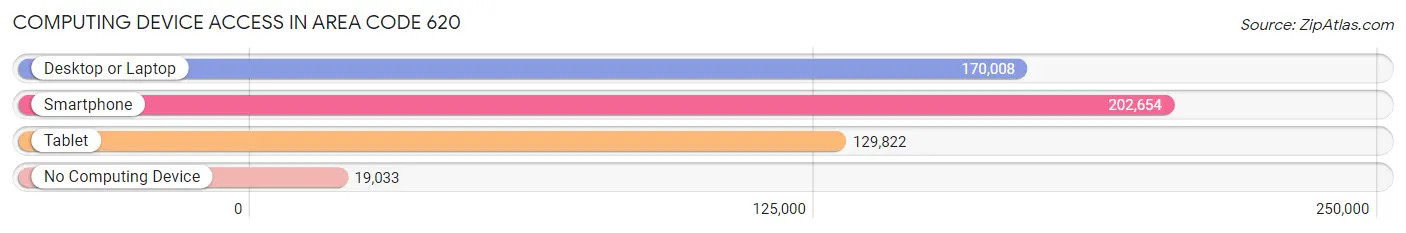
| Device Type | # Households | % Households |
| Desktop or Laptop | 170,008 | 71.0% |
| Smartphone | 202,654 | 84.6% |
| Tablet | 129,822 | 54.2% |
| No Computing Device | 19,033 | 8.0% |
| Total | 239,434 | 100.0% |
Internet Access in Area Code 620
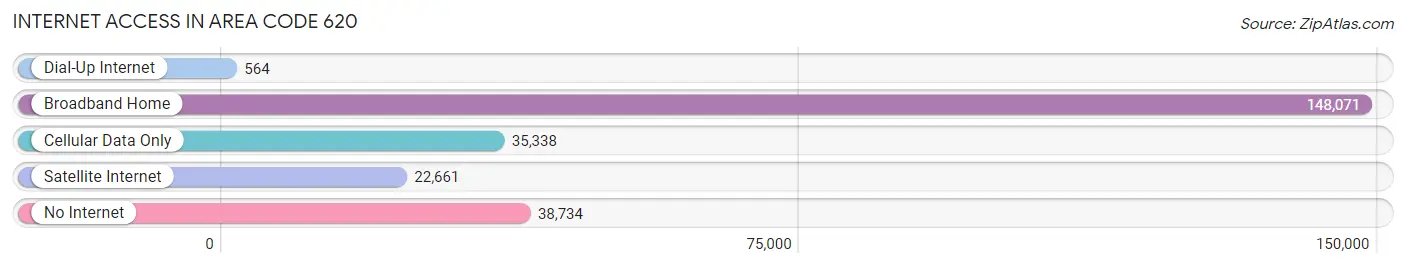
| Internet Type | # Households | % Households |
| Dial-Up Internet | 564 | 0.2% |
| Broadband Home | 148,071 | 61.8% |
| Cellular Data Only | 35,338 | 14.8% |
| Satellite Internet | 22,661 | 9.5% |
| No Internet | 38,734 | 16.2% |
| Total | 239,434 | 100.0% |
Area Code 620 Summary
Geography
Area code 620 is located in the state of Kansas and covers the western and central parts of the state. It includes the cities of Wichita, Hutchinson, Garden City, Dodge City, and Pittsburg.
Social
Area code 620 is home to a diverse population of people from all walks of life. The area is known for its friendly and welcoming atmosphere, and its residents are proud of their heritage and culture.
Economics
Area code 620 is a major economic hub in the state of Kansas. It is home to a number of large companies, including Koch Industries, Cargill, and Spirit AeroSystems. The area also has a thriving agricultural industry, with many farms and ranches located in the region.
Demographics
Area code 620 is home to a population of over 1.2 million people. The majority of the population is white, followed by Hispanic, African American, and Asian. The median household income in the area is around $50,000, and the unemployment rate is around 4%.
Common Questions
What is Per Capita Income in Area Code 620?
Per Capita income in Area Code 620 is $31,958.
What is the Median Family Income in Area Code 620?
Median Family Income in Area Code 620 is $76,767.
What is the Median Household income in Area Code 620?
Median Household Income in Area Code 620 is $61,718.
What is Income or Wage Gap in Area Code 620?
Income or Wage Gap in Area Code 620 is 34.6%.
Women in Area Code 620 earn 65.4 cents for every dollar earned by a man.
What is Family Income Deficit in Area Code 620?
Family Income Deficit in Area Code 620 is $9,632.
Families that are below poverty line in Area Code 620 earn $9,632 less on average than the poverty threshold level.
What is Inequality or Gini Index in Area Code 620?
Inequality or Gini Index in Area Code 620 is 107.06.
What is the Total Population of Area Code 620?
Total Population of Area Code 620 is 616,114.
What is the Total Male Population of Area Code 620?
Total Male Population of Area Code 620 is 311,306.
What is the Total Female Population of Area Code 620?
Total Female Population of Area Code 620 is 304,808.
What is the Ratio of Males per 100 Females in Area Code 620?
There are 102.13 Males per 100 Females in Area Code 620.
What is the Ratio of Females per 100 Males in Area Code 620?
There are 97.91 Females per 100 Males in Area Code 620.
What is the Median Population Age in Area Code 620?
Median Population Age in Area Code 620 is 44.4 Years.
What is the Average Family Size in Area Code 620
Average Family Size in Area Code 620 is 3.1 People.
What is the Average Household Size in Area Code 620
Average Household Size in Area Code 620 is 2.5 People.
How Large is the Labor Force in Area Code 620?
There are 291,789 People in the Labor Forcein in Area Code 620.
What is the Percentage of People in the Labor Force in Area Code 620?
60.4% of People are in the Labor Force in Area Code 620.
What is the Unemployment Rate in Area Code 620?
Unemployment Rate in Area Code 620 is 4.4%.