Area Code 785 Map & Demographics
Area Code 785 Map
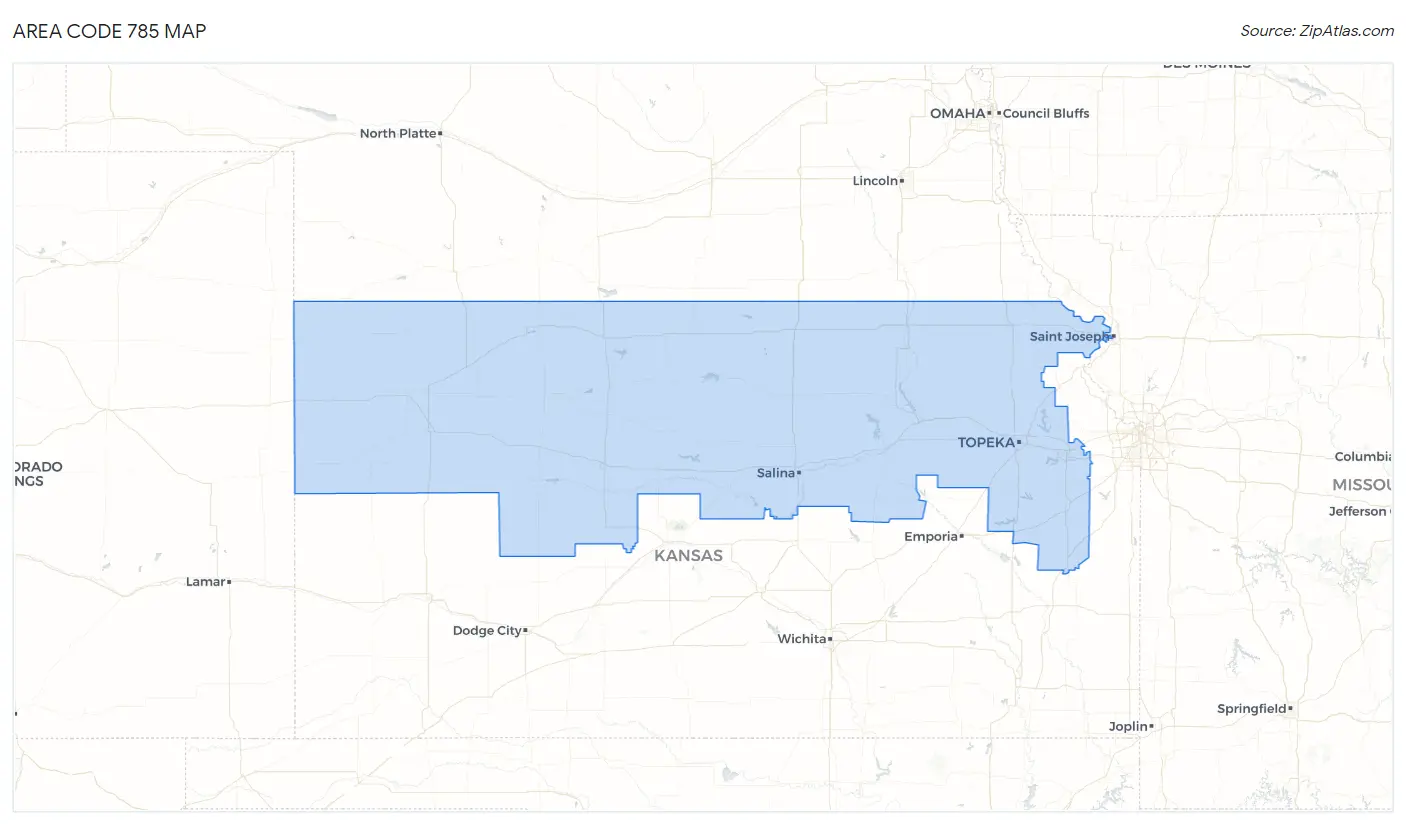
Area Code 785 Overview
$34,187
PER CAPITA INCOME
$80,533
AVG FAMILY INCOME
$65,138
AVG HOUSEHOLD INCOME
33.7%
WAGE / INCOME GAP [ % ]
66.3¢/ $1
WAGE / INCOME GAP [ $ ]
$11,084
FAMILY INCOME DEFICIT
115.87
INEQUALITY / GINI INDEX
790,651
TOTAL POPULATION
399,557
MALE POPULATION
391,094
FEMALE POPULATION
102.16
MALES / 100 FEMALES
97.88
FEMALES / 100 MALES
43.4
MEDIAN AGE
3.0
AVG FAMILY SIZE
2.4
AVG HOUSEHOLD SIZE
401,898
LABOR FORCE [ PEOPLE ]
63.2%
PERCENT IN LABOR FORCE
3.9%
UNEMPLOYMENT RATE
Income in Area Code 785
Income Overview in Area Code 785
Per Capita Income in Area Code 785 is $34,187, while median incomes of families and households are $80,533 and $65,138 respectively.
| Characteristic | Number | Measure |
| Per Capita Income | 790,651 | $34,187 |
| Median Family Income | 192,937 | $80,533 |
| Mean Family Income | 192,937 | $28,188,200 |
| Median Household Income | 320,554 | $65,138 |
| Mean Household Income | 320,554 | $23,842,878 |
| Income Deficit | 192,937 | $11,084 |
| Wage / Income Gap (%) | 790,651 | 33.69% |
| Wage / Income Gap ($) | 790,651 | 66.31¢ per $1 |
| Gini / Inequality Index | 790,651 | 115.87 |
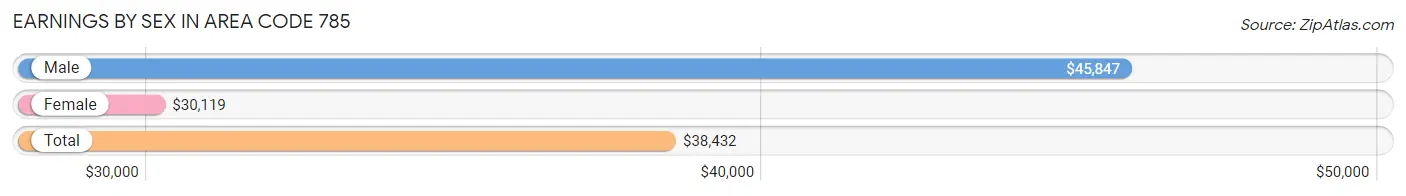
Earnings by Sex in Area Code 785
Average Earnings in Area Code 785 are $38,432, $45,847 for men and $30,119 for women, a difference of 34.3%.
| Sex | Number | Average Earnings |
| Male | 240,343 (53.4%) | $45,847 |
| Female | 209,391 (46.6%) | $30,119 |
| Total | 449,734 (100.0%) | $38,432 |
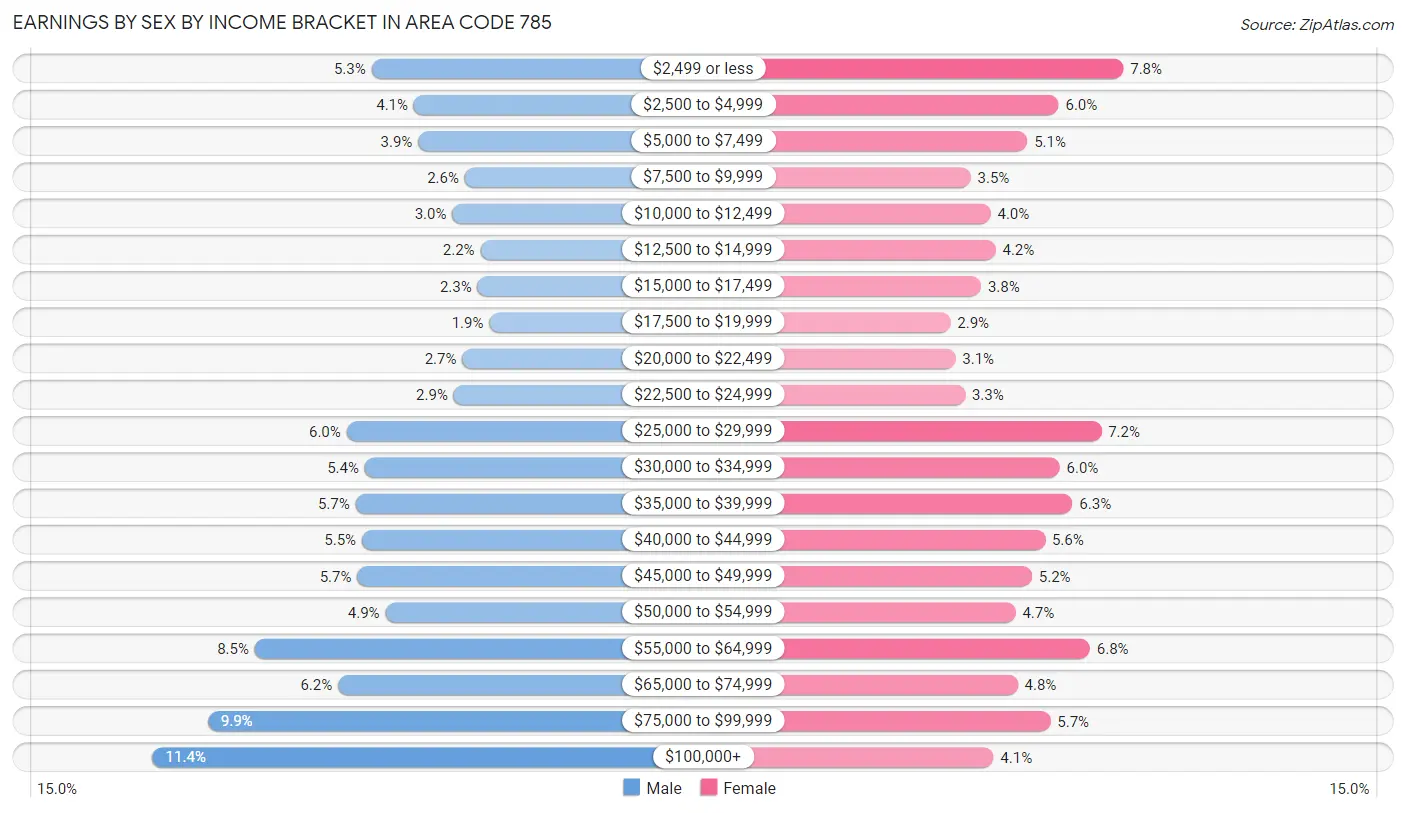
Earnings by Sex by Income Bracket in Area Code 785
The most common earnings brackets in Area Code 785 are $100,000+ for men (27,403 | 11.4%) and $2,499 or less for women (16,263 | 7.8%).
| Income | Male | Female |
| $2,499 or less | 12,612 (5.2%) | 16,263 (7.8%) |
| $2,500 to $4,999 | 9,750 (4.1%) | 12,450 (5.9%) |
| $5,000 to $7,499 | 9,475 (3.9%) | 10,608 (5.1%) |
| $7,500 to $9,999 | 6,319 (2.6%) | 7,290 (3.5%) |
| $10,000 to $12,499 | 7,174 (3.0%) | 8,458 (4.0%) |
| $12,500 to $14,999 | 5,262 (2.2%) | 8,759 (4.2%) |
| $15,000 to $17,499 | 5,464 (2.3%) | 7,902 (3.8%) |
| $17,500 to $19,999 | 4,659 (1.9%) | 6,096 (2.9%) |
| $20,000 to $22,499 | 6,499 (2.7%) | 6,394 (3.0%) |
| $22,500 to $24,999 | 7,065 (2.9%) | 6,952 (3.3%) |
| $25,000 to $29,999 | 14,306 (5.9%) | 14,979 (7.1%) |
| $30,000 to $34,999 | 13,085 (5.4%) | 12,532 (6.0%) |
| $35,000 to $39,999 | 13,701 (5.7%) | 13,274 (6.3%) |
| $40,000 to $44,999 | 13,259 (5.5%) | 11,660 (5.6%) |
| $45,000 to $49,999 | 13,578 (5.7%) | 10,886 (5.2%) |
| $50,000 to $54,999 | 11,681 (4.9%) | 9,923 (4.7%) |
| $55,000 to $64,999 | 20,500 (8.5%) | 14,305 (6.8%) |
| $65,000 to $74,999 | 14,885 (6.2%) | 10,058 (4.8%) |
| $75,000 to $99,999 | 23,666 (9.9%) | 11,981 (5.7%) |
| $100,000+ | 27,403 (11.4%) | 8,621 (4.1%) |
| Total | 240,343 (100.0%) | 209,391 (100.0%) |
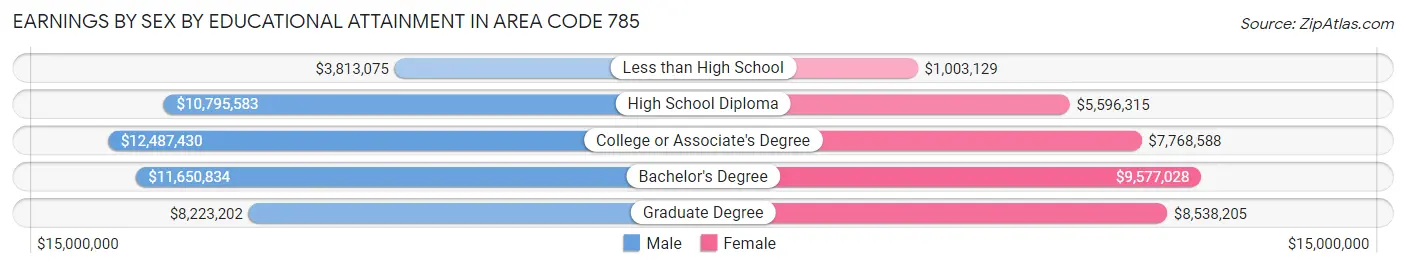
Earnings by Sex by Educational Attainment in Area Code 785
Average earnings in Area Code 785 are $13,970,400 for men and $9,027,159 for women, a difference of 35.4%. Men with an educational attainment of college or associate's degree enjoy the highest average annual earnings of $12,487,430, while those with less than high school education earn the least with $3,813,075. Women with an educational attainment of bachelor's degree earn the most with the average annual earnings of $9,577,028, while those with less than high school education have the smallest earnings of $1,003,129.
| Educational Attainment | Male Income | Female Income |
| Less than High School | $3,813,075 | $1,003,129 |
| High School Diploma | $10,795,583 | $5,596,315 |
| College or Associate's Degree | $12,487,430 | $7,768,588 |
| Bachelor's Degree | $11,650,834 | $9,577,028 |
| Graduate Degree | $8,223,202 | $8,538,205 |
| Total | $13,970,400 | $9,027,159 |
Family Income in Area Code 785
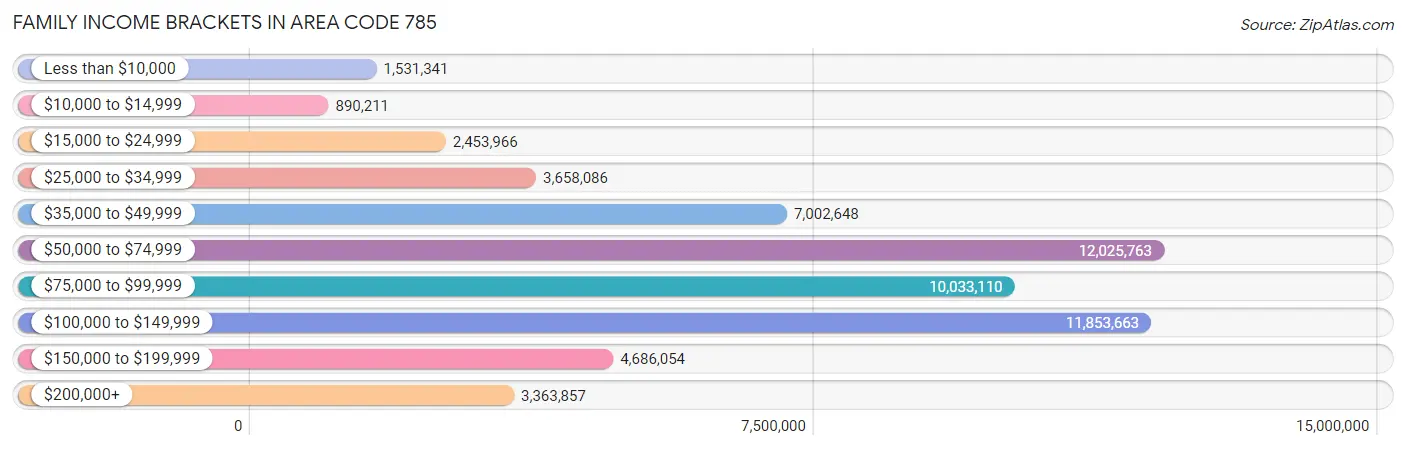
Family Income Brackets in Area Code 785
According to the Area Code 785 family income data, there are 12,025,763 families falling into the $50,000 to $74,999 income range, which is the most common income bracket and makes up 6,233.0% of all families. Conversely, the $10,000 to $14,999 income bracket is the least frequent group with only 890,211 families (461.4%) belonging to this category.
| Income Bracket | # Families | % Families |
| Less than $10,000 | 1,531,341 | 793.7% |
| $10,000 to $14,999 | 890,211 | 461.4% |
| $15,000 to $24,999 | 2,453,966 | 1,271.9% |
| $25,000 to $34,999 | 3,658,086 | 1,896.0% |
| $35,000 to $49,999 | 7,002,648 | 3,629.5% |
| $50,000 to $74,999 | 12,025,763 | 6,233.0% |
| $75,000 to $99,999 | 10,033,110 | 5,200.2% |
| $100,000 to $149,999 | 11,853,663 | 6,143.8% |
| $150,000 to $199,999 | 4,686,054 | 2,428.8% |
| $200,000+ | 3,363,857 | 1,743.5% |
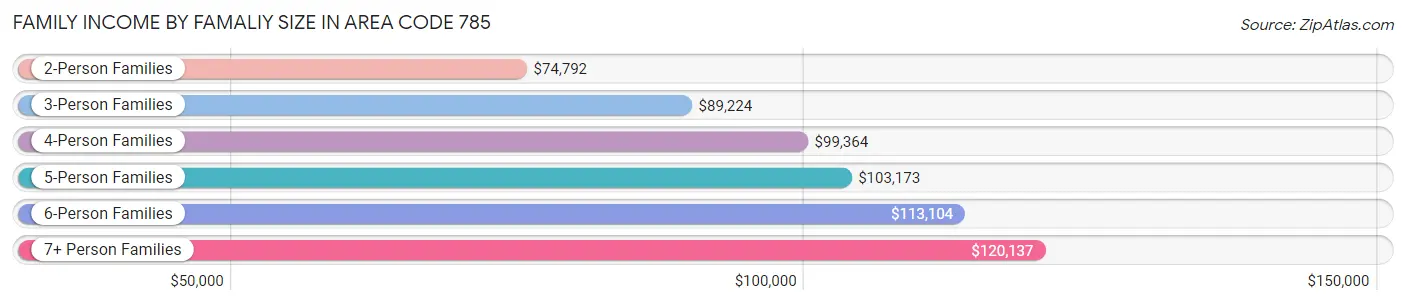
Family Income by Famaliy Size in Area Code 785
7+ person families (2,407 | 1.3%) account for the highest median family income in Area Code 785 with $120,137 per family, while 2-person families (101,976 | 52.8%) have the highest median income of $37,396 per family member.
| Income Bracket | # Families | Median Income |
| 2-Person Families | 101,976 (52.8%) | $74,792 |
| 3-Person Families | 36,417 (18.9%) | $89,224 |
| 4-Person Families | 30,478 (15.8%) | $99,364 |
| 5-Person Families | 15,893 (8.2%) | $103,173 |
| 6-Person Families | 5,766 (3.0%) | $113,104 |
| 7+ Person Families | 2,407 (1.3%) | $120,137 |
| Total | 192,937 (100.0%) | $80,533 |
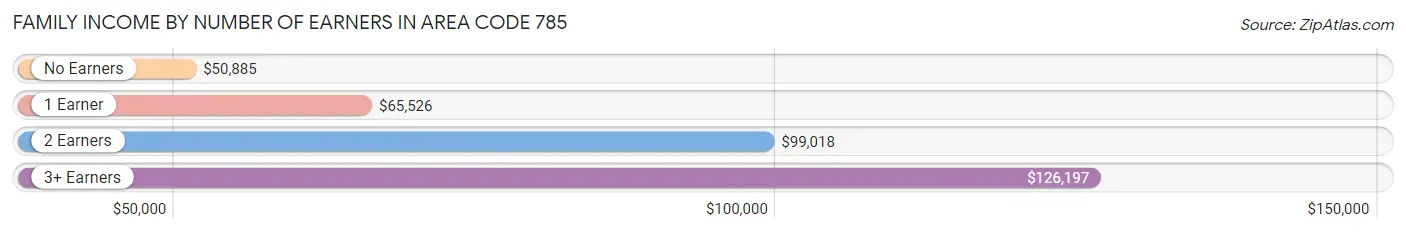
Family Income by Number of Earners in Area Code 785
The median family income in Area Code 785 is $80,533, with families comprising 3+ earners (17,814) having the highest median family income of $126,197, while families with no earners (29,065) have the lowest median family income of $50,885, accounting for 9.2% and 15.1% of families, respectively.
| Number of Earners | # Families | Median Income |
| No Earners | 29,065 (15.1%) | $50,885 |
| 1 Earner | 56,328 (29.2%) | $65,526 |
| 2 Earners | 89,730 (46.5%) | $99,018 |
| 3+ Earners | 17,814 (9.2%) | $126,197 |
| Total | 192,937 (100.0%) | $80,533 |
Household Income in Area Code 785
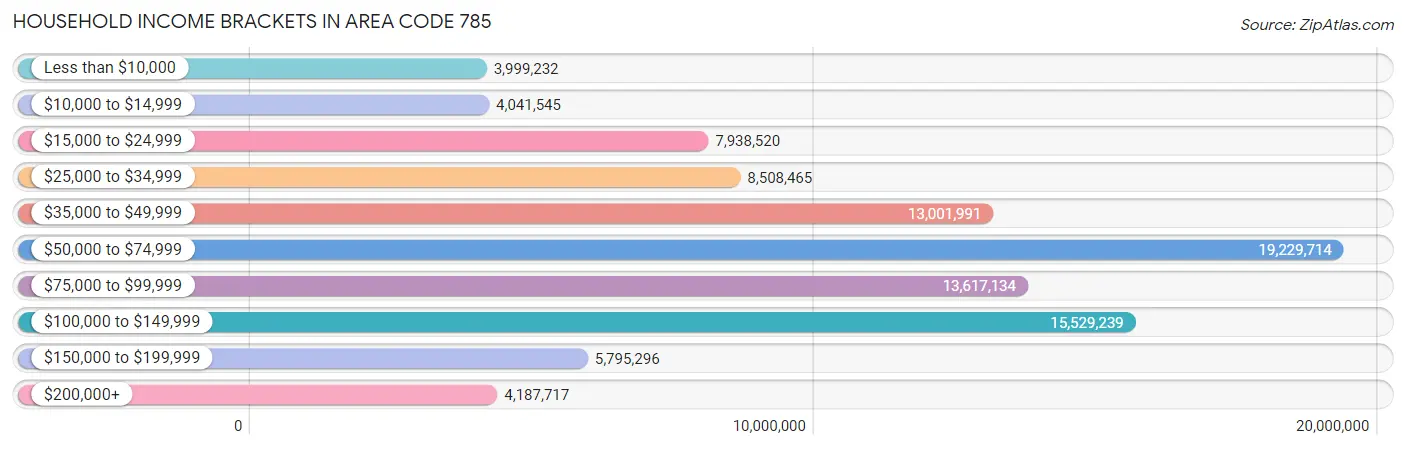
Household Income Brackets in Area Code 785
With 19,229,714 households falling in the category, the $50,000 to $74,999 income range is the most frequent in Area Code 785, accounting for 5,998.9% of all households. In contrast, only 3,999,232 households (1,247.6%) fall into the less than $10,000 income bracket, making it the least populous group.
| Income Bracket | # Households | % Households |
| Less than $10,000 | 3,999,232 | 1,247.6% |
| $10,000 to $14,999 | 4,041,545 | 1,260.8% |
| $15,000 to $24,999 | 7,938,520 | 2,476.5% |
| $25,000 to $34,999 | 8,508,465 | 2,654.3% |
| $35,000 to $49,999 | 13,001,991 | 4,056.1% |
| $50,000 to $74,999 | 19,229,714 | 5,998.9% |
| $75,000 to $99,999 | 13,617,134 | 4,248.0% |
| $100,000 to $149,999 | 15,529,239 | 4,844.5% |
| $150,000 to $199,999 | 5,795,296 | 1,807.9% |
| $200,000+ | 4,187,717 | 1,306.4% |
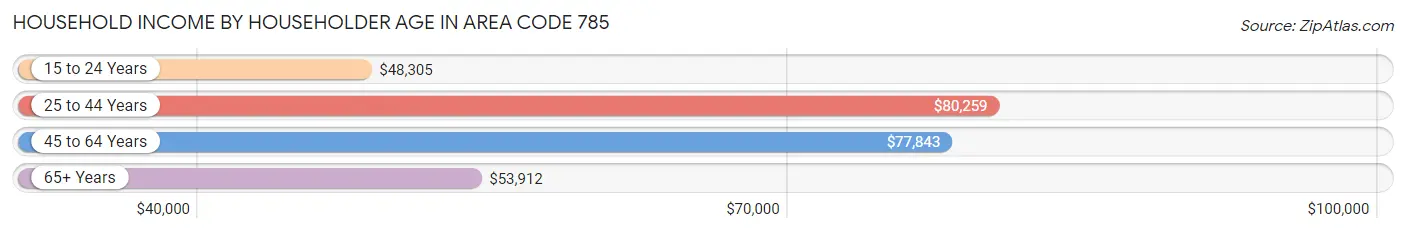
Household Income by Householder Age in Area Code 785
The median household income in Area Code 785 is $65,138, with the highest median household income of $80,259 found in the 25 to 44 years age bracket for the primary householder. A total of 100,013 households (31.2%) fall into this category. Meanwhile, the 15 to 24 years age bracket for the primary householder has the lowest median household income of $48,305, with 29,297 households (9.1%) in this group.
| Income Bracket | # Households | Median Income |
| 15 to 24 Years | 29,297 (9.1%) | $48,305 |
| 25 to 44 Years | 100,013 (31.2%) | $80,259 |
| 45 to 64 Years | 103,825 (32.4%) | $77,843 |
| 65+ Years | 87,419 (27.3%) | $53,912 |
| Total | 320,554 (100.0%) | $65,138 |
Poverty in Area Code 785
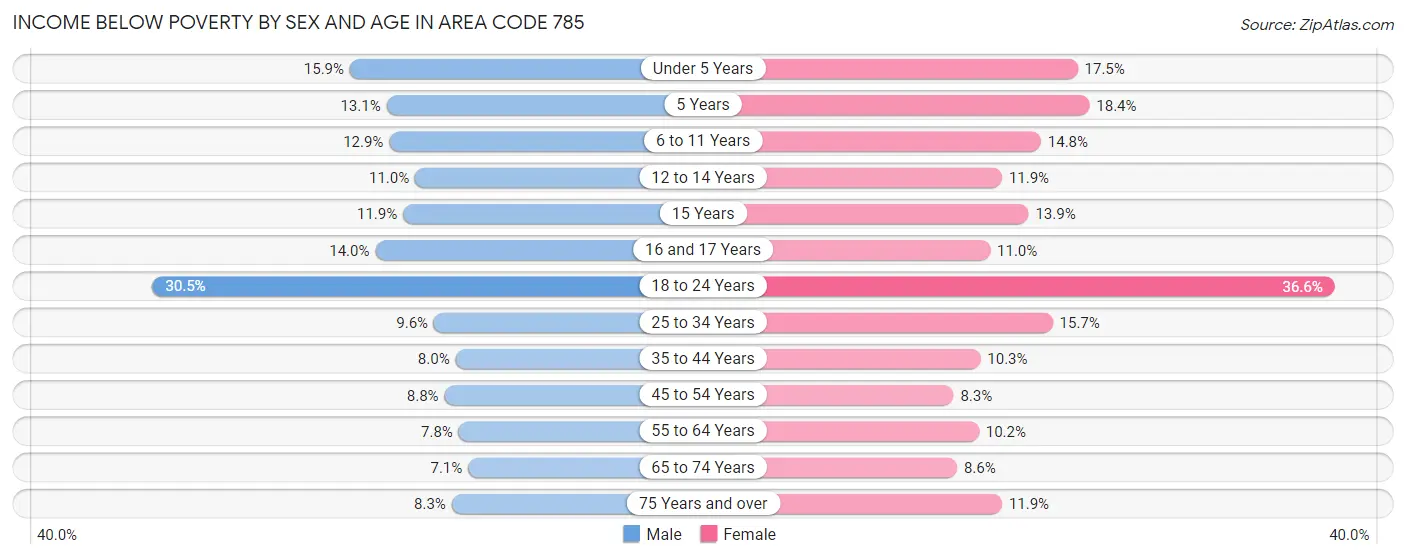
Income Below Poverty by Sex and Age in Area Code 785
With 12.1% poverty level for males and 14.5% for females among the residents of Area Code 785, 18 to 24 year old males and 18 to 24 year old females are the most vulnerable to poverty, with 13,765 males (30.5%) and 14,895 females (36.6%) in their respective age groups living below the poverty level.
| Age Bracket | Male | Female |
| Under 5 Years | 3,707 (15.9%) | 3,866 (17.5%) |
| 5 Years | 713 (13.1%) | 799 (18.4%) |
| 6 to 11 Years | 3,889 (12.9%) | 4,101 (14.8%) |
| 12 to 14 Years | 1,556 (11.0%) | 1,737 (11.9%) |
| 15 Years | 616 (11.9%) | 667 (13.9%) |
| 16 and 17 Years | 1,364 (14.0%) | 1,026 (11.0%) |
| 18 to 24 Years | 13,765 (30.5%) | 14,895 (36.6%) |
| 25 to 34 Years | 4,773 (9.6%) | 7,373 (15.7%) |
| 35 to 44 Years | 3,791 (8.0%) | 4,597 (10.3%) |
| 45 to 54 Years | 3,570 (8.8%) | 3,287 (8.3%) |
| 55 to 64 Years | 3,699 (7.8%) | 5,007 (10.2%) |
| 65 to 74 Years | 2,669 (7.1%) | 3,379 (8.6%) |
| 75 Years and over | 1,872 (8.3%) | 3,656 (11.9%) |
| Total | 45,984 (12.1%) | 54,390 (14.5%) |
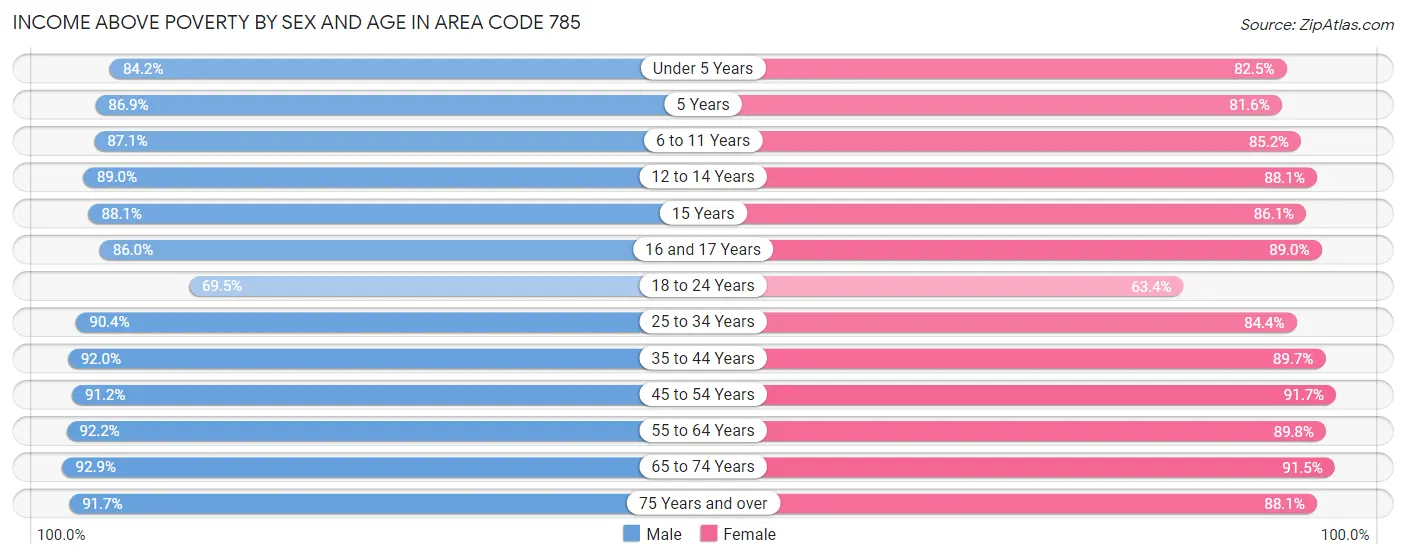
Income Above Poverty by Sex and Age in Area Code 785
According to the poverty statistics in Area Code 785, males aged 65 to 74 years and females aged 45 to 54 years are the age groups that are most secure financially, with 92.9% of males and 91.7% of females in these age groups living above the poverty line.
| Age Bracket | Male | Female |
| Under 5 Years | 19,683 (84.2%) | 18,211 (82.5%) |
| 5 Years | 4,717 (86.9%) | 3,547 (81.6%) |
| 6 to 11 Years | 26,179 (87.1%) | 23,639 (85.2%) |
| 12 to 14 Years | 12,571 (89.0%) | 12,876 (88.1%) |
| 15 Years | 4,559 (88.1%) | 4,145 (86.1%) |
| 16 and 17 Years | 8,407 (86.0%) | 8,293 (89.0%) |
| 18 to 24 Years | 31,355 (69.5%) | 25,811 (63.4%) |
| 25 to 34 Years | 44,903 (90.4%) | 39,742 (84.4%) |
| 35 to 44 Years | 43,557 (92.0%) | 40,089 (89.7%) |
| 45 to 54 Years | 36,883 (91.2%) | 36,349 (91.7%) |
| 55 to 64 Years | 43,901 (92.2%) | 44,246 (89.8%) |
| 65 to 74 Years | 35,095 (92.9%) | 36,144 (91.4%) |
| 75 Years and over | 20,713 (91.7%) | 27,080 (88.1%) |
| Total | 332,523 (87.8%) | 320,172 (85.5%) |
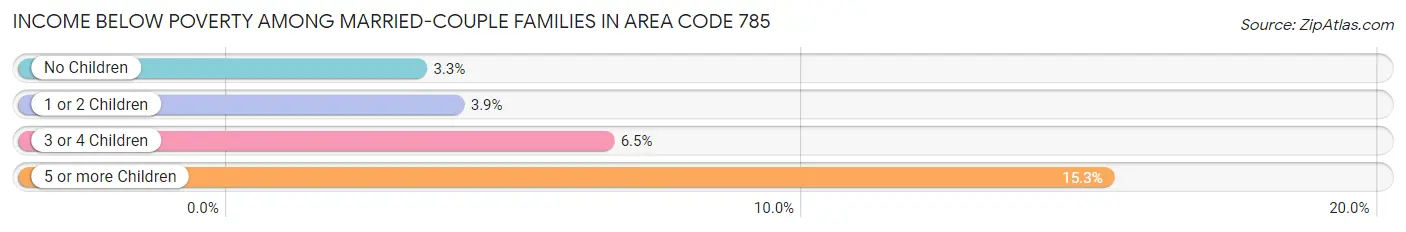
Income Below Poverty Among Married-Couple Families in Area Code 785
The poverty statistics for married-couple families in Area Code 785 show that 3.9% or 5,947 of the total 152,834 families live below the poverty line. Families with 5 or more children have the highest poverty rate of 15.3%, comprising of 208 families. On the other hand, families with no children have the lowest poverty rate of 3.3%, which includes 3,041 families.
| Children | Above Poverty | Below Poverty |
| No Children | 89,811 (96.7%) | 3,041 (3.3%) |
| 1 or 2 Children | 41,782 (96.1%) | 1,709 (3.9%) |
| 3 or 4 Children | 14,139 (93.5%) | 989 (6.5%) |
| 5 or more Children | 1,155 (84.7%) | 208 (15.3%) |
| Total | 146,887 (96.1%) | 5,947 (3.9%) |
Income Below Poverty Among Single-Parent Households in Area Code 785
According to the poverty data in Area Code 785, 14.8% or 1,889 single-father households and 29.4% or 8,041 single-mother households are living below the poverty line. Among single-father households, those with 3 or 4 children have the highest poverty rate, with 520 households (34.7%) experiencing poverty. Likewise, among single-mother households, those with 5 or more children have the highest poverty rate, with 192 households (66.4%) falling below the poverty line.
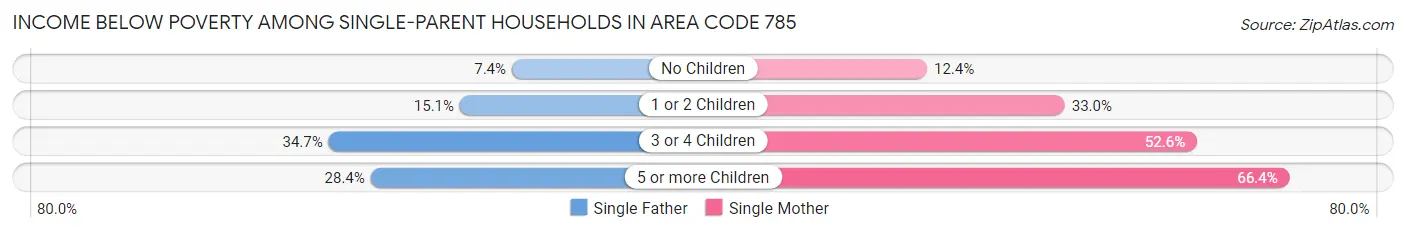
| Children | Single Father | Single Mother |
| No Children | 339 (7.4%) | 1,044 (12.4%) |
| 1 or 2 Children | 999 (15.1%) | 5,018 (33.0%) |
| 3 or 4 Children | 520 (34.7%) | 1,787 (52.6%) |
| 5 or more Children | 31 (28.4%) | 192 (66.4%) |
| Total | 1,889 (14.8%) | 8,041 (29.4%) |
Income Below Poverty Among Married-Couple vs Single-Parent Households in Area Code 785
The poverty data for Area Code 785 shows that 5,947 of the married-couple family households (3.9%) and 9,930 of the single-parent households (24.8%) are living below the poverty level. Within the married-couple family households, those with 5 or more children have the highest poverty rate, with 208 households (15.3%) falling below the poverty line. Among the single-parent households, those with 5 or more children have the highest poverty rate, with 223 household (56.0%) living below poverty.
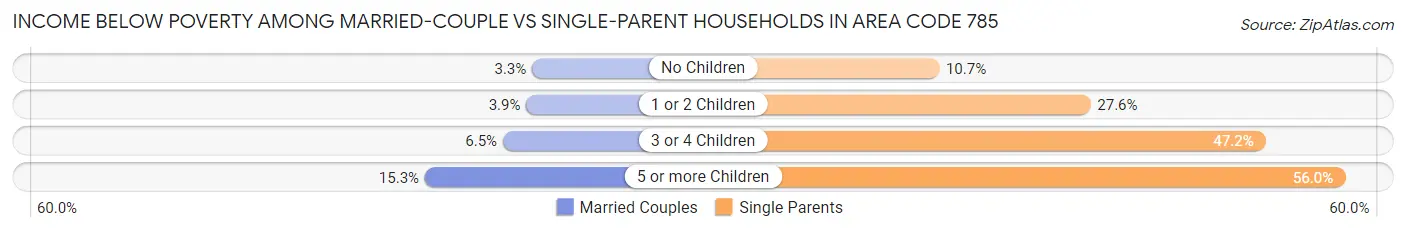
| Children | Married-Couple Families | Single-Parent Households |
| No Children | 3,041 (3.3%) | 1,383 (10.6%) |
| 1 or 2 Children | 1,709 (3.9%) | 6,017 (27.6%) |
| 3 or 4 Children | 989 (6.5%) | 2,307 (47.1%) |
| 5 or more Children | 208 (15.3%) | 223 (56.0%) |
| Total | 5,947 (3.9%) | 9,930 (24.8%) |
Race in Area Code 785
The most populous races in Area Code 785 are White / Caucasian (665,205 | 84.1%), Hispanic or Latino (66,090 | 8.4%), and Two or more Races (49,661 | 6.3%).
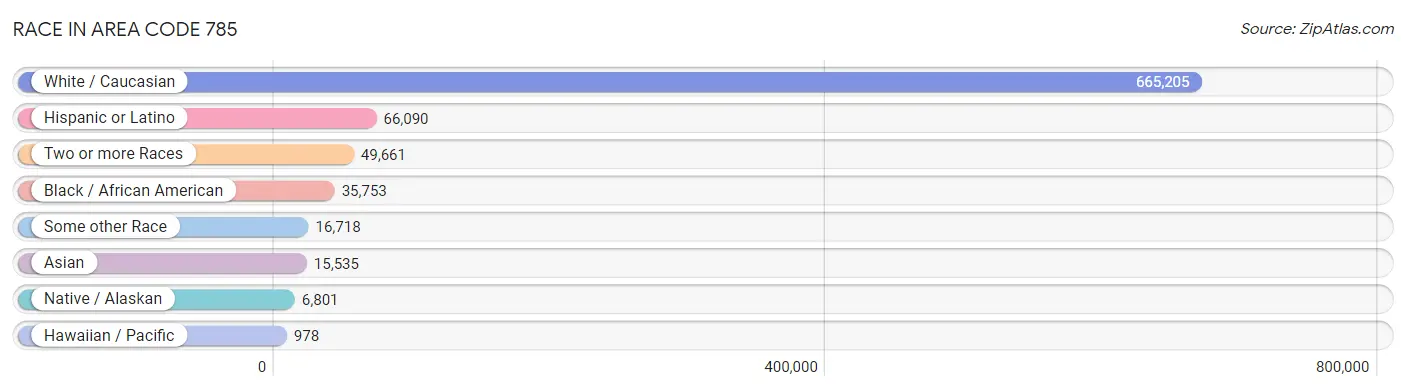
| Race | # Population | % Population |
| Asian | 15,535 | 2.0% |
| Black / African American | 35,753 | 4.5% |
| Hawaiian / Pacific | 978 | 0.1% |
| Hispanic or Latino | 66,090 | 8.4% |
| Native / Alaskan | 6,801 | 0.9% |
| White / Caucasian | 665,205 | 84.1% |
| Two or more Races | 49,661 | 6.3% |
| Some other Race | 16,718 | 2.1% |
| Total | 790,651 | 100.0% |
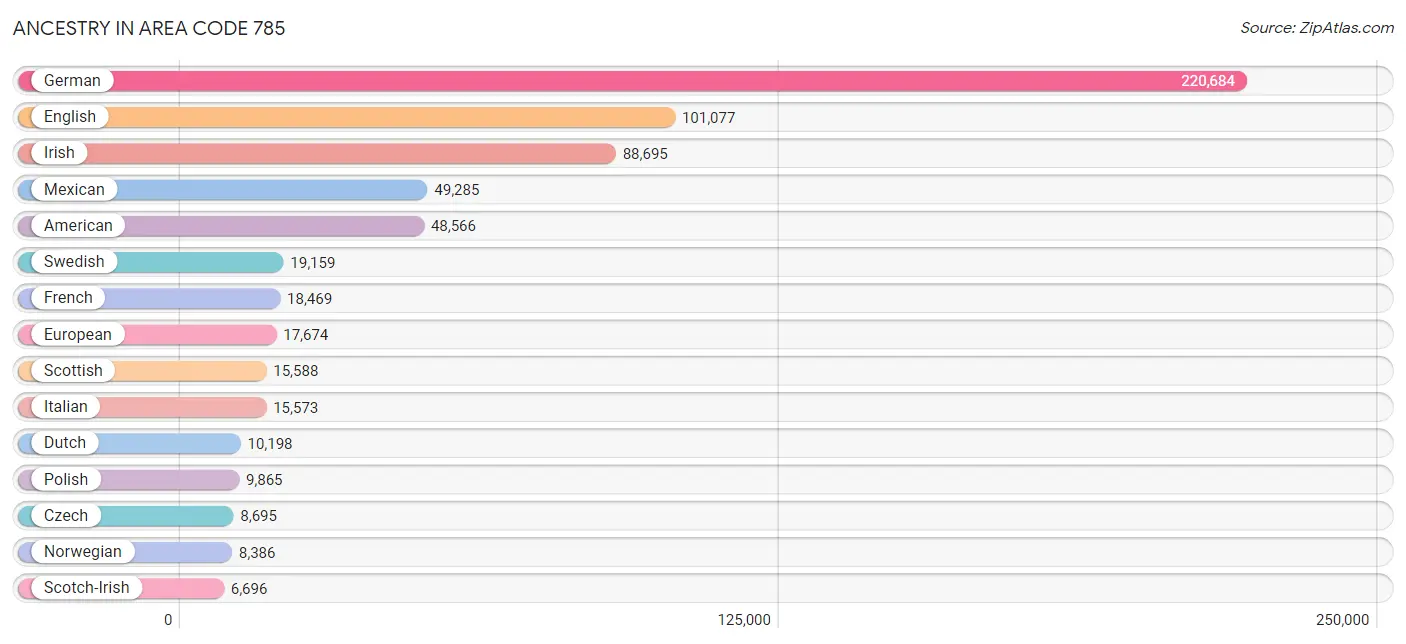
Ancestry in Area Code 785
The most populous ancestries reported in Area Code 785 are German (220,684 | 27.9%), English (101,077 | 12.8%), Irish (88,695 | 11.2%), Mexican (49,285 | 6.2%), and American (48,566 | 6.1%), together accounting for 64.3% of all Area Code 785 residents.
| Ancestry | # Population | % Population |
| African | 1,932 | 0.2% |
| Alaska Native | 66 | 0.0% |
| Alaskan Athabascan | 1 | 0.0% |
| Albanian | 27 | 0.0% |
| Alsatian | 26 | 0.0% |
| American | 48,566 | 6.1% |
| Apache | 354 | 0.0% |
| Arab | 1,729 | 0.2% |
| Arapaho | 2 | 0.0% |
| Argentinean | 185 | 0.0% |
| Armenian | 107 | 0.0% |
| Australian | 184 | 0.0% |
| Austrian | 1,588 | 0.2% |
| Bahamian | 9 | 0.0% |
| Bangladeshi | 110 | 0.0% |
| Barbadian | 20 | 0.0% |
| Basque | 26 | 0.0% |
| Belgian | 1,478 | 0.2% |
| Belizean | 15 | 0.0% |
| Bermudan | 8 | 0.0% |
| Bhutanese | 1,975 | 0.3% |
| Blackfeet | 840 | 0.1% |
| Bolivian | 182 | 0.0% |
| Brazilian | 340 | 0.0% |
| British | 4,039 | 0.5% |
| British West Indian | 14 | 0.0% |
| Bulgarian | 167 | 0.0% |
| Burmese | 2,784 | 0.4% |
| Cajun | 69 | 0.0% |
| Cambodian | 7 | 0.0% |
| Canadian | 802 | 0.1% |
| Cape Verdean | 7 | 0.0% |
| Carpatho Rusyn | 9 | 0.0% |
| Celtic | 85 | 0.0% |
| Central American | 2,757 | 0.4% |
| Central American Indian | 504 | 0.1% |
| Cherokee | 4,418 | 0.6% |
| Cheyenne | 122 | 0.0% |
| Chickasaw | 168 | 0.0% |
| Chilean | 191 | 0.0% |
| Chinese | 7 | 0.0% |
| Chippewa | 282 | 0.0% |
| Choctaw | 502 | 0.1% |
| Colombian | 582 | 0.1% |
| Comanche | 274 | 0.0% |
| Costa Rican | 131 | 0.0% |
| Cree | 109 | 0.0% |
| Creek | 356 | 0.1% |
| Croatian | 693 | 0.1% |
| Crow | 143 | 0.0% |
| Cuban | 1,216 | 0.2% |
| Czech | 8,695 | 1.1% |
| Czechoslovakian | 1,289 | 0.2% |
| Danish | 3,936 | 0.5% |
| Delaware | 231 | 0.0% |
| Dominican | 370 | 0.1% |
| Dutch | 10,198 | 1.3% |
| Dutch West Indian | 42 | 0.0% |
| Eastern European | 1,041 | 0.1% |
| Ecuadorian | 76 | 0.0% |
| Egyptian | 219 | 0.0% |
| English | 101,077 | 12.8% |
| Estonian | 13 | 0.0% |
| Ethiopian | 344 | 0.0% |
| European | 17,674 | 2.2% |
| Filipino | 121 | 0.0% |
| Finnish | 740 | 0.1% |
| French | 18,469 | 2.3% |
| French American Indian | 129 | 0.0% |
| French Canadian | 3,200 | 0.4% |
| German | 220,684 | 27.9% |
| German Russian | 994 | 0.1% |
| Ghanaian | 60 | 0.0% |
| Greek | 993 | 0.1% |
| Guamanian / Chamorro | 304 | 0.0% |
| Guatemalan | 929 | 0.1% |
| Haitian | 42 | 0.0% |
| Honduran | 321 | 0.0% |
| Hopi | 15 | 0.0% |
| Houma | 9 | 0.0% |
| Hungarian | 1,436 | 0.2% |
| Icelander | 21 | 0.0% |
| Indian (Asian) | 5,417 | 0.7% |
| Indonesian | 62 | 0.0% |
| Inupiat | 27 | 0.0% |
| Iranian | 288 | 0.0% |
| Iraqi | 391 | 0.1% |
| Irish | 88,695 | 11.2% |
| Iroquois | 183 | 0.0% |
| Israeli | 19 | 0.0% |
| Italian | 15,573 | 2.0% |
| Jamaican | 427 | 0.1% |
| Japanese | 303 | 0.0% |
| Jordanian | 117 | 0.0% |
| Kenyan | 379 | 0.1% |
| Kiowa | 148 | 0.0% |
| Korean | 4,385 | 0.5% |
| Laotian | 31 | 0.0% |
| Latvian | 53 | 0.0% |
| Lebanese | 277 | 0.0% |
| Liberian | 5 | 0.0% |
| Lithuanian | 598 | 0.1% |
| Luxembourger | 124 | 0.0% |
| Macedonian | 61 | 0.0% |
| Malaysian | 688 | 0.1% |
| Menominee | 42 | 0.0% |
| Mexican | 49,285 | 6.2% |
| Mexican American Indian | 561 | 0.1% |
| Mongolian | 33 | 0.0% |
| Moroccan | 80 | 0.0% |
| Native Hawaiian | 660 | 0.1% |
| Navajo | 855 | 0.1% |
| New Zealander | 20 | 0.0% |
| Nicaraguan | 575 | 0.1% |
| Nigerian | 471 | 0.1% |
| Northern European | 1,414 | 0.2% |
| Norwegian | 8,386 | 1.1% |
| Osage | 163 | 0.0% |
| Ottawa | 68 | 0.0% |
| Paiute | 33 | 0.0% |
| Pakistani | 572 | 0.1% |
| Palestinian | 62 | 0.0% |
| Panamanian | 204 | 0.0% |
| Paraguayan | 192 | 0.0% |
| Pennsylvania German | 549 | 0.1% |
| Peruvian | 325 | 0.0% |
| Pima | 42 | 0.0% |
| Polish | 9,865 | 1.3% |
| Portuguese | 850 | 0.1% |
| Potawatomi | 2,260 | 0.3% |
| Pueblo | 191 | 0.0% |
| Puerto Rican | 5,824 | 0.7% |
| Puget Sound Salish | 17 | 0.0% |
| Romanian | 218 | 0.0% |
| Russian | 4,471 | 0.6% |
| Salvadoran | 597 | 0.1% |
| Samoan | 249 | 0.0% |
| Scandinavian | 2,835 | 0.4% |
| Scotch-Irish | 6,696 | 0.9% |
| Scottish | 15,588 | 2.0% |
| Seminole | 51 | 0.0% |
| Senegalese | 428 | 0.1% |
| Serbian | 59 | 0.0% |
| Shoshone | 45 | 0.0% |
| Sioux | 1,014 | 0.1% |
| Slavic | 167 | 0.0% |
| Slovak | 325 | 0.0% |
| Slovene | 94 | 0.0% |
| South African | 107 | 0.0% |
| South American | 2,152 | 0.3% |
| South American Indian | 102 | 0.0% |
| Spaniard | 1,482 | 0.2% |
| Spanish | 1,099 | 0.1% |
| Spanish American | 16 | 0.0% |
| Spanish American Indian | 11 | 0.0% |
| Sri Lankan | 2,589 | 0.3% |
| Subsaharan African | 3,846 | 0.5% |
| Sudanese | 68 | 0.0% |
| Swedish | 19,159 | 2.4% |
| Swiss | 3,570 | 0.4% |
| Syrian | 193 | 0.0% |
| Thai | 2,416 | 0.3% |
| Tlingit-Haida | 30 | 0.0% |
| Tohono O'Odham | 51 | 0.0% |
| Tongan | 17 | 0.0% |
| Trinidadian and Tobagonian | 42 | 0.0% |
| Turkish | 201 | 0.0% |
| Ukrainian | 1,108 | 0.1% |
| Uruguayan | 17 | 0.0% |
| Ute | 15 | 0.0% |
| Venezuelan | 390 | 0.1% |
| Vietnamese | 385 | 0.1% |
| Welsh | 6,094 | 0.8% |
| West Indian | 228 | 0.0% |
| Yakama | 12 | 0.0% |
| Yaqui | 35 | 0.0% |
| Yugoslavian | 80 | 0.0% |
| Yuman | 49 | 0.0% |
| Yup'ik | 28 | 0.0% | View All 179 Rows |
Immigrants in Area Code 785
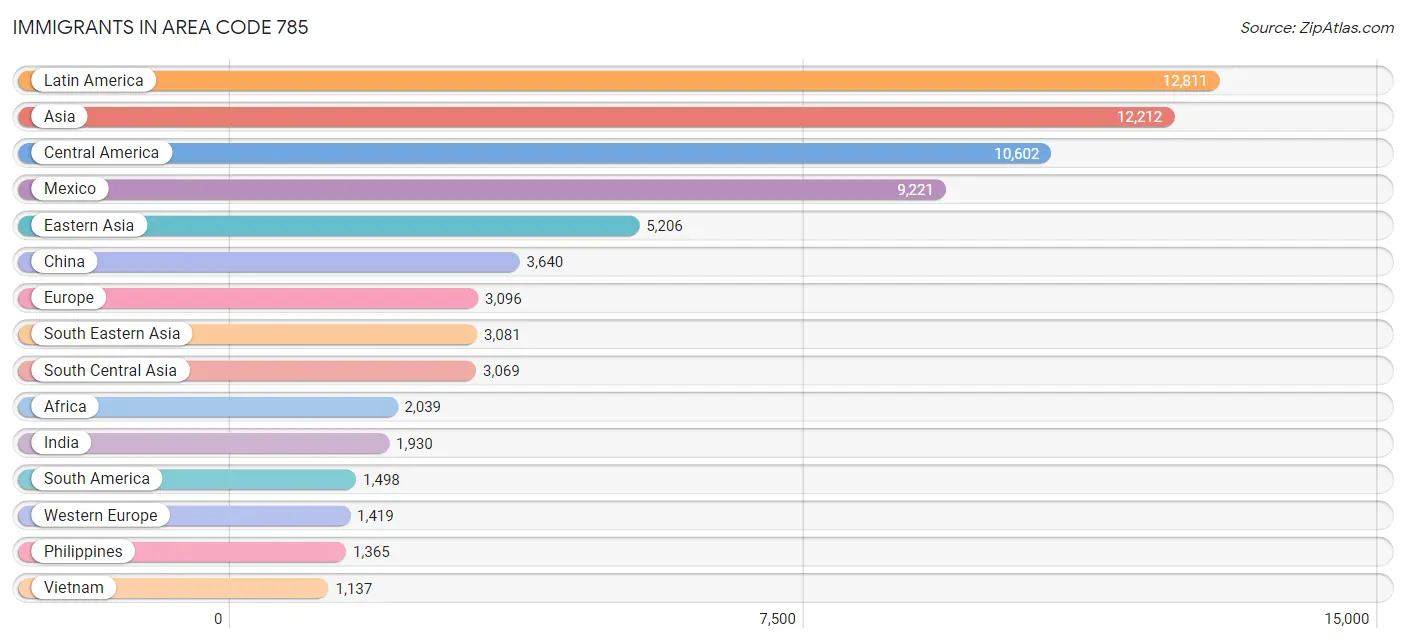
The most numerous immigrant groups reported in Area Code 785 came from Latin America (12,811 | 1.6%), Asia (12,212 | 1.5%), Central America (10,602 | 1.3%), Mexico (9,221 | 1.2%), and Eastern Asia (5,206 | 0.7%), together accounting for 6.3% of all Area Code 785 residents.
| Immigration Origin | # Population | % Population |
| Africa | 2,039 | 0.3% |
| Argentina | 89 | 0.0% |
| Asia | 12,212 | 1.5% |
| Australia | 81 | 0.0% |
| Austria | 13 | 0.0% |
| Azores | 12 | 0.0% |
| Bahamas | 14 | 0.0% |
| Bangladesh | 317 | 0.0% |
| Belgium | 51 | 0.0% |
| Belize | 12 | 0.0% |
| Bolivia | 26 | 0.0% |
| Brazil | 501 | 0.1% |
| Bulgaria | 79 | 0.0% |
| Cambodia | 6 | 0.0% |
| Cameroon | 40 | 0.0% |
| Canada | 688 | 0.1% |
| Caribbean | 711 | 0.1% |
| Central America | 10,602 | 1.3% |
| Chile | 96 | 0.0% |
| China | 3,640 | 0.5% |
| Colombia | 169 | 0.0% |
| Costa Rica | 41 | 0.0% |
| Cuba | 401 | 0.1% |
| Czechoslovakia | 36 | 0.0% |
| Denmark | 5 | 0.0% |
| Dominican Republic | 130 | 0.0% |
| Eastern Africa | 688 | 0.1% |
| Eastern Asia | 5,206 | 0.7% |
| Eastern Europe | 927 | 0.1% |
| Ecuador | 65 | 0.0% |
| Egypt | 49 | 0.0% |
| El Salvador | 175 | 0.0% |
| England | 220 | 0.0% |
| Eritrea | 26 | 0.0% |
| Ethiopia | 238 | 0.0% |
| Europe | 3,096 | 0.4% |
| Fiji | 60 | 0.0% |
| France | 180 | 0.0% |
| Germany | 1,099 | 0.1% |
| Ghana | 213 | 0.0% |
| Guatemala | 599 | 0.1% |
| Haiti | 29 | 0.0% |
| Honduras | 146 | 0.0% |
| Hong Kong | 50 | 0.0% |
| Hungary | 98 | 0.0% |
| India | 1,930 | 0.2% |
| Indonesia | 31 | 0.0% |
| Iran | 166 | 0.0% |
| Iraq | 165 | 0.0% |
| Italy | 55 | 0.0% |
| Jamaica | 118 | 0.0% |
| Japan | 587 | 0.1% |
| Jordan | 90 | 0.0% |
| Kazakhstan | 72 | 0.0% |
| Kenya | 347 | 0.0% |
| Korea | 979 | 0.1% |
| Kuwait | 140 | 0.0% |
| Laos | 294 | 0.0% |
| Latin America | 12,811 | 1.6% |
| Latvia | 28 | 0.0% |
| Lebanon | 57 | 0.0% |
| Lithuania | 6 | 0.0% |
| Malaysia | 33 | 0.0% |
| Mexico | 9,221 | 1.2% |
| Micronesia | 98 | 0.0% |
| Middle Africa | 86 | 0.0% |
| Moldova | 14 | 0.0% |
| Morocco | 25 | 0.0% |
| Nepal | 313 | 0.0% |
| Netherlands | 69 | 0.0% |
| Nicaragua | 259 | 0.0% |
| Nigeria | 182 | 0.0% |
| Northern Africa | 74 | 0.0% |
| Northern Europe | 624 | 0.1% |
| Norway | 36 | 0.0% |
| Oceania | 585 | 0.1% |
| Pakistan | 144 | 0.0% |
| Panama | 145 | 0.0% |
| Peru | 97 | 0.0% |
| Philippines | 1,365 | 0.2% |
| Poland | 82 | 0.0% |
| Portugal | 21 | 0.0% |
| Romania | 54 | 0.0% |
| Russia | 236 | 0.0% |
| Saudi Arabia | 76 | 0.0% |
| Scotland | 51 | 0.0% |
| Senegal | 360 | 0.1% |
| Serbia | 38 | 0.0% |
| Singapore | 33 | 0.0% |
| South Africa | 283 | 0.0% |
| South America | 1,498 | 0.2% |
| South Central Asia | 3,069 | 0.4% |
| South Eastern Asia | 3,081 | 0.4% |
| Southern Europe | 126 | 0.0% |
| Spain | 50 | 0.0% |
| Sri Lanka | 97 | 0.0% |
| Sweden | 6 | 0.0% |
| Switzerland | 7 | 0.0% |
| Syria | 60 | 0.0% |
| Taiwan | 218 | 0.0% |
| Thailand | 182 | 0.0% |
| Trinidad and Tobago | 3 | 0.0% |
| Turkey | 49 | 0.0% |
| Ukraine | 168 | 0.0% |
| Uruguay | 16 | 0.0% |
| Uzbekistan | 15 | 0.0% |
| Venezuela | 303 | 0.0% |
| Vietnam | 1,137 | 0.1% |
| Western Africa | 812 | 0.1% |
| Western Asia | 856 | 0.1% |
| Western Europe | 1,419 | 0.2% |
| Zaire | 7 | 0.0% |
| Zimbabwe | 64 | 0.0% | View All 113 Rows |
Sex and Age in Area Code 785
Sex and Age in Area Code 785
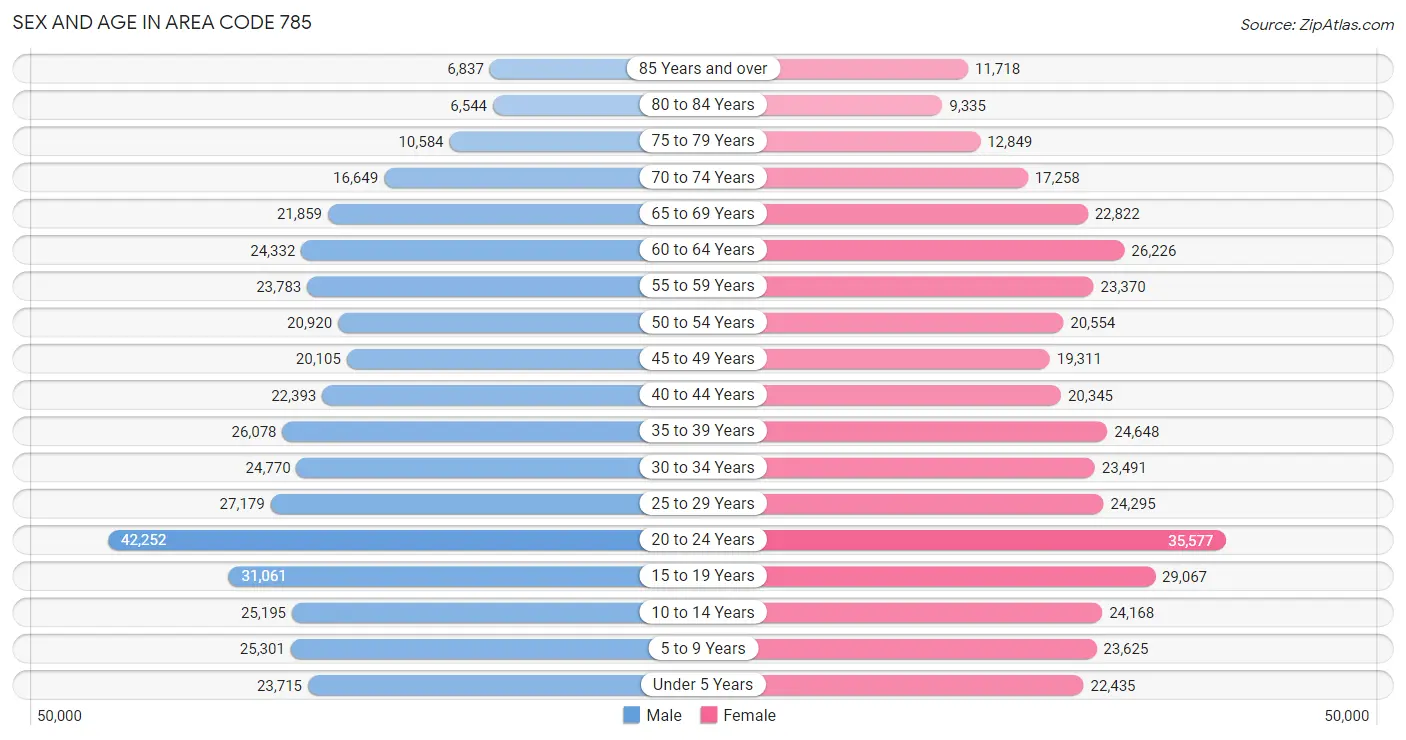
The most populous age groups in Area Code 785 are 20 to 24 Years (42,252 | 10.6%) for men and 20 to 24 Years (35,577 | 9.1%) for women.
| Age Bracket | Male | Female |
| Under 5 Years | 23,715 (5.9%) | 22,435 (5.7%) |
| 5 to 9 Years | 25,301 (6.3%) | 23,625 (6.0%) |
| 10 to 14 Years | 25,195 (6.3%) | 24,168 (6.2%) |
| 15 to 19 Years | 31,061 (7.8%) | 29,067 (7.4%) |
| 20 to 24 Years | 42,252 (10.6%) | 35,577 (9.1%) |
| 25 to 29 Years | 27,179 (6.8%) | 24,295 (6.2%) |
| 30 to 34 Years | 24,770 (6.2%) | 23,491 (6.0%) |
| 35 to 39 Years | 26,078 (6.5%) | 24,648 (6.3%) |
| 40 to 44 Years | 22,393 (5.6%) | 20,345 (5.2%) |
| 45 to 49 Years | 20,105 (5.0%) | 19,311 (4.9%) |
| 50 to 54 Years | 20,920 (5.2%) | 20,554 (5.3%) |
| 55 to 59 Years | 23,783 (5.9%) | 23,370 (6.0%) |
| 60 to 64 Years | 24,332 (6.1%) | 26,226 (6.7%) |
| 65 to 69 Years | 21,859 (5.5%) | 22,822 (5.8%) |
| 70 to 74 Years | 16,649 (4.2%) | 17,258 (4.4%) |
| 75 to 79 Years | 10,584 (2.6%) | 12,849 (3.3%) |
| 80 to 84 Years | 6,544 (1.6%) | 9,335 (2.4%) |
| 85 Years and over | 6,837 (1.7%) | 11,718 (3.0%) |
| Total | 399,557 (100.0%) | 391,094 (100.0%) |
Families and Households in Area Code 785
Median Family Size in Area Code 785
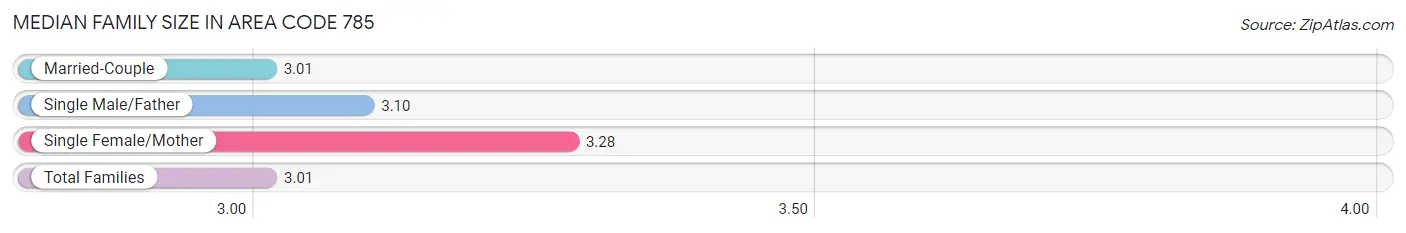
The median family size in Area Code 785 is 3.01 persons per family, with single female/mother families (27,313 | 14.2%) accounting for the largest median family size of 3.27955 persons per family. On the other hand, married-couple families (152,834 | 79.2%) represent the smallest median family size with 3.01 persons per family.
| Family Type | # Families | Family Size |
| Married-Couple | 152,834 (79.2%) | 3.01 |
| Single Male/Father | 12,790 (6.6%) | 3.10 |
| Single Female/Mother | 27,313 (14.2%) | 3.28 |
| Total Families | 192,937 (100.0%) | 3.01 |
Median Household Size in Area Code 785
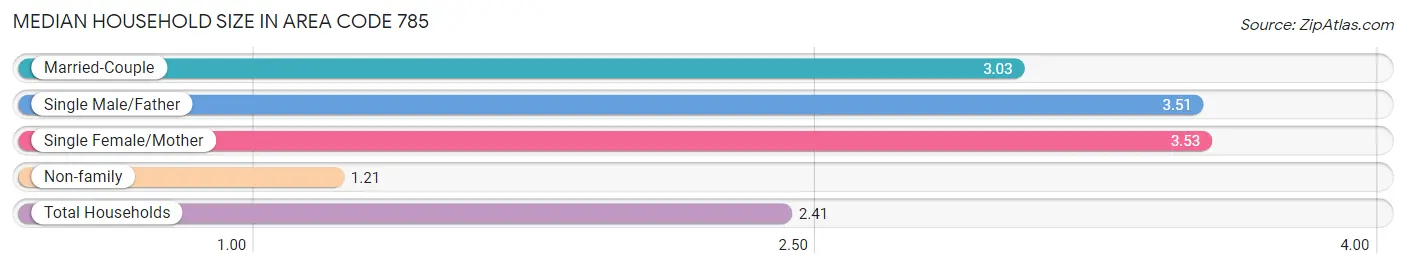
The median household size in Area Code 785 is 2.41 persons per household, with single female/mother households (27,313 | 8.5%) accounting for the largest median household size of 3.53223 persons per household. non-family households (127,617 | 39.8%) represent the smallest median household size with 1.21 persons per household.
| Household Type | # Households | Household Size |
| Married-Couple | 152,834 (47.7%) | 3.03 |
| Single Male/Father | 12,790 (4.0%) | 3.51 |
| Single Female/Mother | 27,313 (8.5%) | 3.53 |
| Non-family | 127,617 (39.8%) | 1.21 |
| Total Households | 320,554 (100.0%) | 2.41 |
Household Size by Marriage Status in Area Code 785
Out of a total of 320,554 households in Area Code 785, 192,937 (60.2%) are family households, while 127,617 (39.8%) are nonfamily households. The most numerous type of family households are 2-person households, comprising 96,655, and the most common type of nonfamily households are 1-person households, comprising 101,581.
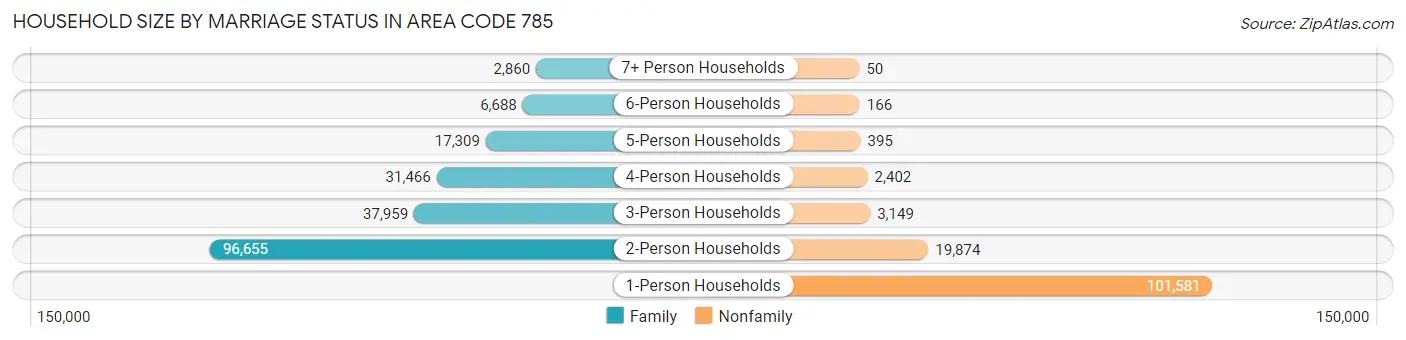
| Household Size | Family Households | Nonfamily Households |
| 1-Person Households | - | 101,581 (31.7%) |
| 2-Person Households | 96,655 (30.1%) | 19,874 (6.2%) |
| 3-Person Households | 37,959 (11.8%) | 3,149 (1.0%) |
| 4-Person Households | 31,466 (9.8%) | 2,402 (0.7%) |
| 5-Person Households | 17,309 (5.4%) | 395 (0.1%) |
| 6-Person Households | 6,688 (2.1%) | 166 (0.1%) |
| 7+ Person Households | 2,860 (0.9%) | 50 (0.0%) |
| Total | 192,937 (60.2%) | 127,617 (39.8%) |
Female Fertility in Area Code 785
Fertility by Age in Area Code 785
Average fertility rate in Area Code 785 is 93.7 births per 1,000 women. Women in the age bracket of 20 to 34 years have the highest fertility rate with 192.8 births per 1,000 women. Women in the age bracket of 20 to 34 years acount for 75.0% of all women with births.
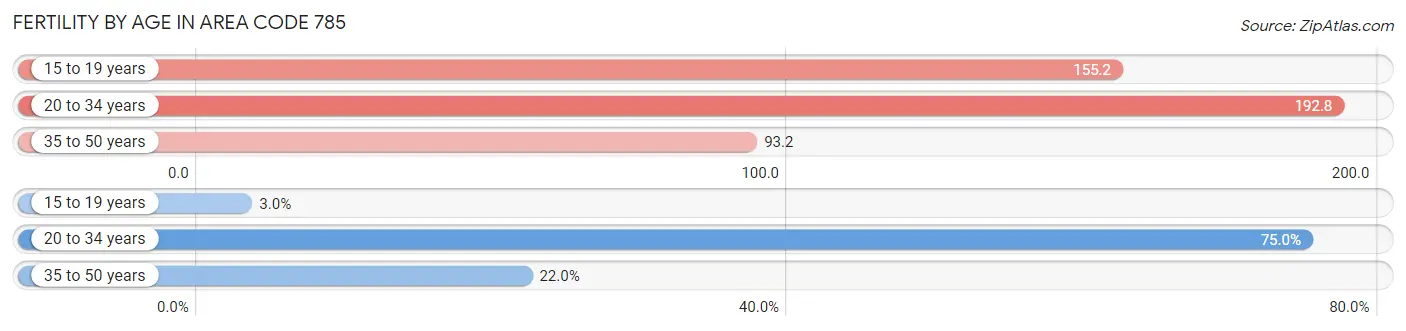
| Age Bracket | Women with Births | Births / 1,000 Women |
| 15 to 19 years | 309 (3.0%) | 155.2 |
| 20 to 34 years | 7,694 (75.0%) | 192.8 |
| 35 to 50 years | 2,260 (22.0%) | 93.2 |
| Total | 10,263 (100.0%) | 93.7 |
Fertility by Age by Marriage Status in Area Code 785
50.0% of women with births (10,263) in Area Code 785 are married. The highest percentage of unmarried women with births falls into 15 to 19 years age bracket with 94.5% of them unmarried at the time of birth, while the lowest percentage of unmarried women with births belong to 20 to 34 years age bracket with 55.5% of them unmarried.
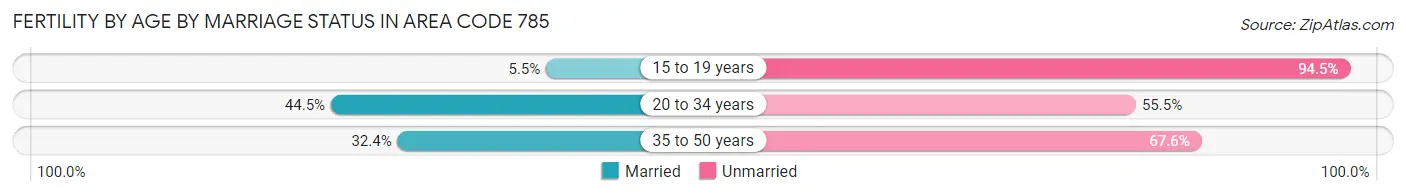
| Age Bracket | Married | Unmarried |
| 15 to 19 years | 17 (5.5%) | 292 (94.5%) |
| 20 to 34 years | 3,424 (44.5%) | 4,270 (55.5%) |
| 35 to 50 years | 733 (32.4%) | 1,527 (67.6%) |
| Total | 5,134 (50.0%) | 5,129 (50.0%) |
Fertility by Education in Area Code 785
Average fertility rate in Area Code 785 is 93.7 births per 1,000 women. Women with the education attainment of graduate degree have the highest fertility rate of 271.6 births per 1,000 women, while women with the education attainment of less than high school have the lowest fertility at 147.8 births per 1,000 women. Women with the education attainment of college or associate's degree represent 33.7% of all women with births.
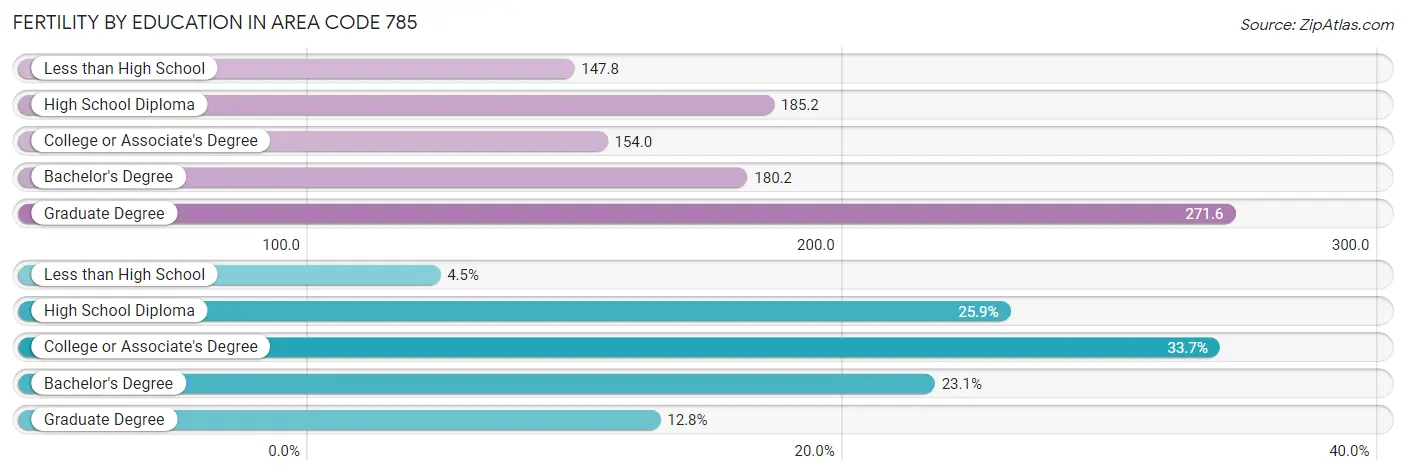
| Educational Attainment | Women with Births | Births / 1,000 Women |
| Less than High School | 465 (4.5%) | 147.8 |
| High School Diploma | 2,657 (25.9%) | 185.2 |
| College or Associate's Degree | 3,462 (33.7%) | 154.0 |
| Bachelor's Degree | 2,367 (23.1%) | 180.2 |
| Graduate Degree | 1,312 (12.8%) | 271.6 |
| Total | 10,263 (100.0%) | 93.7 |
Fertility by Education by Marriage Status in Area Code 785
50.0% of women with births in Area Code 785 are unmarried. Women with the educational attainment of bachelor's degree are most likely to be married with 30.6% of them married at childbirth, while women with the educational attainment of less than high school are least likely to be married with 88.6% of them unmarried at childbirth.
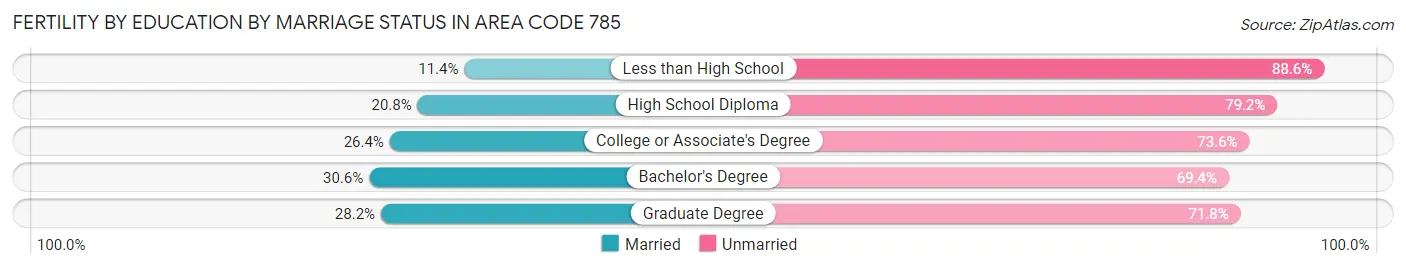
| Educational Attainment | Married | Unmarried |
| Less than High School | 53 (11.4%) | 412 (88.6%) |
| High School Diploma | 553 (20.8%) | 2,104 (79.2%) |
| College or Associate's Degree | 915 (26.4%) | 2,547 (73.6%) |
| Bachelor's Degree | 724 (30.6%) | 1,643 (69.4%) |
| Graduate Degree | 370 (28.2%) | 942 (71.8%) |
| Total | 5,134 (50.0%) | 5,129 (50.0%) |
Employment Characteristics in Area Code 785
Employment by Class of Employer in Area Code 785
Among the 395,957 employed individuals in Area Code 785, private company employees (228,218 | 57.6%), not-for-profit organizations (34,925 | 8.8%), and state government employees (34,207 | 8.6%) make up the most common classes of employment.
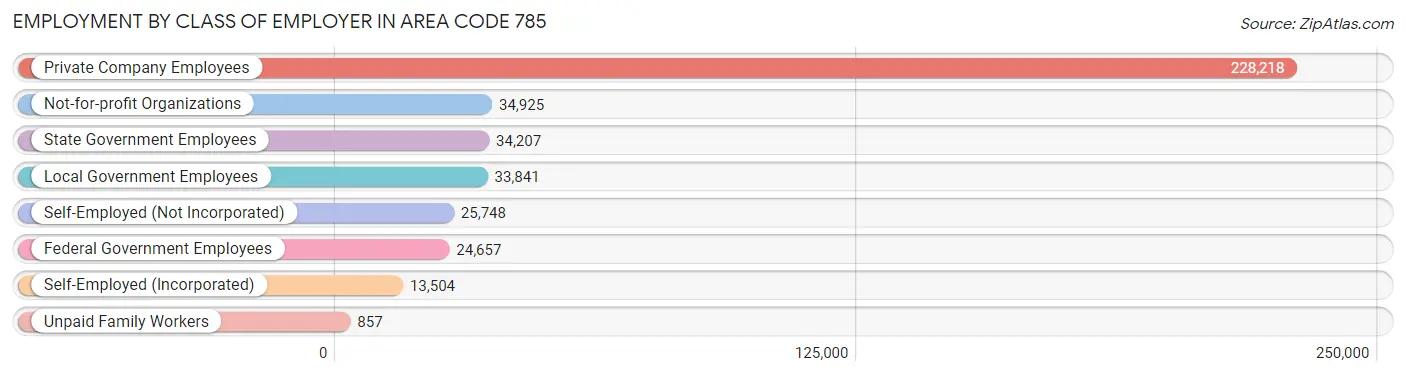
| Employer Class | # Employees | % Employees |
| Private Company Employees | 228,218 | 57.6% |
| Self-Employed (Incorporated) | 13,504 | 3.4% |
| Self-Employed (Not Incorporated) | 25,748 | 6.5% |
| Not-for-profit Organizations | 34,925 | 8.8% |
| Local Government Employees | 33,841 | 8.6% |
| State Government Employees | 34,207 | 8.6% |
| Federal Government Employees | 24,657 | 6.2% |
| Unpaid Family Workers | 857 | 0.2% |
| Total | 395,957 | 100.0% |
Employment Status by Age in Area Code 785
According to the labor force statistics for Area Code 785, out of the total population over 16 years of age (636,169), 63.2% or 401,868 individuals are in the labor force, with 3.9% or 15,552 of them unemployed. The age group with the highest labor force participation rate is 30 to 34 years, with 86.7% or 41,833 individuals in the labor force. Within the labor force, the 16 to 19 years age range has the highest percentage of unemployed individuals, with 2,114.1% or 556,008 of them being unemployed.
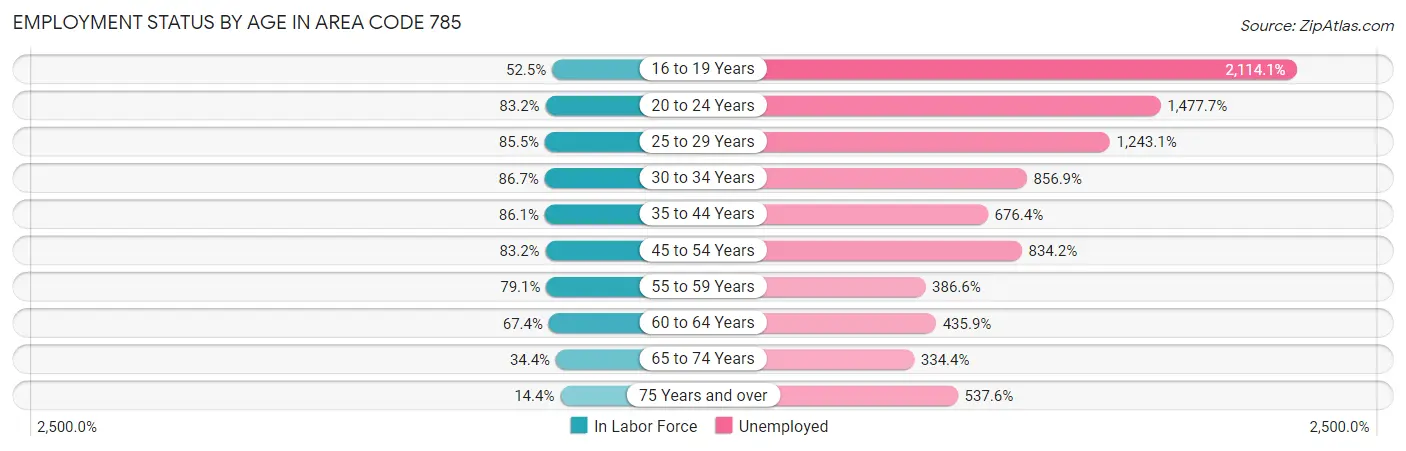
| Age Bracket | In Labor Force | Unemployed |
| 16 to 19 Years | 26,300 (52.5%) | 556,008 (2,114.1%) |
| 20 to 24 Years | 64,764 (83.2%) | 956,988 (1,477.7%) |
| 25 to 29 Years | 43,999 (85.5%) | 546,964 (1,243.1%) |
| 30 to 34 Years | 41,835 (86.7%) | 358,467 (856.9%) |
| 35 to 44 Years | 80,512 (86.1%) | 544,570 (676.4%) |
| 45 to 54 Years | 67,286 (83.2%) | 561,283 (834.2%) |
| 55 to 59 Years | 37,307 (79.1%) | 144,229 (386.6%) |
| 60 to 64 Years | 34,096 (67.4%) | 148,624 (435.9%) |
| 65 to 74 Years | 27,036 (34.4%) | 90,402 (334.4%) |
| 75 Years and over | 8,358 (14.4%) | 44,922 (537.6%) |
| Total | 401,898 (63.2%) | 15,539 (3.9%) |
Employment Status by Educational Attainment in Area Code 785
According to labor force statistics for Area Code 785, 80.5% of individuals (299,187) out of the total population between 25 and 64 years of age (371,800) are in the labor force, with 770.3% or 2,304,637 of them being unemployed. The group with the highest labor force participation rate are those with the educational attainment of bachelor's degree or higher, with 88.6% or 111,799 individuals in the labor force. Within the labor force, individuals with less than high school education have the highest percentage of unemployment, with 1,684.7% or 242,580 of them being unemployed.
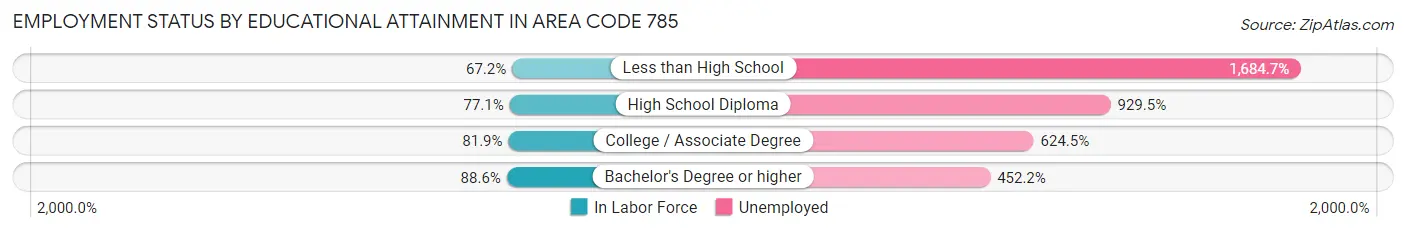
| Educational Attainment | In Labor Force | Unemployed |
| Less than High School | 14,400 (67.1%) | 361,250 (1,684.7%) |
| High School Diploma | 75,076 (77.1%) | 905,212 (929.5%) |
| College / Associate Degree | 103,767 (81.9%) | 791,604 (624.5%) |
| Bachelor's Degree or higher | 111,797 (88.6%) | 570,731 (452.2%) |
| Total | 299,184 (80.5%) | 2,863,975 (770.3%) |
Employment Occupations by Sex in Area Code 785
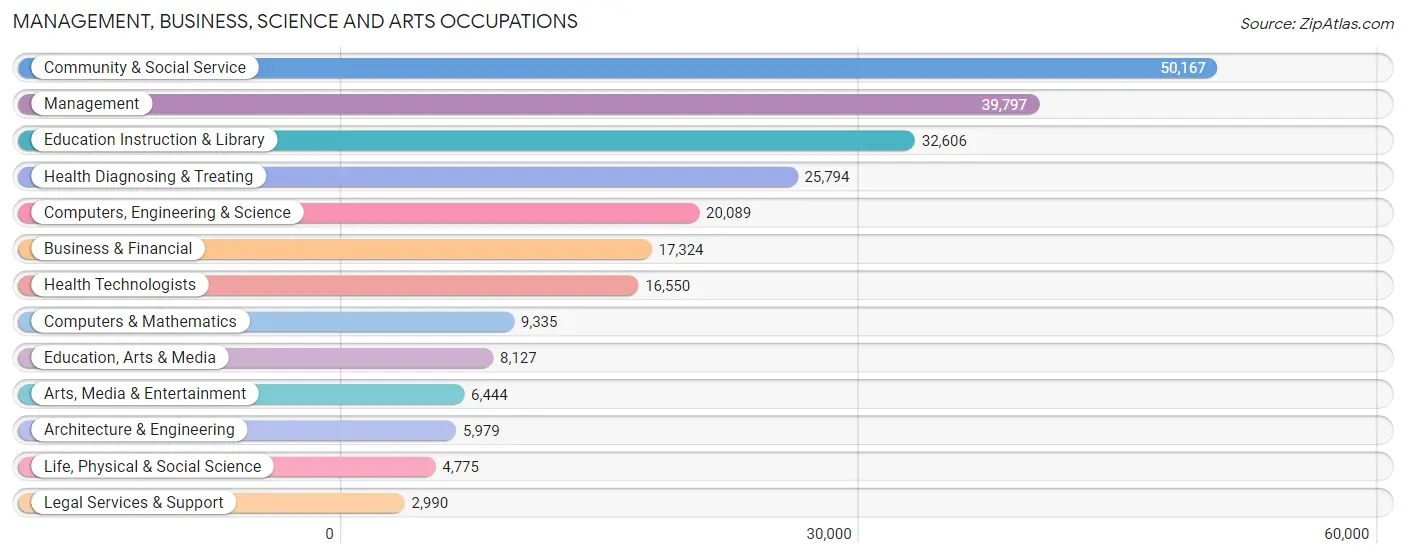
Management, Business, Science and Arts Occupations
The most common Management, Business, Science and Arts occupations in Area Code 785 are Community & Social Service (50,167 | 12.8%), Management (39,797 | 10.2%), Education Instruction & Library (32,606 | 8.3%), Health Diagnosing & Treating (25,794 | 6.6%), and Computers, Engineering & Science (20,089 | 5.1%).
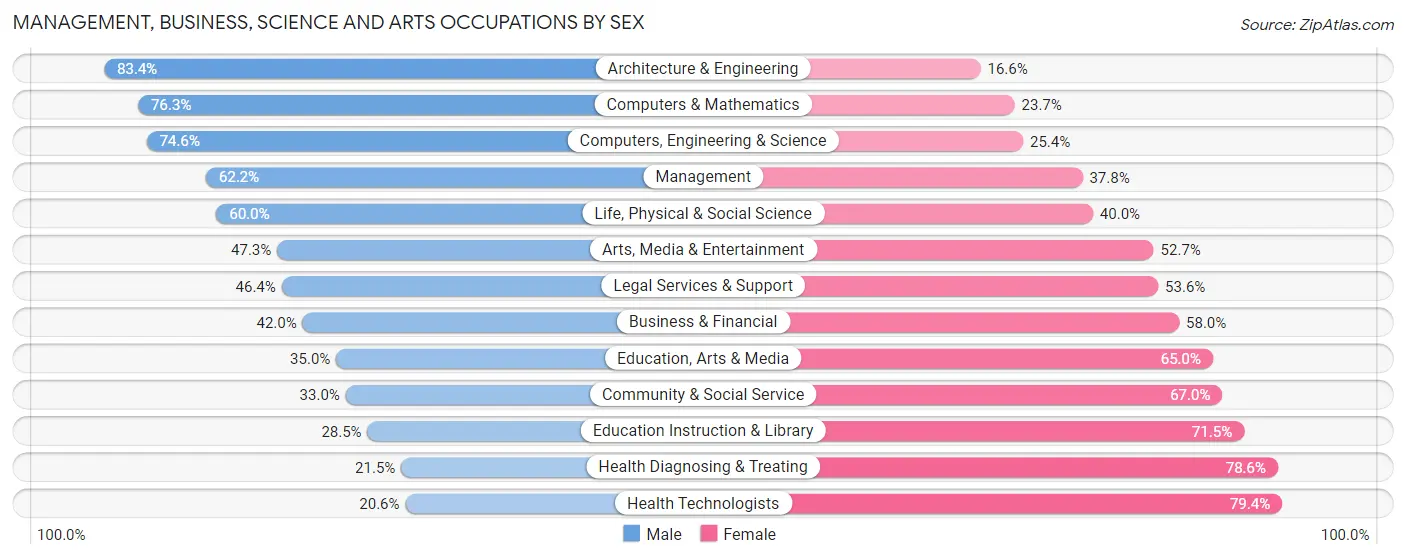
Management, Business, Science and Arts Occupations by Sex
Within the Management, Business, Science and Arts occupations in Area Code 785, the most male-oriented occupations are Architecture & Engineering (83.4%), Computers & Mathematics (76.3%), and Computers, Engineering & Science (74.6%), while the most female-oriented occupations are Health Technologists (79.4%), Health Diagnosing & Treating (78.5%), and Education Instruction & Library (71.5%).
| Occupation | Male | Female |
| Management | 24,746 (62.2%) | 15,051 (37.8%) |
| Business & Financial | 7,280 (42.0%) | 10,044 (58.0%) |
| Computers, Engineering & Science | 14,980 (74.6%) | 5,109 (25.4%) |
| Computers & Mathematics | 7,126 (76.3%) | 2,209 (23.7%) |
| Architecture & Engineering | 4,989 (83.4%) | 990 (16.6%) |
| Life, Physical & Social Science | 2,865 (60.0%) | 1,910 (40.0%) |
| Community & Social Service | 16,569 (33.0%) | 33,598 (67.0%) |
| Education, Arts & Media | 2,845 (35.0%) | 5,282 (65.0%) |
| Legal Services & Support | 1,387 (46.4%) | 1,603 (53.6%) |
| Education Instruction & Library | 9,287 (28.5%) | 23,319 (71.5%) |
| Arts, Media & Entertainment | 3,050 (47.3%) | 3,394 (52.7%) |
| Health Diagnosing & Treating | 5,534 (21.4%) | 20,260 (78.5%) |
| Health Technologists | 3,404 (20.6%) | 13,146 (79.4%) |
| Total (Category) | 69,109 (45.1%) | 84,062 (54.9%) |
| Total (Overall) | 204,031 (52.2%) | 186,907 (47.8%) |
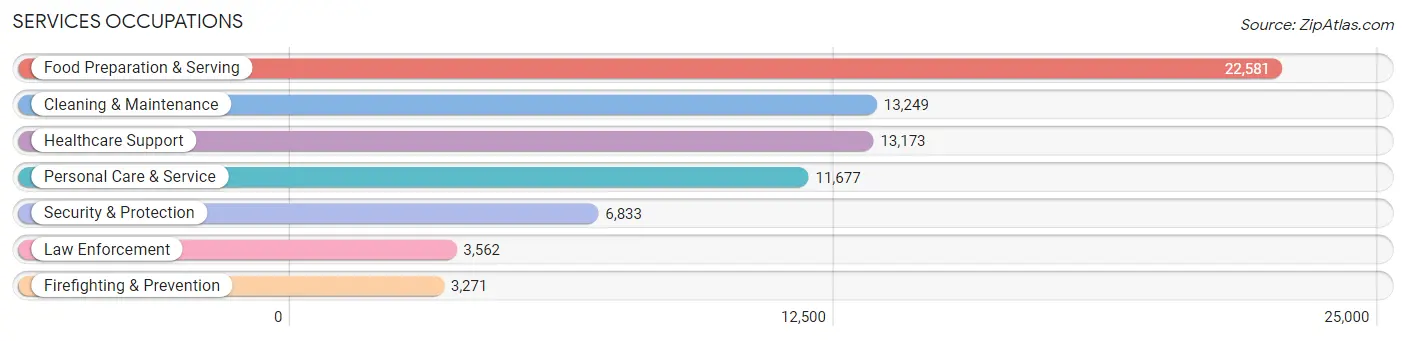
Services Occupations
The most common Services occupations in Area Code 785 are Food Preparation & Serving (22,581 | 5.8%), Cleaning & Maintenance (13,249 | 3.4%), Healthcare Support (13,173 | 3.4%), Personal Care & Service (11,677 | 3.0%), and Security & Protection (6,833 | 1.8%).
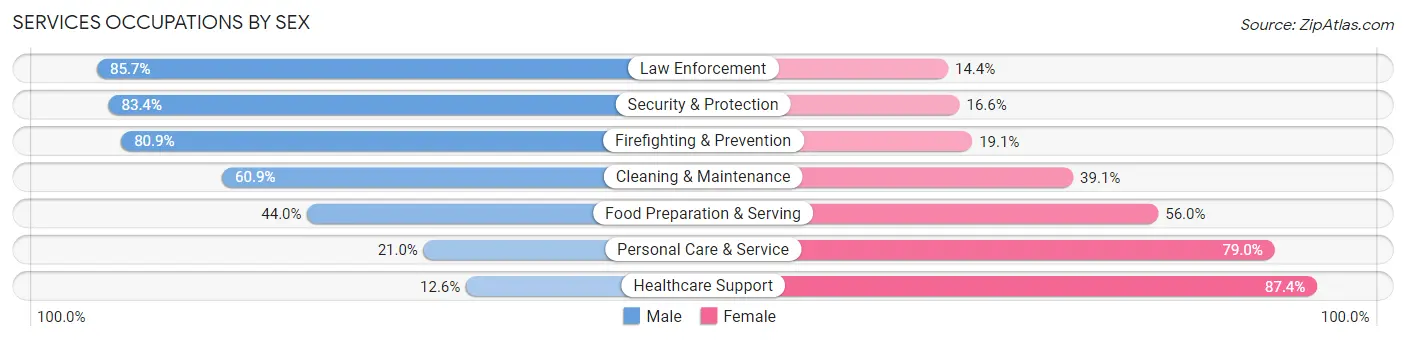
Services Occupations by Sex
Within the Services occupations in Area Code 785, the most male-oriented occupations are Law Enforcement (85.7%), Security & Protection (83.4%), and Firefighting & Prevention (80.9%), while the most female-oriented occupations are Healthcare Support (87.4%), Personal Care & Service (79.0%), and Food Preparation & Serving (56.0%).
| Occupation | Male | Female |
| Healthcare Support | 1,656 (12.6%) | 11,517 (87.4%) |
| Security & Protection | 5,696 (83.4%) | 1,137 (16.6%) |
| Firefighting & Prevention | 2,645 (80.9%) | 626 (19.1%) |
| Law Enforcement | 3,051 (85.7%) | 511 (14.3%) |
| Food Preparation & Serving | 9,939 (44.0%) | 12,642 (56.0%) |
| Cleaning & Maintenance | 8,065 (60.9%) | 5,184 (39.1%) |
| Personal Care & Service | 2,449 (21.0%) | 9,228 (79.0%) |
| Total (Category) | 27,805 (41.2%) | 39,708 (58.8%) |
| Total (Overall) | 204,031 (52.2%) | 186,907 (47.8%) |
Sales and Office Occupations
The most common Sales and Office occupations in Area Code 785 are Office & Administration (43,520 | 11.1%), and Sales & Related (33,162 | 8.5%).

Sales and Office Occupations by Sex
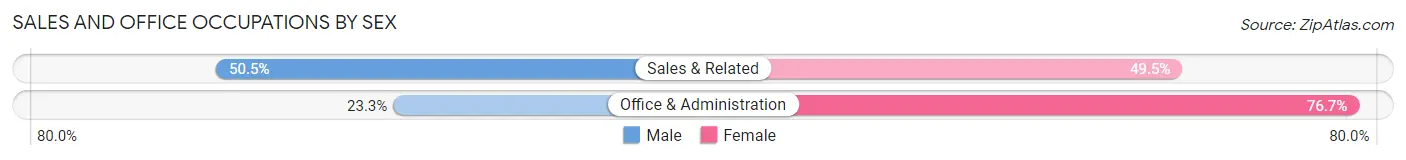
| Occupation | Male | Female |
| Sales & Related | 16,755 (50.5%) | 16,407 (49.5%) |
| Office & Administration | 10,145 (23.3%) | 33,375 (76.7%) |
| Total (Category) | 26,900 (35.1%) | 49,782 (64.9%) |
| Total (Overall) | 204,031 (52.2%) | 186,907 (47.8%) |
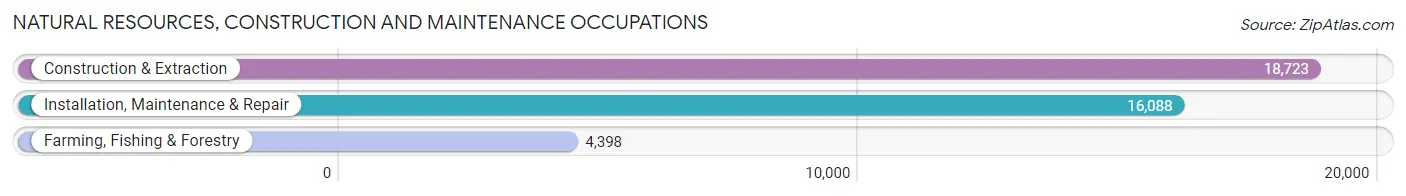
Natural Resources, Construction and Maintenance Occupations
The most common Natural Resources, Construction and Maintenance occupations in Area Code 785 are Construction & Extraction (18,723 | 4.8%), Installation, Maintenance & Repair (16,088 | 4.1%), and Farming, Fishing & Forestry (4,398 | 1.1%).
Natural Resources, Construction and Maintenance Occupations by Sex
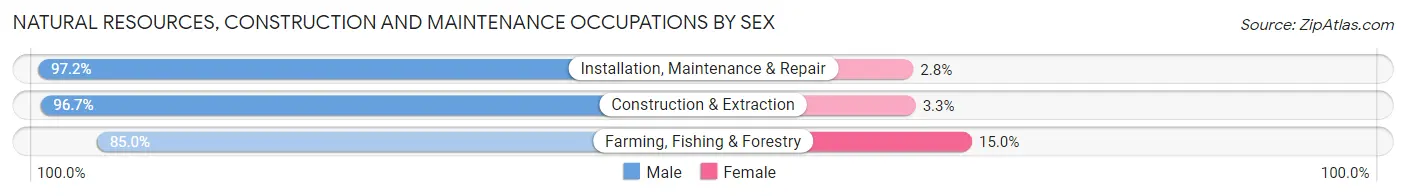
| Occupation | Male | Female |
| Farming, Fishing & Forestry | 3,738 (85.0%) | 660 (15.0%) |
| Construction & Extraction | 18,109 (96.7%) | 614 (3.3%) |
| Installation, Maintenance & Repair | 15,638 (97.2%) | 450 (2.8%) |
| Total (Category) | 37,485 (95.6%) | 1,724 (4.4%) |
| Total (Overall) | 204,031 (52.2%) | 186,907 (47.8%) |
Production, Transportation and Moving Occupations
The most common Production, Transportation and Moving occupations in Area Code 785 are Production (23,788 | 6.1%), Material Moving (17,047 | 4.4%), and Transportation (13,528 | 3.5%).
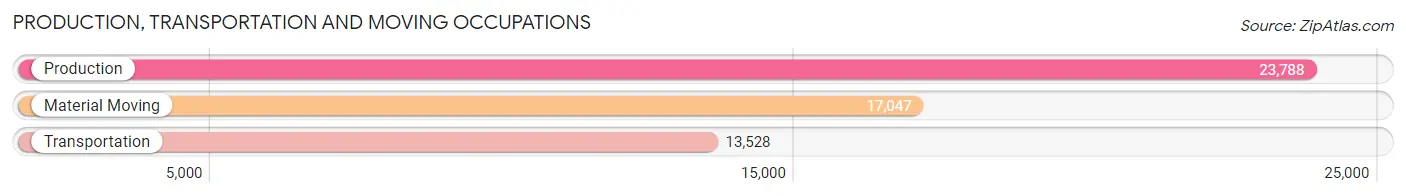
Production, Transportation and Moving Occupations by Sex
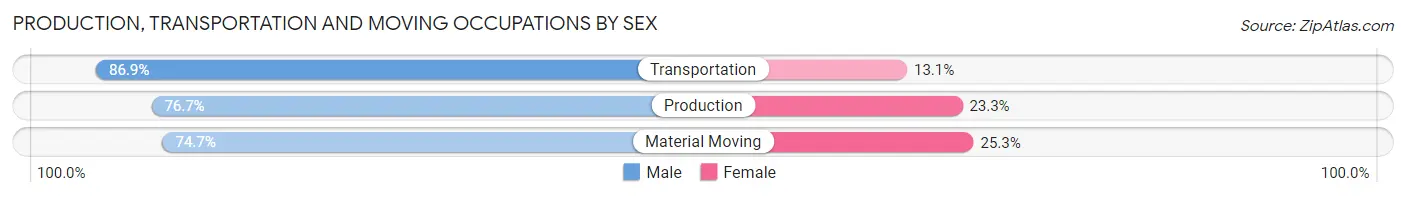
| Occupation | Male | Female |
| Production | 18,249 (76.7%) | 5,539 (23.3%) |
| Transportation | 11,753 (86.9%) | 1,775 (13.1%) |
| Material Moving | 12,730 (74.7%) | 4,317 (25.3%) |
| Total (Category) | 42,732 (78.6%) | 11,631 (21.4%) |
| Total (Overall) | 204,031 (52.2%) | 186,907 (47.8%) |
Employment Industries by Sex in Area Code 785
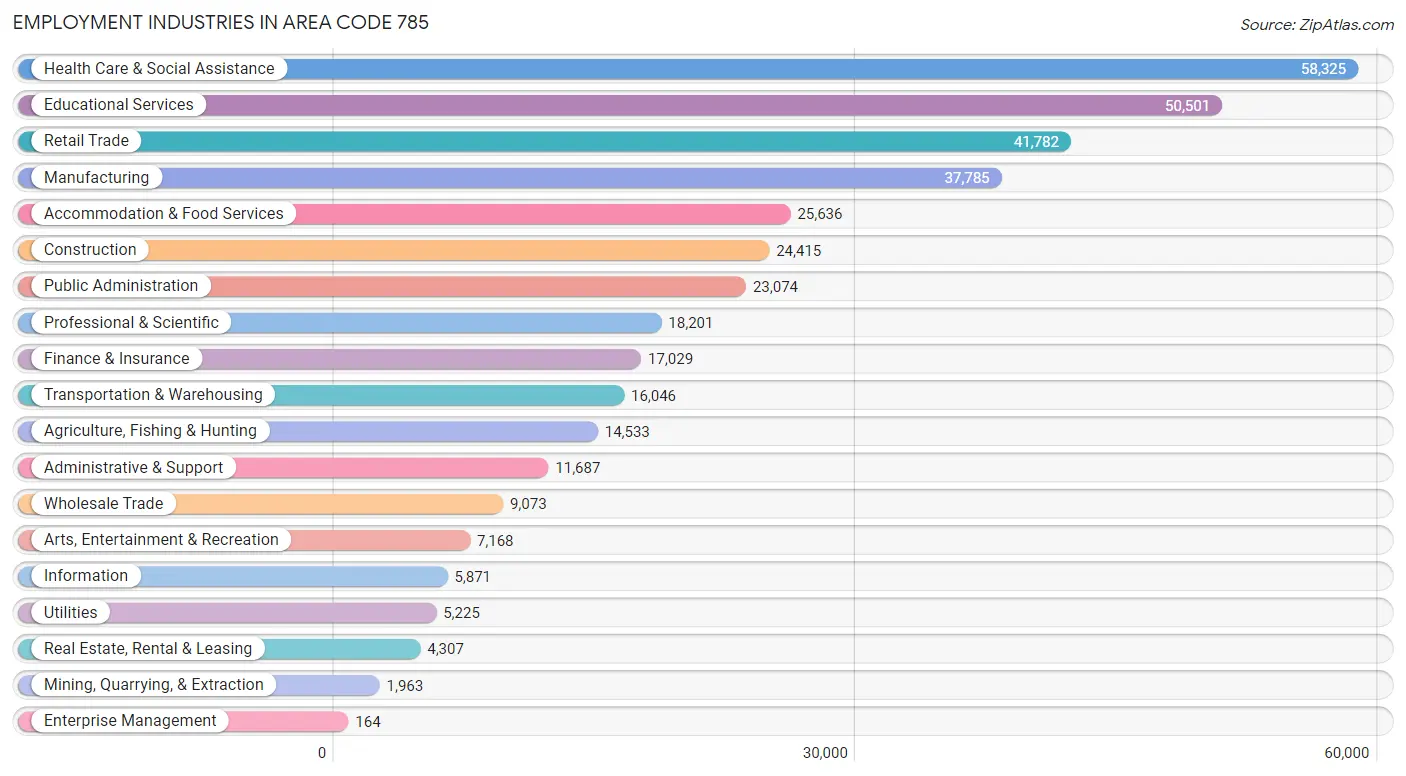
Employment Industries in Area Code 785
The major employment industries in Area Code 785 include Health Care & Social Assistance (58,325 | 14.9%), Educational Services (50,501 | 12.9%), Retail Trade (41,782 | 10.7%), Manufacturing (37,785 | 9.7%), and Accommodation & Food Services (25,636 | 6.6%).
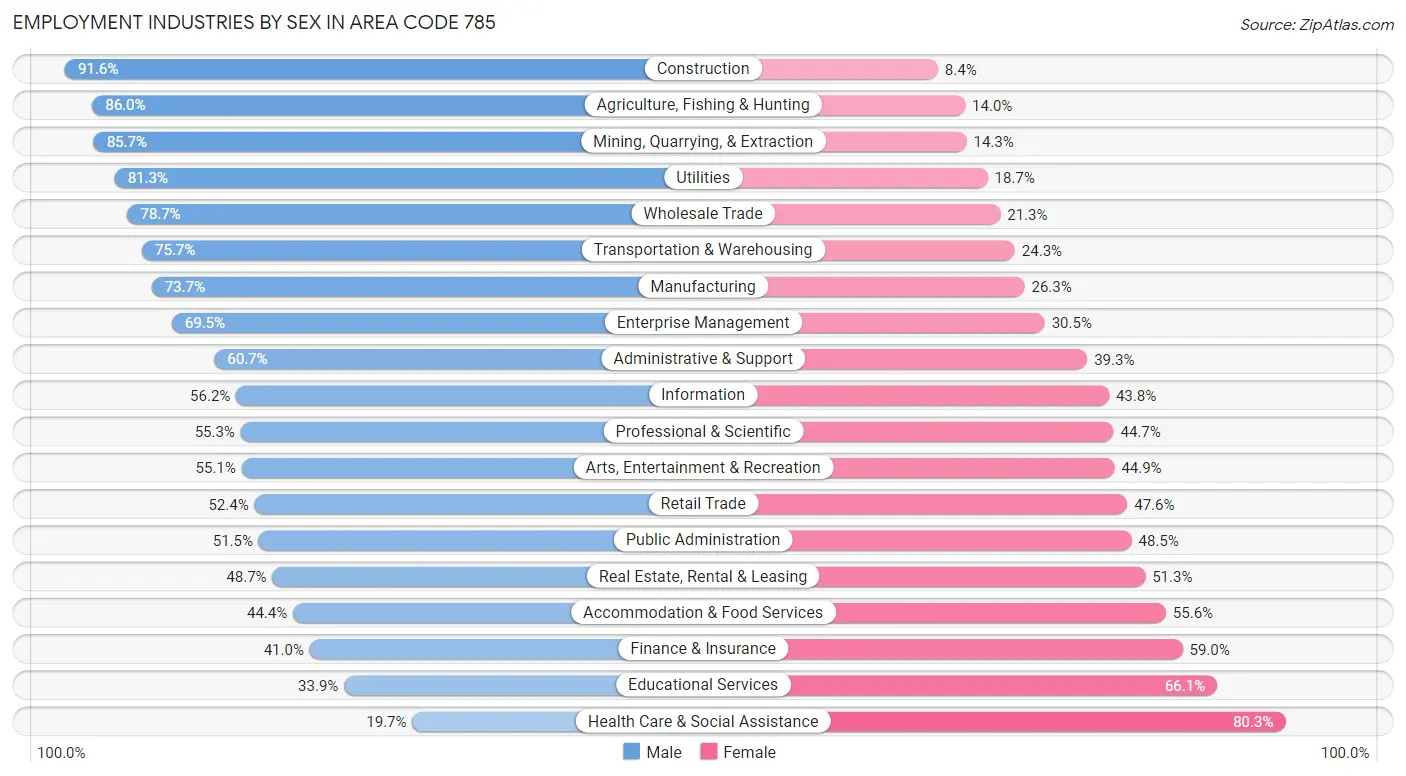
Employment Industries by Sex in Area Code 785
The Area Code 785 industries that see more men than women are Construction (91.6%), Agriculture, Fishing & Hunting (86.0%), and Mining, Quarrying, & Extraction (85.7%), whereas the industries that tend to have a higher number of women are Health Care & Social Assistance (80.3%), Educational Services (66.1%), and Finance & Insurance (59.0%).
| Industry | Male | Female |
| Agriculture, Fishing & Hunting | 12,495 (86.0%) | 2,038 (14.0%) |
| Mining, Quarrying, & Extraction | 1,682 (85.7%) | 281 (14.3%) |
| Construction | 22,369 (91.6%) | 2,046 (8.4%) |
| Manufacturing | 27,841 (73.7%) | 9,944 (26.3%) |
| Wholesale Trade | 7,141 (78.7%) | 1,932 (21.3%) |
| Retail Trade | 21,902 (52.4%) | 19,880 (47.6%) |
| Transportation & Warehousing | 12,143 (75.7%) | 3,903 (24.3%) |
| Utilities | 4,250 (81.3%) | 975 (18.7%) |
| Information | 3,300 (56.2%) | 2,571 (43.8%) |
| Finance & Insurance | 6,979 (41.0%) | 10,050 (59.0%) |
| Real Estate, Rental & Leasing | 2,098 (48.7%) | 2,209 (51.3%) |
| Professional & Scientific | 10,060 (55.3%) | 8,141 (44.7%) |
| Enterprise Management | 114 (69.5%) | 50 (30.5%) |
| Administrative & Support | 7,095 (60.7%) | 4,592 (39.3%) |
| Educational Services | 17,099 (33.9%) | 33,402 (66.1%) |
| Health Care & Social Assistance | 11,516 (19.7%) | 46,809 (80.3%) |
| Arts, Entertainment & Recreation | 3,948 (55.1%) | 3,220 (44.9%) |
| Accommodation & Food Services | 11,391 (44.4%) | 14,245 (55.6%) |
| Public Administration | 11,891 (51.5%) | 11,183 (48.5%) |
| Total | 204,031 (52.2%) | 186,907 (47.8%) |
Education in Area Code 785
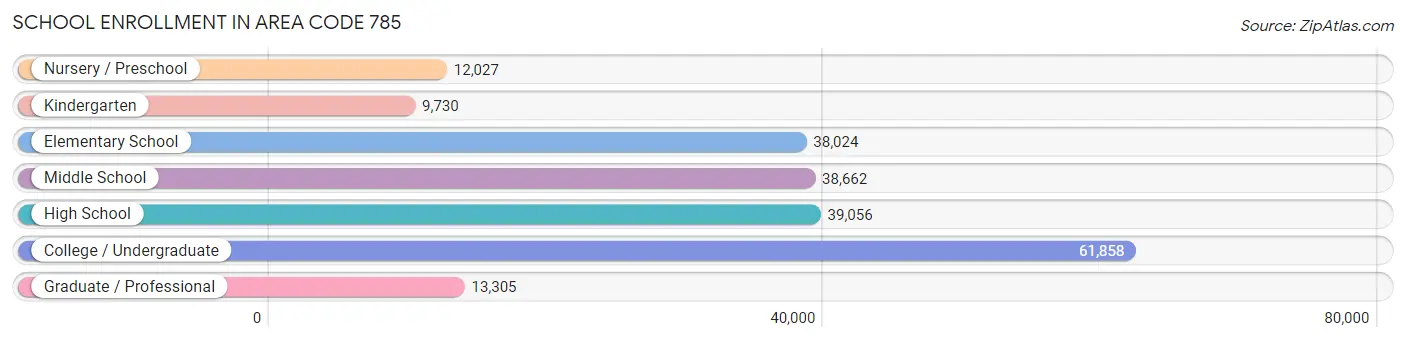
School Enrollment in Area Code 785
The most common levels of schooling among the 212,662 students in Area Code 785 are college / undergraduate (61,858 | 29.1%), high school (39,056 | 18.4%), and middle school (38,662 | 18.2%).
| School Level | # Students | % Students |
| Nursery / Preschool | 12,027 | 5.7% |
| Kindergarten | 9,730 | 4.6% |
| Elementary School | 38,024 | 17.9% |
| Middle School | 38,662 | 18.2% |
| High School | 39,056 | 18.4% |
| College / Undergraduate | 61,858 | 29.1% |
| Graduate / Professional | 13,305 | 6.3% |
| Total | 212,662 | 100.0% |
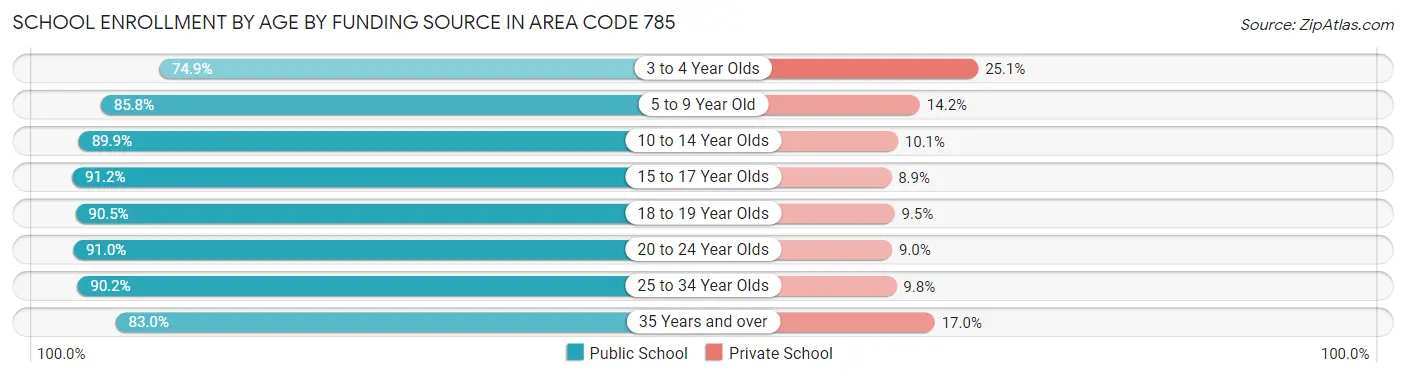
School Enrollment by Age by Funding Source in Area Code 785
Out of a total of 212,662 students who are enrolled in schools in Area Code 785, 24,326 (11.4%) attend a private institution, while the remaining 188,336 (88.6%) are enrolled in public schools. The age group of 3 to 4 year olds has the highest likelihood of being enrolled in private schools, with 2,161 (25.1% in the age bracket) enrolled. Conversely, the age group of 15 to 17 year olds has the lowest likelihood of being enrolled in a private school, with 25,805 (91.1% in the age bracket) attending a public institution.
| Age Bracket | Public School | Private School |
| 3 to 4 Year Olds | 6,463 (74.9%) | 2,161 (25.1%) |
| 5 to 9 Year Old | 39,382 (85.8%) | 6,518 (14.2%) |
| 10 to 14 Year Olds | 42,898 (89.9%) | 4,813 (10.1%) |
| 15 to 17 Year Olds | 25,805 (91.1%) | 2,504 (8.8%) |
| 18 to 19 Year Olds | 21,689 (90.5%) | 2,270 (9.5%) |
| 20 to 24 Year Olds | 33,920 (91.0%) | 3,358 (9.0%) |
| 25 to 34 Year Olds | 10,722 (90.2%) | 1,167 (9.8%) |
| 35 Years and over | 7,467 (83.0%) | 1,525 (17.0%) |
| Total | 188,336 (88.6%) | 24,326 (11.4%) |
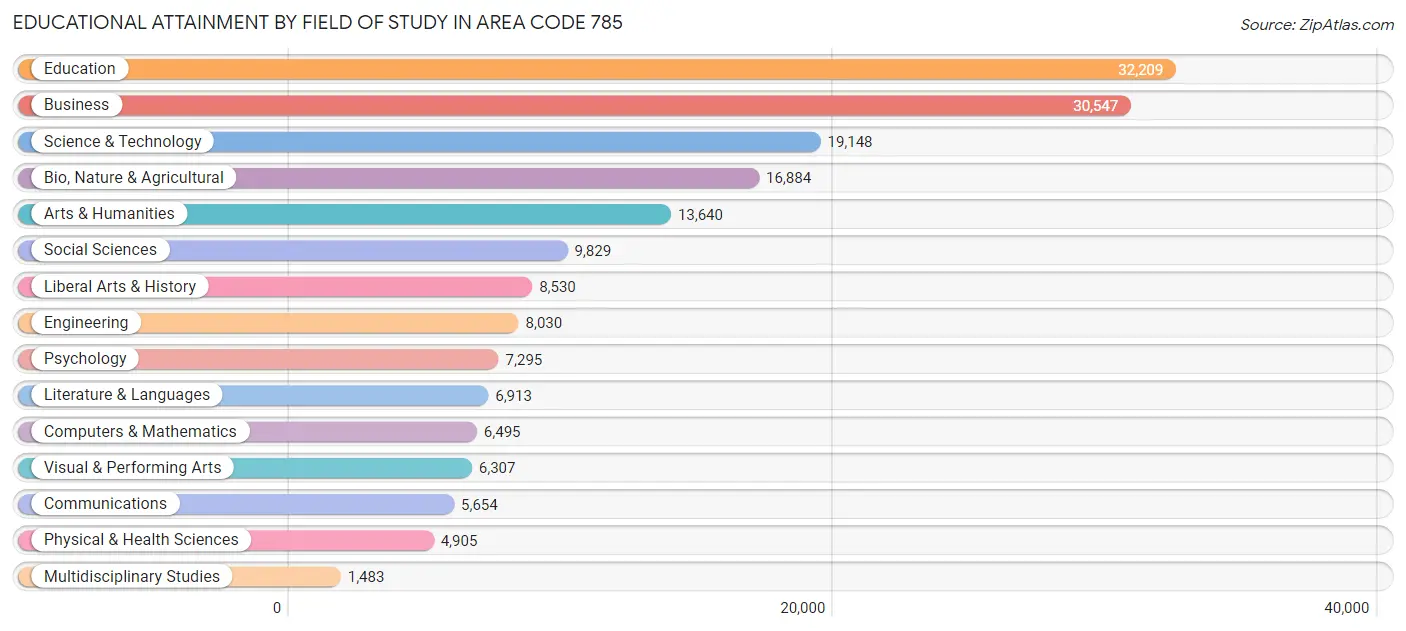
Educational Attainment by Field of Study in Area Code 785
Education (32,209 | 18.1%), business (30,547 | 17.2%), science & technology (19,148 | 10.8%), bio, nature & agricultural (16,884 | 9.5%), and arts & humanities (13,640 | 7.7%) are the most common fields of study among 177,869 individuals in Area Code 785 who have obtained a bachelor's degree or higher.
| Field of Study | # Graduates | % Graduates |
| Computers & Mathematics | 6,495 | 3.6% |
| Bio, Nature & Agricultural | 16,884 | 9.5% |
| Physical & Health Sciences | 4,905 | 2.8% |
| Psychology | 7,295 | 4.1% |
| Social Sciences | 9,829 | 5.5% |
| Engineering | 8,030 | 4.5% |
| Multidisciplinary Studies | 1,483 | 0.8% |
| Science & Technology | 19,148 | 10.8% |
| Business | 30,547 | 17.2% |
| Education | 32,209 | 18.1% |
| Literature & Languages | 6,913 | 3.9% |
| Liberal Arts & History | 8,530 | 4.8% |
| Visual & Performing Arts | 6,307 | 3.5% |
| Communications | 5,654 | 3.2% |
| Arts & Humanities | 13,640 | 7.7% |
| Total | 177,869 | 100.0% |
Transportation & Commute in Area Code 785
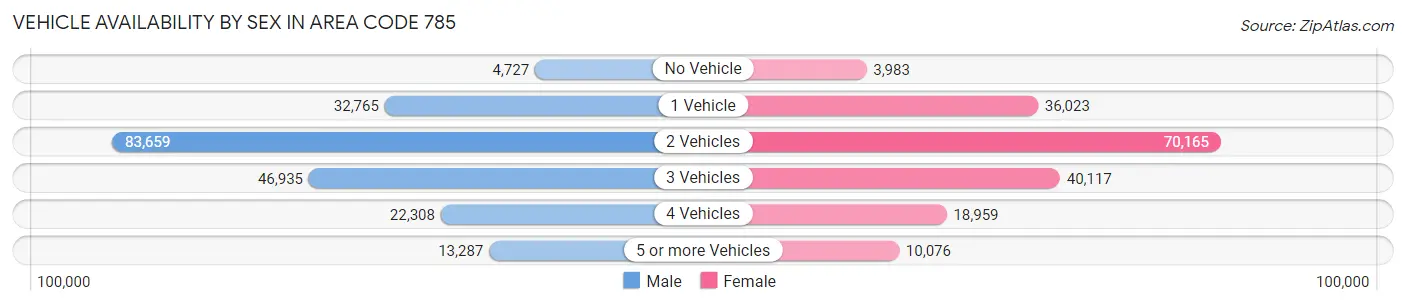
Vehicle Availability by Sex in Area Code 785
The most prevalent vehicle ownership categories in Area Code 785 are males with 2 vehicles (83,659, accounting for 41.1%) and females with 2 vehicles (70,165, making up 46.7%).
| Vehicles Available | Male | Female |
| No Vehicle | 4,727 (2.3%) | 3,983 (2.2%) |
| 1 Vehicle | 32,765 (16.1%) | 36,023 (20.1%) |
| 2 Vehicles | 83,659 (41.1%) | 70,165 (39.1%) |
| 3 Vehicles | 46,935 (23.0%) | 40,117 (22.4%) |
| 4 Vehicles | 22,308 (11.0%) | 18,959 (10.6%) |
| 5 or more Vehicles | 13,287 (6.5%) | 10,076 (5.6%) |
| Total | 203,681 (100.0%) | 179,323 (100.0%) |
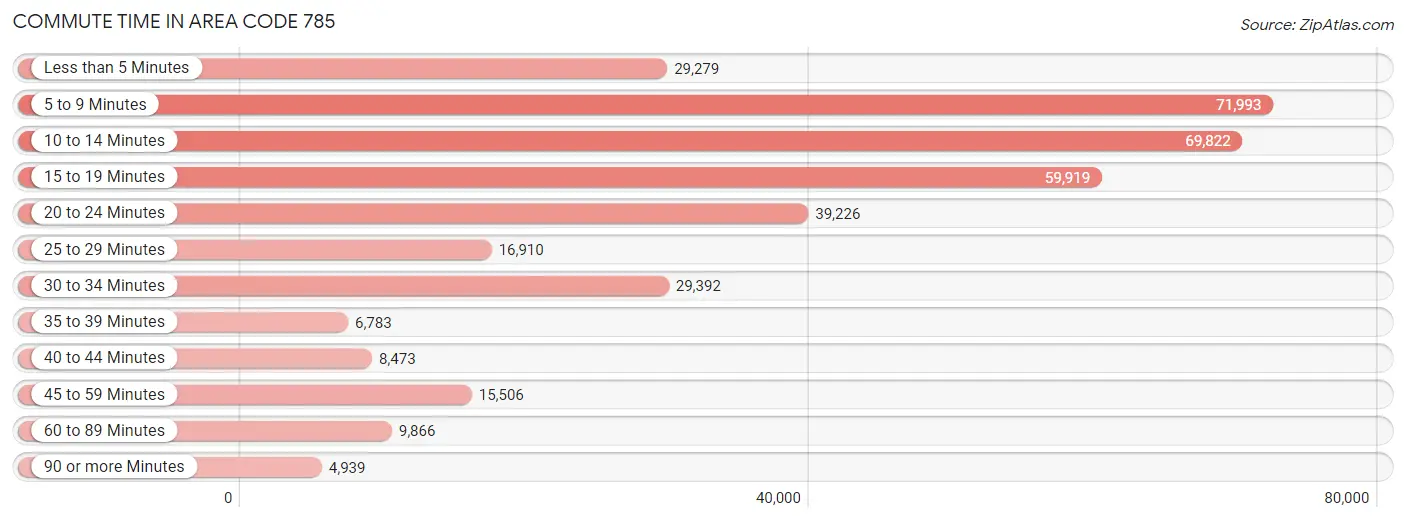
Commute Time in Area Code 785
The most frequently occuring commute durations in Area Code 785 are 5 to 9 minutes (71,993 commuters, 19.9%), 10 to 14 minutes (69,822 commuters, 19.3%), and 15 to 19 minutes (59,919 commuters, 16.6%).
| Commute Time | # Commuters | % Commuters |
| Less than 5 Minutes | 29,279 | 8.1% |
| 5 to 9 Minutes | 71,993 | 19.9% |
| 10 to 14 Minutes | 69,822 | 19.3% |
| 15 to 19 Minutes | 59,919 | 16.6% |
| 20 to 24 Minutes | 39,226 | 10.8% |
| 25 to 29 Minutes | 16,910 | 4.7% |
| 30 to 34 Minutes | 29,392 | 8.1% |
| 35 to 39 Minutes | 6,783 | 1.9% |
| 40 to 44 Minutes | 8,473 | 2.3% |
| 45 to 59 Minutes | 15,506 | 4.3% |
| 60 to 89 Minutes | 9,866 | 2.7% |
| 90 or more Minutes | 4,939 | 1.4% |
Commute Time by Sex in Area Code 785
The most common commute times in Area Code 785 are 5 to 9 minutes (38,023 commuters, 19.4%) for males and 5 to 9 minutes (33,970 commuters, 20.4%) for females.
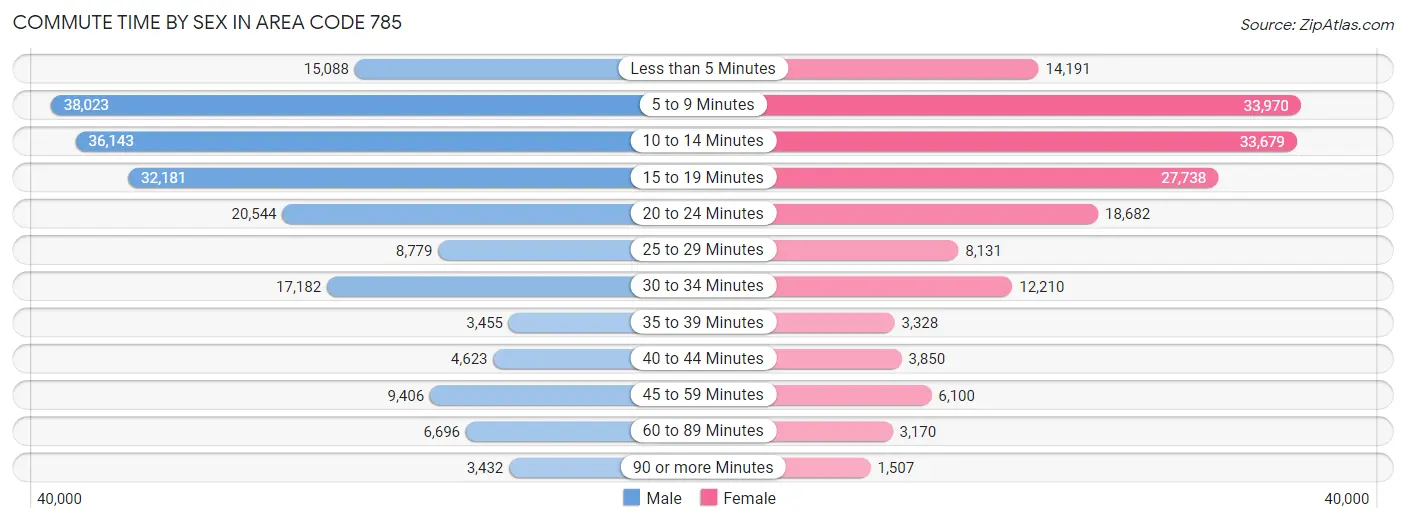
| Commute Time | Male | Female |
| Less than 5 Minutes | 15,088 (7.7%) | 14,191 (8.5%) |
| 5 to 9 Minutes | 38,023 (19.4%) | 33,970 (20.4%) |
| 10 to 14 Minutes | 36,143 (18.5%) | 33,679 (20.2%) |
| 15 to 19 Minutes | 32,181 (16.5%) | 27,738 (16.7%) |
| 20 to 24 Minutes | 20,544 (10.5%) | 18,682 (11.2%) |
| 25 to 29 Minutes | 8,779 (4.5%) | 8,131 (4.9%) |
| 30 to 34 Minutes | 17,182 (8.8%) | 12,210 (7.3%) |
| 35 to 39 Minutes | 3,455 (1.8%) | 3,328 (2.0%) |
| 40 to 44 Minutes | 4,623 (2.4%) | 3,850 (2.3%) |
| 45 to 59 Minutes | 9,406 (4.8%) | 6,100 (3.7%) |
| 60 to 89 Minutes | 6,696 (3.4%) | 3,170 (1.9%) |
| 90 or more Minutes | 3,432 (1.8%) | 1,507 (0.9%) |
Time of Departure to Work by Sex in Area Code 785
The most frequent times of departure to work in Area Code 785 are 7:30 AM to 7:59 AM (33,487, 17.1%) for males and 7:30 AM to 7:59 AM (38,285, 23.0%) for females.
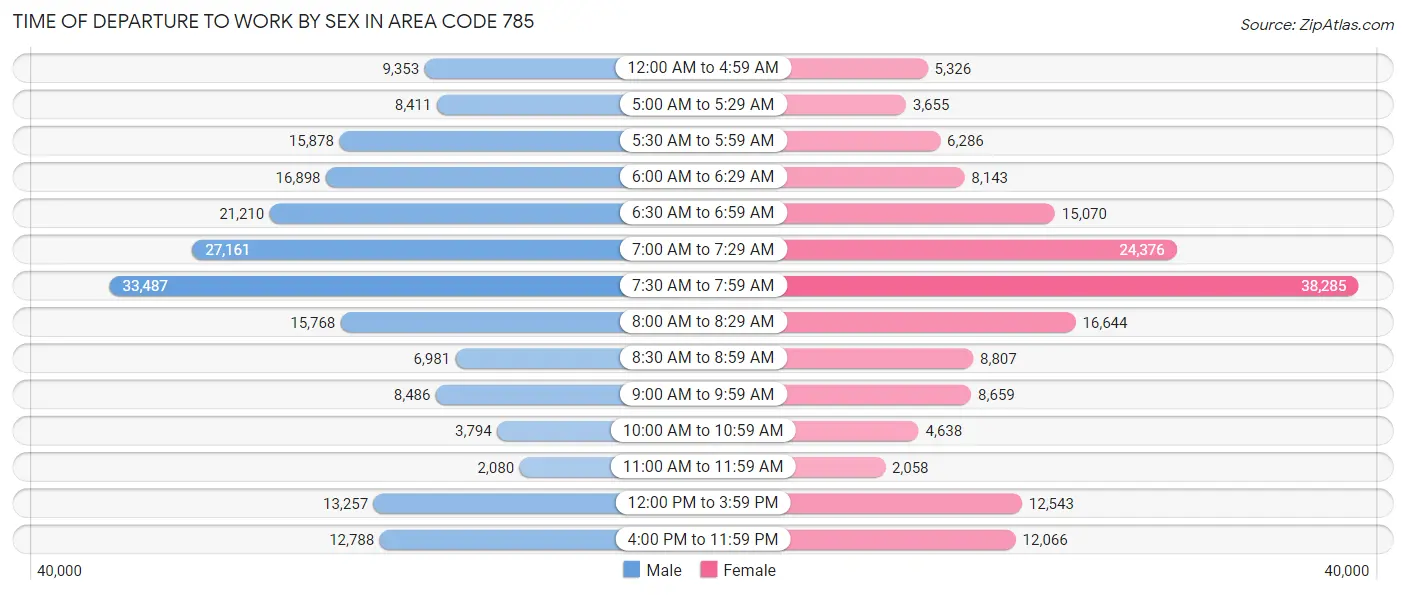
| Time of Departure | Male | Female |
| 12:00 AM to 4:59 AM | 9,353 (4.8%) | 5,326 (3.2%) |
| 5:00 AM to 5:29 AM | 8,411 (4.3%) | 3,655 (2.2%) |
| 5:30 AM to 5:59 AM | 15,878 (8.1%) | 6,286 (3.8%) |
| 6:00 AM to 6:29 AM | 16,898 (8.6%) | 8,143 (4.9%) |
| 6:30 AM to 6:59 AM | 21,210 (10.8%) | 15,070 (9.0%) |
| 7:00 AM to 7:29 AM | 27,161 (13.9%) | 24,376 (14.6%) |
| 7:30 AM to 7:59 AM | 33,487 (17.1%) | 38,285 (23.0%) |
| 8:00 AM to 8:29 AM | 15,768 (8.1%) | 16,644 (10.0%) |
| 8:30 AM to 8:59 AM | 6,981 (3.6%) | 8,807 (5.3%) |
| 9:00 AM to 9:59 AM | 8,486 (4.3%) | 8,659 (5.2%) |
| 10:00 AM to 10:59 AM | 3,794 (1.9%) | 4,638 (2.8%) |
| 11:00 AM to 11:59 AM | 2,080 (1.1%) | 2,058 (1.2%) |
| 12:00 PM to 3:59 PM | 13,257 (6.8%) | 12,543 (7.5%) |
| 4:00 PM to 11:59 PM | 12,788 (6.5%) | 12,066 (7.2%) |
| Total | 195,552 (100.0%) | 166,556 (100.0%) |
Housing Occupancy in Area Code 785
Occupancy by Ownership in Area Code 785
Of the total 320,554 dwellings in Area Code 785, owner-occupied units account for 208,542 (65.1%), while renter-occupied units make up 112,012 (34.9%).
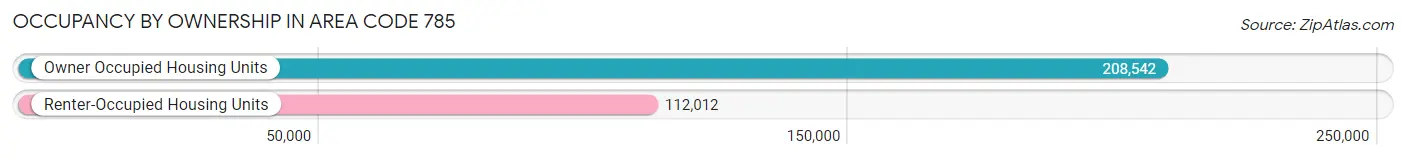
| Occupancy | # Housing Units | % Housing Units |
| Owner Occupied Housing Units | 208,542 | 65.1% |
| Renter-Occupied Housing Units | 112,012 | 34.9% |
| Total Occupied Housing Units | 320,554 | 100.0% |
Occupancy by Household Size in Area Code 785
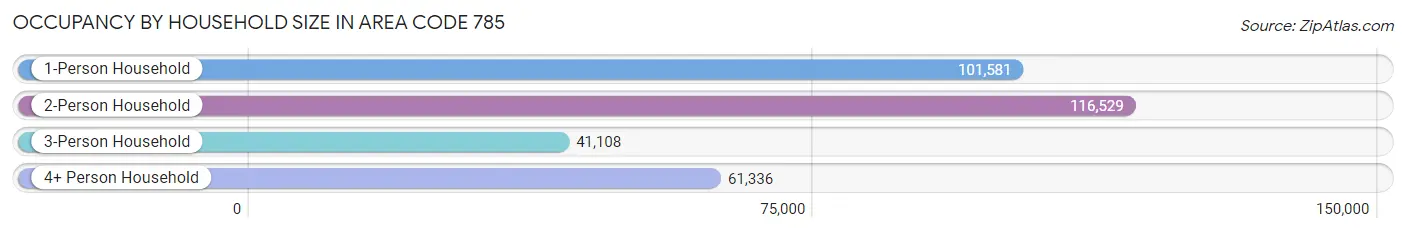
| Household Size | # Housing Units | % Housing Units |
| 1-Person Household | 101,581 | 31.7% |
| 2-Person Household | 116,529 | 36.3% |
| 3-Person Household | 41,108 | 12.8% |
| 4+ Person Household | 61,336 | 19.1% |
| Total Housing Units | 320,554 | 100.0% |
Occupancy by Ownership by Household Size in Area Code 785
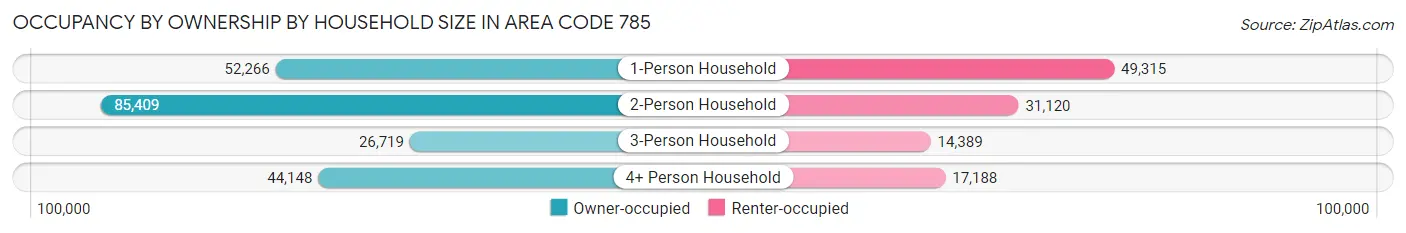
| Household Size | Owner-occupied | Renter-occupied |
| 1-Person Household | 52,266 (51.4%) | 49,315 (48.5%) |
| 2-Person Household | 85,409 (73.3%) | 31,120 (26.7%) |
| 3-Person Household | 26,719 (65.0%) | 14,389 (35.0%) |
| 4+ Person Household | 44,148 (72.0%) | 17,188 (28.0%) |
| Total Housing Units | 208,542 (65.1%) | 112,012 (34.9%) |
Occupancy by Educational Attainment in Area Code 785
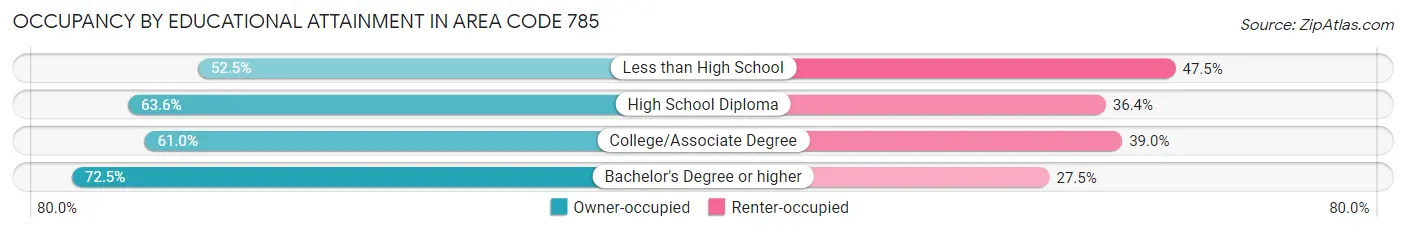
| Household Size | Owner-occupied | Renter-occupied |
| Less than High School | 8,355 (52.5%) | 7,557 (47.5%) |
| High School Diploma | 54,008 (63.6%) | 30,954 (36.4%) |
| College/Associate Degree | 69,245 (61.0%) | 44,323 (39.0%) |
| Bachelor's Degree or higher | 76,934 (72.5%) | 29,178 (27.5%) |
Occupancy by Age of Householder in Area Code 785
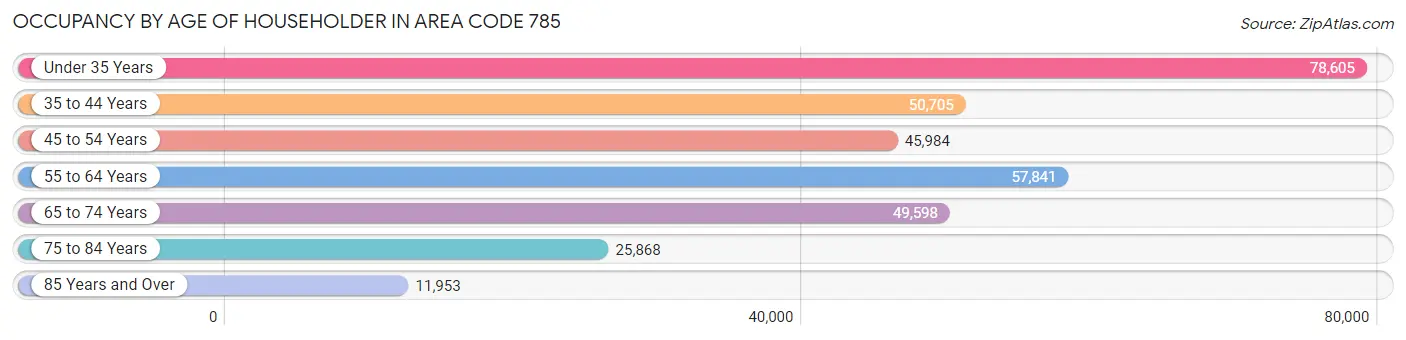
| Age Bracket | # Households | % Households |
| Under 35 Years | 78,605 | 24.5% |
| 35 to 44 Years | 50,705 | 15.8% |
| 45 to 54 Years | 45,984 | 14.3% |
| 55 to 64 Years | 57,841 | 18.0% |
| 65 to 74 Years | 49,598 | 15.5% |
| 75 to 84 Years | 25,868 | 8.1% |
| 85 Years and Over | 11,953 | 3.7% |
| Total | 320,554 | 100.0% |
Housing Finances in Area Code 785
Median Income by Occupancy in Area Code 785
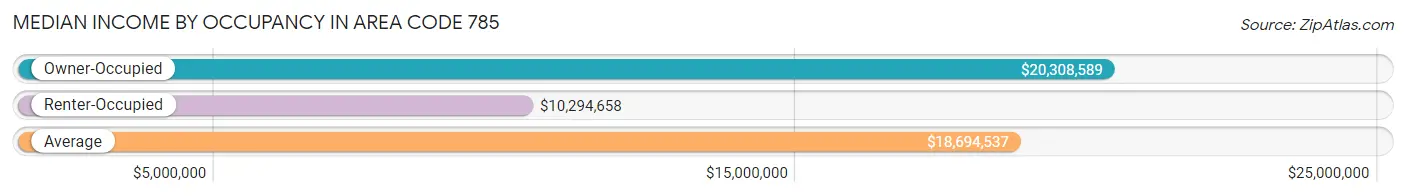
| Occupancy Type | # Households | Median Income |
| Owner-Occupied | 208,542 (65.1%) | $20,308,589 |
| Renter-Occupied | 112,012 (34.9%) | $10,294,658 |
| Average | 320,554 (100.0%) | $18,694,537 |
Occupancy by Householder Income Bracket in Area Code 785
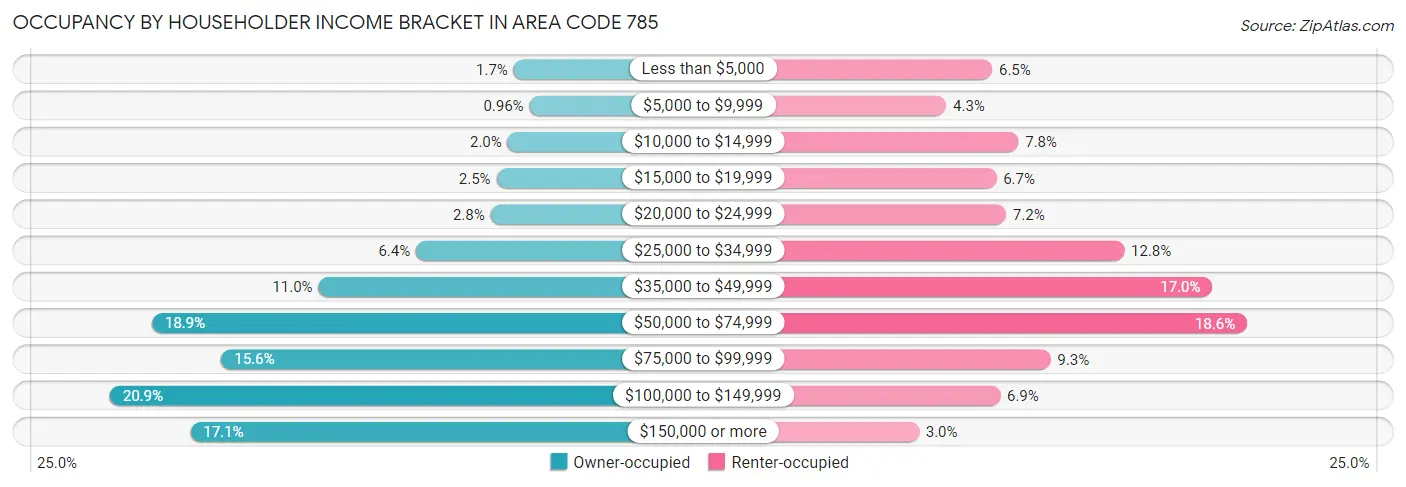
| Income Bracket | Owner-occupied | Renter-occupied |
| Less than $5,000 | 3,557 (1.7%) | 7,277 (6.5%) |
| $5,000 to $9,999 | 1,993 (1.0%) | 4,830 (4.3%) |
| $10,000 to $14,999 | 4,173 (2.0%) | 8,676 (7.7%) |
| $15,000 to $19,999 | 5,271 (2.5%) | 7,504 (6.7%) |
| $20,000 to $24,999 | 5,851 (2.8%) | 8,017 (7.2%) |
| $25,000 to $34,999 | 13,265 (6.4%) | 14,324 (12.8%) |
| $35,000 to $49,999 | 22,964 (11.0%) | 19,027 (17.0%) |
| $50,000 to $74,999 | 39,501 (18.9%) | 20,882 (18.6%) |
| $75,000 to $99,999 | 32,600 (15.6%) | 10,396 (9.3%) |
| $100,000 to $149,999 | 43,678 (20.9%) | 7,709 (6.9%) |
| $150,000 or more | 35,689 (17.1%) | 3,370 (3.0%) |
| Total | 208,542 (100.0%) | 112,012 (100.0%) |
Monthly Housing Cost Tiers in Area Code 785
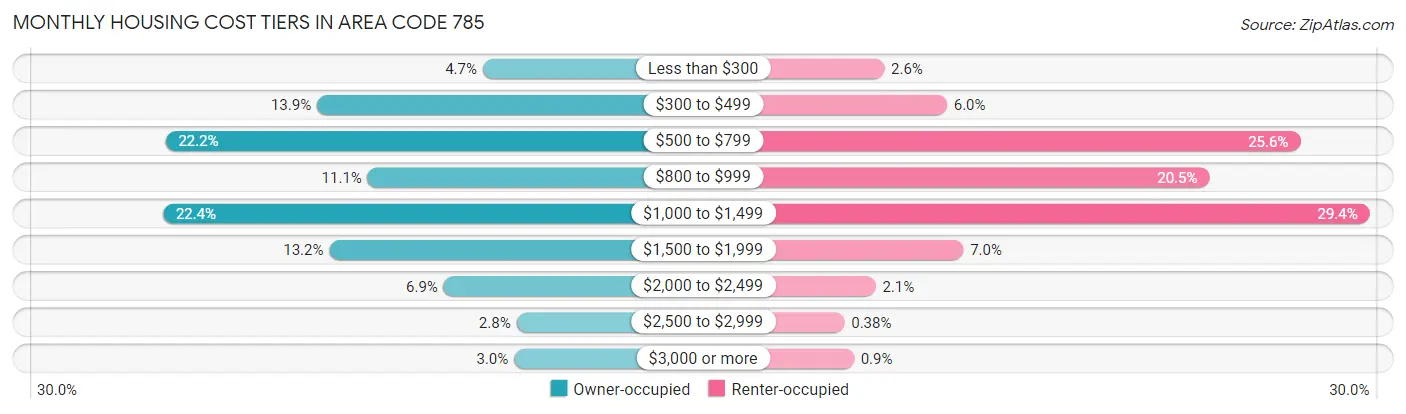
| Monthly Cost | Owner-occupied | Renter-occupied |
| Less than $300 | 9,789 (4.7%) | 2,890 (2.6%) |
| $300 to $499 | 28,888 (13.9%) | 6,770 (6.0%) |
| $500 to $799 | 46,352 (22.2%) | 28,631 (25.6%) |
| $800 to $999 | 23,044 (11.1%) | 23,011 (20.5%) |
| $1,000 to $1,499 | 46,642 (22.4%) | 32,918 (29.4%) |
| $1,500 to $1,999 | 27,471 (13.2%) | 7,784 (7.0%) |
| $2,000 to $2,499 | 14,281 (6.9%) | 2,353 (2.1%) |
| $2,500 to $2,999 | 5,905 (2.8%) | 431 (0.4%) |
| $3,000 or more | 6,170 (3.0%) | 1,009 (0.9%) |
| Total | 208,542 (100.0%) | 112,012 (100.0%) |
Physical Housing Characteristics in Area Code 785
Housing Structures in Area Code 785
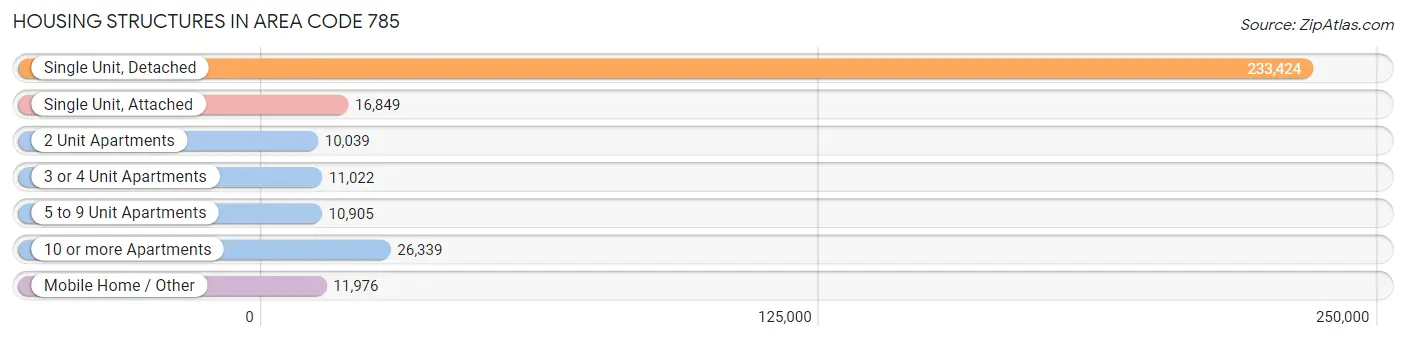
| Structure Type | # Housing Units | % Housing Units |
| Single Unit, Detached | 233,424 | 72.8% |
| Single Unit, Attached | 16,849 | 5.3% |
| 2 Unit Apartments | 10,039 | 3.1% |
| 3 or 4 Unit Apartments | 11,022 | 3.4% |
| 5 to 9 Unit Apartments | 10,905 | 3.4% |
| 10 or more Apartments | 26,339 | 8.2% |
| Mobile Home / Other | 11,976 | 3.7% |
| Total | 320,554 | 100.0% |
Housing Structures by Occupancy in Area Code 785
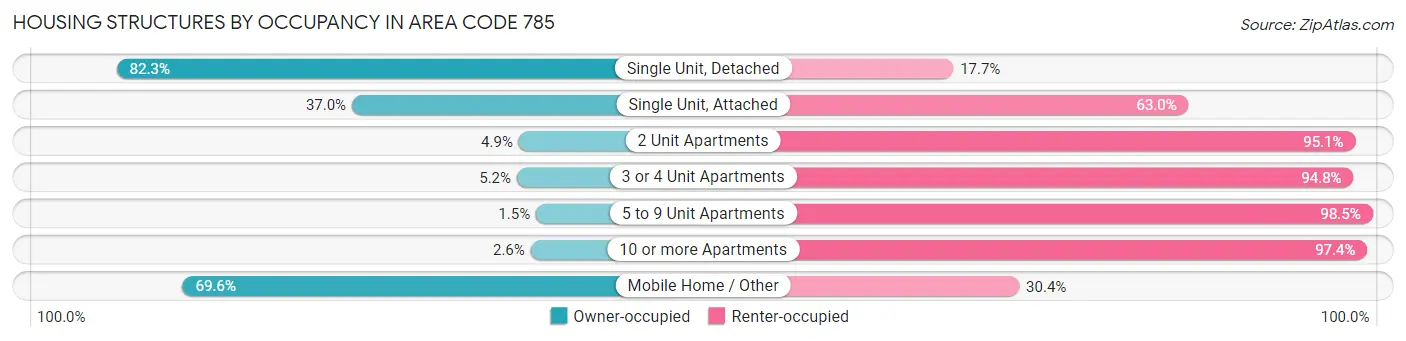
| Structure Type | Owner-occupied | Renter-occupied |
| Single Unit, Detached | 192,071 (82.3%) | 41,353 (17.7%) |
| Single Unit, Attached | 6,229 (37.0%) | 10,620 (63.0%) |
| 2 Unit Apartments | 488 (4.9%) | 9,551 (95.1%) |
| 3 or 4 Unit Apartments | 575 (5.2%) | 10,447 (94.8%) |
| 5 to 9 Unit Apartments | 168 (1.5%) | 10,737 (98.5%) |
| 10 or more Apartments | 678 (2.6%) | 25,661 (97.4%) |
| Mobile Home / Other | 8,333 (69.6%) | 3,643 (30.4%) |
| Total | 208,542 (65.1%) | 112,012 (34.9%) |
Housing Structures by Number of Rooms in Area Code 785
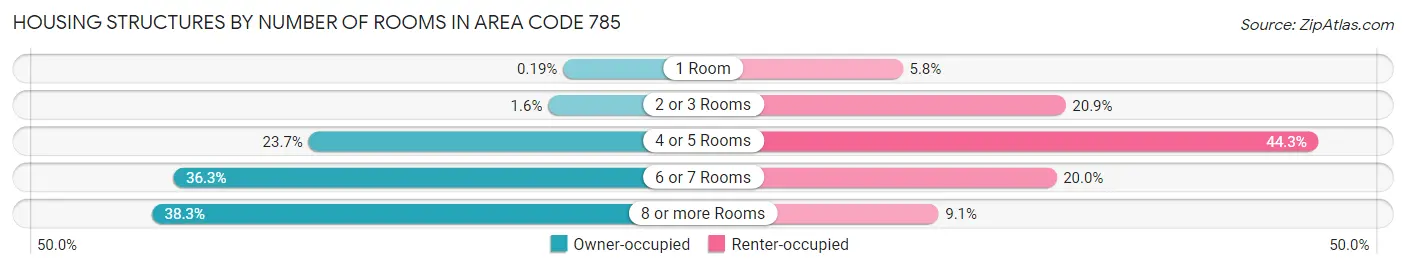
| Number of Rooms | Owner-occupied | Renter-occupied |
| 1 Room | 403 (0.2%) | 6,485 (5.8%) |
| 2 or 3 Rooms | 3,272 (1.6%) | 23,355 (20.8%) |
| 4 or 5 Rooms | 49,495 (23.7%) | 49,572 (44.3%) |
| 6 or 7 Rooms | 75,613 (36.3%) | 22,406 (20.0%) |
| 8 or more Rooms | 79,759 (38.3%) | 10,194 (9.1%) |
| Total | 208,542 (100.0%) | 112,012 (100.0%) |
Housing Structure by Heating Type in Area Code 785
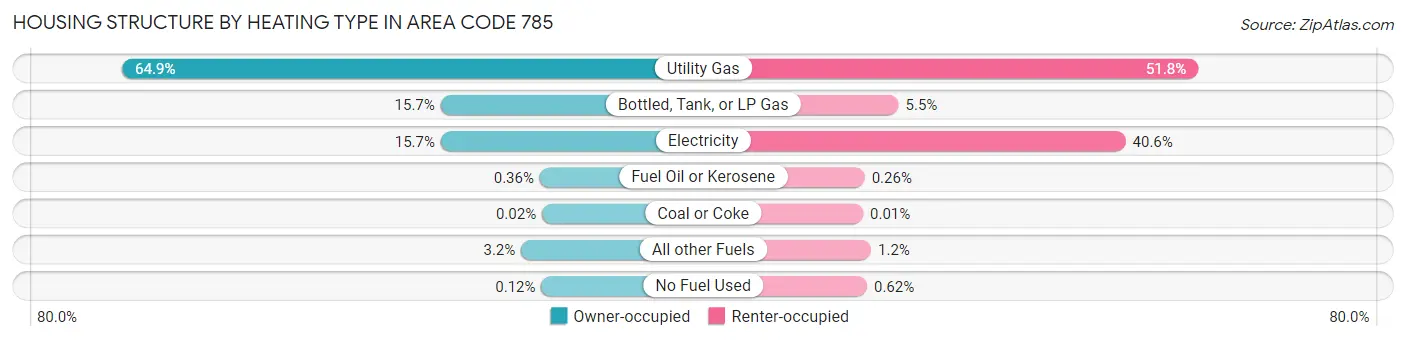
| Heating Type | Owner-occupied | Renter-occupied |
| Utility Gas | 135,379 (64.9%) | 58,003 (51.8%) |
| Bottled, Tank, or LP Gas | 32,713 (15.7%) | 6,165 (5.5%) |
| Electricity | 32,665 (15.7%) | 45,465 (40.6%) |
| Fuel Oil or Kerosene | 747 (0.4%) | 291 (0.3%) |
| Coal or Coke | 33 (0.0%) | 10 (0.0%) |
| All other Fuels | 6,762 (3.2%) | 1,389 (1.2%) |
| No Fuel Used | 243 (0.1%) | 689 (0.6%) |
| Total | 208,542 (100.0%) | 112,012 (100.0%) |
Household Vehicle Usage in Area Code 785
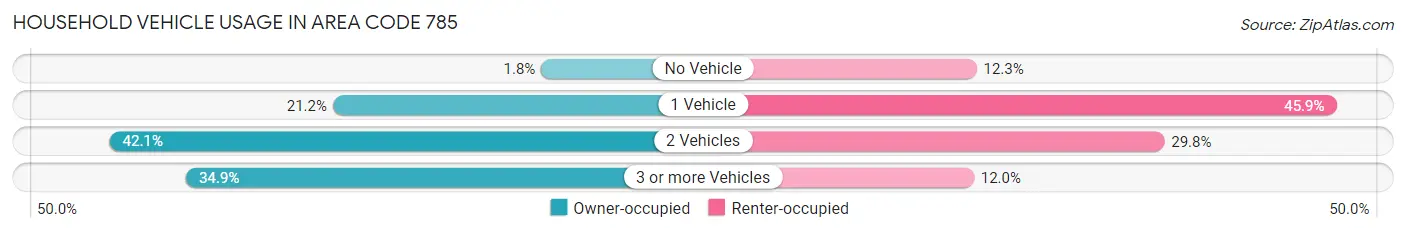
| Vehicles per Household | Owner-occupied | Renter-occupied |
| No Vehicle | 3,714 (1.8%) | 13,766 (12.3%) |
| 1 Vehicle | 44,276 (21.2%) | 51,382 (45.9%) |
| 2 Vehicles | 87,708 (42.1%) | 33,388 (29.8%) |
| 3 or more Vehicles | 72,844 (34.9%) | 13,476 (12.0%) |
| Total | 208,542 (100.0%) | 112,012 (100.0%) |
Real Estate & Mortgages in Area Code 785
Real Estate and Mortgage Overview in Area Code 785
| Characteristic | Without Mortgage | With Mortgage |
| Housing Units | 94,987 | 113,555 |
| Median Property Value | $31,148,097 | $36,349,800 |
| Median Household Income | $16,999,581 | $23,513 |
| Monthly Housing Costs | $151,138 | $6,030 |
| Real Estate Taxes | $442,151 | $2,182 |
Property Value by Mortgage Status in Area Code 785
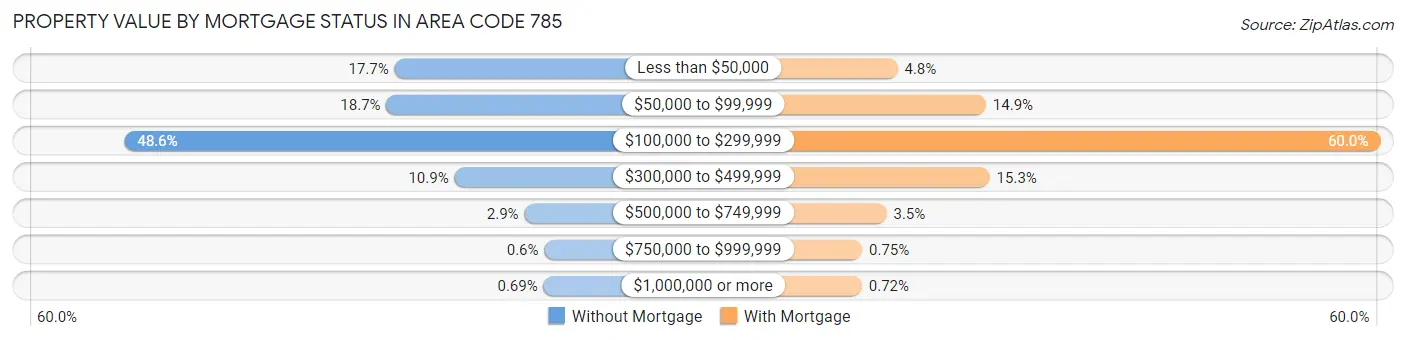
| Property Value | Without Mortgage | With Mortgage |
| Less than $50,000 | 16,832 (17.7%) | 5,445 (4.8%) |
| $50,000 to $99,999 | 17,715 (18.6%) | 16,920 (14.9%) |
| $100,000 to $299,999 | 46,159 (48.6%) | 68,091 (60.0%) |
| $300,000 to $499,999 | 10,323 (10.9%) | 17,412 (15.3%) |
| $500,000 to $749,999 | 2,734 (2.9%) | 4,024 (3.5%) |
| $750,000 to $999,999 | 573 (0.6%) | 846 (0.7%) |
| $1,000,000 or more | 651 (0.7%) | 817 (0.7%) |
| Total | 94,987 (100.0%) | 113,555 (100.0%) |
Household Income by Mortgage Status in Area Code 785
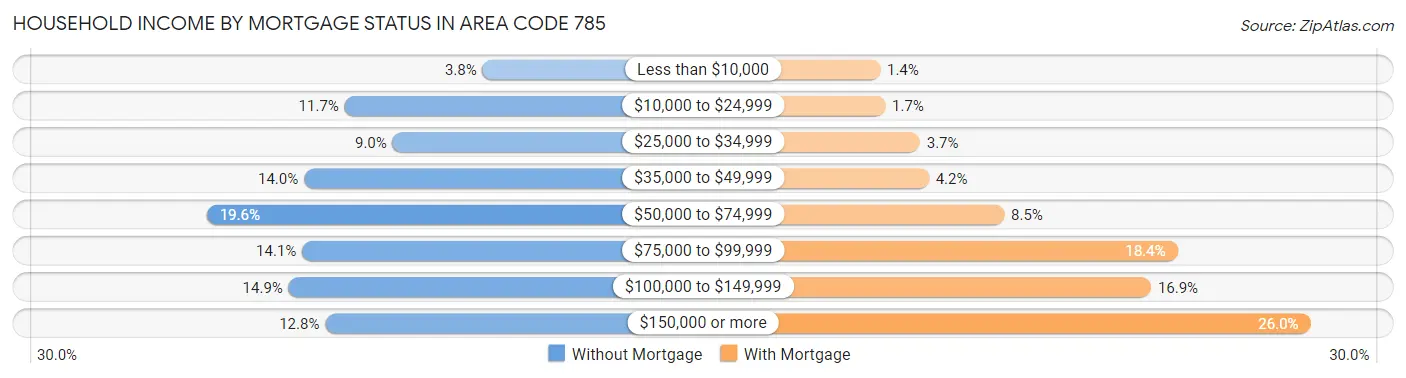
| Household Income | Without Mortgage | With Mortgage |
| Less than $10,000 | 3,634 (3.8%) | 1,591 (1.4%) |
| $10,000 to $24,999 | 11,123 (11.7%) | 1,916 (1.7%) |
| $25,000 to $34,999 | 8,521 (9.0%) | 4,172 (3.7%) |
| $35,000 to $49,999 | 13,327 (14.0%) | 4,744 (4.2%) |
| $50,000 to $74,999 | 18,608 (19.6%) | 9,637 (8.5%) |
| $75,000 to $99,999 | 13,431 (14.1%) | 20,893 (18.4%) |
| $100,000 to $149,999 | 14,167 (14.9%) | 19,169 (16.9%) |
| $150,000 or more | 12,176 (12.8%) | 29,511 (26.0%) |
| Total | 94,987 (100.0%) | 113,555 (100.0%) |
Property Value to Household Income Ratio in Area Code 785
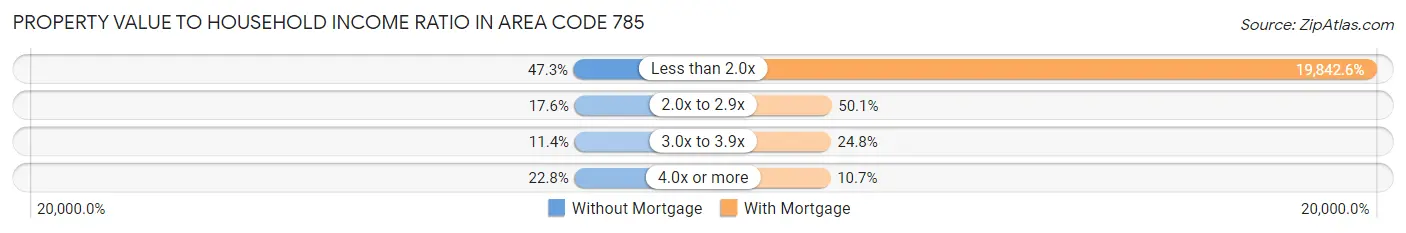
| Value-to-Income Ratio | Without Mortgage | With Mortgage |
| Less than 2.0x | 44,919 (47.3%) | 22,532,215 (19,842.6%) |
| 2.0x to 2.9x | 16,692 (17.6%) | 56,911 (50.1%) |
| 3.0x to 3.9x | 10,790 (11.4%) | 28,118 (24.8%) |
| 4.0x or more | 21,645 (22.8%) | 12,123 (10.7%) |
| Total | 94,987 (100.0%) | 113,555 (100.0%) |
Real Estate Taxes by Mortgage Status in Area Code 785
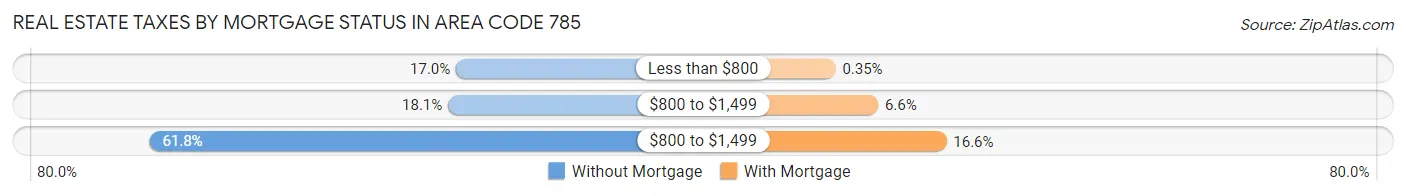
| Property Taxes | Without Mortgage | With Mortgage |
| Less than $800 | 16,096 (17.0%) | 403 (0.4%) |
| $800 to $1,499 | 17,215 (18.1%) | 7,453 (6.6%) |
| $800 to $1,499 | 58,653 (61.8%) | 18,804 (16.6%) |
| Total | 94,987 (100.0%) | 113,555 (100.0%) |
Health & Disability in Area Code 785
Health Insurance Coverage by Age in Area Code 785
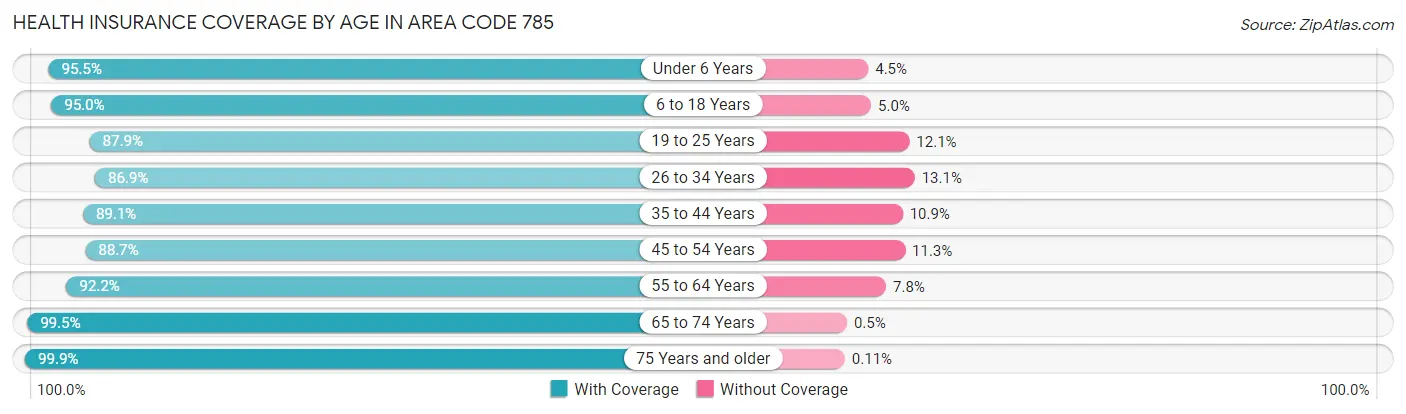
| Age Bracket | With Coverage | Without Coverage |
| Under 6 Years | 53,602 (95.5%) | 2,507 (4.5%) |
| 6 to 18 Years | 125,494 (95.0%) | 6,597 (5.0%) |
| 19 to 25 Years | 85,428 (87.9%) | 11,808 (12.1%) |
| 26 to 34 Years | 72,841 (86.9%) | 11,022 (13.1%) |
| 35 to 44 Years | 80,466 (89.1%) | 9,835 (10.9%) |
| 45 to 54 Years | 70,671 (88.7%) | 9,036 (11.3%) |
| 55 to 64 Years | 89,262 (92.2%) | 7,547 (7.8%) |
| 65 to 74 Years | 76,901 (99.5%) | 386 (0.5%) |
| 75 Years and older | 53,262 (99.9%) | 59 (0.1%) |
| Total | 707,927 (92.3%) | 58,797 (7.7%) |
Health Insurance Coverage by Citizenship Status in Area Code 785
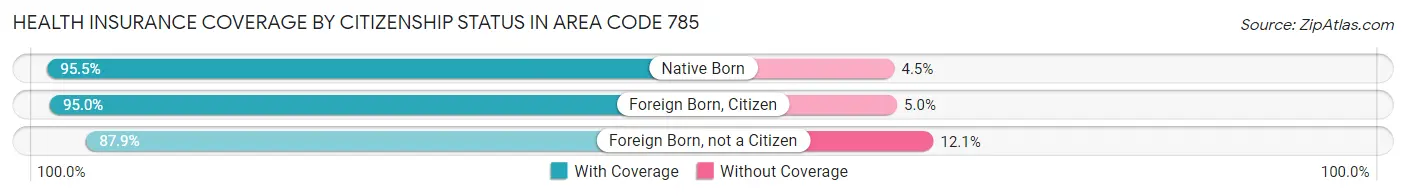
| Citizenship Status | With Coverage | Without Coverage |
| Native Born | 53,602 (95.5%) | 2,507 (4.5%) |
| Foreign Born, Citizen | 125,494 (95.0%) | 6,597 (5.0%) |
| Foreign Born, not a Citizen | 85,428 (87.9%) | 11,808 (12.1%) |
Health Insurance Coverage by Household Income in Area Code 785
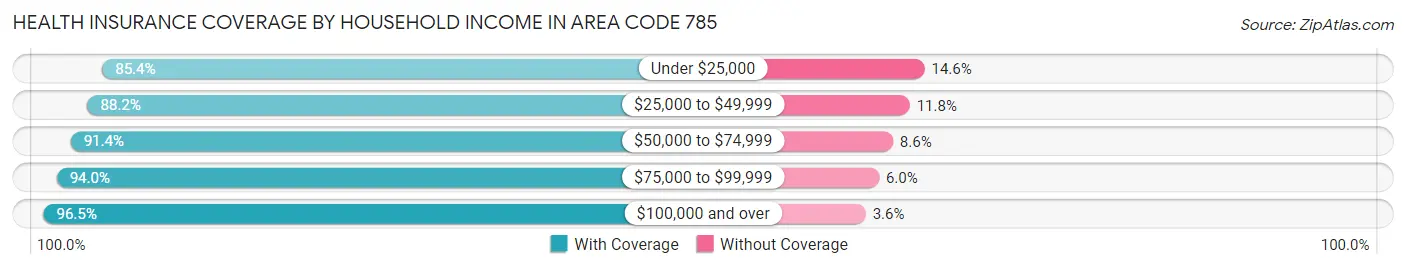
| Household Income | With Coverage | Without Coverage |
| Under $25,000 | 76,561 (85.4%) | 13,061 (14.6%) |
| $25,000 to $49,999 | 116,713 (88.2%) | 15,601 (11.8%) |
| $50,000 to $74,999 | 124,797 (91.4%) | 11,804 (8.6%) |
| $75,000 to $99,999 | 107,540 (94.0%) | 6,892 (6.0%) |
| $100,000 and over | 262,044 (96.5%) | 9,640 (3.5%) |
Public vs Private Health Insurance Coverage by Age in Area Code 785
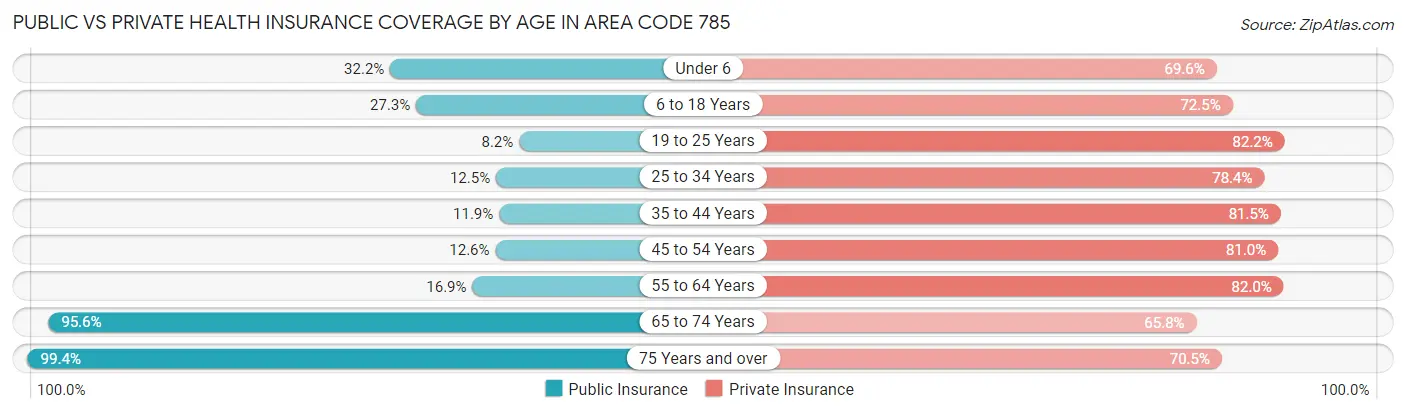
| Age Bracket | Public Insurance | Private Insurance |
| Under 6 | 18,038 (32.2%) | 39,030 (69.6%) |
| 6 to 18 Years | 36,097 (27.3%) | 95,778 (72.5%) |
| 19 to 25 Years | 7,979 (8.2%) | 79,914 (82.2%) |
| 25 to 34 Years | 10,481 (12.5%) | 65,764 (78.4%) |
| 35 to 44 Years | 10,767 (11.9%) | 73,555 (81.5%) |
| 45 to 54 Years | 10,061 (12.6%) | 64,536 (81.0%) |
| 55 to 64 Years | 16,349 (16.9%) | 79,389 (82.0%) |
| 65 to 74 Years | 73,875 (95.6%) | 50,861 (65.8%) |
| 75 Years and over | 53,015 (99.4%) | 37,603 (70.5%) |
| Total | 236,662 (30.9%) | 586,430 (76.5%) |
Disability Status by Sex by Age in Area Code 785
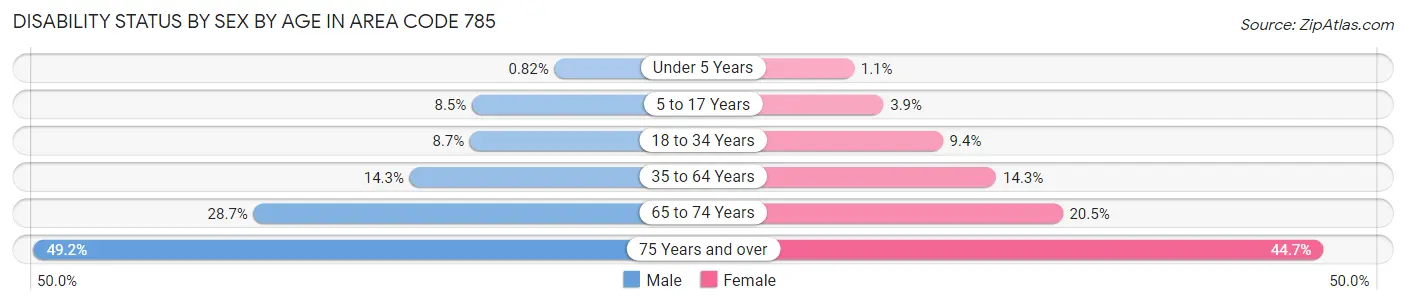
| Age Bracket | Male | Female |
| Under 5 Years | 194 (0.8%) | 248 (1.1%) |
| 5 to 17 Years | 5,546 (8.5%) | 2,385 (3.8%) |
| 18 to 34 Years | 8,578 (8.6%) | 9,040 (9.4%) |
| 35 to 64 Years | 19,008 (14.2%) | 19,098 (14.3%) |
| 65 to 74 Years | 10,855 (28.7%) | 8,095 (20.5%) |
| 75 Years and over | 11,101 (49.1%) | 13,729 (44.7%) |
Disability Class by Sex by Age in Area Code 785
Disability Class: Hearing Difficulty
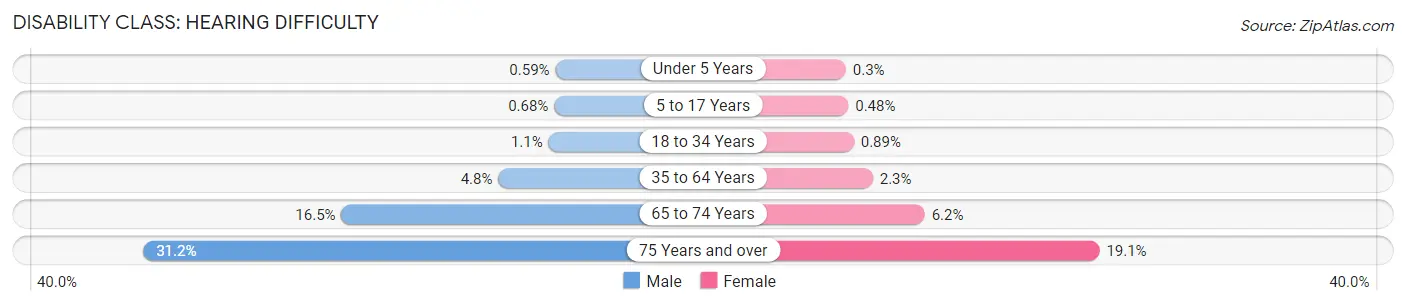
| Age Bracket | Male | Female |
| Under 5 Years | 140 (0.6%) | 67 (0.3%) |
| 5 to 17 Years | 442 (0.7%) | 295 (0.5%) |
| 18 to 34 Years | 1,090 (1.1%) | 863 (0.9%) |
| 35 to 64 Years | 6,447 (4.8%) | 3,070 (2.3%) |
| 65 to 74 Years | 6,224 (16.5%) | 2,435 (6.2%) |
| 75 Years and over | 7,045 (31.2%) | 5,880 (19.1%) |
Disability Class: Vision Difficulty
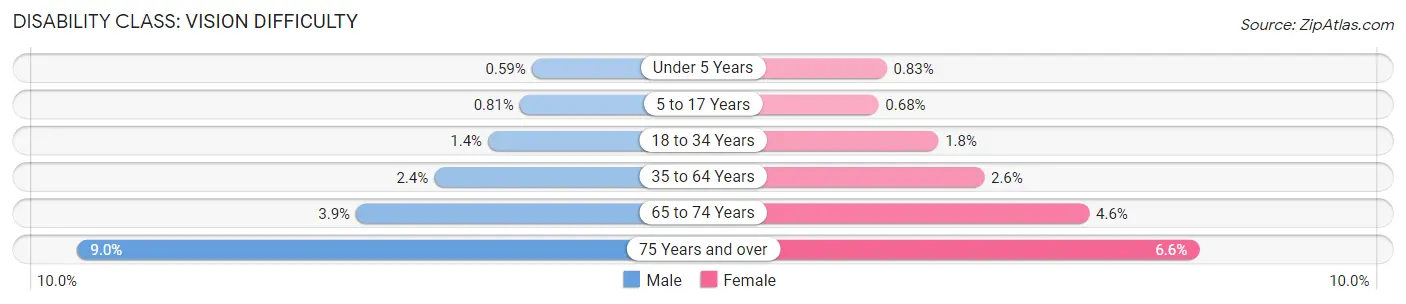
| Age Bracket | Male | Female |
| Under 5 Years | 141 (0.6%) | 187 (0.8%) |
| 5 to 17 Years | 531 (0.8%) | 424 (0.7%) |
| 18 to 34 Years | 1,385 (1.4%) | 1,734 (1.8%) |
| 35 to 64 Years | 3,203 (2.4%) | 3,520 (2.6%) |
| 65 to 74 Years | 1,455 (3.8%) | 1,813 (4.6%) |
| 75 Years and over | 2,038 (9.0%) | 2,039 (6.6%) |
Disability Class: Cognitive Difficulty
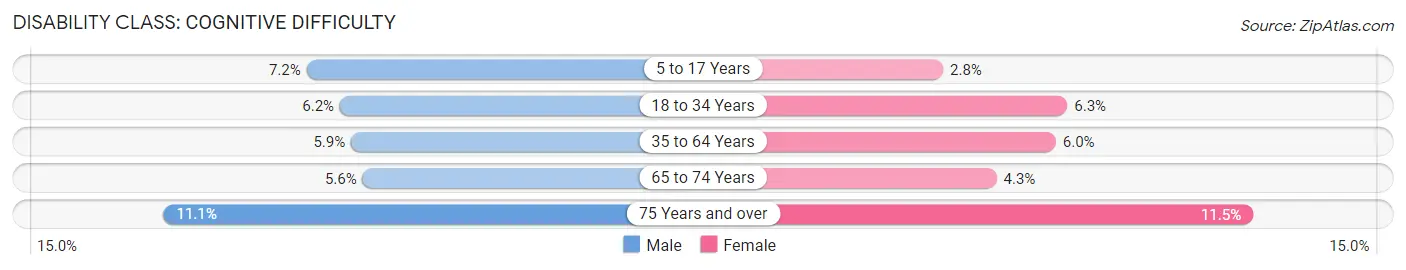
| Age Bracket | Male | Female |
| 5 to 17 Years | 4,681 (7.1%) | 1,747 (2.8%) |
| 18 to 34 Years | 6,165 (6.2%) | 6,065 (6.3%) |
| 35 to 64 Years | 7,884 (5.9%) | 7,948 (6.0%) |
| 65 to 74 Years | 2,112 (5.6%) | 1,703 (4.3%) |
| 75 Years and over | 2,513 (11.1%) | 3,518 (11.5%) |
Disability Class: Ambulatory Difficulty
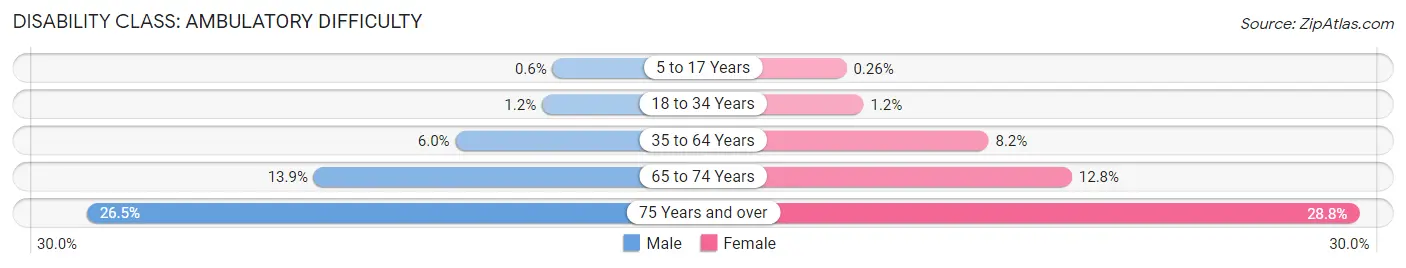
| Age Bracket | Male | Female |
| 5 to 17 Years | 395 (0.6%) | 160 (0.3%) |
| 18 to 34 Years | 1,180 (1.2%) | 1,170 (1.2%) |
| 35 to 64 Years | 8,017 (6.0%) | 10,897 (8.2%) |
| 65 to 74 Years | 5,250 (13.9%) | 5,062 (12.8%) |
| 75 Years and over | 5,995 (26.5%) | 8,855 (28.8%) |
Disability Class: Self-Care Difficulty
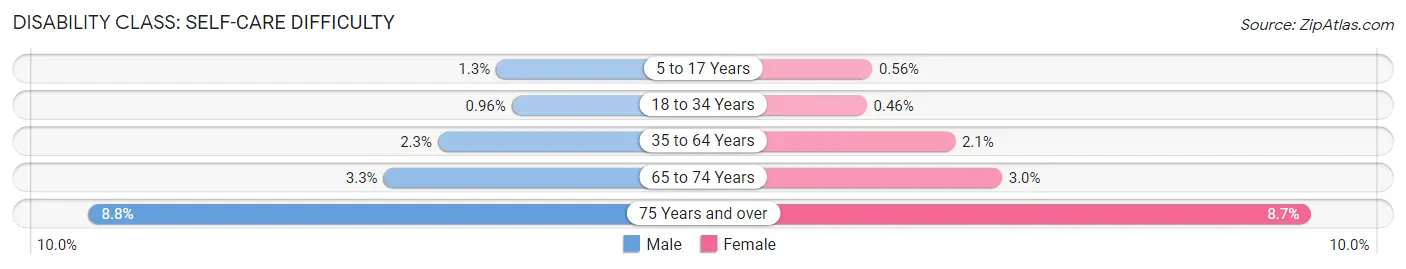
| Age Bracket | Male | Female |
| 5 to 17 Years | 820 (1.3%) | 347 (0.6%) |
| 18 to 34 Years | 951 (1.0%) | 444 (0.5%) |
| 35 to 64 Years | 3,114 (2.3%) | 2,799 (2.1%) |
| 65 to 74 Years | 1,262 (3.3%) | 1,175 (3.0%) |
| 75 Years and over | 1,990 (8.8%) | 2,677 (8.7%) |
Technology Access in Area Code 785
Computing Device Access in Area Code 785
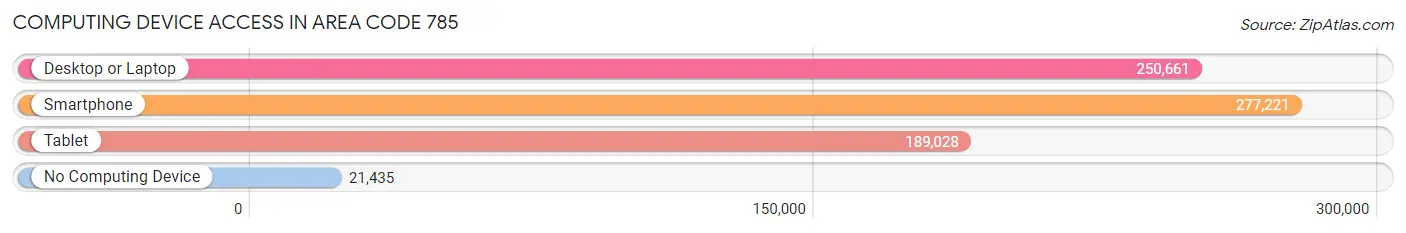
| Device Type | # Households | % Households |
| Desktop or Laptop | 250,661 | 78.2% |
| Smartphone | 277,221 | 86.5% |
| Tablet | 189,028 | 59.0% |
| No Computing Device | 21,435 | 6.7% |
| Total | 320,554 | 100.0% |
Internet Access in Area Code 785
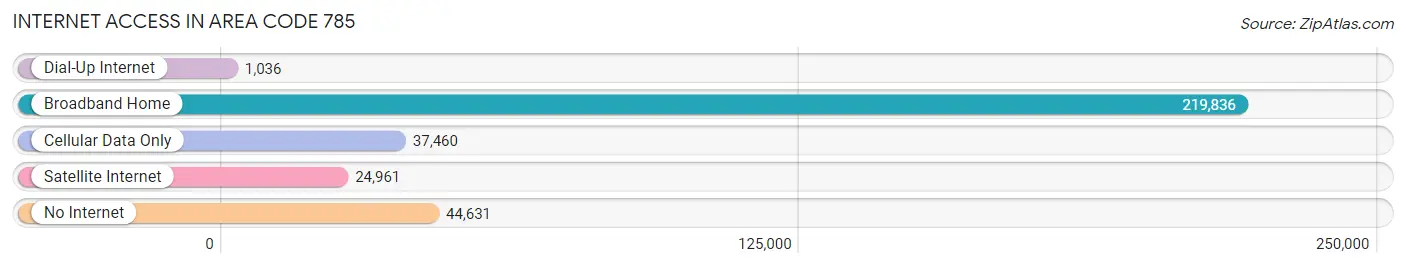
| Internet Type | # Households | % Households |
| Dial-Up Internet | 1,036 | 0.3% |
| Broadband Home | 219,836 | 68.6% |
| Cellular Data Only | 37,460 | 11.7% |
| Satellite Internet | 24,961 | 7.8% |
| No Internet | 44,631 | 13.9% |
| Total | 320,554 | 100.0% |
Area Code 785 Summary
Geography
Area code 785 is located in the state of Kansas. It covers the entire state, including the cities of Topeka, Lawrence, Manhattan, and Salina.
Social
Area code 785 is home to a diverse population of people from all walks of life. The area is known for its friendly and welcoming atmosphere, and its residents are proud of their heritage and culture.
Economics
Area code 785 is a major economic hub in the state of Kansas. It is home to a number of large businesses, including the University of Kansas, the Kansas State University, and the Kansas City Chiefs. The area also has a thriving agricultural industry, with many farms and ranches located in the area.
Demographics
Area code 785 is home to a population of over 1.5 million people. The majority of the population is white, with a smaller percentage of African Americans, Hispanics, and Asians. The median household income in the area is around $50,000, and the unemployment rate is below the national average.
Common Questions
What is Per Capita Income in Area Code 785?
Per Capita income in Area Code 785 is $34,187.
What is the Median Family Income in Area Code 785?
Median Family Income in Area Code 785 is $80,533.
What is the Median Household income in Area Code 785?
Median Household Income in Area Code 785 is $65,138.
What is Income or Wage Gap in Area Code 785?
Income or Wage Gap in Area Code 785 is 33.7%.
Women in Area Code 785 earn 66.3 cents for every dollar earned by a man.
What is Family Income Deficit in Area Code 785?
Family Income Deficit in Area Code 785 is $11,084.
Families that are below poverty line in Area Code 785 earn $11,084 less on average than the poverty threshold level.
What is Inequality or Gini Index in Area Code 785?
Inequality or Gini Index in Area Code 785 is 115.87.
What is the Total Population of Area Code 785?
Total Population of Area Code 785 is 790,651.
What is the Total Male Population of Area Code 785?
Total Male Population of Area Code 785 is 399,557.
What is the Total Female Population of Area Code 785?
Total Female Population of Area Code 785 is 391,094.
What is the Ratio of Males per 100 Females in Area Code 785?
There are 102.16 Males per 100 Females in Area Code 785.
What is the Ratio of Females per 100 Males in Area Code 785?
There are 97.88 Females per 100 Males in Area Code 785.
What is the Median Population Age in Area Code 785?
Median Population Age in Area Code 785 is 43.4 Years.
What is the Average Family Size in Area Code 785
Average Family Size in Area Code 785 is 3.0 People.
What is the Average Household Size in Area Code 785
Average Household Size in Area Code 785 is 2.4 People.
How Large is the Labor Force in Area Code 785?
There are 401,898 People in the Labor Forcein in Area Code 785.
What is the Percentage of People in the Labor Force in Area Code 785?
63.2% of People are in the Labor Force in Area Code 785.
What is the Unemployment Rate in Area Code 785?
Unemployment Rate in Area Code 785 is 3.9%.