Zip Codes with the Highest Percentage of Self-Employed / Not Incorporated in Indianapolis, IN

RELATED REPORTS & OPTIONS

Self-Employed / Not Incorporated
Population
Families and Households
Female Fertility
Female Fertility (Unmarried)
Race (Community Size)
Race (Percentage)
Ancestry (Community Size)
AfghanAfricanAlaskan AthabascanAlbanianAlsatianAmericanApacheArabArgentineanArmenianAustralianAustrianBahamianBangladeshiBarbadianBasqueBelgianBelizeanBhutaneseBlackfeetBolivianBrazilianBritishBritish West IndianBulgarianBurmeseCajunCanadianCelticCentral AmericanCentral American IndianCherokeeChickasawChileanChippewaChoctawColombianCosta RicanCroatianCrowCubanCzechCzechoslovakianDanishDominicanDutchEastern EuropeanEcuadorianEgyptianEnglishEstonianEthiopianEuropeanFilipinoFinnishFrenchFrench CanadianGermanGerman RussianGhanaianGreekGuamanian / ChamorroGuatemalanGuyaneseHaitianHonduranHopiHungarianIcelanderIndian (Asian)IndonesianInupiatIranianIraqiIrishIroquoisIsraeliItalianJamaicanJapaneseJordanianKenyanKoreanLaotianLatvianLebaneseLiberianLithuanianLuxembourgerMacedonianMalaysianMenomineeMexicanMexican American IndianMongolianMoroccanNative HawaiianNavajoNew ZealanderNicaraguanNigerianNorthern EuropeanNorwegianPakistaniPalestinianPanamanianPennsylvania GermanPeruvianPolishPortuguesePotawatomiPuerto RicanRomanianRussianSalvadoranSamoanScandinavianScotch-IrishScottishSeminoleSenegaleseSerbianSierra LeoneanSiouxSlavicSlovakSloveneSouth AfricanSouth AmericanSouth American IndianSpaniardSpanishSri LankanSubsaharan AfricanSudaneseSwedishSwissSyrianThaiTonganTrinidadian and TobagonianTurkishUgandanUkrainianUruguayanVenezuelanVietnameseWelshWest IndianYugoslavianZimbabwean
Ancestry (Percentage)
AfghanAfricanAlaskan AthabascanAlbanianAlsatianAmericanApacheArabArgentineanArmenianAustralianAustrianBahamianBangladeshiBarbadianBasqueBelgianBelizeanBhutaneseBlackfeetBolivianBrazilianBritishBritish West IndianBulgarianBurmeseCajunCanadianCelticCentral AmericanCentral American IndianCherokeeChickasawChileanChippewaChoctawColombianCosta RicanCroatianCrowCubanCzechCzechoslovakianDanishDominicanDutchEastern EuropeanEcuadorianEgyptianEnglishEstonianEthiopianEuropeanFilipinoFinnishFrenchFrench CanadianGermanGerman RussianGhanaianGreekGuamanian / ChamorroGuatemalanGuyaneseHaitianHonduranHopiHungarianIcelanderIndian (Asian)IndonesianInupiatIranianIraqiIrishIroquoisIsraeliItalianJamaicanJapaneseJordanianKenyanKoreanLaotianLatvianLebaneseLiberianLithuanianLuxembourgerMacedonianMalaysianMenomineeMexicanMexican American IndianMongolianMoroccanNative HawaiianNavajoNew ZealanderNicaraguanNigerianNorthern EuropeanNorwegianPakistaniPalestinianPanamanianPennsylvania GermanPeruvianPolishPortuguesePotawatomiPuerto RicanRomanianRussianSalvadoranSamoanScandinavianScotch-IrishScottishSeminoleSenegaleseSerbianSierra LeoneanSiouxSlavicSlovakSloveneSouth AfricanSouth AmericanSouth American IndianSpaniardSpanishSri LankanSubsaharan AfricanSudaneseSwedishSwissSyrianThaiTonganTrinidadian and TobagonianTurkishUgandanUkrainianUruguayanVenezuelanVietnameseWelshWest IndianYugoslavianZimbabwean
Immigrant Origin (Total)
AfghanistanAfricaArgentinaAsiaAustraliaAustriaBahamasBangladeshBarbadosBelarusBoliviaBosnia and HerzegovinaBrazilBulgariaBurma / MyanmarCambodiaCameroonCanadaCaribbeanCentral AmericaChileChinaColombiaCongoCosta RicaCubaDenmarkDominican RepublicEastern AfricaEastern AsiaEastern EuropeEcuadorEgyptEl SalvadorEnglandEritreaEthiopiaEuropeFranceGermanyGhanaGreeceGuatemalaGuyanaHaitiHondurasHong KongHungaryIndiaIndonesiaIranIraqIrelandIsraelItalyJamaicaJapanJordanKenyaKoreaLaosLatin AmericaLatviaLebanonLiberiaMalaysiaMexicoMiddle AfricaMoldovaMoroccoNepalNetherlandsNicaraguaNigeriaNorth MacedoniaNorthern AfricaNorthern EuropeNorwayOceaniaPakistanPanamaPeruPhilippinesPolandPortugalRomaniaRussiaSaudi ArabiaScotlandSenegalSerbiaSierra LeoneSingaporeSouth AfricaSouth AmericaSouth Central AsiaSouth Eastern AsiaSouthern EuropeSpainSt. Vincent and the GrenadinesSudanSyriaTaiwanThailandTrinidad and TobagoTurkeyUgandaUkraineUzbekistanVenezuelaVietnamWest IndiesWestern AfricaWestern AsiaWestern EuropeYemenZaireZimbabwe
Immigrant Origin (Percentage)
AfghanistanAfricaArgentinaAsiaAustraliaAustriaBahamasBangladeshBarbadosBelarusBoliviaBosnia and HerzegovinaBrazilBulgariaBurma / MyanmarCambodiaCameroonCanadaCaribbeanCentral AmericaChileChinaColombiaCongoCosta RicaCubaDenmarkDominican RepublicEastern AfricaEastern AsiaEastern EuropeEcuadorEgyptEl SalvadorEnglandEritreaEthiopiaEuropeFranceGermanyGhanaGreeceGuatemalaGuyanaHaitiHondurasHong KongHungaryIndiaIndonesiaIranIraqIrelandIsraelItalyJamaicaJapanJordanKenyaKoreaLaosLatin AmericaLatviaLebanonLiberiaMalaysiaMexicoMiddle AfricaMoldovaMoroccoNepalNetherlandsNicaraguaNigeriaNorth MacedoniaNorthern AfricaNorthern EuropeNorwayOceaniaPakistanPanamaPeruPhilippinesPolandPortugalRomaniaRussiaSaudi ArabiaScotlandSenegalSerbiaSierra LeoneSingaporeSouth AfricaSouth AmericaSouth Central AsiaSouth Eastern AsiaSouthern EuropeSpainSt. Vincent and the GrenadinesSudanSyriaTaiwanThailandTrinidad and TobagoTurkeyUgandaUkraineUzbekistanVenezuelaVietnamWest IndiesWestern AfricaWestern AsiaWestern EuropeYemenZaireZimbabwe
Income
Income (Families)
Income (Households)
Poverty
Poverty (Families)
Unemployment
Employment Occupations
Employment Industries
Employer Class
Commute Time
Commute Means
School Enrollment
Education by Degree Field
Occupancy
Finances
Physical Characteristics
Indianapolis
Compare Zip Codes
Comparison Subject

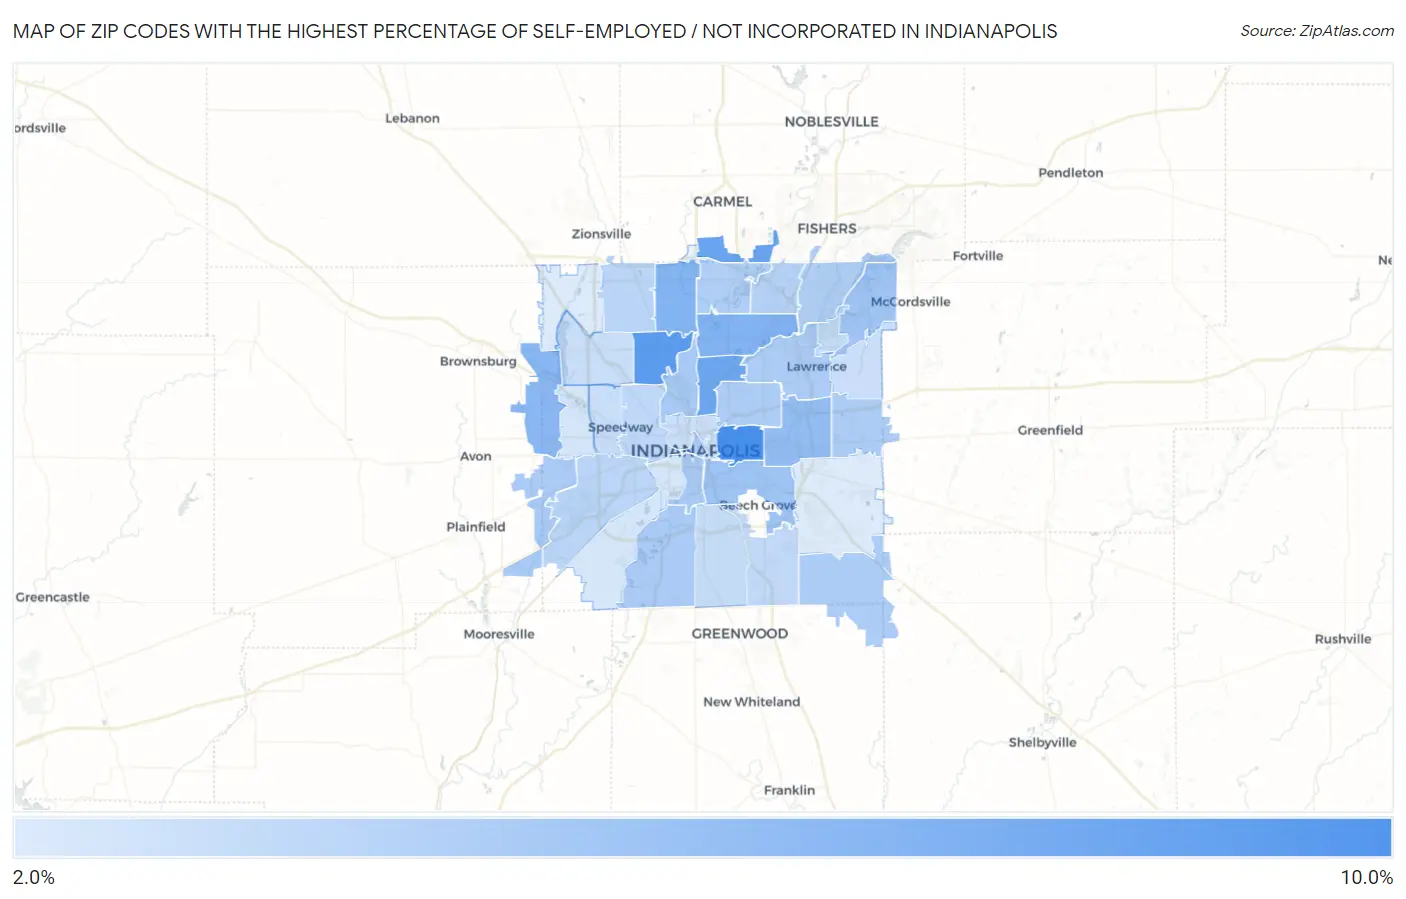
Map of Zip Codes with the Highest Percentage of Self-Employed / Not Incorporated in Indianapolis

0.0%
10.0%
Zip Codes with the Highest Percentage of Self-Employed / Not Incorporated in Indianapolis Map

Zip Codes with the Highest Percentage of Self-Employed / Not Incorporated in Indianapolis, IN

Zip Code % Self-Employed / Not Incorporated vs State vs National
1.462018.9%4.5%(+4.39)#995.8%(+3.07)#8,988
2.462287.9%4.5%(+3.40)#1365.8%(+2.08)#10,861
3.462807.3%4.5%(+2.79)#1585.8%(+1.47)#12,310
4.462057.1%4.5%(+2.60)#1705.8%(+1.28)#12,753
5.462206.2%4.5%(+1.72)#2205.8%(+0.402)#15,365
6.462606.1%4.5%(+1.59)#2325.8%(+0.274)#15,764
7.462345.8%4.5%(+1.34)#2555.8%(+0.021)#16,597
8.462195.4%4.5%(+0.882)#2835.8%(-0.438)#18,209
9.462034.8%4.5%(+0.337)#3375.8%(-0.983)#20,290
10.462364.7%4.5%(+0.244)#3515.8%(-1.08)#20,648
11.462084.5%4.5%(-0.031)#3815.8%(-1.35)#21,713
12.462314.4%4.5%(-0.085)#3875.8%(-1.40)#21,919
13.462174.4%4.5%(-0.094)#3895.8%(-1.41)#21,952
14.462254.4%4.5%(-0.103)#3925.8%(-1.42)#21,975
15.462044.3%4.5%(-0.216)#4115.8%(-1.54)#22,402
16.462264.3%4.5%(-0.235)#4145.8%(-1.55)#22,470
17.462294.3%4.5%(-0.240)#4165.8%(-1.56)#22,488
18.462184.2%4.5%(-0.269)#4215.8%(-1.59)#22,593
19.462594.2%4.5%(-0.277)#4225.8%(-1.60)#22,620
20.462404.1%4.5%(-0.389)#4385.8%(-1.71)#23,027
21.462564.0%4.5%(-0.456)#4475.8%(-1.78)#23,253
22.462503.9%4.5%(-0.638)#4605.8%(-1.96)#23,865
23.462413.7%4.5%(-0.803)#4805.8%(-2.12)#24,429
24.462683.6%4.5%(-0.881)#4915.8%(-2.20)#24,663
25.462223.4%4.5%(-1.06)#5155.8%(-2.38)#25,201
26.462373.3%4.5%(-1.19)#5285.8%(-2.51)#25,582
27.462273.1%4.5%(-1.37)#5505.8%(-2.69)#26,061
28.462163.1%4.5%(-1.38)#5555.8%(-2.70)#26,091
29.462243.1%4.5%(-1.41)#5585.8%(-2.73)#26,154
30.462543.1%4.5%(-1.41)#5595.8%(-2.73)#26,163
31.462353.0%4.5%(-1.53)#5735.8%(-2.85)#26,462
32.462022.9%4.5%(-1.57)#5775.8%(-2.89)#26,546
33.462142.5%4.5%(-1.95)#6075.8%(-3.27)#27,332
34.462212.5%4.5%(-2.02)#6115.8%(-3.34)#27,448
35.462392.1%4.5%(-2.35)#6425.8%(-3.67)#28,034
36.462782.1%4.5%(-2.37)#6435.8%(-3.69)#28,049

Common Questions

What are the Top 10 Zip Codes with the Highest Percentage of Self-Employed / Not Incorporated in Indianapolis, IN?
Top 10 Zip Codes with the Highest Percentage of Self-Employed / Not Incorporated in Indianapolis, IN are:
#1
8.9%
#2
7.9%
#3
7.3%
#4
7.1%
#5
6.2%
#6
6.1%
#7
5.8%
#8
5.4%
#9
4.8%
#10
4.7%
What zip code has the Highest Percentage of Self-Employed / Not Incorporated in Indianapolis, IN?
46201 has the Highest Percentage of Self-Employed / Not Incorporated in Indianapolis, IN with 8.9%.
What is the Percentage of Self-Employed / Not Incorporated in Indianapolis, IN?
Percentage of Self-Employed / Not Incorporated in Indianapolis is 4.2%.
What is the Percentage of Self-Employed / Not Incorporated in Indiana?
Percentage of Self-Employed / Not Incorporated in Indiana is 4.5%.
What is the Percentage of Self-Employed / Not Incorporated in the United States?
Percentage of Self-Employed / Not Incorporated in the United States is 5.8%.