Zip Codes with the Highest Percentage of Self-Employed / Not Incorporated in Indiana
RELATED REPORTS & OPTIONS
Self-Employed / Not Incorporated
Indiana
Compare Zip Codes
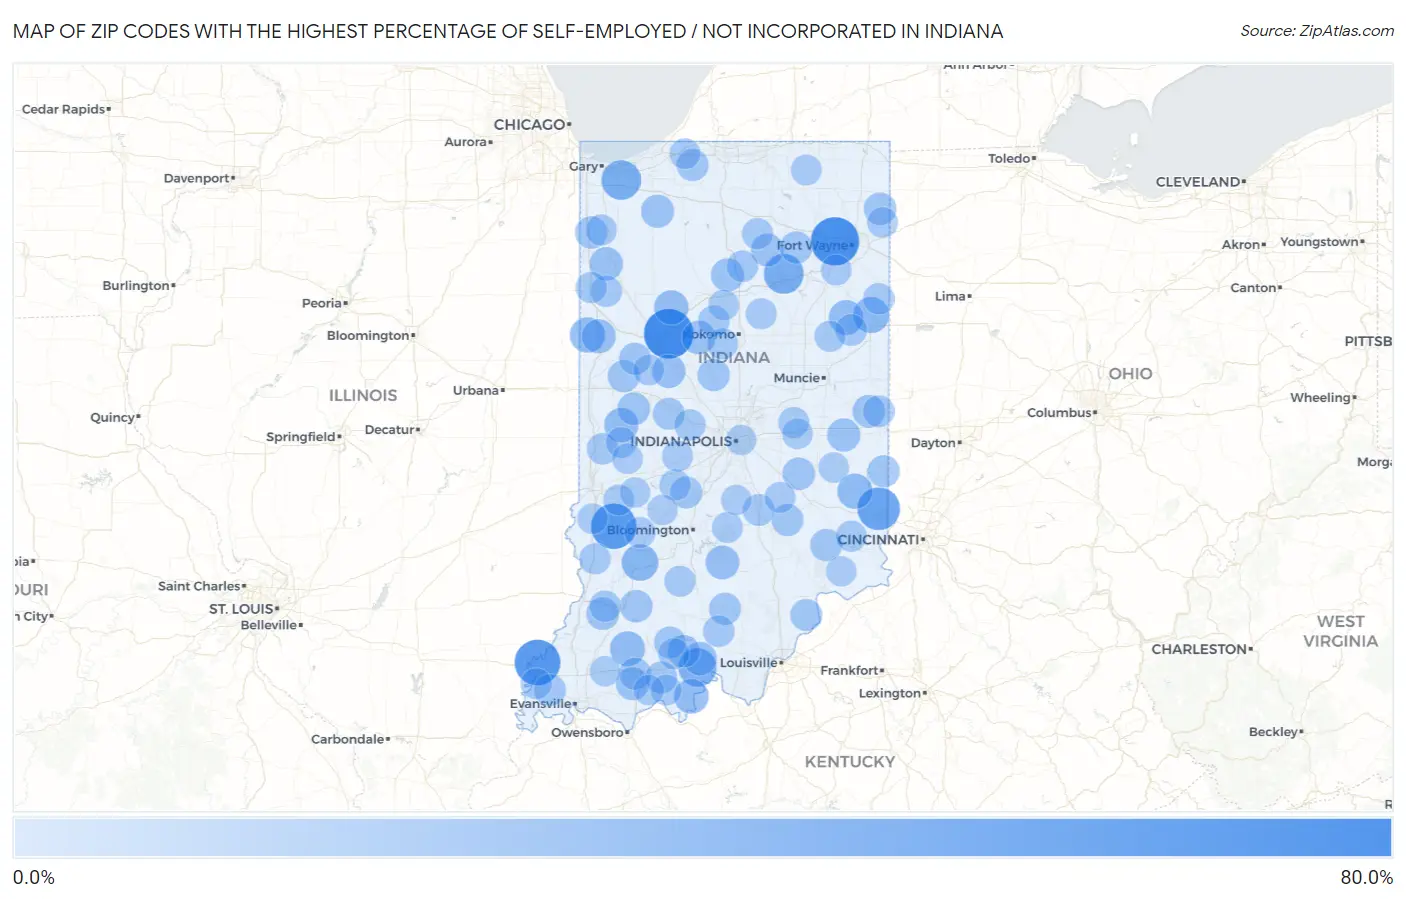
Map of Zip Codes with the Highest Percentage of Self-Employed / Not Incorporated in Indiana
0.0%
80.0%
Zip Codes with the Highest Percentage of Self-Employed / Not Incorporated in Indiana
| Zip Code | % Self-Employed / Not Incorporated | vs State | vs National | |
| 1. | 47924 | 61.4% | 4.5%(+56.9)#1 | 5.8%(+55.6)#133 |
| 2. | 46704 | 57.9% | 4.5%(+53.4)#2 | 5.8%(+52.1)#150 |
| 3. | 47616 | 50.7% | 4.5%(+46.2)#3 | 5.8%(+44.9)#212 |
| 4. | 47845 | 50.0% | 4.5%(+45.5)#4 | 5.8%(+44.2)#225 |
| 5. | 47035 | 41.9% | 4.5%(+37.4)#5 | 5.8%(+36.1)#366 |
| 6. | 46990 | 34.5% | 4.5%(+30.0)#6 | 5.8%(+28.7)#566 |
| 7. | 46393 | 33.3% | 4.5%(+28.8)#7 | 5.8%(+27.5)#605 |
| 8. | 47174 | 30.2% | 4.5%(+25.7)#8 | 5.8%(+24.4)#757 |
| 9. | 47449 | 25.6% | 4.5%(+21.1)#9 | 5.8%(+19.8)#1,091 |
| 10. | 46740 | 24.0% | 4.5%(+19.5)#10 | 5.8%(+18.2)#1,256 |
| 11. | 47917 | 22.0% | 4.5%(+17.5)#11 | 5.8%(+16.2)#1,471 |
| 12. | 47030 | 21.8% | 4.5%(+17.3)#12 | 5.8%(+16.0)#1,503 |
| 13. | 47590 | 21.1% | 4.5%(+16.6)#13 | 5.8%(+15.3)#1,618 |
| 14. | 46759 | 20.7% | 4.5%(+16.2)#14 | 5.8%(+14.9)#1,686 |
| 15. | 47525 | 20.6% | 4.5%(+16.1)#15 | 5.8%(+14.8)#1,708 |
| 16. | 47997 | 19.6% | 4.5%(+15.1)#16 | 5.8%(+13.8)#1,893 |
| 17. | 47859 | 19.1% | 4.5%(+14.6)#17 | 5.8%(+13.3)#1,997 |
| 18. | 47921 | 18.7% | 4.5%(+14.2)#18 | 5.8%(+12.9)#2,112 |
| 19. | 47264 | 17.8% | 4.5%(+13.3)#19 | 5.8%(+12.0)#2,357 |
| 20. | 46920 | 17.3% | 4.5%(+12.8)#20 | 5.8%(+11.5)#2,521 |
| 21. | 47123 | 17.3% | 4.5%(+12.8)#21 | 5.8%(+11.5)#2,531 |
| 22. | 47964 | 17.1% | 4.5%(+12.6)#22 | 5.8%(+11.3)#2,592 |
| 23. | 47930 | 17.1% | 4.5%(+12.6)#23 | 5.8%(+11.3)#2,602 |
| 24. | 47335 | 16.4% | 4.5%(+11.9)#24 | 5.8%(+10.5)#2,854 |
| 25. | 46348 | 16.3% | 4.5%(+11.8)#25 | 5.8%(+10.5)#2,867 |
| 26. | 46988 | 16.1% | 4.5%(+11.6)#26 | 5.8%(+10.3)#2,937 |
| 27. | 47537 | 15.9% | 4.5%(+11.4)#27 | 5.8%(+10.1)#3,000 |
| 28. | 46982 | 15.7% | 4.5%(+11.2)#28 | 5.8%(+9.87)#3,125 |
| 29. | 47393 | 15.1% | 4.5%(+10.6)#29 | 5.8%(+9.26)#3,378 |
| 30. | 47916 | 15.0% | 4.5%(+10.5)#30 | 5.8%(+9.18)#3,427 |
| 31. | 47557 | 14.6% | 4.5%(+10.1)#31 | 5.8%(+8.83)#3,595 |
| 32. | 47558 | 14.5% | 4.5%(+10.0)#32 | 5.8%(+8.72)#3,633 |
| 33. | 46785 | 14.5% | 4.5%(+9.99)#33 | 5.8%(+8.67)#3,662 |
| 34. | 46150 | 14.5% | 4.5%(+9.96)#34 | 5.8%(+8.64)#3,676 |
| 35. | 46379 | 14.3% | 4.5%(+9.79)#35 | 5.8%(+8.47)#3,744 |
| 36. | 46787 | 14.2% | 4.5%(+9.71)#36 | 5.8%(+8.39)#3,799 |
| 37. | 47116 | 13.9% | 4.5%(+9.39)#37 | 5.8%(+8.07)#3,965 |
| 38. | 46050 | 13.7% | 4.5%(+9.21)#38 | 5.8%(+7.89)#4,061 |
| 39. | 47023 | 13.5% | 4.5%(+9.04)#39 | 5.8%(+7.72)#4,163 |
| 40. | 47969 | 13.5% | 4.5%(+9.02)#40 | 5.8%(+7.70)#4,183 |
| 41. | 47108 | 13.4% | 4.5%(+8.90)#41 | 5.8%(+7.58)#4,252 |
| 42. | 47244 | 13.4% | 4.5%(+8.87)#42 | 5.8%(+7.55)#4,268 |
| 43. | 46166 | 13.3% | 4.5%(+8.81)#43 | 5.8%(+7.49)#4,317 |
| 44. | 47523 | 13.3% | 4.5%(+8.76)#44 | 5.8%(+7.44)#4,343 |
| 45. | 47992 | 13.2% | 4.5%(+8.66)#45 | 5.8%(+7.35)#4,416 |
| 46. | 46365 | 13.1% | 4.5%(+8.65)#46 | 5.8%(+7.33)#4,429 |
| 47. | 47521 | 13.0% | 4.5%(+8.48)#47 | 5.8%(+7.16)#4,544 |
| 48. | 47003 | 13.0% | 4.5%(+8.46)#48 | 5.8%(+7.14)#4,555 |
| 49. | 47577 | 12.7% | 4.5%(+8.22)#49 | 5.8%(+6.90)#4,719 |
| 50. | 47147 | 12.7% | 4.5%(+8.21)#50 | 5.8%(+6.89)#4,723 |
| 51. | 47968 | 12.7% | 4.5%(+8.21)#51 | 5.8%(+6.89)#4,728 |
| 52. | 47638 | 12.3% | 4.5%(+7.79)#52 | 5.8%(+6.47)#5,051 |
| 53. | 47280 | 12.3% | 4.5%(+7.77)#53 | 5.8%(+6.45)#5,066 |
| 54. | 47369 | 12.0% | 4.5%(+7.47)#54 | 5.8%(+6.15)#5,311 |
| 55. | 46998 | 11.9% | 4.5%(+7.44)#55 | 5.8%(+6.12)#5,324 |
| 56. | 47341 | 11.9% | 4.5%(+7.39)#56 | 5.8%(+6.07)#5,368 |
| 57. | 47125 | 11.8% | 4.5%(+7.30)#57 | 5.8%(+5.98)#5,458 |
| 58. | 47948 | 11.7% | 4.5%(+7.22)#58 | 5.8%(+5.90)#5,521 |
| 59. | 47860 | 11.7% | 4.5%(+7.22)#59 | 5.8%(+5.90)#5,530 |
| 60. | 46951 | 11.6% | 4.5%(+7.15)#60 | 5.8%(+5.83)#5,588 |
| 61. | 47597 | 11.6% | 4.5%(+7.08)#61 | 5.8%(+5.76)#5,637 |
| 62. | 46772 | 11.4% | 4.5%(+6.94)#62 | 5.8%(+5.62)#5,780 |
| 63. | 46149 | 11.4% | 4.5%(+6.93)#63 | 5.8%(+5.61)#5,792 |
| 64. | 47951 | 11.2% | 4.5%(+6.67)#64 | 5.8%(+5.35)#6,039 |
| 65. | 47456 | 11.1% | 4.5%(+6.62)#65 | 5.8%(+5.30)#6,084 |
| 66. | 46508 | 11.0% | 4.5%(+6.53)#66 | 5.8%(+5.21)#6,181 |
| 67. | 46979 | 11.0% | 4.5%(+6.53)#67 | 5.8%(+5.21)#6,187 |
| 68. | 47838 | 11.0% | 4.5%(+6.51)#68 | 5.8%(+5.19)#6,208 |
| 69. | 47513 | 10.8% | 4.5%(+6.32)#69 | 5.8%(+5.00)#6,396 |
| 70. | 46381 | 10.8% | 4.5%(+6.30)#70 | 5.8%(+4.98)#6,426 |
| 71. | 46186 | 10.7% | 4.5%(+6.20)#71 | 5.8%(+4.88)#6,551 |
| 72. | 47031 | 10.7% | 4.5%(+6.16)#72 | 5.8%(+4.84)#6,590 |
| 73. | 47470 | 10.6% | 4.5%(+6.15)#73 | 5.8%(+4.83)#6,604 |
| 74. | 47631 | 10.6% | 4.5%(+6.14)#74 | 5.8%(+4.82)#6,620 |
| 75. | 47348 | 10.6% | 4.5%(+6.07)#75 | 5.8%(+4.75)#6,698 |
| 76. | 46911 | 10.4% | 4.5%(+5.94)#76 | 5.8%(+4.62)#6,843 |
| 77. | 47471 | 10.4% | 4.5%(+5.93)#77 | 5.8%(+4.61)#6,856 |
| 78. | 47448 | 10.4% | 4.5%(+5.93)#78 | 5.8%(+4.61)#6,857 |
| 79. | 47846 | 10.4% | 4.5%(+5.87)#79 | 5.8%(+4.55)#6,927 |
| 80. | 47234 | 10.2% | 4.5%(+5.73)#80 | 5.8%(+4.41)#7,091 |
| 81. | 46571 | 10.2% | 4.5%(+5.66)#81 | 5.8%(+4.34)#7,172 |
| 82. | 46121 | 10.1% | 4.5%(+5.65)#82 | 5.8%(+4.33)#7,176 |
| 83. | 47981 | 10.1% | 4.5%(+5.59)#83 | 5.8%(+4.27)#7,253 |
| 84. | 46371 | 10.0% | 4.5%(+5.49)#84 | 5.8%(+4.17)#7,384 |
| 85. | 47872 | 9.8% | 4.5%(+5.28)#85 | 5.8%(+3.96)#7,665 |
| 86. | 47588 | 9.7% | 4.5%(+5.17)#86 | 5.8%(+3.85)#7,798 |
| 87. | 46799 | 9.7% | 4.5%(+5.17)#87 | 5.8%(+3.85)#7,805 |
| 88. | 46117 | 9.5% | 4.5%(+5.05)#88 | 5.8%(+3.73)#7,970 |
| 89. | 46994 | 9.5% | 4.5%(+4.98)#89 | 5.8%(+3.66)#8,046 |
| 90. | 47837 | 9.5% | 4.5%(+4.97)#90 | 5.8%(+3.65)#8,059 |
| 91. | 46743 | 9.4% | 4.5%(+4.93)#91 | 5.8%(+3.61)#8,105 |
| 92. | 47850 | 9.2% | 4.5%(+4.75)#92 | 5.8%(+3.43)#8,386 |
| 93. | 46133 | 9.2% | 4.5%(+4.67)#93 | 5.8%(+3.35)#8,510 |
| 94. | 47840 | 9.1% | 4.5%(+4.58)#94 | 5.8%(+3.26)#8,663 |
| 95. | 46181 | 9.0% | 4.5%(+4.55)#95 | 5.8%(+3.23)#8,706 |
| 96. | 47460 | 9.0% | 4.5%(+4.54)#96 | 5.8%(+3.22)#8,725 |
| 97. | 47550 | 9.0% | 4.5%(+4.50)#97 | 5.8%(+3.18)#8,773 |
| 98. | 47619 | 8.9% | 4.5%(+4.41)#98 | 5.8%(+3.09)#8,940 |
| 99. | 46201 | 8.9% | 4.5%(+4.39)#99 | 5.8%(+3.07)#8,988 |
| 100. | 47224 | 8.9% | 4.5%(+4.38)#100 | 5.8%(+3.06)#9,023 |
Common Questions
What are the Top 10 Zip Codes with the Highest Percentage of Self-Employed / Not Incorporated in Indiana?
Top 10 Zip Codes with the Highest Percentage of Self-Employed / Not Incorporated in Indiana are:
What zip code has the Highest Percentage of Self-Employed / Not Incorporated in Indiana?
47924 has the Highest Percentage of Self-Employed / Not Incorporated in Indiana with 61.4%.
What is the Percentage of Self-Employed / Not Incorporated in the State of Indiana?
Percentage of Self-Employed / Not Incorporated in Indiana is 4.5%.
What is the Percentage of Self-Employed / Not Incorporated in the United States?
Percentage of Self-Employed / Not Incorporated in the United States is 5.8%.