Thornton, IA Map & Demographics
Thornton Map
Thornton Overview
$31,683
PER CAPITA INCOME
$62,500
AVG FAMILY INCOME
$58,676
AVG HOUSEHOLD INCOME
43.0%
WAGE / INCOME GAP [ % ]
57.0¢/ $1
WAGE / INCOME GAP [ $ ]
0.34
INEQUALITY / GINI INDEX
466
TOTAL POPULATION
228
MALE POPULATION
238
FEMALE POPULATION
95.80
MALES / 100 FEMALES
104.39
FEMALES / 100 MALES
33.0
MEDIAN AGE
2.6
AVG FAMILY SIZE
2.2
AVG HOUSEHOLD SIZE
248
LABOR FORCE [ PEOPLE ]
66.1%
PERCENT IN LABOR FORCE
2.0%
UNEMPLOYMENT RATE
Thornton Zip Codes
Thornton Area Codes
Income in Thornton
Income Overview in Thornton
Per Capita Income in Thornton is $31,683, while median incomes of families and households are $62,500 and $58,676 respectively.
| Characteristic | Number | Measure |
| Per Capita Income | 466 | $31,683 |
| Median Family Income | 146 | $62,500 |
| Mean Family Income | 146 | $78,347 |
| Median Household Income | 216 | $58,676 |
| Mean Household Income | 216 | $72,162 |
| Income Deficit | 146 | $0 |
| Wage / Income Gap (%) | 466 | 43.00% |
| Wage / Income Gap ($) | 466 | 57.00¢ per $1 |
| Gini / Inequality Index | 466 | 0.34 |
Earnings by Sex in Thornton
Average Earnings in Thornton are $38,571, $46,927 for men and $26,750 for women, a difference of 43.0%.
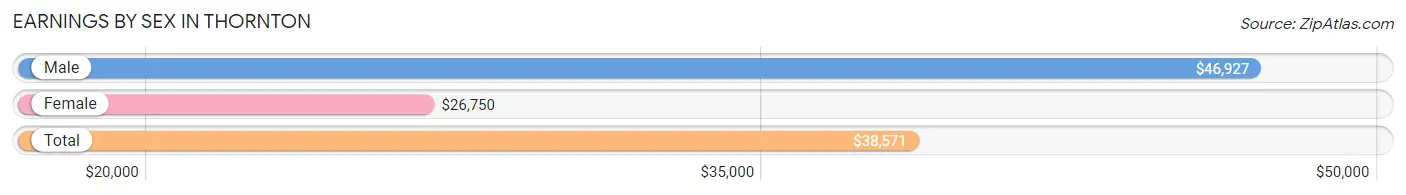
| Sex | Number | Average Earnings |
| Male | 145 (58.0%) | $46,927 |
| Female | 105 (42.0%) | $26,750 |
| Total | 250 (100.0%) | $38,571 |
Earnings by Sex by Income Bracket in Thornton
The most common earnings brackets in Thornton are $45,000 to $49,999 for men (38 | 26.2%) and $10,000 to $12,499 for women (18 | 17.1%).
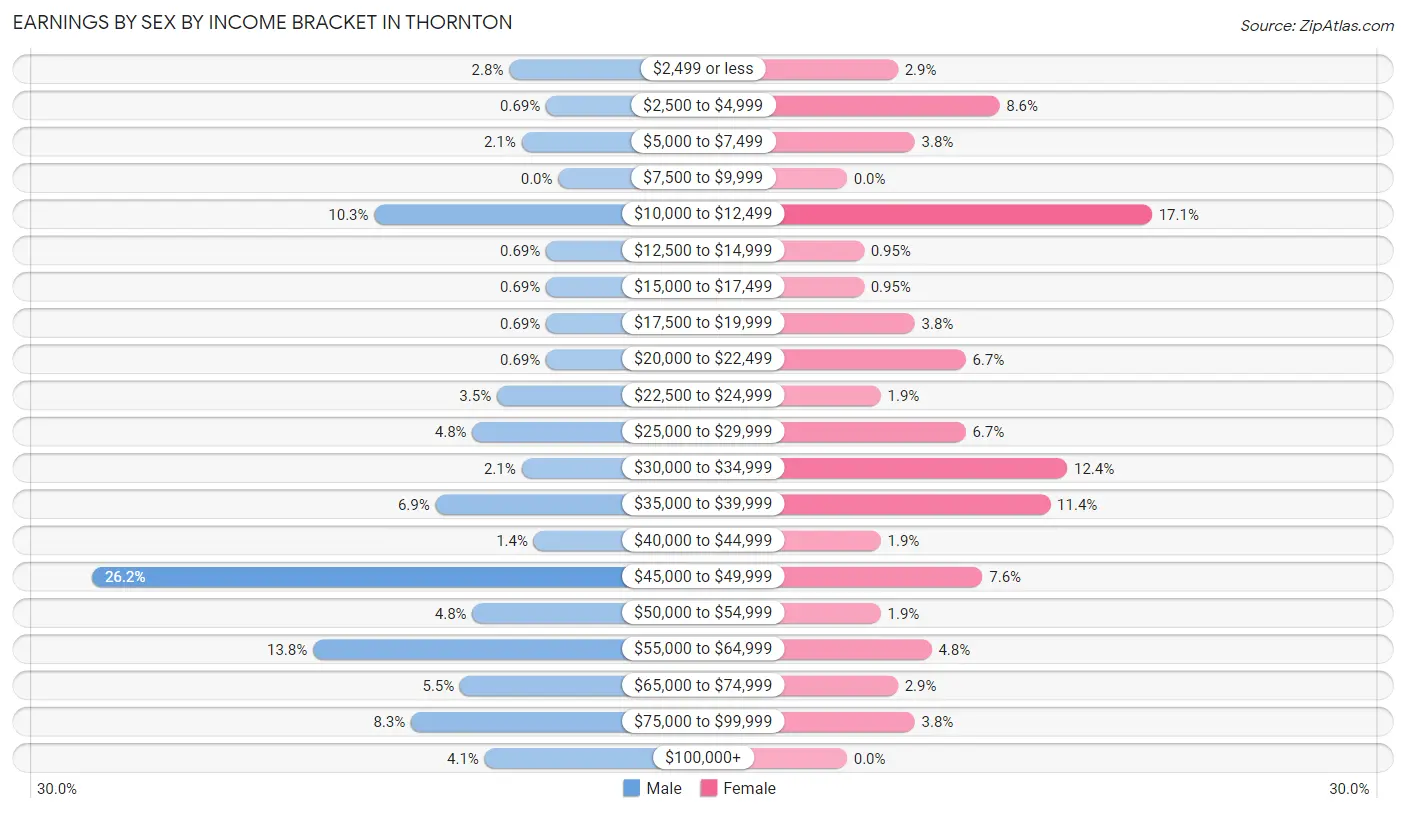
| Income | Male | Female |
| $2,499 or less | 4 (2.8%) | 3 (2.9%) |
| $2,500 to $4,999 | 1 (0.7%) | 9 (8.6%) |
| $5,000 to $7,499 | 3 (2.1%) | 4 (3.8%) |
| $7,500 to $9,999 | 0 (0.0%) | 0 (0.0%) |
| $10,000 to $12,499 | 15 (10.3%) | 18 (17.1%) |
| $12,500 to $14,999 | 1 (0.7%) | 1 (0.9%) |
| $15,000 to $17,499 | 1 (0.7%) | 1 (0.9%) |
| $17,500 to $19,999 | 1 (0.7%) | 4 (3.8%) |
| $20,000 to $22,499 | 1 (0.7%) | 7 (6.7%) |
| $22,500 to $24,999 | 5 (3.5%) | 2 (1.9%) |
| $25,000 to $29,999 | 7 (4.8%) | 7 (6.7%) |
| $30,000 to $34,999 | 3 (2.1%) | 13 (12.4%) |
| $35,000 to $39,999 | 10 (6.9%) | 12 (11.4%) |
| $40,000 to $44,999 | 2 (1.4%) | 2 (1.9%) |
| $45,000 to $49,999 | 38 (26.2%) | 8 (7.6%) |
| $50,000 to $54,999 | 7 (4.8%) | 2 (1.9%) |
| $55,000 to $64,999 | 20 (13.8%) | 5 (4.8%) |
| $65,000 to $74,999 | 8 (5.5%) | 3 (2.9%) |
| $75,000 to $99,999 | 12 (8.3%) | 4 (3.8%) |
| $100,000+ | 6 (4.1%) | 0 (0.0%) |
| Total | 145 (100.0%) | 105 (100.0%) |
Earnings by Sex by Educational Attainment in Thornton
Average earnings in Thornton are $50,313 for men and $34,375 for women, a difference of 31.7%. Men with an educational attainment of college or associate's degree enjoy the highest average annual earnings of $58,250, while those with graduate degree education earn the least with $41,250. Women with an educational attainment of college or associate's degree earn the most with the average annual earnings of $35,938, while those with high school diploma education have the smallest earnings of $33,750.
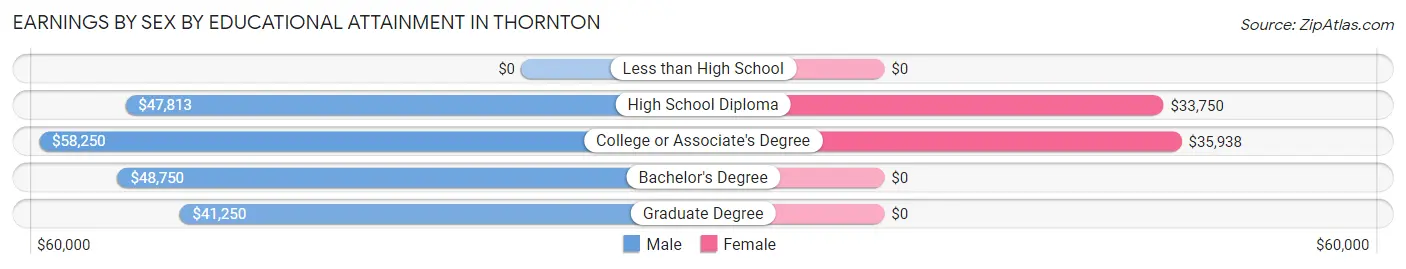
| Educational Attainment | Male Income | Female Income |
| Less than High School | - | - |
| High School Diploma | $47,813 | $33,750 |
| College or Associate's Degree | $58,250 | $35,938 |
| Bachelor's Degree | $48,750 | $0 |
| Graduate Degree | $41,250 | $0 |
| Total | $50,313 | $34,375 |
Family Income in Thornton
Family Income Brackets in Thornton
According to the Thornton family income data, there are 50 families falling into the $50,000 to $74,999 income range, which is the most common income bracket and makes up 34.3% of all families. Conversely, the less than $10,000 income bracket is the least frequent group with only 1 families (0.7%) belonging to this category.
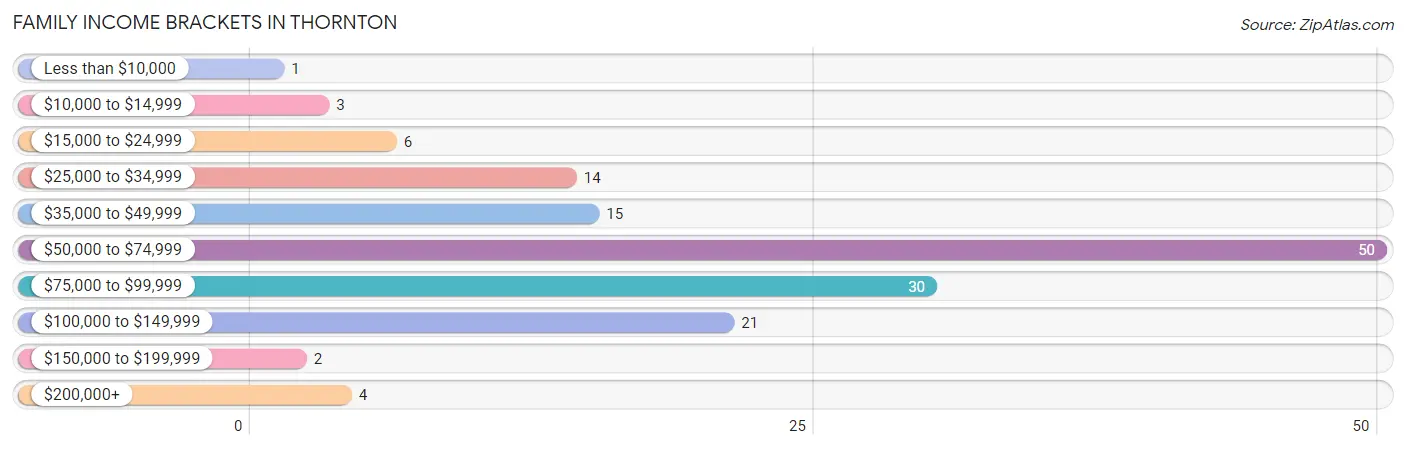
| Income Bracket | # Families | % Families |
| Less than $10,000 | 1 | 0.7% |
| $10,000 to $14,999 | 3 | 2.1% |
| $15,000 to $24,999 | 6 | 4.1% |
| $25,000 to $34,999 | 14 | 9.6% |
| $35,000 to $49,999 | 15 | 10.3% |
| $50,000 to $74,999 | 50 | 34.2% |
| $75,000 to $99,999 | 30 | 20.5% |
| $100,000 to $149,999 | 21 | 14.4% |
| $150,000 to $199,999 | 2 | 1.4% |
| $200,000+ | 4 | 2.7% |
Family Income by Famaliy Size in Thornton
3-person families (22 | 15.1%) account for the highest median family income in Thornton with $76,667 per family, while 2-person families (96 | 65.7%) have the highest median income of $29,375 per family member.
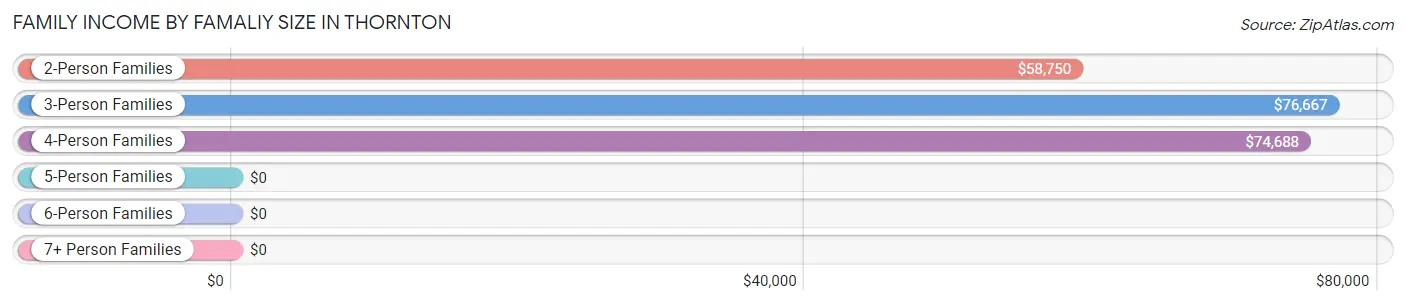
| Income Bracket | # Families | Median Income |
| 2-Person Families | 96 (65.7%) | $58,750 |
| 3-Person Families | 22 (15.1%) | $76,667 |
| 4-Person Families | 19 (13.0%) | $74,688 |
| 5-Person Families | 8 (5.5%) | $0 |
| 6-Person Families | 1 (0.7%) | $0 |
| 7+ Person Families | 0 (0.0%) | $0 |
| Total | 146 (100.0%) | $62,500 |
Family Income by Number of Earners in Thornton
The median family income in Thornton is $62,500, with families comprising 3+ earners (6) having the highest median family income of $100,000, while families with 1 earner (30) have the lowest median family income of $49,375, accounting for 4.1% and 20.5% of families, respectively.
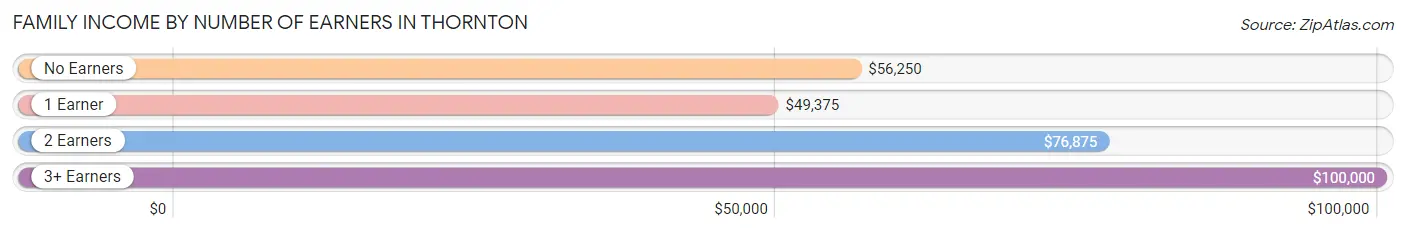
| Number of Earners | # Families | Median Income |
| No Earners | 41 (28.1%) | $56,250 |
| 1 Earner | 30 (20.5%) | $49,375 |
| 2 Earners | 69 (47.3%) | $76,875 |
| 3+ Earners | 6 (4.1%) | $100,000 |
| Total | 146 (100.0%) | $62,500 |
Household Income in Thornton
Household Income Brackets in Thornton
With 71 households falling in the category, the $50,000 to $74,999 income range is the most frequent in Thornton, accounting for 32.9% of all households. In contrast, only 1 households (0.5%) fall into the less than $10,000 income bracket, making it the least populous group.
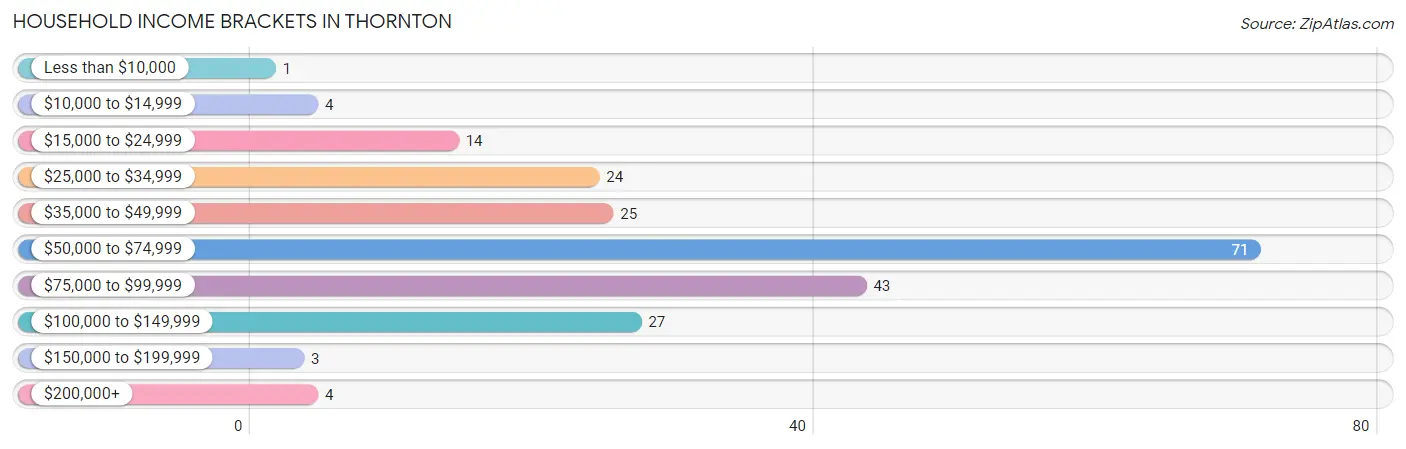
| Income Bracket | # Households | % Households |
| Less than $10,000 | 1 | 0.5% |
| $10,000 to $14,999 | 4 | 1.9% |
| $15,000 to $24,999 | 14 | 6.5% |
| $25,000 to $34,999 | 24 | 11.1% |
| $35,000 to $49,999 | 25 | 11.6% |
| $50,000 to $74,999 | 71 | 32.9% |
| $75,000 to $99,999 | 43 | 19.9% |
| $100,000 to $149,999 | 27 | 12.5% |
| $150,000 to $199,999 | 3 | 1.4% |
| $200,000+ | 4 | 1.9% |
Household Income by Householder Age in Thornton
The median household income in Thornton is $58,676, with the highest median household income of $77,188 found in the 45 to 64 years age bracket for the primary householder. A total of 50 households (23.2%) fall into this category. Meanwhile, the 65+ years age bracket for the primary householder has the lowest median household income of $56,354, with 58 households (26.9%) in this group.
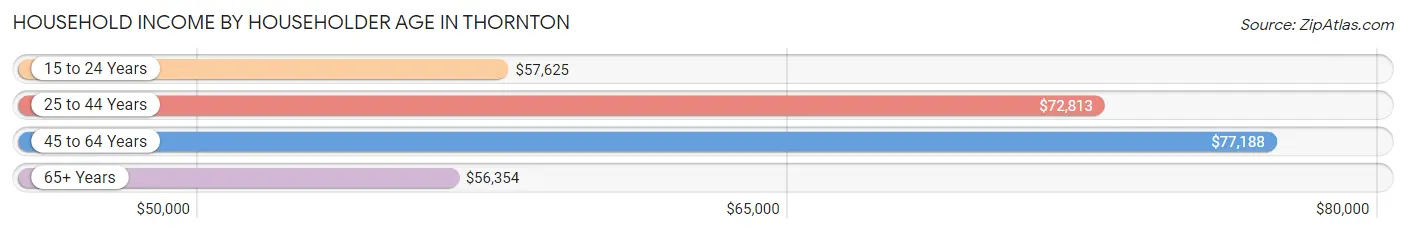
| Income Bracket | # Households | Median Income |
| 15 to 24 Years | 47 (21.8%) | $57,625 |
| 25 to 44 Years | 61 (28.2%) | $72,813 |
| 45 to 64 Years | 50 (23.2%) | $77,188 |
| 65+ Years | 58 (26.9%) | $56,354 |
| Total | 216 (100.0%) | $58,676 |
Poverty in Thornton
Income Below Poverty by Sex and Age in Thornton
With 9.2% poverty level for males and 8.8% for females among the residents of Thornton, 18 to 24 year old males and 6 to 11 year old females are the most vulnerable to poverty, with 10 males (22.7%) and 5 females (25.0%) in their respective age groups living below the poverty level.
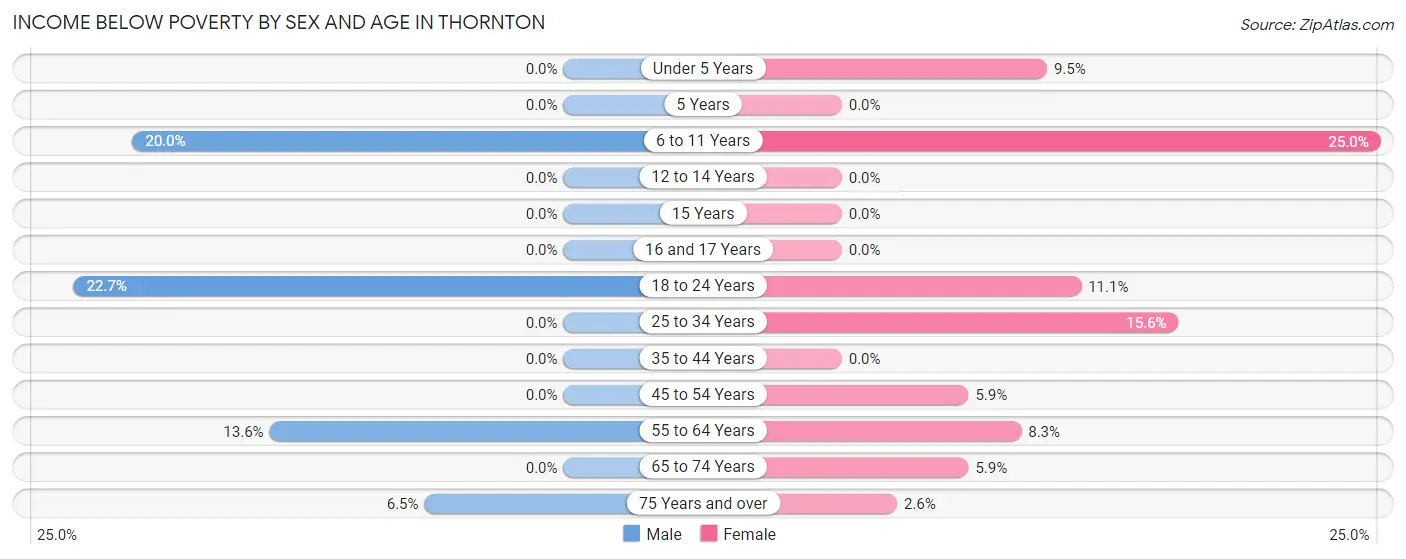
| Age Bracket | Male | Female |
| Under 5 Years | 0 (0.0%) | 2 (9.5%) |
| 5 Years | 0 (0.0%) | 0 (0.0%) |
| 6 to 11 Years | 6 (20.0%) | 5 (25.0%) |
| 12 to 14 Years | 0 (0.0%) | 0 (0.0%) |
| 15 Years | 0 (0.0%) | 0 (0.0%) |
| 16 and 17 Years | 0 (0.0%) | 0 (0.0%) |
| 18 to 24 Years | 10 (22.7%) | 4 (11.1%) |
| 25 to 34 Years | 0 (0.0%) | 5 (15.6%) |
| 35 to 44 Years | 0 (0.0%) | 0 (0.0%) |
| 45 to 54 Years | 0 (0.0%) | 1 (5.9%) |
| 55 to 64 Years | 3 (13.6%) | 2 (8.3%) |
| 65 to 74 Years | 0 (0.0%) | 1 (5.9%) |
| 75 Years and over | 2 (6.5%) | 1 (2.6%) |
| Total | 21 (9.2%) | 21 (8.8%) |
Income Above Poverty by Sex and Age in Thornton
According to the poverty statistics in Thornton, males aged under 5 years and females aged 5 years are the age groups that are most secure financially, with 100.0% of males and 100.0% of females in these age groups living above the poverty line.
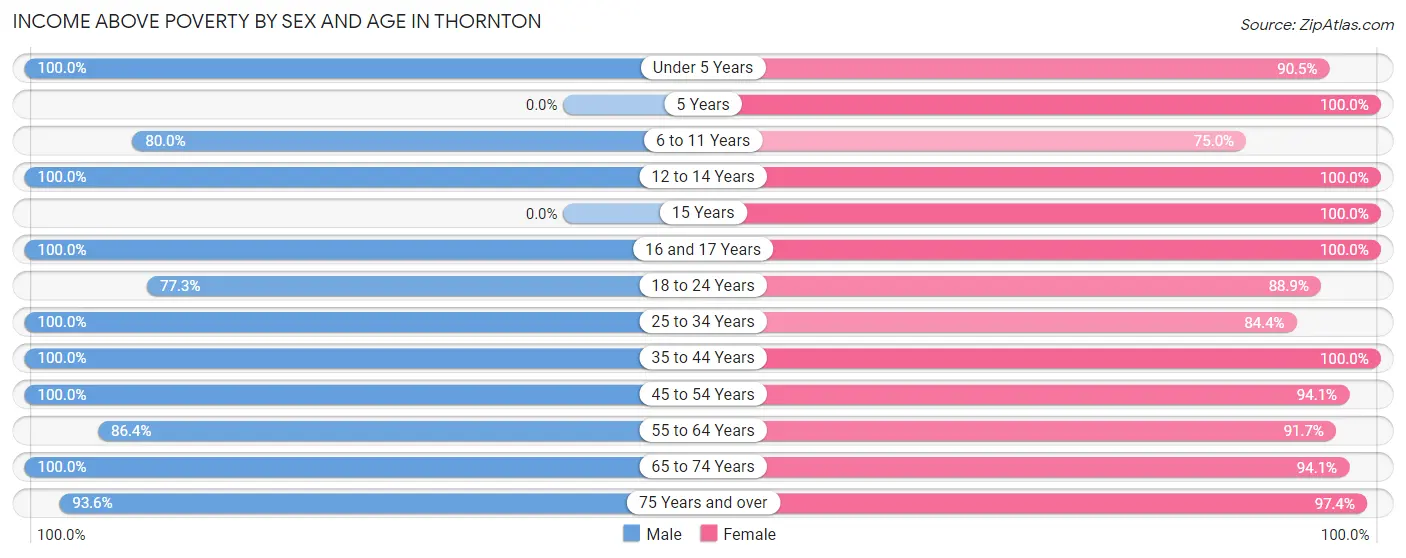
| Age Bracket | Male | Female |
| Under 5 Years | 5 (100.0%) | 19 (90.5%) |
| 5 Years | 0 (0.0%) | 3 (100.0%) |
| 6 to 11 Years | 24 (80.0%) | 15 (75.0%) |
| 12 to 14 Years | 3 (100.0%) | 6 (100.0%) |
| 15 Years | 0 (0.0%) | 3 (100.0%) |
| 16 and 17 Years | 1 (100.0%) | 2 (100.0%) |
| 18 to 24 Years | 34 (77.3%) | 32 (88.9%) |
| 25 to 34 Years | 35 (100.0%) | 27 (84.4%) |
| 35 to 44 Years | 18 (100.0%) | 18 (100.0%) |
| 45 to 54 Years | 21 (100.0%) | 16 (94.1%) |
| 55 to 64 Years | 19 (86.4%) | 22 (91.7%) |
| 65 to 74 Years | 18 (100.0%) | 16 (94.1%) |
| 75 Years and over | 29 (93.5%) | 38 (97.4%) |
| Total | 207 (90.8%) | 217 (91.2%) |
Income Below Poverty Among Married-Couple Families in Thornton
The poverty statistics for married-couple families in Thornton show that 3.1% or 4 of the total 129 families live below the poverty line. Families with no children have the highest poverty rate of 4.1%, comprising of 4 families. On the other hand, families with 1 or 2 children have the lowest poverty rate of 0.0%, which includes 0 families.
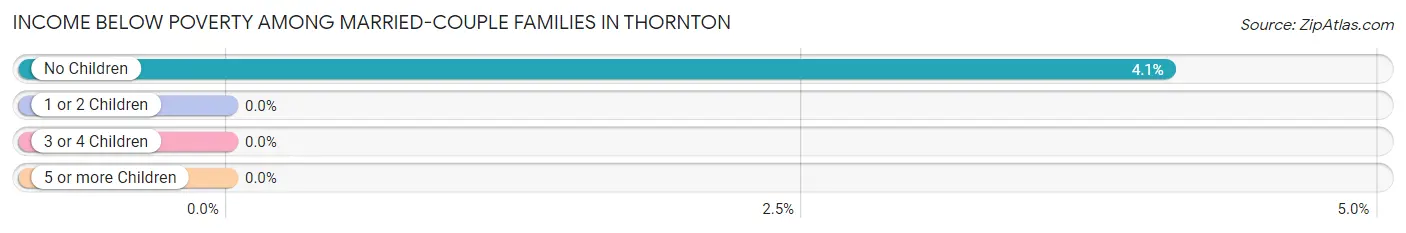
| Children | Above Poverty | Below Poverty |
| No Children | 94 (95.9%) | 4 (4.1%) |
| 1 or 2 Children | 29 (100.0%) | 0 (0.0%) |
| 3 or 4 Children | 2 (100.0%) | 0 (0.0%) |
| 5 or more Children | 0 (0.0%) | 0 (0.0%) |
| Total | 125 (96.9%) | 4 (3.1%) |
Income Below Poverty Among Single-Parent Households in Thornton
| Children | Single Father | Single Mother |
| No Children | 0 (0.0%) | 0 (0.0%) |
| 1 or 2 Children | 0 (0.0%) | 5 (71.4%) |
| 3 or 4 Children | 0 (0.0%) | 0 (0.0%) |
| 5 or more Children | 0 (0.0%) | 0 (0.0%) |
| Total | 0 (0.0%) | 5 (33.3%) |
Income Below Poverty Among Married-Couple vs Single-Parent Households in Thornton
The poverty data for Thornton shows that 4 of the married-couple family households (3.1%) and 5 of the single-parent households (29.4%) are living below the poverty level. Within the married-couple family households, those with no children have the highest poverty rate, with 4 households (4.1%) falling below the poverty line. Among the single-parent households, those with 1 or 2 children have the highest poverty rate, with 5 household (62.5%) living below poverty.
| Children | Married-Couple Families | Single-Parent Households |
| No Children | 4 (4.1%) | 0 (0.0%) |
| 1 or 2 Children | 0 (0.0%) | 5 (62.5%) |
| 3 or 4 Children | 0 (0.0%) | 0 (0.0%) |
| 5 or more Children | 0 (0.0%) | 0 (0.0%) |
| Total | 4 (3.1%) | 5 (29.4%) |
Race in Thornton
The most populous races in Thornton are White / Caucasian (437 | 93.8%), Hispanic or Latino (30 | 6.4%), and Two or more Races (21 | 4.5%).
| Race | # Population | % Population |
| Asian | 2 | 0.4% |
| Black / African American | 0 | 0.0% |
| Hawaiian / Pacific | 0 | 0.0% |
| Hispanic or Latino | 30 | 6.4% |
| Native / Alaskan | 0 | 0.0% |
| White / Caucasian | 437 | 93.8% |
| Two or more Races | 21 | 4.5% |
| Some other Race | 6 | 1.3% |
| Total | 466 | 100.0% |
Ancestry in Thornton
The most populous ancestries reported in Thornton are German (212 | 45.5%), Irish (35 | 7.5%), Czech (31 | 6.7%), Norwegian (26 | 5.6%), and English (22 | 4.7%), together accounting for 70.0% of all Thornton residents.
| Ancestry | # Population | % Population |
| American | 7 | 1.5% |
| Belgian | 1 | 0.2% |
| British | 1 | 0.2% |
| Burmese | 4 | 0.9% |
| Central American | 5 | 1.1% |
| Cherokee | 2 | 0.4% |
| Czech | 31 | 6.7% |
| Danish | 8 | 1.7% |
| Dutch | 9 | 1.9% |
| English | 22 | 4.7% |
| European | 7 | 1.5% |
| French | 5 | 1.1% |
| German | 212 | 45.5% |
| Greek | 2 | 0.4% |
| Guatemalan | 1 | 0.2% |
| Honduran | 4 | 0.9% |
| Indian (Asian) | 5 | 1.1% |
| Irish | 35 | 7.5% |
| Italian | 4 | 0.9% |
| Mexican | 14 | 3.0% |
| Norwegian | 26 | 5.6% |
| Pennsylvania German | 2 | 0.4% |
| Polish | 2 | 0.4% |
| Portuguese | 2 | 0.4% |
| Puerto Rican | 5 | 1.1% |
| Russian | 1 | 0.2% |
| Scandinavian | 1 | 0.2% |
| Swedish | 20 | 4.3% |
| Welsh | 6 | 1.3% | View All 29 Rows |
Immigrants in Thornton
The most numerous immigrant groups reported in Thornton came from Asia (2 | 0.4%), Central America (2 | 0.4%), Eastern Asia (2 | 0.4%), Honduras (2 | 0.4%), and Latin America (2 | 0.4%), together accounting for 2.1% of all Thornton residents.
| Immigration Origin | # Population | % Population |
| Asia | 2 | 0.4% |
| Central America | 2 | 0.4% |
| China | 1 | 0.2% |
| Eastern Asia | 2 | 0.4% |
| Eastern Europe | 1 | 0.2% |
| Europe | 1 | 0.2% |
| Honduras | 2 | 0.4% |
| Korea | 1 | 0.2% |
| Latin America | 2 | 0.4% |
| Russia | 1 | 0.2% | View All 10 Rows |
Sex and Age in Thornton
Sex and Age in Thornton
The most populous age groups in Thornton are 15 to 19 Years (27 | 11.8%) for men and 20 to 24 Years (34 | 14.3%) for women.
| Age Bracket | Male | Female |
| Under 5 Years | 5 (2.2%) | 21 (8.8%) |
| 5 to 9 Years | 25 (11.0%) | 16 (6.7%) |
| 10 to 14 Years | 8 (3.5%) | 13 (5.5%) |
| 15 to 19 Years | 27 (11.8%) | 7 (2.9%) |
| 20 to 24 Years | 18 (7.9%) | 34 (14.3%) |
| 25 to 29 Years | 24 (10.5%) | 26 (10.9%) |
| 30 to 34 Years | 11 (4.8%) | 6 (2.5%) |
| 35 to 39 Years | 13 (5.7%) | 14 (5.9%) |
| 40 to 44 Years | 5 (2.2%) | 4 (1.7%) |
| 45 to 49 Years | 14 (6.1%) | 10 (4.2%) |
| 50 to 54 Years | 7 (3.1%) | 7 (2.9%) |
| 55 to 59 Years | 11 (4.8%) | 9 (3.8%) |
| 60 to 64 Years | 11 (4.8%) | 15 (6.3%) |
| 65 to 69 Years | 3 (1.3%) | 9 (3.8%) |
| 70 to 74 Years | 15 (6.6%) | 8 (3.4%) |
| 75 to 79 Years | 27 (11.8%) | 32 (13.5%) |
| 80 to 84 Years | 2 (0.9%) | 1 (0.4%) |
| 85 Years and over | 2 (0.9%) | 6 (2.5%) |
| Total | 228 (100.0%) | 238 (100.0%) |
Families and Households in Thornton
Median Family Size in Thornton
The median family size in Thornton is 2.58 persons per family, with single male/father families (2 | 1.4%) accounting for the largest median family size of 3.5 persons per family. On the other hand, married-couple families (129 | 88.4%) represent the smallest median family size with 2.48 persons per family.
| Family Type | # Families | Family Size |
| Married-Couple | 129 (88.4%) | 2.48 |
| Single Male/Father | 2 (1.4%) | 3.50 |
| Single Female/Mother | 15 (10.3%) | 3.33 |
| Total Families | 146 (100.0%) | 2.58 |
Median Household Size in Thornton
The median household size in Thornton is 2.16 persons per household, with single male/father households (2 | 0.9%) accounting for the largest median household size of 4 persons per household. non-family households (70 | 32.4%) represent the smallest median household size with 1.20 persons per household.
| Household Type | # Households | Household Size |
| Married-Couple | 129 (59.7%) | 2.48 |
| Single Male/Father | 2 (0.9%) | 4.00 |
| Single Female/Mother | 15 (6.9%) | 3.60 |
| Non-family | 70 (32.4%) | 1.20 |
| Total Households | 216 (100.0%) | 2.16 |
Household Size by Marriage Status in Thornton
Out of a total of 216 households in Thornton, 146 (67.6%) are family households, while 70 (32.4%) are nonfamily households. The most numerous type of family households are 2-person households, comprising 96, and the most common type of nonfamily households are 1-person households, comprising 54.
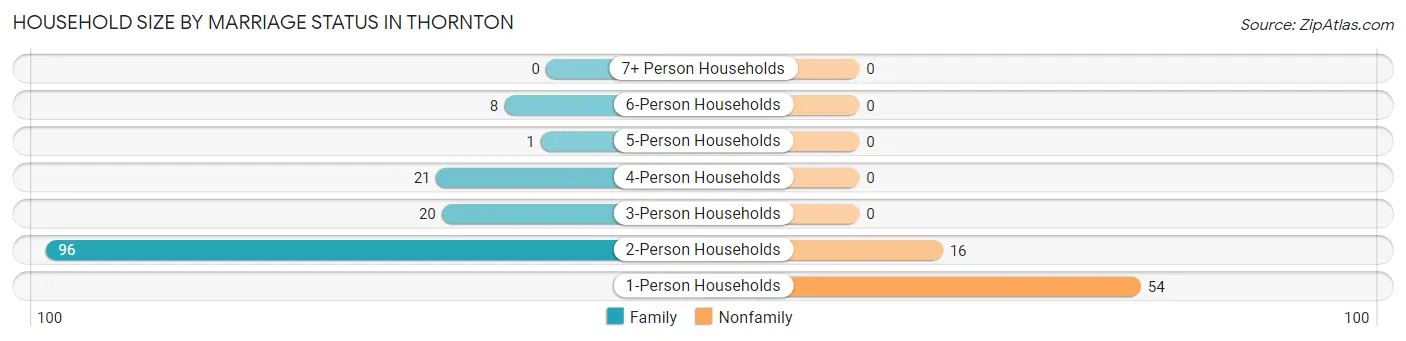
| Household Size | Family Households | Nonfamily Households |
| 1-Person Households | - | 54 (25.0%) |
| 2-Person Households | 96 (44.4%) | 16 (7.4%) |
| 3-Person Households | 20 (9.3%) | 0 (0.0%) |
| 4-Person Households | 21 (9.7%) | 0 (0.0%) |
| 5-Person Households | 1 (0.5%) | 0 (0.0%) |
| 6-Person Households | 8 (3.7%) | 0 (0.0%) |
| 7+ Person Households | 0 (0.0%) | 0 (0.0%) |
| Total | 146 (67.6%) | 70 (32.4%) |
Female Fertility in Thornton
Fertility by Age in Thornton
Average fertility rate in Thornton is 20.0 births per 1,000 women. Women in the age bracket of 20 to 34 years have the highest fertility rate with 30.0 births per 1,000 women. Women in the age bracket of 20 to 34 years acount for 100.0% of all women with births.
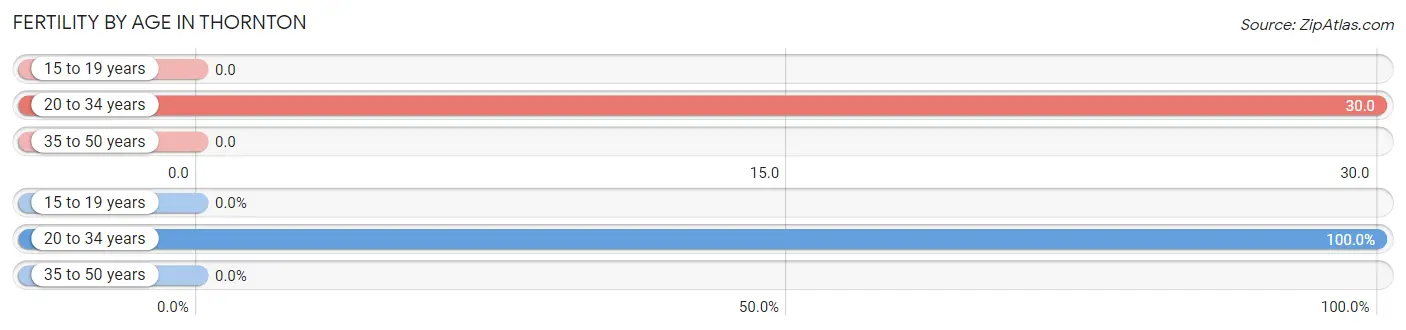
| Age Bracket | Women with Births | Births / 1,000 Women |
| 15 to 19 years | 0 (0.0%) | 0.0 |
| 20 to 34 years | 2 (100.0%) | 30.0 |
| 35 to 50 years | 0 (0.0%) | 0.0 |
| Total | 2 (100.0%) | 20.0 |
Fertility by Age by Marriage Status in Thornton
50.0% of women with births (2) in Thornton are married. The highest percentage of unmarried women with births falls into 20 to 34 years age bracket with 50.0% of them unmarried at the time of birth, while the lowest percentage of unmarried women with births belong to 20 to 34 years age bracket with 50.0% of them unmarried.
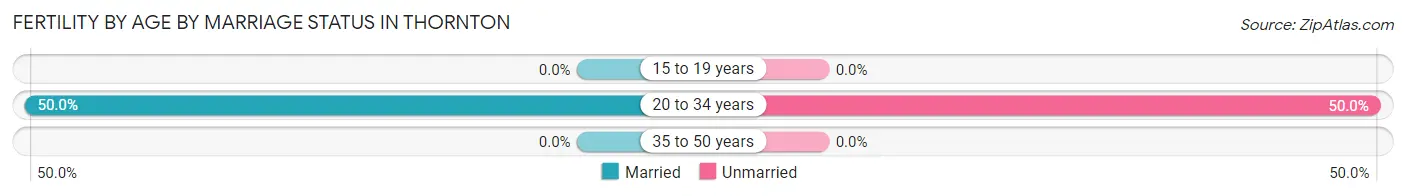
| Age Bracket | Married | Unmarried |
| 15 to 19 years | 0 (0.0%) | 0 (0.0%) |
| 20 to 34 years | 1 (50.0%) | 1 (50.0%) |
| 35 to 50 years | 0 (0.0%) | 0 (0.0%) |
| Total | 1 (50.0%) | 1 (50.0%) |
Fertility by Education in Thornton
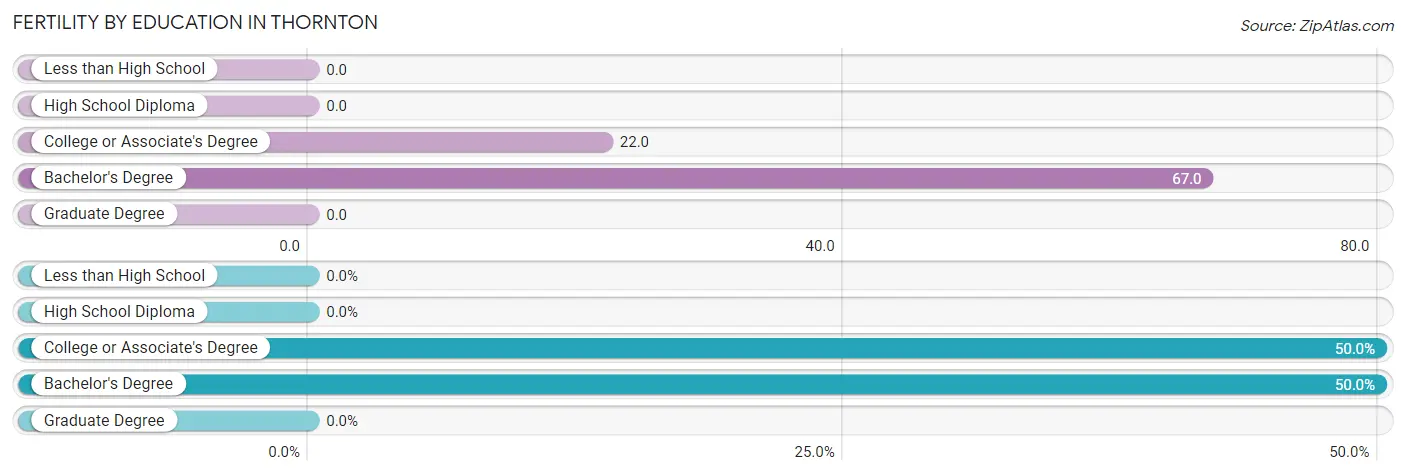
| Educational Attainment | Women with Births | Births / 1,000 Women |
| Less than High School | 0 (0.0%) | 0.0 |
| High School Diploma | 0 (0.0%) | 0.0 |
| College or Associate's Degree | 1 (50.0%) | 22.0 |
| Bachelor's Degree | 1 (50.0%) | 67.0 |
| Graduate Degree | 0 (0.0%) | 0.0 |
| Total | 2 (100.0%) | 20.0 |
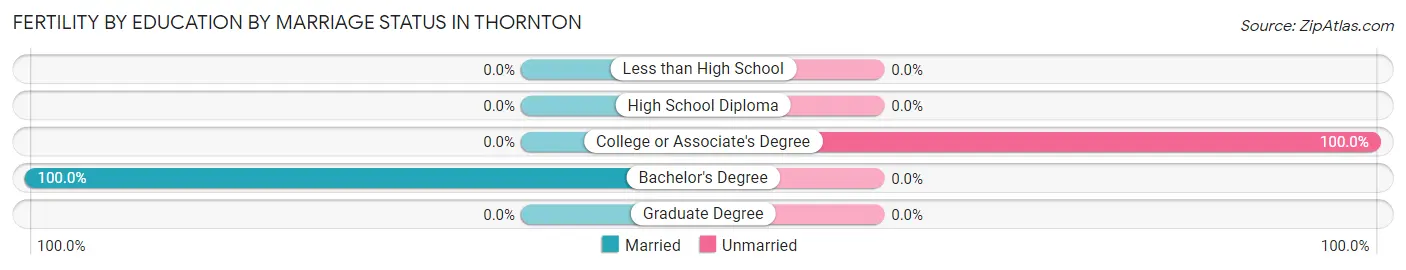
Fertility by Education by Marriage Status in Thornton
50.0% of women with births in Thornton are unmarried. Women with the educational attainment of bachelor's degree are most likely to be married with 100.0% of them married at childbirth, while women with the educational attainment of college or associate's degree are least likely to be married with 100.0% of them unmarried at childbirth.
| Educational Attainment | Married | Unmarried |
| Less than High School | 0 (0.0%) | 0 (0.0%) |
| High School Diploma | 0 (0.0%) | 0 (0.0%) |
| College or Associate's Degree | 0 (0.0%) | 1 (100.0%) |
| Bachelor's Degree | 1 (100.0%) | 0 (0.0%) |
| Graduate Degree | 0 (0.0%) | 0 (0.0%) |
| Total | 1 (50.0%) | 1 (50.0%) |
Employment Characteristics in Thornton
Employment by Class of Employer in Thornton
Among the 241 employed individuals in Thornton, private company employees (187 | 77.6%), local government employees (16 | 6.6%), and not-for-profit organizations (15 | 6.2%) make up the most common classes of employment.
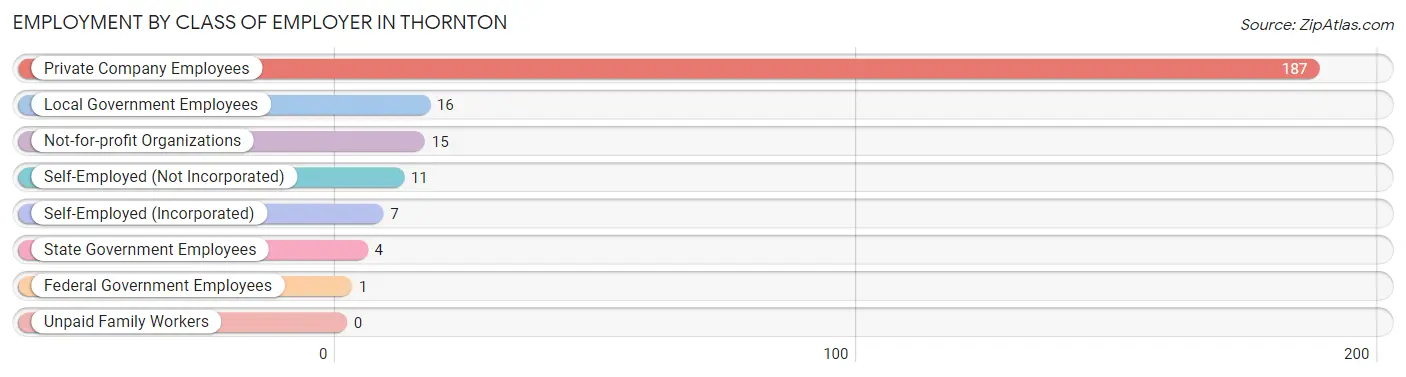
| Employer Class | # Employees | % Employees |
| Private Company Employees | 187 | 77.6% |
| Self-Employed (Incorporated) | 7 | 2.9% |
| Self-Employed (Not Incorporated) | 11 | 4.6% |
| Not-for-profit Organizations | 15 | 6.2% |
| Local Government Employees | 16 | 6.6% |
| State Government Employees | 4 | 1.7% |
| Federal Government Employees | 1 | 0.4% |
| Unpaid Family Workers | 0 | 0.0% |
| Total | 241 | 100.0% |
Employment Status by Age in Thornton
According to the labor force statistics for Thornton, out of the total population over 16 years of age (375), 66.1% or 248 individuals are in the labor force, with 2.0% or 5 of them unemployed. The age group with the highest labor force participation rate is 30 to 34 years, with 100.0% or 17 individuals in the labor force. Within the labor force, the 60 to 64 years age range has the highest percentage of unemployed individuals, with 11.8% or 2 of them being unemployed.
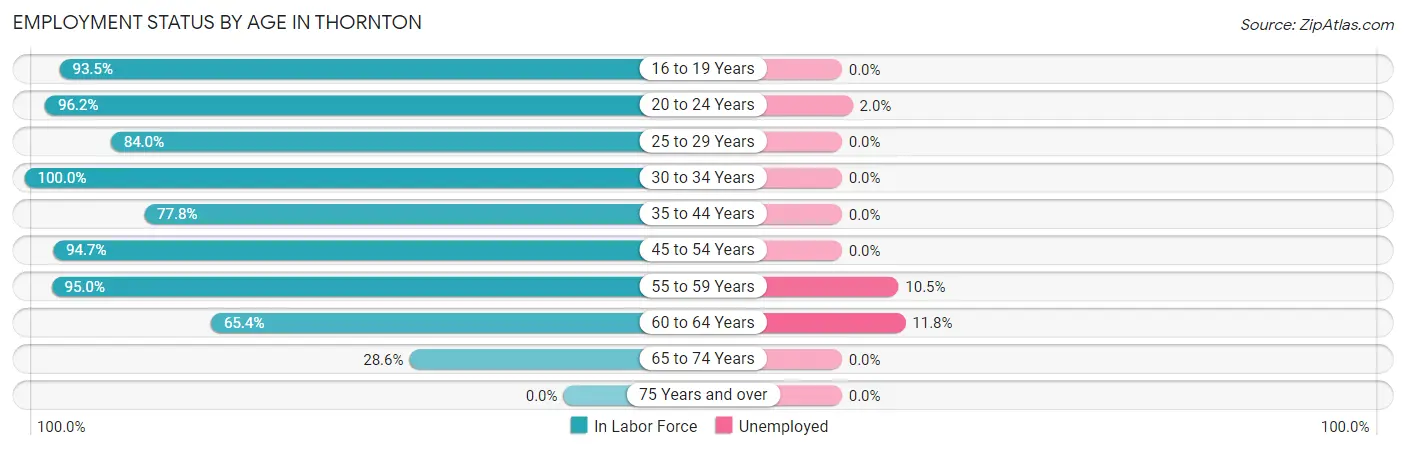
| Age Bracket | In Labor Force | Unemployed |
| 16 to 19 Years | 29 (93.5%) | 0 (0.0%) |
| 20 to 24 Years | 50 (96.2%) | 1 (2.0%) |
| 25 to 29 Years | 42 (84.0%) | 0 (0.0%) |
| 30 to 34 Years | 17 (100.0%) | 0 (0.0%) |
| 35 to 44 Years | 28 (77.8%) | 0 (0.0%) |
| 45 to 54 Years | 36 (94.7%) | 0 (0.0%) |
| 55 to 59 Years | 19 (95.0%) | 2 (10.5%) |
| 60 to 64 Years | 17 (65.4%) | 2 (11.8%) |
| 65 to 74 Years | 10 (28.6%) | 0 (0.0%) |
| 75 Years and over | 0 (0.0%) | 0 (0.0%) |
| Total | 248 (66.1%) | 5 (2.0%) |
Employment Status by Educational Attainment in Thornton
According to labor force statistics for Thornton, 85.0% of individuals (159) out of the total population between 25 and 64 years of age (187) are in the labor force, with 2.5% or 4 of them being unemployed. The group with the highest labor force participation rate are those with the educational attainment of high school diploma, with 87.2% or 41 individuals in the labor force. Within the labor force, individuals with less than high school education have the highest percentage of unemployment, with 20.0% or 1 of them being unemployed.
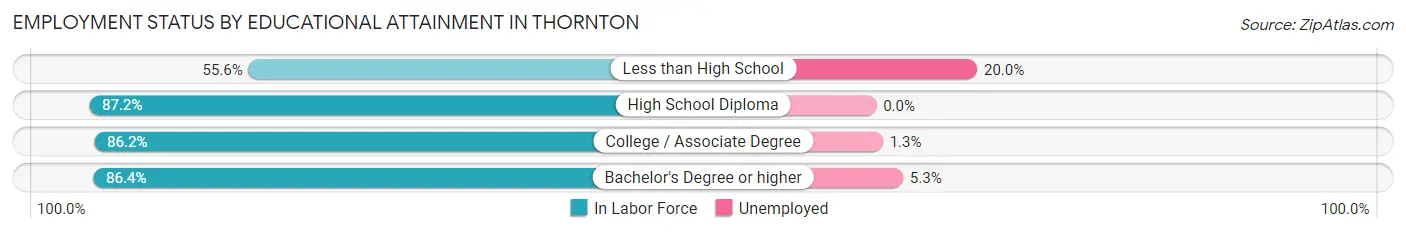
| Educational Attainment | In Labor Force | Unemployed |
| Less than High School | 5 (55.6%) | 2 (20.0%) |
| High School Diploma | 41 (87.2%) | 0 (0.0%) |
| College / Associate Degree | 75 (86.2%) | 1 (1.3%) |
| Bachelor's Degree or higher | 38 (86.4%) | 2 (5.3%) |
| Total | 159 (85.0%) | 5 (2.5%) |
Employment Occupations by Sex in Thornton
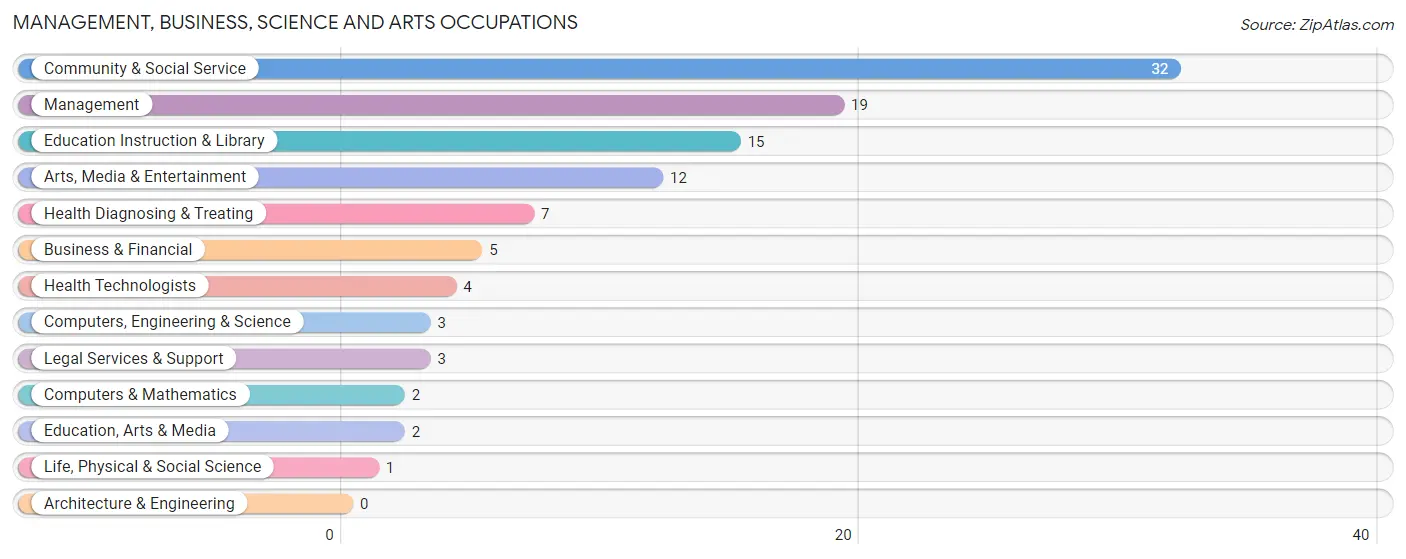
Management, Business, Science and Arts Occupations
The most common Management, Business, Science and Arts occupations in Thornton are Community & Social Service (32 | 13.2%), Management (19 | 7.8%), Education Instruction & Library (15 | 6.2%), Arts, Media & Entertainment (12 | 4.9%), and Health Diagnosing & Treating (7 | 2.9%).
Management, Business, Science and Arts Occupations by Sex
Within the Management, Business, Science and Arts occupations in Thornton, the most male-oriented occupations are Computers & Mathematics (100.0%), Legal Services & Support (100.0%), and Arts, Media & Entertainment (100.0%), while the most female-oriented occupations are Life, Physical & Social Science (100.0%), Health Diagnosing & Treating (85.7%), and Health Technologists (75.0%).
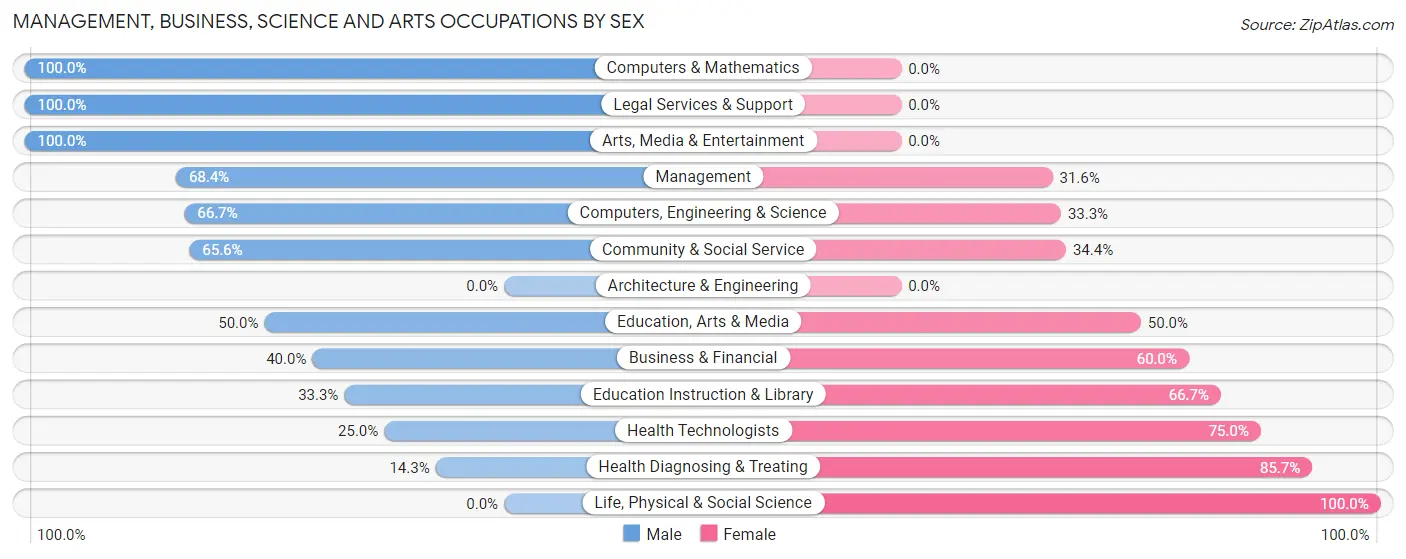
| Occupation | Male | Female |
| Management | 13 (68.4%) | 6 (31.6%) |
| Business & Financial | 2 (40.0%) | 3 (60.0%) |
| Computers, Engineering & Science | 2 (66.7%) | 1 (33.3%) |
| Computers & Mathematics | 2 (100.0%) | 0 (0.0%) |
| Architecture & Engineering | 0 (0.0%) | 0 (0.0%) |
| Life, Physical & Social Science | 0 (0.0%) | 1 (100.0%) |
| Community & Social Service | 21 (65.6%) | 11 (34.4%) |
| Education, Arts & Media | 1 (50.0%) | 1 (50.0%) |
| Legal Services & Support | 3 (100.0%) | 0 (0.0%) |
| Education Instruction & Library | 5 (33.3%) | 10 (66.7%) |
| Arts, Media & Entertainment | 12 (100.0%) | 0 (0.0%) |
| Health Diagnosing & Treating | 1 (14.3%) | 6 (85.7%) |
| Health Technologists | 1 (25.0%) | 3 (75.0%) |
| Total (Category) | 39 (59.1%) | 27 (40.9%) |
| Total (Overall) | 143 (58.9%) | 100 (41.1%) |
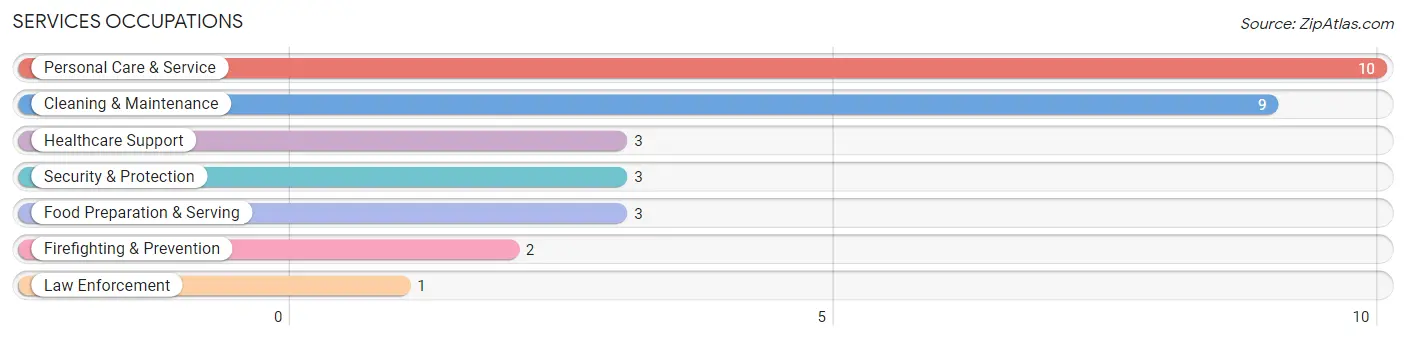
Services Occupations
The most common Services occupations in Thornton are Personal Care & Service (10 | 4.1%), Cleaning & Maintenance (9 | 3.7%), Healthcare Support (3 | 1.2%), Security & Protection (3 | 1.2%), and Food Preparation & Serving (3 | 1.2%).
Services Occupations by Sex
Within the Services occupations in Thornton, the most male-oriented occupations are Security & Protection (100.0%), Firefighting & Prevention (100.0%), and Law Enforcement (100.0%), while the most female-oriented occupations are Food Preparation & Serving (100.0%), Personal Care & Service (100.0%), and Healthcare Support (66.7%).
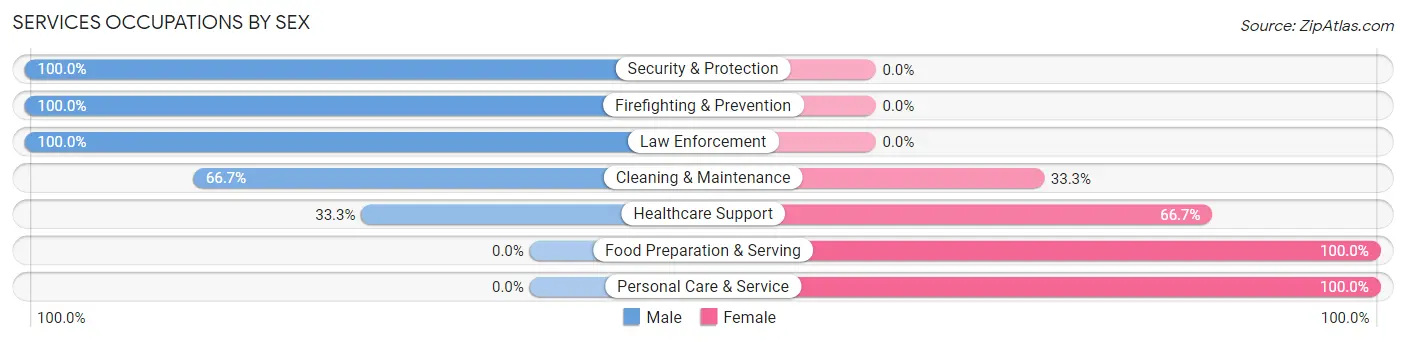
| Occupation | Male | Female |
| Healthcare Support | 1 (33.3%) | 2 (66.7%) |
| Security & Protection | 3 (100.0%) | 0 (0.0%) |
| Firefighting & Prevention | 2 (100.0%) | 0 (0.0%) |
| Law Enforcement | 1 (100.0%) | 0 (0.0%) |
| Food Preparation & Serving | 0 (0.0%) | 3 (100.0%) |
| Cleaning & Maintenance | 6 (66.7%) | 3 (33.3%) |
| Personal Care & Service | 0 (0.0%) | 10 (100.0%) |
| Total (Category) | 10 (35.7%) | 18 (64.3%) |
| Total (Overall) | 143 (58.9%) | 100 (41.1%) |
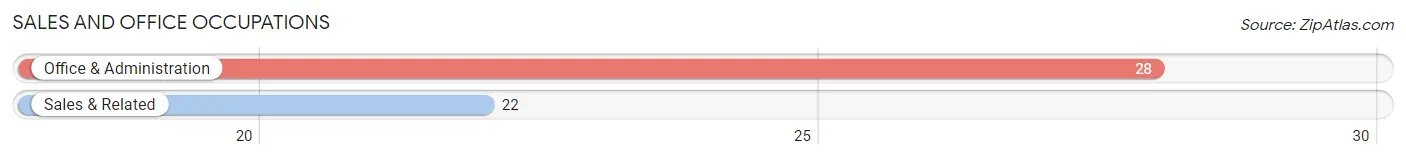
Sales and Office Occupations
The most common Sales and Office occupations in Thornton are Office & Administration (28 | 11.5%), and Sales & Related (22 | 9.0%).
Sales and Office Occupations by Sex
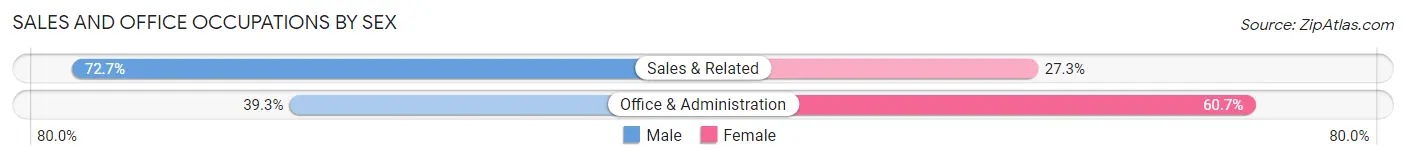
| Occupation | Male | Female |
| Sales & Related | 16 (72.7%) | 6 (27.3%) |
| Office & Administration | 11 (39.3%) | 17 (60.7%) |
| Total (Category) | 27 (54.0%) | 23 (46.0%) |
| Total (Overall) | 143 (58.9%) | 100 (41.1%) |
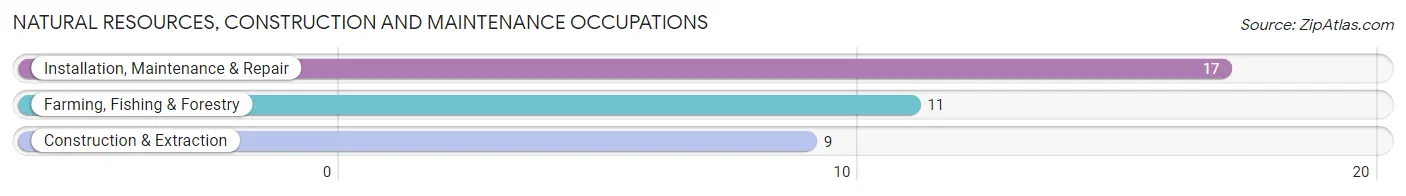
Natural Resources, Construction and Maintenance Occupations
The most common Natural Resources, Construction and Maintenance occupations in Thornton are Installation, Maintenance & Repair (17 | 7.0%), Farming, Fishing & Forestry (11 | 4.5%), and Construction & Extraction (9 | 3.7%).
Natural Resources, Construction and Maintenance Occupations by Sex
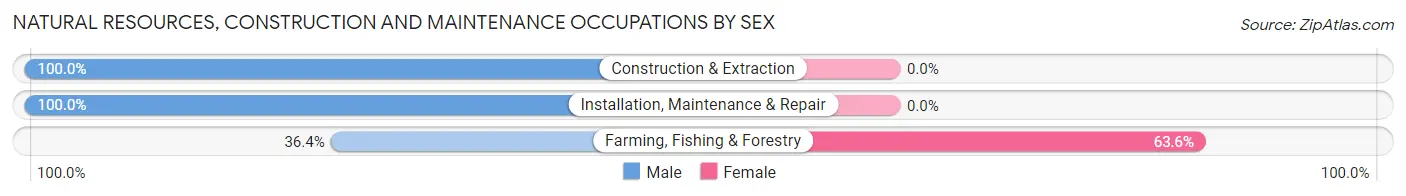
| Occupation | Male | Female |
| Farming, Fishing & Forestry | 4 (36.4%) | 7 (63.6%) |
| Construction & Extraction | 9 (100.0%) | 0 (0.0%) |
| Installation, Maintenance & Repair | 17 (100.0%) | 0 (0.0%) |
| Total (Category) | 30 (81.1%) | 7 (18.9%) |
| Total (Overall) | 143 (58.9%) | 100 (41.1%) |
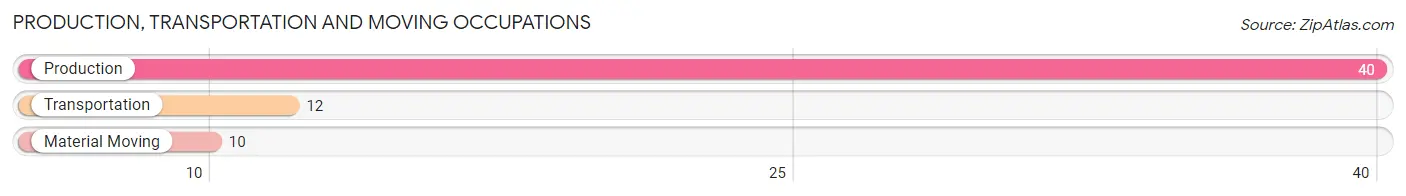
Production, Transportation and Moving Occupations
The most common Production, Transportation and Moving occupations in Thornton are Production (40 | 16.5%), Transportation (12 | 4.9%), and Material Moving (10 | 4.1%).
Production, Transportation and Moving Occupations by Sex
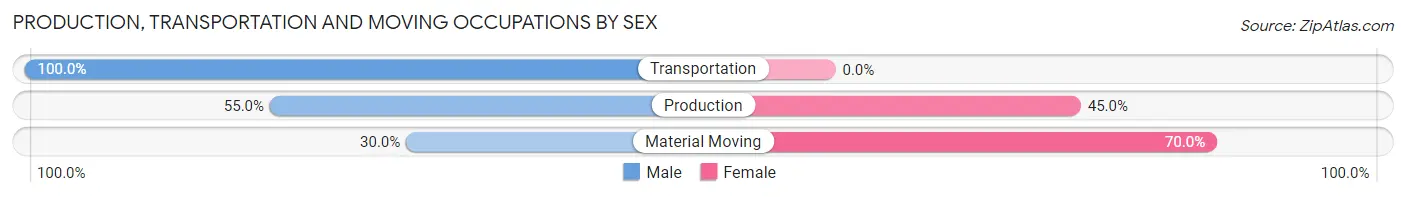
| Occupation | Male | Female |
| Production | 22 (55.0%) | 18 (45.0%) |
| Transportation | 12 (100.0%) | 0 (0.0%) |
| Material Moving | 3 (30.0%) | 7 (70.0%) |
| Total (Category) | 37 (59.7%) | 25 (40.3%) |
| Total (Overall) | 143 (58.9%) | 100 (41.1%) |
Employment Industries by Sex in Thornton
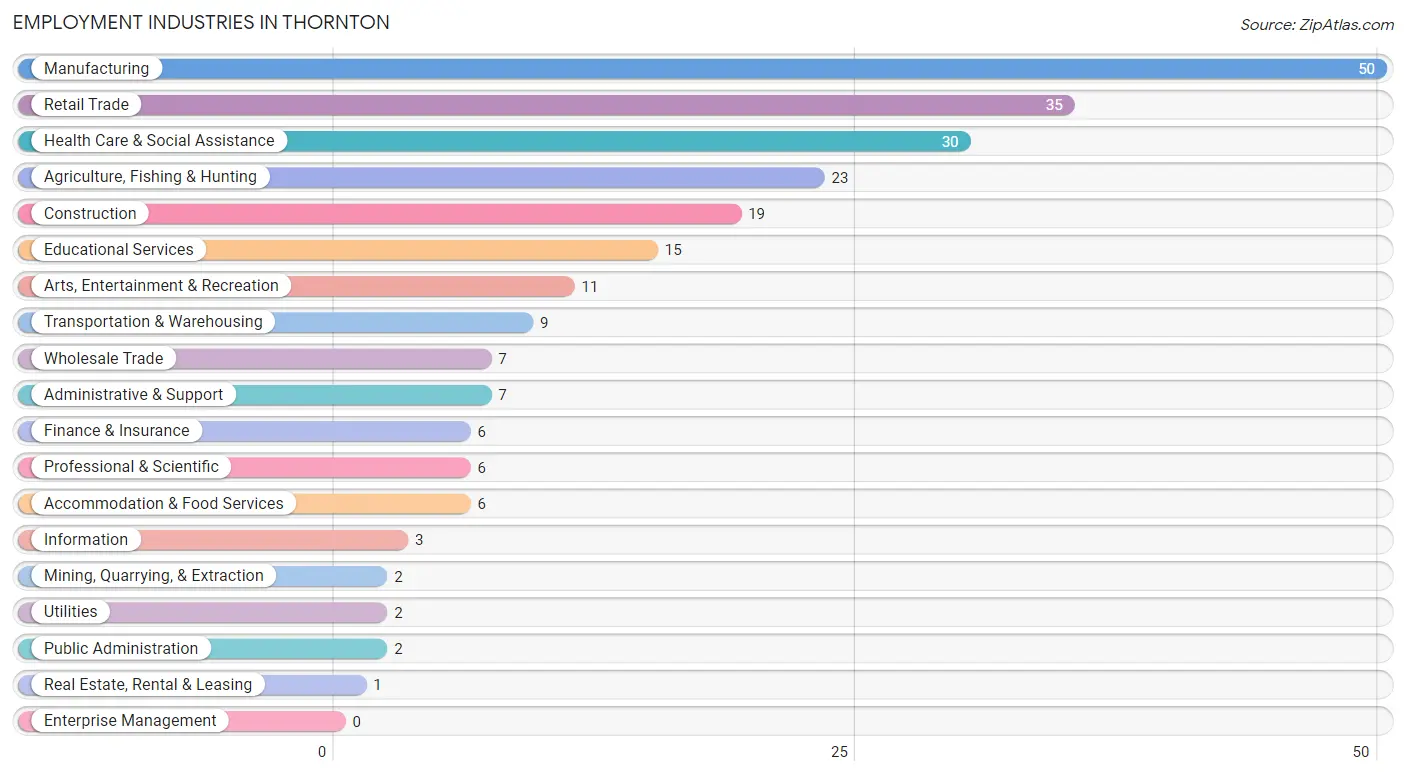
Employment Industries in Thornton
The major employment industries in Thornton include Manufacturing (50 | 20.6%), Retail Trade (35 | 14.4%), Health Care & Social Assistance (30 | 12.3%), Agriculture, Fishing & Hunting (23 | 9.5%), and Construction (19 | 7.8%).
Employment Industries by Sex in Thornton
The Thornton industries that see more men than women are Construction (100.0%), Wholesale Trade (100.0%), and Transportation & Warehousing (100.0%), whereas the industries that tend to have a higher number of women are Mining, Quarrying, & Extraction (100.0%), Information (100.0%), and Accommodation & Food Services (100.0%).
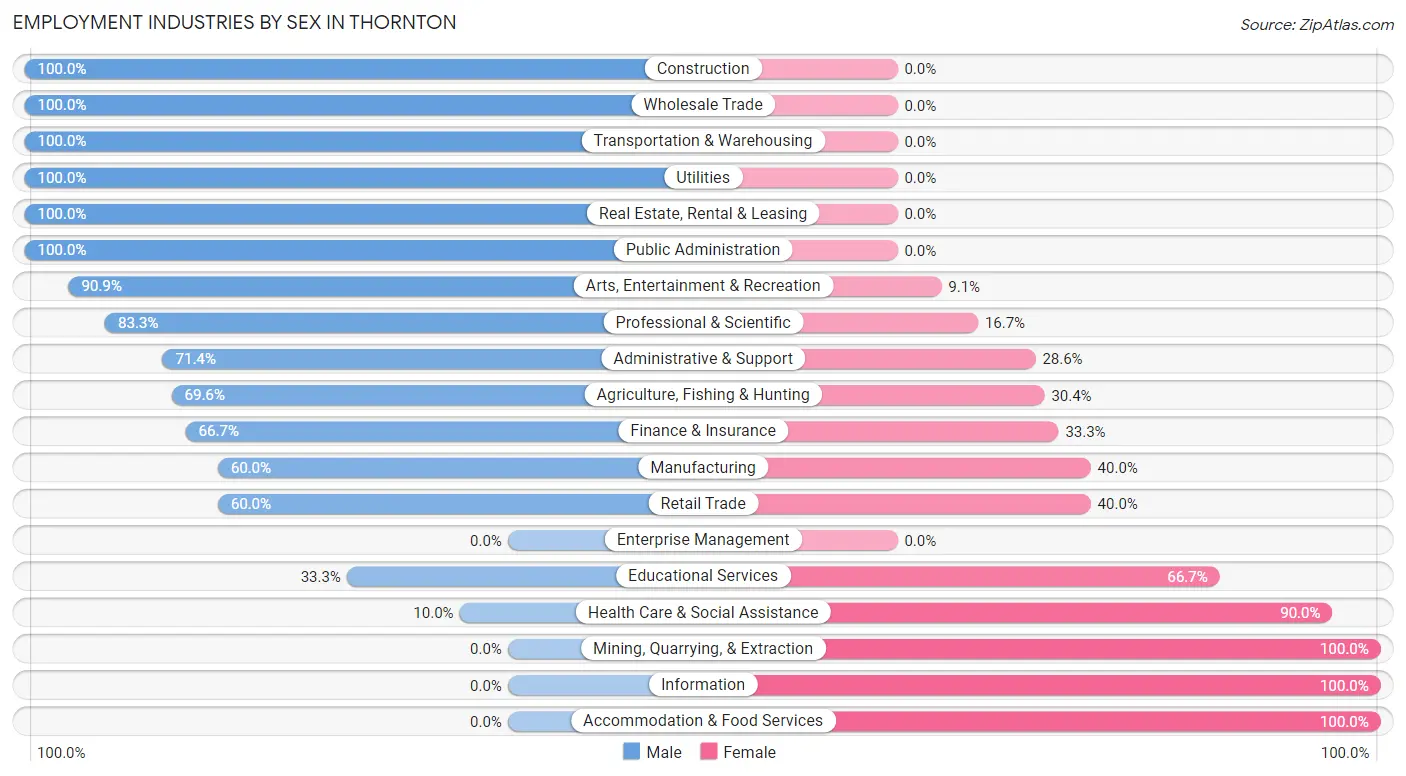
| Industry | Male | Female |
| Agriculture, Fishing & Hunting | 16 (69.6%) | 7 (30.4%) |
| Mining, Quarrying, & Extraction | 0 (0.0%) | 2 (100.0%) |
| Construction | 19 (100.0%) | 0 (0.0%) |
| Manufacturing | 30 (60.0%) | 20 (40.0%) |
| Wholesale Trade | 7 (100.0%) | 0 (0.0%) |
| Retail Trade | 21 (60.0%) | 14 (40.0%) |
| Transportation & Warehousing | 9 (100.0%) | 0 (0.0%) |
| Utilities | 2 (100.0%) | 0 (0.0%) |
| Information | 0 (0.0%) | 3 (100.0%) |
| Finance & Insurance | 4 (66.7%) | 2 (33.3%) |
| Real Estate, Rental & Leasing | 1 (100.0%) | 0 (0.0%) |
| Professional & Scientific | 5 (83.3%) | 1 (16.7%) |
| Enterprise Management | 0 (0.0%) | 0 (0.0%) |
| Administrative & Support | 5 (71.4%) | 2 (28.6%) |
| Educational Services | 5 (33.3%) | 10 (66.7%) |
| Health Care & Social Assistance | 3 (10.0%) | 27 (90.0%) |
| Arts, Entertainment & Recreation | 10 (90.9%) | 1 (9.1%) |
| Accommodation & Food Services | 0 (0.0%) | 6 (100.0%) |
| Public Administration | 2 (100.0%) | 0 (0.0%) |
| Total | 143 (58.9%) | 100 (41.1%) |
Education in Thornton
School Enrollment in Thornton
The most common levels of schooling among the 100 students in Thornton are elementary school (35 | 35.0%), college / undergraduate (24 | 24.0%), and middle school (13 | 13.0%).
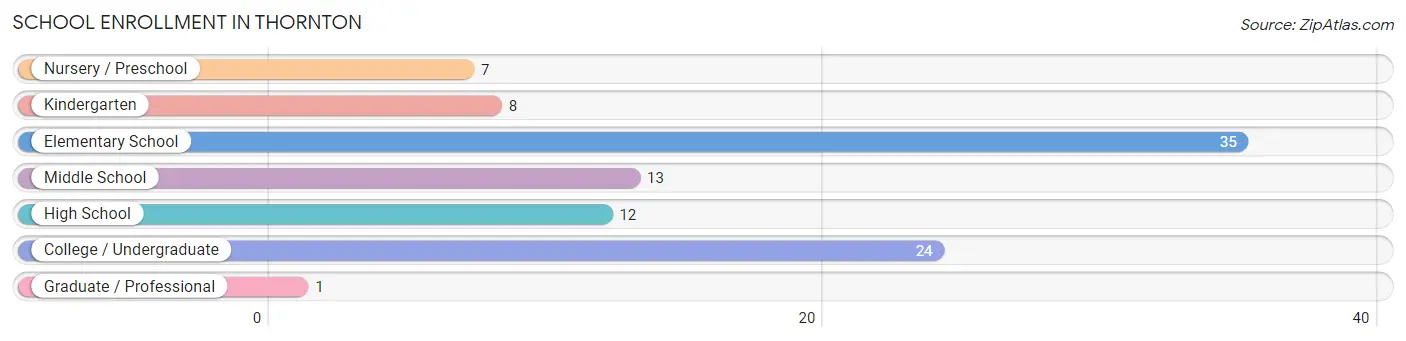
| School Level | # Students | % Students |
| Nursery / Preschool | 7 | 7.0% |
| Kindergarten | 8 | 8.0% |
| Elementary School | 35 | 35.0% |
| Middle School | 13 | 13.0% |
| High School | 12 | 12.0% |
| College / Undergraduate | 24 | 24.0% |
| Graduate / Professional | 1 | 1.0% |
| Total | 100 | 100.0% |
School Enrollment by Age by Funding Source in Thornton
Out of a total of 100 students who are enrolled in schools in Thornton, 5 (5.0%) attend a private institution, while the remaining 95 (95.0%) are enrolled in public schools. The age group of 15 to 17 year olds has the highest likelihood of being enrolled in private schools, with 2 (33.3% in the age bracket) enrolled. Conversely, the age group of 3 to 4 year olds has the lowest likelihood of being enrolled in a private school, with 7 (100.0% in the age bracket) attending a public institution.
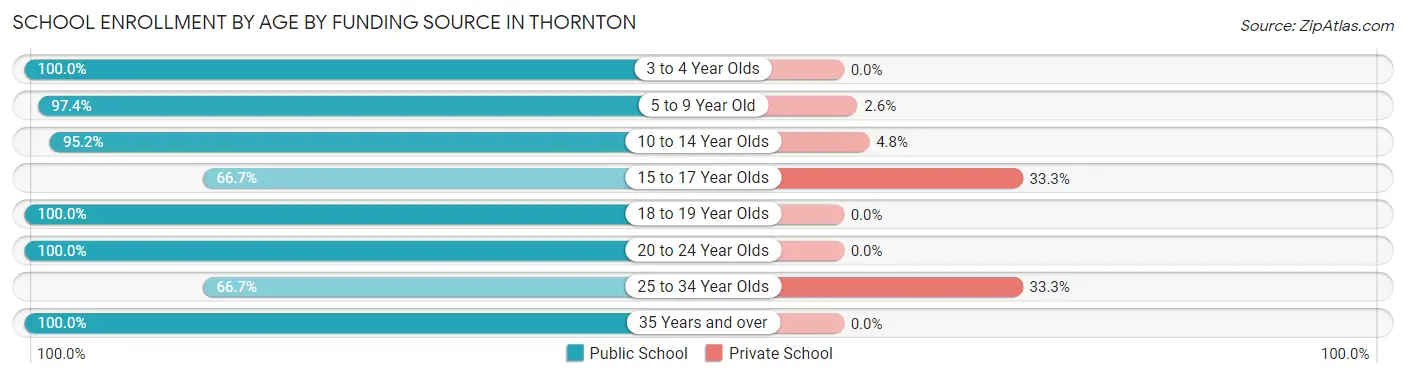
| Age Bracket | Public School | Private School |
| 3 to 4 Year Olds | 7 (100.0%) | 0 (0.0%) |
| 5 to 9 Year Old | 38 (97.4%) | 1 (2.6%) |
| 10 to 14 Year Olds | 20 (95.2%) | 1 (4.8%) |
| 15 to 17 Year Olds | 4 (66.7%) | 2 (33.3%) |
| 18 to 19 Year Olds | 6 (100.0%) | 0 (0.0%) |
| 20 to 24 Year Olds | 11 (100.0%) | 0 (0.0%) |
| 25 to 34 Year Olds | 2 (66.7%) | 1 (33.3%) |
| 35 Years and over | 7 (100.0%) | 0 (0.0%) |
| Total | 95 (95.0%) | 5 (5.0%) |
Educational Attainment by Field of Study in Thornton
Business (17 | 27.4%), education (13 | 21.0%), psychology (7 | 11.3%), computers & mathematics (4 | 6.5%), and social sciences (4 | 6.5%) are the most common fields of study among 62 individuals in Thornton who have obtained a bachelor's degree or higher.
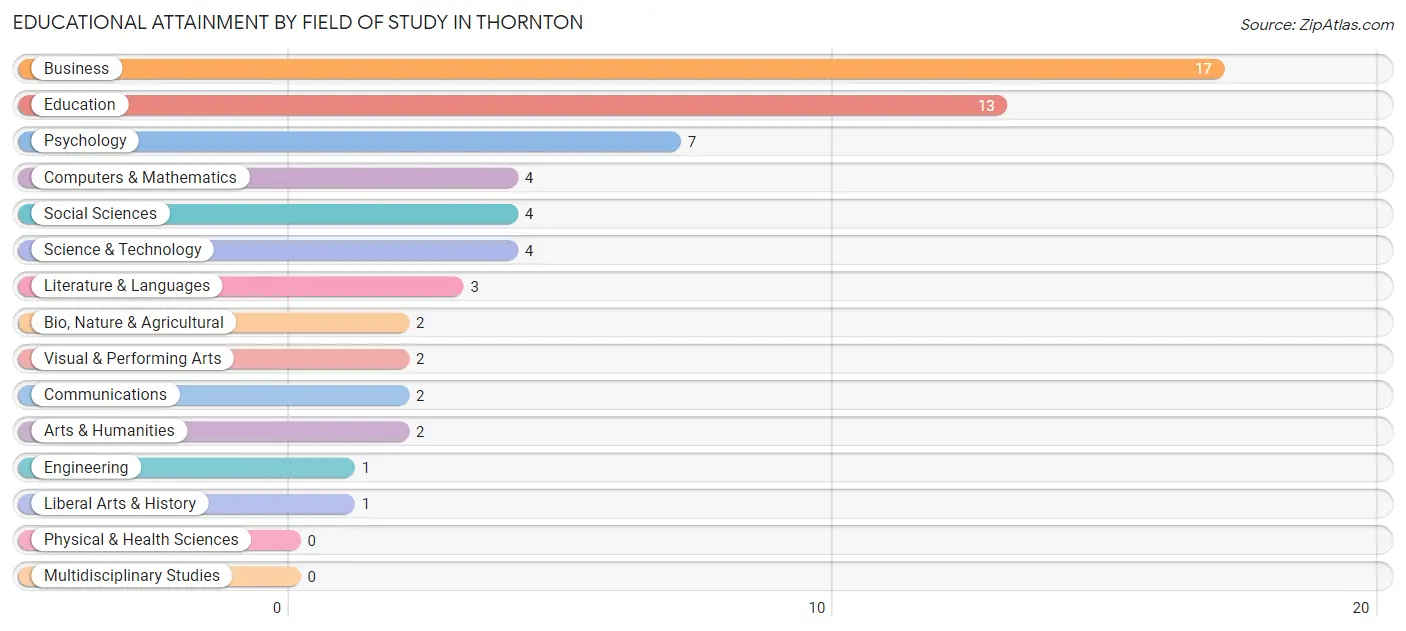
| Field of Study | # Graduates | % Graduates |
| Computers & Mathematics | 4 | 6.5% |
| Bio, Nature & Agricultural | 2 | 3.2% |
| Physical & Health Sciences | 0 | 0.0% |
| Psychology | 7 | 11.3% |
| Social Sciences | 4 | 6.5% |
| Engineering | 1 | 1.6% |
| Multidisciplinary Studies | 0 | 0.0% |
| Science & Technology | 4 | 6.5% |
| Business | 17 | 27.4% |
| Education | 13 | 21.0% |
| Literature & Languages | 3 | 4.8% |
| Liberal Arts & History | 1 | 1.6% |
| Visual & Performing Arts | 2 | 3.2% |
| Communications | 2 | 3.2% |
| Arts & Humanities | 2 | 3.2% |
| Total | 62 | 100.0% |
Transportation & Commute in Thornton
Vehicle Availability by Sex in Thornton
The most prevalent vehicle ownership categories in Thornton are males with 2 vehicles (83, accounting for 58.9%) and females with 2 vehicles (54, making up 83.0%).
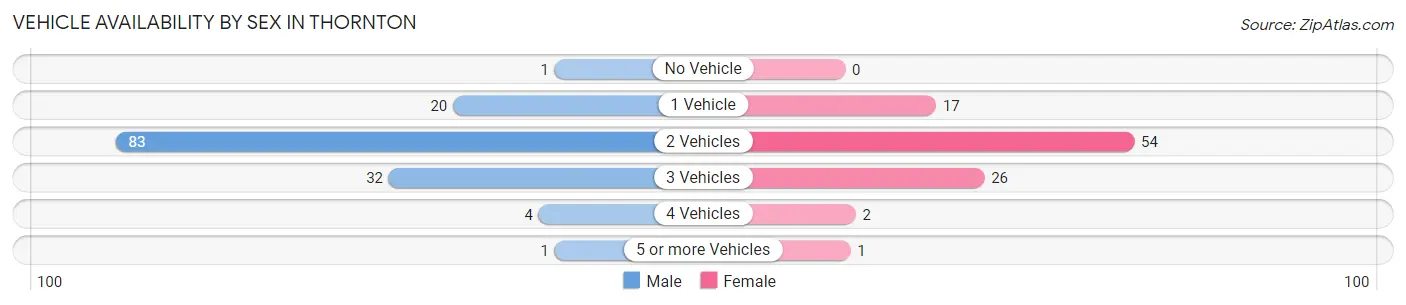
| Vehicles Available | Male | Female |
| No Vehicle | 1 (0.7%) | 0 (0.0%) |
| 1 Vehicle | 20 (14.2%) | 17 (17.0%) |
| 2 Vehicles | 83 (58.9%) | 54 (54.0%) |
| 3 Vehicles | 32 (22.7%) | 26 (26.0%) |
| 4 Vehicles | 4 (2.8%) | 2 (2.0%) |
| 5 or more Vehicles | 1 (0.7%) | 1 (1.0%) |
| Total | 141 (100.0%) | 100 (100.0%) |
Commute Time in Thornton
The most frequently occuring commute durations in Thornton are 20 to 24 minutes (55 commuters, 23.8%), 30 to 34 minutes (41 commuters, 17.7%), and 25 to 29 minutes (35 commuters, 15.1%).
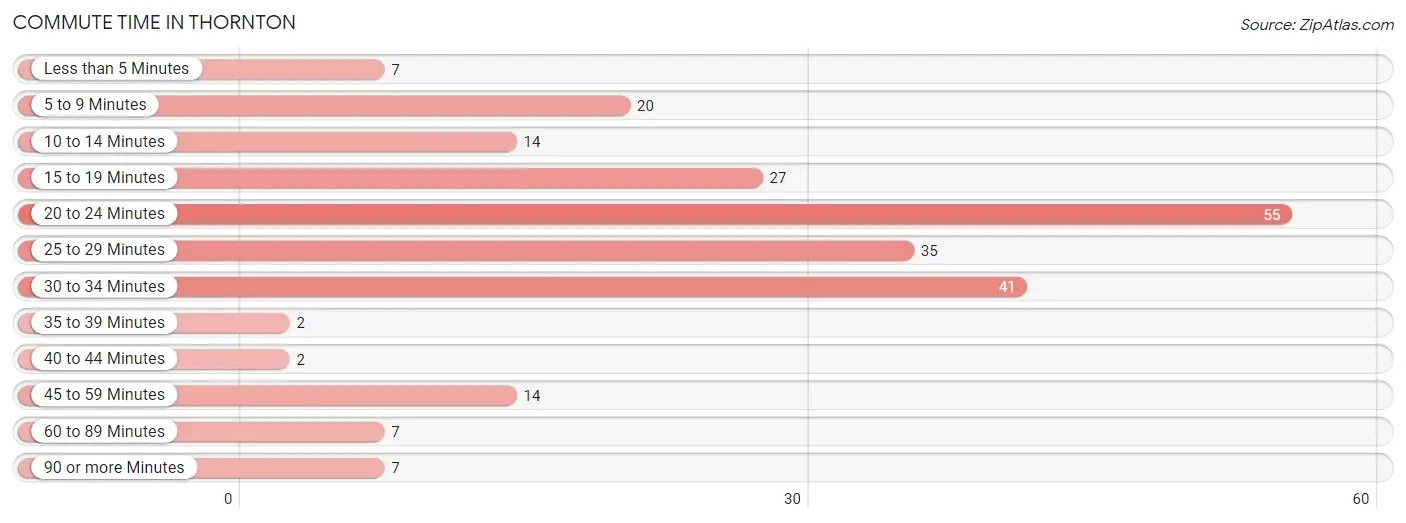
| Commute Time | # Commuters | % Commuters |
| Less than 5 Minutes | 7 | 3.0% |
| 5 to 9 Minutes | 20 | 8.7% |
| 10 to 14 Minutes | 14 | 6.1% |
| 15 to 19 Minutes | 27 | 11.7% |
| 20 to 24 Minutes | 55 | 23.8% |
| 25 to 29 Minutes | 35 | 15.1% |
| 30 to 34 Minutes | 41 | 17.7% |
| 35 to 39 Minutes | 2 | 0.9% |
| 40 to 44 Minutes | 2 | 0.9% |
| 45 to 59 Minutes | 14 | 6.1% |
| 60 to 89 Minutes | 7 | 3.0% |
| 90 or more Minutes | 7 | 3.0% |
Commute Time by Sex in Thornton
The most common commute times in Thornton are 20 to 24 minutes (47 commuters, 35.1%) for males and 30 to 34 minutes (24 commuters, 24.7%) for females.
| Commute Time | Male | Female |
| Less than 5 Minutes | 4 (3.0%) | 3 (3.1%) |
| 5 to 9 Minutes | 10 (7.5%) | 10 (10.3%) |
| 10 to 14 Minutes | 7 (5.2%) | 7 (7.2%) |
| 15 to 19 Minutes | 13 (9.7%) | 14 (14.4%) |
| 20 to 24 Minutes | 47 (35.1%) | 8 (8.3%) |
| 25 to 29 Minutes | 17 (12.7%) | 18 (18.6%) |
| 30 to 34 Minutes | 17 (12.7%) | 24 (24.7%) |
| 35 to 39 Minutes | 0 (0.0%) | 2 (2.1%) |
| 40 to 44 Minutes | 0 (0.0%) | 2 (2.1%) |
| 45 to 59 Minutes | 9 (6.7%) | 5 (5.1%) |
| 60 to 89 Minutes | 6 (4.5%) | 1 (1.0%) |
| 90 or more Minutes | 4 (3.0%) | 3 (3.1%) |
Time of Departure to Work by Sex in Thornton
The most frequent times of departure to work in Thornton are 4:00 PM to 11:59 PM (21, 15.7%) for males and 7:00 AM to 7:29 AM (27, 27.8%) for females.

| Time of Departure | Male | Female |
| 12:00 AM to 4:59 AM | 7 (5.2%) | 2 (2.1%) |
| 5:00 AM to 5:29 AM | 4 (3.0%) | 12 (12.4%) |
| 5:30 AM to 5:59 AM | 10 (7.5%) | 10 (10.3%) |
| 6:00 AM to 6:29 AM | 20 (14.9%) | 4 (4.1%) |
| 6:30 AM to 6:59 AM | 14 (10.4%) | 6 (6.2%) |
| 7:00 AM to 7:29 AM | 14 (10.4%) | 27 (27.8%) |
| 7:30 AM to 7:59 AM | 15 (11.2%) | 8 (8.3%) |
| 8:00 AM to 8:29 AM | 7 (5.2%) | 0 (0.0%) |
| 8:30 AM to 8:59 AM | 9 (6.7%) | 0 (0.0%) |
| 9:00 AM to 9:59 AM | 5 (3.7%) | 1 (1.0%) |
| 10:00 AM to 10:59 AM | 1 (0.7%) | 1 (1.0%) |
| 11:00 AM to 11:59 AM | 0 (0.0%) | 1 (1.0%) |
| 12:00 PM to 3:59 PM | 7 (5.2%) | 16 (16.5%) |
| 4:00 PM to 11:59 PM | 21 (15.7%) | 9 (9.3%) |
| Total | 134 (100.0%) | 97 (100.0%) |
Housing Occupancy in Thornton
Occupancy by Ownership in Thornton
Of the total 216 dwellings in Thornton, owner-occupied units account for 166 (76.8%), while renter-occupied units make up 50 (23.2%).
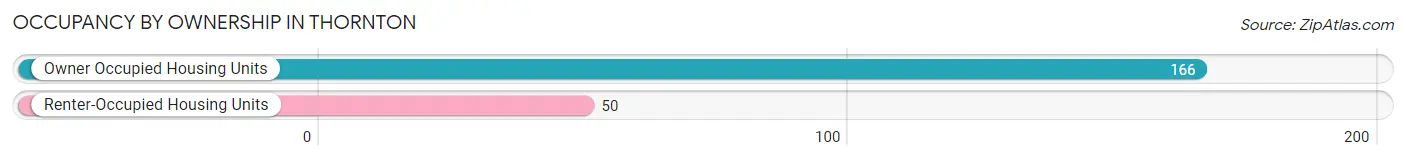
| Occupancy | # Housing Units | % Housing Units |
| Owner Occupied Housing Units | 166 | 76.8% |
| Renter-Occupied Housing Units | 50 | 23.2% |
| Total Occupied Housing Units | 216 | 100.0% |
Occupancy by Household Size in Thornton
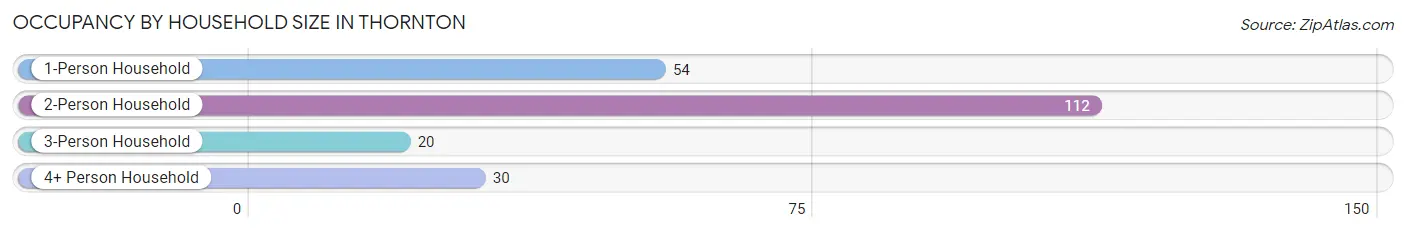
| Household Size | # Housing Units | % Housing Units |
| 1-Person Household | 54 | 25.0% |
| 2-Person Household | 112 | 51.8% |
| 3-Person Household | 20 | 9.3% |
| 4+ Person Household | 30 | 13.9% |
| Total Housing Units | 216 | 100.0% |
Occupancy by Ownership by Household Size in Thornton
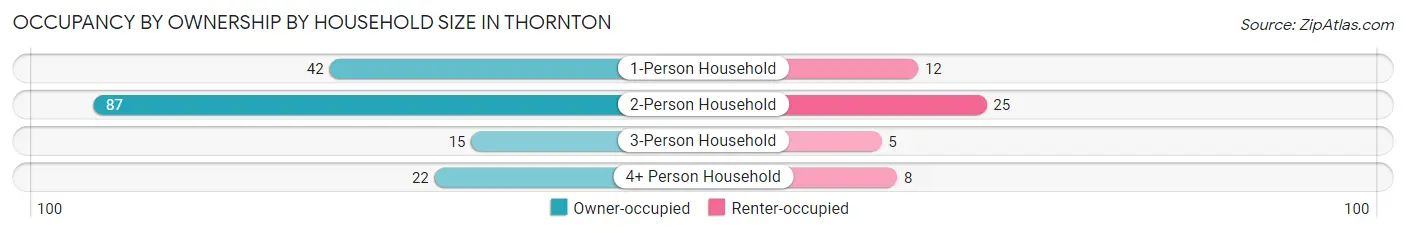
| Household Size | Owner-occupied | Renter-occupied |
| 1-Person Household | 42 (77.8%) | 12 (22.2%) |
| 2-Person Household | 87 (77.7%) | 25 (22.3%) |
| 3-Person Household | 15 (75.0%) | 5 (25.0%) |
| 4+ Person Household | 22 (73.3%) | 8 (26.7%) |
| Total Housing Units | 166 (76.8%) | 50 (23.2%) |
Occupancy by Educational Attainment in Thornton
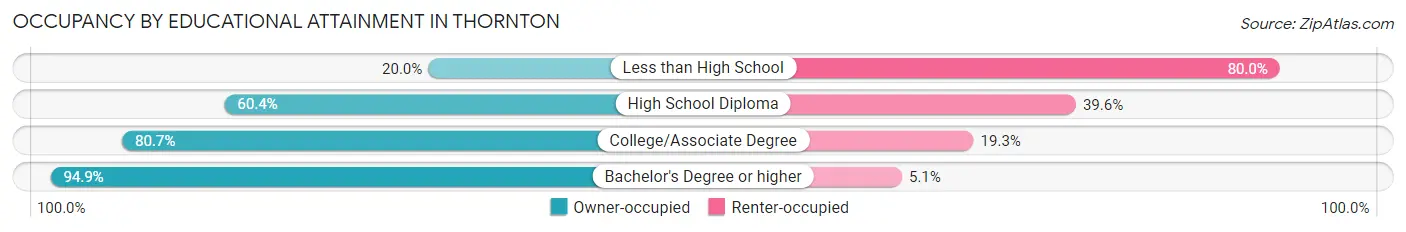
| Household Size | Owner-occupied | Renter-occupied |
| Less than High School | 1 (20.0%) | 4 (80.0%) |
| High School Diploma | 32 (60.4%) | 21 (39.6%) |
| College/Associate Degree | 96 (80.7%) | 23 (19.3%) |
| Bachelor's Degree or higher | 37 (94.9%) | 2 (5.1%) |
Occupancy by Age of Householder in Thornton
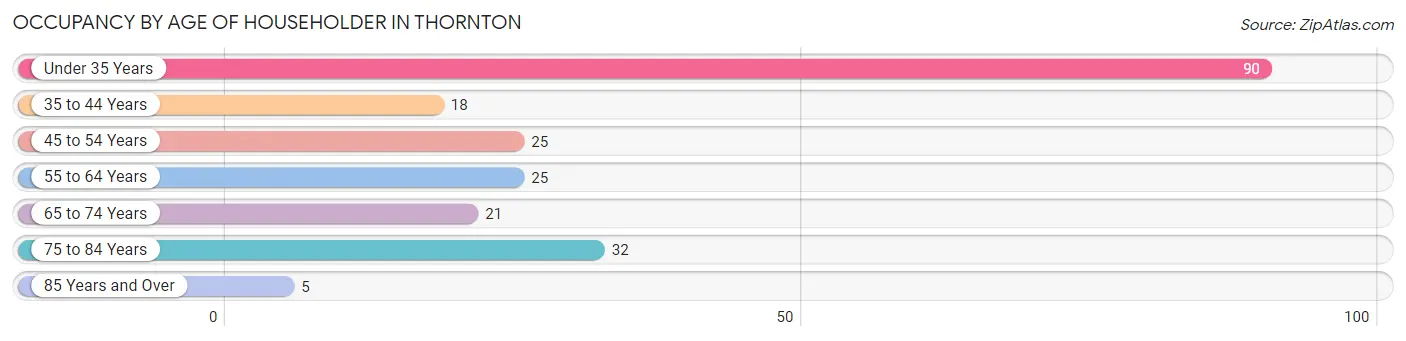
| Age Bracket | # Households | % Households |
| Under 35 Years | 90 | 41.7% |
| 35 to 44 Years | 18 | 8.3% |
| 45 to 54 Years | 25 | 11.6% |
| 55 to 64 Years | 25 | 11.6% |
| 65 to 74 Years | 21 | 9.7% |
| 75 to 84 Years | 32 | 14.8% |
| 85 Years and Over | 5 | 2.3% |
| Total | 216 | 100.0% |
Housing Finances in Thornton
Median Income by Occupancy in Thornton
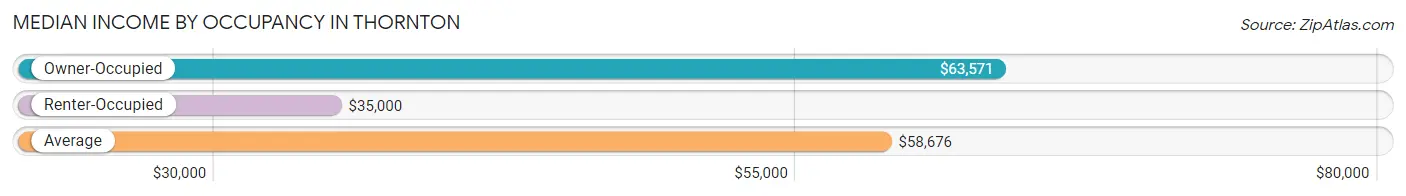
| Occupancy Type | # Households | Median Income |
| Owner-Occupied | 166 (76.8%) | $63,571 |
| Renter-Occupied | 50 (23.2%) | $35,000 |
| Average | 216 (100.0%) | $58,676 |
Occupancy by Householder Income Bracket in Thornton
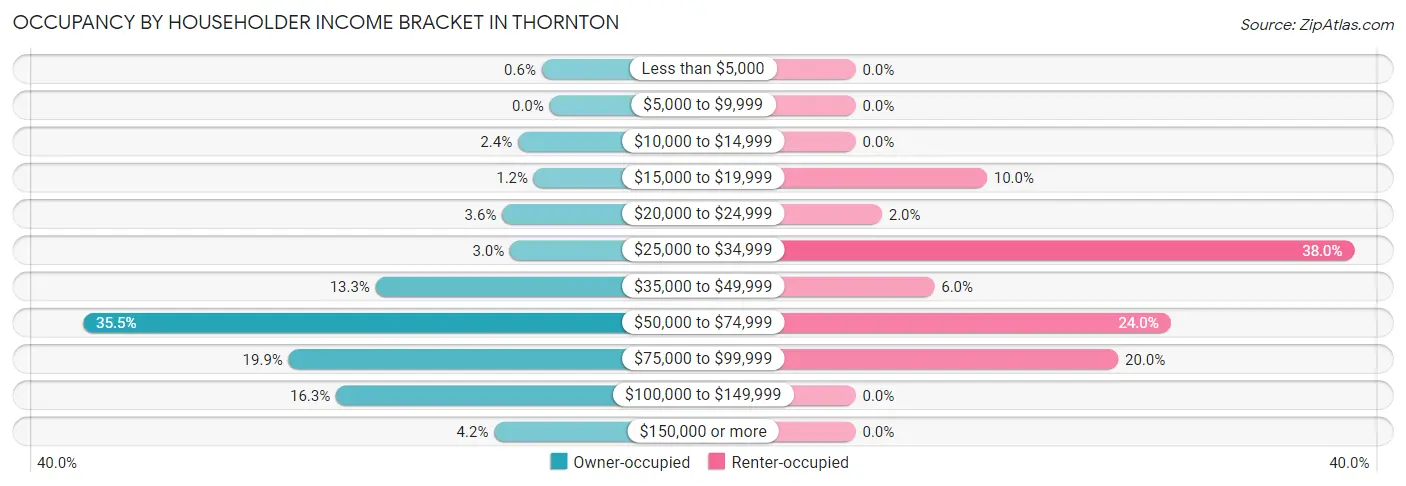
| Income Bracket | Owner-occupied | Renter-occupied |
| Less than $5,000 | 1 (0.6%) | 0 (0.0%) |
| $5,000 to $9,999 | 0 (0.0%) | 0 (0.0%) |
| $10,000 to $14,999 | 4 (2.4%) | 0 (0.0%) |
| $15,000 to $19,999 | 2 (1.2%) | 5 (10.0%) |
| $20,000 to $24,999 | 6 (3.6%) | 1 (2.0%) |
| $25,000 to $34,999 | 5 (3.0%) | 19 (38.0%) |
| $35,000 to $49,999 | 22 (13.3%) | 3 (6.0%) |
| $50,000 to $74,999 | 59 (35.5%) | 12 (24.0%) |
| $75,000 to $99,999 | 33 (19.9%) | 10 (20.0%) |
| $100,000 to $149,999 | 27 (16.3%) | 0 (0.0%) |
| $150,000 or more | 7 (4.2%) | 0 (0.0%) |
| Total | 166 (100.0%) | 50 (100.0%) |
Monthly Housing Cost Tiers in Thornton
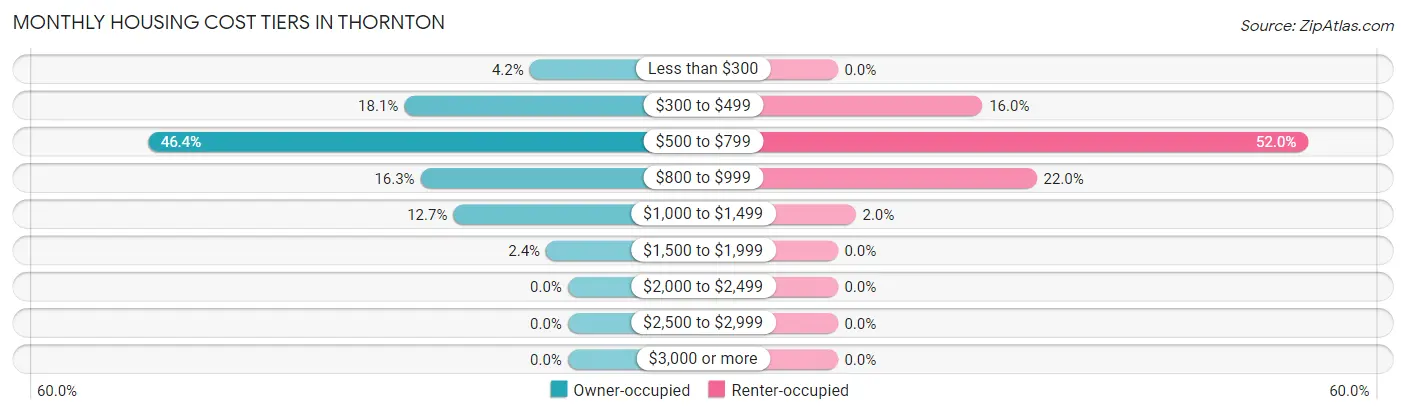
| Monthly Cost | Owner-occupied | Renter-occupied |
| Less than $300 | 7 (4.2%) | 0 (0.0%) |
| $300 to $499 | 30 (18.1%) | 8 (16.0%) |
| $500 to $799 | 77 (46.4%) | 26 (52.0%) |
| $800 to $999 | 27 (16.3%) | 11 (22.0%) |
| $1,000 to $1,499 | 21 (12.7%) | 1 (2.0%) |
| $1,500 to $1,999 | 4 (2.4%) | 0 (0.0%) |
| $2,000 to $2,499 | 0 (0.0%) | 0 (0.0%) |
| $2,500 to $2,999 | 0 (0.0%) | 0 (0.0%) |
| $3,000 or more | 0 (0.0%) | 0 (0.0%) |
| Total | 166 (100.0%) | 50 (100.0%) |
Physical Housing Characteristics in Thornton
Housing Structures in Thornton
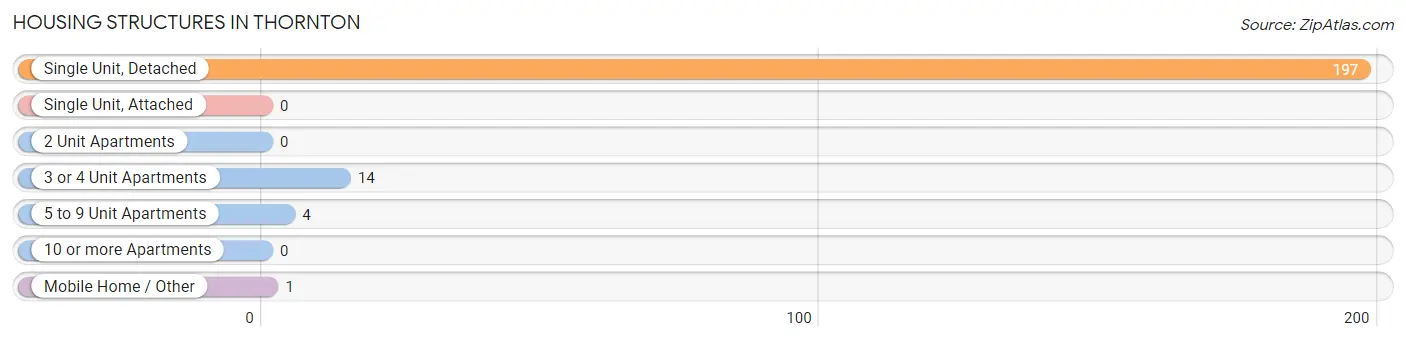
| Structure Type | # Housing Units | % Housing Units |
| Single Unit, Detached | 197 | 91.2% |
| Single Unit, Attached | 0 | 0.0% |
| 2 Unit Apartments | 0 | 0.0% |
| 3 or 4 Unit Apartments | 14 | 6.5% |
| 5 to 9 Unit Apartments | 4 | 1.8% |
| 10 or more Apartments | 0 | 0.0% |
| Mobile Home / Other | 1 | 0.5% |
| Total | 216 | 100.0% |
Housing Structures by Occupancy in Thornton

| Structure Type | Owner-occupied | Renter-occupied |
| Single Unit, Detached | 165 (83.8%) | 32 (16.2%) |
| Single Unit, Attached | 0 (0.0%) | 0 (0.0%) |
| 2 Unit Apartments | 0 (0.0%) | 0 (0.0%) |
| 3 or 4 Unit Apartments | 0 (0.0%) | 14 (100.0%) |
| 5 to 9 Unit Apartments | 0 (0.0%) | 4 (100.0%) |
| 10 or more Apartments | 0 (0.0%) | 0 (0.0%) |
| Mobile Home / Other | 1 (100.0%) | 0 (0.0%) |
| Total | 166 (76.8%) | 50 (23.2%) |
Housing Structures by Number of Rooms in Thornton
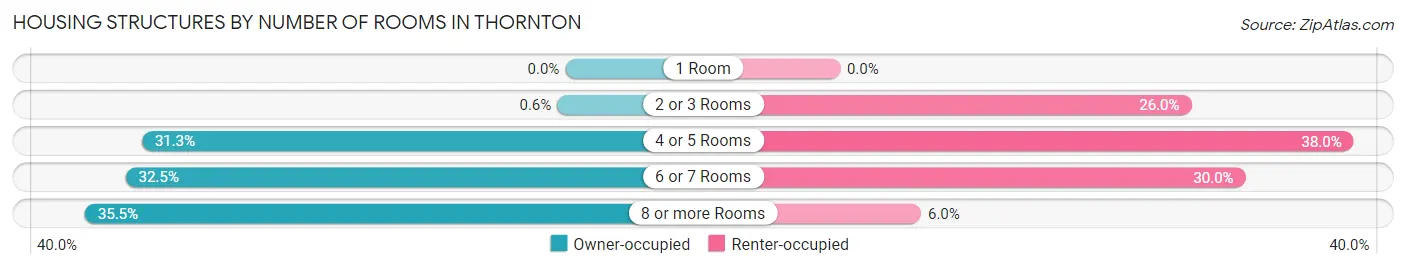
| Number of Rooms | Owner-occupied | Renter-occupied |
| 1 Room | 0 (0.0%) | 0 (0.0%) |
| 2 or 3 Rooms | 1 (0.6%) | 13 (26.0%) |
| 4 or 5 Rooms | 52 (31.3%) | 19 (38.0%) |
| 6 or 7 Rooms | 54 (32.5%) | 15 (30.0%) |
| 8 or more Rooms | 59 (35.5%) | 3 (6.0%) |
| Total | 166 (100.0%) | 50 (100.0%) |
Housing Structure by Heating Type in Thornton
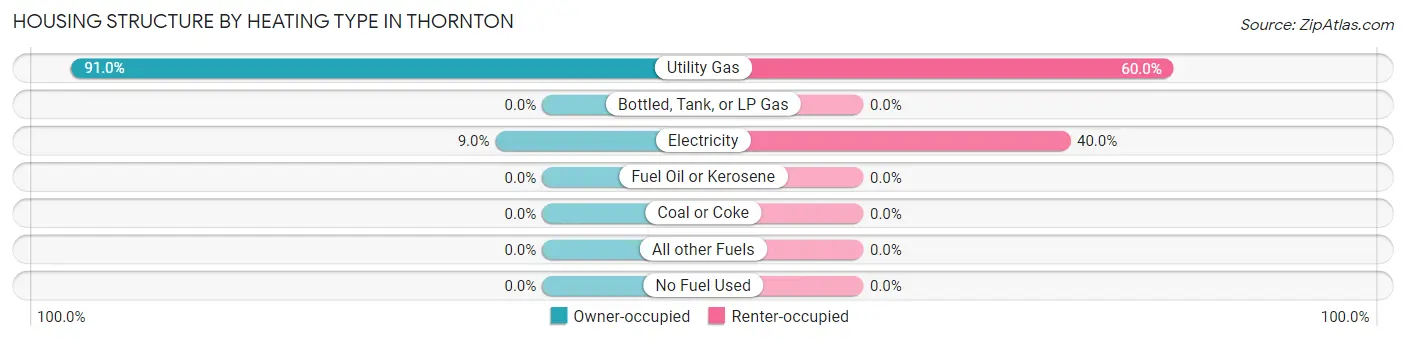
| Heating Type | Owner-occupied | Renter-occupied |
| Utility Gas | 151 (91.0%) | 30 (60.0%) |
| Bottled, Tank, or LP Gas | 0 (0.0%) | 0 (0.0%) |
| Electricity | 15 (9.0%) | 20 (40.0%) |
| Fuel Oil or Kerosene | 0 (0.0%) | 0 (0.0%) |
| Coal or Coke | 0 (0.0%) | 0 (0.0%) |
| All other Fuels | 0 (0.0%) | 0 (0.0%) |
| No Fuel Used | 0 (0.0%) | 0 (0.0%) |
| Total | 166 (100.0%) | 50 (100.0%) |
Household Vehicle Usage in Thornton
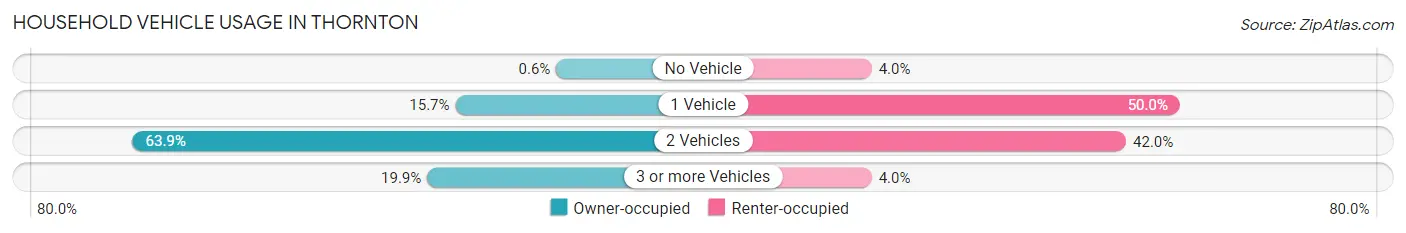
| Vehicles per Household | Owner-occupied | Renter-occupied |
| No Vehicle | 1 (0.6%) | 2 (4.0%) |
| 1 Vehicle | 26 (15.7%) | 25 (50.0%) |
| 2 Vehicles | 106 (63.9%) | 21 (42.0%) |
| 3 or more Vehicles | 33 (19.9%) | 2 (4.0%) |
| Total | 166 (100.0%) | 50 (100.0%) |
Real Estate & Mortgages in Thornton
Real Estate and Mortgage Overview in Thornton
| Characteristic | Without Mortgage | With Mortgage |
| Housing Units | 83 | 83 |
| Median Property Value | - | - |
| Median Household Income | $57,448 | $2 |
| Monthly Housing Costs | $518 | $0 |
| Real Estate Taxes | $1,375 | $1 |
Property Value by Mortgage Status in Thornton
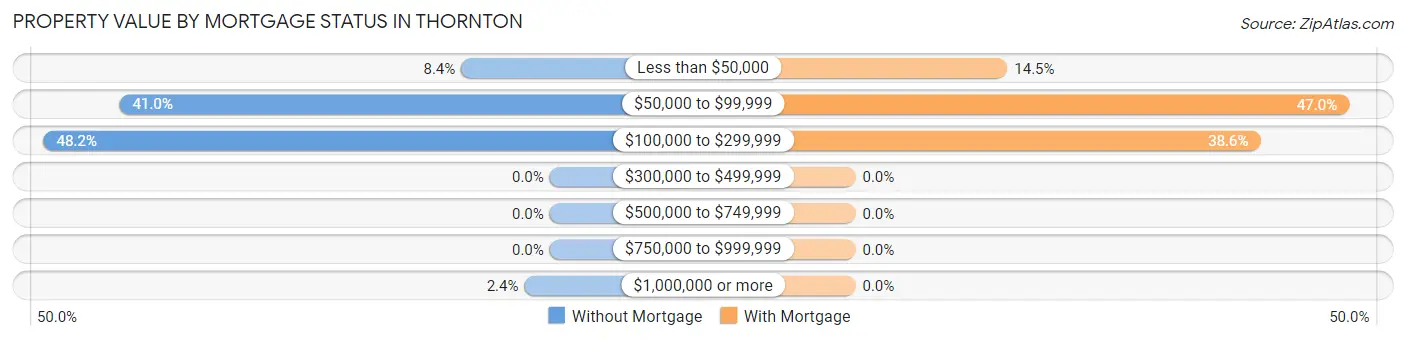
| Property Value | Without Mortgage | With Mortgage |
| Less than $50,000 | 7 (8.4%) | 12 (14.5%) |
| $50,000 to $99,999 | 34 (41.0%) | 39 (47.0%) |
| $100,000 to $299,999 | 40 (48.2%) | 32 (38.6%) |
| $300,000 to $499,999 | 0 (0.0%) | 0 (0.0%) |
| $500,000 to $749,999 | 0 (0.0%) | 0 (0.0%) |
| $750,000 to $999,999 | 0 (0.0%) | 0 (0.0%) |
| $1,000,000 or more | 2 (2.4%) | 0 (0.0%) |
| Total | 83 (100.0%) | 83 (100.0%) |
Household Income by Mortgage Status in Thornton
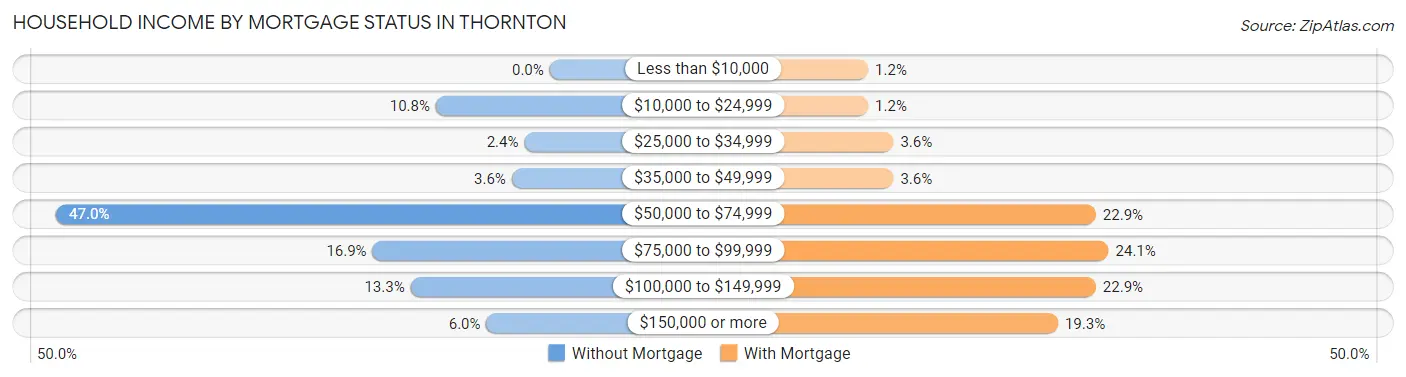
| Household Income | Without Mortgage | With Mortgage |
| Less than $10,000 | 0 (0.0%) | 1 (1.2%) |
| $10,000 to $24,999 | 9 (10.8%) | 1 (1.2%) |
| $25,000 to $34,999 | 2 (2.4%) | 3 (3.6%) |
| $35,000 to $49,999 | 3 (3.6%) | 3 (3.6%) |
| $50,000 to $74,999 | 39 (47.0%) | 19 (22.9%) |
| $75,000 to $99,999 | 14 (16.9%) | 20 (24.1%) |
| $100,000 to $149,999 | 11 (13.3%) | 19 (22.9%) |
| $150,000 or more | 5 (6.0%) | 16 (19.3%) |
| Total | 83 (100.0%) | 83 (100.0%) |
Property Value to Household Income Ratio in Thornton
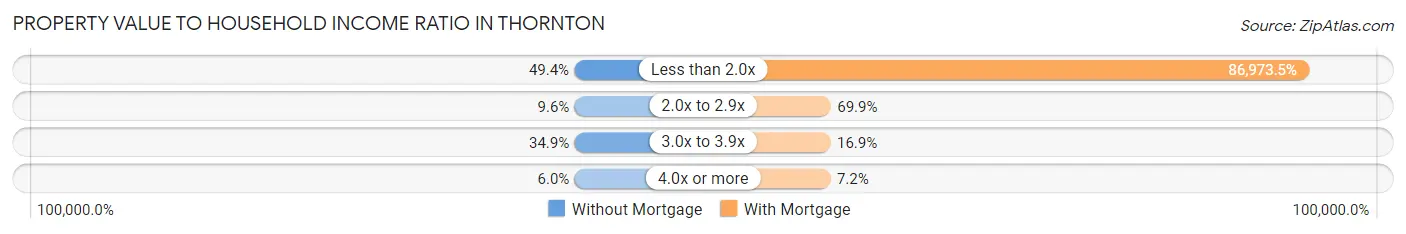
| Value-to-Income Ratio | Without Mortgage | With Mortgage |
| Less than 2.0x | 41 (49.4%) | 72,188 (86,973.5%) |
| 2.0x to 2.9x | 8 (9.6%) | 58 (69.9%) |
| 3.0x to 3.9x | 29 (34.9%) | 14 (16.9%) |
| 4.0x or more | 5 (6.0%) | 6 (7.2%) |
| Total | 83 (100.0%) | 83 (100.0%) |
Real Estate Taxes by Mortgage Status in Thornton
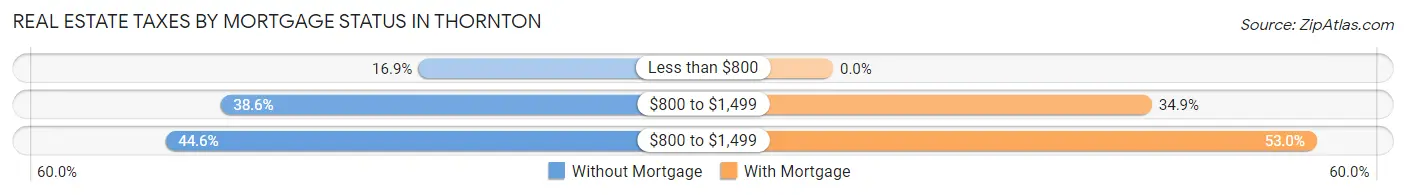
| Property Taxes | Without Mortgage | With Mortgage |
| Less than $800 | 14 (16.9%) | 0 (0.0%) |
| $800 to $1,499 | 32 (38.6%) | 29 (34.9%) |
| $800 to $1,499 | 37 (44.6%) | 44 (53.0%) |
| Total | 83 (100.0%) | 83 (100.0%) |
Health & Disability in Thornton
Health Insurance Coverage by Age in Thornton
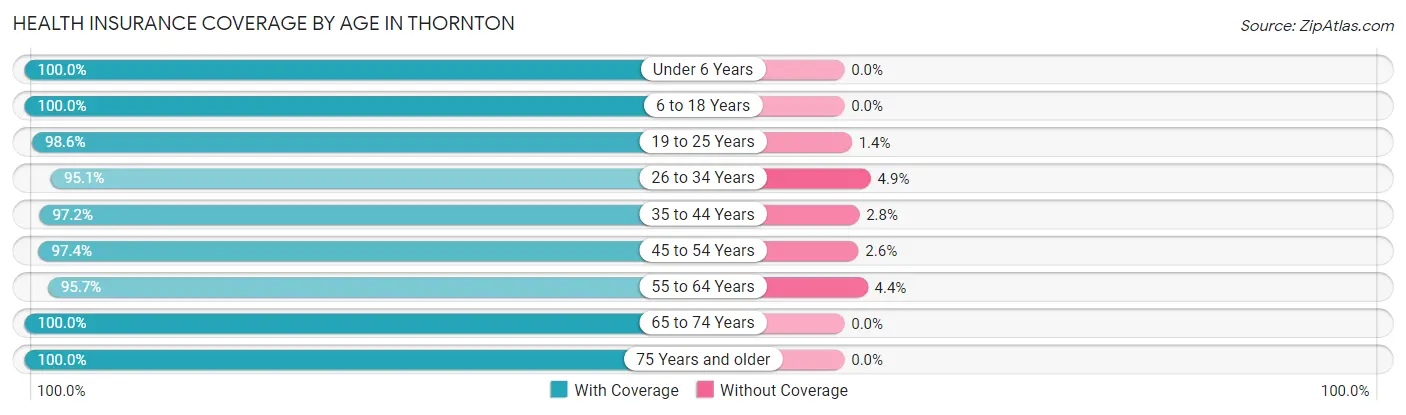
| Age Bracket | With Coverage | Without Coverage |
| Under 6 Years | 29 (100.0%) | 0 (0.0%) |
| 6 to 18 Years | 79 (100.0%) | 0 (0.0%) |
| 19 to 25 Years | 71 (98.6%) | 1 (1.4%) |
| 26 to 34 Years | 58 (95.1%) | 3 (4.9%) |
| 35 to 44 Years | 35 (97.2%) | 1 (2.8%) |
| 45 to 54 Years | 37 (97.4%) | 1 (2.6%) |
| 55 to 64 Years | 44 (95.7%) | 2 (4.3%) |
| 65 to 74 Years | 35 (100.0%) | 0 (0.0%) |
| 75 Years and older | 70 (100.0%) | 0 (0.0%) |
| Total | 458 (98.3%) | 8 (1.7%) |
Health Insurance Coverage by Citizenship Status in Thornton
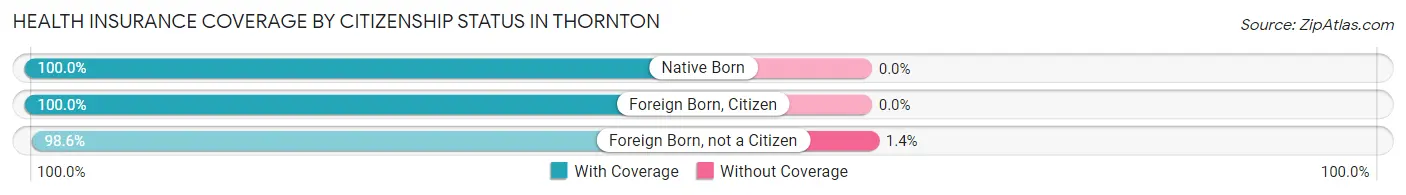
| Citizenship Status | With Coverage | Without Coverage |
| Native Born | 29 (100.0%) | 0 (0.0%) |
| Foreign Born, Citizen | 79 (100.0%) | 0 (0.0%) |
| Foreign Born, not a Citizen | 71 (98.6%) | 1 (1.4%) |
Health Insurance Coverage by Household Income in Thornton
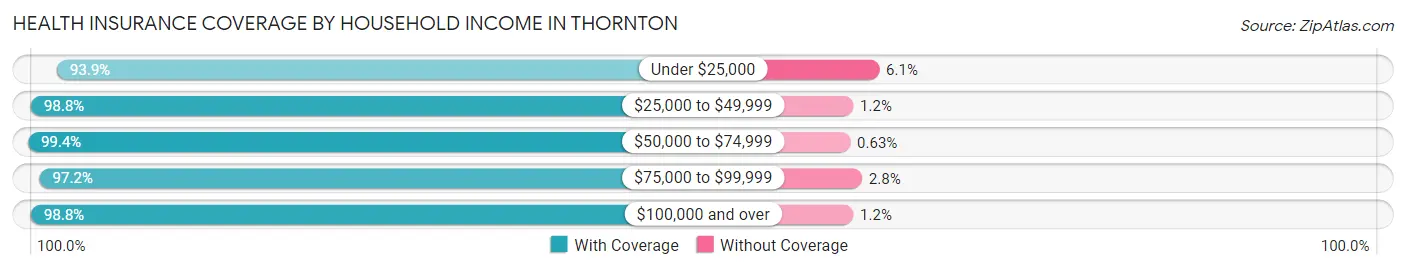
| Household Income | With Coverage | Without Coverage |
| Under $25,000 | 31 (93.9%) | 2 (6.1%) |
| $25,000 to $49,999 | 83 (98.8%) | 1 (1.2%) |
| $50,000 to $74,999 | 158 (99.4%) | 1 (0.6%) |
| $75,000 to $99,999 | 103 (97.2%) | 3 (2.8%) |
| $100,000 and over | 83 (98.8%) | 1 (1.2%) |
Public vs Private Health Insurance Coverage by Age in Thornton
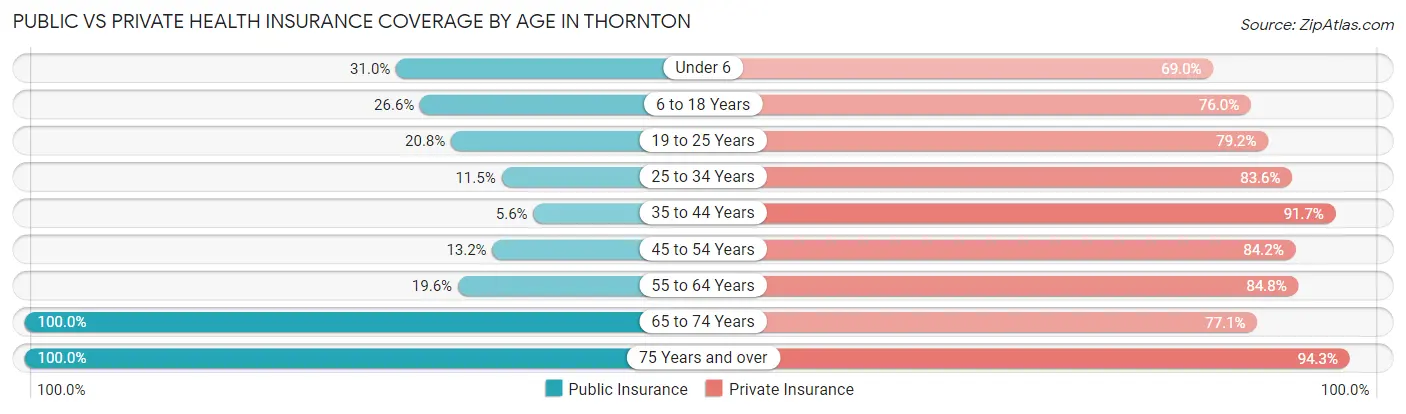
| Age Bracket | Public Insurance | Private Insurance |
| Under 6 | 9 (31.0%) | 20 (69.0%) |
| 6 to 18 Years | 21 (26.6%) | 60 (75.9%) |
| 19 to 25 Years | 15 (20.8%) | 57 (79.2%) |
| 25 to 34 Years | 7 (11.5%) | 51 (83.6%) |
| 35 to 44 Years | 2 (5.6%) | 33 (91.7%) |
| 45 to 54 Years | 5 (13.2%) | 32 (84.2%) |
| 55 to 64 Years | 9 (19.6%) | 39 (84.8%) |
| 65 to 74 Years | 35 (100.0%) | 27 (77.1%) |
| 75 Years and over | 70 (100.0%) | 66 (94.3%) |
| Total | 173 (37.1%) | 385 (82.6%) |
Disability Status by Sex by Age in Thornton
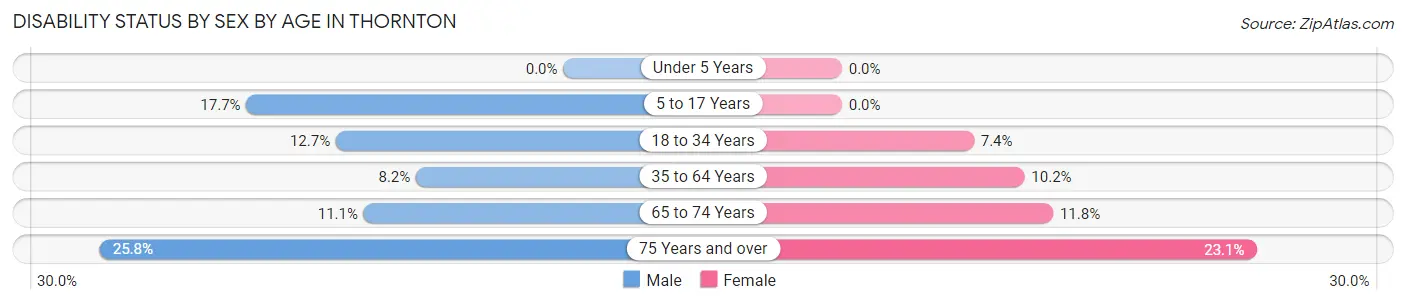
| Age Bracket | Male | Female |
| Under 5 Years | 0 (0.0%) | 0 (0.0%) |
| 5 to 17 Years | 6 (17.6%) | 0 (0.0%) |
| 18 to 34 Years | 10 (12.7%) | 5 (7.3%) |
| 35 to 64 Years | 5 (8.2%) | 6 (10.2%) |
| 65 to 74 Years | 2 (11.1%) | 2 (11.8%) |
| 75 Years and over | 8 (25.8%) | 9 (23.1%) |
Disability Class by Sex by Age in Thornton
Disability Class: Hearing Difficulty
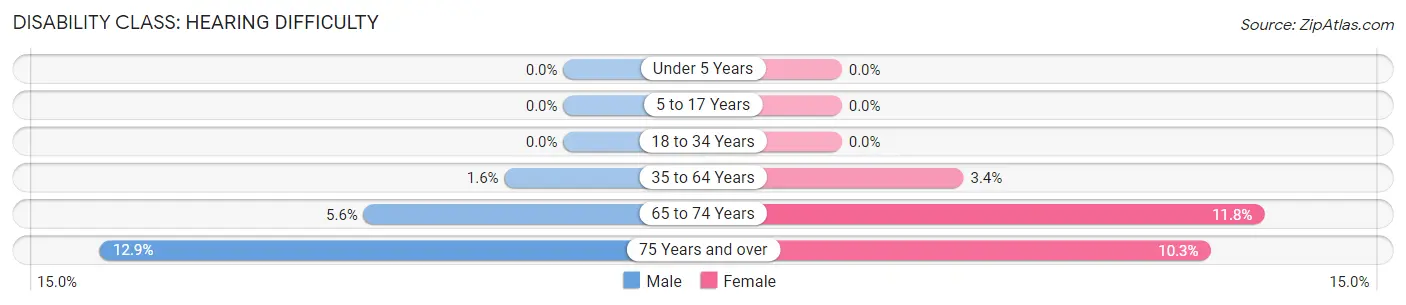
| Age Bracket | Male | Female |
| Under 5 Years | 0 (0.0%) | 0 (0.0%) |
| 5 to 17 Years | 0 (0.0%) | 0 (0.0%) |
| 18 to 34 Years | 0 (0.0%) | 0 (0.0%) |
| 35 to 64 Years | 1 (1.6%) | 2 (3.4%) |
| 65 to 74 Years | 1 (5.6%) | 2 (11.8%) |
| 75 Years and over | 4 (12.9%) | 4 (10.3%) |
Disability Class: Vision Difficulty
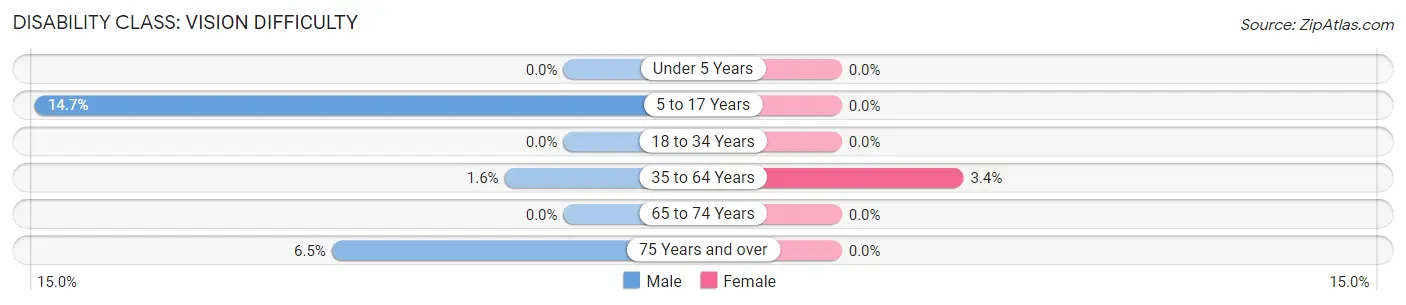
| Age Bracket | Male | Female |
| Under 5 Years | 0 (0.0%) | 0 (0.0%) |
| 5 to 17 Years | 5 (14.7%) | 0 (0.0%) |
| 18 to 34 Years | 0 (0.0%) | 0 (0.0%) |
| 35 to 64 Years | 1 (1.6%) | 2 (3.4%) |
| 65 to 74 Years | 0 (0.0%) | 0 (0.0%) |
| 75 Years and over | 2 (6.5%) | 0 (0.0%) |
Disability Class: Cognitive Difficulty
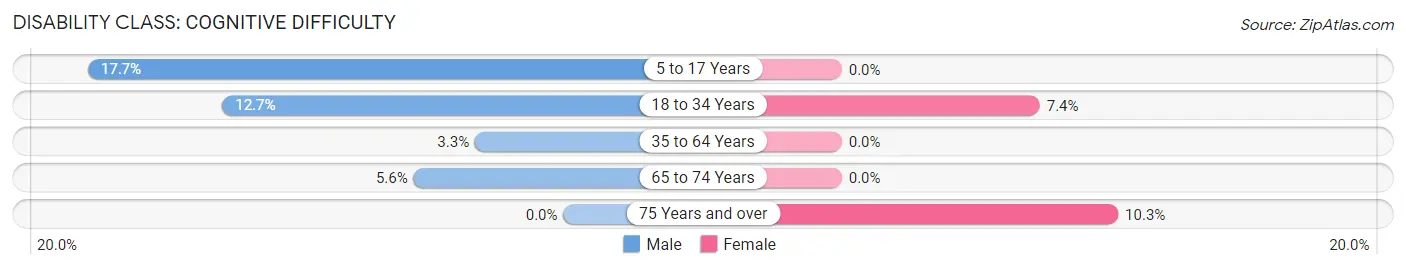
| Age Bracket | Male | Female |
| 5 to 17 Years | 6 (17.6%) | 0 (0.0%) |
| 18 to 34 Years | 10 (12.7%) | 5 (7.3%) |
| 35 to 64 Years | 2 (3.3%) | 0 (0.0%) |
| 65 to 74 Years | 1 (5.6%) | 0 (0.0%) |
| 75 Years and over | 0 (0.0%) | 4 (10.3%) |
Disability Class: Ambulatory Difficulty
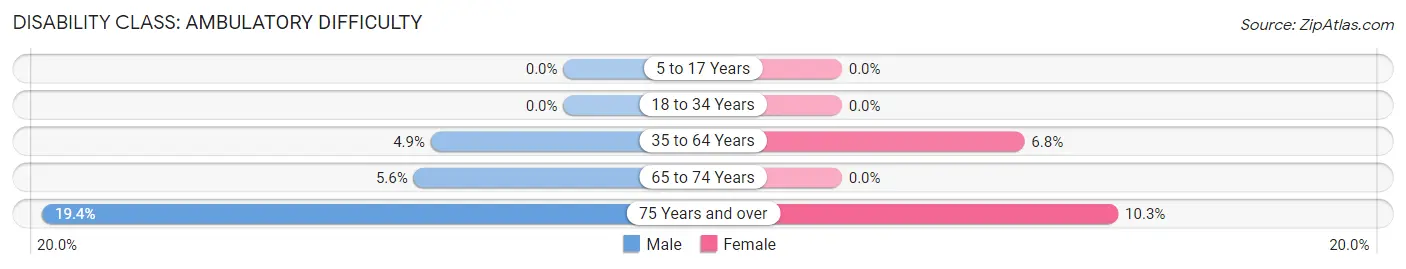
| Age Bracket | Male | Female |
| 5 to 17 Years | 0 (0.0%) | 0 (0.0%) |
| 18 to 34 Years | 0 (0.0%) | 0 (0.0%) |
| 35 to 64 Years | 3 (4.9%) | 4 (6.8%) |
| 65 to 74 Years | 1 (5.6%) | 0 (0.0%) |
| 75 Years and over | 6 (19.4%) | 4 (10.3%) |
Disability Class: Self-Care Difficulty
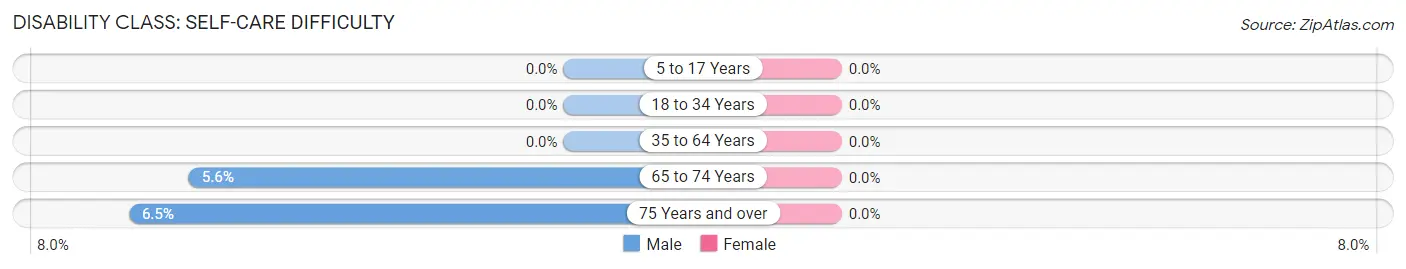
| Age Bracket | Male | Female |
| 5 to 17 Years | 0 (0.0%) | 0 (0.0%) |
| 18 to 34 Years | 0 (0.0%) | 0 (0.0%) |
| 35 to 64 Years | 0 (0.0%) | 0 (0.0%) |
| 65 to 74 Years | 1 (5.6%) | 0 (0.0%) |
| 75 Years and over | 2 (6.5%) | 0 (0.0%) |
Technology Access in Thornton
Computing Device Access in Thornton
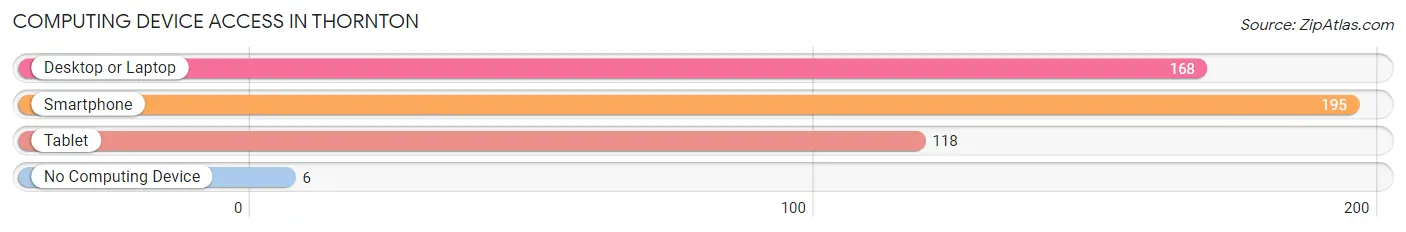
| Device Type | # Households | % Households |
| Desktop or Laptop | 168 | 77.8% |
| Smartphone | 195 | 90.3% |
| Tablet | 118 | 54.6% |
| No Computing Device | 6 | 2.8% |
| Total | 216 | 100.0% |
Internet Access in Thornton
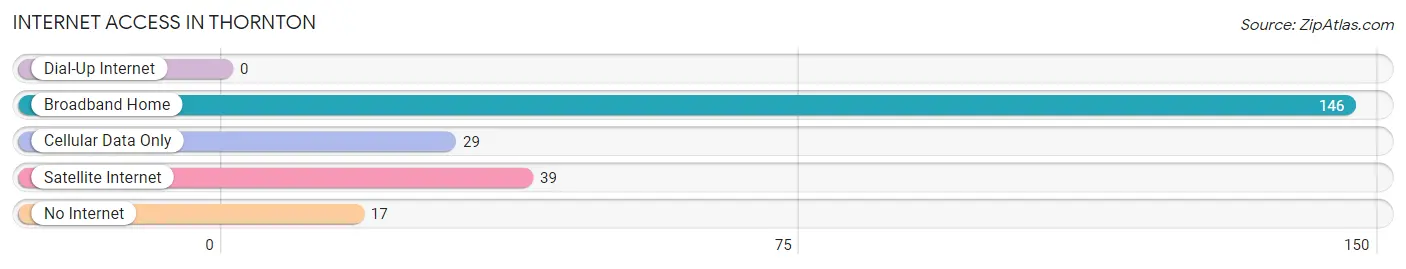
| Internet Type | # Households | % Households |
| Dial-Up Internet | 0 | 0.0% |
| Broadband Home | 146 | 67.6% |
| Cellular Data Only | 29 | 13.4% |
| Satellite Internet | 39 | 18.1% |
| No Internet | 17 | 7.9% |
| Total | 216 | 100.0% |
Thornton Summary
Thornton, Iowa is a small city located in the northern part of the state, in the county of Franklin. It is situated on the banks of the Cedar River, and is home to a population of just over 1,000 people. The city is known for its small-town charm and its close-knit community.
History
Thornton was founded in 1854 by a group of settlers from New York. The city was named after the town of Thornton, New York, which was the hometown of the settlers. The settlers were attracted to the area due to its fertile soil and abundant natural resources. The city was incorporated in 1856 and quickly grew to become a thriving agricultural community.
In the late 19th century, Thornton was a major hub for the lumber industry. The city was home to several sawmills and lumber yards, and the timber industry provided many jobs for the local population. The city also had a thriving brick-making industry, and the bricks produced in Thornton were used to build many of the city’s buildings.
Geography
Thornton is located in the northern part of Iowa, in the county of Franklin. The city is situated on the banks of the Cedar River, and is surrounded by rolling hills and farmland. The city is located approximately 30 miles north of Des Moines, the state capital.
The climate in Thornton is typical of the Midwest, with hot summers and cold winters. The average temperature in the summer is around 75 degrees Fahrenheit, and the average temperature in the winter is around 25 degrees Fahrenheit. The city receives an average of 40 inches of precipitation per year.
Economy
The economy of Thornton is largely based on agriculture. The city is home to several farms, and the surrounding area is known for its production of corn, soybeans, and other crops. The city is also home to several manufacturing companies, including a furniture factory and a plastics factory.
Thornton is also home to several small businesses, including restaurants, retail stores, and service providers. The city is also home to a number of tourist attractions, including a historic downtown area and a museum.
Demographics
As of the 2010 census, the population of Thornton was 1,039. The racial makeup of the city was 97.3% White, 0.7% African American, 0.3% Native American, 0.2% Asian, 0.1% Pacific Islander, and 1.4% from other races. The median household income in Thornton was $41,250, and the median family income was $50,000.
Thornton is a small city with a close-knit community. The city is known for its small-town charm and its friendly atmosphere. The city is home to a diverse population, and the city is proud of its heritage and its commitment to preserving its history.
Common Questions
What is Per Capita Income in Thornton?
Per Capita income in Thornton is $31,683.
What is the Median Family Income in Thornton?
Median Family Income in Thornton is $62,500.
What is the Median Household income in Thornton?
Median Household Income in Thornton is $58,676.
What is Income or Wage Gap in Thornton?
Income or Wage Gap in Thornton is 43.0%.
Women in Thornton earn 57.0 cents for every dollar earned by a man.
What is Inequality or Gini Index in Thornton?
Inequality or Gini Index in Thornton is 0.34.
What is the Total Population of Thornton?
Total Population of Thornton is 466.
What is the Total Male Population of Thornton?
Total Male Population of Thornton is 228.
What is the Total Female Population of Thornton?
Total Female Population of Thornton is 238.
What is the Ratio of Males per 100 Females in Thornton?
There are 95.80 Males per 100 Females in Thornton.
What is the Ratio of Females per 100 Males in Thornton?
There are 104.39 Females per 100 Males in Thornton.
What is the Median Population Age in Thornton?
Median Population Age in Thornton is 33.0 Years.
What is the Average Family Size in Thornton
Average Family Size in Thornton is 2.6 People.
What is the Average Household Size in Thornton
Average Household Size in Thornton is 2.2 People.
How Large is the Labor Force in Thornton?
There are 248 People in the Labor Forcein in Thornton.
What is the Percentage of People in the Labor Force in Thornton?
66.1% of People are in the Labor Force in Thornton.
What is the Unemployment Rate in Thornton?
Unemployment Rate in Thornton is 2.0%.