North English, IA Map & Demographics
North English Map
North English Overview
$33,676
PER CAPITA INCOME
$61,563
AVG FAMILY INCOME
$47,656
AVG HOUSEHOLD INCOME
43.8%
WAGE / INCOME GAP [ % ]
56.2¢/ $1
WAGE / INCOME GAP [ $ ]
0.50
INEQUALITY / GINI INDEX
826
TOTAL POPULATION
356
MALE POPULATION
470
FEMALE POPULATION
75.74
MALES / 100 FEMALES
132.02
FEMALES / 100 MALES
38.8
MEDIAN AGE
3.0
AVG FAMILY SIZE
2.2
AVG HOUSEHOLD SIZE
397
LABOR FORCE [ PEOPLE ]
60.5%
PERCENT IN LABOR FORCE
1.3%
UNEMPLOYMENT RATE
North English Zip Codes
North English Area Codes
Income in North English
Income Overview in North English
Per Capita Income in North English is $33,676, while median incomes of families and households are $61,563 and $47,656 respectively.
| Characteristic | Number | Measure |
| Per Capita Income | 826 | $33,676 |
| Median Family Income | 193 | $61,563 |
| Mean Family Income | 193 | $98,102 |
| Median Household Income | 353 | $47,656 |
| Mean Household Income | 353 | $76,367 |
| Income Deficit | 193 | $0 |
| Wage / Income Gap (%) | 826 | 43.78% |
| Wage / Income Gap ($) | 826 | 56.22¢ per $1 |
| Gini / Inequality Index | 826 | 0.50 |
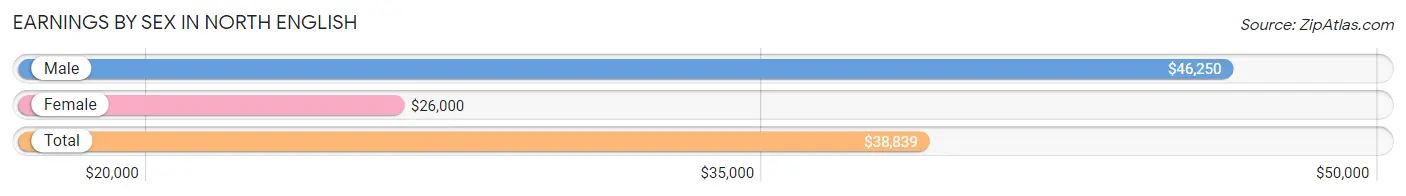
Earnings by Sex in North English
Average Earnings in North English are $38,839, $46,250 for men and $26,000 for women, a difference of 43.8%.
| Sex | Number | Average Earnings |
| Male | 175 (43.0%) | $46,250 |
| Female | 232 (57.0%) | $26,000 |
| Total | 407 (100.0%) | $38,839 |
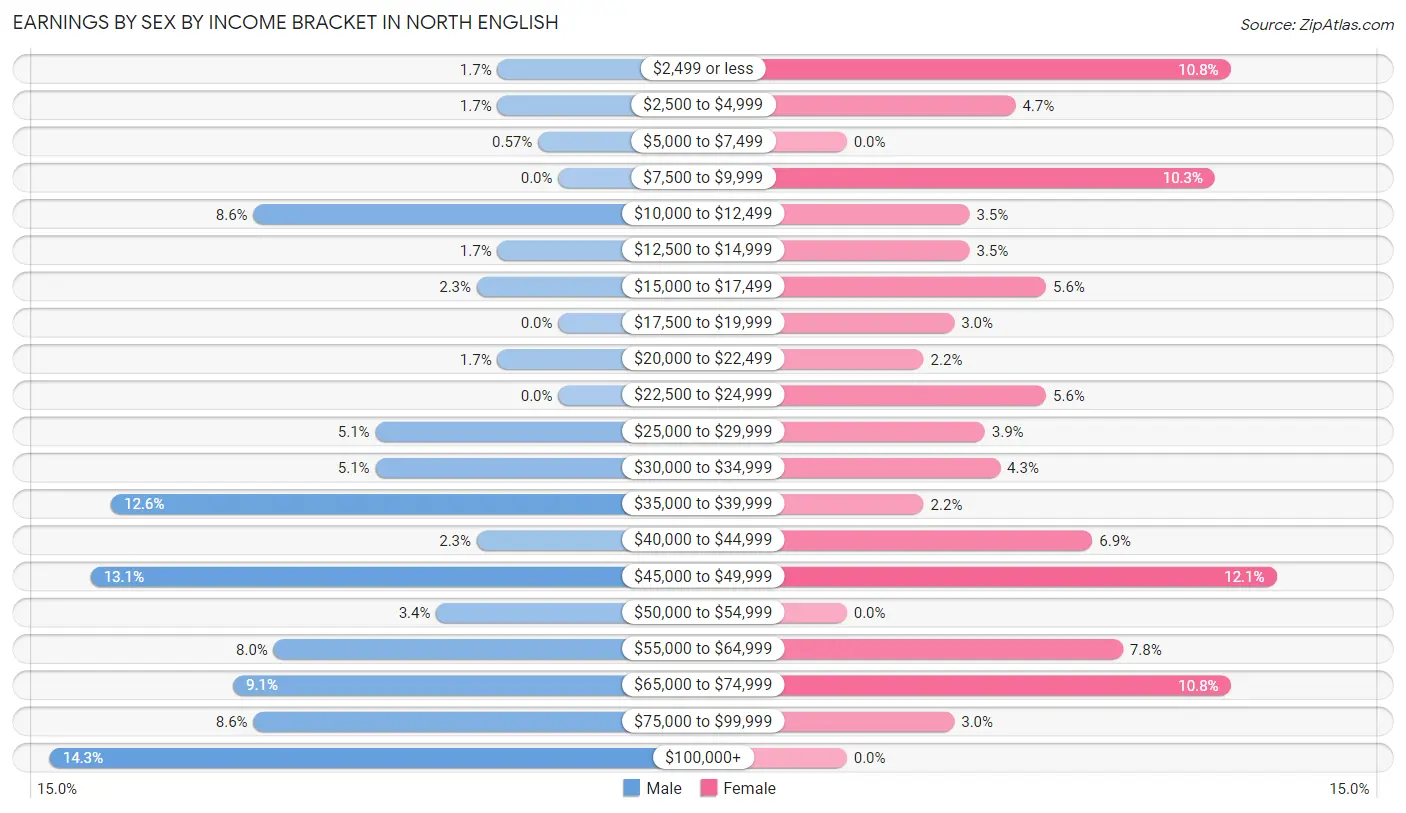
Earnings by Sex by Income Bracket in North English
The most common earnings brackets in North English are $100,000+ for men (25 | 14.3%) and $45,000 to $49,999 for women (28 | 12.1%).
| Income | Male | Female |
| $2,499 or less | 3 (1.7%) | 25 (10.8%) |
| $2,500 to $4,999 | 3 (1.7%) | 11 (4.7%) |
| $5,000 to $7,499 | 1 (0.6%) | 0 (0.0%) |
| $7,500 to $9,999 | 0 (0.0%) | 24 (10.3%) |
| $10,000 to $12,499 | 15 (8.6%) | 8 (3.5%) |
| $12,500 to $14,999 | 3 (1.7%) | 8 (3.5%) |
| $15,000 to $17,499 | 4 (2.3%) | 13 (5.6%) |
| $17,500 to $19,999 | 0 (0.0%) | 7 (3.0%) |
| $20,000 to $22,499 | 3 (1.7%) | 5 (2.2%) |
| $22,500 to $24,999 | 0 (0.0%) | 13 (5.6%) |
| $25,000 to $29,999 | 9 (5.1%) | 9 (3.9%) |
| $30,000 to $34,999 | 9 (5.1%) | 10 (4.3%) |
| $35,000 to $39,999 | 22 (12.6%) | 5 (2.2%) |
| $40,000 to $44,999 | 4 (2.3%) | 16 (6.9%) |
| $45,000 to $49,999 | 23 (13.1%) | 28 (12.1%) |
| $50,000 to $54,999 | 6 (3.4%) | 0 (0.0%) |
| $55,000 to $64,999 | 14 (8.0%) | 18 (7.8%) |
| $65,000 to $74,999 | 16 (9.1%) | 25 (10.8%) |
| $75,000 to $99,999 | 15 (8.6%) | 7 (3.0%) |
| $100,000+ | 25 (14.3%) | 0 (0.0%) |
| Total | 175 (100.0%) | 232 (100.0%) |
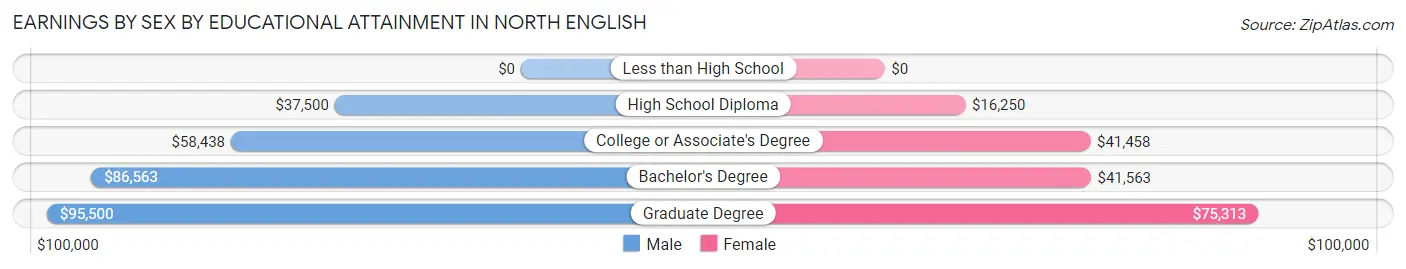
Earnings by Sex by Educational Attainment in North English
Average earnings in North English are $51,458 for men and $40,156 for women, a difference of 22.0%. Men with an educational attainment of graduate degree enjoy the highest average annual earnings of $95,500, while those with high school diploma education earn the least with $37,500. Women with an educational attainment of graduate degree earn the most with the average annual earnings of $75,313, while those with high school diploma education have the smallest earnings of $16,250.
| Educational Attainment | Male Income | Female Income |
| Less than High School | - | - |
| High School Diploma | $37,500 | $16,250 |
| College or Associate's Degree | $58,438 | $41,458 |
| Bachelor's Degree | $86,563 | $41,563 |
| Graduate Degree | $95,500 | $75,313 |
| Total | $51,458 | $40,156 |
Family Income in North English
Family Income Brackets in North English
According to the North English family income data, there are 45 families falling into the $35,000 to $49,999 income range, which is the most common income bracket and makes up 23.3% of all families. Conversely, the $10,000 to $14,999 income bracket is the least frequent group with only 2 families (1.0%) belonging to this category.
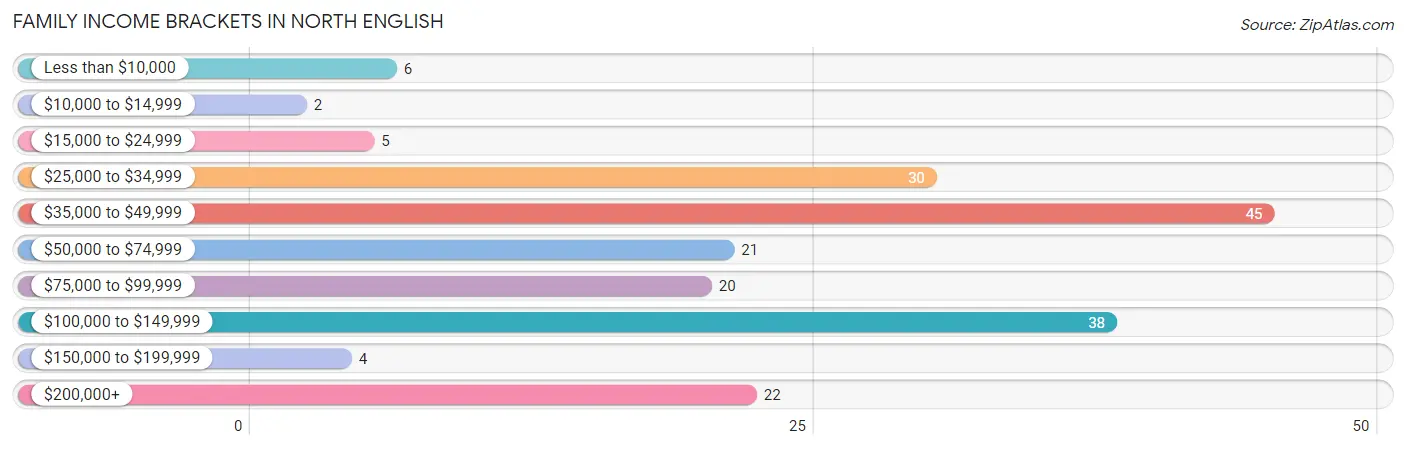
| Income Bracket | # Families | % Families |
| Less than $10,000 | 6 | 3.1% |
| $10,000 to $14,999 | 2 | 1.0% |
| $15,000 to $24,999 | 5 | 2.6% |
| $25,000 to $34,999 | 30 | 15.5% |
| $35,000 to $49,999 | 45 | 23.3% |
| $50,000 to $74,999 | 21 | 10.9% |
| $75,000 to $99,999 | 20 | 10.4% |
| $100,000 to $149,999 | 38 | 19.7% |
| $150,000 to $199,999 | 4 | 2.1% |
| $200,000+ | 22 | 11.4% |
Family Income by Famaliy Size in North English
4-person families (43 | 22.3%) account for the highest median family income in North English with $95,313 per family, while 3-person families (25 | 13.0%) have the highest median income of $26,713 per family member.
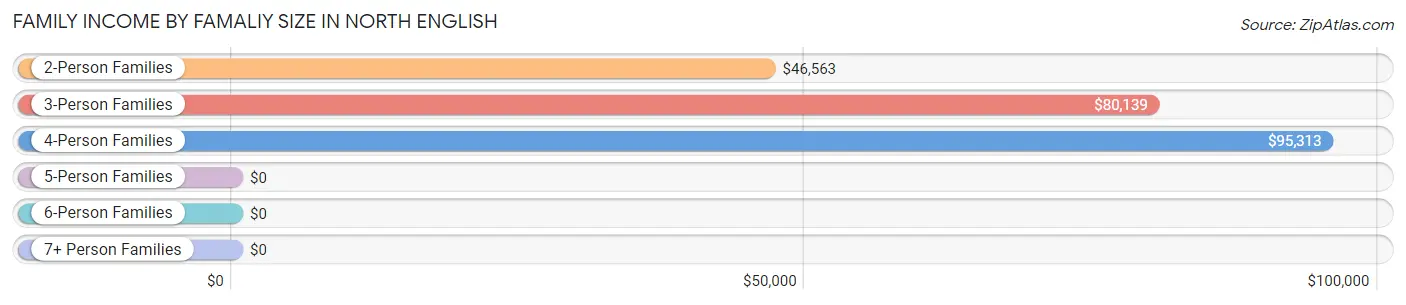
| Income Bracket | # Families | Median Income |
| 2-Person Families | 115 (59.6%) | $46,563 |
| 3-Person Families | 25 (13.0%) | $80,139 |
| 4-Person Families | 43 (22.3%) | $95,313 |
| 5-Person Families | 2 (1.0%) | $0 |
| 6-Person Families | 0 (0.0%) | $0 |
| 7+ Person Families | 8 (4.2%) | $0 |
| Total | 193 (100.0%) | $61,563 |
Family Income by Number of Earners in North English
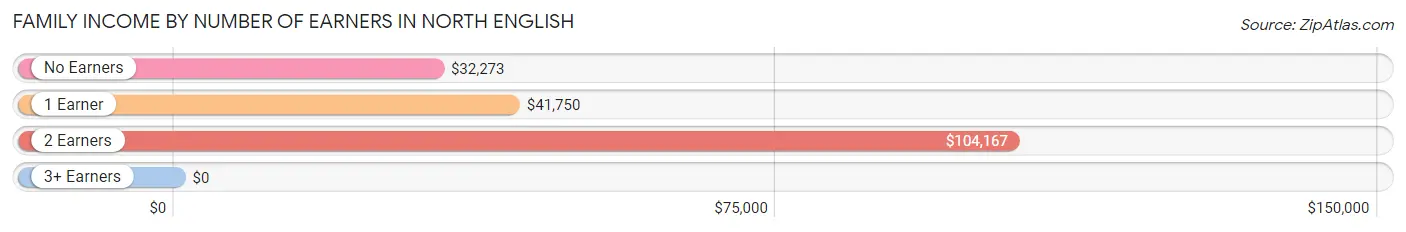
| Number of Earners | # Families | Median Income |
| No Earners | 40 (20.7%) | $32,273 |
| 1 Earner | 60 (31.1%) | $41,750 |
| 2 Earners | 88 (45.6%) | $104,167 |
| 3+ Earners | 5 (2.6%) | $0 |
| Total | 193 (100.0%) | $61,563 |
Household Income in North English
Household Income Brackets in North English
With 70 households falling in the category, the $35,000 to $49,999 income range is the most frequent in North English, accounting for 19.8% of all households. In contrast, only 16 households (4.5%) fall into the less than $10,000 income bracket, making it the least populous group.
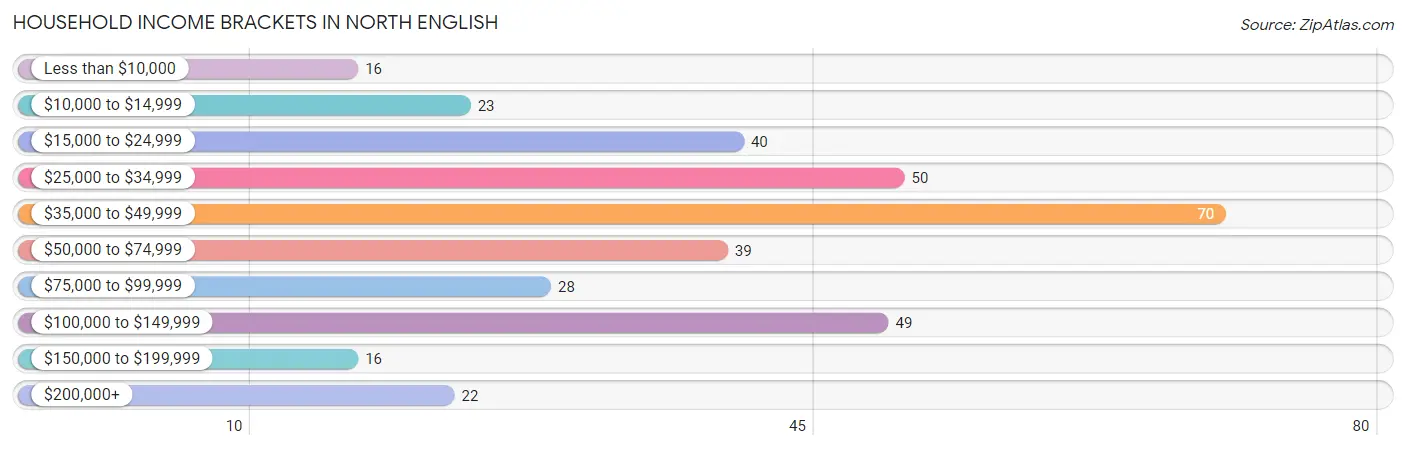
| Income Bracket | # Households | % Households |
| Less than $10,000 | 16 | 4.5% |
| $10,000 to $14,999 | 23 | 6.5% |
| $15,000 to $24,999 | 40 | 11.3% |
| $25,000 to $34,999 | 50 | 14.2% |
| $35,000 to $49,999 | 70 | 19.8% |
| $50,000 to $74,999 | 39 | 11.0% |
| $75,000 to $99,999 | 28 | 7.9% |
| $100,000 to $149,999 | 49 | 13.9% |
| $150,000 to $199,999 | 16 | 4.5% |
| $200,000+ | 22 | 6.2% |
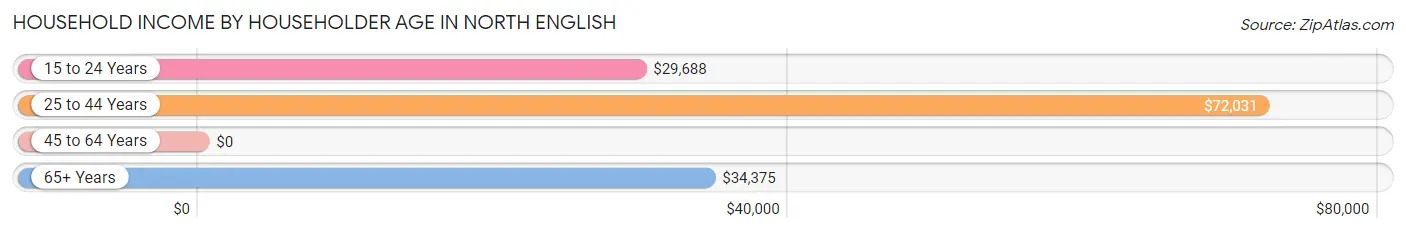
Household Income by Householder Age in North English
The median household income in North English is $47,656, with the highest median household income of $72,031 found in the 25 to 44 years age bracket for the primary householder. A total of 79 households (22.4%) fall into this category. Meanwhile, the 45 to 64 years age bracket for the primary householder has the lowest median household income of $0, with 125 households (35.4%) in this group.
| Income Bracket | # Households | Median Income |
| 15 to 24 Years | 19 (5.4%) | $29,688 |
| 25 to 44 Years | 79 (22.4%) | $72,031 |
| 45 to 64 Years | 125 (35.4%) | $0 |
| 65+ Years | 130 (36.8%) | $34,375 |
| Total | 353 (100.0%) | $47,656 |
Poverty in North English
Income Below Poverty by Sex and Age in North English
With 7.4% poverty level for males and 8.8% for females among the residents of North English, 18 to 24 year old males and 5 year old females are the most vulnerable to poverty, with 8 males (26.7%) and 2 females (100.0%) in their respective age groups living below the poverty level.
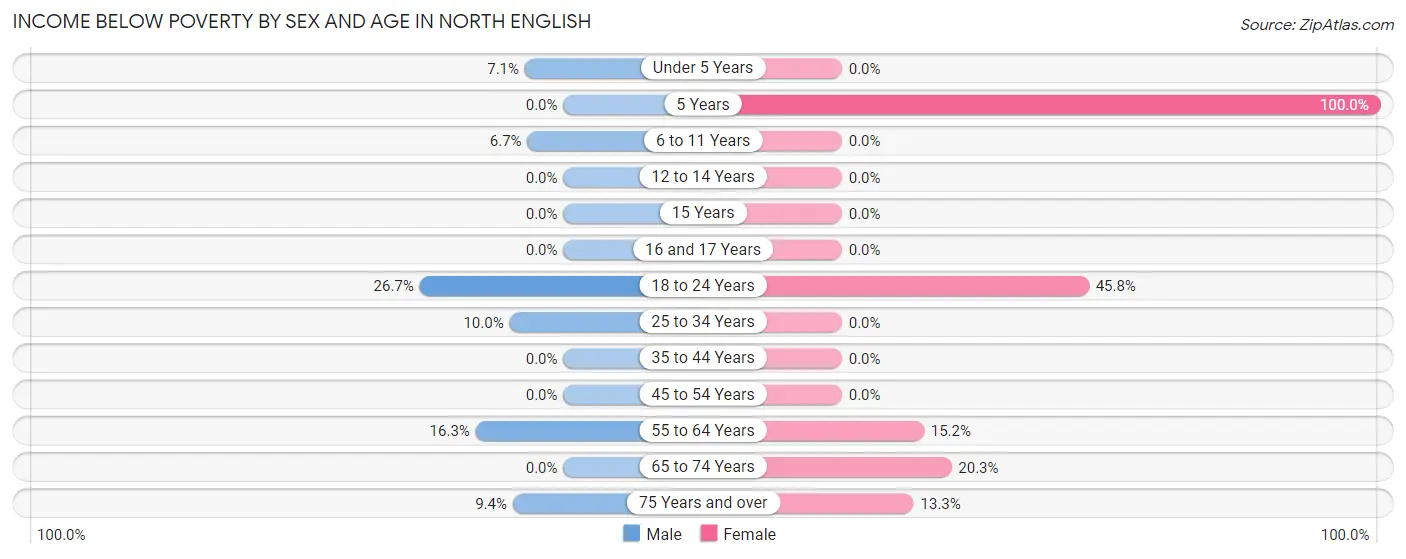
| Age Bracket | Male | Female |
| Under 5 Years | 2 (7.1%) | 0 (0.0%) |
| 5 Years | 0 (0.0%) | 2 (100.0%) |
| 6 to 11 Years | 2 (6.7%) | 0 (0.0%) |
| 12 to 14 Years | 0 (0.0%) | 0 (0.0%) |
| 15 Years | 0 (0.0%) | 0 (0.0%) |
| 16 and 17 Years | 0 (0.0%) | 0 (0.0%) |
| 18 to 24 Years | 8 (26.7%) | 11 (45.8%) |
| 25 to 34 Years | 4 (10.0%) | 0 (0.0%) |
| 35 to 44 Years | 0 (0.0%) | 0 (0.0%) |
| 45 to 54 Years | 0 (0.0%) | 0 (0.0%) |
| 55 to 64 Years | 7 (16.3%) | 7 (15.2%) |
| 65 to 74 Years | 0 (0.0%) | 12 (20.3%) |
| 75 Years and over | 3 (9.4%) | 6 (13.3%) |
| Total | 26 (7.4%) | 38 (8.8%) |
Income Above Poverty by Sex and Age in North English
According to the poverty statistics in North English, males aged 5 years and females aged under 5 years are the age groups that are most secure financially, with 100.0% of males and 100.0% of females in these age groups living above the poverty line.
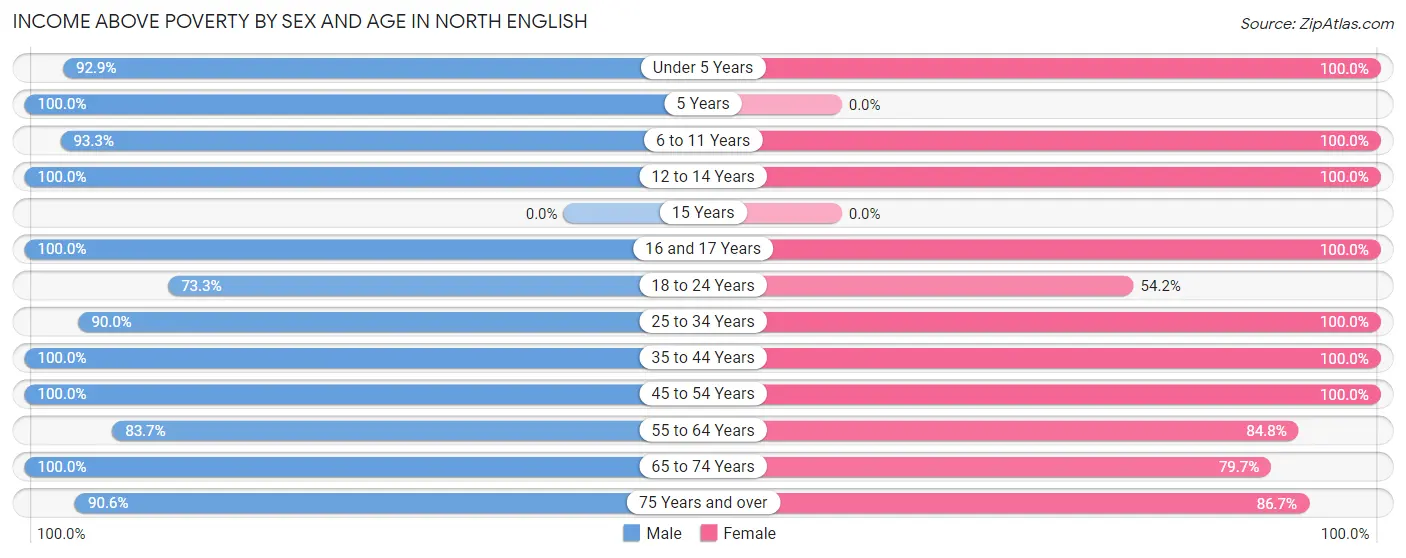
| Age Bracket | Male | Female |
| Under 5 Years | 26 (92.9%) | 20 (100.0%) |
| 5 Years | 13 (100.0%) | 0 (0.0%) |
| 6 to 11 Years | 28 (93.3%) | 28 (100.0%) |
| 12 to 14 Years | 20 (100.0%) | 29 (100.0%) |
| 15 Years | 0 (0.0%) | 0 (0.0%) |
| 16 and 17 Years | 17 (100.0%) | 42 (100.0%) |
| 18 to 24 Years | 22 (73.3%) | 13 (54.2%) |
| 25 to 34 Years | 36 (90.0%) | 49 (100.0%) |
| 35 to 44 Years | 22 (100.0%) | 28 (100.0%) |
| 45 to 54 Years | 57 (100.0%) | 59 (100.0%) |
| 55 to 64 Years | 36 (83.7%) | 39 (84.8%) |
| 65 to 74 Years | 17 (100.0%) | 47 (79.7%) |
| 75 Years and over | 29 (90.6%) | 39 (86.7%) |
| Total | 323 (92.5%) | 393 (91.2%) |
Income Below Poverty Among Married-Couple Families in North English
The poverty statistics for married-couple families in North English show that 4.5% or 6 of the total 133 families live below the poverty line. Families with no children have the highest poverty rate of 7.8%, comprising of 6 families. On the other hand, families with 1 or 2 children have the lowest poverty rate of 0.0%, which includes 0 families.
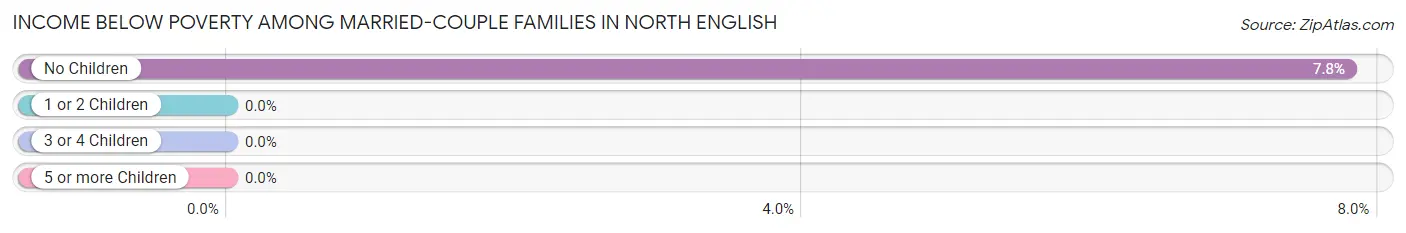
| Children | Above Poverty | Below Poverty |
| No Children | 71 (92.2%) | 6 (7.8%) |
| 1 or 2 Children | 48 (100.0%) | 0 (0.0%) |
| 3 or 4 Children | 0 (0.0%) | 0 (0.0%) |
| 5 or more Children | 8 (100.0%) | 0 (0.0%) |
| Total | 127 (95.5%) | 6 (4.5%) |
Income Below Poverty Among Single-Parent Households in North English
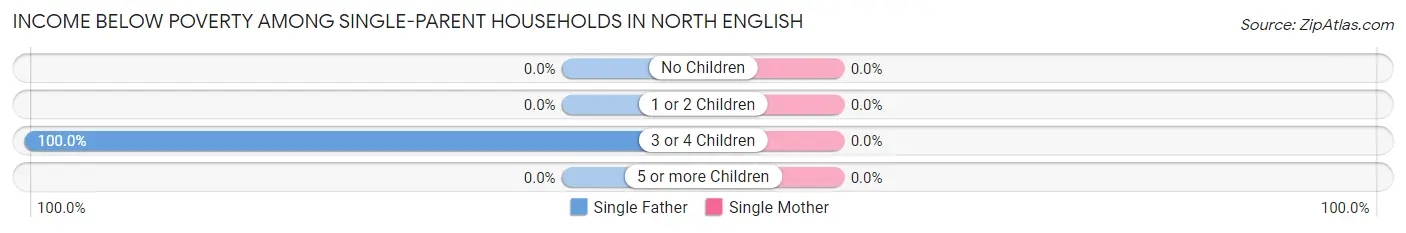
| Children | Single Father | Single Mother |
| No Children | 0 (0.0%) | 0 (0.0%) |
| 1 or 2 Children | 0 (0.0%) | 0 (0.0%) |
| 3 or 4 Children | 2 (100.0%) | 0 (0.0%) |
| 5 or more Children | 0 (0.0%) | 0 (0.0%) |
| Total | 2 (12.5%) | 0 (0.0%) |
Income Below Poverty Among Married-Couple vs Single-Parent Households in North English
The poverty data for North English shows that 6 of the married-couple family households (4.5%) and 2 of the single-parent households (3.3%) are living below the poverty level. Within the married-couple family households, those with no children have the highest poverty rate, with 6 households (7.8%) falling below the poverty line. Among the single-parent households, those with 3 or 4 children have the highest poverty rate, with 2 household (15.4%) living below poverty.
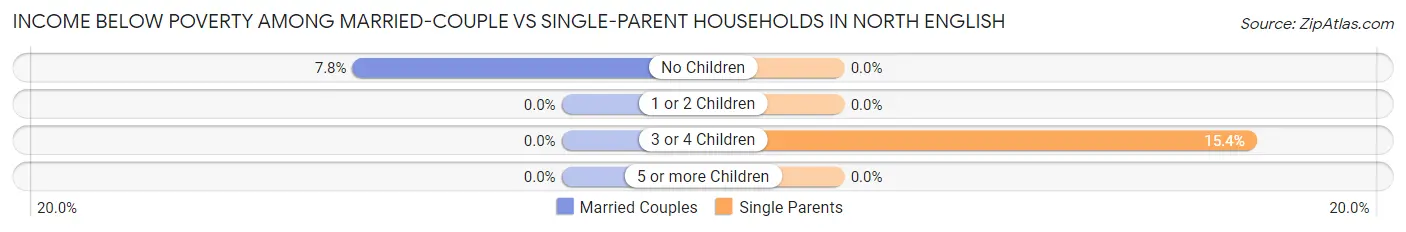
| Children | Married-Couple Families | Single-Parent Households |
| No Children | 6 (7.8%) | 0 (0.0%) |
| 1 or 2 Children | 0 (0.0%) | 0 (0.0%) |
| 3 or 4 Children | 0 (0.0%) | 2 (15.4%) |
| 5 or more Children | 0 (0.0%) | 0 (0.0%) |
| Total | 6 (4.5%) | 2 (3.3%) |
Race in North English
The most populous races in North English are White / Caucasian (805 | 97.5%), and Two or more Races (21 | 2.5%).
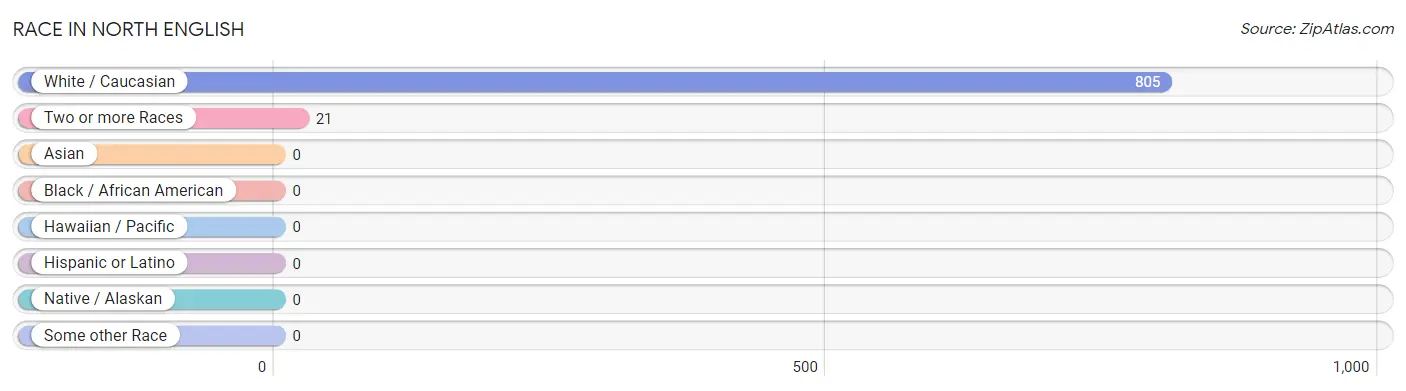
| Race | # Population | % Population |
| Asian | 0 | 0.0% |
| Black / African American | 0 | 0.0% |
| Hawaiian / Pacific | 0 | 0.0% |
| Hispanic or Latino | 0 | 0.0% |
| Native / Alaskan | 0 | 0.0% |
| White / Caucasian | 805 | 97.5% |
| Two or more Races | 21 | 2.5% |
| Some other Race | 0 | 0.0% |
| Total | 826 | 100.0% |
Ancestry in North English
The most populous ancestries reported in North English are German (172 | 20.8%), Irish (159 | 19.3%), English (130 | 15.7%), American (49 | 5.9%), and Polish (30 | 3.6%), together accounting for 65.4% of all North English residents.
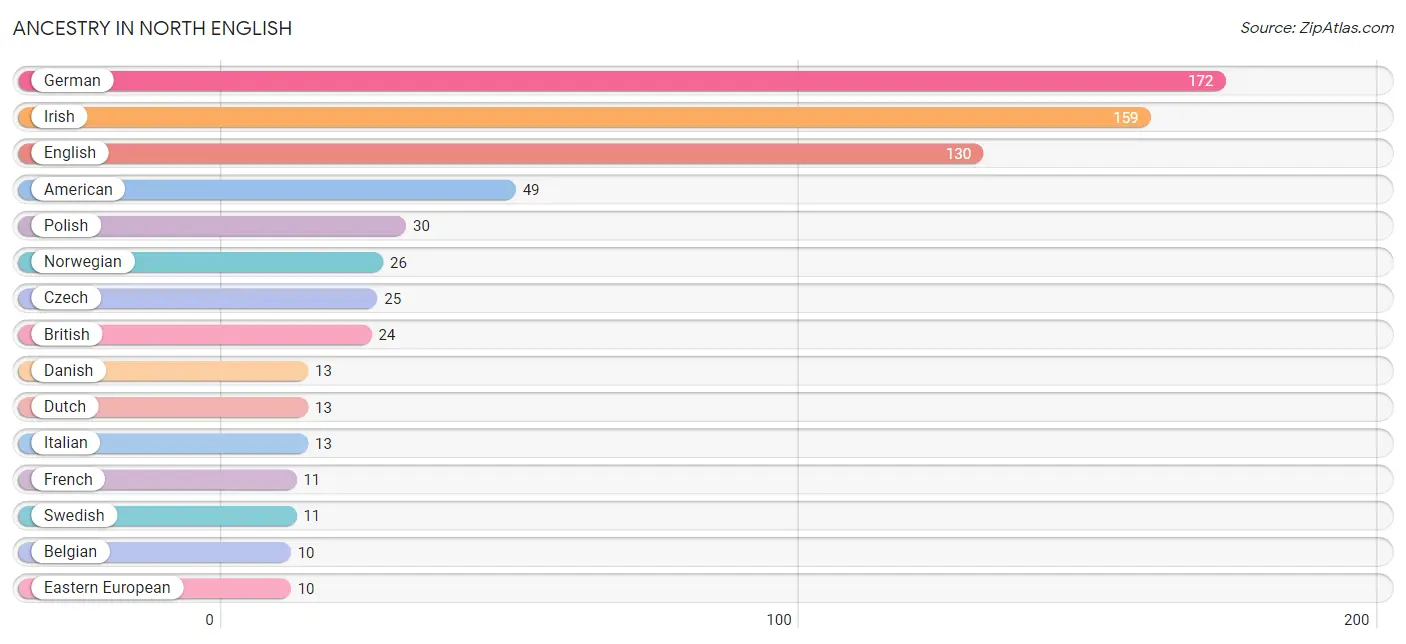
| Ancestry | # Population | % Population |
| American | 49 | 5.9% |
| Belgian | 10 | 1.2% |
| British | 24 | 2.9% |
| Czech | 25 | 3.0% |
| Danish | 13 | 1.6% |
| Dutch | 13 | 1.6% |
| Eastern European | 10 | 1.2% |
| English | 130 | 15.7% |
| European | 8 | 1.0% |
| French | 11 | 1.3% |
| German | 172 | 20.8% |
| Irish | 159 | 19.3% |
| Italian | 13 | 1.6% |
| Korean | 3 | 0.4% |
| Norwegian | 26 | 3.2% |
| Polish | 30 | 3.6% |
| Russian | 3 | 0.4% |
| Scotch-Irish | 6 | 0.7% |
| Scottish | 4 | 0.5% |
| Swedish | 11 | 1.3% | View All 20 Rows |
Immigrants in North English

| Immigration Origin | # Population | % Population | View All 0 Rows |
Sex and Age in North English
Sex and Age in North English
The most populous age groups in North English are 50 to 54 Years (43 | 12.1%) for men and 15 to 19 Years (50 | 10.6%) for women.
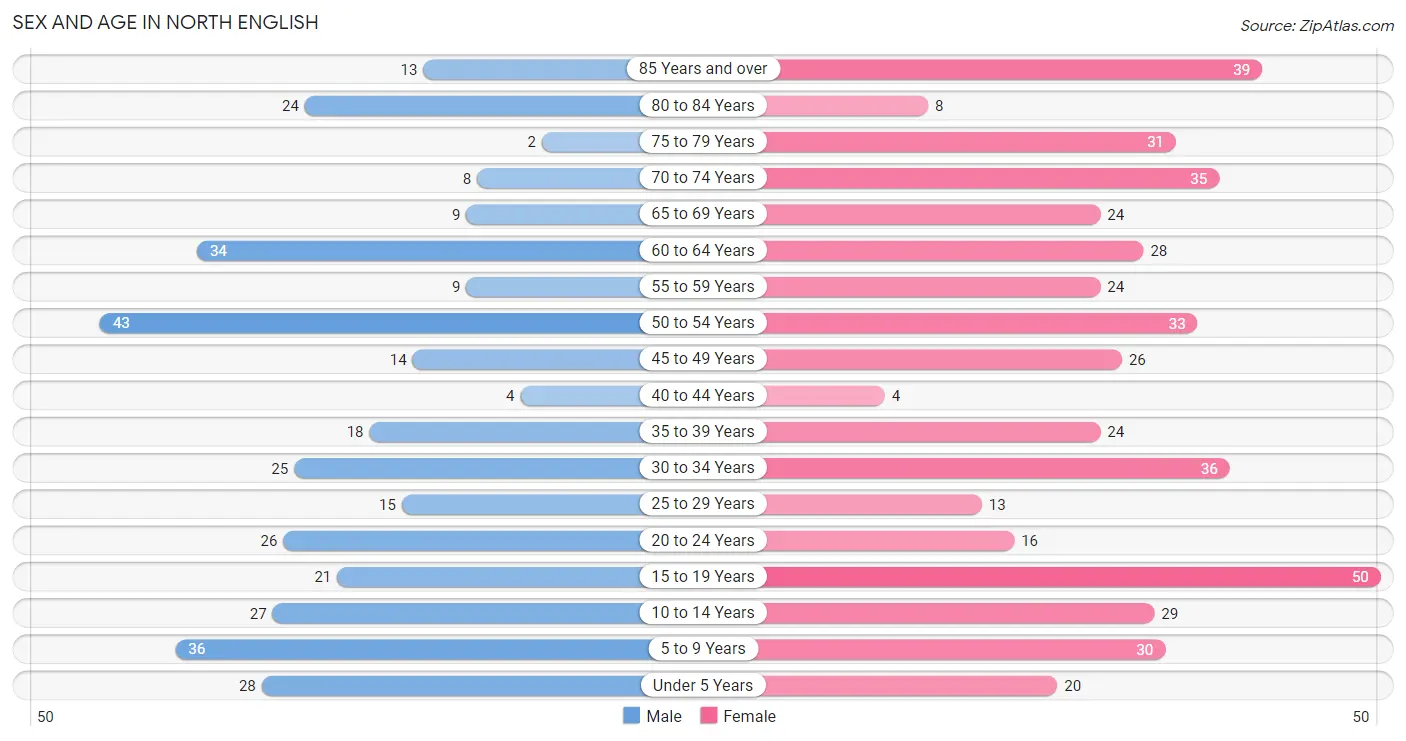
| Age Bracket | Male | Female |
| Under 5 Years | 28 (7.9%) | 20 (4.3%) |
| 5 to 9 Years | 36 (10.1%) | 30 (6.4%) |
| 10 to 14 Years | 27 (7.6%) | 29 (6.2%) |
| 15 to 19 Years | 21 (5.9%) | 50 (10.6%) |
| 20 to 24 Years | 26 (7.3%) | 16 (3.4%) |
| 25 to 29 Years | 15 (4.2%) | 13 (2.8%) |
| 30 to 34 Years | 25 (7.0%) | 36 (7.7%) |
| 35 to 39 Years | 18 (5.1%) | 24 (5.1%) |
| 40 to 44 Years | 4 (1.1%) | 4 (0.9%) |
| 45 to 49 Years | 14 (3.9%) | 26 (5.5%) |
| 50 to 54 Years | 43 (12.1%) | 33 (7.0%) |
| 55 to 59 Years | 9 (2.5%) | 24 (5.1%) |
| 60 to 64 Years | 34 (9.6%) | 28 (6.0%) |
| 65 to 69 Years | 9 (2.5%) | 24 (5.1%) |
| 70 to 74 Years | 8 (2.2%) | 35 (7.4%) |
| 75 to 79 Years | 2 (0.6%) | 31 (6.6%) |
| 80 to 84 Years | 24 (6.7%) | 8 (1.7%) |
| 85 Years and over | 13 (3.6%) | 39 (8.3%) |
| Total | 356 (100.0%) | 470 (100.0%) |
Families and Households in North English
Median Family Size in North English
The median family size in North English is 3.03 persons per family, with married-couple families (133 | 68.9%) accounting for the largest median family size of 3.22 persons per family. On the other hand, single male/father families (16 | 8.3%) represent the smallest median family size with 2.31 persons per family.
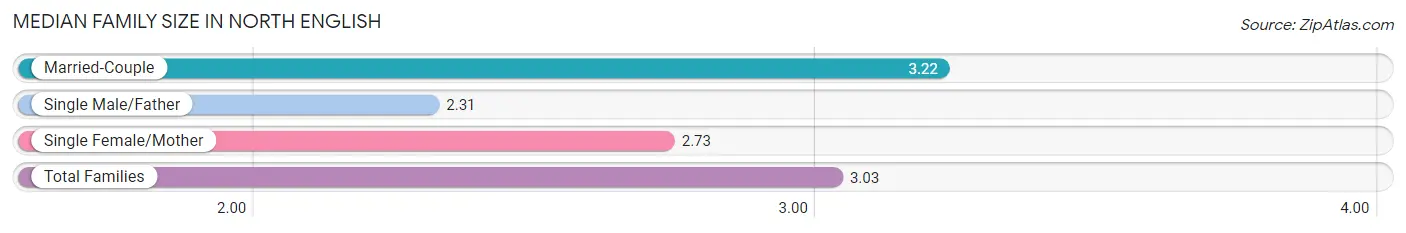
| Family Type | # Families | Family Size |
| Married-Couple | 133 (68.9%) | 3.22 |
| Single Male/Father | 16 (8.3%) | 2.31 |
| Single Female/Mother | 44 (22.8%) | 2.73 |
| Total Families | 193 (100.0%) | 3.03 |
Median Household Size in North English
The median household size in North English is 2.21 persons per household, with married-couple households (133 | 37.7%) accounting for the largest median household size of 3.22 persons per household. non-family households (160 | 45.3%) represent the smallest median household size with 1.08 persons per household.
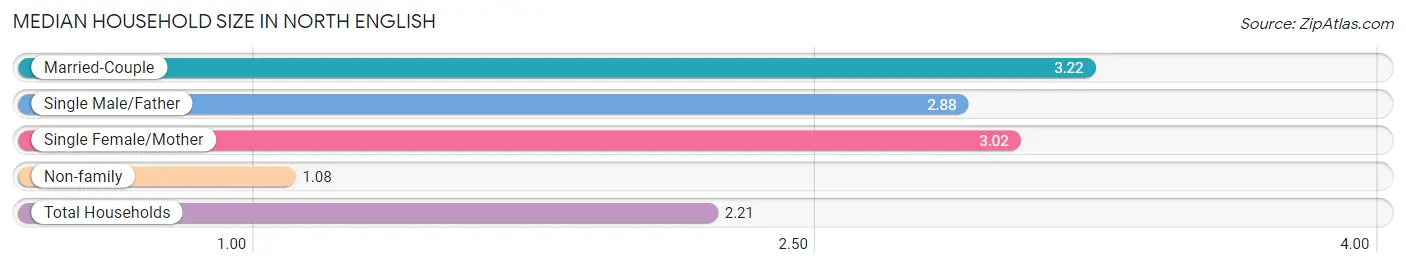
| Household Type | # Households | Household Size |
| Married-Couple | 133 (37.7%) | 3.22 |
| Single Male/Father | 16 (4.5%) | 2.88 |
| Single Female/Mother | 44 (12.5%) | 3.02 |
| Non-family | 160 (45.3%) | 1.08 |
| Total Households | 353 (100.0%) | 2.21 |
Household Size by Marriage Status in North English
Out of a total of 353 households in North English, 193 (54.7%) are family households, while 160 (45.3%) are nonfamily households. The most numerous type of family households are 2-person households, comprising 101, and the most common type of nonfamily households are 1-person households, comprising 146.
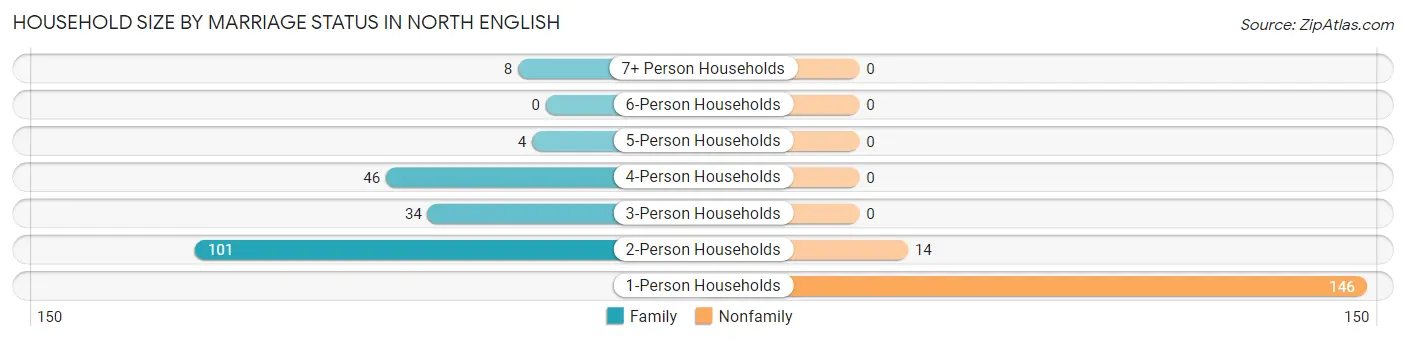
| Household Size | Family Households | Nonfamily Households |
| 1-Person Households | - | 146 (41.4%) |
| 2-Person Households | 101 (28.6%) | 14 (4.0%) |
| 3-Person Households | 34 (9.6%) | 0 (0.0%) |
| 4-Person Households | 46 (13.0%) | 0 (0.0%) |
| 5-Person Households | 4 (1.1%) | 0 (0.0%) |
| 6-Person Households | 0 (0.0%) | 0 (0.0%) |
| 7+ Person Households | 8 (2.3%) | 0 (0.0%) |
| Total | 193 (54.7%) | 160 (45.3%) |
Female Fertility in North English
Fertility by Age in North English
| Age Bracket | Women with Births | Births / 1,000 Women |
| 15 to 19 years | 0 (0.0%) | 0.0 |
| 20 to 34 years | 0 (0.0%) | 0.0 |
| 35 to 50 years | 0 (0.0%) | 0.0 |
| Total | 0 (0.0%) | 0.0 |
Fertility by Age by Marriage Status in North English
| Age Bracket | Married | Unmarried |
| 15 to 19 years | 0 (0.0%) | 0 (0.0%) |
| 20 to 34 years | 0 (0.0%) | 0 (0.0%) |
| 35 to 50 years | 0 (0.0%) | 0 (0.0%) |
| Total | 0 (0.0%) | 0 (0.0%) |
Fertility by Education in North English
| Educational Attainment | Women with Births | Births / 1,000 Women |
| Less than High School | 0 (0.0%) | 0.0 |
| High School Diploma | 0 (0.0%) | 0.0 |
| College or Associate's Degree | 0 (0.0%) | 0.0 |
| Bachelor's Degree | 0 (0.0%) | 0.0 |
| Graduate Degree | 0 (0.0%) | 0.0 |
| Total | 0 (0.0%) | 0.0 |
Fertility by Education by Marriage Status in North English
| Educational Attainment | Married | Unmarried |
| Less than High School | 0 (0.0%) | 0 (0.0%) |
| High School Diploma | 0 (0.0%) | 0 (0.0%) |
| College or Associate's Degree | 0 (0.0%) | 0 (0.0%) |
| Bachelor's Degree | 0 (0.0%) | 0 (0.0%) |
| Graduate Degree | 0 (0.0%) | 0 (0.0%) |
| Total | 0 (0.0%) | 0 (0.0%) |
Employment Characteristics in North English
Employment by Class of Employer in North English
Among the 392 employed individuals in North English, private company employees (236 | 60.2%), self-employed (not incorporated) (41 | 10.5%), and not-for-profit organizations (31 | 7.9%) make up the most common classes of employment.
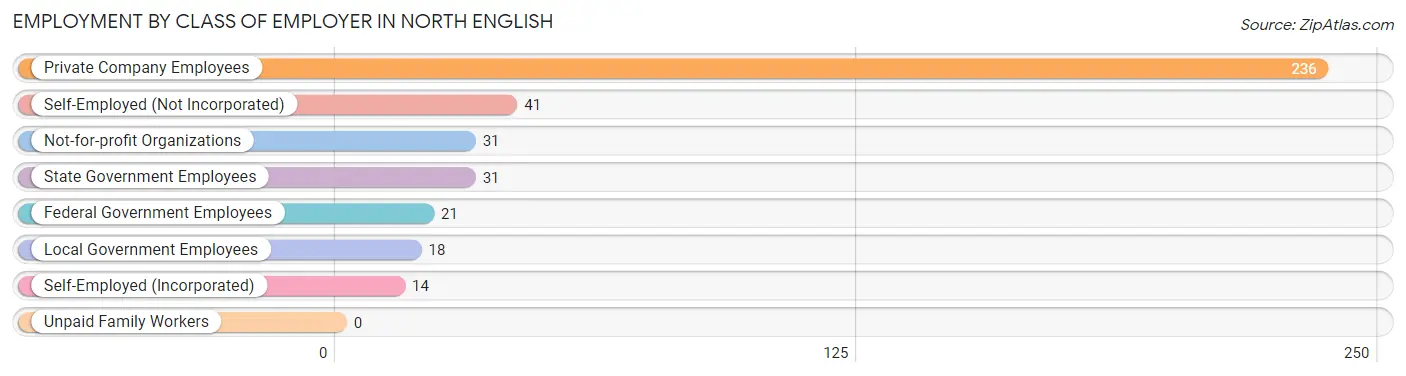
| Employer Class | # Employees | % Employees |
| Private Company Employees | 236 | 60.2% |
| Self-Employed (Incorporated) | 14 | 3.6% |
| Self-Employed (Not Incorporated) | 41 | 10.5% |
| Not-for-profit Organizations | 31 | 7.9% |
| Local Government Employees | 18 | 4.6% |
| State Government Employees | 31 | 7.9% |
| Federal Government Employees | 21 | 5.4% |
| Unpaid Family Workers | 0 | 0.0% |
| Total | 392 | 100.0% |
Employment Status by Age in North English
According to the labor force statistics for North English, out of the total population over 16 years of age (656), 60.5% or 397 individuals are in the labor force, with 1.3% or 5 of them unemployed. The age group with the highest labor force participation rate is 25 to 29 years, with 100.0% or 28 individuals in the labor force. Within the labor force, the 60 to 64 years age range has the highest percentage of unemployed individuals, with 8.1% or 3 of them being unemployed.
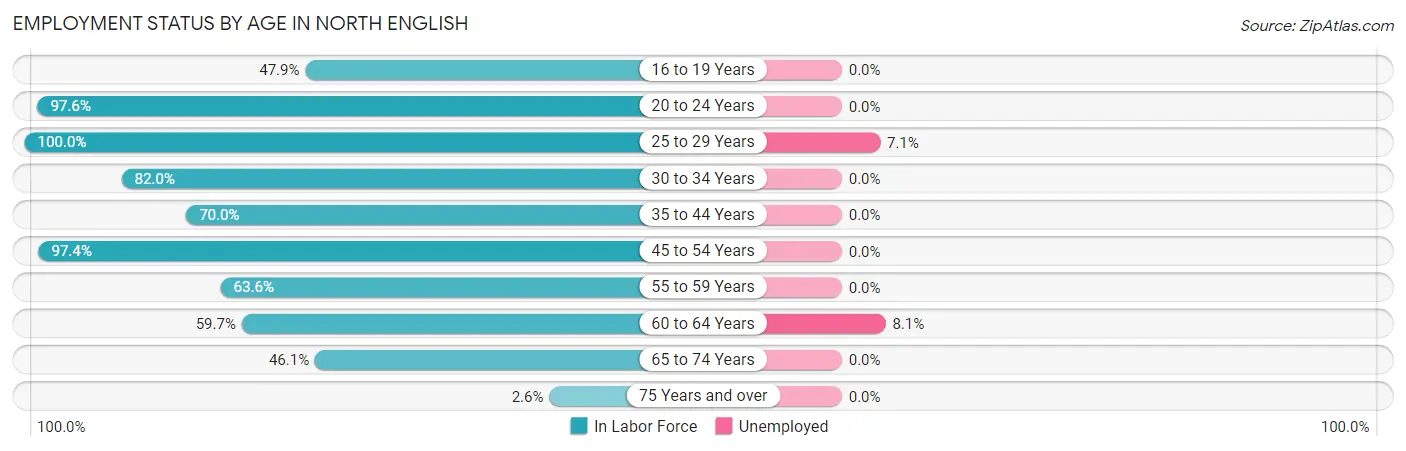
| Age Bracket | In Labor Force | Unemployed |
| 16 to 19 Years | 34 (47.9%) | 0 (0.0%) |
| 20 to 24 Years | 41 (97.6%) | 0 (0.0%) |
| 25 to 29 Years | 28 (100.0%) | 2 (7.1%) |
| 30 to 34 Years | 50 (82.0%) | 0 (0.0%) |
| 35 to 44 Years | 35 (70.0%) | 0 (0.0%) |
| 45 to 54 Years | 113 (97.4%) | 0 (0.0%) |
| 55 to 59 Years | 21 (63.6%) | 0 (0.0%) |
| 60 to 64 Years | 37 (59.7%) | 3 (8.1%) |
| 65 to 74 Years | 35 (46.1%) | 0 (0.0%) |
| 75 Years and over | 3 (2.6%) | 0 (0.0%) |
| Total | 397 (60.5%) | 5 (1.3%) |
Employment Status by Educational Attainment in North English
According to labor force statistics for North English, 81.1% of individuals (284) out of the total population between 25 and 64 years of age (350) are in the labor force, with 1.8% or 5 of them being unemployed. The group with the highest labor force participation rate are those with the educational attainment of bachelor's degree or higher, with 88.9% or 72 individuals in the labor force. Within the labor force, individuals with high school diploma education have the highest percentage of unemployment, with 3.2% or 3 of them being unemployed.
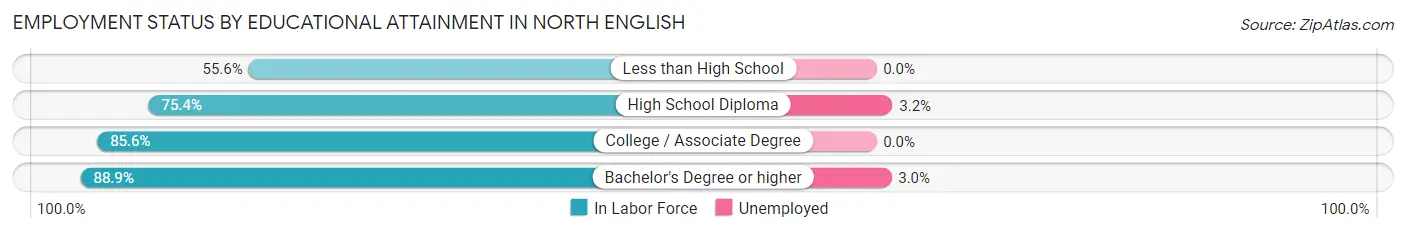
| Educational Attainment | In Labor Force | Unemployed |
| Less than High School | 10 (55.6%) | 0 (0.0%) |
| High School Diploma | 95 (75.4%) | 4 (3.2%) |
| College / Associate Degree | 107 (85.6%) | 0 (0.0%) |
| Bachelor's Degree or higher | 72 (88.9%) | 2 (3.0%) |
| Total | 284 (81.1%) | 6 (1.8%) |
Employment Occupations by Sex in North English
Management, Business, Science and Arts Occupations
The most common Management, Business, Science and Arts occupations in North English are Health Diagnosing & Treating (48 | 12.4%), Health Technologists (35 | 9.0%), Community & Social Service (23 | 5.9%), Education Instruction & Library (19 | 4.9%), and Business & Financial (17 | 4.4%).
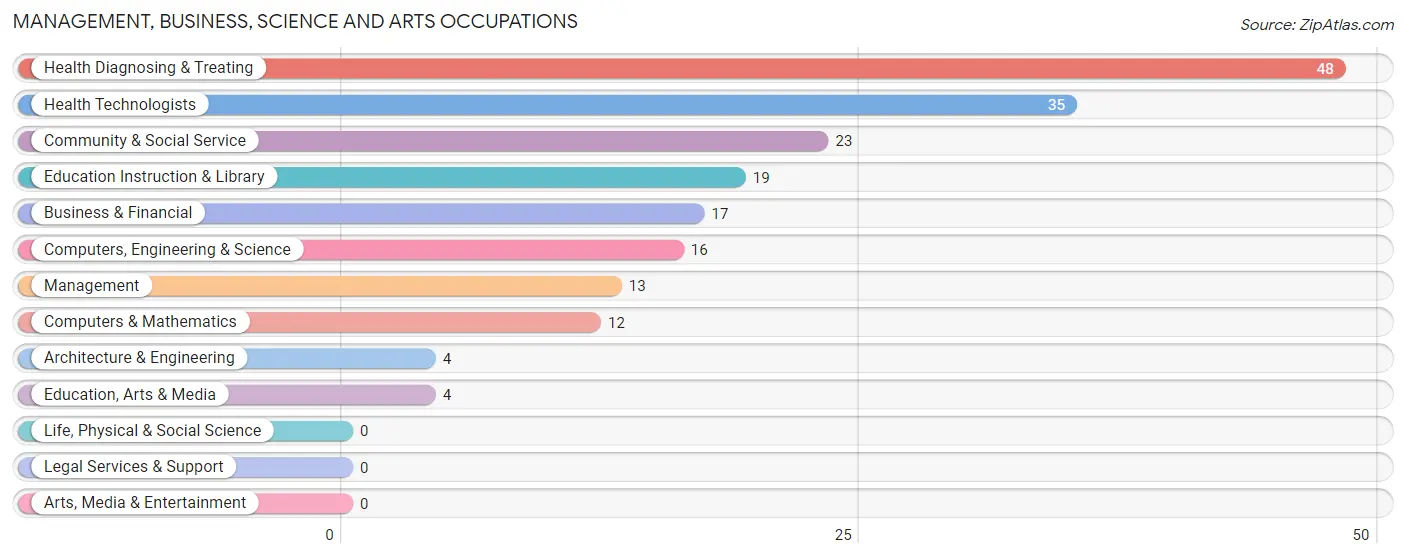
Management, Business, Science and Arts Occupations by Sex
Within the Management, Business, Science and Arts occupations in North English, the most male-oriented occupations are Management (69.2%), Education Instruction & Library (52.6%), and Community & Social Service (43.5%), while the most female-oriented occupations are Architecture & Engineering (100.0%), Education, Arts & Media (100.0%), and Health Diagnosing & Treating (93.8%).
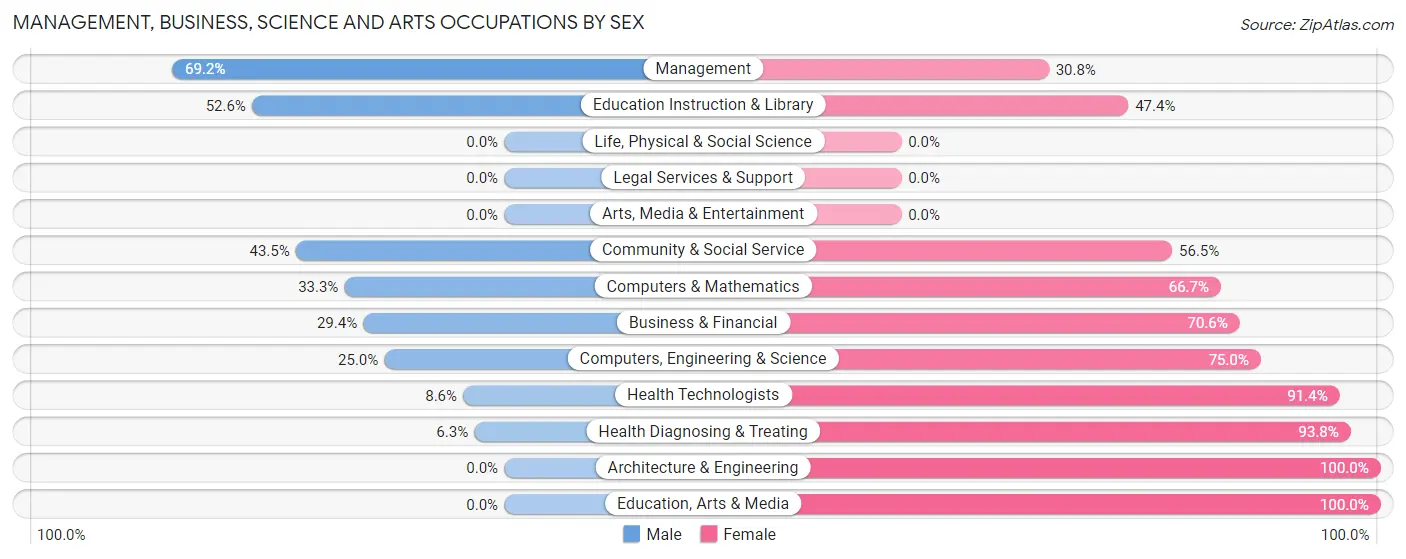
| Occupation | Male | Female |
| Management | 9 (69.2%) | 4 (30.8%) |
| Business & Financial | 5 (29.4%) | 12 (70.6%) |
| Computers, Engineering & Science | 4 (25.0%) | 12 (75.0%) |
| Computers & Mathematics | 4 (33.3%) | 8 (66.7%) |
| Architecture & Engineering | 0 (0.0%) | 4 (100.0%) |
| Life, Physical & Social Science | 0 (0.0%) | 0 (0.0%) |
| Community & Social Service | 10 (43.5%) | 13 (56.5%) |
| Education, Arts & Media | 0 (0.0%) | 4 (100.0%) |
| Legal Services & Support | 0 (0.0%) | 0 (0.0%) |
| Education Instruction & Library | 10 (52.6%) | 9 (47.4%) |
| Arts, Media & Entertainment | 0 (0.0%) | 0 (0.0%) |
| Health Diagnosing & Treating | 3 (6.2%) | 45 (93.8%) |
| Health Technologists | 3 (8.6%) | 32 (91.4%) |
| Total (Category) | 31 (26.5%) | 86 (73.5%) |
| Total (Overall) | 164 (42.4%) | 223 (57.6%) |
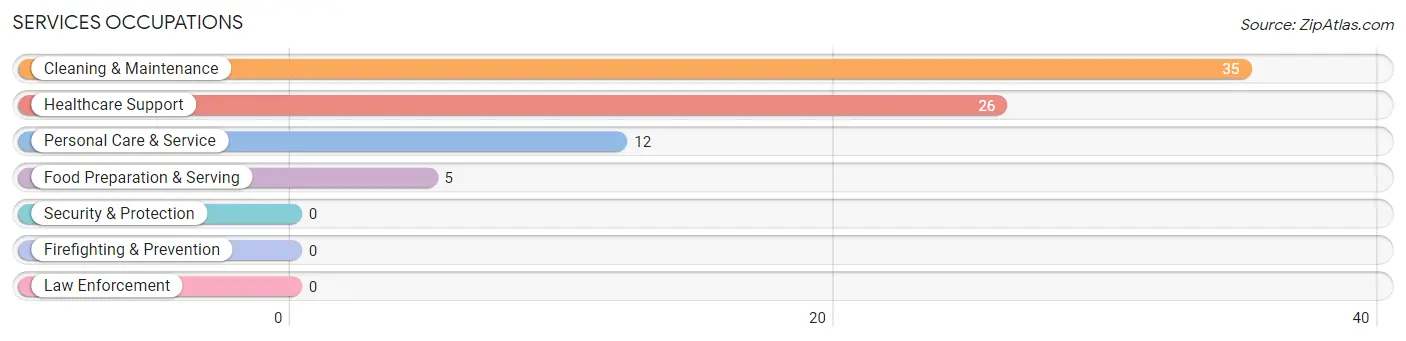
Services Occupations
The most common Services occupations in North English are Cleaning & Maintenance (35 | 9.0%), Healthcare Support (26 | 6.7%), Personal Care & Service (12 | 3.1%), and Food Preparation & Serving (5 | 1.3%).
Services Occupations by Sex
Within the Services occupations in North English, the most male-oriented occupations are Cleaning & Maintenance (51.4%), and Personal Care & Service (41.7%), while the most female-oriented occupations are Healthcare Support (100.0%), Food Preparation & Serving (100.0%), and Personal Care & Service (58.3%).
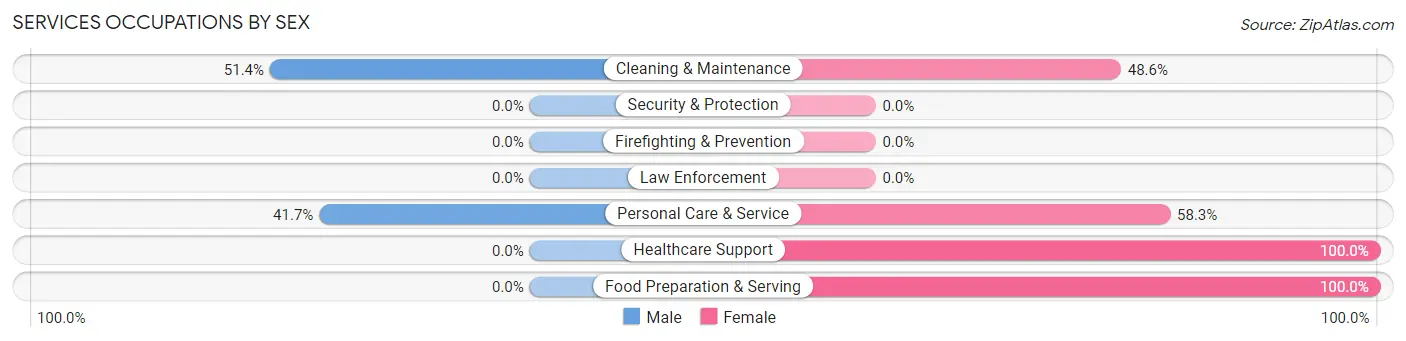
| Occupation | Male | Female |
| Healthcare Support | 0 (0.0%) | 26 (100.0%) |
| Security & Protection | 0 (0.0%) | 0 (0.0%) |
| Firefighting & Prevention | 0 (0.0%) | 0 (0.0%) |
| Law Enforcement | 0 (0.0%) | 0 (0.0%) |
| Food Preparation & Serving | 0 (0.0%) | 5 (100.0%) |
| Cleaning & Maintenance | 18 (51.4%) | 17 (48.6%) |
| Personal Care & Service | 5 (41.7%) | 7 (58.3%) |
| Total (Category) | 23 (29.5%) | 55 (70.5%) |
| Total (Overall) | 164 (42.4%) | 223 (57.6%) |
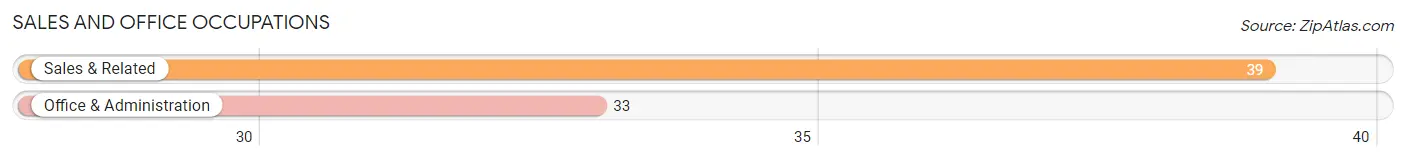
Sales and Office Occupations
The most common Sales and Office occupations in North English are Sales & Related (39 | 10.1%), and Office & Administration (33 | 8.5%).
Sales and Office Occupations by Sex
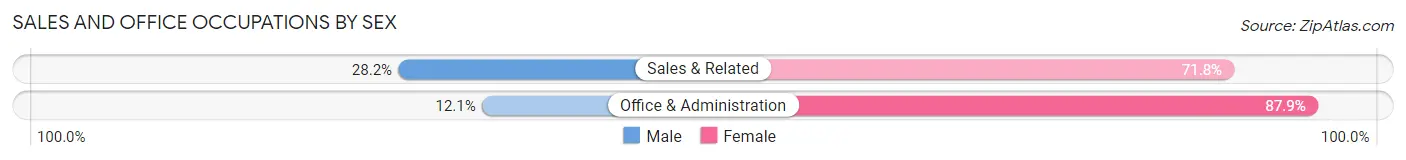
| Occupation | Male | Female |
| Sales & Related | 11 (28.2%) | 28 (71.8%) |
| Office & Administration | 4 (12.1%) | 29 (87.9%) |
| Total (Category) | 15 (20.8%) | 57 (79.2%) |
| Total (Overall) | 164 (42.4%) | 223 (57.6%) |
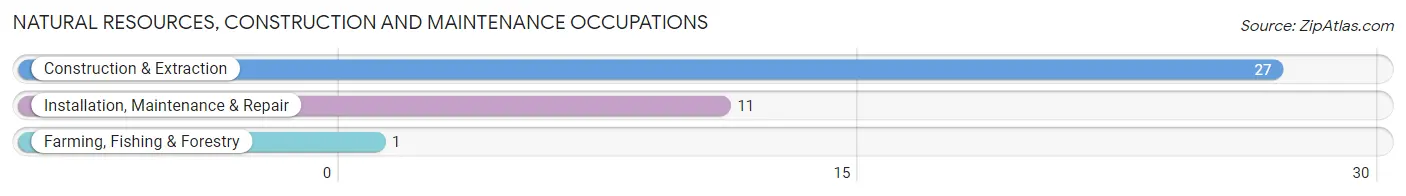
Natural Resources, Construction and Maintenance Occupations
The most common Natural Resources, Construction and Maintenance occupations in North English are Construction & Extraction (27 | 7.0%), Installation, Maintenance & Repair (11 | 2.8%), and Farming, Fishing & Forestry (1 | 0.3%).
Natural Resources, Construction and Maintenance Occupations by Sex
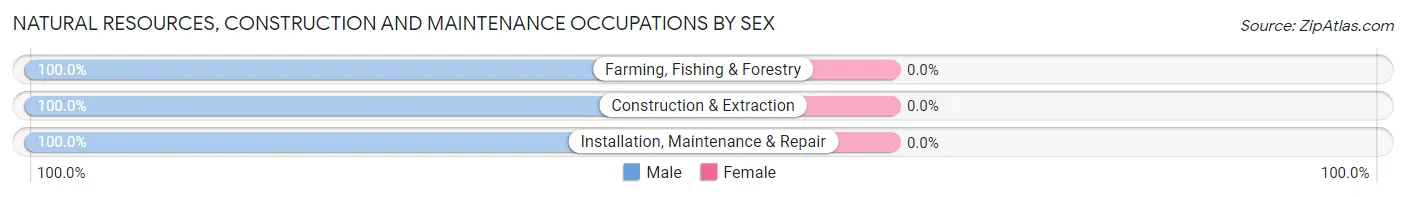
| Occupation | Male | Female |
| Farming, Fishing & Forestry | 1 (100.0%) | 0 (0.0%) |
| Construction & Extraction | 27 (100.0%) | 0 (0.0%) |
| Installation, Maintenance & Repair | 11 (100.0%) | 0 (0.0%) |
| Total (Category) | 39 (100.0%) | 0 (0.0%) |
| Total (Overall) | 164 (42.4%) | 223 (57.6%) |
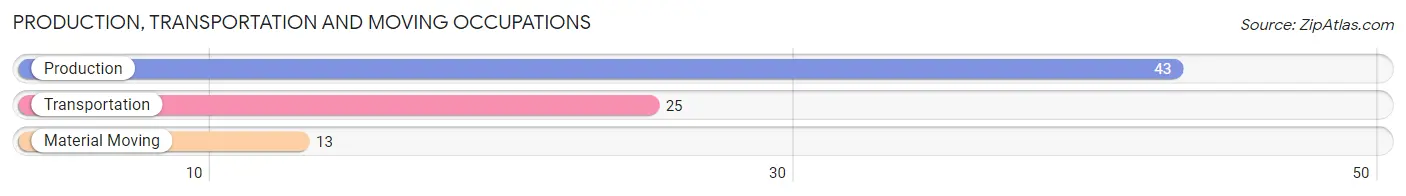
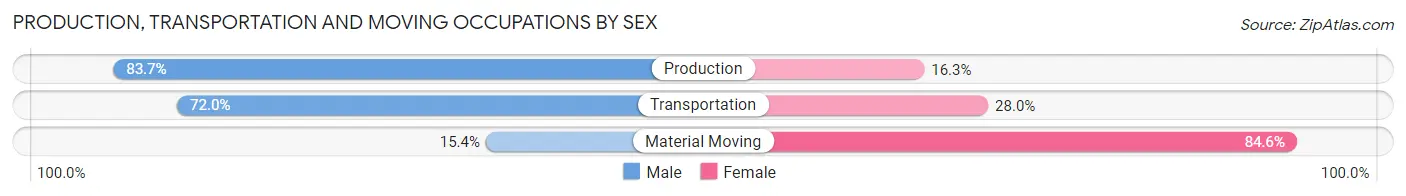
Production, Transportation and Moving Occupations
The most common Production, Transportation and Moving occupations in North English are Production (43 | 11.1%), Transportation (25 | 6.5%), and Material Moving (13 | 3.4%).
Production, Transportation and Moving Occupations by Sex
| Occupation | Male | Female |
| Production | 36 (83.7%) | 7 (16.3%) |
| Transportation | 18 (72.0%) | 7 (28.0%) |
| Material Moving | 2 (15.4%) | 11 (84.6%) |
| Total (Category) | 56 (69.1%) | 25 (30.9%) |
| Total (Overall) | 164 (42.4%) | 223 (57.6%) |
Employment Industries by Sex in North English
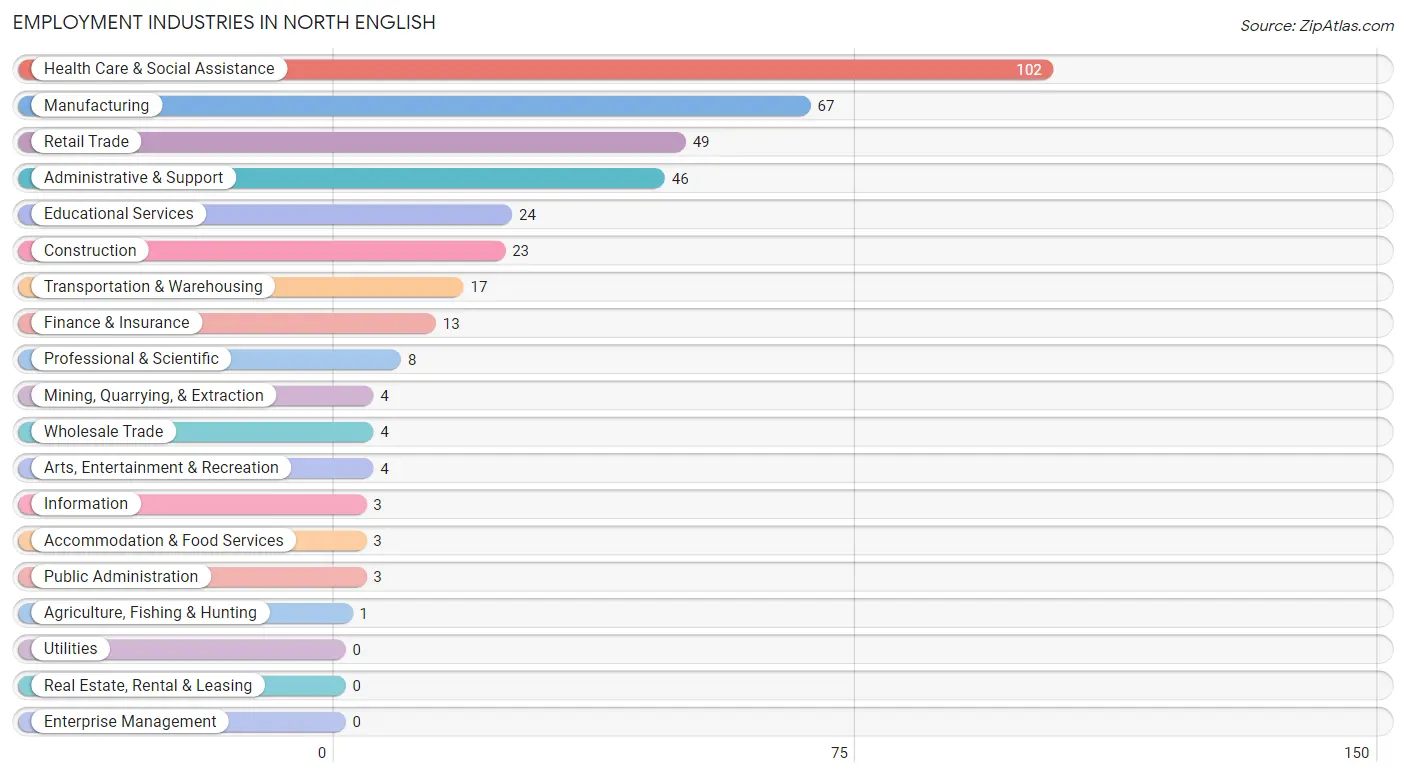
Employment Industries in North English
The major employment industries in North English include Health Care & Social Assistance (102 | 26.4%), Manufacturing (67 | 17.3%), Retail Trade (49 | 12.7%), Administrative & Support (46 | 11.9%), and Educational Services (24 | 6.2%).
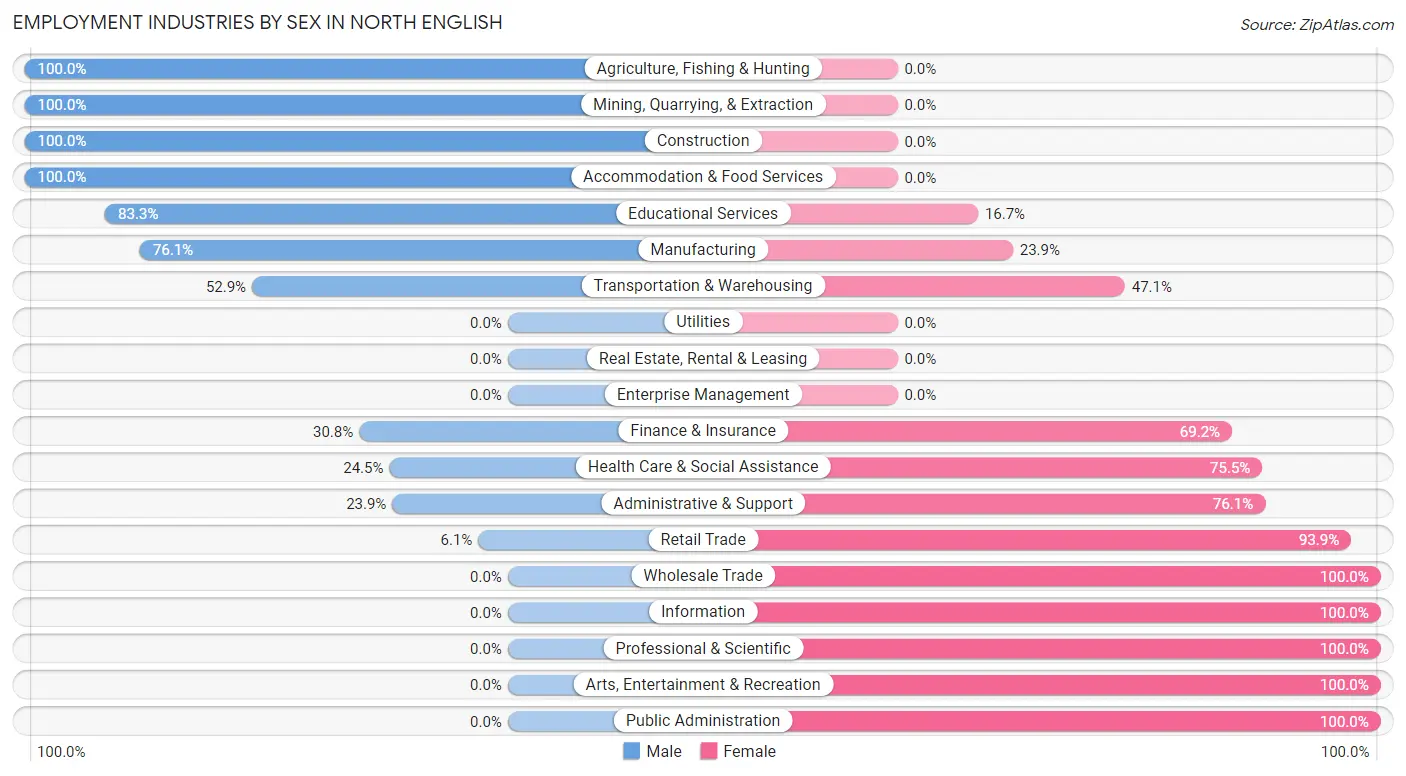
Employment Industries by Sex in North English
The North English industries that see more men than women are Agriculture, Fishing & Hunting (100.0%), Mining, Quarrying, & Extraction (100.0%), and Construction (100.0%), whereas the industries that tend to have a higher number of women are Wholesale Trade (100.0%), Information (100.0%), and Professional & Scientific (100.0%).
| Industry | Male | Female |
| Agriculture, Fishing & Hunting | 1 (100.0%) | 0 (0.0%) |
| Mining, Quarrying, & Extraction | 4 (100.0%) | 0 (0.0%) |
| Construction | 23 (100.0%) | 0 (0.0%) |
| Manufacturing | 51 (76.1%) | 16 (23.9%) |
| Wholesale Trade | 0 (0.0%) | 4 (100.0%) |
| Retail Trade | 3 (6.1%) | 46 (93.9%) |
| Transportation & Warehousing | 9 (52.9%) | 8 (47.1%) |
| Utilities | 0 (0.0%) | 0 (0.0%) |
| Information | 0 (0.0%) | 3 (100.0%) |
| Finance & Insurance | 4 (30.8%) | 9 (69.2%) |
| Real Estate, Rental & Leasing | 0 (0.0%) | 0 (0.0%) |
| Professional & Scientific | 0 (0.0%) | 8 (100.0%) |
| Enterprise Management | 0 (0.0%) | 0 (0.0%) |
| Administrative & Support | 11 (23.9%) | 35 (76.1%) |
| Educational Services | 20 (83.3%) | 4 (16.7%) |
| Health Care & Social Assistance | 25 (24.5%) | 77 (75.5%) |
| Arts, Entertainment & Recreation | 0 (0.0%) | 4 (100.0%) |
| Accommodation & Food Services | 3 (100.0%) | 0 (0.0%) |
| Public Administration | 0 (0.0%) | 3 (100.0%) |
| Total | 164 (42.4%) | 223 (57.6%) |
Education in North English
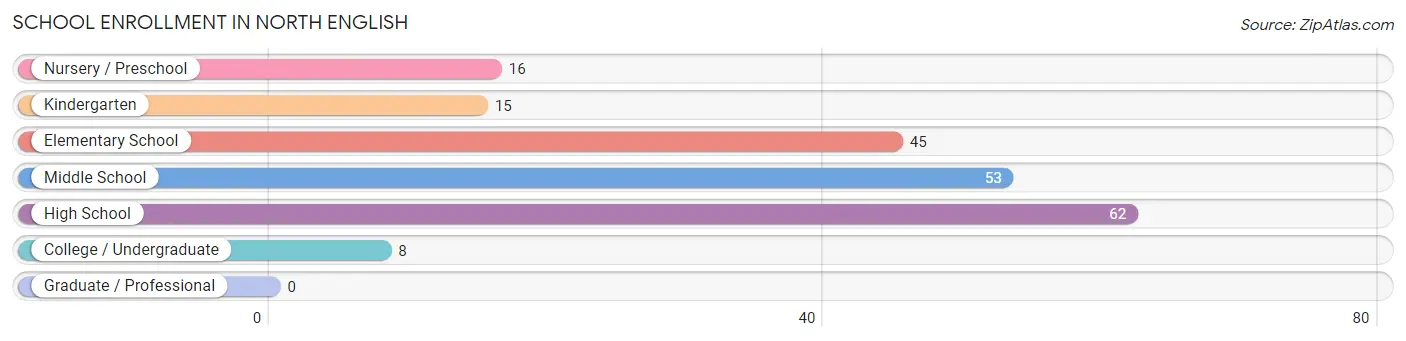
School Enrollment in North English
The most common levels of schooling among the 199 students in North English are high school (62 | 31.2%), middle school (53 | 26.6%), and elementary school (45 | 22.6%).
| School Level | # Students | % Students |
| Nursery / Preschool | 16 | 8.0% |
| Kindergarten | 15 | 7.5% |
| Elementary School | 45 | 22.6% |
| Middle School | 53 | 26.6% |
| High School | 62 | 31.2% |
| College / Undergraduate | 8 | 4.0% |
| Graduate / Professional | 0 | 0.0% |
| Total | 199 | 100.0% |
School Enrollment by Age by Funding Source in North English
Out of a total of 199 students who are enrolled in schools in North English, 5 (2.5%) attend a private institution, while the remaining 194 (97.5%) are enrolled in public schools. The age group of 5 to 9 year old has the highest likelihood of being enrolled in private schools, with 5 (8.1% in the age bracket) enrolled. Conversely, the age group of 3 to 4 year olds has the lowest likelihood of being enrolled in a private school, with 14 (100.0% in the age bracket) attending a public institution.
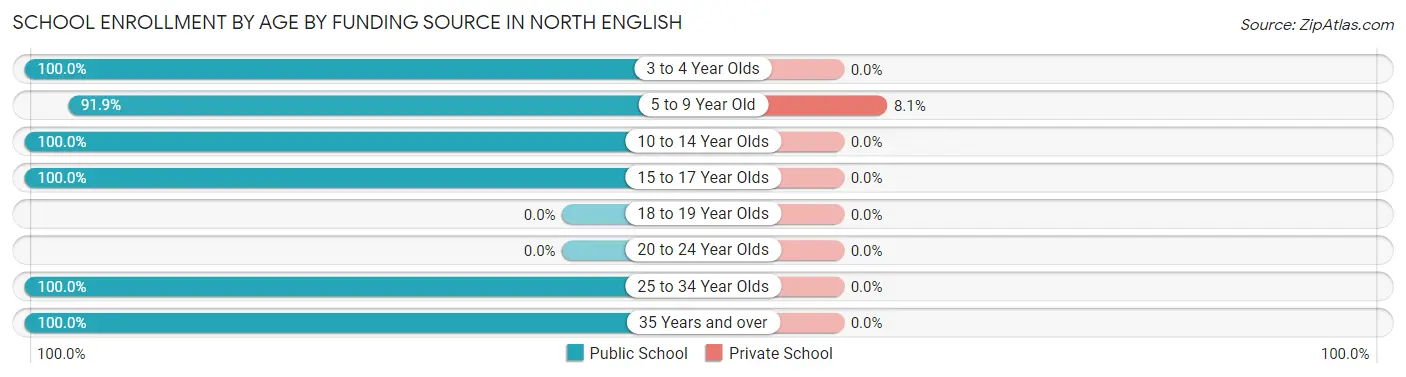
| Age Bracket | Public School | Private School |
| 3 to 4 Year Olds | 14 (100.0%) | 0 (0.0%) |
| 5 to 9 Year Old | 57 (91.9%) | 5 (8.1%) |
| 10 to 14 Year Olds | 56 (100.0%) | 0 (0.0%) |
| 15 to 17 Year Olds | 59 (100.0%) | 0 (0.0%) |
| 18 to 19 Year Olds | 0 (0.0%) | 0 (0.0%) |
| 20 to 24 Year Olds | 0 (0.0%) | 0 (0.0%) |
| 25 to 34 Year Olds | 3 (100.0%) | 0 (0.0%) |
| 35 Years and over | 5 (100.0%) | 0 (0.0%) |
| Total | 194 (97.5%) | 5 (2.5%) |
Educational Attainment by Field of Study in North English
Business (34 | 34.0%), education (23 | 23.0%), visual & performing arts (14 | 14.0%), bio, nature & agricultural (10 | 10.0%), and psychology (3 | 3.0%) are the most common fields of study among 100 individuals in North English who have obtained a bachelor's degree or higher.
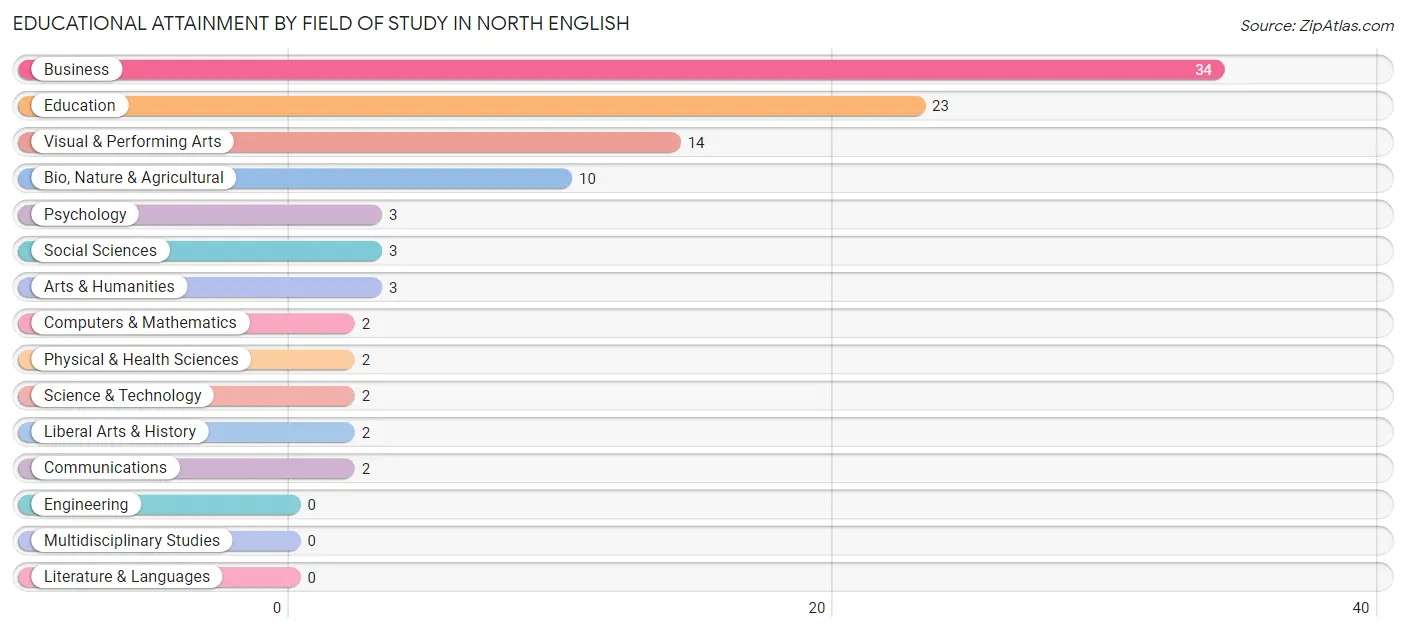
| Field of Study | # Graduates | % Graduates |
| Computers & Mathematics | 2 | 2.0% |
| Bio, Nature & Agricultural | 10 | 10.0% |
| Physical & Health Sciences | 2 | 2.0% |
| Psychology | 3 | 3.0% |
| Social Sciences | 3 | 3.0% |
| Engineering | 0 | 0.0% |
| Multidisciplinary Studies | 0 | 0.0% |
| Science & Technology | 2 | 2.0% |
| Business | 34 | 34.0% |
| Education | 23 | 23.0% |
| Literature & Languages | 0 | 0.0% |
| Liberal Arts & History | 2 | 2.0% |
| Visual & Performing Arts | 14 | 14.0% |
| Communications | 2 | 2.0% |
| Arts & Humanities | 3 | 3.0% |
| Total | 100 | 100.0% |
Transportation & Commute in North English
Vehicle Availability by Sex in North English
The most prevalent vehicle ownership categories in North English are males with 2 vehicles (54, accounting for 32.0%) and females with 2 vehicles (61, making up 24.2%).
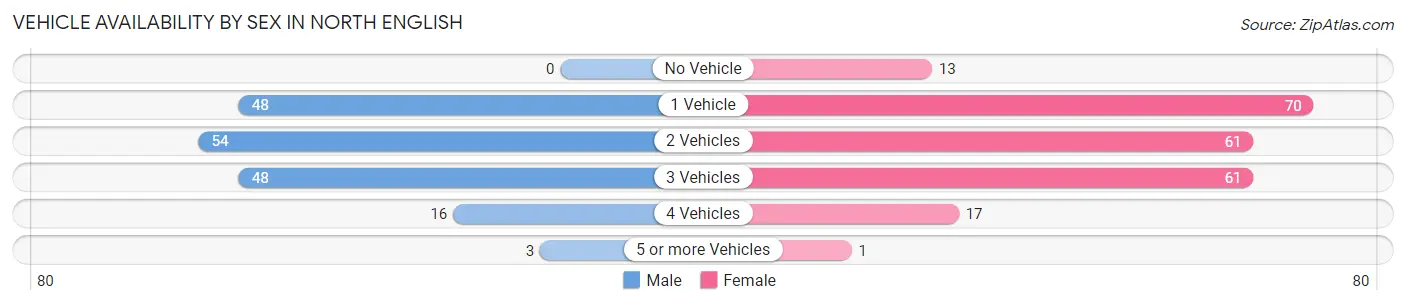
| Vehicles Available | Male | Female |
| No Vehicle | 0 (0.0%) | 13 (5.8%) |
| 1 Vehicle | 48 (28.4%) | 70 (31.4%) |
| 2 Vehicles | 54 (32.0%) | 61 (27.4%) |
| 3 Vehicles | 48 (28.4%) | 61 (27.4%) |
| 4 Vehicles | 16 (9.5%) | 17 (7.6%) |
| 5 or more Vehicles | 3 (1.8%) | 1 (0.4%) |
| Total | 169 (100.0%) | 223 (100.0%) |
Commute Time in North English
The most frequently occuring commute durations in North English are 20 to 24 minutes (76 commuters, 21.4%), 45 to 59 minutes (53 commuters, 14.9%), and 25 to 29 minutes (41 commuters, 11.6%).
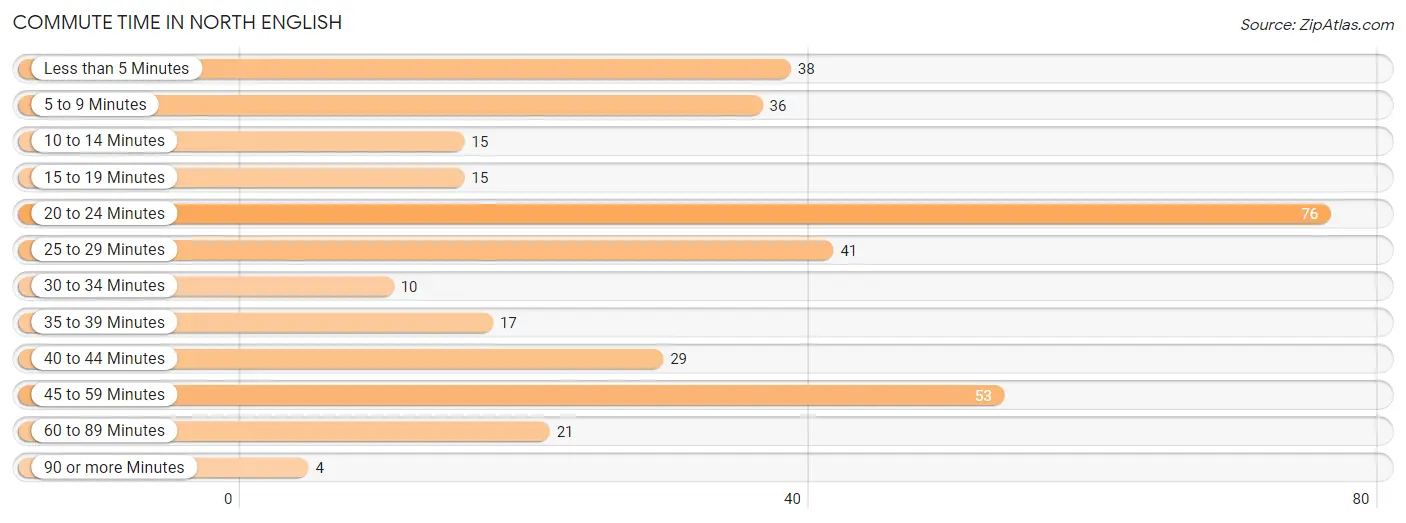
| Commute Time | # Commuters | % Commuters |
| Less than 5 Minutes | 38 | 10.7% |
| 5 to 9 Minutes | 36 | 10.1% |
| 10 to 14 Minutes | 15 | 4.2% |
| 15 to 19 Minutes | 15 | 4.2% |
| 20 to 24 Minutes | 76 | 21.4% |
| 25 to 29 Minutes | 41 | 11.6% |
| 30 to 34 Minutes | 10 | 2.8% |
| 35 to 39 Minutes | 17 | 4.8% |
| 40 to 44 Minutes | 29 | 8.2% |
| 45 to 59 Minutes | 53 | 14.9% |
| 60 to 89 Minutes | 21 | 5.9% |
| 90 or more Minutes | 4 | 1.1% |
Commute Time by Sex in North English
The most common commute times in North English are 20 to 24 minutes (38 commuters, 23.5%) for males and 20 to 24 minutes (38 commuters, 19.7%) for females.
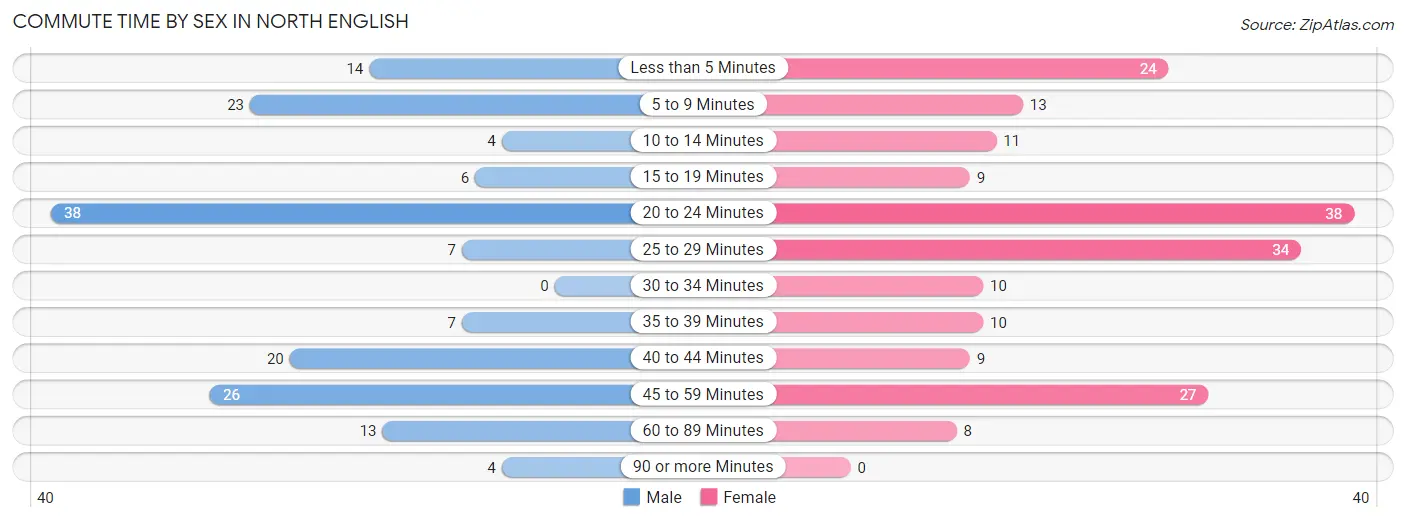
| Commute Time | Male | Female |
| Less than 5 Minutes | 14 (8.6%) | 24 (12.4%) |
| 5 to 9 Minutes | 23 (14.2%) | 13 (6.7%) |
| 10 to 14 Minutes | 4 (2.5%) | 11 (5.7%) |
| 15 to 19 Minutes | 6 (3.7%) | 9 (4.7%) |
| 20 to 24 Minutes | 38 (23.5%) | 38 (19.7%) |
| 25 to 29 Minutes | 7 (4.3%) | 34 (17.6%) |
| 30 to 34 Minutes | 0 (0.0%) | 10 (5.2%) |
| 35 to 39 Minutes | 7 (4.3%) | 10 (5.2%) |
| 40 to 44 Minutes | 20 (12.3%) | 9 (4.7%) |
| 45 to 59 Minutes | 26 (16.1%) | 27 (14.0%) |
| 60 to 89 Minutes | 13 (8.0%) | 8 (4.2%) |
| 90 or more Minutes | 4 (2.5%) | 0 (0.0%) |
Time of Departure to Work by Sex in North English
The most frequent times of departure to work in North English are 5:30 AM to 5:59 AM (30, 18.5%) for males and 6:00 AM to 6:29 AM (31, 16.1%) for females.
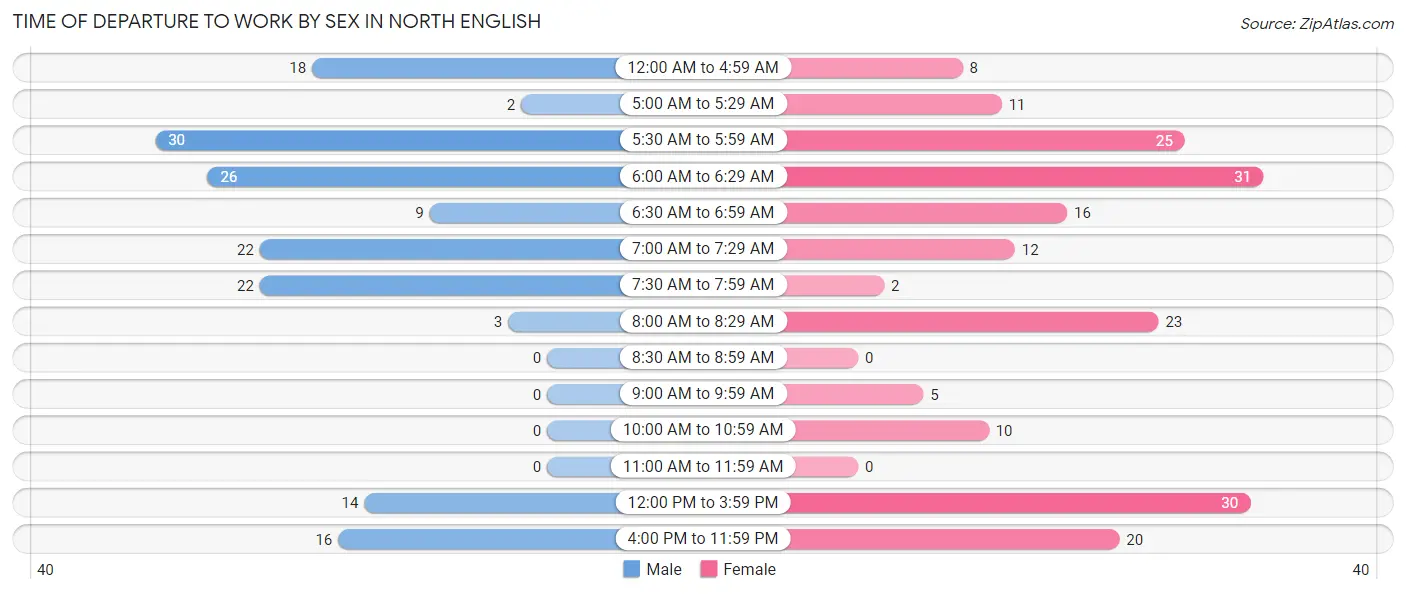
| Time of Departure | Male | Female |
| 12:00 AM to 4:59 AM | 18 (11.1%) | 8 (4.2%) |
| 5:00 AM to 5:29 AM | 2 (1.2%) | 11 (5.7%) |
| 5:30 AM to 5:59 AM | 30 (18.5%) | 25 (13.0%) |
| 6:00 AM to 6:29 AM | 26 (16.1%) | 31 (16.1%) |
| 6:30 AM to 6:59 AM | 9 (5.6%) | 16 (8.3%) |
| 7:00 AM to 7:29 AM | 22 (13.6%) | 12 (6.2%) |
| 7:30 AM to 7:59 AM | 22 (13.6%) | 2 (1.0%) |
| 8:00 AM to 8:29 AM | 3 (1.8%) | 23 (11.9%) |
| 8:30 AM to 8:59 AM | 0 (0.0%) | 0 (0.0%) |
| 9:00 AM to 9:59 AM | 0 (0.0%) | 5 (2.6%) |
| 10:00 AM to 10:59 AM | 0 (0.0%) | 10 (5.2%) |
| 11:00 AM to 11:59 AM | 0 (0.0%) | 0 (0.0%) |
| 12:00 PM to 3:59 PM | 14 (8.6%) | 30 (15.5%) |
| 4:00 PM to 11:59 PM | 16 (9.9%) | 20 (10.4%) |
| Total | 162 (100.0%) | 193 (100.0%) |
Housing Occupancy in North English
Occupancy by Ownership in North English
Of the total 353 dwellings in North English, owner-occupied units account for 238 (67.4%), while renter-occupied units make up 115 (32.6%).
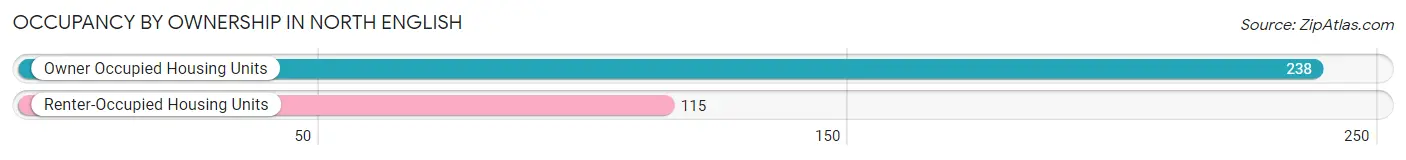
| Occupancy | # Housing Units | % Housing Units |
| Owner Occupied Housing Units | 238 | 67.4% |
| Renter-Occupied Housing Units | 115 | 32.6% |
| Total Occupied Housing Units | 353 | 100.0% |
Occupancy by Household Size in North English
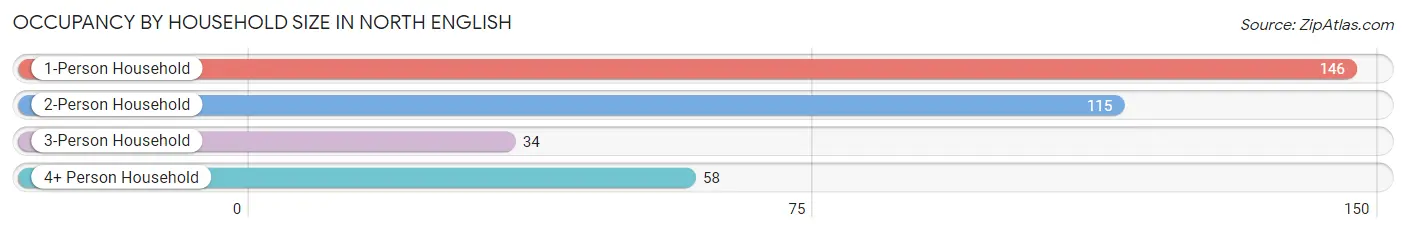
| Household Size | # Housing Units | % Housing Units |
| 1-Person Household | 146 | 41.4% |
| 2-Person Household | 115 | 32.6% |
| 3-Person Household | 34 | 9.6% |
| 4+ Person Household | 58 | 16.4% |
| Total Housing Units | 353 | 100.0% |
Occupancy by Ownership by Household Size in North English
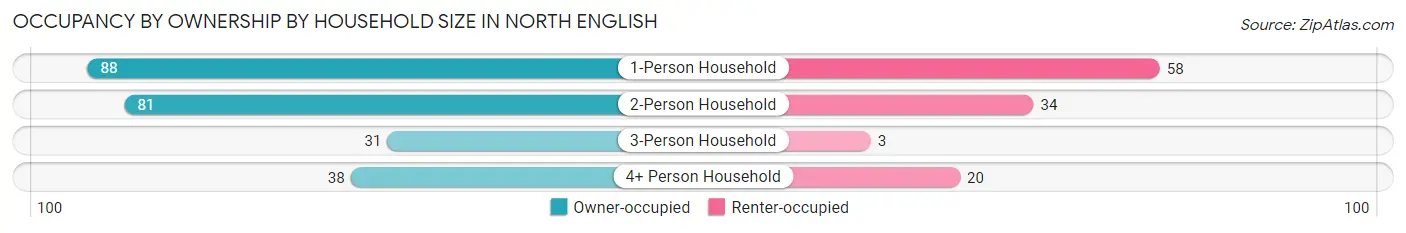
| Household Size | Owner-occupied | Renter-occupied |
| 1-Person Household | 88 (60.3%) | 58 (39.7%) |
| 2-Person Household | 81 (70.4%) | 34 (29.6%) |
| 3-Person Household | 31 (91.2%) | 3 (8.8%) |
| 4+ Person Household | 38 (65.5%) | 20 (34.5%) |
| Total Housing Units | 238 (67.4%) | 115 (32.6%) |
Occupancy by Educational Attainment in North English
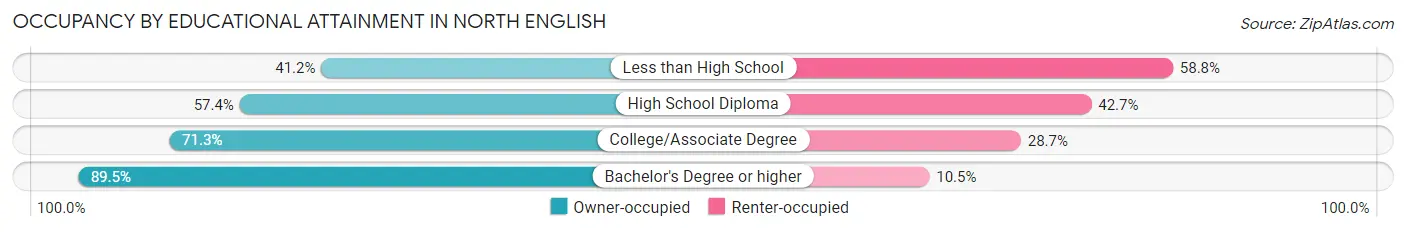
| Household Size | Owner-occupied | Renter-occupied |
| Less than High School | 7 (41.2%) | 10 (58.8%) |
| High School Diploma | 78 (57.4%) | 58 (42.6%) |
| College/Associate Degree | 102 (71.3%) | 41 (28.7%) |
| Bachelor's Degree or higher | 51 (89.5%) | 6 (10.5%) |
Occupancy by Age of Householder in North English
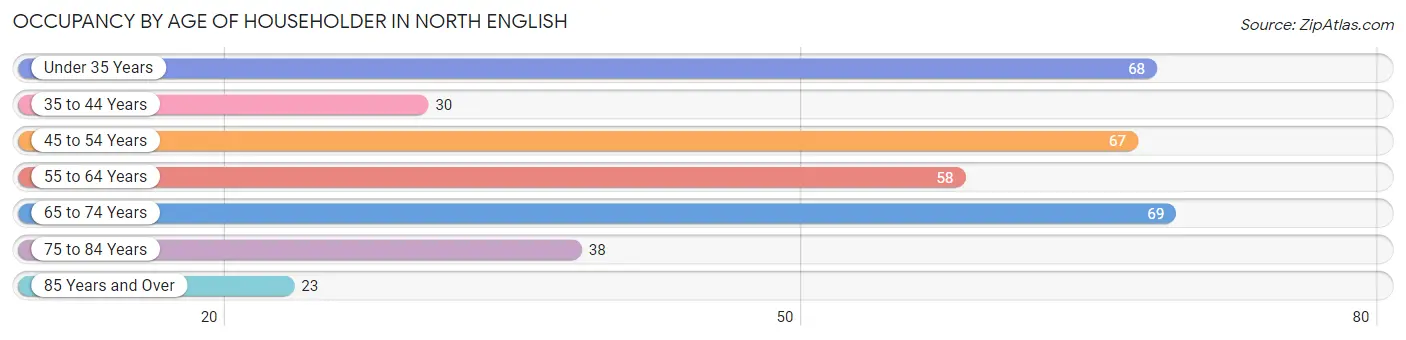
| Age Bracket | # Households | % Households |
| Under 35 Years | 68 | 19.3% |
| 35 to 44 Years | 30 | 8.5% |
| 45 to 54 Years | 67 | 19.0% |
| 55 to 64 Years | 58 | 16.4% |
| 65 to 74 Years | 69 | 19.6% |
| 75 to 84 Years | 38 | 10.8% |
| 85 Years and Over | 23 | 6.5% |
| Total | 353 | 100.0% |
Housing Finances in North English
Median Income by Occupancy in North English
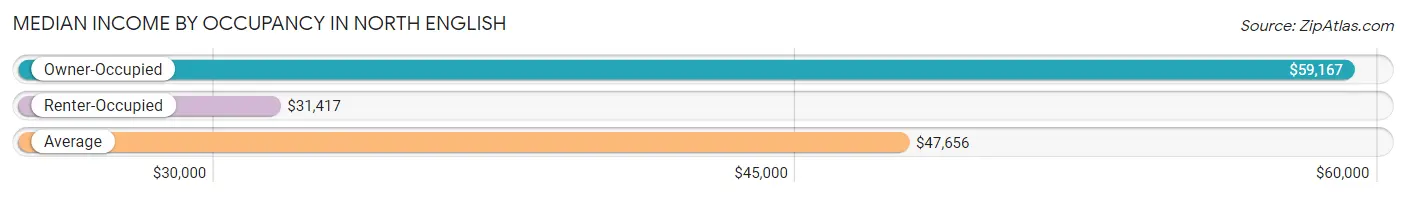
| Occupancy Type | # Households | Median Income |
| Owner-Occupied | 238 (67.4%) | $59,167 |
| Renter-Occupied | 115 (32.6%) | $31,417 |
| Average | 353 (100.0%) | $47,656 |
Occupancy by Householder Income Bracket in North English
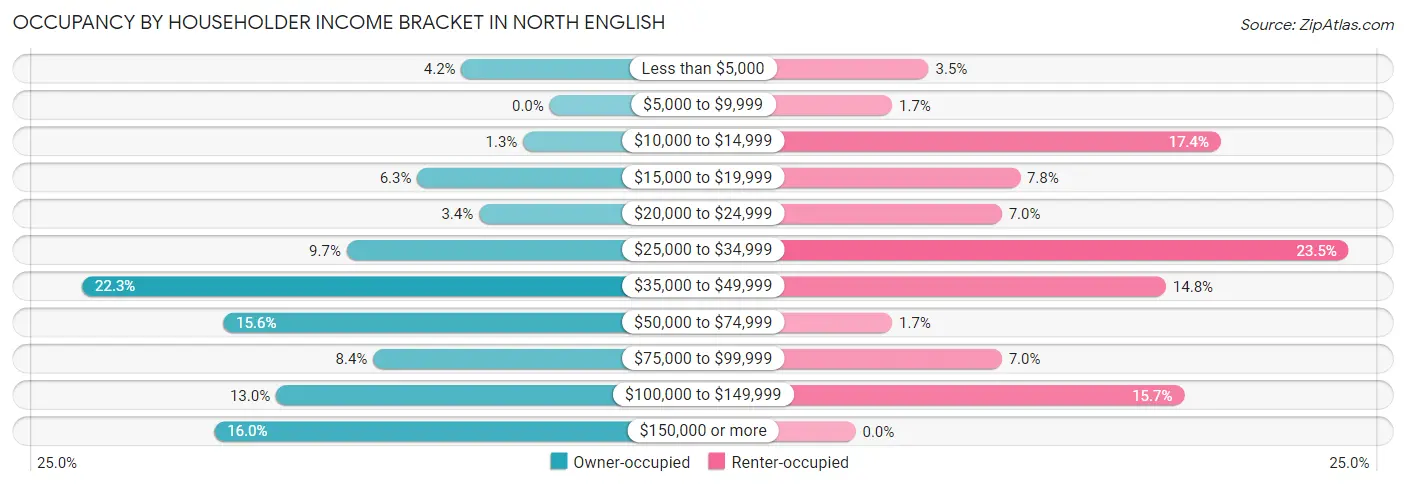
| Income Bracket | Owner-occupied | Renter-occupied |
| Less than $5,000 | 10 (4.2%) | 4 (3.5%) |
| $5,000 to $9,999 | 0 (0.0%) | 2 (1.7%) |
| $10,000 to $14,999 | 3 (1.3%) | 20 (17.4%) |
| $15,000 to $19,999 | 15 (6.3%) | 9 (7.8%) |
| $20,000 to $24,999 | 8 (3.4%) | 8 (7.0%) |
| $25,000 to $34,999 | 23 (9.7%) | 27 (23.5%) |
| $35,000 to $49,999 | 53 (22.3%) | 17 (14.8%) |
| $50,000 to $74,999 | 37 (15.5%) | 2 (1.7%) |
| $75,000 to $99,999 | 20 (8.4%) | 8 (7.0%) |
| $100,000 to $149,999 | 31 (13.0%) | 18 (15.7%) |
| $150,000 or more | 38 (16.0%) | 0 (0.0%) |
| Total | 238 (100.0%) | 115 (100.0%) |
Monthly Housing Cost Tiers in North English
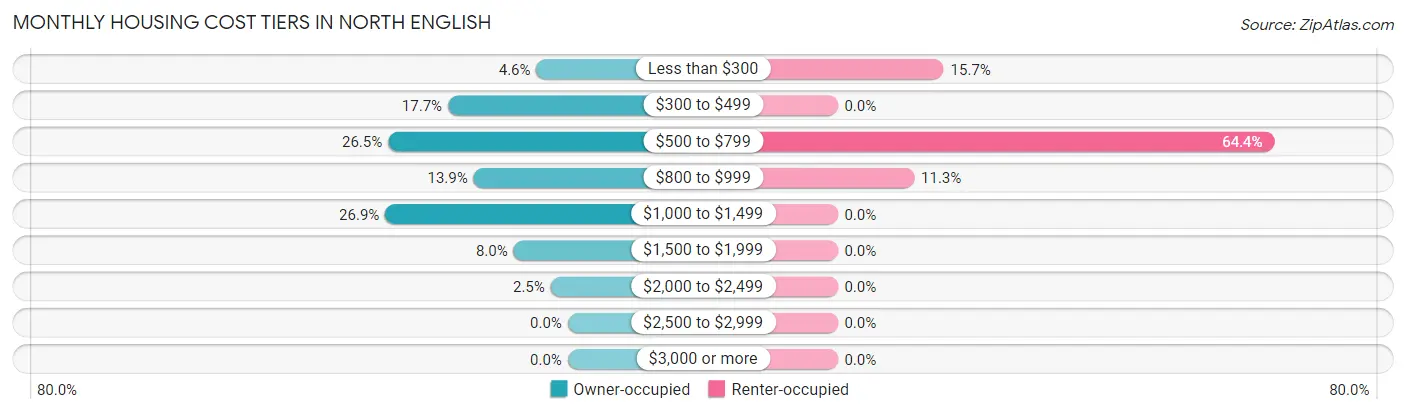
| Monthly Cost | Owner-occupied | Renter-occupied |
| Less than $300 | 11 (4.6%) | 18 (15.7%) |
| $300 to $499 | 42 (17.6%) | 0 (0.0%) |
| $500 to $799 | 63 (26.5%) | 74 (64.3%) |
| $800 to $999 | 33 (13.9%) | 13 (11.3%) |
| $1,000 to $1,499 | 64 (26.9%) | 0 (0.0%) |
| $1,500 to $1,999 | 19 (8.0%) | 0 (0.0%) |
| $2,000 to $2,499 | 6 (2.5%) | 0 (0.0%) |
| $2,500 to $2,999 | 0 (0.0%) | 0 (0.0%) |
| $3,000 or more | 0 (0.0%) | 0 (0.0%) |
| Total | 238 (100.0%) | 115 (100.0%) |
Physical Housing Characteristics in North English
Housing Structures in North English
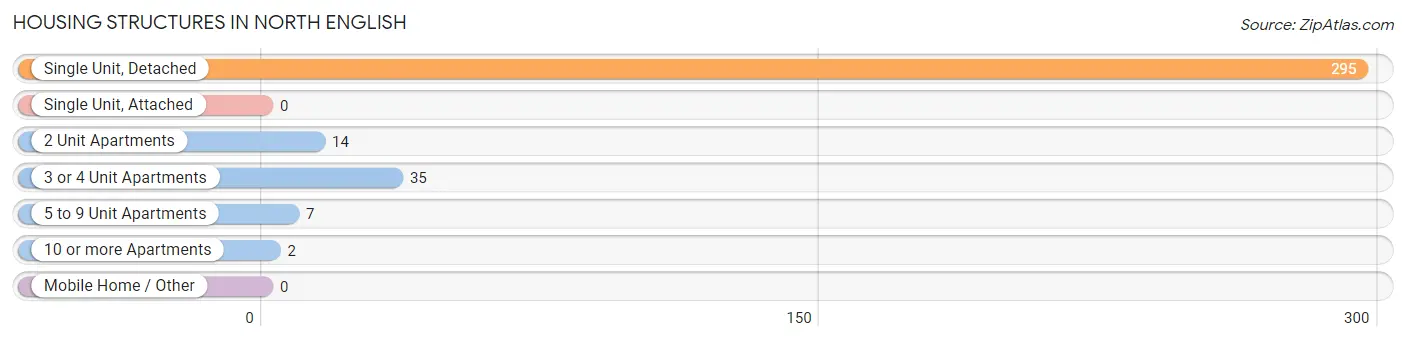
| Structure Type | # Housing Units | % Housing Units |
| Single Unit, Detached | 295 | 83.6% |
| Single Unit, Attached | 0 | 0.0% |
| 2 Unit Apartments | 14 | 4.0% |
| 3 or 4 Unit Apartments | 35 | 9.9% |
| 5 to 9 Unit Apartments | 7 | 2.0% |
| 10 or more Apartments | 2 | 0.6% |
| Mobile Home / Other | 0 | 0.0% |
| Total | 353 | 100.0% |
Housing Structures by Occupancy in North English
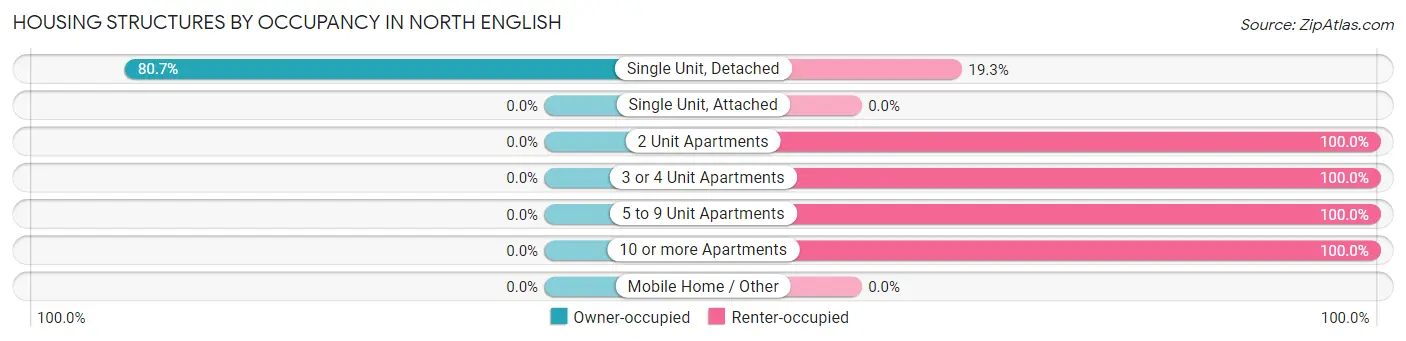
| Structure Type | Owner-occupied | Renter-occupied |
| Single Unit, Detached | 238 (80.7%) | 57 (19.3%) |
| Single Unit, Attached | 0 (0.0%) | 0 (0.0%) |
| 2 Unit Apartments | 0 (0.0%) | 14 (100.0%) |
| 3 or 4 Unit Apartments | 0 (0.0%) | 35 (100.0%) |
| 5 to 9 Unit Apartments | 0 (0.0%) | 7 (100.0%) |
| 10 or more Apartments | 0 (0.0%) | 2 (100.0%) |
| Mobile Home / Other | 0 (0.0%) | 0 (0.0%) |
| Total | 238 (67.4%) | 115 (32.6%) |
Housing Structures by Number of Rooms in North English
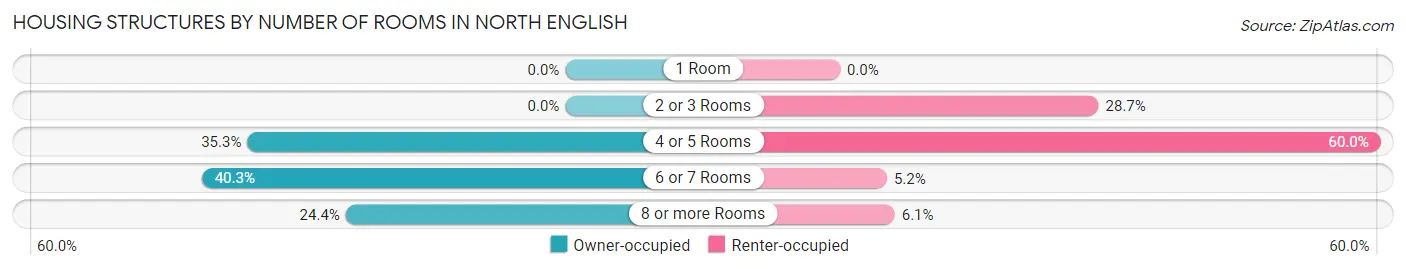
| Number of Rooms | Owner-occupied | Renter-occupied |
| 1 Room | 0 (0.0%) | 0 (0.0%) |
| 2 or 3 Rooms | 0 (0.0%) | 33 (28.7%) |
| 4 or 5 Rooms | 84 (35.3%) | 69 (60.0%) |
| 6 or 7 Rooms | 96 (40.3%) | 6 (5.2%) |
| 8 or more Rooms | 58 (24.4%) | 7 (6.1%) |
| Total | 238 (100.0%) | 115 (100.0%) |
Housing Structure by Heating Type in North English
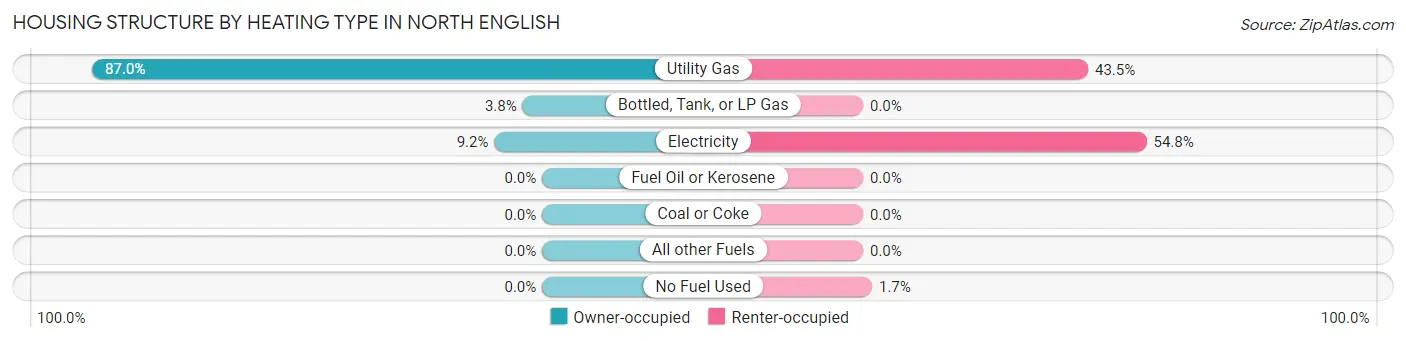
| Heating Type | Owner-occupied | Renter-occupied |
| Utility Gas | 207 (87.0%) | 50 (43.5%) |
| Bottled, Tank, or LP Gas | 9 (3.8%) | 0 (0.0%) |
| Electricity | 22 (9.2%) | 63 (54.8%) |
| Fuel Oil or Kerosene | 0 (0.0%) | 0 (0.0%) |
| Coal or Coke | 0 (0.0%) | 0 (0.0%) |
| All other Fuels | 0 (0.0%) | 0 (0.0%) |
| No Fuel Used | 0 (0.0%) | 2 (1.7%) |
| Total | 238 (100.0%) | 115 (100.0%) |
Household Vehicle Usage in North English
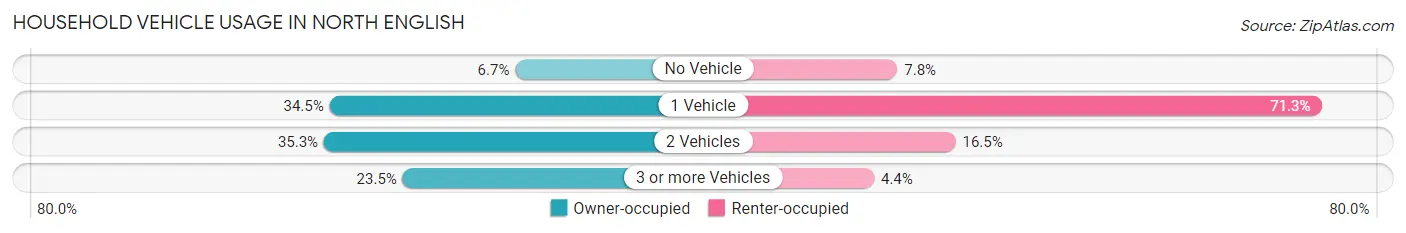
| Vehicles per Household | Owner-occupied | Renter-occupied |
| No Vehicle | 16 (6.7%) | 9 (7.8%) |
| 1 Vehicle | 82 (34.4%) | 82 (71.3%) |
| 2 Vehicles | 84 (35.3%) | 19 (16.5%) |
| 3 or more Vehicles | 56 (23.5%) | 5 (4.3%) |
| Total | 238 (100.0%) | 115 (100.0%) |
Real Estate & Mortgages in North English
Real Estate and Mortgage Overview in North English
| Characteristic | Without Mortgage | With Mortgage |
| Housing Units | 108 | 130 |
| Median Property Value | $80,000 | $110,300 |
| Median Household Income | $40,000 | $30 |
| Monthly Housing Costs | $504 | $0 |
| Real Estate Taxes | $1,214 | $2 |
Property Value by Mortgage Status in North English
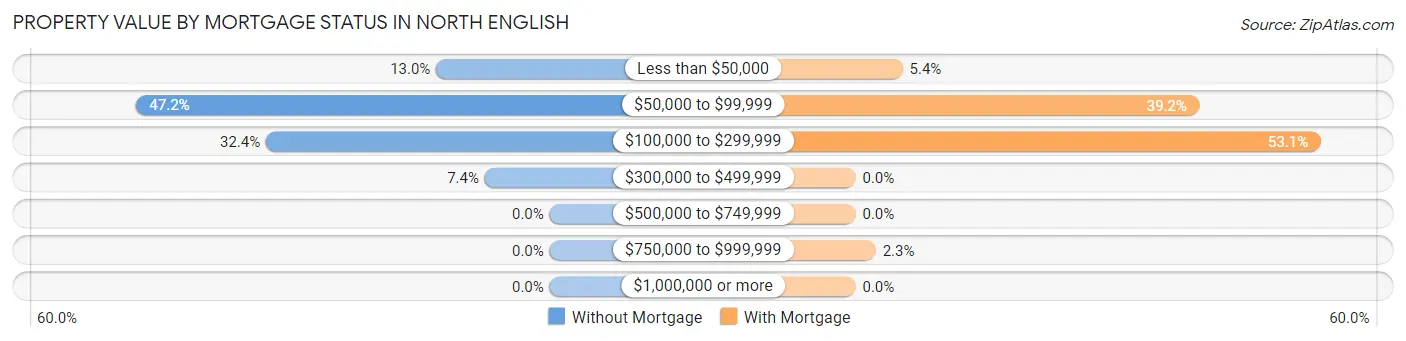
| Property Value | Without Mortgage | With Mortgage |
| Less than $50,000 | 14 (13.0%) | 7 (5.4%) |
| $50,000 to $99,999 | 51 (47.2%) | 51 (39.2%) |
| $100,000 to $299,999 | 35 (32.4%) | 69 (53.1%) |
| $300,000 to $499,999 | 8 (7.4%) | 0 (0.0%) |
| $500,000 to $749,999 | 0 (0.0%) | 0 (0.0%) |
| $750,000 to $999,999 | 0 (0.0%) | 3 (2.3%) |
| $1,000,000 or more | 0 (0.0%) | 0 (0.0%) |
| Total | 108 (100.0%) | 130 (100.0%) |
Household Income by Mortgage Status in North English
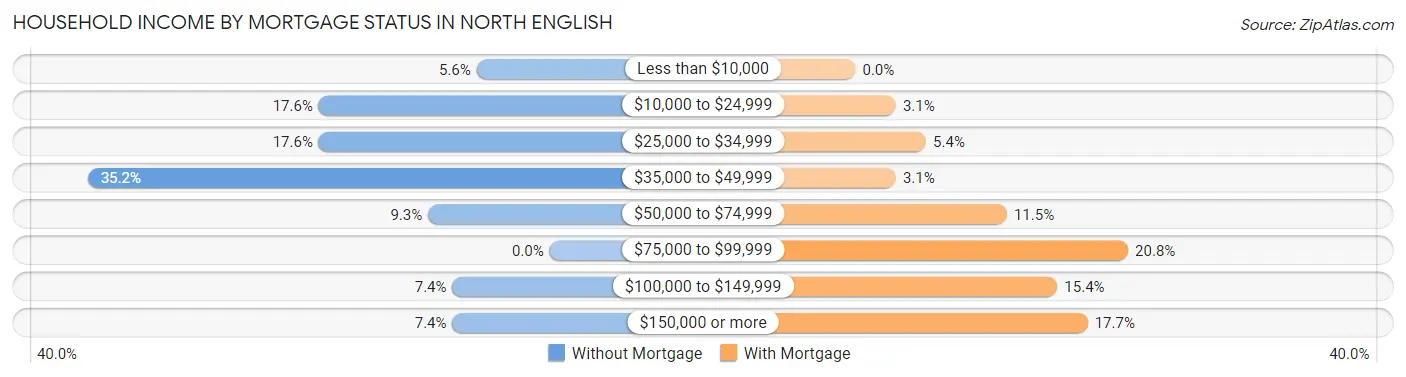
| Household Income | Without Mortgage | With Mortgage |
| Less than $10,000 | 6 (5.6%) | 0 (0.0%) |
| $10,000 to $24,999 | 19 (17.6%) | 4 (3.1%) |
| $25,000 to $34,999 | 19 (17.6%) | 7 (5.4%) |
| $35,000 to $49,999 | 38 (35.2%) | 4 (3.1%) |
| $50,000 to $74,999 | 10 (9.3%) | 15 (11.5%) |
| $75,000 to $99,999 | 0 (0.0%) | 27 (20.8%) |
| $100,000 to $149,999 | 8 (7.4%) | 20 (15.4%) |
| $150,000 or more | 8 (7.4%) | 23 (17.7%) |
| Total | 108 (100.0%) | 130 (100.0%) |
Property Value to Household Income Ratio in North English
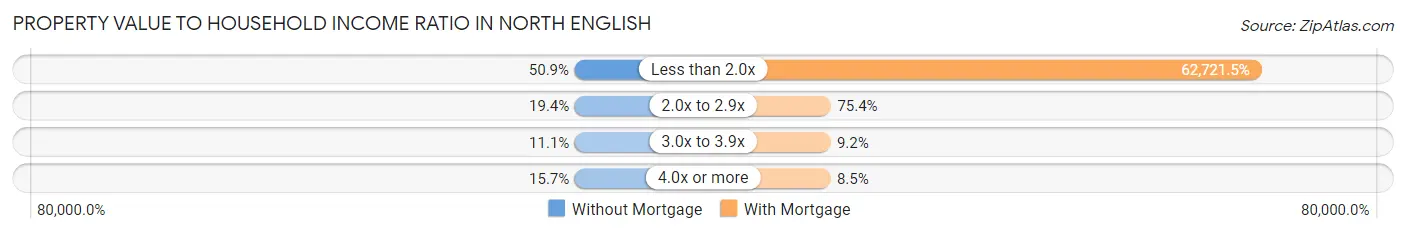
| Value-to-Income Ratio | Without Mortgage | With Mortgage |
| Less than 2.0x | 55 (50.9%) | 81,538 (62,721.5%) |
| 2.0x to 2.9x | 21 (19.4%) | 98 (75.4%) |
| 3.0x to 3.9x | 12 (11.1%) | 12 (9.2%) |
| 4.0x or more | 17 (15.7%) | 11 (8.5%) |
| Total | 108 (100.0%) | 130 (100.0%) |
Real Estate Taxes by Mortgage Status in North English
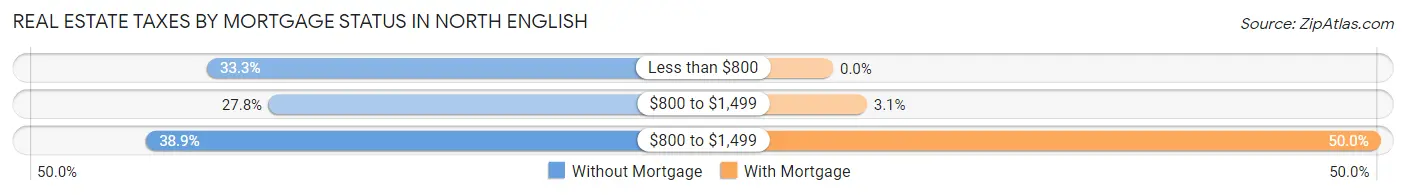
| Property Taxes | Without Mortgage | With Mortgage |
| Less than $800 | 36 (33.3%) | 0 (0.0%) |
| $800 to $1,499 | 30 (27.8%) | 4 (3.1%) |
| $800 to $1,499 | 42 (38.9%) | 65 (50.0%) |
| Total | 108 (100.0%) | 130 (100.0%) |
Health & Disability in North English
Health Insurance Coverage by Age in North English
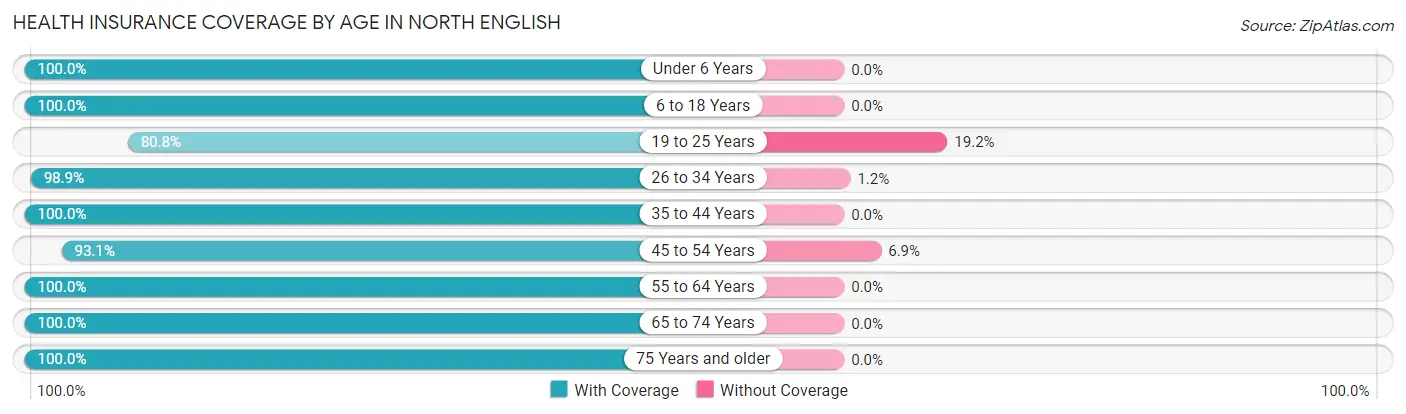
| Age Bracket | With Coverage | Without Coverage |
| Under 6 Years | 63 (100.0%) | 0 (0.0%) |
| 6 to 18 Years | 170 (100.0%) | 0 (0.0%) |
| 19 to 25 Years | 42 (80.8%) | 10 (19.2%) |
| 26 to 34 Years | 86 (98.9%) | 1 (1.1%) |
| 35 to 44 Years | 45 (100.0%) | 0 (0.0%) |
| 45 to 54 Years | 108 (93.1%) | 8 (6.9%) |
| 55 to 64 Years | 89 (100.0%) | 0 (0.0%) |
| 65 to 74 Years | 76 (100.0%) | 0 (0.0%) |
| 75 Years and older | 77 (100.0%) | 0 (0.0%) |
| Total | 756 (97.6%) | 19 (2.5%) |
Health Insurance Coverage by Citizenship Status in North English
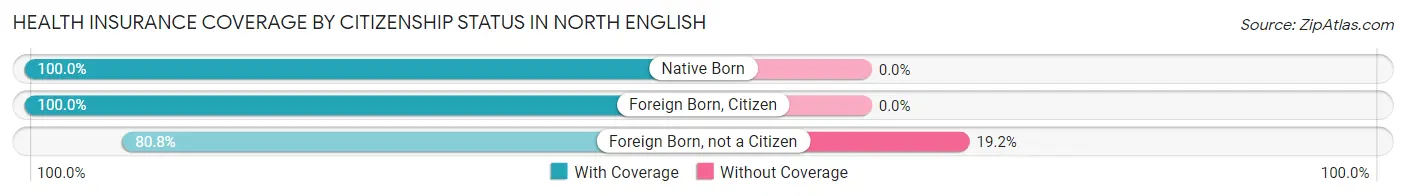
| Citizenship Status | With Coverage | Without Coverage |
| Native Born | 63 (100.0%) | 0 (0.0%) |
| Foreign Born, Citizen | 170 (100.0%) | 0 (0.0%) |
| Foreign Born, not a Citizen | 42 (80.8%) | 10 (19.2%) |
Health Insurance Coverage by Household Income in North English
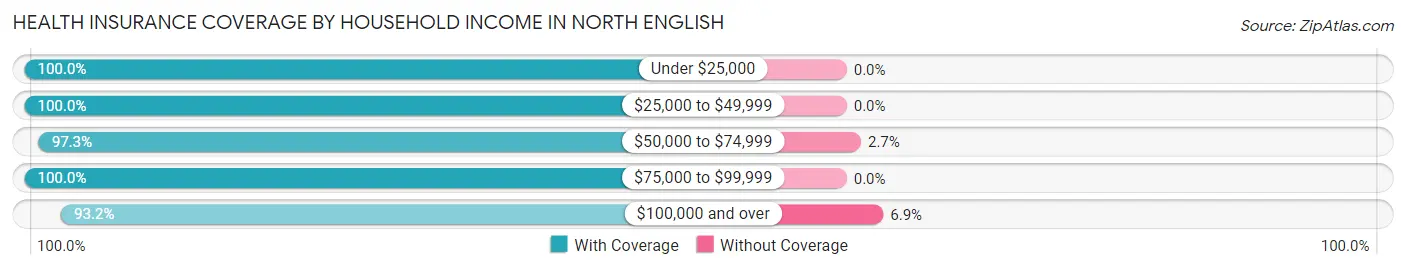
| Household Income | With Coverage | Without Coverage |
| Under $25,000 | 97 (100.0%) | 0 (0.0%) |
| $25,000 to $49,999 | 209 (100.0%) | 0 (0.0%) |
| $50,000 to $74,999 | 146 (97.3%) | 4 (2.7%) |
| $75,000 to $99,999 | 100 (100.0%) | 0 (0.0%) |
| $100,000 and over | 204 (93.1%) | 15 (6.9%) |
Public vs Private Health Insurance Coverage by Age in North English
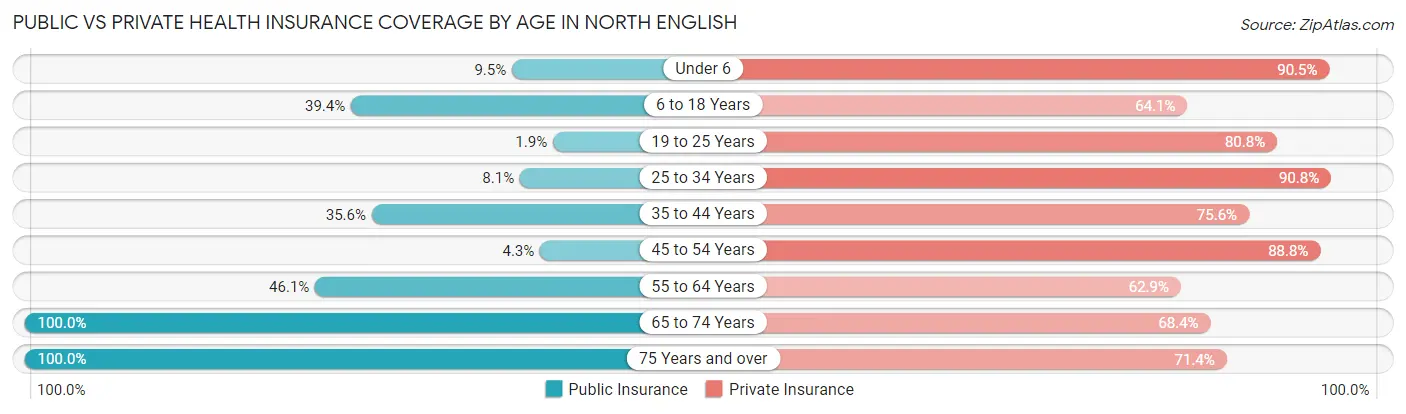
| Age Bracket | Public Insurance | Private Insurance |
| Under 6 | 6 (9.5%) | 57 (90.5%) |
| 6 to 18 Years | 67 (39.4%) | 109 (64.1%) |
| 19 to 25 Years | 1 (1.9%) | 42 (80.8%) |
| 25 to 34 Years | 7 (8.1%) | 79 (90.8%) |
| 35 to 44 Years | 16 (35.6%) | 34 (75.6%) |
| 45 to 54 Years | 5 (4.3%) | 103 (88.8%) |
| 55 to 64 Years | 41 (46.1%) | 56 (62.9%) |
| 65 to 74 Years | 76 (100.0%) | 52 (68.4%) |
| 75 Years and over | 77 (100.0%) | 55 (71.4%) |
| Total | 296 (38.2%) | 587 (75.7%) |
Disability Status by Sex by Age in North English
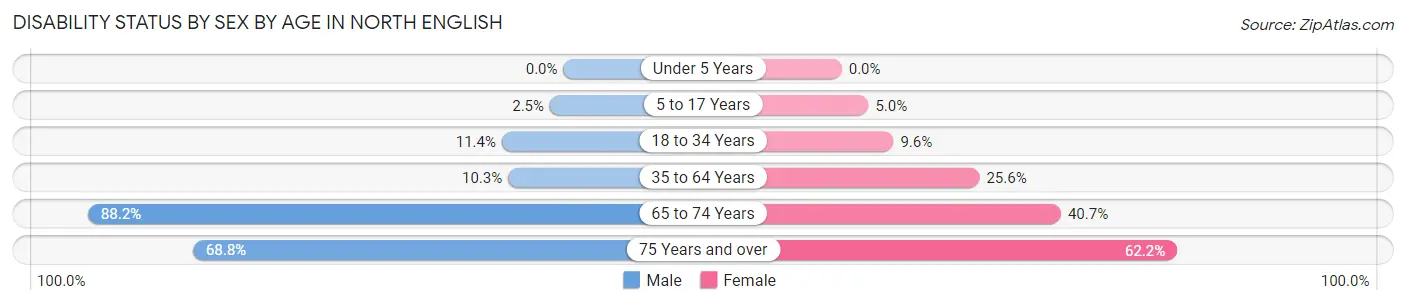
| Age Bracket | Male | Female |
| Under 5 Years | 0 (0.0%) | 0 (0.0%) |
| 5 to 17 Years | 2 (2.5%) | 5 (5.0%) |
| 18 to 34 Years | 8 (11.4%) | 7 (9.6%) |
| 35 to 64 Years | 12 (10.3%) | 34 (25.6%) |
| 65 to 74 Years | 15 (88.2%) | 24 (40.7%) |
| 75 Years and over | 22 (68.8%) | 28 (62.2%) |
Disability Class by Sex by Age in North English
Disability Class: Hearing Difficulty
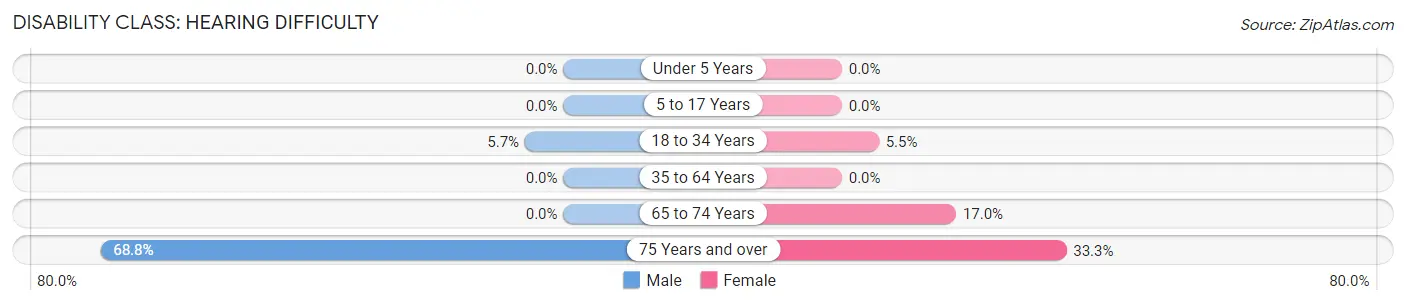
| Age Bracket | Male | Female |
| Under 5 Years | 0 (0.0%) | 0 (0.0%) |
| 5 to 17 Years | 0 (0.0%) | 0 (0.0%) |
| 18 to 34 Years | 4 (5.7%) | 4 (5.5%) |
| 35 to 64 Years | 0 (0.0%) | 0 (0.0%) |
| 65 to 74 Years | 0 (0.0%) | 10 (17.0%) |
| 75 Years and over | 22 (68.8%) | 15 (33.3%) |
Disability Class: Vision Difficulty
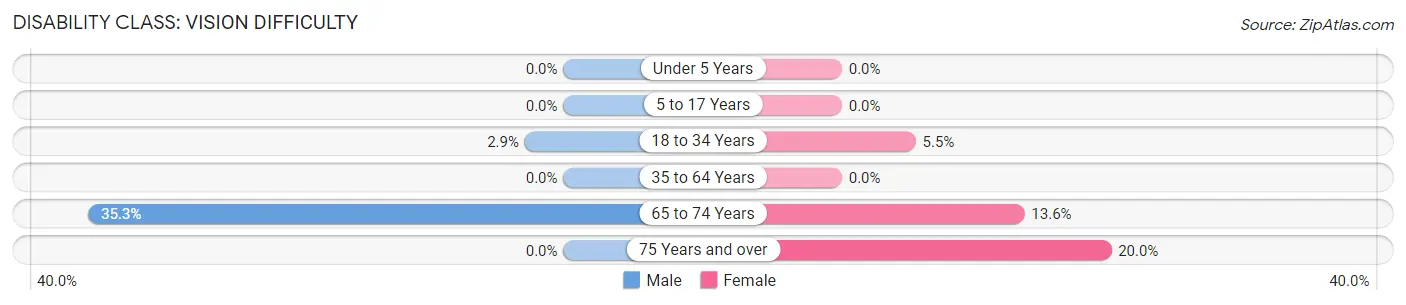
| Age Bracket | Male | Female |
| Under 5 Years | 0 (0.0%) | 0 (0.0%) |
| 5 to 17 Years | 0 (0.0%) | 0 (0.0%) |
| 18 to 34 Years | 2 (2.9%) | 4 (5.5%) |
| 35 to 64 Years | 0 (0.0%) | 0 (0.0%) |
| 65 to 74 Years | 6 (35.3%) | 8 (13.6%) |
| 75 Years and over | 0 (0.0%) | 9 (20.0%) |
Disability Class: Cognitive Difficulty
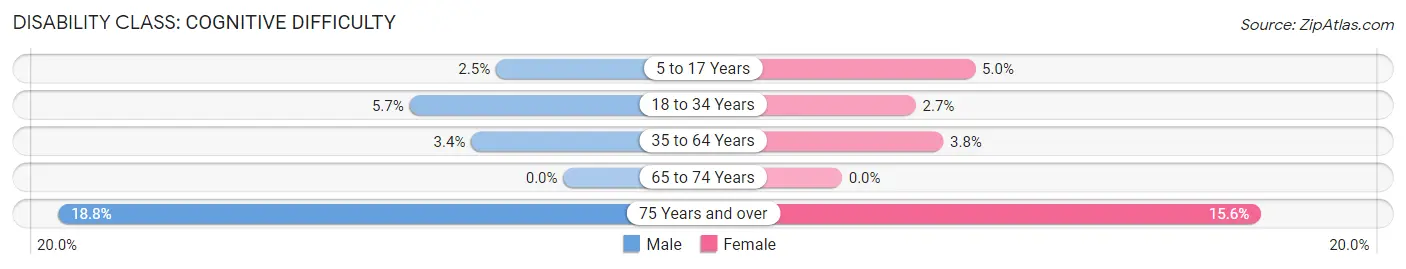
| Age Bracket | Male | Female |
| 5 to 17 Years | 2 (2.5%) | 5 (5.0%) |
| 18 to 34 Years | 4 (5.7%) | 2 (2.7%) |
| 35 to 64 Years | 4 (3.4%) | 5 (3.8%) |
| 65 to 74 Years | 0 (0.0%) | 0 (0.0%) |
| 75 Years and over | 6 (18.8%) | 7 (15.6%) |
Disability Class: Ambulatory Difficulty
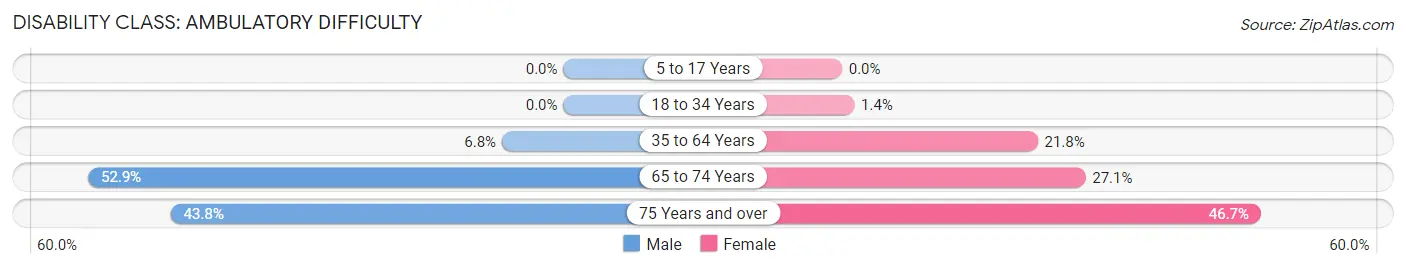
| Age Bracket | Male | Female |
| 5 to 17 Years | 0 (0.0%) | 0 (0.0%) |
| 18 to 34 Years | 0 (0.0%) | 1 (1.4%) |
| 35 to 64 Years | 8 (6.8%) | 29 (21.8%) |
| 65 to 74 Years | 9 (52.9%) | 16 (27.1%) |
| 75 Years and over | 14 (43.8%) | 21 (46.7%) |
Disability Class: Self-Care Difficulty
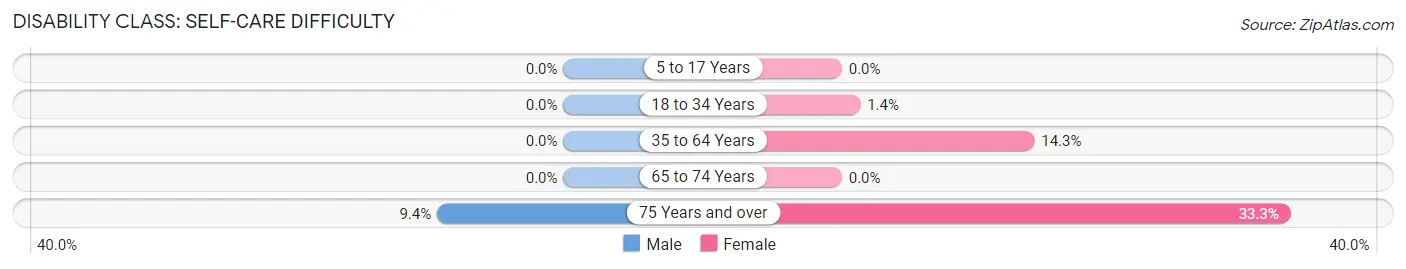
| Age Bracket | Male | Female |
| 5 to 17 Years | 0 (0.0%) | 0 (0.0%) |
| 18 to 34 Years | 0 (0.0%) | 1 (1.4%) |
| 35 to 64 Years | 0 (0.0%) | 19 (14.3%) |
| 65 to 74 Years | 0 (0.0%) | 0 (0.0%) |
| 75 Years and over | 3 (9.4%) | 15 (33.3%) |
Technology Access in North English
Computing Device Access in North English
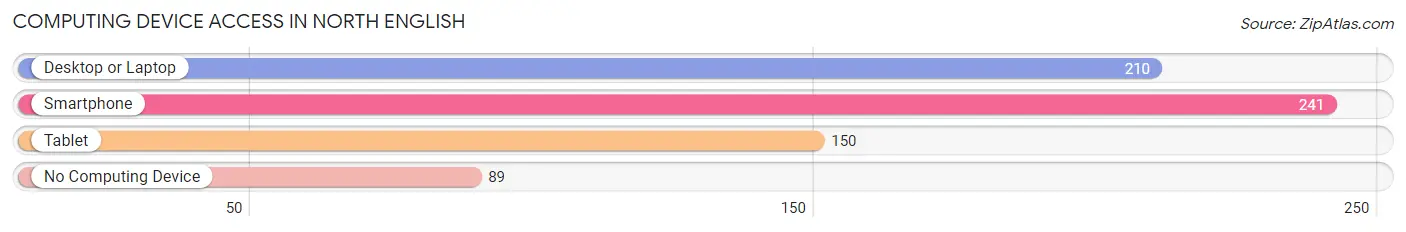
| Device Type | # Households | % Households |
| Desktop or Laptop | 210 | 59.5% |
| Smartphone | 241 | 68.3% |
| Tablet | 150 | 42.5% |
| No Computing Device | 89 | 25.2% |
| Total | 353 | 100.0% |
Internet Access in North English
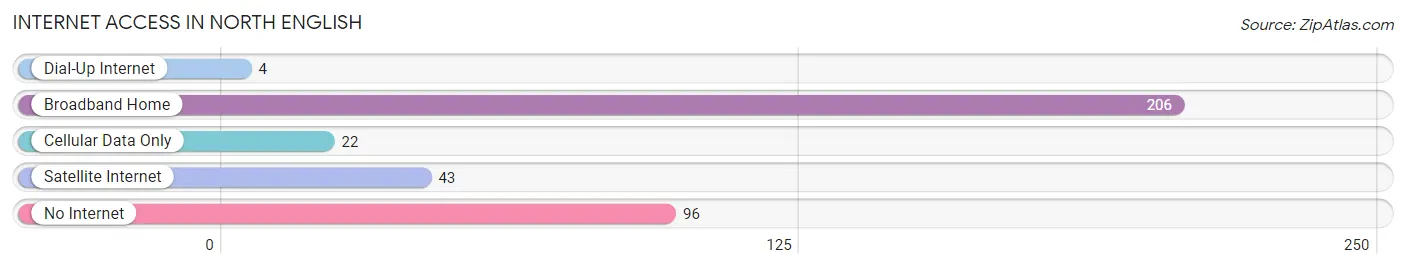
| Internet Type | # Households | % Households |
| Dial-Up Internet | 4 | 1.1% |
| Broadband Home | 206 | 58.4% |
| Cellular Data Only | 22 | 6.2% |
| Satellite Internet | 43 | 12.2% |
| No Internet | 96 | 27.2% |
| Total | 353 | 100.0% |
North English Summary
English, Iowa is a small town located in the northeastern corner of the state, in Winneshiek County. It is situated on the banks of the Upper Iowa River, and is surrounded by rolling hills and farmland. The town was founded in 1856, and has a population of just over 1,000 people.
Geography
English, Iowa is located in the northeastern corner of the state, in Winneshiek County. It is situated on the banks of the Upper Iowa River, and is surrounded by rolling hills and farmland. The town is located at the intersection of two major highways, US Highway 52 and Iowa Highway 9. The town is located about 25 miles from the Minnesota border, and about 50 miles from the Wisconsin border.
The town is located in a rural area, and is surrounded by small towns and villages. The nearest major city is Decorah, which is about 10 miles away. The town is also close to the Mississippi River, which is about 25 miles away.
The climate in English, Iowa is typical of the Midwest, with cold winters and hot summers. The average temperature in the winter is around 20 degrees Fahrenheit, and the average temperature in the summer is around 80 degrees Fahrenheit.
History
English, Iowa was founded in 1856 by a group of settlers from England. The town was named after the settlers’ homeland, and was originally known as “English Settlement”. The town was incorporated in 1858, and the first post office was established in 1859.
The town grew slowly over the years, and by the early 1900s, it had a population of around 500 people. The town was primarily an agricultural community, and the main crops grown were corn, oats, and hay.
The town experienced a period of growth in the 1950s and 1960s, when the population increased to over 1,000 people. The town was also home to a number of small businesses, including a grocery store, a hardware store, and a gas station.
Economy
English, Iowa is a small, rural town, and the economy is primarily based on agriculture. The main crops grown in the area are corn, oats, and hay. The town is also home to a number of small businesses, including a grocery store, a hardware store, and a gas station.
The town is also home to a number of manufacturing companies, including a furniture factory, a metal fabrication plant, and a plastics factory. The town is also home to a number of small businesses, including a restaurant, a bar, and a hotel.
Demographics
English, Iowa has a population of just over 1,000 people. The town is predominantly white, with a small Hispanic population. The median household income is around $40,000, and the median home value is around $100,000. The town has a low unemployment rate, and the poverty rate is below the national average.
English, Iowa is a small, rural town with a rich history and a strong sense of community. The town is home to a number of small businesses, and the economy is primarily based on agriculture. The town is also home to a number of manufacturing companies, and the population is predominantly white. The town has a low unemployment rate, and the poverty rate is below the national average.
Common Questions
What is Per Capita Income in North English?
Per Capita income in North English is $33,676.
What is the Median Family Income in North English?
Median Family Income in North English is $61,563.
What is the Median Household income in North English?
Median Household Income in North English is $47,656.
What is Income or Wage Gap in North English?
Income or Wage Gap in North English is 43.8%.
Women in North English earn 56.2 cents for every dollar earned by a man.
What is Inequality or Gini Index in North English?
Inequality or Gini Index in North English is 0.50.
What is the Total Population of North English?
Total Population of North English is 826.
What is the Total Male Population of North English?
Total Male Population of North English is 356.
What is the Total Female Population of North English?
Total Female Population of North English is 470.
What is the Ratio of Males per 100 Females in North English?
There are 75.74 Males per 100 Females in North English.
What is the Ratio of Females per 100 Males in North English?
There are 132.02 Females per 100 Males in North English.
What is the Median Population Age in North English?
Median Population Age in North English is 38.8 Years.
What is the Average Family Size in North English
Average Family Size in North English is 3.0 People.
What is the Average Household Size in North English
Average Household Size in North English is 2.2 People.
How Large is the Labor Force in North English?
There are 397 People in the Labor Forcein in North English.
What is the Percentage of People in the Labor Force in North English?
60.5% of People are in the Labor Force in North English.
What is the Unemployment Rate in North English?
Unemployment Rate in North English is 1.3%.