Zip Codes with the Lowest Poverty Level Among Children Under the Age of 5 in Iowa
RELATED REPORTS & OPTIONS
Lowest Poverty | Child 0-5
Iowa
Compare Zip Codes
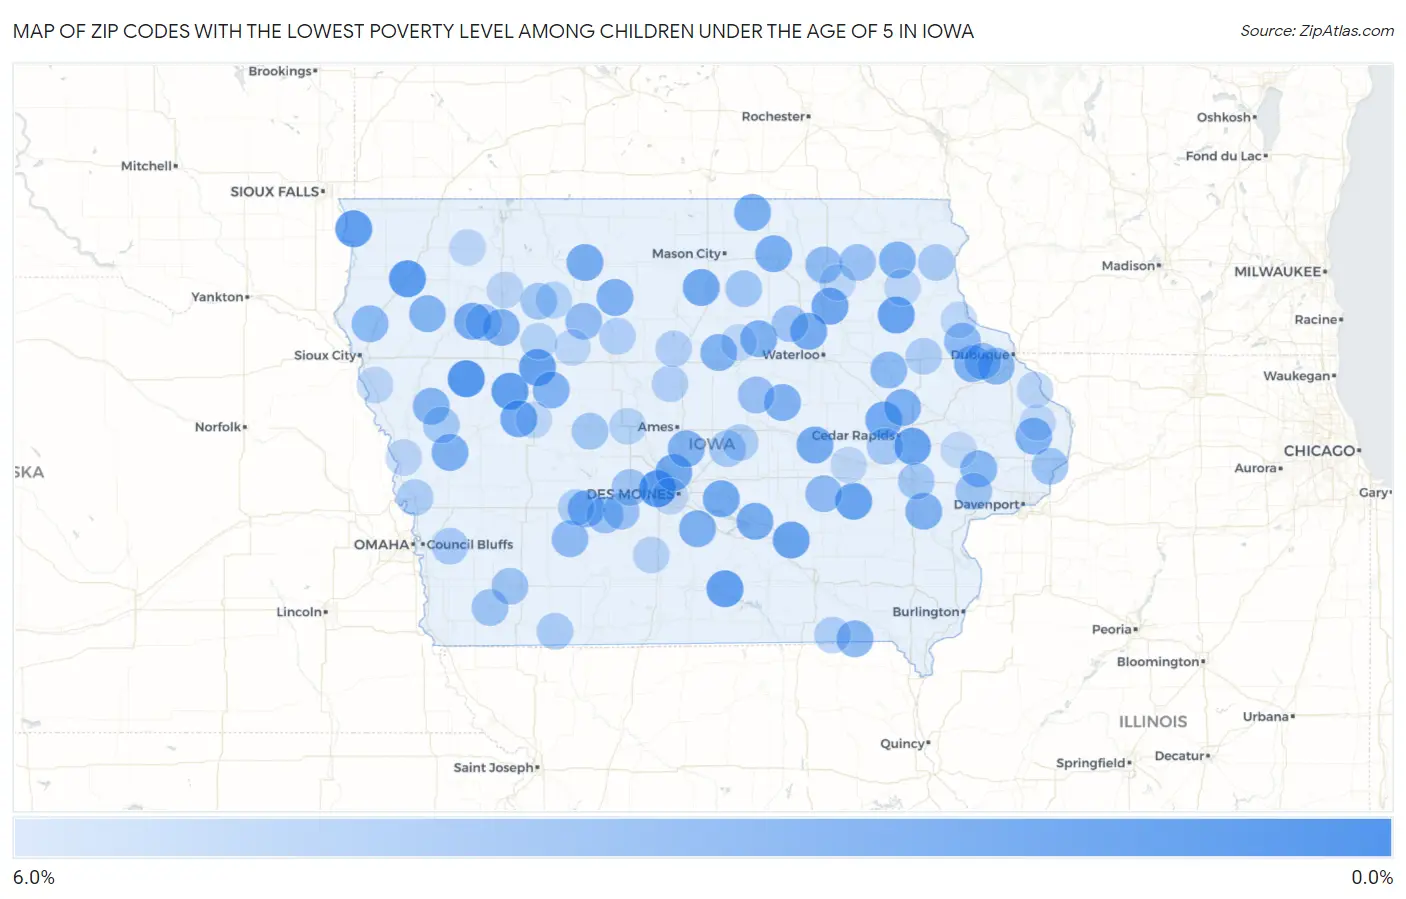
Map of Zip Codes with the Lowest Poverty Level Among Children Under the Age of 5 in Iowa
6.0%
0.0%
Zip Codes with the Lowest Poverty Level Among Children Under the Age of 5 in Iowa
| Zip Code | Child Poverty | vs State | vs National | |
| 1. | 50325 | 0.70% | 14.3%(-13.6)#1 | 18.1%(-17.4)#131 |
| 2. | 51445 | 0.74% | 14.3%(-13.6)#2 | 18.1%(-17.3)#144 |
| 3. | 51003 | 0.93% | 14.3%(-13.4)#3 | 18.1%(-17.1)#248 |
| 4. | 51466 | 1.1% | 14.3%(-13.2)#4 | 18.1%(-16.9)#358 |
| 5. | 51240 | 1.2% | 14.3%(-13.1)#5 | 18.1%(-16.9)#370 |
| 6. | 50238 | 1.3% | 14.3%(-13.0)#6 | 18.1%(-16.8)#409 |
| 7. | 50561 | 1.5% | 14.3%(-12.8)#7 | 18.1%(-16.6)#514 |
| 8. | 50606 | 1.5% | 14.3%(-12.8)#8 | 18.1%(-16.5)#545 |
| 9. | 52595 | 1.5% | 14.3%(-12.8)#9 | 18.1%(-16.5)#558 |
| 10. | 52227 | 1.6% | 14.3%(-12.7)#10 | 18.1%(-16.5)#572 |
| 11. | 52316 | 1.6% | 14.3%(-12.7)#11 | 18.1%(-16.5)#588 |
| 12. | 50676 | 1.8% | 14.3%(-12.5)#12 | 18.1%(-16.2)#731 |
| 13. | 50479 | 1.9% | 14.3%(-12.4)#13 | 18.1%(-16.1)#793 |
| 14. | 50023 | 2.0% | 14.3%(-12.3)#14 | 18.1%(-16.1)#833 |
| 15. | 52324 | 2.0% | 14.3%(-12.3)#15 | 18.1%(-16.0)#845 |
| 16. | 50228 | 2.0% | 14.3%(-12.3)#16 | 18.1%(-16.0)#860 |
| 17. | 51430 | 2.1% | 14.3%(-12.2)#17 | 18.1%(-16.0)#866 |
| 18. | 52215 | 2.1% | 14.3%(-12.2)#18 | 18.1%(-15.9)#922 |
| 19. | 50647 | 2.2% | 14.3%(-12.1)#19 | 18.1%(-15.9)#951 |
| 20. | 51005 | 2.2% | 14.3%(-12.1)#20 | 18.1%(-15.9)#953 |
| 21. | 50598 | 2.2% | 14.3%(-12.1)#21 | 18.1%(-15.8)#978 |
| 22. | 50219 | 2.3% | 14.3%(-12.0)#22 | 18.1%(-15.8)#1,013 |
| 23. | 50435 | 2.4% | 14.3%(-11.9)#23 | 18.1%(-15.7)#1,084 |
| 24. | 50472 | 2.4% | 14.3%(-11.9)#24 | 18.1%(-15.6)#1,116 |
| 25. | 50164 | 2.4% | 14.3%(-11.9)#25 | 18.1%(-15.6)#1,131 |
| 26. | 50558 | 2.5% | 14.3%(-11.8)#26 | 18.1%(-15.6)#1,174 |
| 27. | 50001 | 2.5% | 14.3%(-11.8)#27 | 18.1%(-15.6)#1,175 |
| 28. | 52202 | 2.5% | 14.3%(-11.8)#28 | 18.1%(-15.5)#1,187 |
| 29. | 51529 | 2.6% | 14.3%(-11.7)#29 | 18.1%(-15.5)#1,218 |
| 30. | 50604 | 2.6% | 14.3%(-11.7)#30 | 18.1%(-15.5)#1,219 |
| 31. | 52755 | 2.6% | 14.3%(-11.7)#31 | 18.1%(-15.4)#1,244 |
| 32. | 50046 | 2.6% | 14.3%(-11.7)#32 | 18.1%(-15.4)#1,246 |
| 33. | 52046 | 2.6% | 14.3%(-11.7)#33 | 18.1%(-15.4)#1,255 |
| 34. | 50635 | 2.7% | 14.3%(-11.6)#34 | 18.1%(-15.4)#1,274 |
| 35. | 50126 | 2.7% | 14.3%(-11.6)#35 | 18.1%(-15.4)#1,292 |
| 36. | 52133 | 2.7% | 14.3%(-11.6)#36 | 18.1%(-15.4)#1,303 |
| 37. | 50588 | 2.7% | 14.3%(-11.6)#37 | 18.1%(-15.3)#1,312 |
| 38. | 51449 | 2.8% | 14.3%(-11.5)#38 | 18.1%(-15.3)#1,351 |
| 39. | 52731 | 2.8% | 14.3%(-11.5)#39 | 18.1%(-15.3)#1,354 |
| 40. | 51035 | 2.9% | 14.3%(-11.4)#40 | 18.1%(-15.2)#1,409 |
| 41. | 51034 | 2.9% | 14.3%(-11.4)#41 | 18.1%(-15.2)#1,430 |
| 42. | 52542 | 2.9% | 14.3%(-11.4)#42 | 18.1%(-15.1)#1,469 |
| 43. | 52721 | 3.0% | 14.3%(-11.3)#43 | 18.1%(-15.0)#1,524 |
| 44. | 52068 | 3.1% | 14.3%(-11.2)#44 | 18.1%(-15.0)#1,553 |
| 45. | 51038 | 3.2% | 14.3%(-11.1)#45 | 18.1%(-14.9)#1,620 |
| 46. | 52326 | 3.2% | 14.3%(-11.1)#46 | 18.1%(-14.9)#1,631 |
| 47. | 52065 | 3.3% | 14.3%(-11.0)#47 | 18.1%(-14.7)#1,725 |
| 48. | 52222 | 3.3% | 14.3%(-11.0)#48 | 18.1%(-14.7)#1,726 |
| 49. | 50846 | 3.4% | 14.3%(-10.9)#49 | 18.1%(-14.7)#1,741 |
| 50. | 50659 | 3.4% | 14.3%(-10.9)#50 | 18.1%(-14.6)#1,776 |
| 51. | 52045 | 3.5% | 14.3%(-10.8)#51 | 18.1%(-14.6)#1,829 |
| 52. | 50541 | 3.5% | 14.3%(-10.8)#52 | 18.1%(-14.5)#1,849 |
| 53. | 50621 | 3.7% | 14.3%(-10.6)#53 | 18.1%(-14.4)#1,958 |
| 54. | 50070 | 3.7% | 14.3%(-10.6)#54 | 18.1%(-14.4)#1,960 |
| 55. | 50072 | 3.8% | 14.3%(-10.5)#55 | 18.1%(-14.3)#2,014 |
| 56. | 52171 | 3.8% | 14.3%(-10.5)#56 | 18.1%(-14.2)#2,063 |
| 57. | 52730 | 3.9% | 14.3%(-10.4)#57 | 18.1%(-14.1)#2,114 |
| 58. | 52778 | 4.0% | 14.3%(-10.3)#58 | 18.1%(-14.1)#2,136 |
| 59. | 51002 | 4.0% | 14.3%(-10.3)#59 | 18.1%(-14.1)#2,137 |
| 60. | 50670 | 4.0% | 14.3%(-10.3)#60 | 18.1%(-14.1)#2,150 |
| 61. | 51638 | 4.0% | 14.3%(-10.3)#61 | 18.1%(-14.1)#2,173 |
| 62. | 51573 | 4.0% | 14.3%(-10.3)#62 | 18.1%(-14.1)#2,174 |
| 63. | 50003 | 4.0% | 14.3%(-10.3)#63 | 18.1%(-14.0)#2,202 |
| 64. | 50433 | 4.1% | 14.3%(-10.2)#64 | 18.1%(-14.0)#2,228 |
| 65. | 50554 | 4.2% | 14.3%(-10.1)#65 | 18.1%(-13.9)#2,348 |
| 66. | 50129 | 4.2% | 14.3%(-10.1)#66 | 18.1%(-13.8)#2,369 |
| 67. | 52245 | 4.3% | 14.3%(-10.0)#67 | 18.1%(-13.8)#2,400 |
| 68. | 51060 | 4.3% | 14.3%(-9.95)#68 | 18.1%(-13.7)#2,449 |
| 69. | 50234 | 4.3% | 14.3%(-9.95)#69 | 18.1%(-13.7)#2,453 |
| 70. | 52228 | 4.4% | 14.3%(-9.93)#70 | 18.1%(-13.7)#2,465 |
| 71. | 51575 | 4.4% | 14.3%(-9.86)#71 | 18.1%(-13.6)#2,511 |
| 72. | 52159 | 4.5% | 14.3%(-9.83)#72 | 18.1%(-13.6)#2,533 |
| 73. | 50833 | 4.6% | 14.3%(-9.72)#73 | 18.1%(-13.5)#2,613 |
| 74. | 51555 | 4.7% | 14.3%(-9.63)#74 | 18.1%(-13.4)#2,680 |
| 75. | 50162 | 4.7% | 14.3%(-9.59)#75 | 18.1%(-13.4)#2,700 |
| 76. | 50048 | 4.7% | 14.3%(-9.59)#76 | 18.1%(-13.4)#2,701 |
| 77. | 52057 | 4.7% | 14.3%(-9.59)#77 | 18.1%(-13.4)#2,706 |
| 78. | 52584 | 4.8% | 14.3%(-9.54)#78 | 18.1%(-13.3)#2,735 |
| 79. | 50130 | 4.9% | 14.3%(-9.42)#79 | 18.1%(-13.2)#2,820 |
| 80. | 50516 | 4.9% | 14.3%(-9.42)#80 | 18.1%(-13.2)#2,822 |
| 81. | 50034 | 4.9% | 14.3%(-9.38)#81 | 18.1%(-13.1)#2,848 |
| 82. | 50540 | 4.9% | 14.3%(-9.36)#82 | 18.1%(-13.1)#2,862 |
| 83. | 50212 | 5.0% | 14.3%(-9.30)#83 | 18.1%(-13.1)#2,903 |
| 84. | 50546 | 5.0% | 14.3%(-9.30)#84 | 18.1%(-13.1)#2,913 |
| 85. | 50257 | 5.1% | 14.3%(-9.22)#85 | 18.1%(-13.0)#2,954 |
| 86. | 52031 | 5.2% | 14.3%(-9.15)#86 | 18.1%(-12.9)#3,011 |
| 87. | 50585 | 5.3% | 14.3%(-9.04)#87 | 18.1%(-12.8)#3,074 |
| 88. | 51052 | 5.3% | 14.3%(-9.04)#88 | 18.1%(-12.8)#3,075 |
| 89. | 51545 | 5.3% | 14.3%(-9.04)#89 | 18.1%(-12.8)#3,085 |
| 90. | 52052 | 5.4% | 14.3%(-8.94)#90 | 18.1%(-12.7)#3,126 |
| 91. | 51346 | 5.4% | 14.3%(-8.93)#91 | 18.1%(-12.7)#3,138 |
| 92. | 51401 | 5.4% | 14.3%(-8.92)#92 | 18.1%(-12.7)#3,149 |
| 93. | 50563 | 5.4% | 14.3%(-8.92)#93 | 18.1%(-12.7)#3,153 |
| 94. | 50630 | 5.4% | 14.3%(-8.92)#94 | 18.1%(-12.7)#3,154 |
| 95. | 52141 | 5.4% | 14.3%(-8.89)#95 | 18.1%(-12.7)#3,165 |
| 96. | 52069 | 5.4% | 14.3%(-8.86)#96 | 18.1%(-12.6)#3,198 |
| 97. | 50601 | 5.5% | 14.3%(-8.85)#97 | 18.1%(-12.6)#3,208 |
| 98. | 52301 | 5.5% | 14.3%(-8.84)#98 | 18.1%(-12.6)#3,217 |
| 99. | 50312 | 5.5% | 14.3%(-8.81)#99 | 18.1%(-12.6)#3,229 |
| 100. | 52337 | 5.6% | 14.3%(-8.74)#100 | 18.1%(-12.5)#3,293 |
Common Questions
What are the Top 10 Zip Codes with the Lowest Poverty Level Among Children Under the Age of 5 in Iowa?
Top 10 Zip Codes with the Lowest Poverty Level Among Children Under the Age of 5 in Iowa are:
What zip code has the Lowest Poverty Level Among Children Under the Age of 5 in Iowa?
50325 has the Lowest Poverty Level Among Children Under the Age of 5 in Iowa with 0.70%.
What is the Poverty Level Among Children Under the Age of 5 in the State of Iowa?
Poverty Level Among Children Under the Age of 5 in Iowa is 14.3%.
What is the Poverty Level Among Children Under the Age of 5 in the United States?
Poverty Level Among Children Under the Age of 5 in the United States is 18.1%.