Zip Codes with the Highest Percentage of Population Employed in Life, Physical & Social Science in Georgia
RELATED REPORTS & OPTIONS
Life, Physical & Social Science
Georgia
Compare Zip Codes
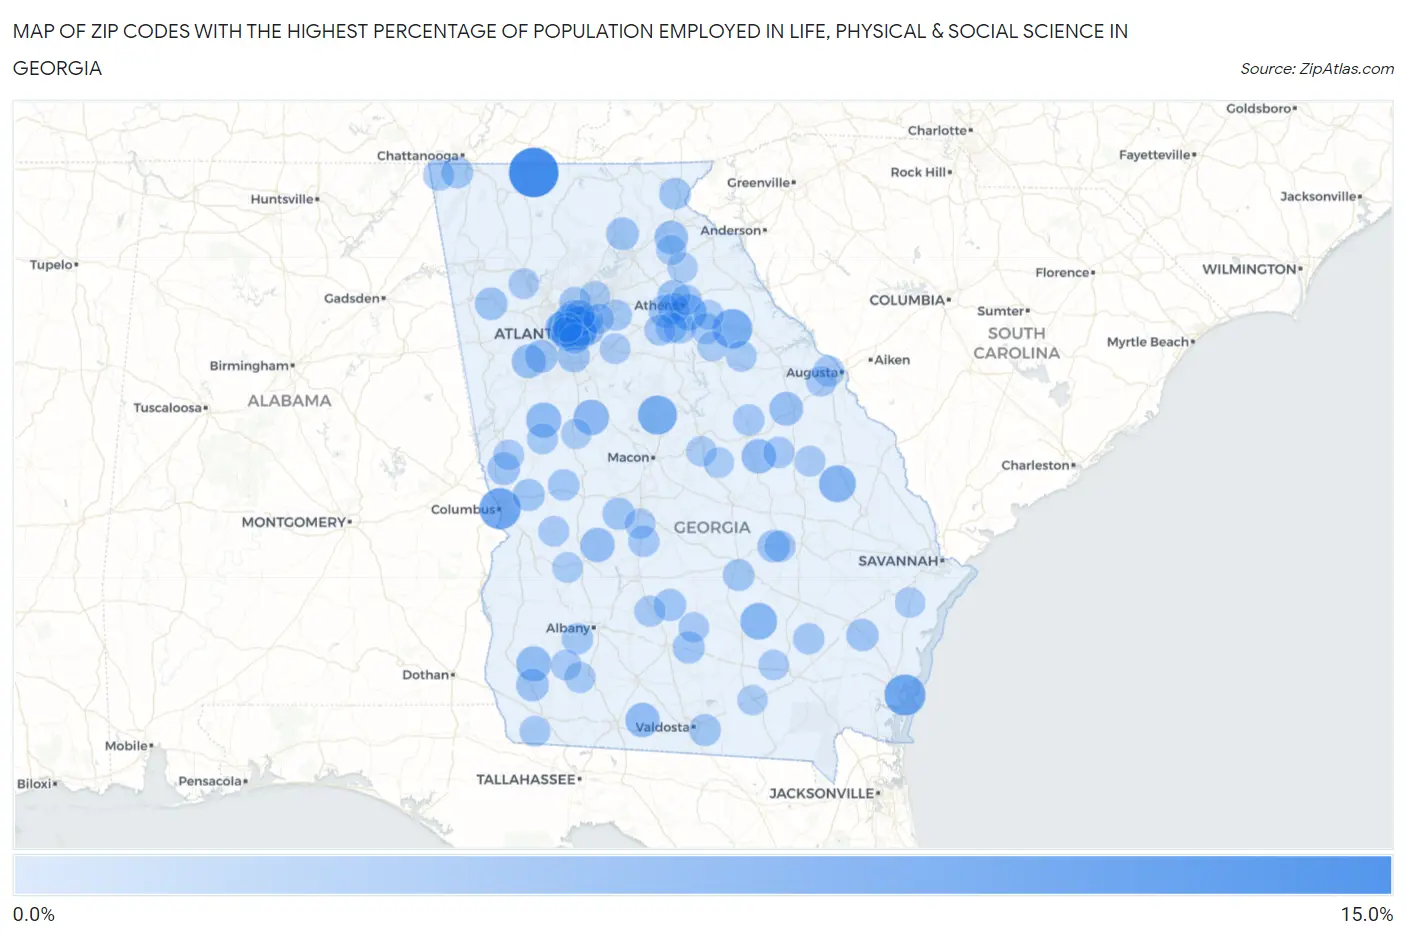
Map of Zip Codes with the Highest Percentage of Population Employed in Life, Physical & Social Science in Georgia
0.0%
15.0%
Zip Codes with the Highest Percentage of Population Employed in Life, Physical & Social Science in Georgia
| Zip Code | % Employed | vs State | vs National | |
| 1. | 30708 | 12.9% | 0.91%(+12.0)#1 | 1.1%(+11.9)#132 |
| 2. | 31901 | 8.0% | 0.91%(+7.13)#2 | 1.1%(+6.95)#319 |
| 3. | 31527 | 7.8% | 0.91%(+6.91)#3 | 1.1%(+6.73)#337 |
| 4. | 30660 | 6.9% | 0.91%(+6.03)#4 | 1.1%(+5.86)#415 |
| 5. | 31038 | 6.7% | 0.91%(+5.83)#5 | 1.1%(+5.66)#436 |
| 6. | 30363 | 6.1% | 0.91%(+5.23)#6 | 1.1%(+5.05)#528 |
| 7. | 30033 | 5.6% | 0.91%(+4.73)#7 | 1.1%(+4.55)#601 |
| 8. | 30030 | 5.6% | 0.91%(+4.72)#8 | 1.1%(+4.55)#604 |
| 9. | 30425 | 5.4% | 0.91%(+4.53)#9 | 1.1%(+4.35)#640 |
| 10. | 31567 | 5.3% | 0.91%(+4.42)#10 | 1.1%(+4.24)#676 |
| 11. | 30605 | 4.8% | 0.91%(+3.86)#11 | 1.1%(+3.68)#827 |
| 12. | 30257 | 4.7% | 0.91%(+3.77)#12 | 1.1%(+3.59)#857 |
| 13. | 30218 | 4.5% | 0.91%(+3.55)#13 | 1.1%(+3.38)#939 |
| 14. | 39841 | 4.4% | 0.91%(+3.45)#14 | 1.1%(+3.27)#982 |
| 15. | 30329 | 4.1% | 0.91%(+3.21)#15 | 1.1%(+3.03)#1,089 |
| 16. | 31035 | 4.0% | 0.91%(+3.14)#16 | 1.1%(+2.96)#1,122 |
| 17. | 31720 | 4.0% | 0.91%(+3.13)#17 | 1.1%(+2.95)#1,130 |
| 18. | 31711 | 4.0% | 0.91%(+3.10)#18 | 1.1%(+2.92)#1,143 |
| 19. | 30268 | 3.8% | 0.91%(+2.85)#19 | 1.1%(+2.68)#1,284 |
| 20. | 30823 | 3.7% | 0.91%(+2.75)#20 | 1.1%(+2.57)#1,336 |
| 21. | 30511 | 3.6% | 0.91%(+2.68)#21 | 1.1%(+2.50)#1,373 |
| 22. | 30072 | 3.5% | 0.91%(+2.59)#22 | 1.1%(+2.41)#1,421 |
| 23. | 30213 | 3.2% | 0.91%(+2.33)#23 | 1.1%(+2.16)#1,627 |
| 24. | 30306 | 3.2% | 0.91%(+2.30)#24 | 1.1%(+2.12)#1,657 |
| 25. | 30607 | 3.1% | 0.91%(+2.20)#25 | 1.1%(+2.02)#1,748 |
| 26. | 30564 | 3.1% | 0.91%(+2.16)#26 | 1.1%(+1.99)#1,784 |
| 27. | 30622 | 3.1% | 0.91%(+2.15)#27 | 1.1%(+1.97)#1,810 |
| 28. | 31811 | 3.0% | 0.91%(+2.11)#28 | 1.1%(+1.93)#1,850 |
| 29. | 39837 | 3.0% | 0.91%(+2.11)#29 | 1.1%(+1.93)#1,851 |
| 30. | 30317 | 3.0% | 0.91%(+2.10)#30 | 1.1%(+1.92)#1,862 |
| 31. | 30153 | 3.0% | 0.91%(+2.08)#31 | 1.1%(+1.90)#1,882 |
| 32. | 30319 | 3.0% | 0.91%(+2.04)#32 | 1.1%(+1.86)#1,930 |
| 33. | 30445 | 2.9% | 0.91%(+2.03)#33 | 1.1%(+1.85)#1,950 |
| 34. | 31546 | 2.9% | 0.91%(+1.98)#34 | 1.1%(+1.80)#2,006 |
| 35. | 31057 | 2.9% | 0.91%(+1.97)#35 | 1.1%(+1.79)#2,013 |
| 36. | 30260 | 2.9% | 0.91%(+1.96)#36 | 1.1%(+1.78)#2,023 |
| 37. | 30312 | 2.8% | 0.91%(+1.91)#37 | 1.1%(+1.73)#2,086 |
| 38. | 31783 | 2.8% | 0.91%(+1.90)#38 | 1.1%(+1.72)#2,105 |
| 39. | 30324 | 2.8% | 0.91%(+1.89)#39 | 1.1%(+1.71)#2,117 |
| 40. | 31829 | 2.7% | 0.91%(+1.80)#40 | 1.1%(+1.62)#2,233 |
| 41. | 31749 | 2.7% | 0.91%(+1.78)#41 | 1.1%(+1.60)#2,256 |
| 42. | 30318 | 2.7% | 0.91%(+1.75)#42 | 1.1%(+1.57)#2,298 |
| 43. | 31606 | 2.6% | 0.91%(+1.69)#43 | 1.1%(+1.51)#2,385 |
| 44. | 30326 | 2.6% | 0.91%(+1.66)#44 | 1.1%(+1.48)#2,444 |
| 45. | 30308 | 2.6% | 0.91%(+1.66)#45 | 1.1%(+1.48)#2,448 |
| 46. | 30677 | 2.6% | 0.91%(+1.64)#46 | 1.1%(+1.46)#2,473 |
| 47. | 31055 | 2.6% | 0.91%(+1.64)#47 | 1.1%(+1.46)#2,478 |
| 48. | 30606 | 2.5% | 0.91%(+1.59)#48 | 1.1%(+1.41)#2,565 |
| 49. | 30725 | 2.5% | 0.91%(+1.56)#49 | 1.1%(+1.38)#2,617 |
| 50. | 30552 | 2.5% | 0.91%(+1.56)#50 | 1.1%(+1.38)#2,619 |
| 51. | 31812 | 2.4% | 0.91%(+1.49)#51 | 1.1%(+1.31)#2,756 |
| 52. | 30350 | 2.4% | 0.91%(+1.48)#52 | 1.1%(+1.30)#2,777 |
| 53. | 31094 | 2.4% | 0.91%(+1.45)#53 | 1.1%(+1.27)#2,819 |
| 54. | 30621 | 2.4% | 0.91%(+1.44)#54 | 1.1%(+1.27)#2,828 |
| 55. | 30413 | 2.3% | 0.91%(+1.42)#55 | 1.1%(+1.24)#2,882 |
| 56. | 30410 | 2.3% | 0.91%(+1.40)#56 | 1.1%(+1.22)#2,919 |
| 57. | 30752 | 2.3% | 0.91%(+1.39)#57 | 1.1%(+1.22)#2,949 |
| 58. | 31721 | 2.3% | 0.91%(+1.39)#58 | 1.1%(+1.21)#2,962 |
| 59. | 31551 | 2.3% | 0.91%(+1.38)#59 | 1.1%(+1.20)#2,976 |
| 60. | 30017 | 2.3% | 0.91%(+1.36)#60 | 1.1%(+1.19)#3,002 |
| 61. | 31091 | 2.2% | 0.91%(+1.33)#61 | 1.1%(+1.15)#3,073 |
| 62. | 31714 | 2.2% | 0.91%(+1.31)#62 | 1.1%(+1.13)#3,123 |
| 63. | 30641 | 2.2% | 0.91%(+1.27)#63 | 1.1%(+1.09)#3,218 |
| 64. | 30307 | 2.2% | 0.91%(+1.24)#64 | 1.1%(+1.06)#3,300 |
| 65. | 30909 | 2.1% | 0.91%(+1.23)#65 | 1.1%(+1.05)#3,320 |
| 66. | 30667 | 2.1% | 0.91%(+1.21)#66 | 1.1%(+1.03)#3,362 |
| 67. | 30631 | 2.1% | 0.91%(+1.18)#67 | 1.1%(+1.00)#3,444 |
| 68. | 30293 | 2.1% | 0.91%(+1.16)#68 | 1.1%(+0.985)#3,476 |
| 69. | 31730 | 2.1% | 0.91%(+1.15)#69 | 1.1%(+0.969)#3,518 |
| 70. | 30084 | 2.1% | 0.91%(+1.14)#70 | 1.1%(+0.963)#3,533 |
| 71. | 39819 | 2.0% | 0.91%(+1.13)#71 | 1.1%(+0.953)#3,557 |
| 72. | 30601 | 2.0% | 0.91%(+1.10)#72 | 1.1%(+0.921)#3,654 |
| 73. | 30441 | 2.0% | 0.91%(+1.09)#73 | 1.1%(+0.914)#3,670 |
| 74. | 31822 | 2.0% | 0.91%(+1.06)#74 | 1.1%(+0.886)#3,750 |
| 75. | 39870 | 2.0% | 0.91%(+1.05)#75 | 1.1%(+0.876)#3,782 |
| 76. | 31025 | 2.0% | 0.91%(+1.05)#76 | 1.1%(+0.875)#3,785 |
| 77. | 31803 | 2.0% | 0.91%(+1.04)#77 | 1.1%(+0.866)#3,806 |
| 78. | 30345 | 2.0% | 0.91%(+1.04)#78 | 1.1%(+0.863)#3,813 |
| 79. | 30002 | 1.9% | 0.91%(+1.04)#79 | 1.1%(+0.857)#3,832 |
| 80. | 31780 | 1.9% | 0.91%(+0.996)#80 | 1.1%(+0.818)#3,947 |
| 81. | 30097 | 1.9% | 0.91%(+0.980)#81 | 1.1%(+0.802)#4,004 |
| 82. | 30047 | 1.9% | 0.91%(+0.961)#82 | 1.1%(+0.782)#4,060 |
| 83. | 30013 | 1.9% | 0.91%(+0.951)#83 | 1.1%(+0.773)#4,099 |
| 84. | 30905 | 1.9% | 0.91%(+0.948)#84 | 1.1%(+0.770)#4,107 |
| 85. | 31774 | 1.8% | 0.91%(+0.926)#85 | 1.1%(+0.748)#4,183 |
| 86. | 30137 | 1.8% | 0.91%(+0.917)#86 | 1.1%(+0.739)#4,218 |
| 87. | 31552 | 1.8% | 0.91%(+0.916)#87 | 1.1%(+0.738)#4,221 |
| 88. | 31054 | 1.8% | 0.91%(+0.902)#88 | 1.1%(+0.724)#4,279 |
| 89. | 31090 | 1.8% | 0.91%(+0.897)#89 | 1.1%(+0.719)#4,293 |
| 90. | 30341 | 1.8% | 0.91%(+0.863)#90 | 1.1%(+0.685)#4,420 |
| 91. | 30313 | 1.8% | 0.91%(+0.861)#91 | 1.1%(+0.683)#4,428 |
| 92. | 30256 | 1.8% | 0.91%(+0.853)#92 | 1.1%(+0.675)#4,456 |
| 93. | 30669 | 1.7% | 0.91%(+0.829)#93 | 1.1%(+0.651)#4,548 |
| 94. | 30530 | 1.7% | 0.91%(+0.821)#94 | 1.1%(+0.643)#4,576 |
| 95. | 30316 | 1.7% | 0.91%(+0.816)#95 | 1.1%(+0.638)#4,599 |
| 96. | 31320 | 1.7% | 0.91%(+0.810)#96 | 1.1%(+0.632)#4,623 |
| 97. | 31634 | 1.7% | 0.91%(+0.792)#97 | 1.1%(+0.614)#4,701 |
| 98. | 30547 | 1.7% | 0.91%(+0.769)#98 | 1.1%(+0.591)#4,813 |
| 99. | 30309 | 1.7% | 0.91%(+0.762)#99 | 1.1%(+0.584)#4,844 |
| 100. | 30630 | 1.7% | 0.91%(+0.761)#100 | 1.1%(+0.583)#4,849 |
Common Questions
What are the Top 10 Zip Codes with the Highest Percentage of Population Employed in Life, Physical & Social Science in Georgia?
Top 10 Zip Codes with the Highest Percentage of Population Employed in Life, Physical & Social Science in Georgia are:
What zip code has the Highest Percentage of Population Employed in Life, Physical & Social Science in Georgia?
30708 has the Highest Percentage of Population Employed in Life, Physical & Social Science in Georgia with 12.9%.
What is the Percentage of Population Employed in Life, Physical & Social Science in the State of Georgia?
Percentage of Population Employed in Life, Physical & Social Science in Georgia is 0.91%.
What is the Percentage of Population Employed in Life, Physical & Social Science in the United States?
Percentage of Population Employed in Life, Physical & Social Science in the United States is 1.1%.