Vidette, GA Map & Demographics
Vidette Map
Vidette Overview
$19,939
PER CAPITA INCOME
$58,036
AVG FAMILY INCOME
$24,184
AVG HOUSEHOLD INCOME
48.1%
WAGE / INCOME GAP [ % ]
51.9¢/ $1
WAGE / INCOME GAP [ $ ]
0.38
INEQUALITY / GINI INDEX
191
TOTAL POPULATION
73
MALE POPULATION
118
FEMALE POPULATION
61.86
MALES / 100 FEMALES
161.64
FEMALES / 100 MALES
60.2
MEDIAN AGE
3.9
AVG FAMILY SIZE
2.0
AVG HOUSEHOLD SIZE
99
LABOR FORCE [ PEOPLE ]
65.1%
PERCENT IN LABOR FORCE
11.1%
UNEMPLOYMENT RATE
Income in Vidette
Income Overview in Vidette
Per Capita Income in Vidette is $19,939, while median incomes of families and households are $58,036 and $24,184 respectively.
| Characteristic | Number | Measure |
| Per Capita Income | 191 | $19,939 |
| Median Family Income | 33 | $58,036 |
| Mean Family Income | 33 | $58,406 |
| Median Household Income | 96 | $24,184 |
| Mean Household Income | 96 | $36,938 |
| Income Deficit | 33 | $0 |
| Wage / Income Gap (%) | 191 | 48.08% |
| Wage / Income Gap ($) | 191 | 51.92¢ per $1 |
| Gini / Inequality Index | 191 | 0.38 |
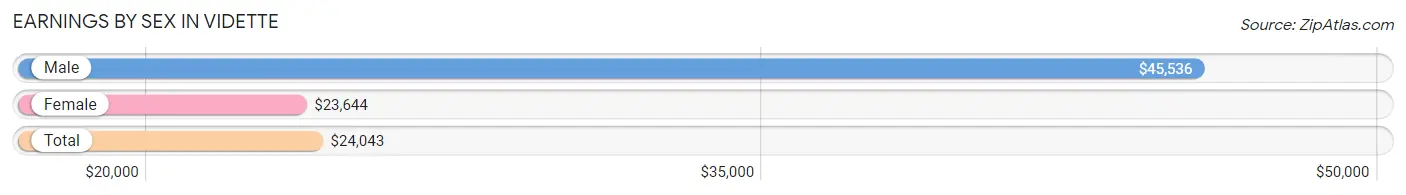
Earnings by Sex in Vidette
Average Earnings in Vidette are $24,043, $45,536 for men and $23,644 for women, a difference of 48.1%.
| Sex | Number | Average Earnings |
| Male | 27 (28.1%) | $45,536 |
| Female | 69 (71.9%) | $23,644 |
| Total | 96 (100.0%) | $24,043 |
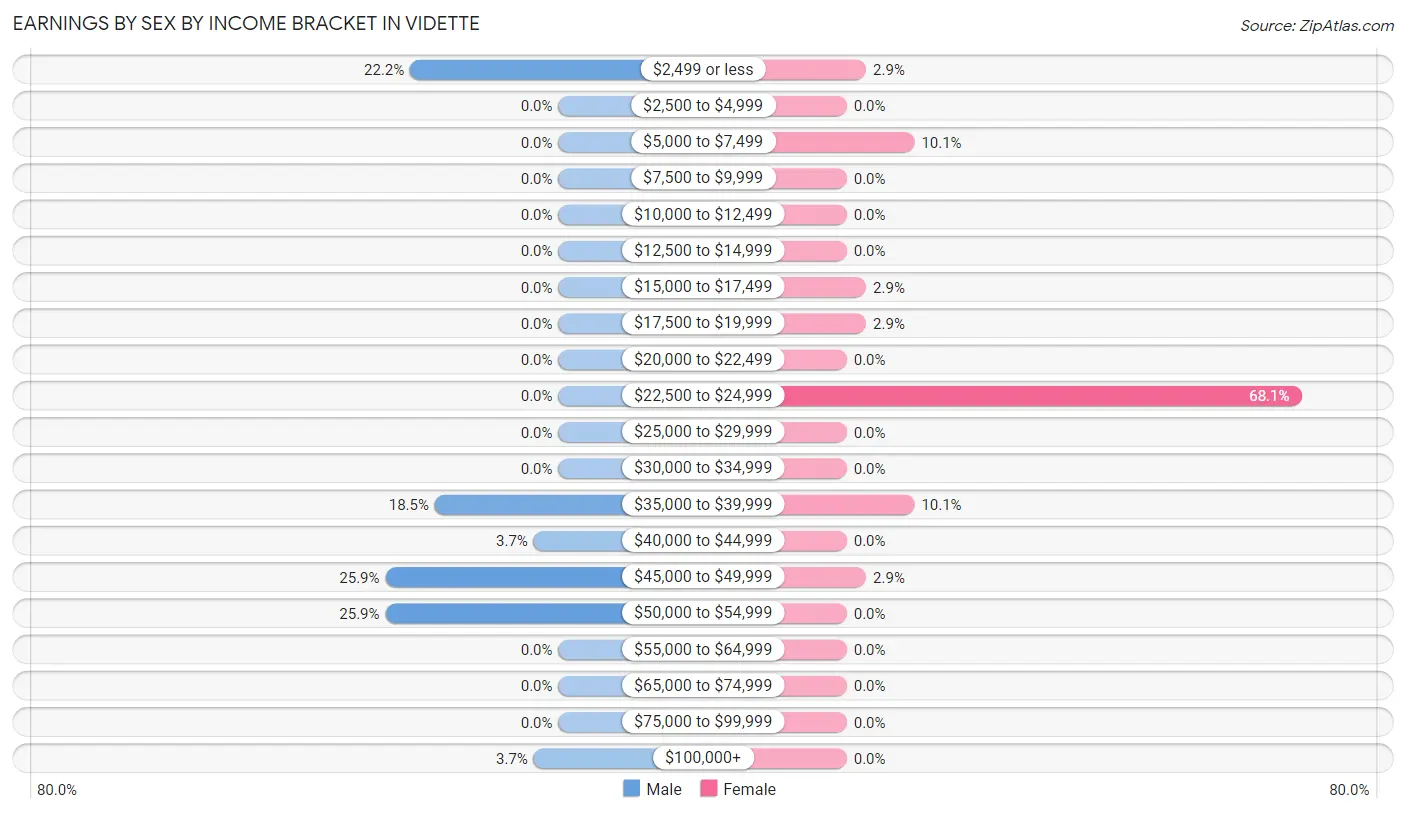
Earnings by Sex by Income Bracket in Vidette
The most common earnings brackets in Vidette are $45,000 to $49,999 for men (7 | 25.9%) and $22,500 to $24,999 for women (47 | 68.1%).
| Income | Male | Female |
| $2,499 or less | 6 (22.2%) | 2 (2.9%) |
| $2,500 to $4,999 | 0 (0.0%) | 0 (0.0%) |
| $5,000 to $7,499 | 0 (0.0%) | 7 (10.1%) |
| $7,500 to $9,999 | 0 (0.0%) | 0 (0.0%) |
| $10,000 to $12,499 | 0 (0.0%) | 0 (0.0%) |
| $12,500 to $14,999 | 0 (0.0%) | 0 (0.0%) |
| $15,000 to $17,499 | 0 (0.0%) | 2 (2.9%) |
| $17,500 to $19,999 | 0 (0.0%) | 2 (2.9%) |
| $20,000 to $22,499 | 0 (0.0%) | 0 (0.0%) |
| $22,500 to $24,999 | 0 (0.0%) | 47 (68.1%) |
| $25,000 to $29,999 | 0 (0.0%) | 0 (0.0%) |
| $30,000 to $34,999 | 0 (0.0%) | 0 (0.0%) |
| $35,000 to $39,999 | 5 (18.5%) | 7 (10.1%) |
| $40,000 to $44,999 | 1 (3.7%) | 0 (0.0%) |
| $45,000 to $49,999 | 7 (25.9%) | 2 (2.9%) |
| $50,000 to $54,999 | 7 (25.9%) | 0 (0.0%) |
| $55,000 to $64,999 | 0 (0.0%) | 0 (0.0%) |
| $65,000 to $74,999 | 0 (0.0%) | 0 (0.0%) |
| $75,000 to $99,999 | 0 (0.0%) | 0 (0.0%) |
| $100,000+ | 1 (3.7%) | 0 (0.0%) |
| Total | 27 (100.0%) | 69 (100.0%) |
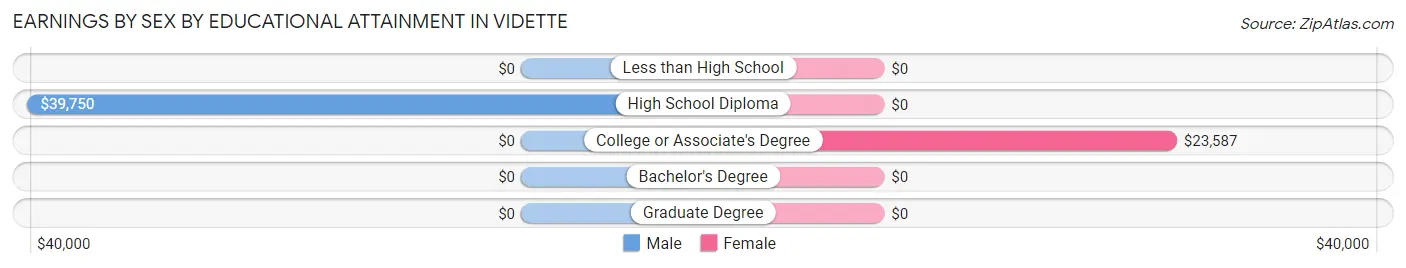
Earnings by Sex by Educational Attainment in Vidette
Average earnings in Vidette are $45,536 for men and $23,641 for women, a difference of 48.1%. Men with an educational attainment of high school diploma enjoy the highest average annual earnings of $39,750, while those with high school diploma education earn the least with $39,750. Women with an educational attainment of college or associate's degree earn the most with the average annual earnings of $23,587, while those with college or associate's degree education have the smallest earnings of $23,587.
| Educational Attainment | Male Income | Female Income |
| Less than High School | - | - |
| High School Diploma | $39,750 | $0 |
| College or Associate's Degree | - | - |
| Bachelor's Degree | - | - |
| Graduate Degree | - | - |
| Total | $45,536 | $23,641 |
Family Income in Vidette
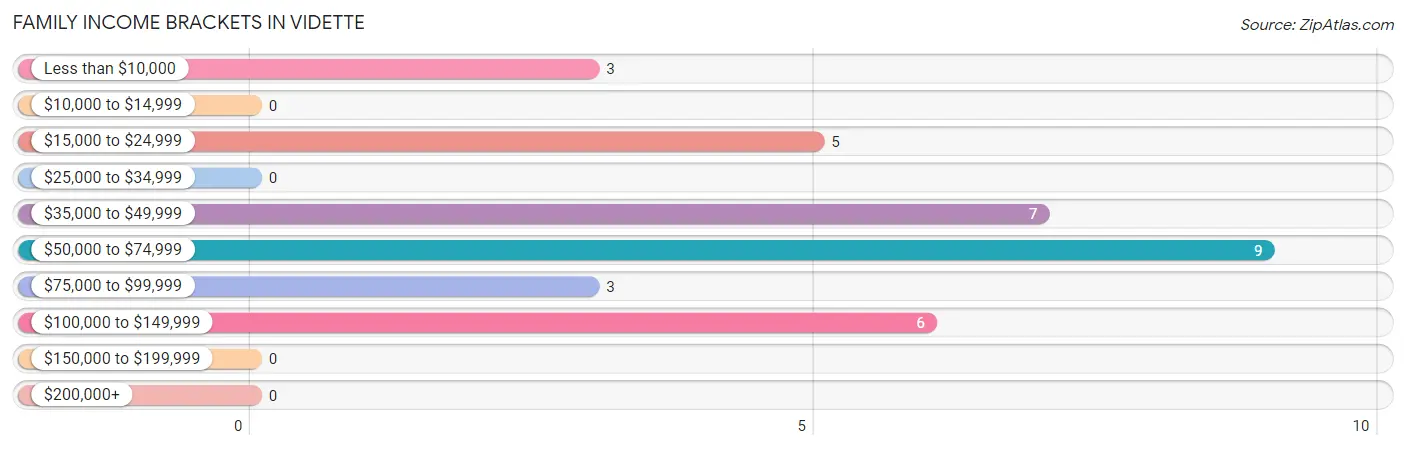
Family Income Brackets in Vidette
According to the Vidette family income data, there are 9 families falling into the $50,000 to $74,999 income range, which is the most common income bracket and makes up 27.3% of all families.
| Income Bracket | # Families | % Families |
| Less than $10,000 | 3 | 9.1% |
| $10,000 to $14,999 | 0 | 0.0% |
| $15,000 to $24,999 | 5 | 15.2% |
| $25,000 to $34,999 | 0 | 0.0% |
| $35,000 to $49,999 | 7 | 21.2% |
| $50,000 to $74,999 | 9 | 27.3% |
| $75,000 to $99,999 | 3 | 9.1% |
| $100,000 to $149,999 | 6 | 18.2% |
| $150,000 to $199,999 | 0 | 0.0% |
| $200,000+ | 0 | 0.0% |
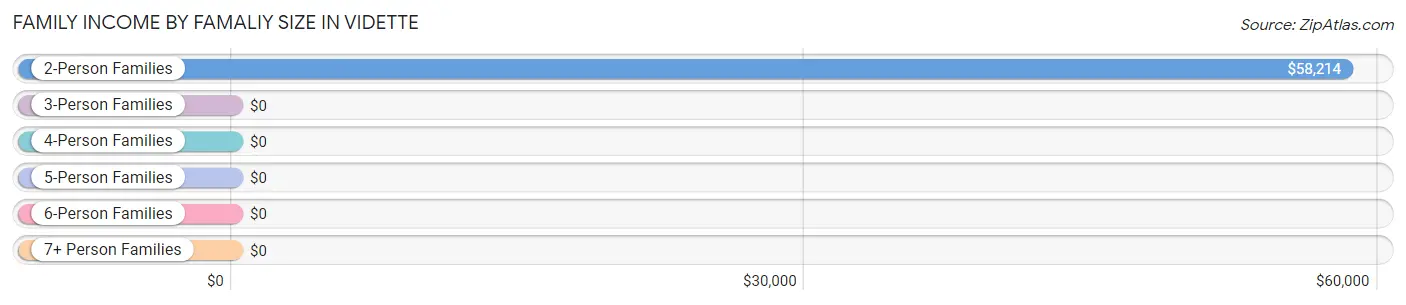
Family Income by Famaliy Size in Vidette
2-person families (22 | 66.7%) account for the highest median family income in Vidette with $58,214 per family, while 2-person families (22 | 66.7%) have the highest median income of $29,107 per family member.
| Income Bracket | # Families | Median Income |
| 2-Person Families | 22 (66.7%) | $58,214 |
| 3-Person Families | 5 (15.1%) | $0 |
| 4-Person Families | 0 (0.0%) | $0 |
| 5-Person Families | 0 (0.0%) | $0 |
| 6-Person Families | 3 (9.1%) | $0 |
| 7+ Person Families | 3 (9.1%) | $0 |
| Total | 33 (100.0%) | $58,036 |
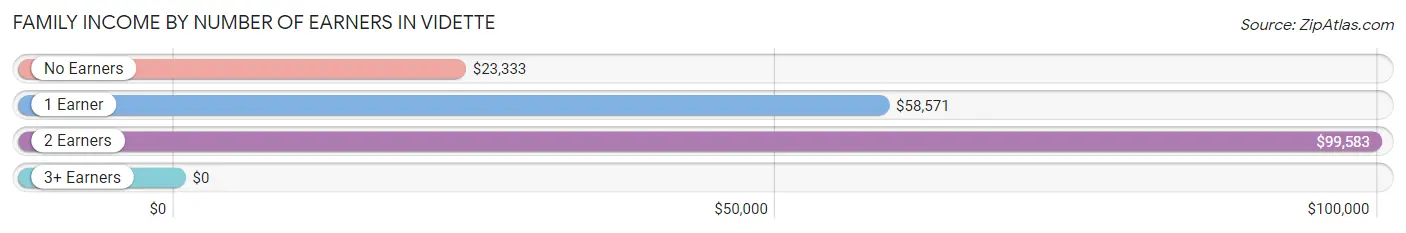
Family Income by Number of Earners in Vidette
| Number of Earners | # Families | Median Income |
| No Earners | 12 (36.4%) | $23,333 |
| 1 Earner | 10 (30.3%) | $58,571 |
| 2 Earners | 11 (33.3%) | $99,583 |
| 3+ Earners | 0 (0.0%) | $0 |
| Total | 33 (100.0%) | $58,036 |
Household Income in Vidette
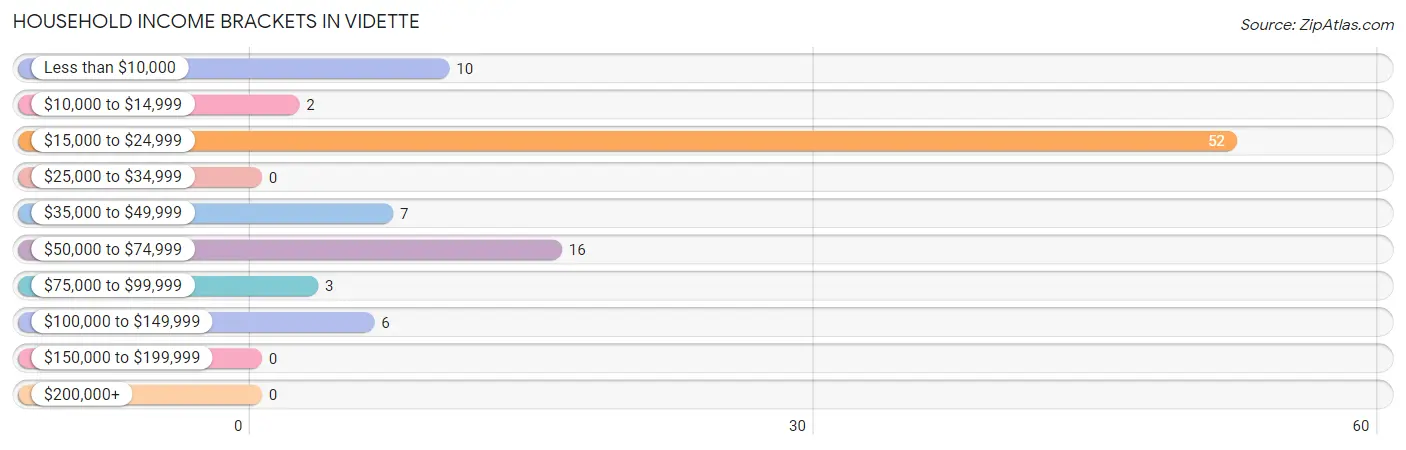
Household Income Brackets in Vidette
With 52 households falling in the category, the $15,000 to $24,999 income range is the most frequent in Vidette, accounting for 54.2% of all households.
| Income Bracket | # Households | % Households |
| Less than $10,000 | 10 | 10.4% |
| $10,000 to $14,999 | 2 | 2.1% |
| $15,000 to $24,999 | 52 | 54.2% |
| $25,000 to $34,999 | 0 | 0.0% |
| $35,000 to $49,999 | 7 | 7.3% |
| $50,000 to $74,999 | 16 | 16.7% |
| $75,000 to $99,999 | 3 | 3.1% |
| $100,000 to $149,999 | 6 | 6.3% |
| $150,000 to $199,999 | 0 | 0.0% |
| $200,000+ | 0 | 0.0% |
Household Income by Householder Age in Vidette
The median household income in Vidette is $24,184, with the highest median household income of $67,679 found in the 65+ years age bracket for the primary householder. A total of 25 households (26.0%) fall into this category.
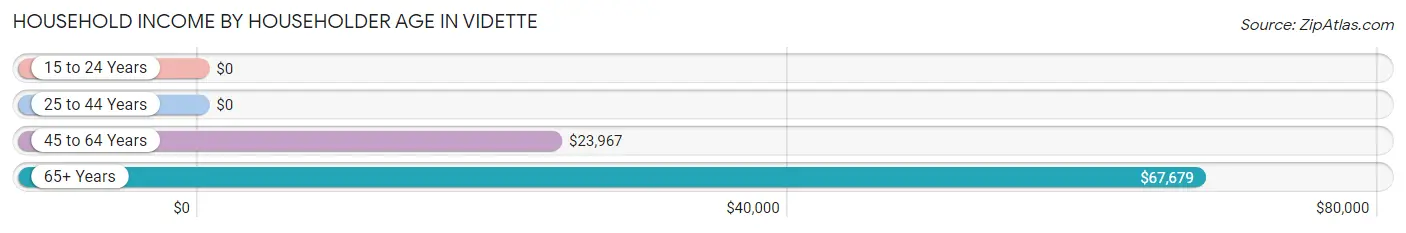
| Income Bracket | # Households | Median Income |
| 15 to 24 Years | 0 (0.0%) | $0 |
| 25 to 44 Years | 3 (3.1%) | $0 |
| 45 to 64 Years | 68 (70.8%) | $23,967 |
| 65+ Years | 25 (26.0%) | $67,679 |
| Total | 96 (100.0%) | $24,184 |
Poverty in Vidette
Income Below Poverty by Sex and Age in Vidette
With 34.3% poverty level for males and 11.0% for females among the residents of Vidette, under 5 year old males and 15 year old females are the most vulnerable to poverty, with 6 males (100.0%) and 3 females (100.0%) in their respective age groups living below the poverty level.
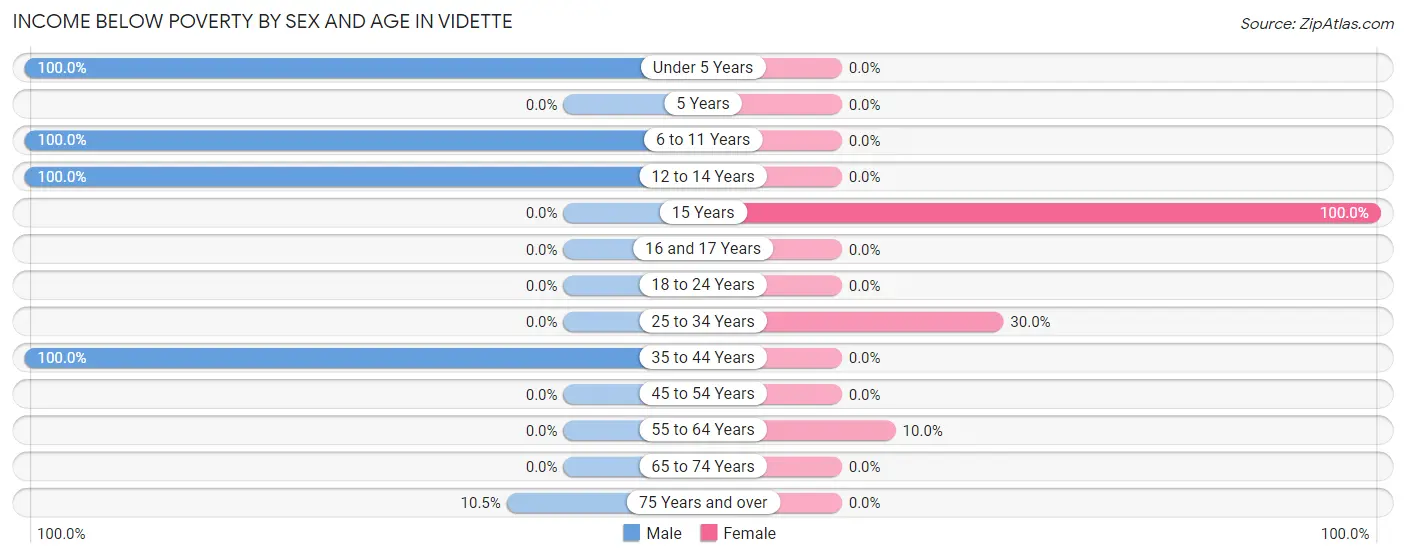
| Age Bracket | Male | Female |
| Under 5 Years | 6 (100.0%) | 0 (0.0%) |
| 5 Years | 0 (0.0%) | 0 (0.0%) |
| 6 to 11 Years | 6 (100.0%) | 0 (0.0%) |
| 12 to 14 Years | 6 (100.0%) | 0 (0.0%) |
| 15 Years | 0 (0.0%) | 3 (100.0%) |
| 16 and 17 Years | 0 (0.0%) | 0 (0.0%) |
| 18 to 24 Years | 0 (0.0%) | 0 (0.0%) |
| 25 to 34 Years | 0 (0.0%) | 3 (30.0%) |
| 35 to 44 Years | 5 (100.0%) | 0 (0.0%) |
| 45 to 54 Years | 0 (0.0%) | 0 (0.0%) |
| 55 to 64 Years | 0 (0.0%) | 7 (10.0%) |
| 65 to 74 Years | 0 (0.0%) | 0 (0.0%) |
| 75 Years and over | 2 (10.5%) | 0 (0.0%) |
| Total | 25 (34.3%) | 13 (11.0%) |
Income Above Poverty by Sex and Age in Vidette
According to the poverty statistics in Vidette, males aged 25 to 34 years and females aged under 5 years are the age groups that are most secure financially, with 100.0% of males and 100.0% of females in these age groups living above the poverty line.
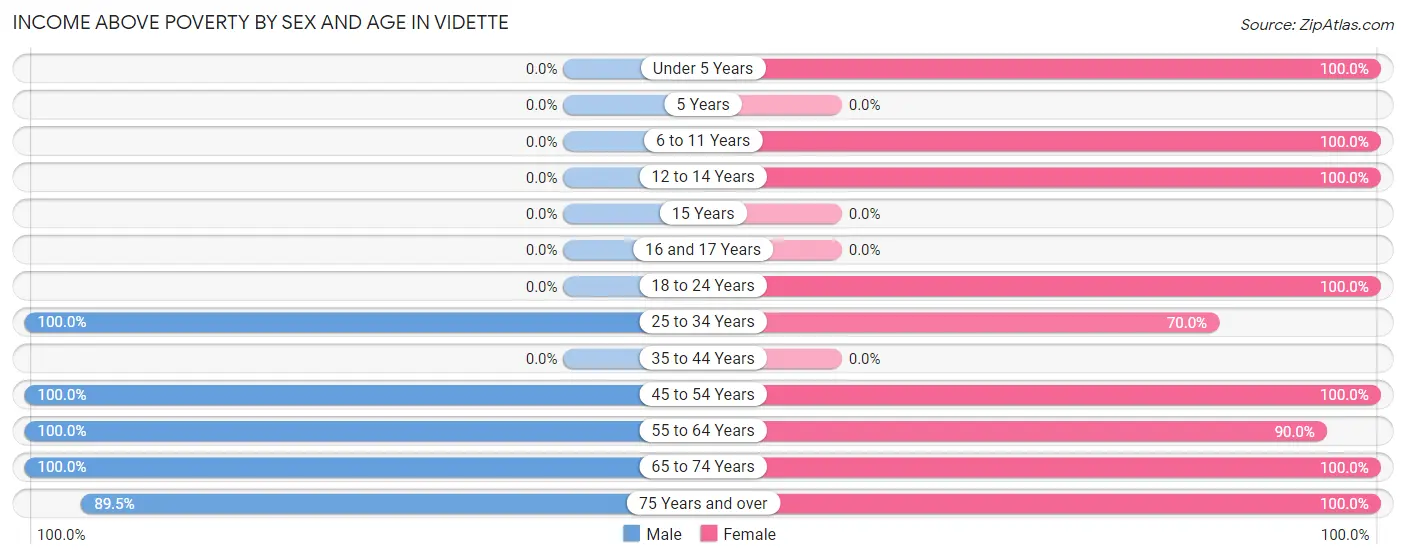
| Age Bracket | Male | Female |
| Under 5 Years | 0 (0.0%) | 8 (100.0%) |
| 5 Years | 0 (0.0%) | 0 (0.0%) |
| 6 to 11 Years | 0 (0.0%) | 5 (100.0%) |
| 12 to 14 Years | 0 (0.0%) | 5 (100.0%) |
| 15 Years | 0 (0.0%) | 0 (0.0%) |
| 16 and 17 Years | 0 (0.0%) | 0 (0.0%) |
| 18 to 24 Years | 0 (0.0%) | 3 (100.0%) |
| 25 to 34 Years | 11 (100.0%) | 7 (70.0%) |
| 35 to 44 Years | 0 (0.0%) | 0 (0.0%) |
| 45 to 54 Years | 10 (100.0%) | 3 (100.0%) |
| 55 to 64 Years | 8 (100.0%) | 63 (90.0%) |
| 65 to 74 Years | 2 (100.0%) | 5 (100.0%) |
| 75 Years and over | 17 (89.5%) | 6 (100.0%) |
| Total | 48 (65.7%) | 105 (89.0%) |
Income Below Poverty Among Married-Couple Families in Vidette
The poverty statistics for married-couple families in Vidette show that 15.8% or 3 of the total 19 families live below the poverty line. Families with 3 or 4 children have the highest poverty rate of 50.0%, comprising of 3 families. On the other hand, families with no children have the lowest poverty rate of 0.0%, which includes 0 families.
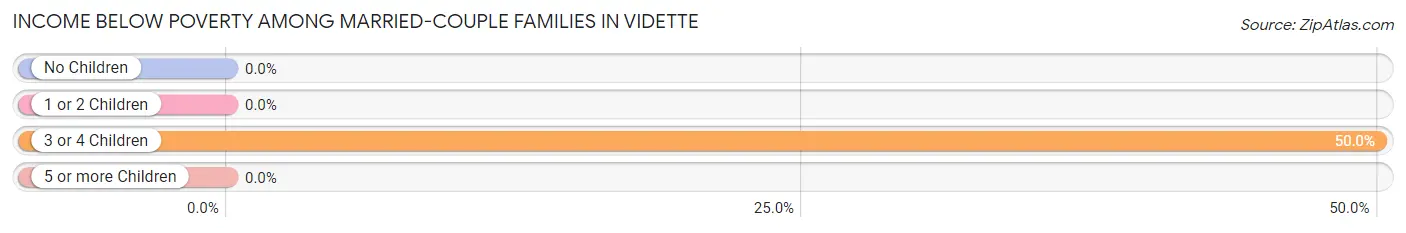
| Children | Above Poverty | Below Poverty |
| No Children | 12 (100.0%) | 0 (0.0%) |
| 1 or 2 Children | 1 (100.0%) | 0 (0.0%) |
| 3 or 4 Children | 3 (50.0%) | 3 (50.0%) |
| 5 or more Children | 0 (0.0%) | 0 (0.0%) |
| Total | 16 (84.2%) | 3 (15.8%) |
Income Below Poverty Among Single-Parent Households in Vidette
| Children | Single Father | Single Mother |
| No Children | 0 (0.0%) | 0 (0.0%) |
| 1 or 2 Children | 0 (0.0%) | 0 (0.0%) |
| 3 or 4 Children | 0 (0.0%) | 0 (0.0%) |
| 5 or more Children | 0 (0.0%) | 0 (0.0%) |
| Total | 0 (0.0%) | 0 (0.0%) |
Income Below Poverty Among Married-Couple vs Single-Parent Households in Vidette
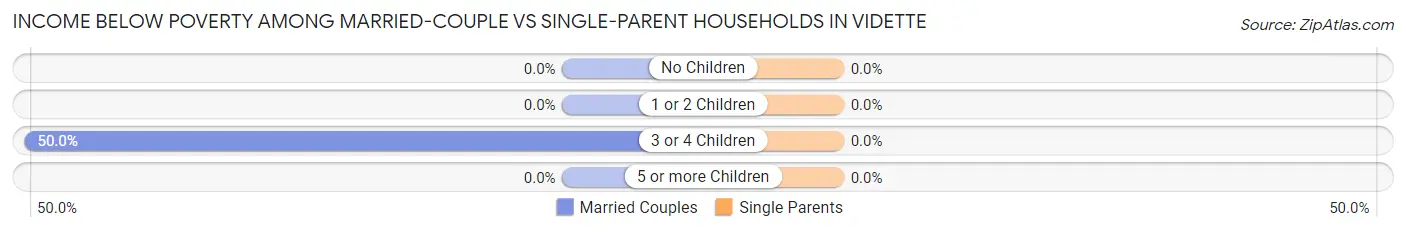
| Children | Married-Couple Families | Single-Parent Households |
| No Children | 0 (0.0%) | 0 (0.0%) |
| 1 or 2 Children | 0 (0.0%) | 0 (0.0%) |
| 3 or 4 Children | 3 (50.0%) | 0 (0.0%) |
| 5 or more Children | 0 (0.0%) | 0 (0.0%) |
| Total | 3 (15.8%) | 0 (0.0%) |
Race in Vidette
The most populous races in Vidette are Black / African American (115 | 60.2%), and White / Caucasian (76 | 39.8%).
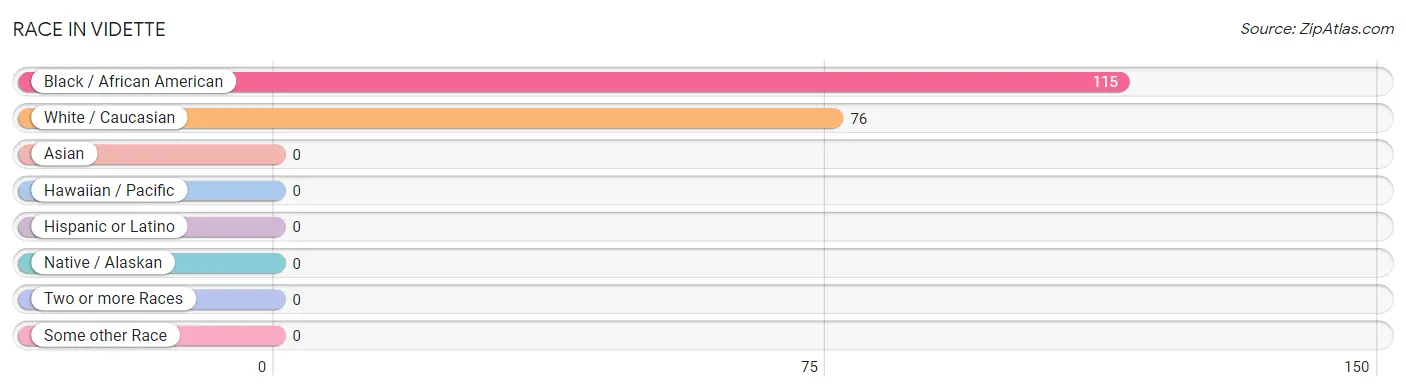
| Race | # Population | % Population |
| Asian | 0 | 0.0% |
| Black / African American | 115 | 60.2% |
| Hawaiian / Pacific | 0 | 0.0% |
| Hispanic or Latino | 0 | 0.0% |
| Native / Alaskan | 0 | 0.0% |
| White / Caucasian | 76 | 39.8% |
| Two or more Races | 0 | 0.0% |
| Some other Race | 0 | 0.0% |
| Total | 191 | 100.0% |
Ancestry in Vidette
The most populous ancestries reported in Vidette are American (22 | 11.5%), English (15 | 7.9%), German (13 | 6.8%), Irish (10 | 5.2%), and Dutch (4 | 2.1%), together accounting for 33.5% of all Vidette residents.
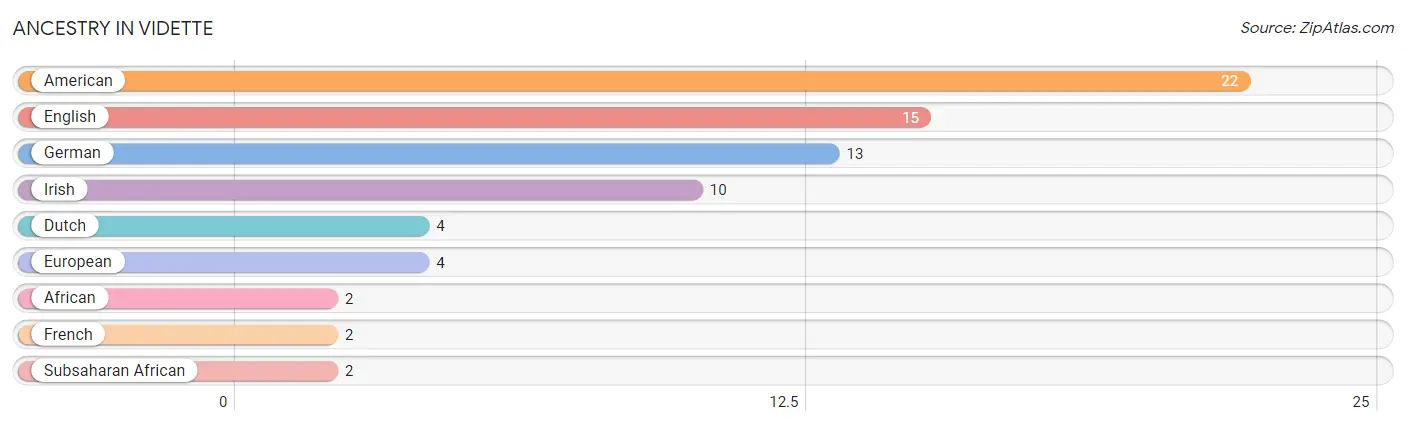
| Ancestry | # Population | % Population |
| African | 2 | 1.1% |
| American | 22 | 11.5% |
| Dutch | 4 | 2.1% |
| English | 15 | 7.9% |
| European | 4 | 2.1% |
| French | 2 | 1.1% |
| German | 13 | 6.8% |
| Irish | 10 | 5.2% |
| Subsaharan African | 2 | 1.1% | View All 9 Rows |
Immigrants in Vidette

| Immigration Origin | # Population | % Population | View All 0 Rows |
Sex and Age in Vidette
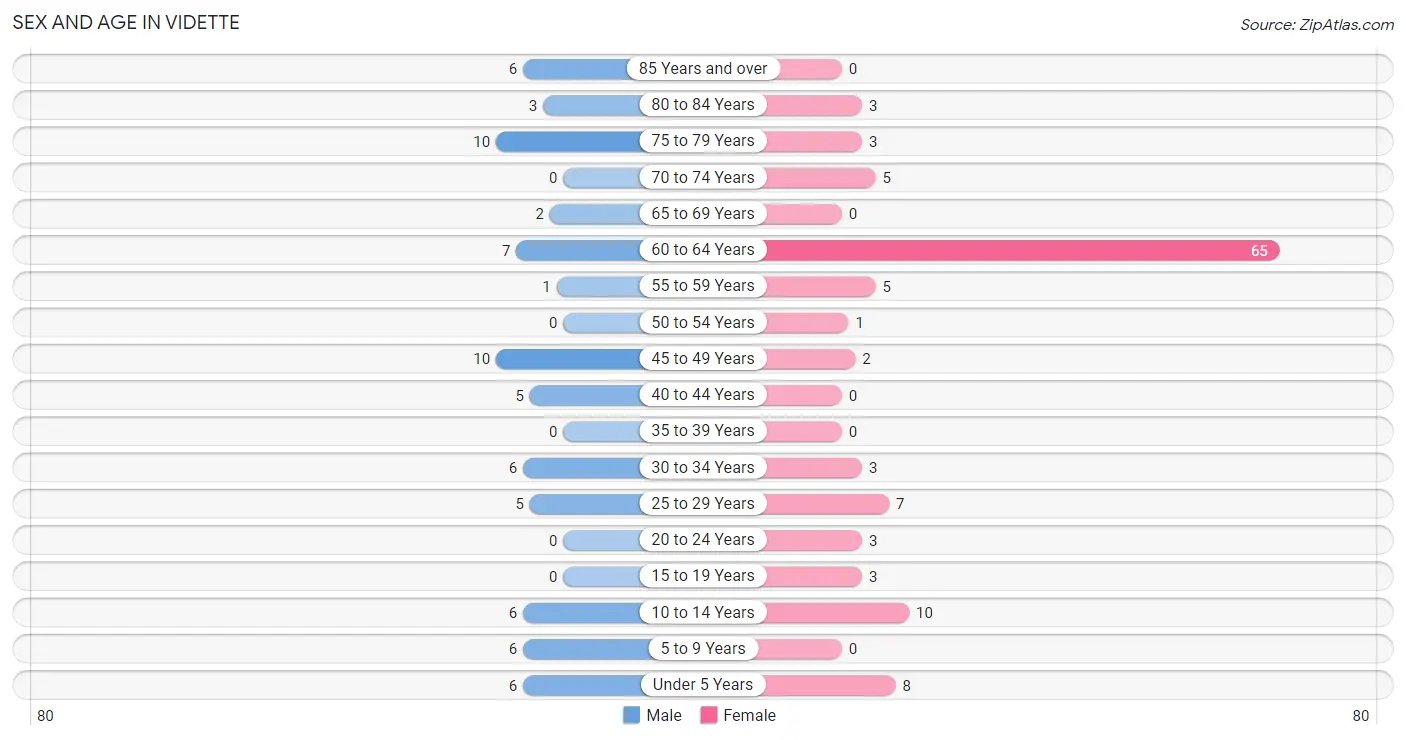
Sex and Age in Vidette
The most populous age groups in Vidette are 45 to 49 Years (10 | 13.7%) for men and 60 to 64 Years (65 | 55.1%) for women.
| Age Bracket | Male | Female |
| Under 5 Years | 6 (8.2%) | 8 (6.8%) |
| 5 to 9 Years | 6 (8.2%) | 0 (0.0%) |
| 10 to 14 Years | 6 (8.2%) | 10 (8.5%) |
| 15 to 19 Years | 0 (0.0%) | 3 (2.5%) |
| 20 to 24 Years | 0 (0.0%) | 3 (2.5%) |
| 25 to 29 Years | 5 (6.9%) | 7 (5.9%) |
| 30 to 34 Years | 6 (8.2%) | 3 (2.5%) |
| 35 to 39 Years | 0 (0.0%) | 0 (0.0%) |
| 40 to 44 Years | 5 (6.9%) | 0 (0.0%) |
| 45 to 49 Years | 10 (13.7%) | 2 (1.7%) |
| 50 to 54 Years | 0 (0.0%) | 1 (0.9%) |
| 55 to 59 Years | 1 (1.4%) | 5 (4.2%) |
| 60 to 64 Years | 7 (9.6%) | 65 (55.1%) |
| 65 to 69 Years | 2 (2.7%) | 0 (0.0%) |
| 70 to 74 Years | 0 (0.0%) | 5 (4.2%) |
| 75 to 79 Years | 10 (13.7%) | 3 (2.5%) |
| 80 to 84 Years | 3 (4.1%) | 3 (2.5%) |
| 85 Years and over | 6 (8.2%) | 0 (0.0%) |
| Total | 73 (100.0%) | 118 (100.0%) |
Families and Households in Vidette
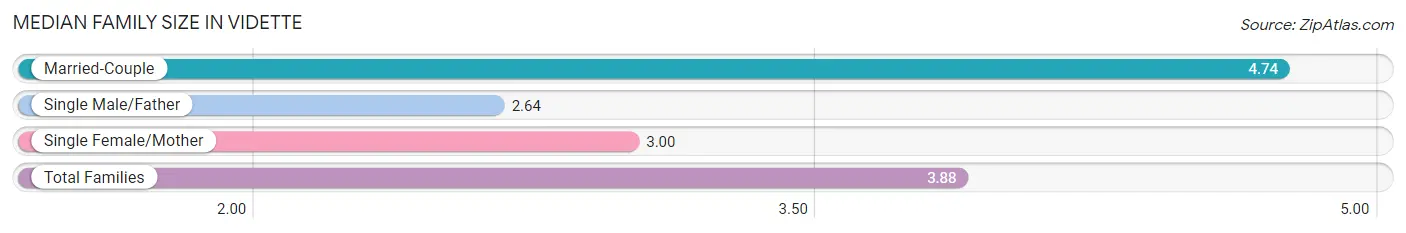
Median Family Size in Vidette
The median family size in Vidette is 3.88 persons per family, with married-couple families (19 | 57.6%) accounting for the largest median family size of 4.74 persons per family. On the other hand, single male/father families (11 | 33.3%) represent the smallest median family size with 2.64 persons per family.
| Family Type | # Families | Family Size |
| Married-Couple | 19 (57.6%) | 4.74 |
| Single Male/Father | 11 (33.3%) | 2.64 |
| Single Female/Mother | 3 (9.1%) | 3.00 |
| Total Families | 33 (100.0%) | 3.88 |
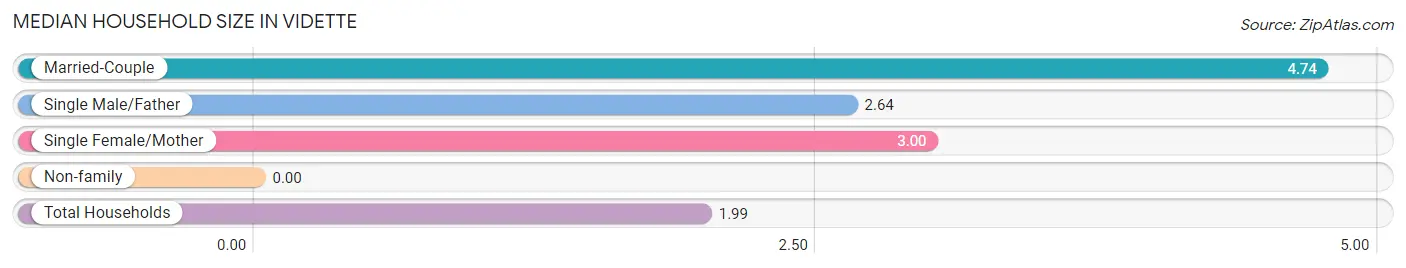
Median Household Size in Vidette
| Household Type | # Households | Household Size |
| Married-Couple | 19 (19.8%) | 4.74 |
| Single Male/Father | 11 (11.5%) | 2.64 |
| Single Female/Mother | 3 (3.1%) | 3.00 |
| Non-family | 63 (65.6%) | - |
| Total Households | 96 (100.0%) | 1.99 |
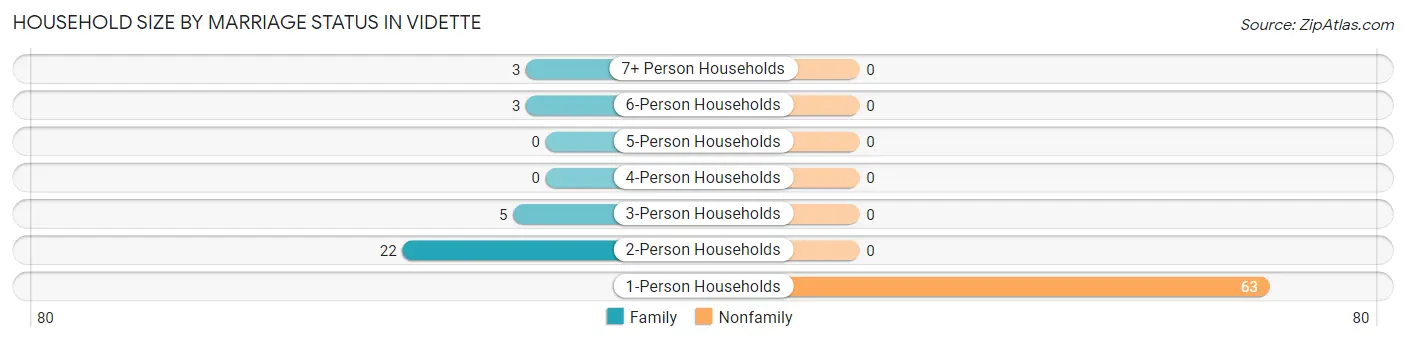
Household Size by Marriage Status in Vidette
Out of a total of 96 households in Vidette, 33 (34.4%) are family households, while 63 (65.6%) are nonfamily households. The most numerous type of family households are 2-person households, comprising 22, and the most common type of nonfamily households are 1-person households, comprising 63.
| Household Size | Family Households | Nonfamily Households |
| 1-Person Households | - | 63 (65.6%) |
| 2-Person Households | 22 (22.9%) | 0 (0.0%) |
| 3-Person Households | 5 (5.2%) | 0 (0.0%) |
| 4-Person Households | 0 (0.0%) | 0 (0.0%) |
| 5-Person Households | 0 (0.0%) | 0 (0.0%) |
| 6-Person Households | 3 (3.1%) | 0 (0.0%) |
| 7+ Person Households | 3 (3.1%) | 0 (0.0%) |
| Total | 33 (34.4%) | 63 (65.6%) |
Female Fertility in Vidette
Fertility by Age in Vidette
| Age Bracket | Women with Births | Births / 1,000 Women |
| 15 to 19 years | 0 (0.0%) | 0.0 |
| 20 to 34 years | 0 (0.0%) | 0.0 |
| 35 to 50 years | 0 (0.0%) | 0.0 |
| Total | 0 (0.0%) | 0.0 |
Fertility by Age by Marriage Status in Vidette
| Age Bracket | Married | Unmarried |
| 15 to 19 years | 0 (0.0%) | 0 (0.0%) |
| 20 to 34 years | 0 (0.0%) | 0 (0.0%) |
| 35 to 50 years | 0 (0.0%) | 0 (0.0%) |
| Total | 0 (0.0%) | 0 (0.0%) |
Fertility by Education in Vidette
| Educational Attainment | Women with Births | Births / 1,000 Women |
| Less than High School | 0 (0.0%) | 0.0 |
| High School Diploma | 0 (0.0%) | 0.0 |
| College or Associate's Degree | 0 (0.0%) | 0.0 |
| Bachelor's Degree | 0 (0.0%) | 0.0 |
| Graduate Degree | 0 (0.0%) | 0.0 |
| Total | 0 (0.0%) | 0.0 |
Fertility by Education by Marriage Status in Vidette
| Educational Attainment | Married | Unmarried |
| Less than High School | 0 (0.0%) | 0 (0.0%) |
| High School Diploma | 0 (0.0%) | 0 (0.0%) |
| College or Associate's Degree | 0 (0.0%) | 0 (0.0%) |
| Bachelor's Degree | 0 (0.0%) | 0 (0.0%) |
| Graduate Degree | 0 (0.0%) | 0 (0.0%) |
| Total | 0 (0.0%) | 0 (0.0%) |
Employment Characteristics in Vidette
Employment by Class of Employer in Vidette
Among the 88 employed individuals in Vidette, self-employed (not incorporated) (48 | 54.5%), private company employees (27 | 30.7%), and local government employees (7 | 8.0%) make up the most common classes of employment.
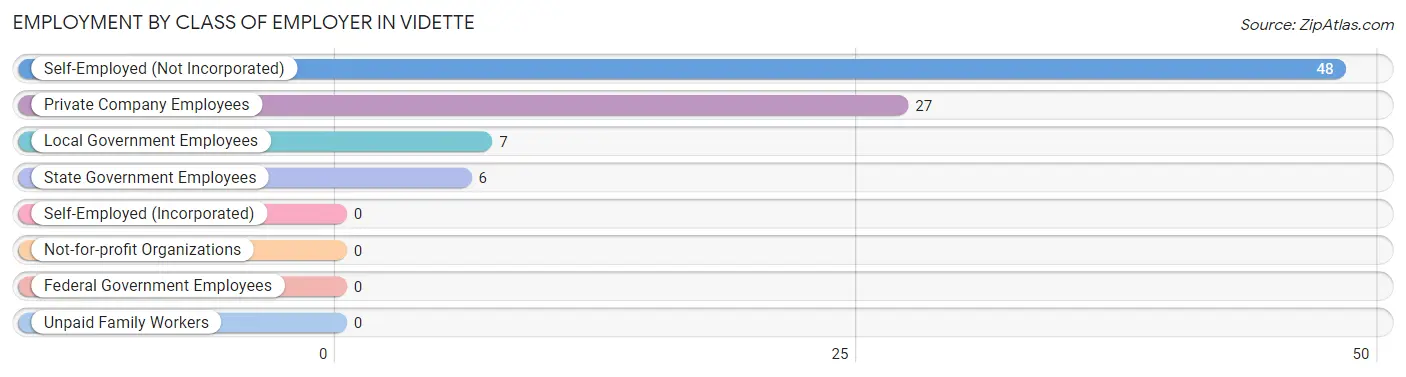
| Employer Class | # Employees | % Employees |
| Private Company Employees | 27 | 30.7% |
| Self-Employed (Incorporated) | 0 | 0.0% |
| Self-Employed (Not Incorporated) | 48 | 54.5% |
| Not-for-profit Organizations | 0 | 0.0% |
| Local Government Employees | 7 | 8.0% |
| State Government Employees | 6 | 6.8% |
| Federal Government Employees | 0 | 0.0% |
| Unpaid Family Workers | 0 | 0.0% |
| Total | 88 | 100.0% |
Employment Status by Age in Vidette
According to the labor force statistics for Vidette, out of the total population over 16 years of age (152), 65.1% or 99 individuals are in the labor force, with 11.1% or 11 of them unemployed. The age group with the highest labor force participation rate is 25 to 29 years, with 100.0% or 12 individuals in the labor force. Within the labor force, the 30 to 34 years age range has the highest percentage of unemployed individuals, with 100.0% or 6 of them being unemployed.
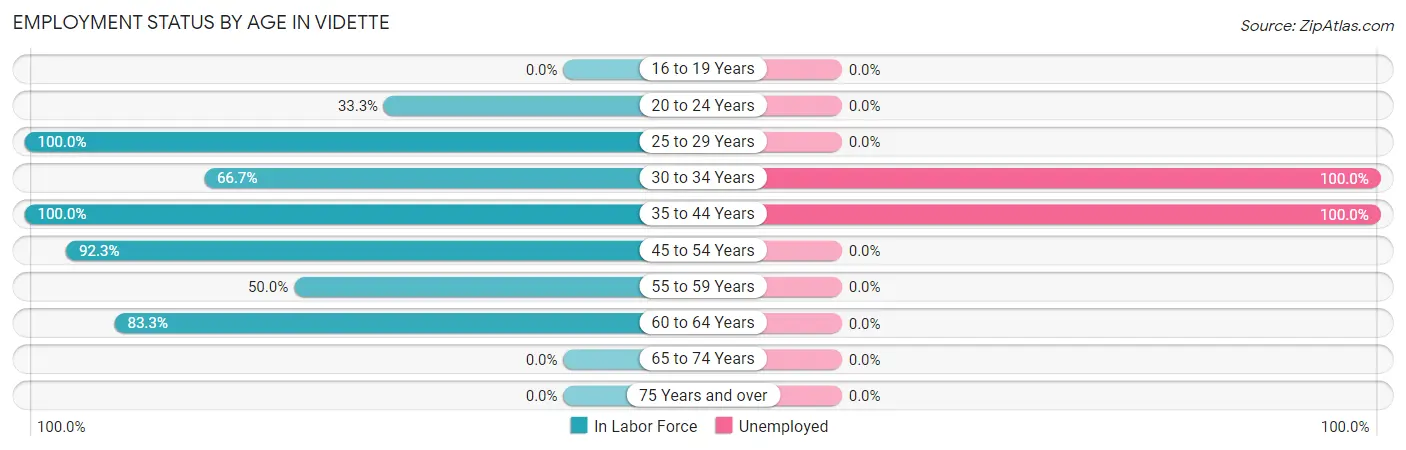
| Age Bracket | In Labor Force | Unemployed |
| 16 to 19 Years | 0 (0.0%) | 0 (0.0%) |
| 20 to 24 Years | 1 (33.3%) | 0 (0.0%) |
| 25 to 29 Years | 12 (100.0%) | 0 (0.0%) |
| 30 to 34 Years | 6 (66.7%) | 6 (100.0%) |
| 35 to 44 Years | 5 (100.0%) | 5 (100.0%) |
| 45 to 54 Years | 12 (92.3%) | 0 (0.0%) |
| 55 to 59 Years | 3 (50.0%) | 0 (0.0%) |
| 60 to 64 Years | 60 (83.3%) | 0 (0.0%) |
| 65 to 74 Years | 0 (0.0%) | 0 (0.0%) |
| 75 Years and over | 0 (0.0%) | 0 (0.0%) |
| Total | 99 (65.1%) | 11 (11.1%) |
Employment Status by Educational Attainment in Vidette
According to labor force statistics for Vidette, 83.8% of individuals (98) out of the total population between 25 and 64 years of age (117) are in the labor force, with 11.2% or 11 of them being unemployed. The group with the highest labor force participation rate are those with the educational attainment of bachelor's degree or higher, with 100.0% or 6 individuals in the labor force. Within the labor force, individuals with less than high school education have the highest percentage of unemployment, with 100.0% or 6 of them being unemployed.
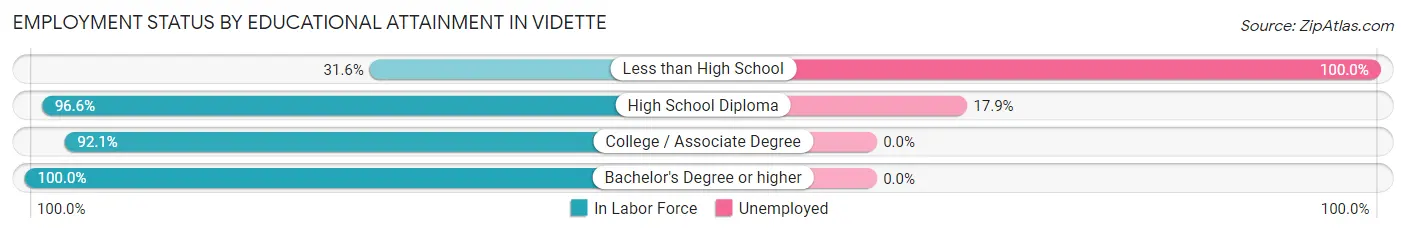
| Educational Attainment | In Labor Force | Unemployed |
| Less than High School | 6 (31.6%) | 19 (100.0%) |
| High School Diploma | 28 (96.6%) | 5 (17.9%) |
| College / Associate Degree | 58 (92.1%) | 0 (0.0%) |
| Bachelor's Degree or higher | 6 (100.0%) | 0 (0.0%) |
| Total | 98 (83.8%) | 13 (11.2%) |
Employment Occupations by Sex in Vidette
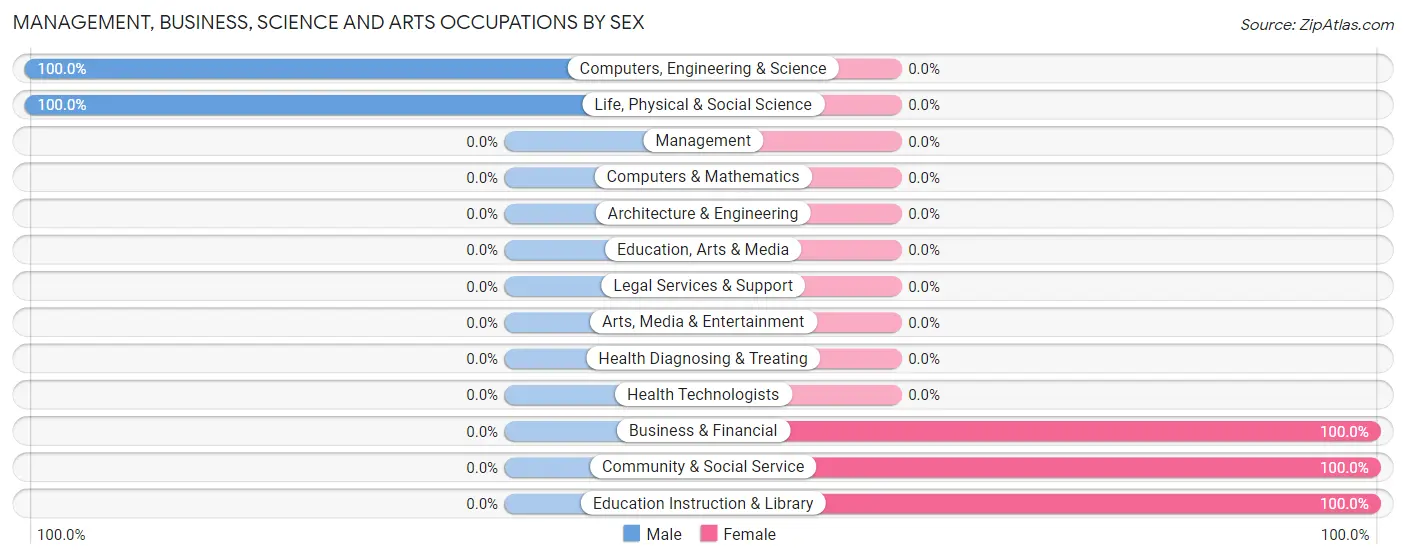
Management, Business, Science and Arts Occupations
The most common Management, Business, Science and Arts occupations in Vidette are Business & Financial (7 | 8.0%), Computers, Engineering & Science (4 | 4.5%), Life, Physical & Social Science (4 | 4.5%), Community & Social Service (4 | 4.5%), and Education Instruction & Library (4 | 4.5%).
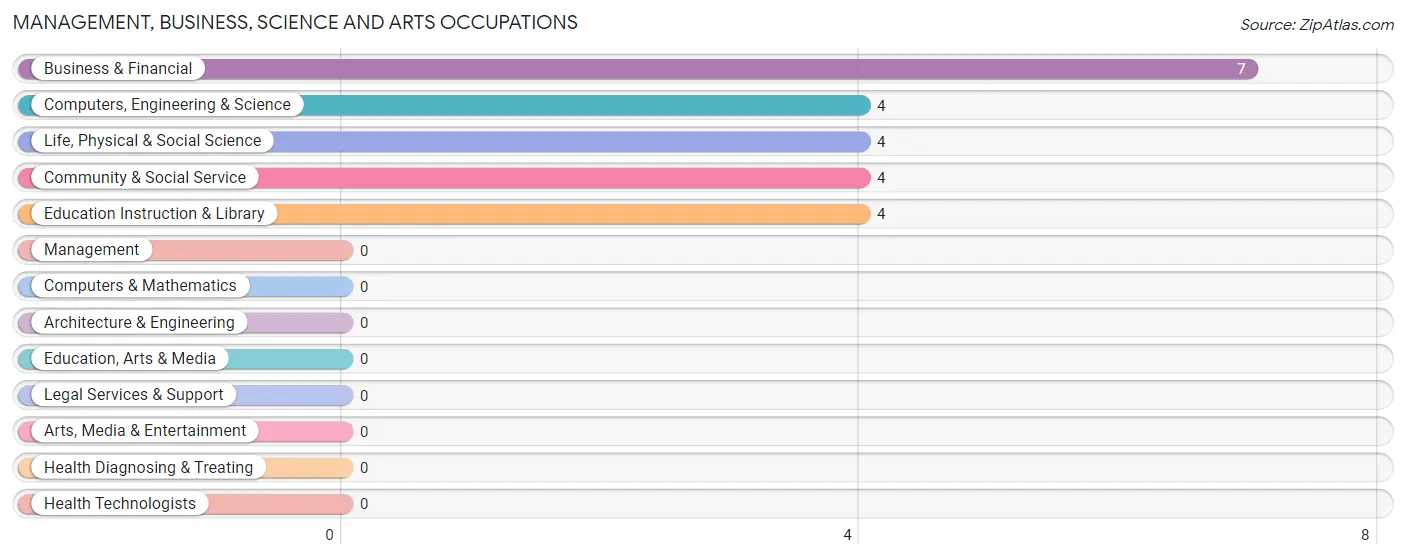
Management, Business, Science and Arts Occupations by Sex
Within the Management, Business, Science and Arts occupations in Vidette, the most male-oriented occupations are Computers, Engineering & Science (100.0%), and Life, Physical & Social Science (100.0%), while the most female-oriented occupations are Business & Financial (100.0%), Community & Social Service (100.0%), and Education Instruction & Library (100.0%).
| Occupation | Male | Female |
| Management | 0 (0.0%) | 0 (0.0%) |
| Business & Financial | 0 (0.0%) | 7 (100.0%) |
| Computers, Engineering & Science | 4 (100.0%) | 0 (0.0%) |
| Computers & Mathematics | 0 (0.0%) | 0 (0.0%) |
| Architecture & Engineering | 0 (0.0%) | 0 (0.0%) |
| Life, Physical & Social Science | 4 (100.0%) | 0 (0.0%) |
| Community & Social Service | 0 (0.0%) | 4 (100.0%) |
| Education, Arts & Media | 0 (0.0%) | 0 (0.0%) |
| Legal Services & Support | 0 (0.0%) | 0 (0.0%) |
| Education Instruction & Library | 0 (0.0%) | 4 (100.0%) |
| Arts, Media & Entertainment | 0 (0.0%) | 0 (0.0%) |
| Health Diagnosing & Treating | 0 (0.0%) | 0 (0.0%) |
| Health Technologists | 0 (0.0%) | 0 (0.0%) |
| Total (Category) | 4 (26.7%) | 11 (73.3%) |
| Total (Overall) | 21 (23.9%) | 67 (76.1%) |
Services Occupations
Services Occupations by Sex
| Occupation | Male | Female |
| Healthcare Support | 0 (0.0%) | 0 (0.0%) |
| Security & Protection | 0 (0.0%) | 0 (0.0%) |
| Firefighting & Prevention | 0 (0.0%) | 0 (0.0%) |
| Law Enforcement | 0 (0.0%) | 0 (0.0%) |
| Food Preparation & Serving | 0 (0.0%) | 0 (0.0%) |
| Cleaning & Maintenance | 0 (0.0%) | 0 (0.0%) |
| Personal Care & Service | 0 (0.0%) | 0 (0.0%) |
| Total (Category) | 0 (0.0%) | 0 (0.0%) |
| Total (Overall) | 21 (23.9%) | 67 (76.1%) |
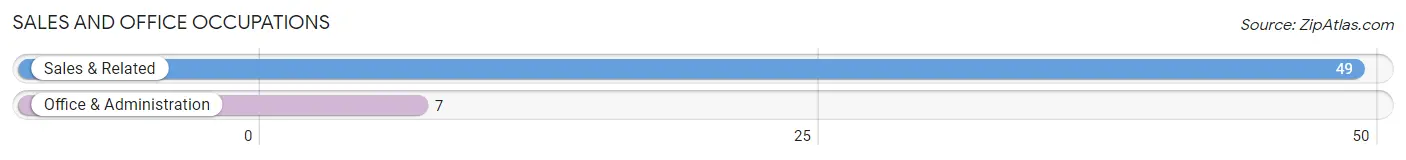
Sales and Office Occupations
The most common Sales and Office occupations in Vidette are Sales & Related (49 | 55.7%), and Office & Administration (7 | 8.0%).
Sales and Office Occupations by Sex
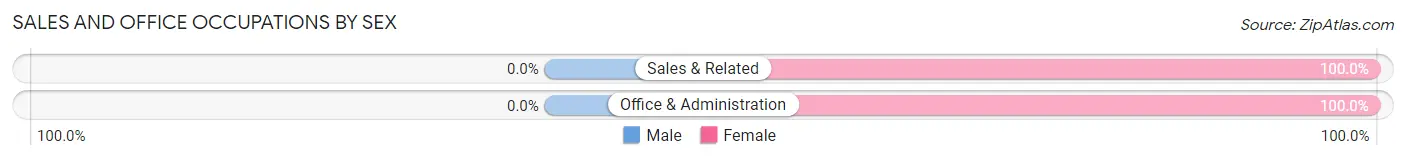
| Occupation | Male | Female |
| Sales & Related | 0 (0.0%) | 49 (100.0%) |
| Office & Administration | 0 (0.0%) | 7 (100.0%) |
| Total (Category) | 0 (0.0%) | 56 (100.0%) |
| Total (Overall) | 21 (23.9%) | 67 (76.1%) |
Natural Resources, Construction and Maintenance Occupations
The most common Natural Resources, Construction and Maintenance occupations in Vidette are , and Construction & Extraction (3 | 3.4%).
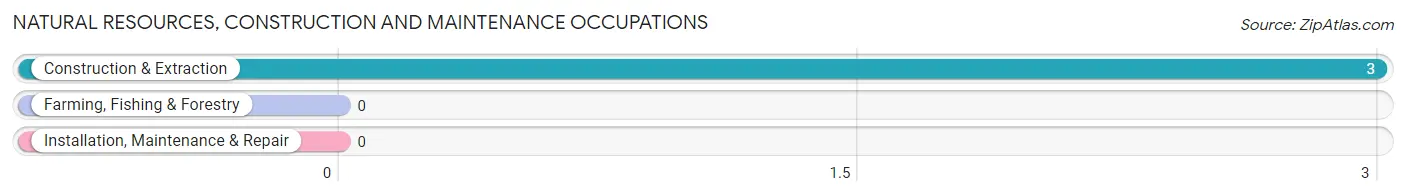
Natural Resources, Construction and Maintenance Occupations by Sex
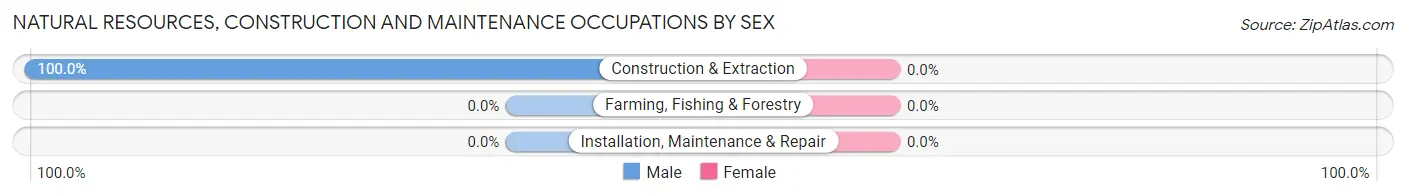
| Occupation | Male | Female |
| Farming, Fishing & Forestry | 0 (0.0%) | 0 (0.0%) |
| Construction & Extraction | 3 (100.0%) | 0 (0.0%) |
| Installation, Maintenance & Repair | 0 (0.0%) | 0 (0.0%) |
| Total (Category) | 3 (100.0%) | 0 (0.0%) |
| Total (Overall) | 21 (23.9%) | 67 (76.1%) |
Production, Transportation and Moving Occupations
The most common Production, Transportation and Moving occupations in Vidette are Transportation (9 | 10.2%), and Material Moving (5 | 5.7%).
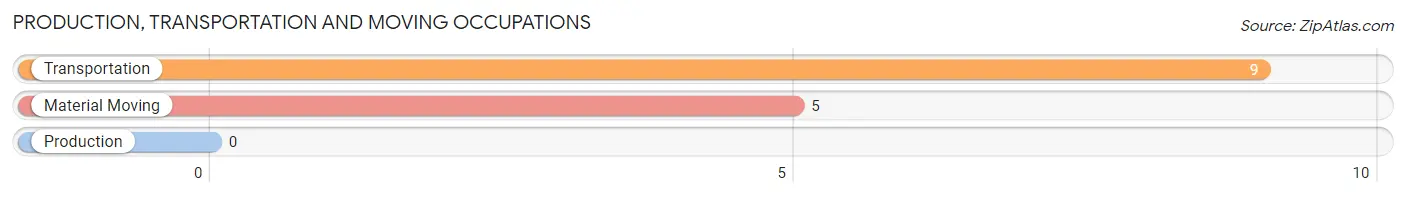
Production, Transportation and Moving Occupations by Sex
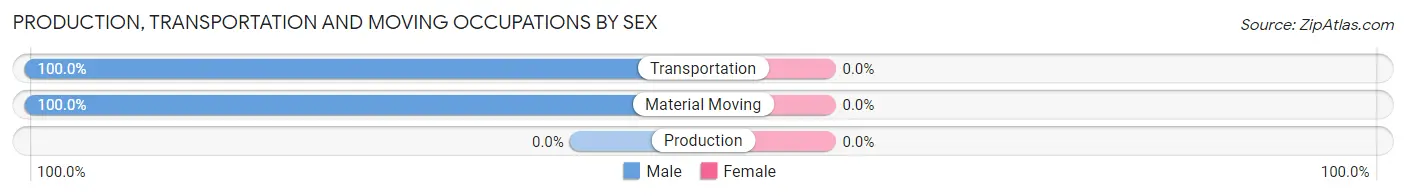
| Occupation | Male | Female |
| Production | 0 (0.0%) | 0 (0.0%) |
| Transportation | 9 (100.0%) | 0 (0.0%) |
| Material Moving | 5 (100.0%) | 0 (0.0%) |
| Total (Category) | 14 (100.0%) | 0 (0.0%) |
| Total (Overall) | 21 (23.9%) | 67 (76.1%) |
Employment Industries by Sex in Vidette
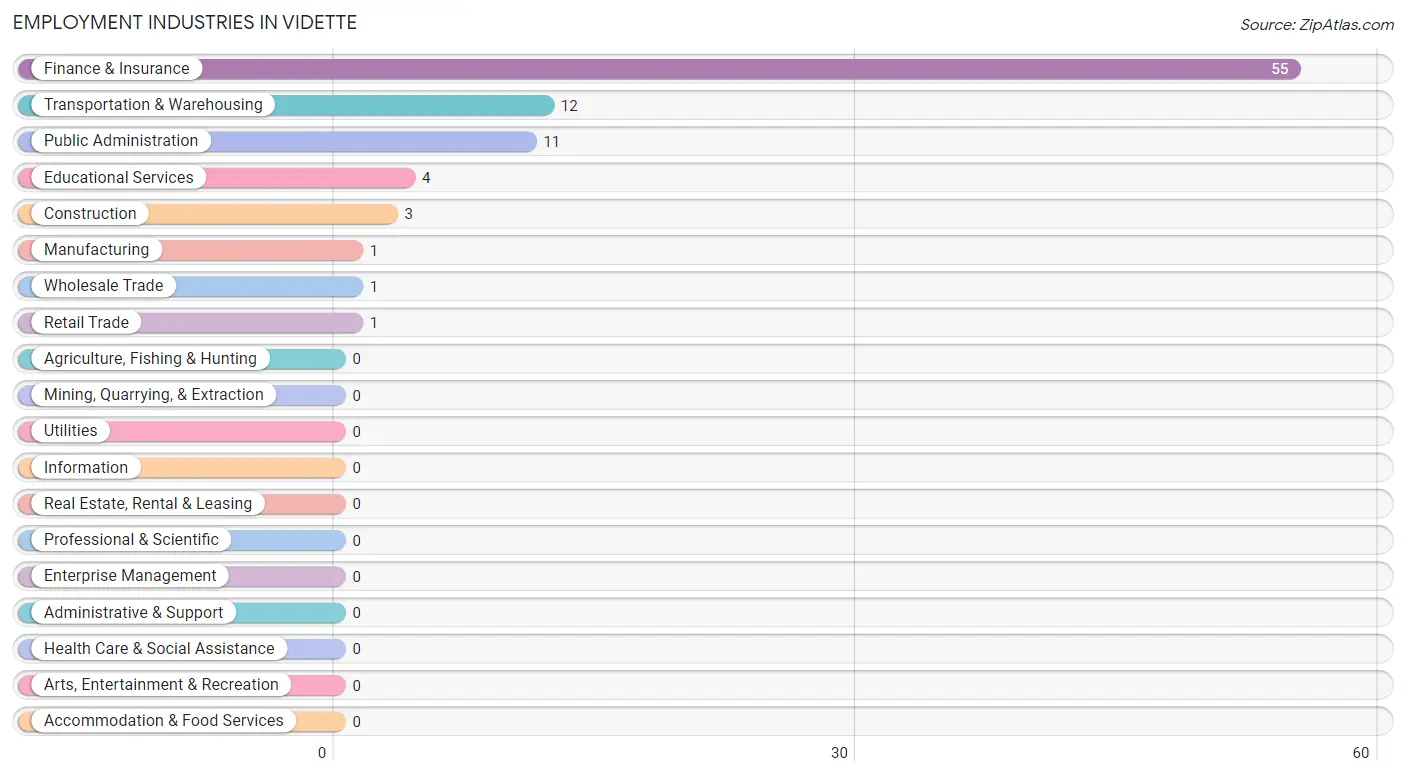
Employment Industries in Vidette
The major employment industries in Vidette include Finance & Insurance (55 | 62.5%), Transportation & Warehousing (12 | 13.6%), Public Administration (11 | 12.5%), Educational Services (4 | 4.5%), and Construction (3 | 3.4%).
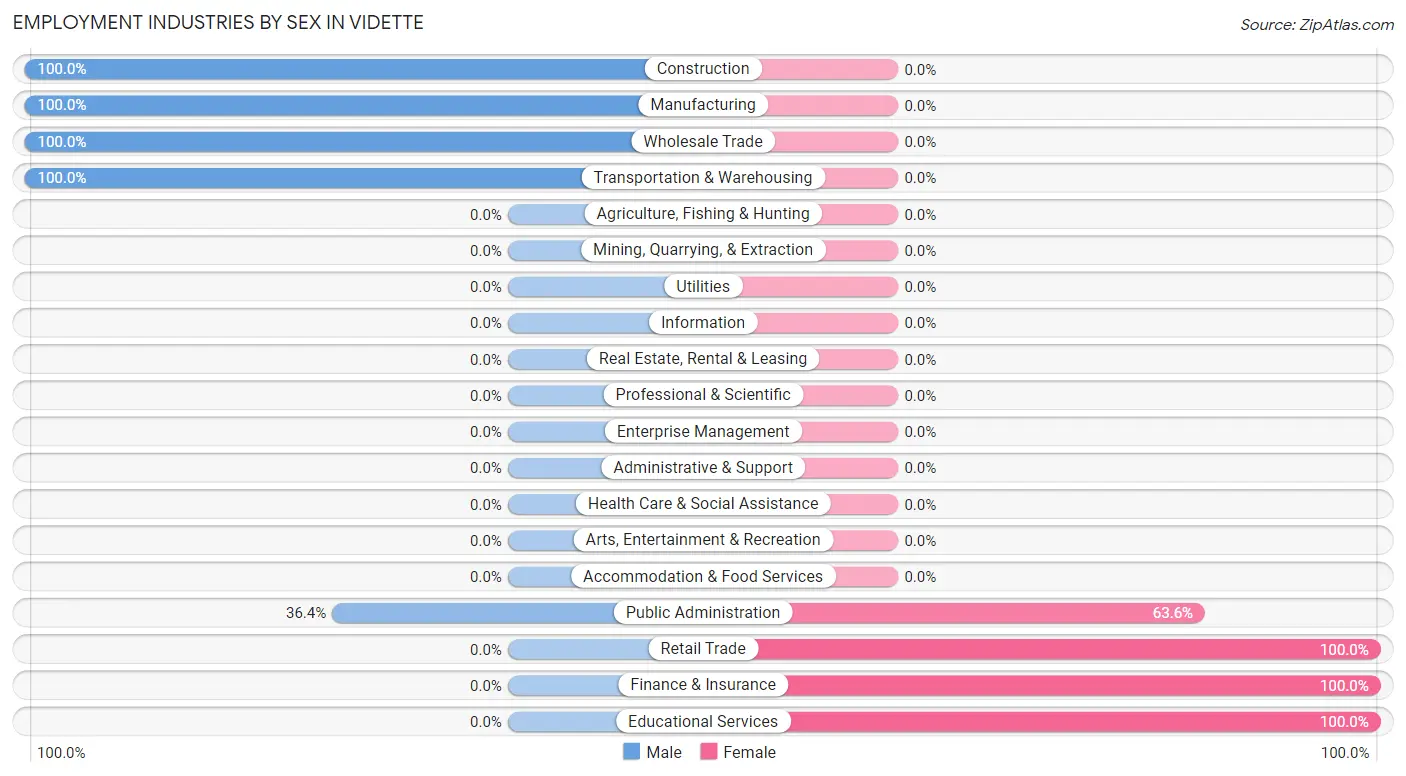
Employment Industries by Sex in Vidette
The Vidette industries that see more men than women are Construction (100.0%), Manufacturing (100.0%), and Wholesale Trade (100.0%), whereas the industries that tend to have a higher number of women are Retail Trade (100.0%), Finance & Insurance (100.0%), and Educational Services (100.0%).
| Industry | Male | Female |
| Agriculture, Fishing & Hunting | 0 (0.0%) | 0 (0.0%) |
| Mining, Quarrying, & Extraction | 0 (0.0%) | 0 (0.0%) |
| Construction | 3 (100.0%) | 0 (0.0%) |
| Manufacturing | 1 (100.0%) | 0 (0.0%) |
| Wholesale Trade | 1 (100.0%) | 0 (0.0%) |
| Retail Trade | 0 (0.0%) | 1 (100.0%) |
| Transportation & Warehousing | 12 (100.0%) | 0 (0.0%) |
| Utilities | 0 (0.0%) | 0 (0.0%) |
| Information | 0 (0.0%) | 0 (0.0%) |
| Finance & Insurance | 0 (0.0%) | 55 (100.0%) |
| Real Estate, Rental & Leasing | 0 (0.0%) | 0 (0.0%) |
| Professional & Scientific | 0 (0.0%) | 0 (0.0%) |
| Enterprise Management | 0 (0.0%) | 0 (0.0%) |
| Administrative & Support | 0 (0.0%) | 0 (0.0%) |
| Educational Services | 0 (0.0%) | 4 (100.0%) |
| Health Care & Social Assistance | 0 (0.0%) | 0 (0.0%) |
| Arts, Entertainment & Recreation | 0 (0.0%) | 0 (0.0%) |
| Accommodation & Food Services | 0 (0.0%) | 0 (0.0%) |
| Public Administration | 4 (36.4%) | 7 (63.6%) |
| Total | 21 (23.9%) | 67 (76.1%) |
Education in Vidette
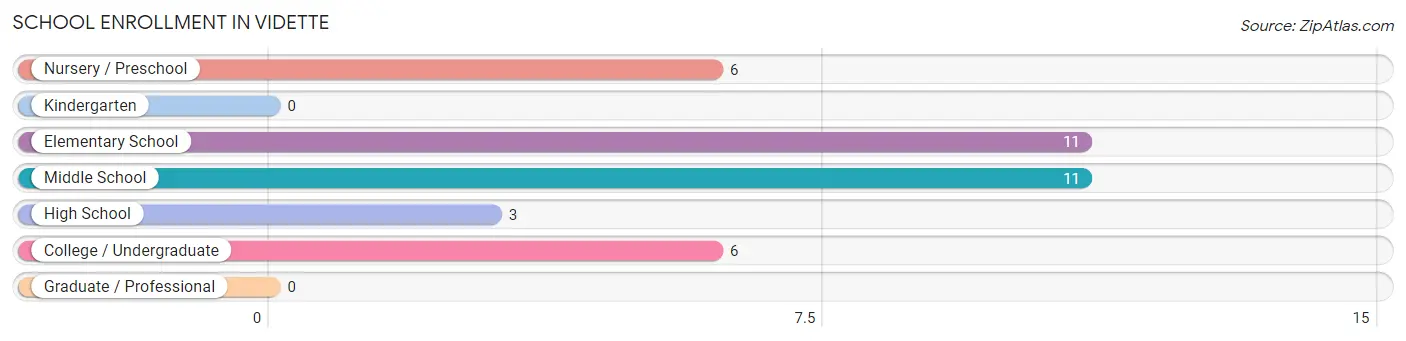
School Enrollment in Vidette
The most common levels of schooling among the 37 students in Vidette are elementary school (11 | 29.7%), middle school (11 | 29.7%), and nursery / preschool (6 | 16.2%).
| School Level | # Students | % Students |
| Nursery / Preschool | 6 | 16.2% |
| Kindergarten | 0 | 0.0% |
| Elementary School | 11 | 29.7% |
| Middle School | 11 | 29.7% |
| High School | 3 | 8.1% |
| College / Undergraduate | 6 | 16.2% |
| Graduate / Professional | 0 | 0.0% |
| Total | 37 | 100.0% |
School Enrollment by Age by Funding Source in Vidette
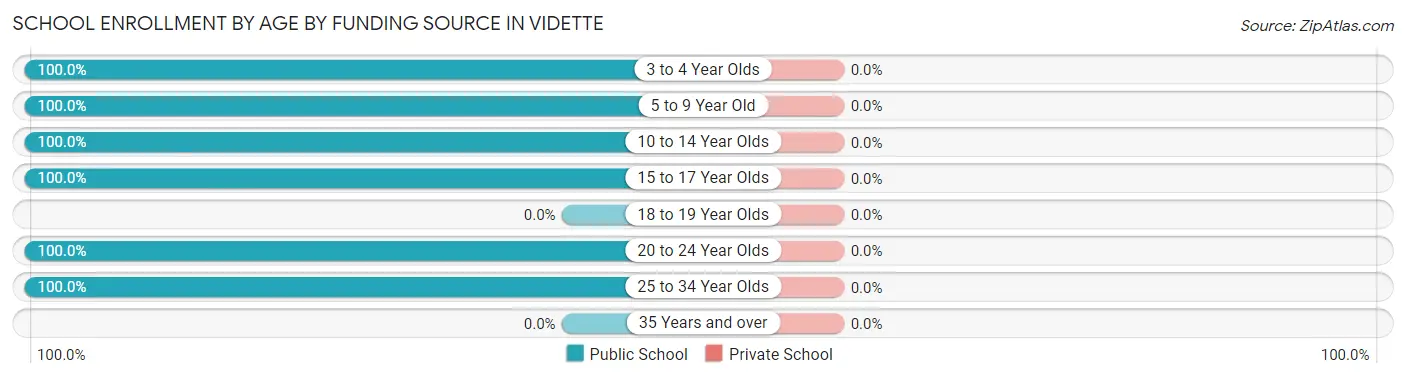
| Age Bracket | Public School | Private School |
| 3 to 4 Year Olds | 6 (100.0%) | 0 (0.0%) |
| 5 to 9 Year Old | 6 (100.0%) | 0 (0.0%) |
| 10 to 14 Year Olds | 16 (100.0%) | 0 (0.0%) |
| 15 to 17 Year Olds | 3 (100.0%) | 0 (0.0%) |
| 18 to 19 Year Olds | 0 (0.0%) | 0 (0.0%) |
| 20 to 24 Year Olds | 3 (100.0%) | 0 (0.0%) |
| 25 to 34 Year Olds | 3 (100.0%) | 0 (0.0%) |
| 35 Years and over | 0 (0.0%) | 0 (0.0%) |
| Total | 37 (100.0%) | 0 (0.0%) |
Educational Attainment by Field of Study in Vidette
Business (4 | 57.1%), and education (3 | 42.9%) are the most common fields of study among 7 individuals in Vidette who have obtained a bachelor's degree or higher.
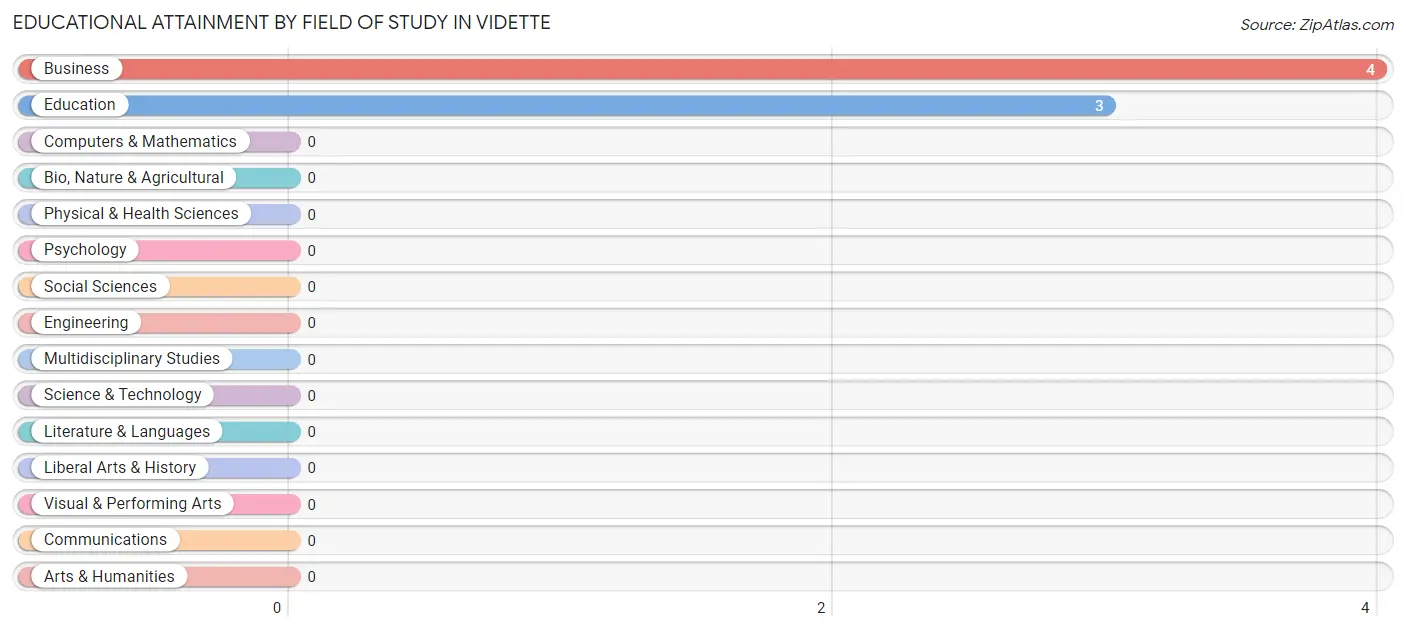
| Field of Study | # Graduates | % Graduates |
| Computers & Mathematics | 0 | 0.0% |
| Bio, Nature & Agricultural | 0 | 0.0% |
| Physical & Health Sciences | 0 | 0.0% |
| Psychology | 0 | 0.0% |
| Social Sciences | 0 | 0.0% |
| Engineering | 0 | 0.0% |
| Multidisciplinary Studies | 0 | 0.0% |
| Science & Technology | 0 | 0.0% |
| Business | 4 | 57.1% |
| Education | 3 | 42.9% |
| Literature & Languages | 0 | 0.0% |
| Liberal Arts & History | 0 | 0.0% |
| Visual & Performing Arts | 0 | 0.0% |
| Communications | 0 | 0.0% |
| Arts & Humanities | 0 | 0.0% |
| Total | 7 | 100.0% |
Transportation & Commute in Vidette
Vehicle Availability by Sex in Vidette
The most prevalent vehicle ownership categories in Vidette are males with 2 vehicles (9, accounting for 42.9%) and females with 2 vehicles (12, making up 13.4%).
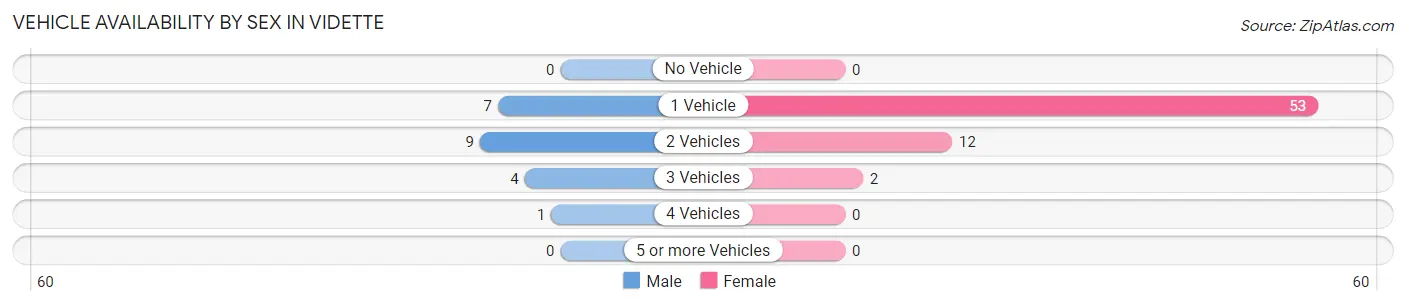
| Vehicles Available | Male | Female |
| No Vehicle | 0 (0.0%) | 0 (0.0%) |
| 1 Vehicle | 7 (33.3%) | 53 (79.1%) |
| 2 Vehicles | 9 (42.9%) | 12 (17.9%) |
| 3 Vehicles | 4 (19.1%) | 2 (3.0%) |
| 4 Vehicles | 1 (4.8%) | 0 (0.0%) |
| 5 or more Vehicles | 0 (0.0%) | 0 (0.0%) |
| Total | 21 (100.0%) | 67 (100.0%) |
Commute Time in Vidette
The most frequently occuring commute durations in Vidette are 20 to 24 minutes (61 commuters, 69.3%), 25 to 29 minutes (9 commuters, 10.2%), and 15 to 19 minutes (8 commuters, 9.1%).
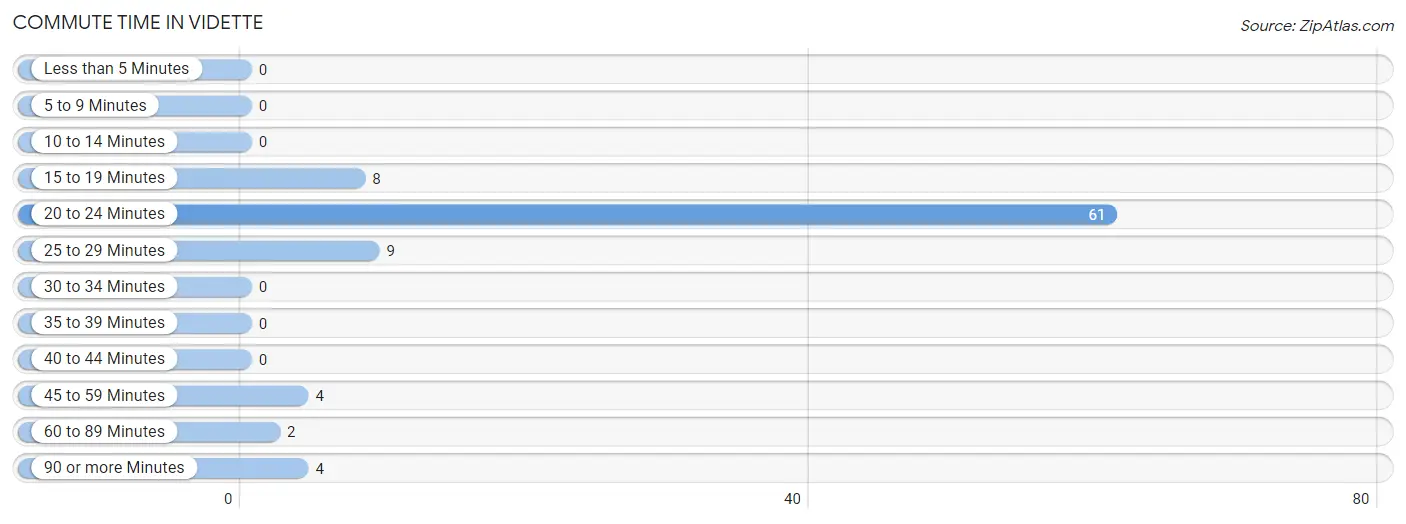
| Commute Time | # Commuters | % Commuters |
| Less than 5 Minutes | 0 | 0.0% |
| 5 to 9 Minutes | 0 | 0.0% |
| 10 to 14 Minutes | 0 | 0.0% |
| 15 to 19 Minutes | 8 | 9.1% |
| 20 to 24 Minutes | 61 | 69.3% |
| 25 to 29 Minutes | 9 | 10.2% |
| 30 to 34 Minutes | 0 | 0.0% |
| 35 to 39 Minutes | 0 | 0.0% |
| 40 to 44 Minutes | 0 | 0.0% |
| 45 to 59 Minutes | 4 | 4.5% |
| 60 to 89 Minutes | 2 | 2.3% |
| 90 or more Minutes | 4 | 4.5% |
Commute Time by Sex in Vidette
The most common commute times in Vidette are 15 to 19 minutes (8 commuters, 38.1%) for males and 20 to 24 minutes (56 commuters, 83.6%) for females.
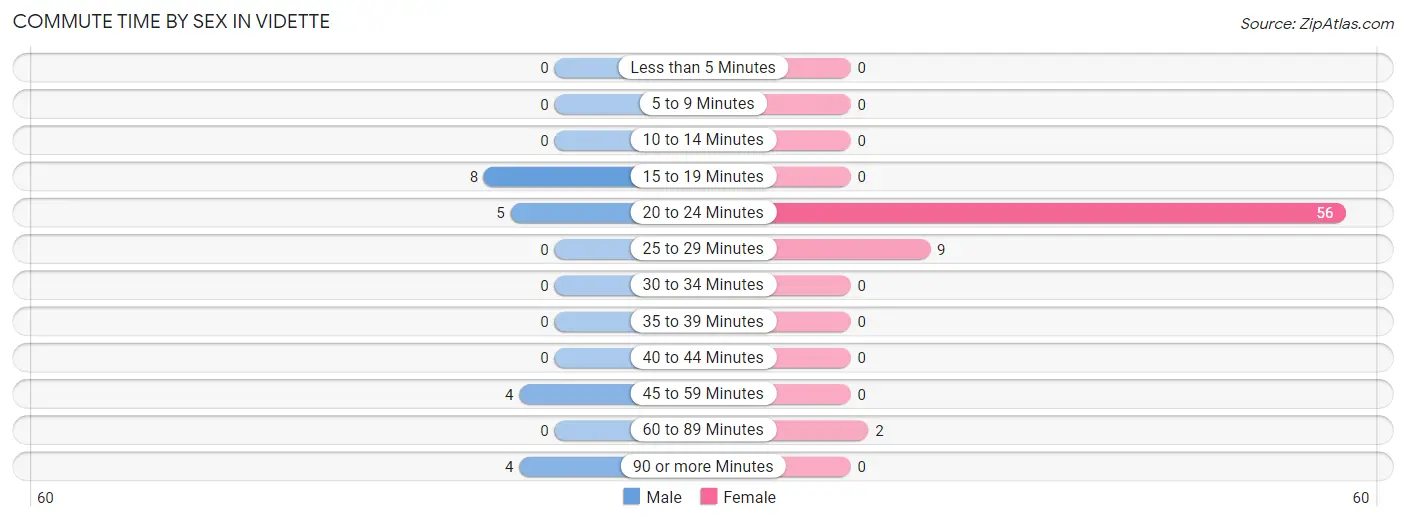
| Commute Time | Male | Female |
| Less than 5 Minutes | 0 (0.0%) | 0 (0.0%) |
| 5 to 9 Minutes | 0 (0.0%) | 0 (0.0%) |
| 10 to 14 Minutes | 0 (0.0%) | 0 (0.0%) |
| 15 to 19 Minutes | 8 (38.1%) | 0 (0.0%) |
| 20 to 24 Minutes | 5 (23.8%) | 56 (83.6%) |
| 25 to 29 Minutes | 0 (0.0%) | 9 (13.4%) |
| 30 to 34 Minutes | 0 (0.0%) | 0 (0.0%) |
| 35 to 39 Minutes | 0 (0.0%) | 0 (0.0%) |
| 40 to 44 Minutes | 0 (0.0%) | 0 (0.0%) |
| 45 to 59 Minutes | 4 (19.1%) | 0 (0.0%) |
| 60 to 89 Minutes | 0 (0.0%) | 2 (3.0%) |
| 90 or more Minutes | 4 (19.1%) | 0 (0.0%) |
Time of Departure to Work by Sex in Vidette
The most frequent times of departure to work in Vidette are 12:00 AM to 4:59 AM (7, 33.3%) for males and 10:00 AM to 10:59 AM (49, 73.1%) for females.
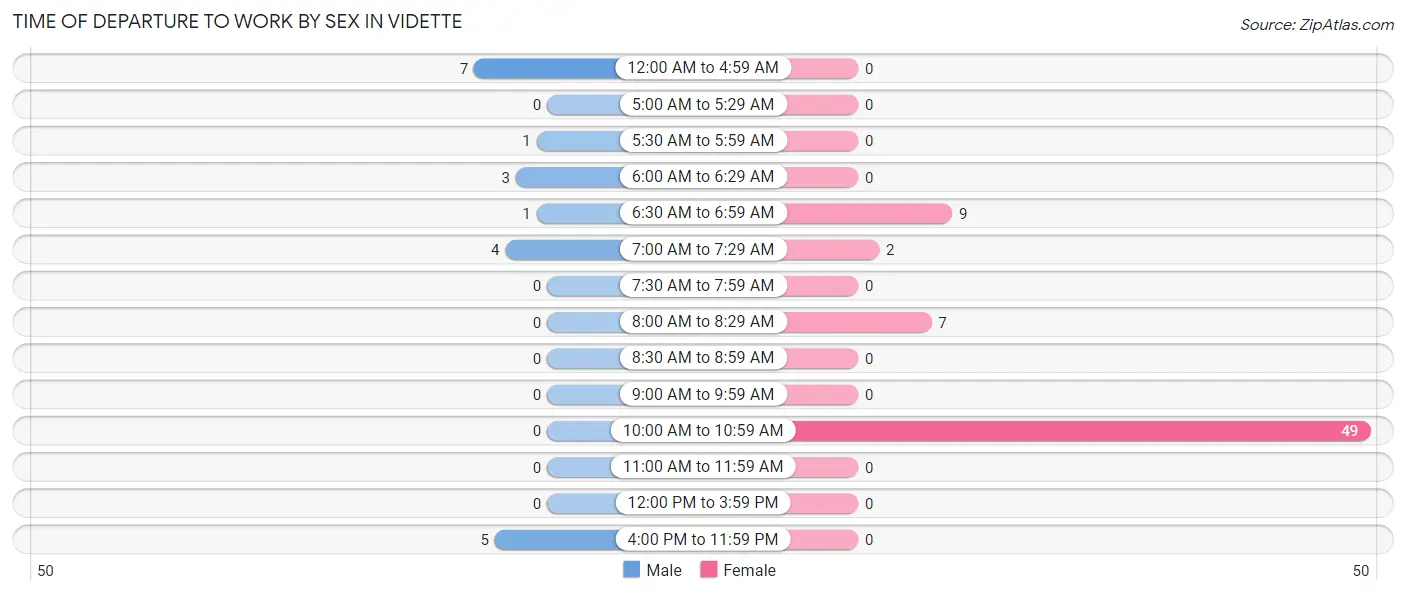
| Time of Departure | Male | Female |
| 12:00 AM to 4:59 AM | 7 (33.3%) | 0 (0.0%) |
| 5:00 AM to 5:29 AM | 0 (0.0%) | 0 (0.0%) |
| 5:30 AM to 5:59 AM | 1 (4.8%) | 0 (0.0%) |
| 6:00 AM to 6:29 AM | 3 (14.3%) | 0 (0.0%) |
| 6:30 AM to 6:59 AM | 1 (4.8%) | 9 (13.4%) |
| 7:00 AM to 7:29 AM | 4 (19.1%) | 2 (3.0%) |
| 7:30 AM to 7:59 AM | 0 (0.0%) | 0 (0.0%) |
| 8:00 AM to 8:29 AM | 0 (0.0%) | 7 (10.4%) |
| 8:30 AM to 8:59 AM | 0 (0.0%) | 0 (0.0%) |
| 9:00 AM to 9:59 AM | 0 (0.0%) | 0 (0.0%) |
| 10:00 AM to 10:59 AM | 0 (0.0%) | 49 (73.1%) |
| 11:00 AM to 11:59 AM | 0 (0.0%) | 0 (0.0%) |
| 12:00 PM to 3:59 PM | 0 (0.0%) | 0 (0.0%) |
| 4:00 PM to 11:59 PM | 5 (23.8%) | 0 (0.0%) |
| Total | 21 (100.0%) | 67 (100.0%) |
Housing Occupancy in Vidette
Occupancy by Ownership in Vidette
Of the total 96 dwellings in Vidette, owner-occupied units account for 94 (97.9%), while renter-occupied units make up 2 (2.1%).
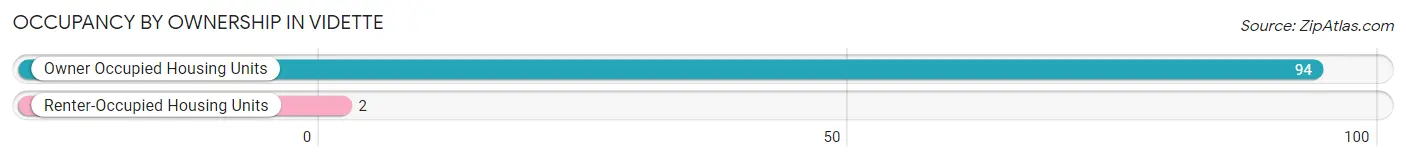
| Occupancy | # Housing Units | % Housing Units |
| Owner Occupied Housing Units | 94 | 97.9% |
| Renter-Occupied Housing Units | 2 | 2.1% |
| Total Occupied Housing Units | 96 | 100.0% |
Occupancy by Household Size in Vidette
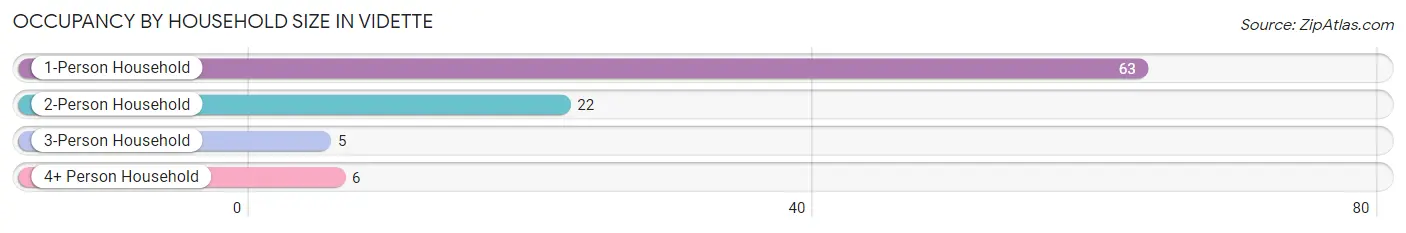
| Household Size | # Housing Units | % Housing Units |
| 1-Person Household | 63 | 65.6% |
| 2-Person Household | 22 | 22.9% |
| 3-Person Household | 5 | 5.2% |
| 4+ Person Household | 6 | 6.2% |
| Total Housing Units | 96 | 100.0% |
Occupancy by Ownership by Household Size in Vidette
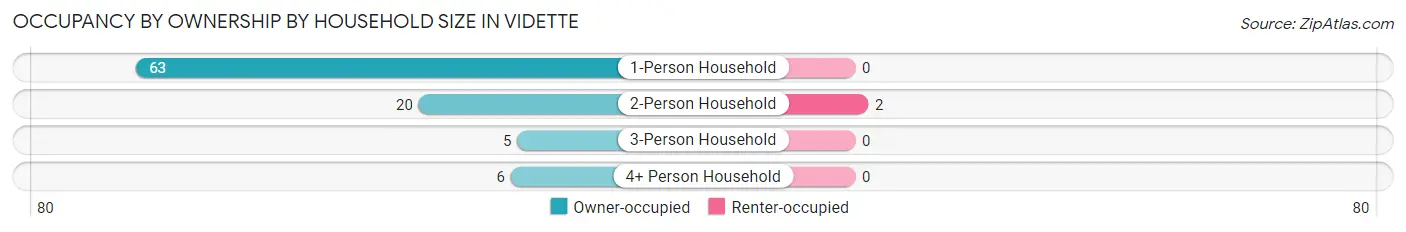
| Household Size | Owner-occupied | Renter-occupied |
| 1-Person Household | 63 (100.0%) | 0 (0.0%) |
| 2-Person Household | 20 (90.9%) | 2 (9.1%) |
| 3-Person Household | 5 (100.0%) | 0 (0.0%) |
| 4+ Person Household | 6 (100.0%) | 0 (0.0%) |
| Total Housing Units | 94 (97.9%) | 2 (2.1%) |
Occupancy by Educational Attainment in Vidette
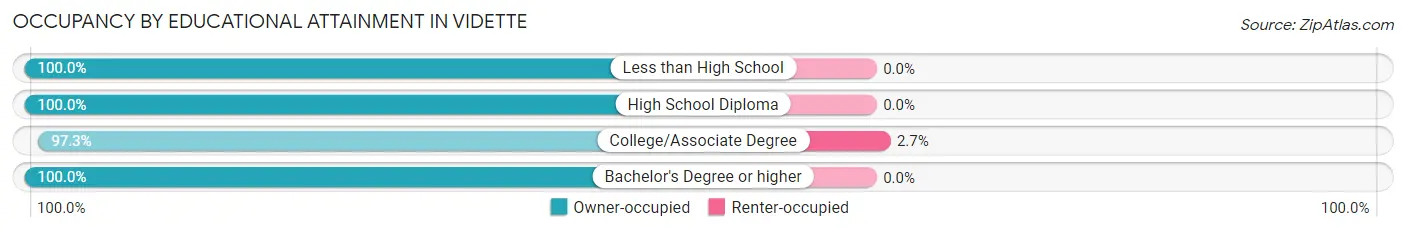
| Household Size | Owner-occupied | Renter-occupied |
| Less than High School | 5 (100.0%) | 0 (0.0%) |
| High School Diploma | 13 (100.0%) | 0 (0.0%) |
| College/Associate Degree | 71 (97.3%) | 2 (2.7%) |
| Bachelor's Degree or higher | 5 (100.0%) | 0 (0.0%) |
Occupancy by Age of Householder in Vidette
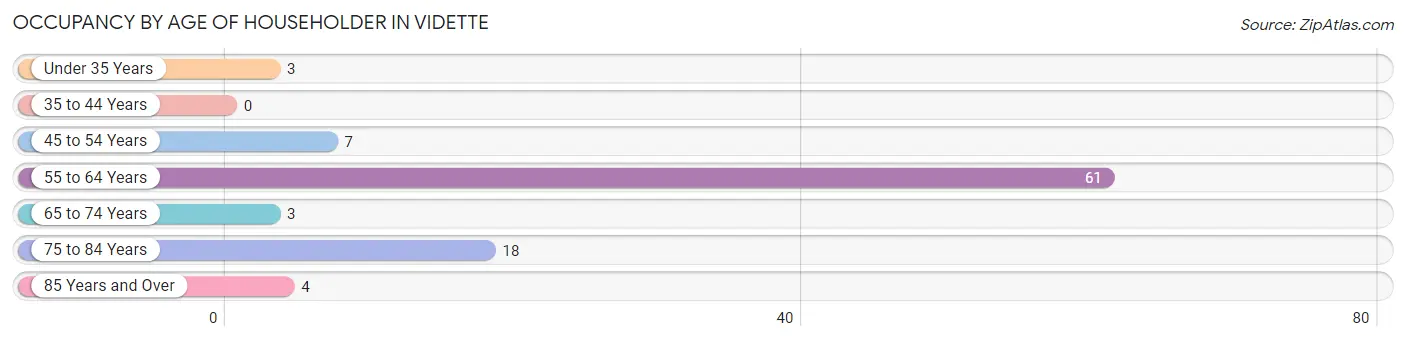
| Age Bracket | # Households | % Households |
| Under 35 Years | 3 | 3.1% |
| 35 to 44 Years | 0 | 0.0% |
| 45 to 54 Years | 7 | 7.3% |
| 55 to 64 Years | 61 | 63.5% |
| 65 to 74 Years | 3 | 3.1% |
| 75 to 84 Years | 18 | 18.8% |
| 85 Years and Over | 4 | 4.2% |
| Total | 96 | 100.0% |
Housing Finances in Vidette
Median Income by Occupancy in Vidette
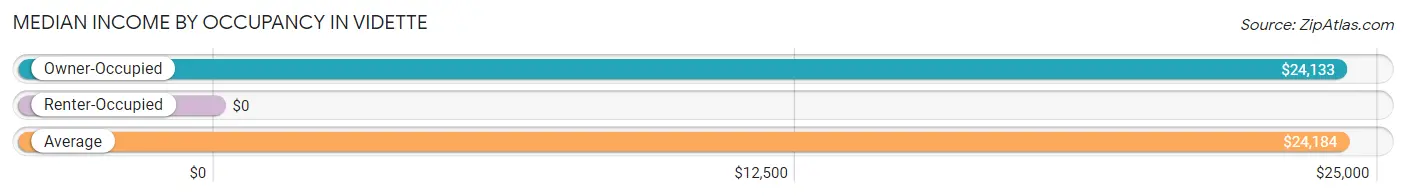
| Occupancy Type | # Households | Median Income |
| Owner-Occupied | 94 (97.9%) | $24,133 |
| Renter-Occupied | 2 (2.1%) | $0 |
| Average | 96 (100.0%) | $24,184 |
Occupancy by Householder Income Bracket in Vidette
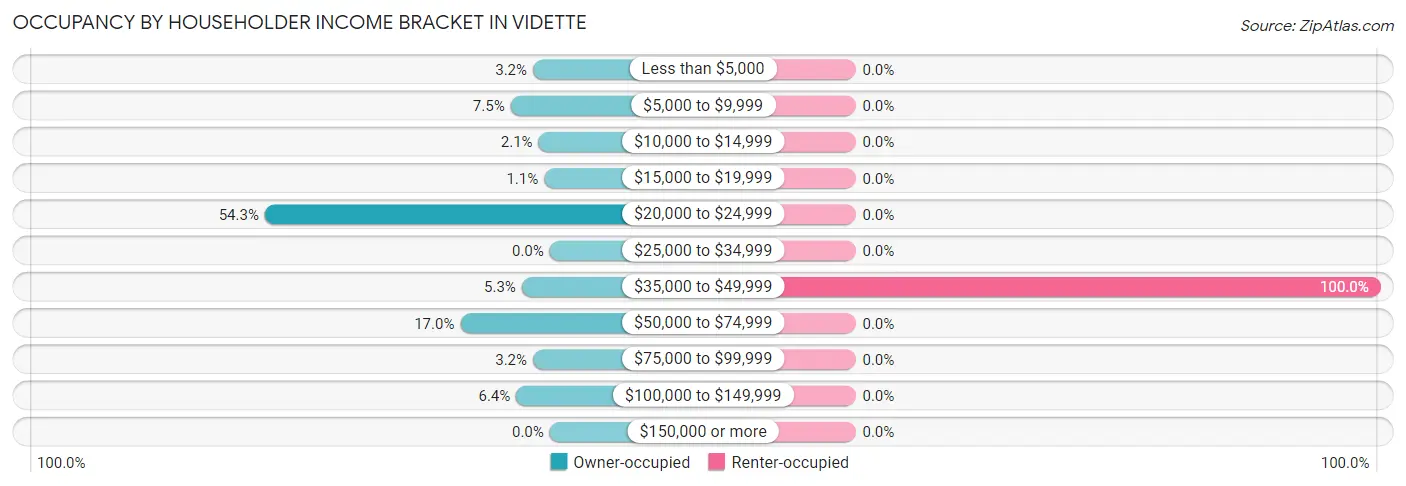
| Income Bracket | Owner-occupied | Renter-occupied |
| Less than $5,000 | 3 (3.2%) | 0 (0.0%) |
| $5,000 to $9,999 | 7 (7.4%) | 0 (0.0%) |
| $10,000 to $14,999 | 2 (2.1%) | 0 (0.0%) |
| $15,000 to $19,999 | 1 (1.1%) | 0 (0.0%) |
| $20,000 to $24,999 | 51 (54.3%) | 0 (0.0%) |
| $25,000 to $34,999 | 0 (0.0%) | 0 (0.0%) |
| $35,000 to $49,999 | 5 (5.3%) | 2 (100.0%) |
| $50,000 to $74,999 | 16 (17.0%) | 0 (0.0%) |
| $75,000 to $99,999 | 3 (3.2%) | 0 (0.0%) |
| $100,000 to $149,999 | 6 (6.4%) | 0 (0.0%) |
| $150,000 or more | 0 (0.0%) | 0 (0.0%) |
| Total | 94 (100.0%) | 2 (100.0%) |
Monthly Housing Cost Tiers in Vidette
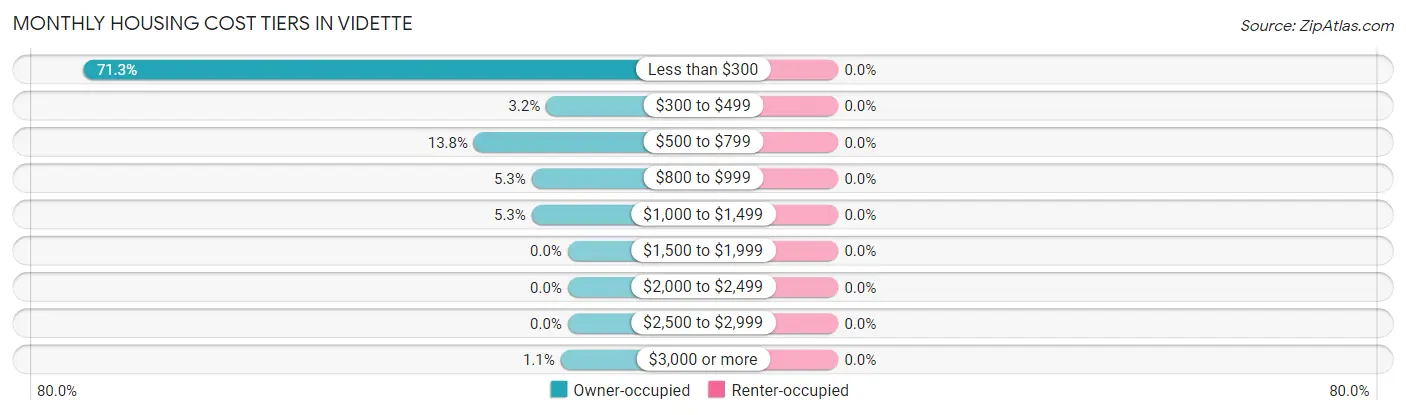
| Monthly Cost | Owner-occupied | Renter-occupied |
| Less than $300 | 67 (71.3%) | 0 (0.0%) |
| $300 to $499 | 3 (3.2%) | 0 (0.0%) |
| $500 to $799 | 13 (13.8%) | 0 (0.0%) |
| $800 to $999 | 5 (5.3%) | 0 (0.0%) |
| $1,000 to $1,499 | 5 (5.3%) | 0 (0.0%) |
| $1,500 to $1,999 | 0 (0.0%) | 0 (0.0%) |
| $2,000 to $2,499 | 0 (0.0%) | 0 (0.0%) |
| $2,500 to $2,999 | 0 (0.0%) | 0 (0.0%) |
| $3,000 or more | 1 (1.1%) | 0 (0.0%) |
| Total | 94 (100.0%) | 2 (100.0%) |
Physical Housing Characteristics in Vidette
Housing Structures in Vidette
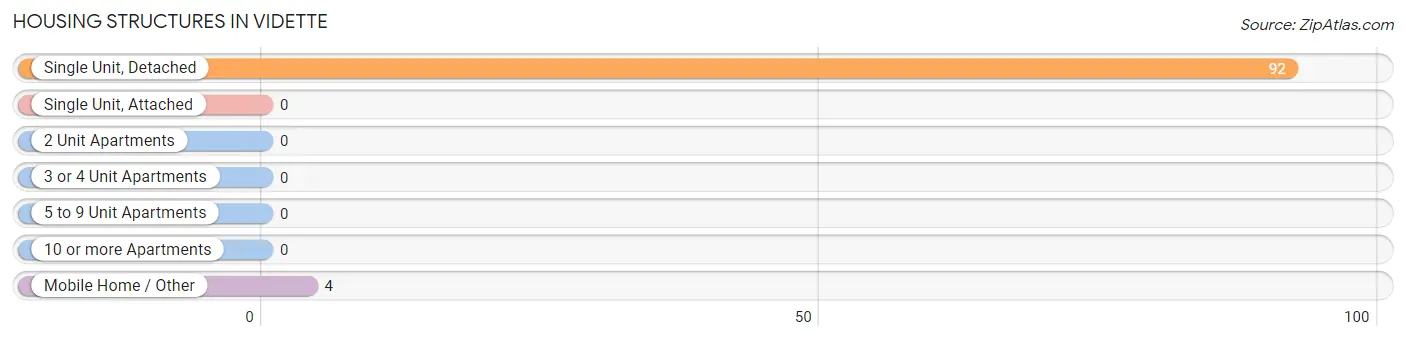
| Structure Type | # Housing Units | % Housing Units |
| Single Unit, Detached | 92 | 95.8% |
| Single Unit, Attached | 0 | 0.0% |
| 2 Unit Apartments | 0 | 0.0% |
| 3 or 4 Unit Apartments | 0 | 0.0% |
| 5 to 9 Unit Apartments | 0 | 0.0% |
| 10 or more Apartments | 0 | 0.0% |
| Mobile Home / Other | 4 | 4.2% |
| Total | 96 | 100.0% |
Housing Structures by Occupancy in Vidette
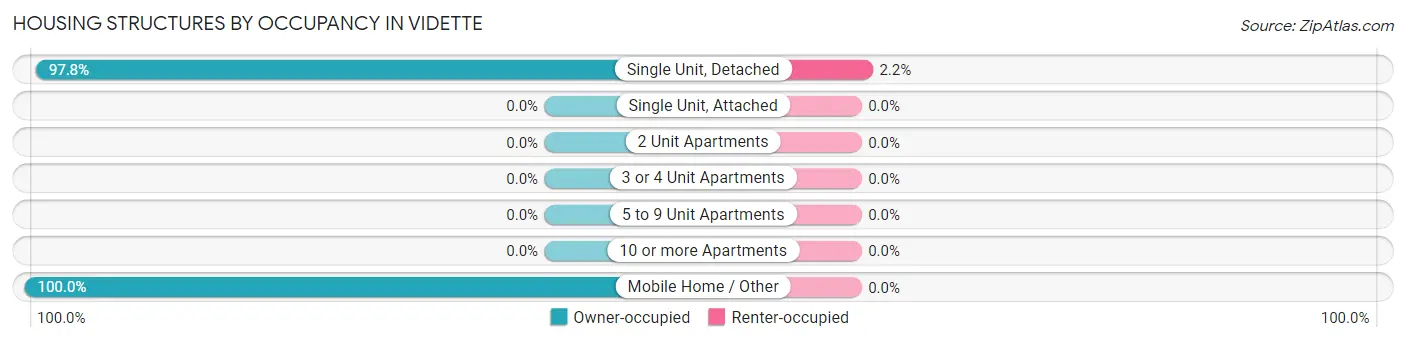
| Structure Type | Owner-occupied | Renter-occupied |
| Single Unit, Detached | 90 (97.8%) | 2 (2.2%) |
| Single Unit, Attached | 0 (0.0%) | 0 (0.0%) |
| 2 Unit Apartments | 0 (0.0%) | 0 (0.0%) |
| 3 or 4 Unit Apartments | 0 (0.0%) | 0 (0.0%) |
| 5 to 9 Unit Apartments | 0 (0.0%) | 0 (0.0%) |
| 10 or more Apartments | 0 (0.0%) | 0 (0.0%) |
| Mobile Home / Other | 4 (100.0%) | 0 (0.0%) |
| Total | 94 (97.9%) | 2 (2.1%) |
Housing Structures by Number of Rooms in Vidette
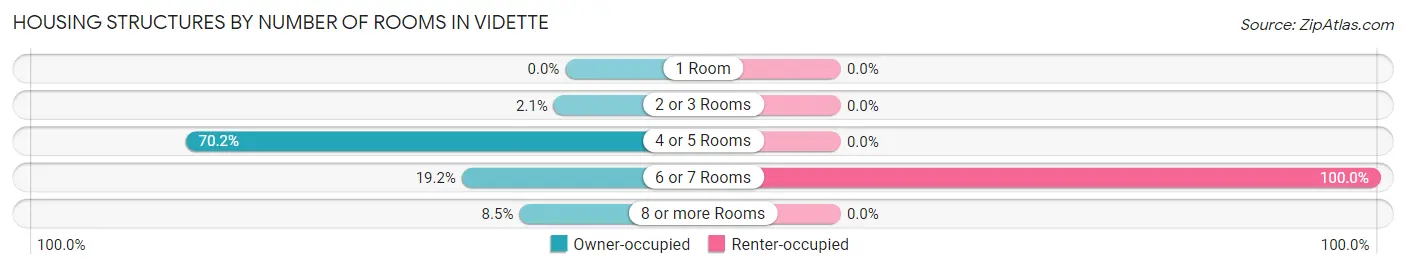
| Number of Rooms | Owner-occupied | Renter-occupied |
| 1 Room | 0 (0.0%) | 0 (0.0%) |
| 2 or 3 Rooms | 2 (2.1%) | 0 (0.0%) |
| 4 or 5 Rooms | 66 (70.2%) | 0 (0.0%) |
| 6 or 7 Rooms | 18 (19.2%) | 2 (100.0%) |
| 8 or more Rooms | 8 (8.5%) | 0 (0.0%) |
| Total | 94 (100.0%) | 2 (100.0%) |
Housing Structure by Heating Type in Vidette
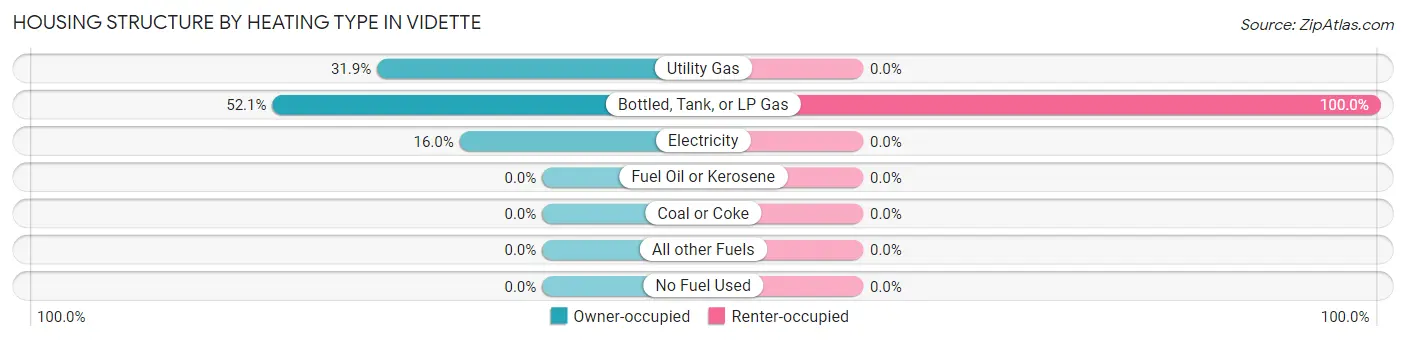
| Heating Type | Owner-occupied | Renter-occupied |
| Utility Gas | 30 (31.9%) | 0 (0.0%) |
| Bottled, Tank, or LP Gas | 49 (52.1%) | 2 (100.0%) |
| Electricity | 15 (16.0%) | 0 (0.0%) |
| Fuel Oil or Kerosene | 0 (0.0%) | 0 (0.0%) |
| Coal or Coke | 0 (0.0%) | 0 (0.0%) |
| All other Fuels | 0 (0.0%) | 0 (0.0%) |
| No Fuel Used | 0 (0.0%) | 0 (0.0%) |
| Total | 94 (100.0%) | 2 (100.0%) |
Household Vehicle Usage in Vidette
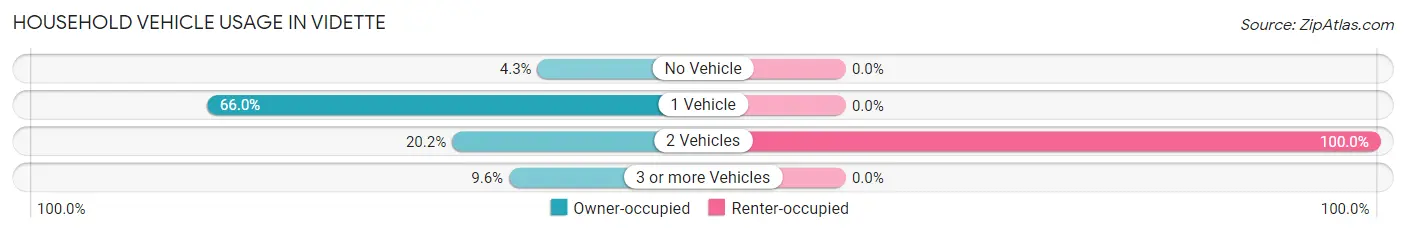
| Vehicles per Household | Owner-occupied | Renter-occupied |
| No Vehicle | 4 (4.3%) | 0 (0.0%) |
| 1 Vehicle | 62 (66.0%) | 0 (0.0%) |
| 2 Vehicles | 19 (20.2%) | 2 (100.0%) |
| 3 or more Vehicles | 9 (9.6%) | 0 (0.0%) |
| Total | 94 (100.0%) | 2 (100.0%) |
Real Estate & Mortgages in Vidette
Real Estate and Mortgage Overview in Vidette
| Characteristic | Without Mortgage | With Mortgage |
| Housing Units | 79 | 15 |
| Median Property Value | - | - |
| Median Household Income | - | - |
| Monthly Housing Costs | $237 | $0 |
| Real Estate Taxes | $199 | $0 |
Property Value by Mortgage Status in Vidette
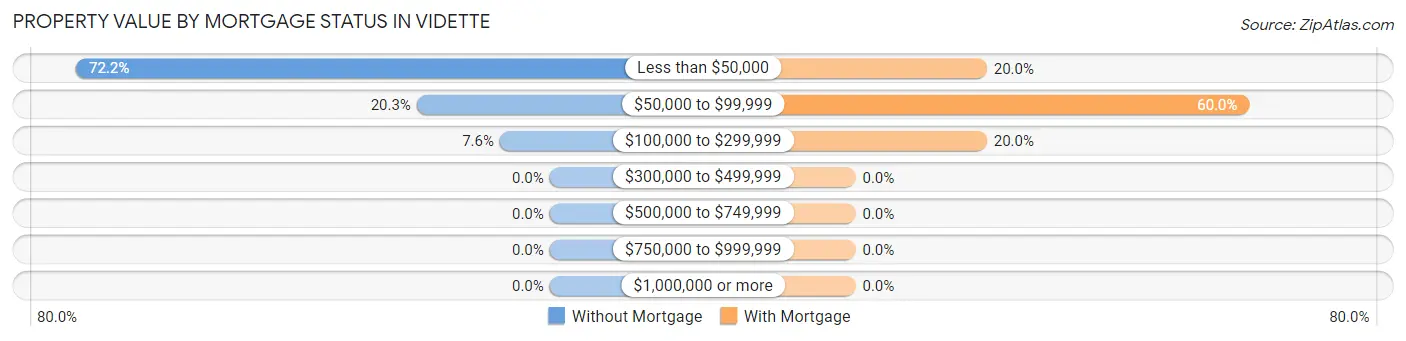
| Property Value | Without Mortgage | With Mortgage |
| Less than $50,000 | 57 (72.2%) | 3 (20.0%) |
| $50,000 to $99,999 | 16 (20.3%) | 9 (60.0%) |
| $100,000 to $299,999 | 6 (7.6%) | 3 (20.0%) |
| $300,000 to $499,999 | 0 (0.0%) | 0 (0.0%) |
| $500,000 to $749,999 | 0 (0.0%) | 0 (0.0%) |
| $750,000 to $999,999 | 0 (0.0%) | 0 (0.0%) |
| $1,000,000 or more | 0 (0.0%) | 0 (0.0%) |
| Total | 79 (100.0%) | 15 (100.0%) |
Household Income by Mortgage Status in Vidette
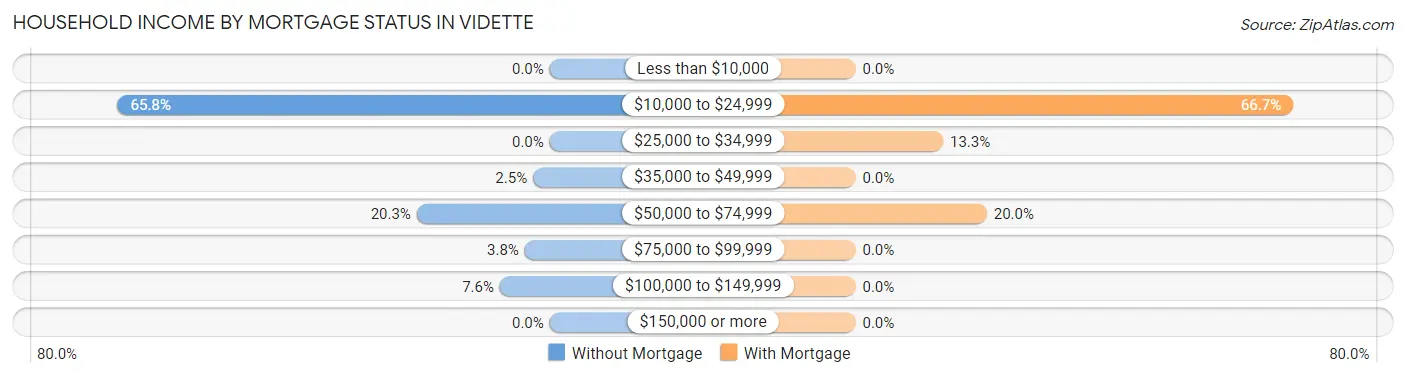
| Household Income | Without Mortgage | With Mortgage |
| Less than $10,000 | 0 (0.0%) | 0 (0.0%) |
| $10,000 to $24,999 | 52 (65.8%) | 10 (66.7%) |
| $25,000 to $34,999 | 0 (0.0%) | 2 (13.3%) |
| $35,000 to $49,999 | 2 (2.5%) | 0 (0.0%) |
| $50,000 to $74,999 | 16 (20.3%) | 3 (20.0%) |
| $75,000 to $99,999 | 3 (3.8%) | 0 (0.0%) |
| $100,000 to $149,999 | 6 (7.6%) | 0 (0.0%) |
| $150,000 or more | 0 (0.0%) | 0 (0.0%) |
| Total | 79 (100.0%) | 15 (100.0%) |
Property Value to Household Income Ratio in Vidette
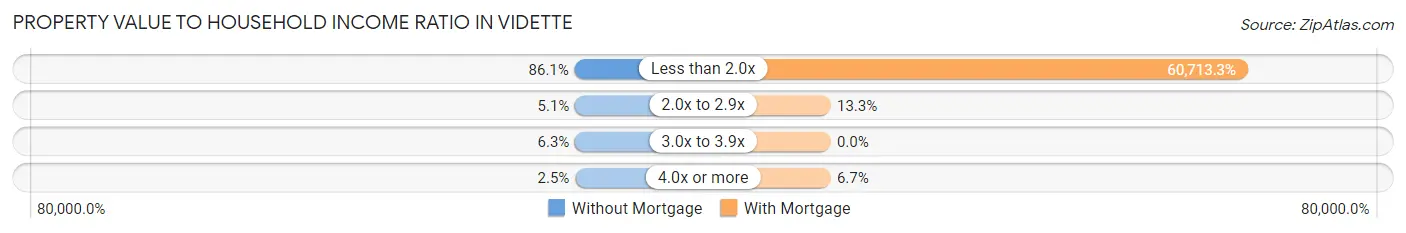
| Value-to-Income Ratio | Without Mortgage | With Mortgage |
| Less than 2.0x | 68 (86.1%) | 9,107 (60,713.3%) |
| 2.0x to 2.9x | 4 (5.1%) | 2 (13.3%) |
| 3.0x to 3.9x | 5 (6.3%) | 0 (0.0%) |
| 4.0x or more | 2 (2.5%) | 1 (6.7%) |
| Total | 79 (100.0%) | 15 (100.0%) |
Real Estate Taxes by Mortgage Status in Vidette
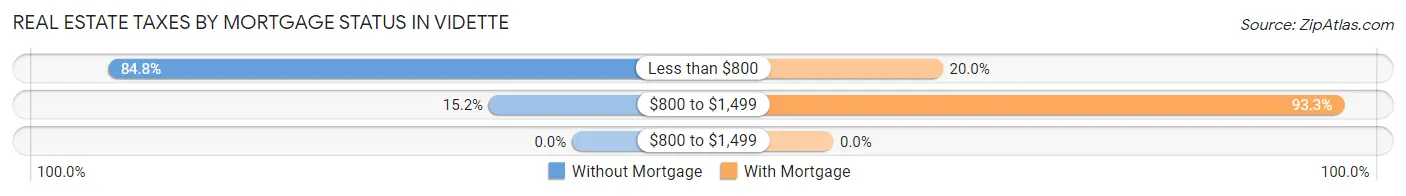
| Property Taxes | Without Mortgage | With Mortgage |
| Less than $800 | 67 (84.8%) | 3 (20.0%) |
| $800 to $1,499 | 12 (15.2%) | 14 (93.3%) |
| $800 to $1,499 | 0 (0.0%) | 0 (0.0%) |
| Total | 79 (100.0%) | 15 (100.0%) |
Health & Disability in Vidette
Health Insurance Coverage by Age in Vidette
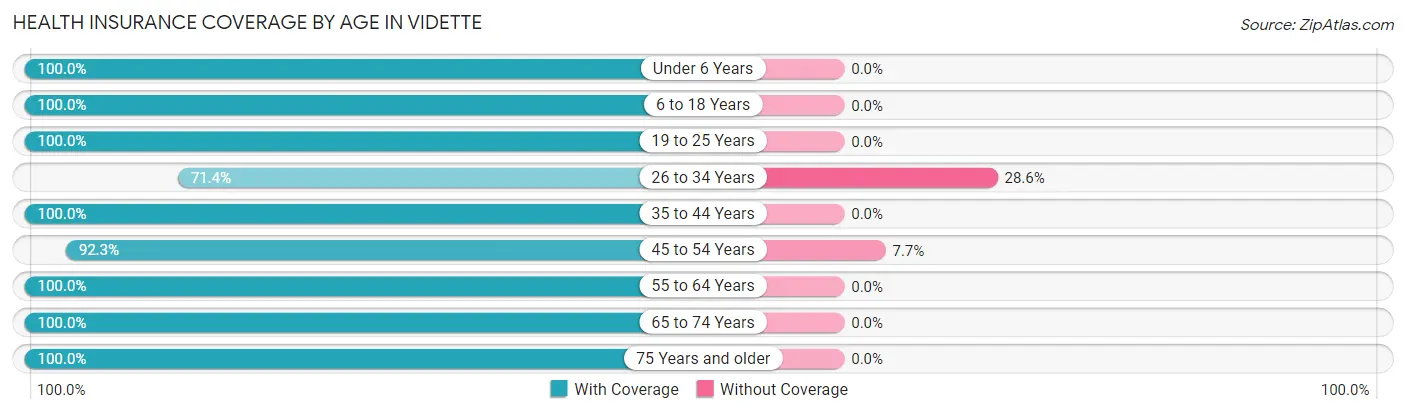
| Age Bracket | With Coverage | Without Coverage |
| Under 6 Years | 14 (100.0%) | 0 (0.0%) |
| 6 to 18 Years | 25 (100.0%) | 0 (0.0%) |
| 19 to 25 Years | 3 (100.0%) | 0 (0.0%) |
| 26 to 34 Years | 15 (71.4%) | 6 (28.6%) |
| 35 to 44 Years | 5 (100.0%) | 0 (0.0%) |
| 45 to 54 Years | 12 (92.3%) | 1 (7.7%) |
| 55 to 64 Years | 78 (100.0%) | 0 (0.0%) |
| 65 to 74 Years | 7 (100.0%) | 0 (0.0%) |
| 75 Years and older | 25 (100.0%) | 0 (0.0%) |
| Total | 184 (96.3%) | 7 (3.7%) |
Health Insurance Coverage by Citizenship Status in Vidette
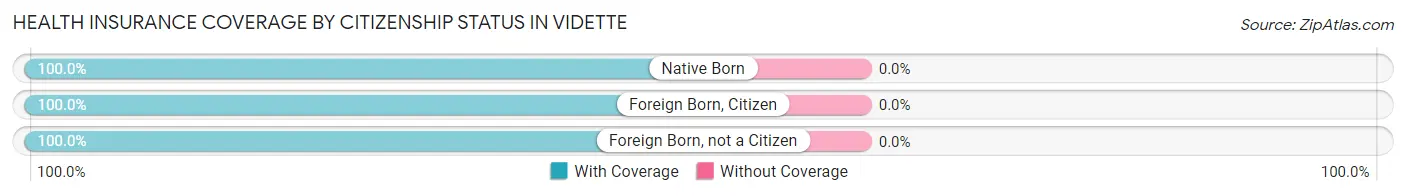
| Citizenship Status | With Coverage | Without Coverage |
| Native Born | 14 (100.0%) | 0 (0.0%) |
| Foreign Born, Citizen | 25 (100.0%) | 0 (0.0%) |
| Foreign Born, not a Citizen | 3 (100.0%) | 0 (0.0%) |
Health Insurance Coverage by Household Income in Vidette
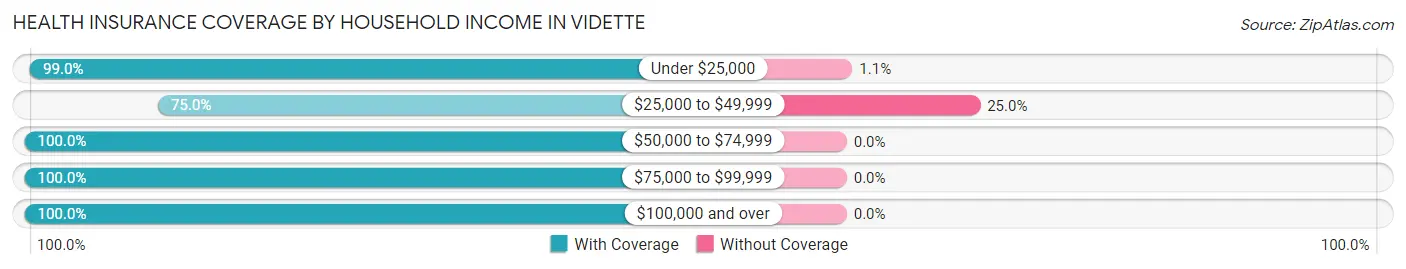
| Household Income | With Coverage | Without Coverage |
| Under $25,000 | 94 (99.0%) | 1 (1.1%) |
| $25,000 to $49,999 | 18 (75.0%) | 6 (25.0%) |
| $50,000 to $74,999 | 22 (100.0%) | 0 (0.0%) |
| $75,000 to $99,999 | 34 (100.0%) | 0 (0.0%) |
| $100,000 and over | 16 (100.0%) | 0 (0.0%) |
Public vs Private Health Insurance Coverage by Age in Vidette
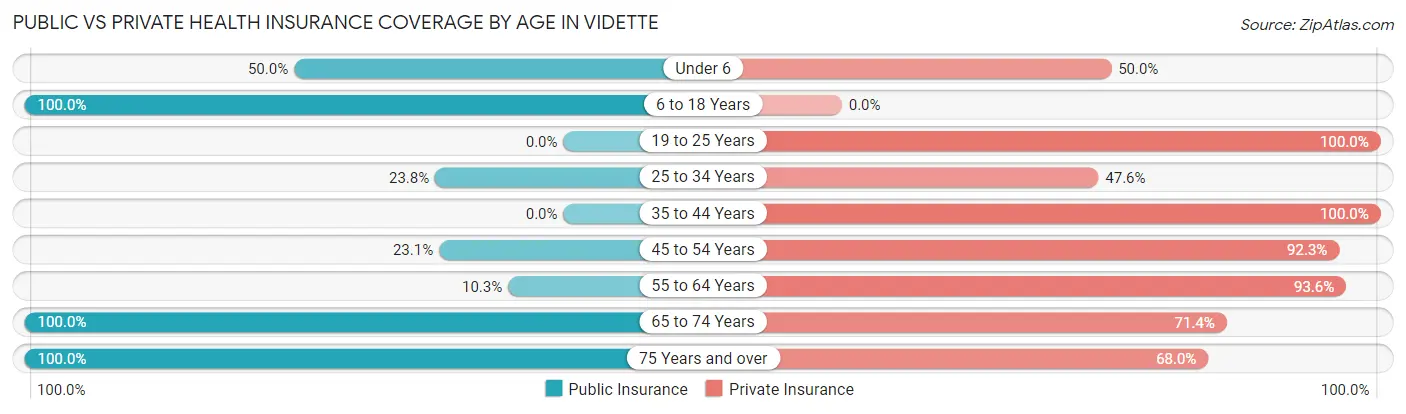
| Age Bracket | Public Insurance | Private Insurance |
| Under 6 | 7 (50.0%) | 7 (50.0%) |
| 6 to 18 Years | 25 (100.0%) | 0 (0.0%) |
| 19 to 25 Years | 0 (0.0%) | 3 (100.0%) |
| 25 to 34 Years | 5 (23.8%) | 10 (47.6%) |
| 35 to 44 Years | 0 (0.0%) | 5 (100.0%) |
| 45 to 54 Years | 3 (23.1%) | 12 (92.3%) |
| 55 to 64 Years | 8 (10.3%) | 73 (93.6%) |
| 65 to 74 Years | 7 (100.0%) | 5 (71.4%) |
| 75 Years and over | 25 (100.0%) | 17 (68.0%) |
| Total | 80 (41.9%) | 132 (69.1%) |
Disability Status by Sex by Age in Vidette
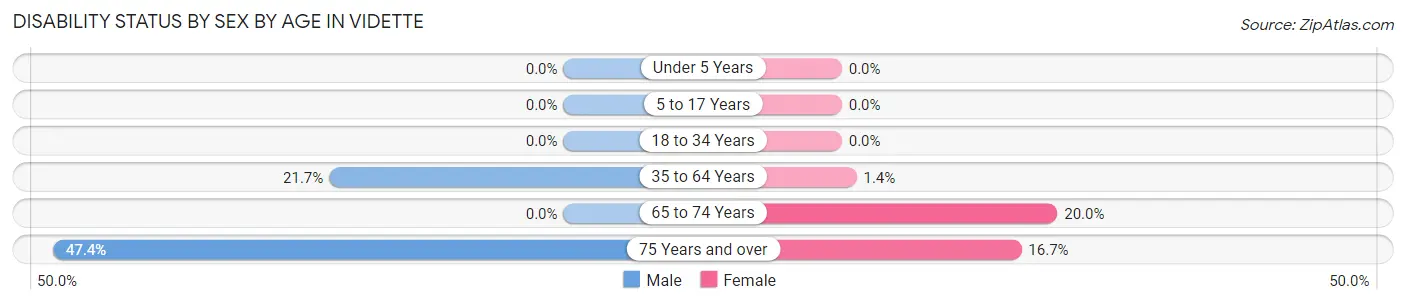
| Age Bracket | Male | Female |
| Under 5 Years | 0 (0.0%) | 0 (0.0%) |
| 5 to 17 Years | 0 (0.0%) | 0 (0.0%) |
| 18 to 34 Years | 0 (0.0%) | 0 (0.0%) |
| 35 to 64 Years | 5 (21.7%) | 1 (1.4%) |
| 65 to 74 Years | 0 (0.0%) | 1 (20.0%) |
| 75 Years and over | 9 (47.4%) | 1 (16.7%) |
Disability Class by Sex by Age in Vidette
Disability Class: Hearing Difficulty
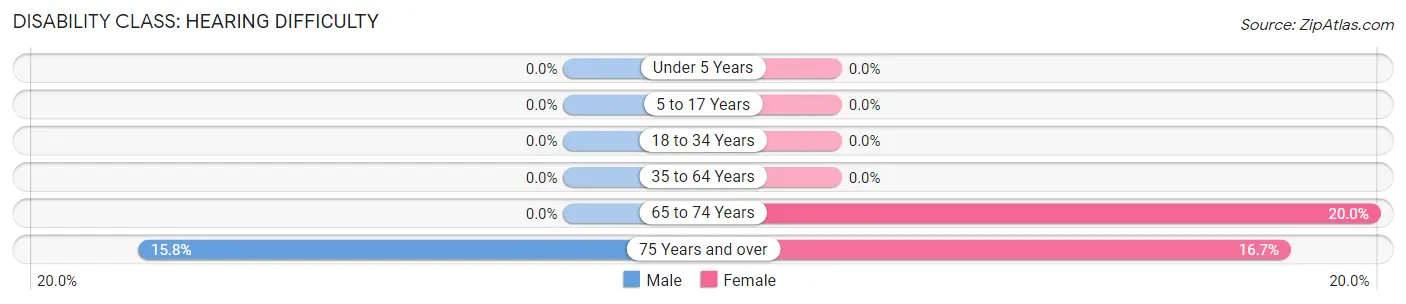
| Age Bracket | Male | Female |
| Under 5 Years | 0 (0.0%) | 0 (0.0%) |
| 5 to 17 Years | 0 (0.0%) | 0 (0.0%) |
| 18 to 34 Years | 0 (0.0%) | 0 (0.0%) |
| 35 to 64 Years | 0 (0.0%) | 0 (0.0%) |
| 65 to 74 Years | 0 (0.0%) | 1 (20.0%) |
| 75 Years and over | 3 (15.8%) | 1 (16.7%) |
Disability Class: Vision Difficulty
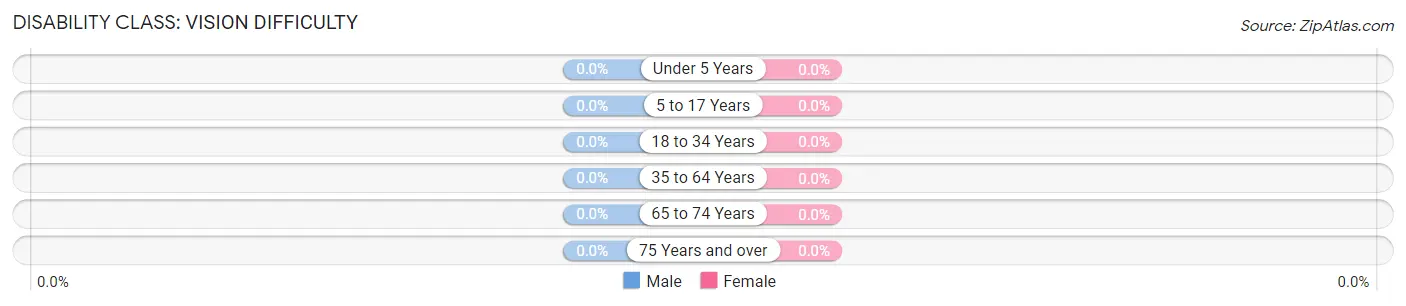
| Age Bracket | Male | Female |
| Under 5 Years | 0 (0.0%) | 0 (0.0%) |
| 5 to 17 Years | 0 (0.0%) | 0 (0.0%) |
| 18 to 34 Years | 0 (0.0%) | 0 (0.0%) |
| 35 to 64 Years | 0 (0.0%) | 0 (0.0%) |
| 65 to 74 Years | 0 (0.0%) | 0 (0.0%) |
| 75 Years and over | 0 (0.0%) | 0 (0.0%) |
Disability Class: Cognitive Difficulty
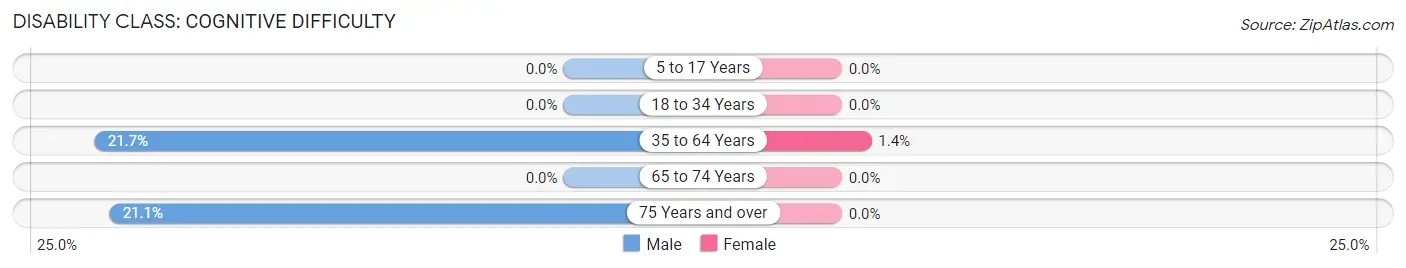
| Age Bracket | Male | Female |
| 5 to 17 Years | 0 (0.0%) | 0 (0.0%) |
| 18 to 34 Years | 0 (0.0%) | 0 (0.0%) |
| 35 to 64 Years | 5 (21.7%) | 1 (1.4%) |
| 65 to 74 Years | 0 (0.0%) | 0 (0.0%) |
| 75 Years and over | 4 (21.0%) | 0 (0.0%) |
Disability Class: Ambulatory Difficulty
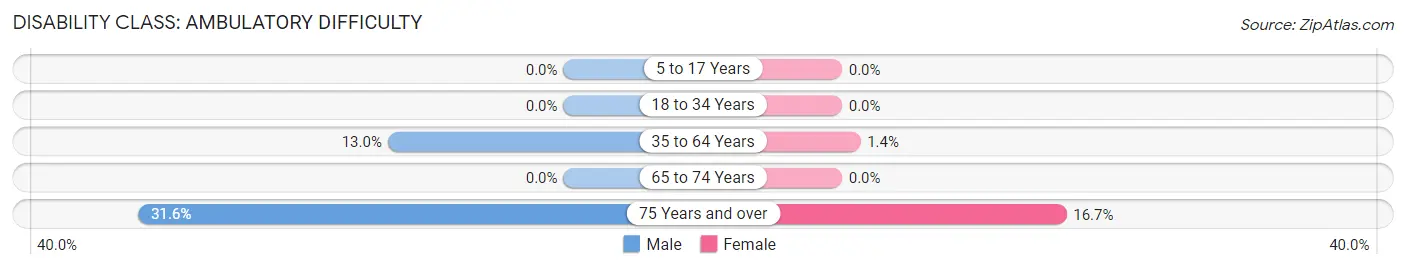
| Age Bracket | Male | Female |
| 5 to 17 Years | 0 (0.0%) | 0 (0.0%) |
| 18 to 34 Years | 0 (0.0%) | 0 (0.0%) |
| 35 to 64 Years | 3 (13.0%) | 1 (1.4%) |
| 65 to 74 Years | 0 (0.0%) | 0 (0.0%) |
| 75 Years and over | 6 (31.6%) | 1 (16.7%) |
Disability Class: Self-Care Difficulty
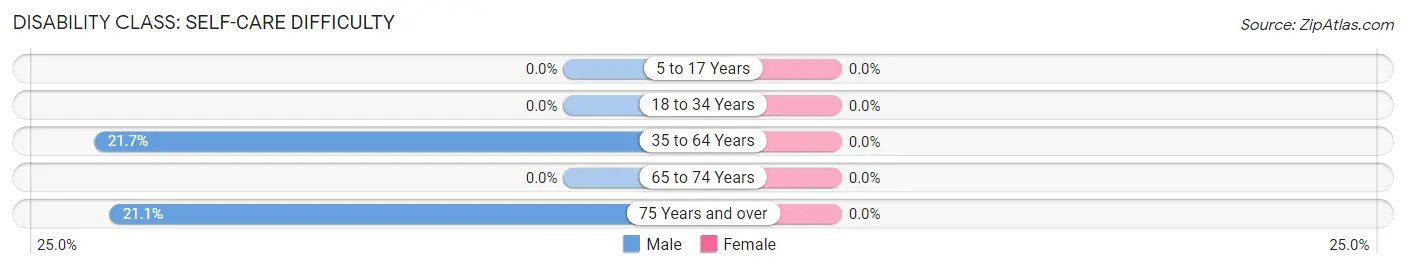
| Age Bracket | Male | Female |
| 5 to 17 Years | 0 (0.0%) | 0 (0.0%) |
| 18 to 34 Years | 0 (0.0%) | 0 (0.0%) |
| 35 to 64 Years | 5 (21.7%) | 0 (0.0%) |
| 65 to 74 Years | 0 (0.0%) | 0 (0.0%) |
| 75 Years and over | 4 (21.0%) | 0 (0.0%) |
Technology Access in Vidette
Computing Device Access in Vidette
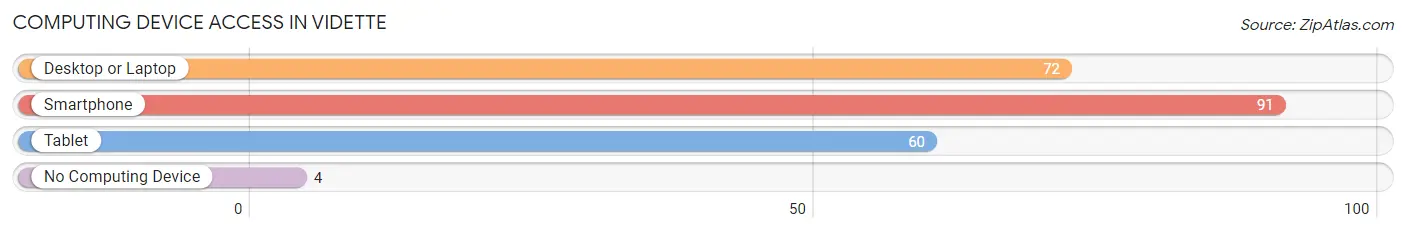
| Device Type | # Households | % Households |
| Desktop or Laptop | 72 | 75.0% |
| Smartphone | 91 | 94.8% |
| Tablet | 60 | 62.5% |
| No Computing Device | 4 | 4.2% |
| Total | 96 | 100.0% |
Internet Access in Vidette
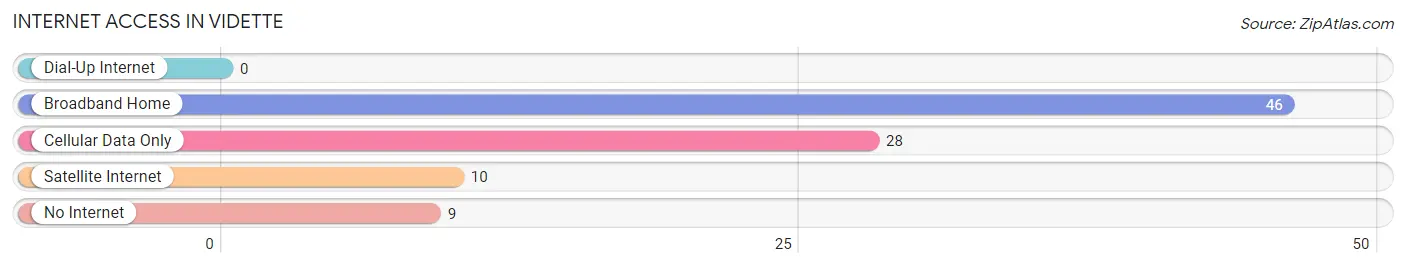
| Internet Type | # Households | % Households |
| Dial-Up Internet | 0 | 0.0% |
| Broadband Home | 46 | 47.9% |
| Cellular Data Only | 28 | 29.2% |
| Satellite Internet | 10 | 10.4% |
| No Internet | 9 | 9.4% |
| Total | 96 | 100.0% |
Vidette Summary
Vidette is a small town located in the state of Georgia, United States. It is situated in the southwestern part of the state, in the county of Troup. The town has a population of approximately 1,000 people, and is located about 30 miles south of Atlanta.
History
Vidette was founded in 1883 by a group of settlers from the nearby town of LaGrange. The town was named after the nearby Vidette Creek, which was named after a nearby mountain peak. The town was originally a farming community, and the main crops grown were cotton, corn, and tobacco. In the early 1900s, the town began to grow and develop, and by the 1920s, it had become a thriving community.
In the 1950s, the town began to experience a decline in population, as many of the residents moved away to larger cities. However, in the late 1970s, the town began to experience a resurgence in population, as many people moved back to the area. Today, Vidette is a small, rural town with a population of approximately 1,000 people.
Geography
Vidette is located in the southwestern part of the state of Georgia, in the county of Troup. The town is situated on the banks of the Chattahoochee River, and is surrounded by rolling hills and forests. The town is located about 30 miles south of Atlanta, and is accessible by both Interstate 85 and US Highway 27.
The climate in Vidette is humid subtropical, with hot, humid summers and mild winters. The average annual temperature is around 70 degrees Fahrenheit, and the average annual precipitation is around 50 inches.
Economy
The economy of Vidette is largely based on agriculture. The main crops grown in the area are cotton, corn, and tobacco. In addition, the town is home to several small businesses, including a grocery store, a hardware store, and a few restaurants.
The town is also home to a small manufacturing plant, which produces a variety of products, including furniture and clothing. The town is also home to a few small tourist attractions, including a historic church and a museum.
Demographics
As of the 2010 census, the population of Vidette was 1,000 people. The racial makeup of the town was 95.2% White, 2.2% African American, 0.2% Native American, 0.2% Asian, 0.2% from other races, and 1.9% from two or more races. Hispanic or Latino of any race were 1.2% of the population.
The median income for a household in Vidette was $35,000, and the median income for a family was $41,000. The per capita income for the town was $17,000. About 15.2% of families and 17.2% of the population were below the poverty line, including 25.2% of those under age 18 and 8.2% of those age 65 or over.
Conclusion
Vidette is a small town located in the southwestern part of the state of Georgia. It has a population of approximately 1,000 people, and is situated on the banks of the Chattahoochee River. The town is largely based on agriculture, and is home to several small businesses and tourist attractions. The population of Vidette is mostly White, with a small percentage of African American, Native American, and Asian residents. The median income for a household in Vidette is $35,000, and the per capita income is $17,000.
Common Questions
What is Per Capita Income in Vidette?
Per Capita income in Vidette is $19,939.
What is the Median Family Income in Vidette?
Median Family Income in Vidette is $58,036.
What is the Median Household income in Vidette?
Median Household Income in Vidette is $24,184.
What is Income or Wage Gap in Vidette?
Income or Wage Gap in Vidette is 48.1%.
Women in Vidette earn 51.9 cents for every dollar earned by a man.
What is Inequality or Gini Index in Vidette?
Inequality or Gini Index in Vidette is 0.38.
What is the Total Population of Vidette?
Total Population of Vidette is 191.
What is the Total Male Population of Vidette?
Total Male Population of Vidette is 73.
What is the Total Female Population of Vidette?
Total Female Population of Vidette is 118.
What is the Ratio of Males per 100 Females in Vidette?
There are 61.86 Males per 100 Females in Vidette.
What is the Ratio of Females per 100 Males in Vidette?
There are 161.64 Females per 100 Males in Vidette.
What is the Median Population Age in Vidette?
Median Population Age in Vidette is 60.2 Years.
What is the Average Family Size in Vidette
Average Family Size in Vidette is 3.9 People.
What is the Average Household Size in Vidette
Average Household Size in Vidette is 2.0 People.
How Large is the Labor Force in Vidette?
There are 99 People in the Labor Forcein in Vidette.
What is the Percentage of People in the Labor Force in Vidette?
65.1% of People are in the Labor Force in Vidette.
What is the Unemployment Rate in Vidette?
Unemployment Rate in Vidette is 11.1%.