Bainbridge, GA Map & Demographics
Bainbridge Map
Bainbridge Overview
$23,115
PER CAPITA INCOME
$52,237
AVG FAMILY INCOME
$42,093
AVG HOUSEHOLD INCOME
29.1%
WAGE / INCOME GAP [ % ]
70.9¢/ $1
WAGE / INCOME GAP [ $ ]
0.52
INEQUALITY / GINI INDEX
14,234
TOTAL POPULATION
6,739
MALE POPULATION
7,495
FEMALE POPULATION
89.91
MALES / 100 FEMALES
111.22
FEMALES / 100 MALES
36.2
MEDIAN AGE
3.3
AVG FAMILY SIZE
2.6
AVG HOUSEHOLD SIZE
5,377
LABOR FORCE [ PEOPLE ]
50.3%
PERCENT IN LABOR FORCE
9.5%
UNEMPLOYMENT RATE
Bainbridge Area Codes
Income in Bainbridge
Income Overview in Bainbridge
Per Capita Income in Bainbridge is $23,115, while median incomes of families and households are $52,237 and $42,093 respectively.
| Characteristic | Number | Measure |
| Per Capita Income | 14,234 | $23,115 |
| Median Family Income | 3,364 | $52,237 |
| Mean Family Income | 3,364 | $71,777 |
| Median Household Income | 5,210 | $42,093 |
| Mean Household Income | 5,210 | $60,520 |
| Income Deficit | 3,364 | $0 |
| Wage / Income Gap (%) | 14,234 | 29.14% |
| Wage / Income Gap ($) | 14,234 | 70.86¢ per $1 |
| Gini / Inequality Index | 14,234 | 0.52 |
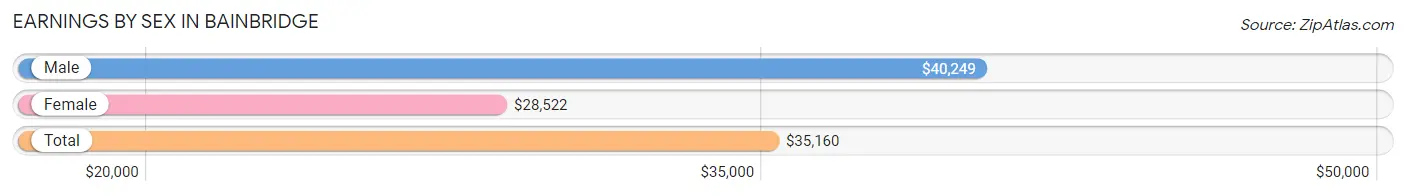
Earnings by Sex in Bainbridge
Average Earnings in Bainbridge are $35,160, $40,249 for men and $28,522 for women, a difference of 29.1%.
| Sex | Number | Average Earnings |
| Male | 2,622 (49.3%) | $40,249 |
| Female | 2,696 (50.7%) | $28,522 |
| Total | 5,318 (100.0%) | $35,160 |
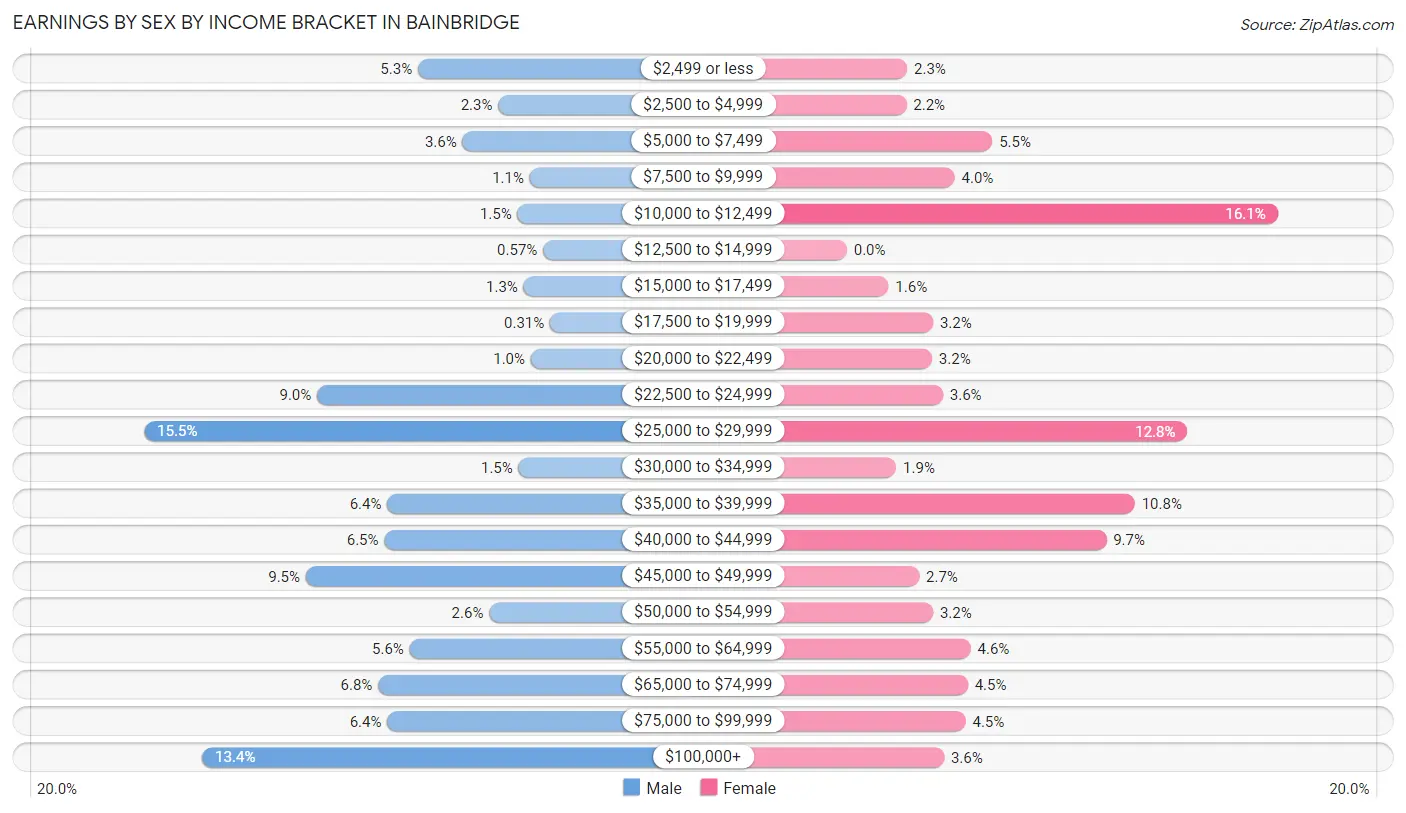
Earnings by Sex by Income Bracket in Bainbridge
The most common earnings brackets in Bainbridge are $25,000 to $29,999 for men (407 | 15.5%) and $10,000 to $12,499 for women (435 | 16.1%).
| Income | Male | Female |
| $2,499 or less | 138 (5.3%) | 61 (2.3%) |
| $2,500 to $4,999 | 59 (2.2%) | 60 (2.2%) |
| $5,000 to $7,499 | 94 (3.6%) | 147 (5.4%) |
| $7,500 to $9,999 | 28 (1.1%) | 109 (4.0%) |
| $10,000 to $12,499 | 40 (1.5%) | 435 (16.1%) |
| $12,500 to $14,999 | 15 (0.6%) | 0 (0.0%) |
| $15,000 to $17,499 | 34 (1.3%) | 42 (1.6%) |
| $17,500 to $19,999 | 8 (0.3%) | 87 (3.2%) |
| $20,000 to $22,499 | 27 (1.0%) | 86 (3.2%) |
| $22,500 to $24,999 | 237 (9.0%) | 97 (3.6%) |
| $25,000 to $29,999 | 407 (15.5%) | 344 (12.8%) |
| $30,000 to $34,999 | 39 (1.5%) | 50 (1.8%) |
| $35,000 to $39,999 | 168 (6.4%) | 291 (10.8%) |
| $40,000 to $44,999 | 171 (6.5%) | 262 (9.7%) |
| $45,000 to $49,999 | 248 (9.5%) | 73 (2.7%) |
| $50,000 to $54,999 | 68 (2.6%) | 87 (3.2%) |
| $55,000 to $64,999 | 146 (5.6%) | 125 (4.6%) |
| $65,000 to $74,999 | 177 (6.8%) | 122 (4.5%) |
| $75,000 to $99,999 | 168 (6.4%) | 120 (4.4%) |
| $100,000+ | 350 (13.4%) | 98 (3.6%) |
| Total | 2,622 (100.0%) | 2,696 (100.0%) |
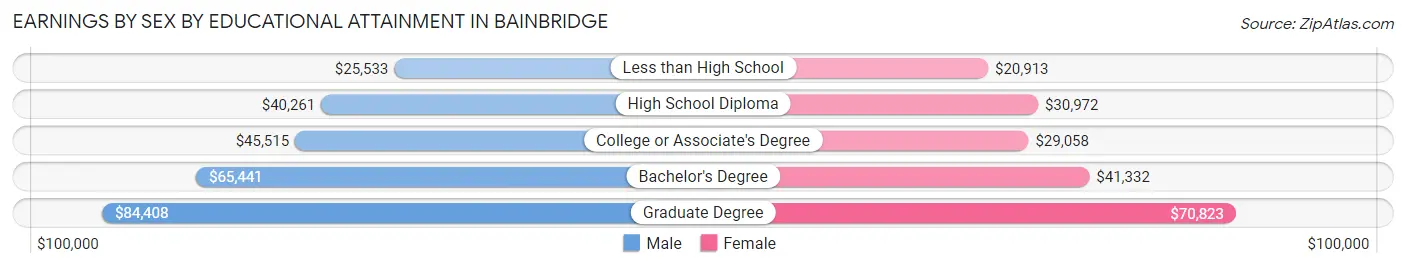
Earnings by Sex by Educational Attainment in Bainbridge
Average earnings in Bainbridge are $43,750 for men and $30,052 for women, a difference of 31.3%. Men with an educational attainment of graduate degree enjoy the highest average annual earnings of $84,408, while those with less than high school education earn the least with $25,533. Women with an educational attainment of graduate degree earn the most with the average annual earnings of $70,823, while those with less than high school education have the smallest earnings of $20,913.
| Educational Attainment | Male Income | Female Income |
| Less than High School | $25,533 | $20,913 |
| High School Diploma | $40,261 | $30,972 |
| College or Associate's Degree | $45,515 | $29,058 |
| Bachelor's Degree | $65,441 | $41,332 |
| Graduate Degree | $84,408 | $70,823 |
| Total | $43,750 | $30,052 |
Family Income in Bainbridge
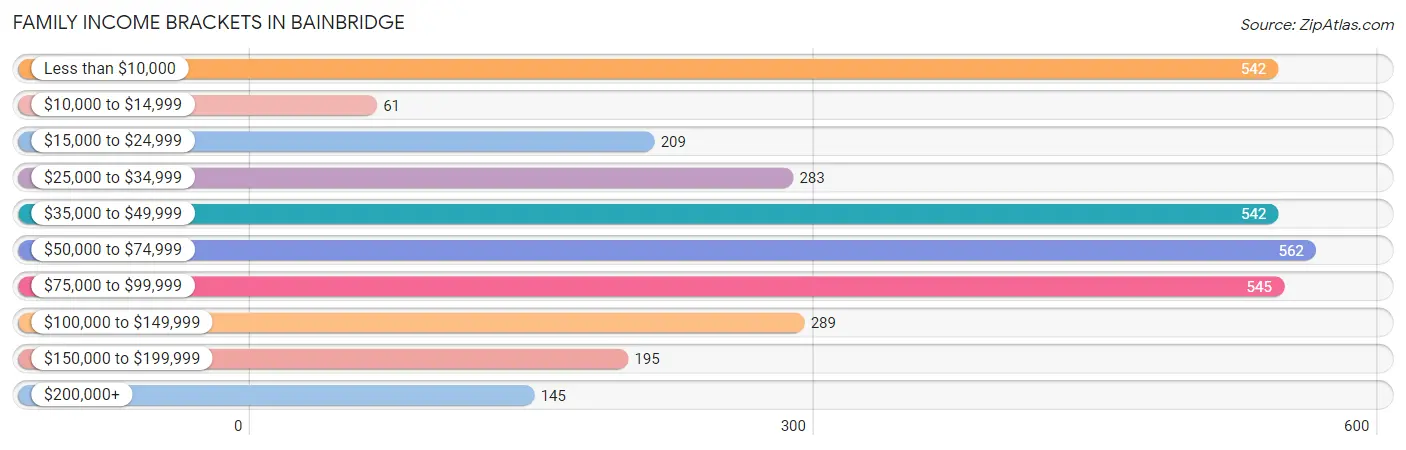
Family Income Brackets in Bainbridge
According to the Bainbridge family income data, there are 562 families falling into the $50,000 to $74,999 income range, which is the most common income bracket and makes up 16.7% of all families. Conversely, the $10,000 to $14,999 income bracket is the least frequent group with only 61 families (1.8%) belonging to this category.
| Income Bracket | # Families | % Families |
| Less than $10,000 | 542 | 16.1% |
| $10,000 to $14,999 | 61 | 1.8% |
| $15,000 to $24,999 | 209 | 6.2% |
| $25,000 to $34,999 | 283 | 8.4% |
| $35,000 to $49,999 | 542 | 16.1% |
| $50,000 to $74,999 | 562 | 16.7% |
| $75,000 to $99,999 | 545 | 16.2% |
| $100,000 to $149,999 | 289 | 8.6% |
| $150,000 to $199,999 | 195 | 5.8% |
| $200,000+ | 145 | 4.3% |
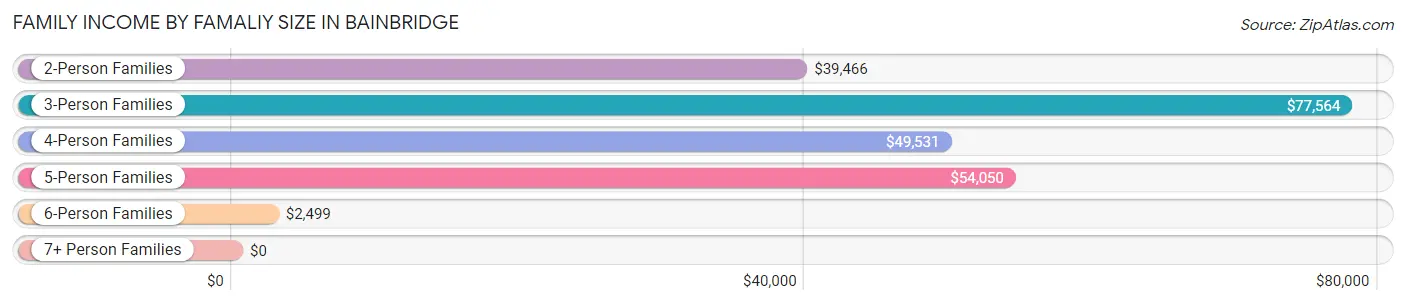
Family Income by Famaliy Size in Bainbridge
3-person families (761 | 22.6%) account for the highest median family income in Bainbridge with $77,564 per family, while 3-person families (761 | 22.6%) have the highest median income of $25,855 per family member.
| Income Bracket | # Families | Median Income |
| 2-Person Families | 1,617 (48.1%) | $39,466 |
| 3-Person Families | 761 (22.6%) | $77,564 |
| 4-Person Families | 393 (11.7%) | $49,531 |
| 5-Person Families | 466 (13.9%) | $54,050 |
| 6-Person Families | 127 (3.8%) | $2,499 |
| 7+ Person Families | 0 (0.0%) | $0 |
| Total | 3,364 (100.0%) | $52,237 |
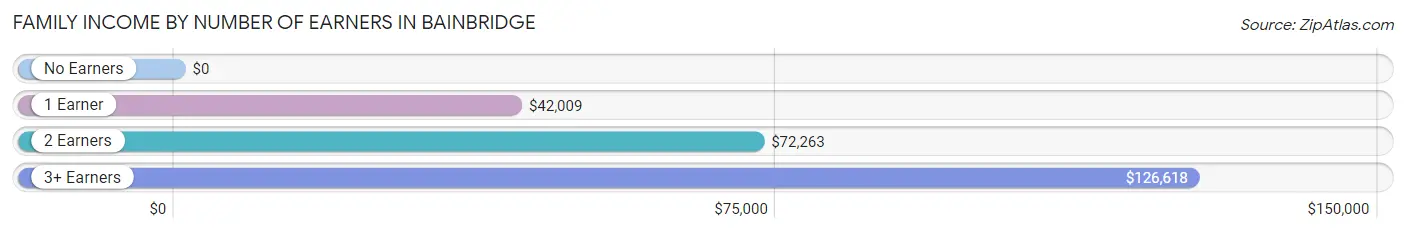
Family Income by Number of Earners in Bainbridge
| Number of Earners | # Families | Median Income |
| No Earners | 863 (25.7%) | $0 |
| 1 Earner | 1,022 (30.4%) | $42,009 |
| 2 Earners | 1,419 (42.2%) | $72,263 |
| 3+ Earners | 60 (1.8%) | $126,618 |
| Total | 3,364 (100.0%) | $52,237 |
Household Income in Bainbridge
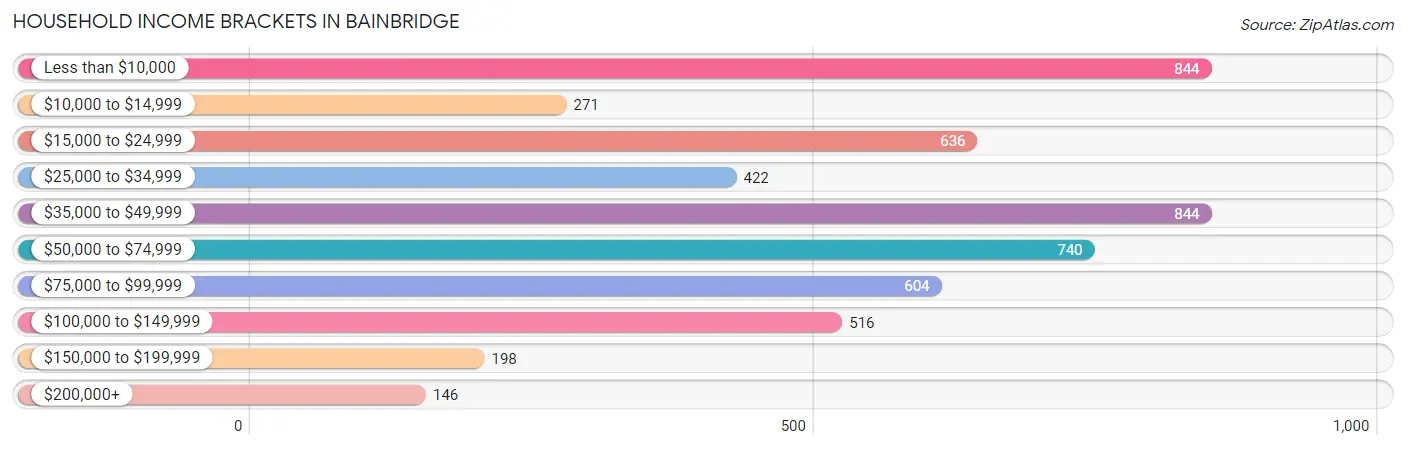
Household Income Brackets in Bainbridge
With 844 households falling in the category, the less than $10,000 income range is the most frequent in Bainbridge, accounting for 16.2% of all households. In contrast, only 146 households (2.8%) fall into the $200,000+ income bracket, making it the least populous group.
| Income Bracket | # Households | % Households |
| Less than $10,000 | 844 | 16.2% |
| $10,000 to $14,999 | 271 | 5.2% |
| $15,000 to $24,999 | 636 | 12.2% |
| $25,000 to $34,999 | 422 | 8.1% |
| $35,000 to $49,999 | 844 | 16.2% |
| $50,000 to $74,999 | 740 | 14.2% |
| $75,000 to $99,999 | 604 | 11.6% |
| $100,000 to $149,999 | 516 | 9.9% |
| $150,000 to $199,999 | 198 | 3.8% |
| $200,000+ | 146 | 2.8% |
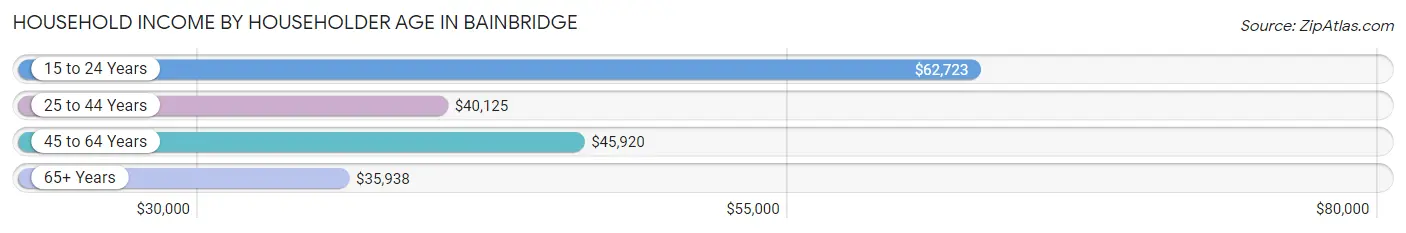
Household Income by Householder Age in Bainbridge
The median household income in Bainbridge is $42,093, with the highest median household income of $62,723 found in the 15 to 24 years age bracket for the primary householder. A total of 413 households (7.9%) fall into this category. Meanwhile, the 65+ years age bracket for the primary householder has the lowest median household income of $35,938, with 1,467 households (28.2%) in this group.
| Income Bracket | # Households | Median Income |
| 15 to 24 Years | 413 (7.9%) | $62,723 |
| 25 to 44 Years | 1,608 (30.9%) | $40,125 |
| 45 to 64 Years | 1,722 (33.1%) | $45,920 |
| 65+ Years | 1,467 (28.2%) | $35,938 |
| Total | 5,210 (100.0%) | $42,093 |
Poverty in Bainbridge
Income Below Poverty by Sex and Age in Bainbridge
With 22.0% poverty level for males and 31.4% for females among the residents of Bainbridge, 5 year old males and under 5 year old females are the most vulnerable to poverty, with 204 males (97.1%) and 209 females (66.6%) in their respective age groups living below the poverty level.
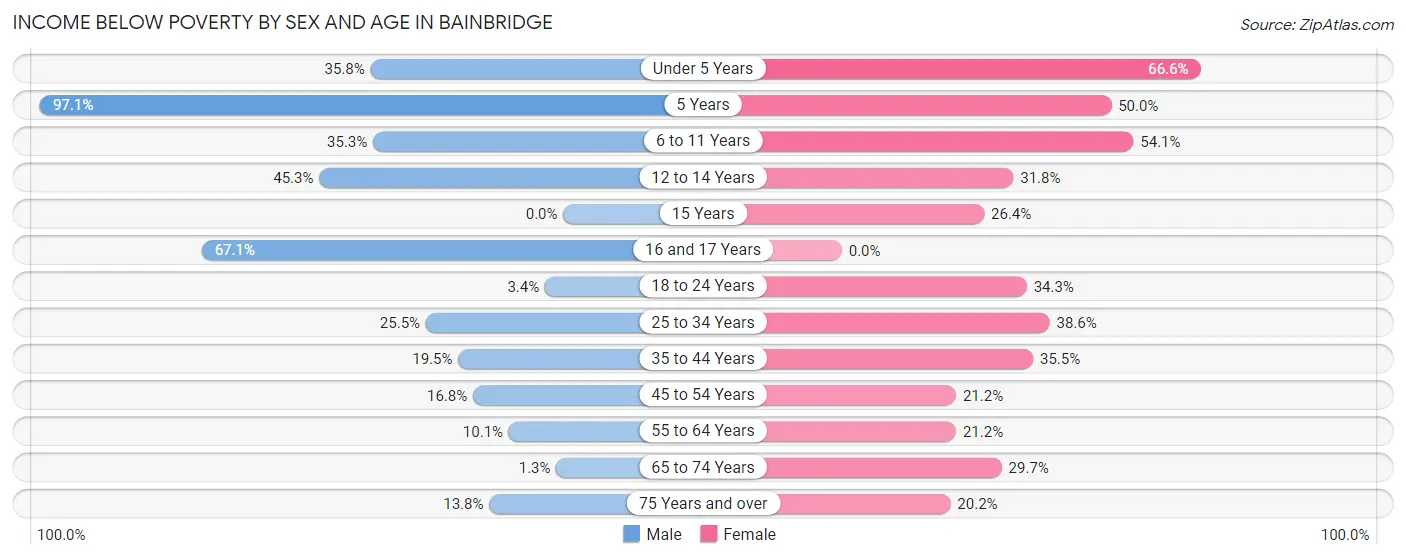
| Age Bracket | Male | Female |
| Under 5 Years | 199 (35.8%) | 209 (66.6%) |
| 5 Years | 204 (97.1%) | 45 (50.0%) |
| 6 to 11 Years | 220 (35.3%) | 197 (54.1%) |
| 12 to 14 Years | 188 (45.3%) | 148 (31.8%) |
| 15 Years | 0 (0.0%) | 42 (26.4%) |
| 16 and 17 Years | 49 (67.1%) | 0 (0.0%) |
| 18 to 24 Years | 26 (3.4%) | 267 (34.3%) |
| 25 to 34 Years | 88 (25.5%) | 290 (38.6%) |
| 35 to 44 Years | 157 (19.5%) | 383 (35.5%) |
| 45 to 54 Years | 119 (16.8%) | 162 (21.2%) |
| 55 to 64 Years | 62 (10.1%) | 171 (21.2%) |
| 65 to 74 Years | 7 (1.3%) | 246 (29.7%) |
| 75 Years and over | 44 (13.8%) | 124 (20.2%) |
| Total | 1,363 (22.0%) | 2,284 (31.4%) |
Income Above Poverty by Sex and Age in Bainbridge
According to the poverty statistics in Bainbridge, males aged 15 years and females aged 16 and 17 years are the age groups that are most secure financially, with 100.0% of males and 100.0% of females in these age groups living above the poverty line.
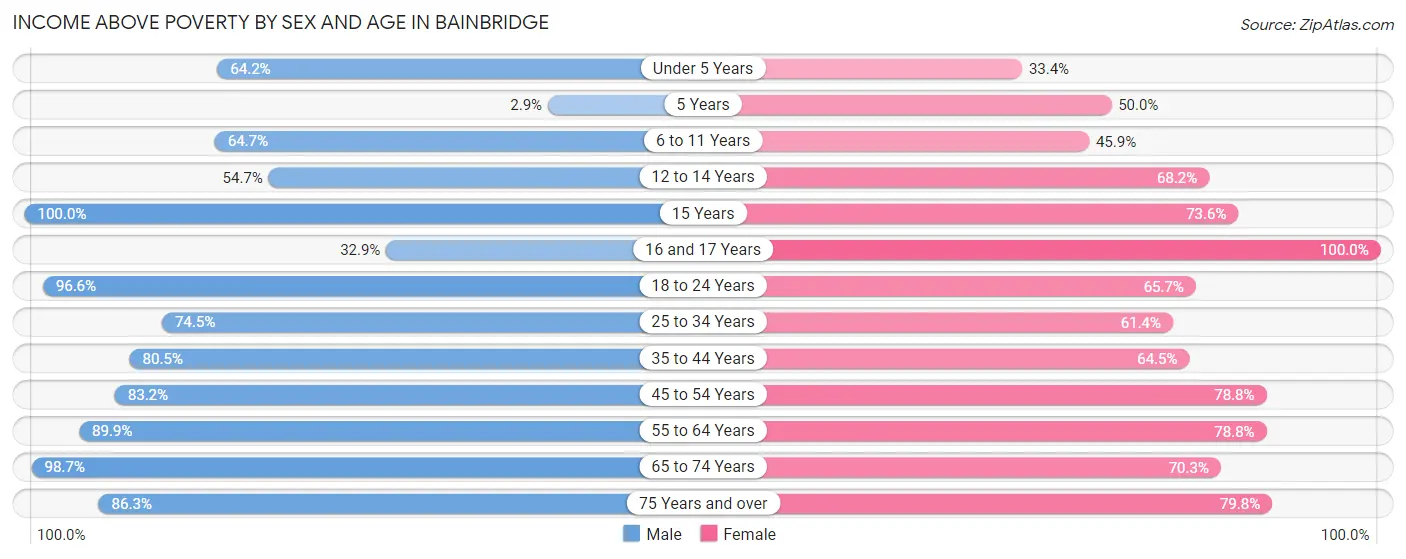
| Age Bracket | Male | Female |
| Under 5 Years | 357 (64.2%) | 105 (33.4%) |
| 5 Years | 6 (2.9%) | 45 (50.0%) |
| 6 to 11 Years | 403 (64.7%) | 167 (45.9%) |
| 12 to 14 Years | 227 (54.7%) | 317 (68.2%) |
| 15 Years | 230 (100.0%) | 117 (73.6%) |
| 16 and 17 Years | 24 (32.9%) | 264 (100.0%) |
| 18 to 24 Years | 738 (96.6%) | 511 (65.7%) |
| 25 to 34 Years | 257 (74.5%) | 462 (61.4%) |
| 35 to 44 Years | 648 (80.5%) | 696 (64.5%) |
| 45 to 54 Years | 591 (83.2%) | 602 (78.8%) |
| 55 to 64 Years | 551 (89.9%) | 636 (78.8%) |
| 65 to 74 Years | 531 (98.7%) | 583 (70.3%) |
| 75 Years and over | 276 (86.3%) | 491 (79.8%) |
| Total | 4,839 (78.0%) | 4,996 (68.6%) |
Income Below Poverty Among Married-Couple Families in Bainbridge
The poverty statistics for married-couple families in Bainbridge show that 10.9% or 192 of the total 1,755 families live below the poverty line. Families with 3 or 4 children have the highest poverty rate of 37.6%, comprising of 89 families. On the other hand, families with no children have the lowest poverty rate of 3.8%, which includes 43 families.
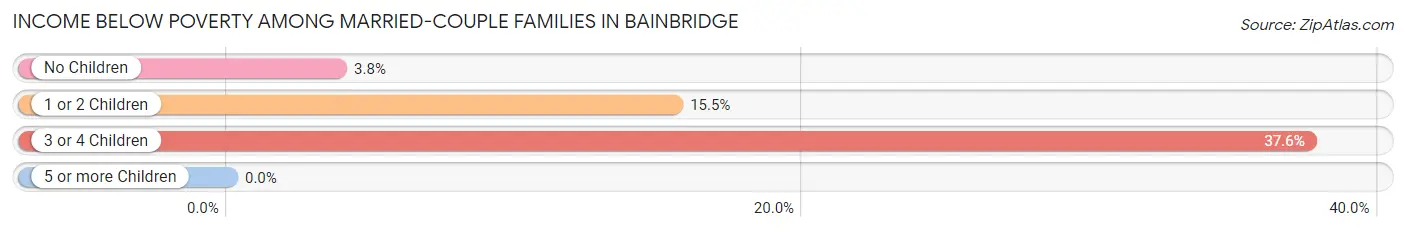
| Children | Above Poverty | Below Poverty |
| No Children | 1,088 (96.2%) | 43 (3.8%) |
| 1 or 2 Children | 327 (84.5%) | 60 (15.5%) |
| 3 or 4 Children | 148 (62.5%) | 89 (37.6%) |
| 5 or more Children | 0 (0.0%) | 0 (0.0%) |
| Total | 1,563 (89.1%) | 192 (10.9%) |
Income Below Poverty Among Single-Parent Households in Bainbridge
According to the poverty data in Bainbridge, 9.9% or 34 single-father households and 42.2% or 533 single-mother households are living below the poverty line. Among single-father households, those with 3 or 4 children have the highest poverty rate, with 7 households (100.0%) experiencing poverty. Likewise, among single-mother households, those with 5 or more children have the highest poverty rate, with 24 households (100.0%) falling below the poverty line.
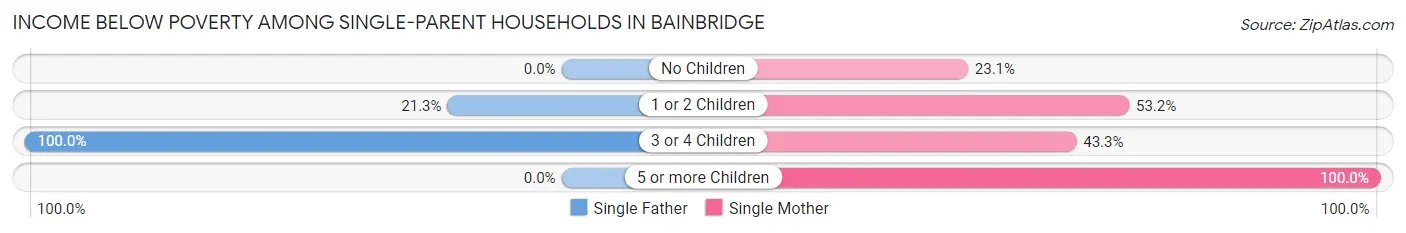
| Children | Single Father | Single Mother |
| No Children | 0 (0.0%) | 93 (23.1%) |
| 1 or 2 Children | 27 (21.3%) | 286 (53.2%) |
| 3 or 4 Children | 7 (100.0%) | 130 (43.3%) |
| 5 or more Children | 0 (0.0%) | 24 (100.0%) |
| Total | 34 (9.9%) | 533 (42.2%) |
Income Below Poverty Among Married-Couple vs Single-Parent Households in Bainbridge
The poverty data for Bainbridge shows that 192 of the married-couple family households (10.9%) and 567 of the single-parent households (35.2%) are living below the poverty level. Within the married-couple family households, those with 3 or 4 children have the highest poverty rate, with 89 households (37.6%) falling below the poverty line. Among the single-parent households, those with 5 or more children have the highest poverty rate, with 24 household (100.0%) living below poverty.
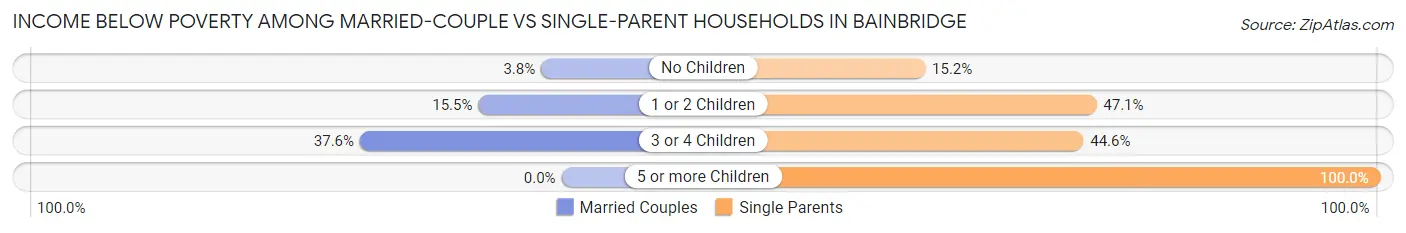
| Children | Married-Couple Families | Single-Parent Households |
| No Children | 43 (3.8%) | 93 (15.2%) |
| 1 or 2 Children | 60 (15.5%) | 313 (47.1%) |
| 3 or 4 Children | 89 (37.6%) | 137 (44.6%) |
| 5 or more Children | 0 (0.0%) | 24 (100.0%) |
| Total | 192 (10.9%) | 567 (35.2%) |
Race in Bainbridge
The most populous races in Bainbridge are Black / African American (7,908 | 55.6%), White / Caucasian (5,331 | 37.4%), and Hispanic or Latino (770 | 5.4%).
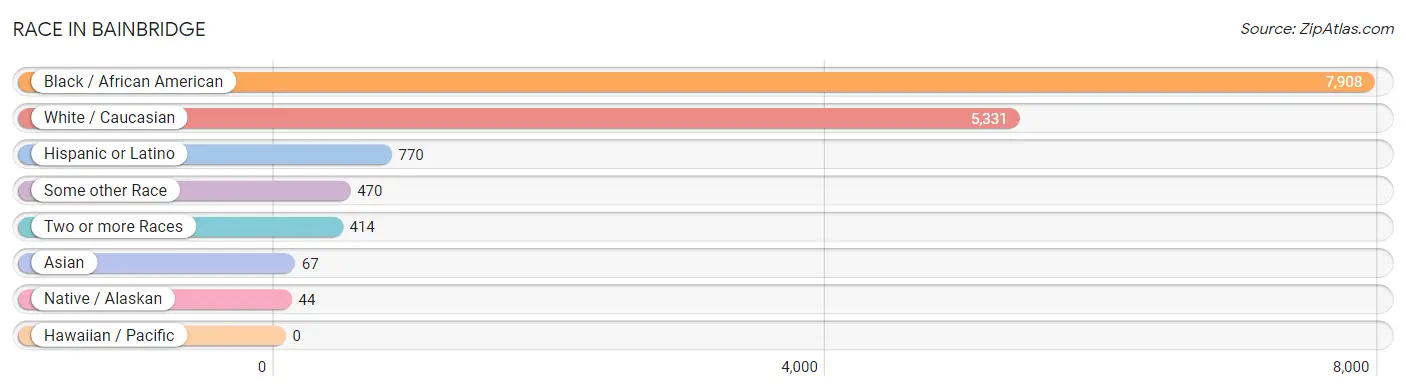
| Race | # Population | % Population |
| Asian | 67 | 0.5% |
| Black / African American | 7,908 | 55.6% |
| Hawaiian / Pacific | 0 | 0.0% |
| Hispanic or Latino | 770 | 5.4% |
| Native / Alaskan | 44 | 0.3% |
| White / Caucasian | 5,331 | 37.4% |
| Two or more Races | 414 | 2.9% |
| Some other Race | 470 | 3.3% |
| Total | 14,234 | 100.0% |
Ancestry in Bainbridge
The most populous ancestries reported in Bainbridge are English (1,076 | 7.6%), Mexican (691 | 4.9%), American (660 | 4.6%), German (366 | 2.6%), and Irish (333 | 2.3%), together accounting for 22.0% of all Bainbridge residents.
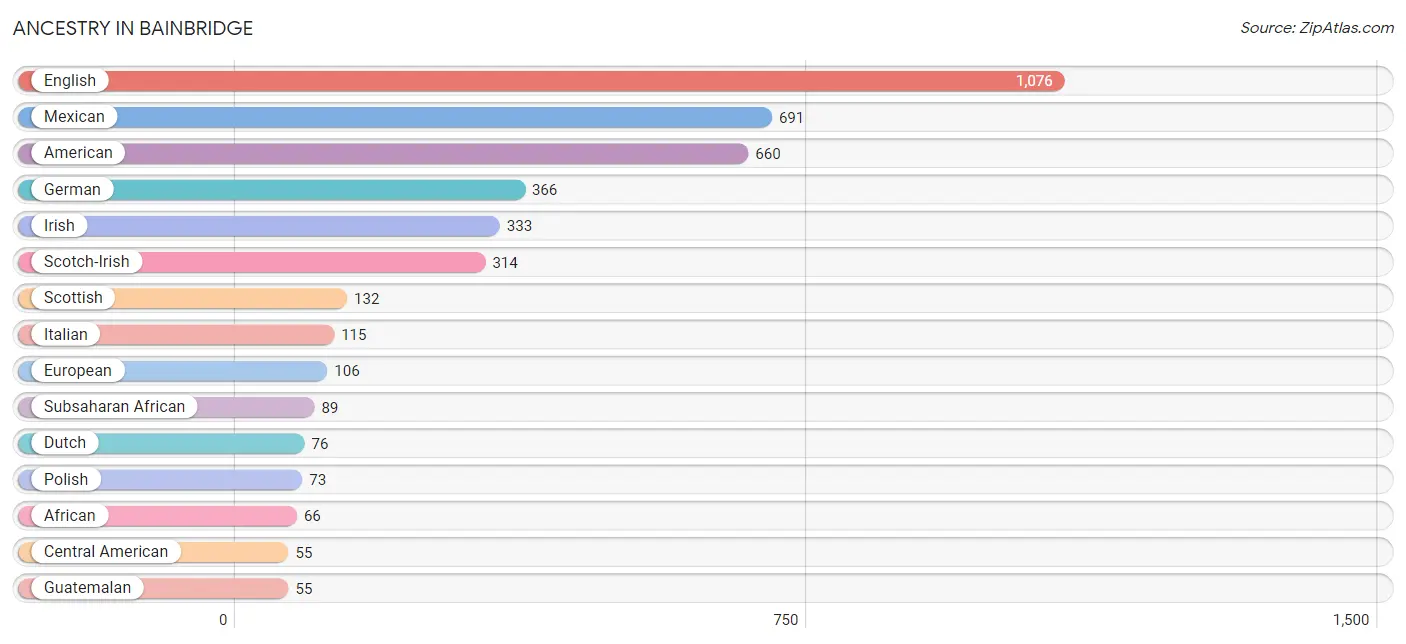
| Ancestry | # Population | % Population |
| African | 66 | 0.5% |
| American | 660 | 4.6% |
| Central American | 55 | 0.4% |
| Cherokee | 20 | 0.1% |
| Danish | 25 | 0.2% |
| Dutch | 76 | 0.5% |
| English | 1,076 | 7.6% |
| Ethiopian | 23 | 0.2% |
| European | 106 | 0.7% |
| Finnish | 10 | 0.1% |
| French | 54 | 0.4% |
| German | 366 | 2.6% |
| Guatemalan | 55 | 0.4% |
| Hungarian | 18 | 0.1% |
| Irish | 333 | 2.3% |
| Italian | 115 | 0.8% |
| Korean | 49 | 0.3% |
| Mexican | 691 | 4.9% |
| Polish | 73 | 0.5% |
| Scandinavian | 37 | 0.3% |
| Scotch-Irish | 314 | 2.2% |
| Scottish | 132 | 0.9% |
| South American | 22 | 0.2% |
| Subsaharan African | 89 | 0.6% |
| Swedish | 7 | 0.1% |
| Thai | 18 | 0.1% |
| Trinidadian and Tobagonian | 22 | 0.2% |
| Venezuelan | 22 | 0.2% | View All 28 Rows |
Immigrants in Bainbridge
The most numerous immigrant groups reported in Bainbridge came from Latin America (230 | 1.6%), Central America (221 | 1.5%), Mexico (170 | 1.2%), Asia (58 | 0.4%), and Guatemala (51 | 0.4%), together accounting for 5.1% of all Bainbridge residents.
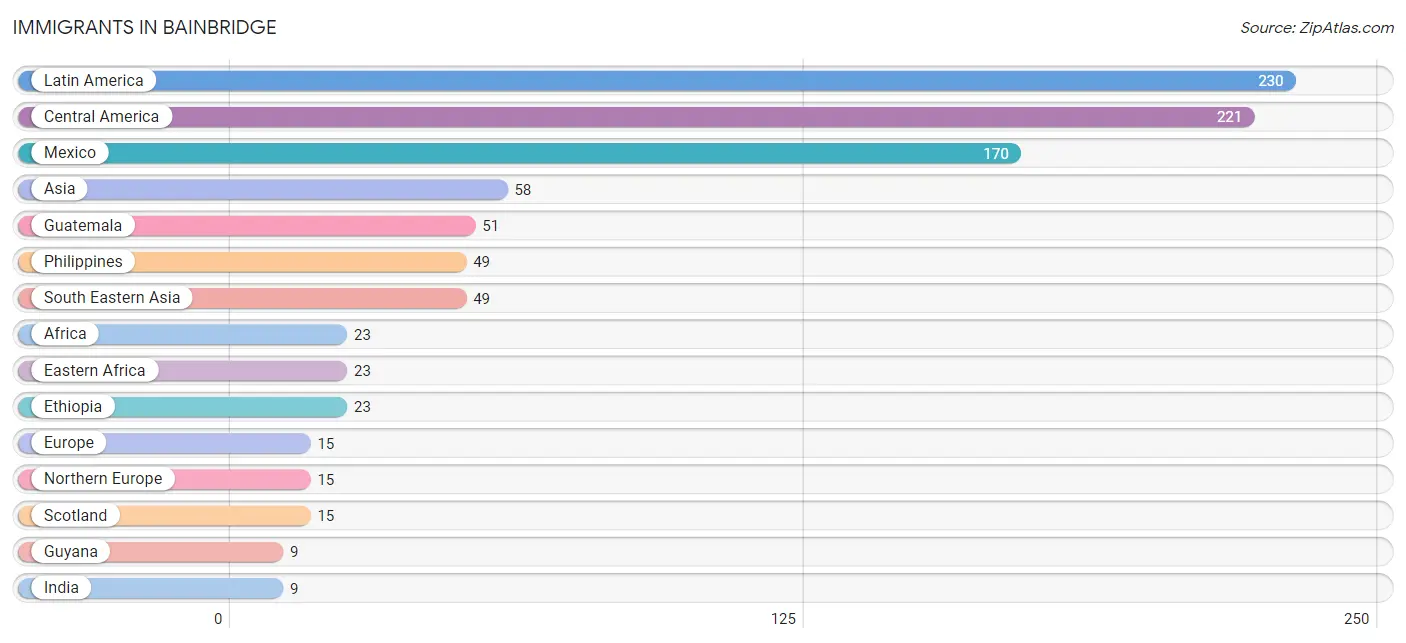
| Immigration Origin | # Population | % Population |
| Africa | 23 | 0.2% |
| Asia | 58 | 0.4% |
| Central America | 221 | 1.5% |
| Eastern Africa | 23 | 0.2% |
| Ethiopia | 23 | 0.2% |
| Europe | 15 | 0.1% |
| Guatemala | 51 | 0.4% |
| Guyana | 9 | 0.1% |
| India | 9 | 0.1% |
| Latin America | 230 | 1.6% |
| Mexico | 170 | 1.2% |
| Northern Europe | 15 | 0.1% |
| Philippines | 49 | 0.3% |
| Scotland | 15 | 0.1% |
| South America | 9 | 0.1% |
| South Central Asia | 9 | 0.1% |
| South Eastern Asia | 49 | 0.3% | View All 17 Rows |
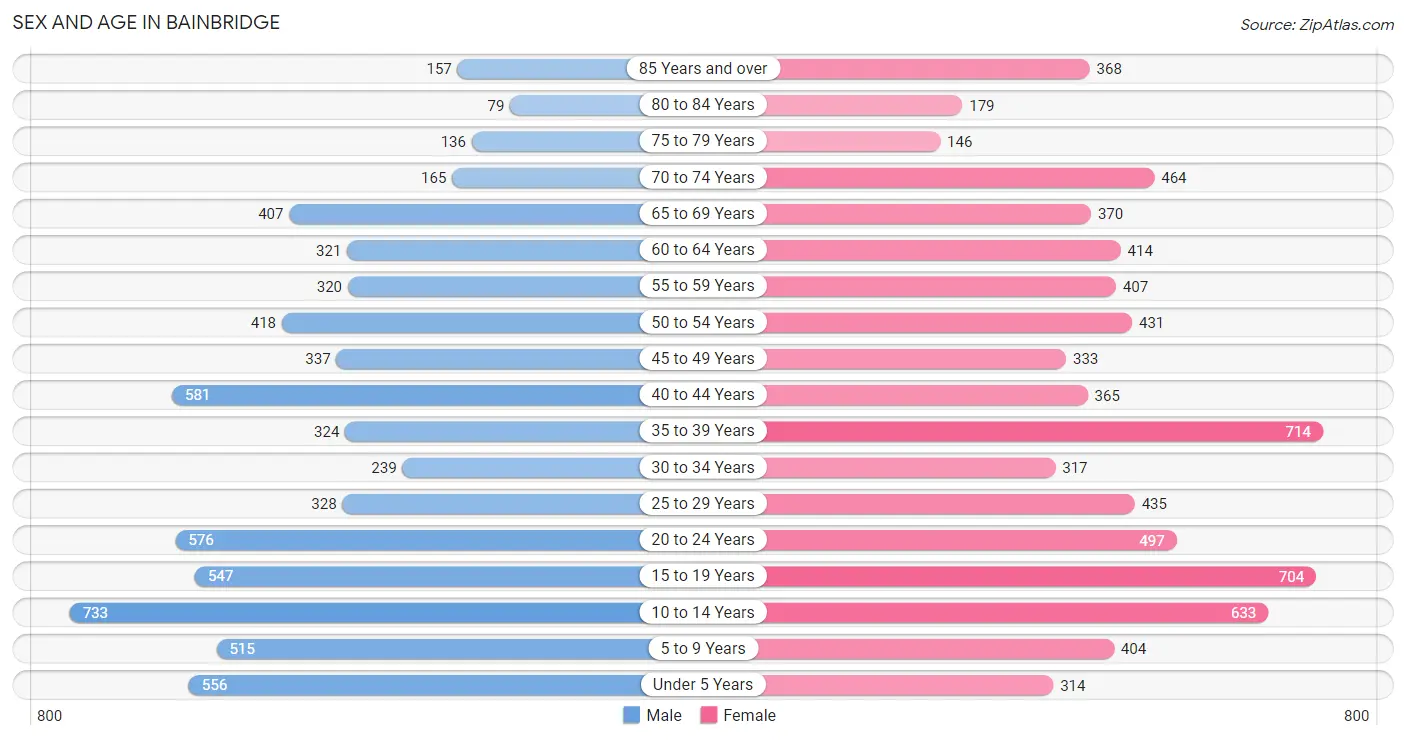
Sex and Age in Bainbridge
Sex and Age in Bainbridge
The most populous age groups in Bainbridge are 10 to 14 Years (733 | 10.9%) for men and 35 to 39 Years (714 | 9.5%) for women.
| Age Bracket | Male | Female |
| Under 5 Years | 556 (8.3%) | 314 (4.2%) |
| 5 to 9 Years | 515 (7.6%) | 404 (5.4%) |
| 10 to 14 Years | 733 (10.9%) | 633 (8.5%) |
| 15 to 19 Years | 547 (8.1%) | 704 (9.4%) |
| 20 to 24 Years | 576 (8.6%) | 497 (6.6%) |
| 25 to 29 Years | 328 (4.9%) | 435 (5.8%) |
| 30 to 34 Years | 239 (3.5%) | 317 (4.2%) |
| 35 to 39 Years | 324 (4.8%) | 714 (9.5%) |
| 40 to 44 Years | 581 (8.6%) | 365 (4.9%) |
| 45 to 49 Years | 337 (5.0%) | 333 (4.4%) |
| 50 to 54 Years | 418 (6.2%) | 431 (5.8%) |
| 55 to 59 Years | 320 (4.8%) | 407 (5.4%) |
| 60 to 64 Years | 321 (4.8%) | 414 (5.5%) |
| 65 to 69 Years | 407 (6.0%) | 370 (4.9%) |
| 70 to 74 Years | 165 (2.5%) | 464 (6.2%) |
| 75 to 79 Years | 136 (2.0%) | 146 (1.9%) |
| 80 to 84 Years | 79 (1.2%) | 179 (2.4%) |
| 85 Years and over | 157 (2.3%) | 368 (4.9%) |
| Total | 6,739 (100.0%) | 7,495 (100.0%) |
Families and Households in Bainbridge
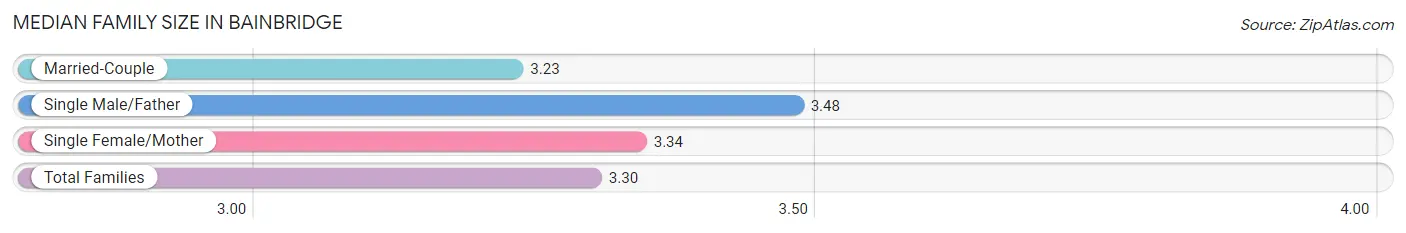
Median Family Size in Bainbridge
The median family size in Bainbridge is 3.30 persons per family, with single male/father families (345 | 10.3%) accounting for the largest median family size of 3.48 persons per family. On the other hand, married-couple families (1,755 | 52.2%) represent the smallest median family size with 3.23 persons per family.
| Family Type | # Families | Family Size |
| Married-Couple | 1,755 (52.2%) | 3.23 |
| Single Male/Father | 345 (10.3%) | 3.48 |
| Single Female/Mother | 1,264 (37.6%) | 3.34 |
| Total Families | 3,364 (100.0%) | 3.30 |
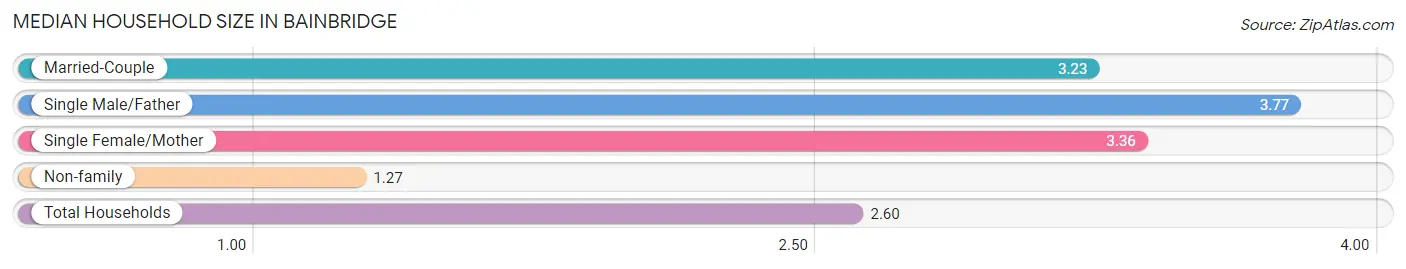
Median Household Size in Bainbridge
The median household size in Bainbridge is 2.60 persons per household, with single male/father households (345 | 6.6%) accounting for the largest median household size of 3.77 persons per household. non-family households (1,846 | 35.4%) represent the smallest median household size with 1.27 persons per household.
| Household Type | # Households | Household Size |
| Married-Couple | 1,755 (33.7%) | 3.23 |
| Single Male/Father | 345 (6.6%) | 3.77 |
| Single Female/Mother | 1,264 (24.3%) | 3.36 |
| Non-family | 1,846 (35.4%) | 1.27 |
| Total Households | 5,210 (100.0%) | 2.60 |
Household Size by Marriage Status in Bainbridge
Out of a total of 5,210 households in Bainbridge, 3,364 (64.6%) are family households, while 1,846 (35.4%) are nonfamily households. The most numerous type of family households are 2-person households, comprising 1,617, and the most common type of nonfamily households are 1-person households, comprising 1,668.
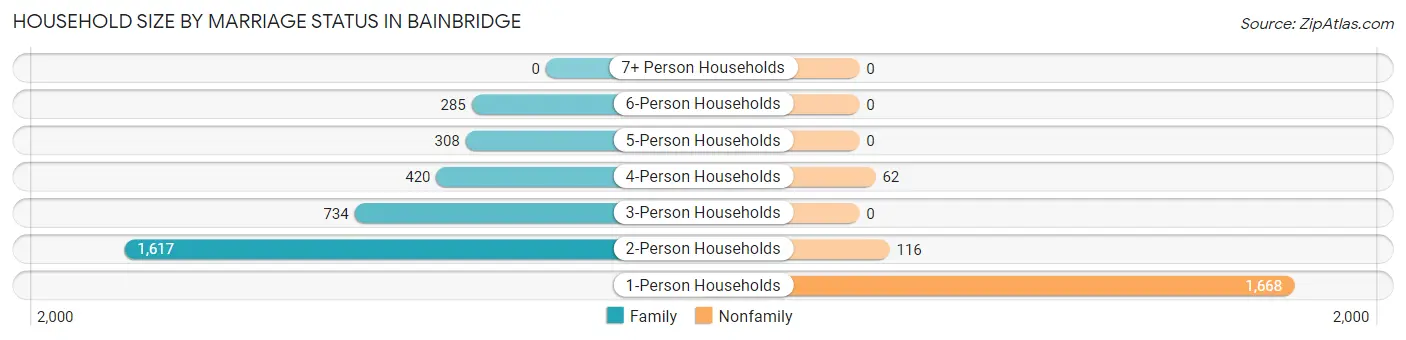
| Household Size | Family Households | Nonfamily Households |
| 1-Person Households | - | 1,668 (32.0%) |
| 2-Person Households | 1,617 (31.0%) | 116 (2.2%) |
| 3-Person Households | 734 (14.1%) | 0 (0.0%) |
| 4-Person Households | 420 (8.1%) | 62 (1.2%) |
| 5-Person Households | 308 (5.9%) | 0 (0.0%) |
| 6-Person Households | 285 (5.5%) | 0 (0.0%) |
| 7+ Person Households | 0 (0.0%) | 0 (0.0%) |
| Total | 3,364 (64.6%) | 1,846 (35.4%) |
Female Fertility in Bainbridge
Fertility by Age in Bainbridge
Average fertility rate in Bainbridge is 39.0 births per 1,000 women. Women in the age bracket of 20 to 34 years have the highest fertility rate with 109.0 births per 1,000 women. Women in the age bracket of 20 to 34 years acount for 100.0% of all women with births.
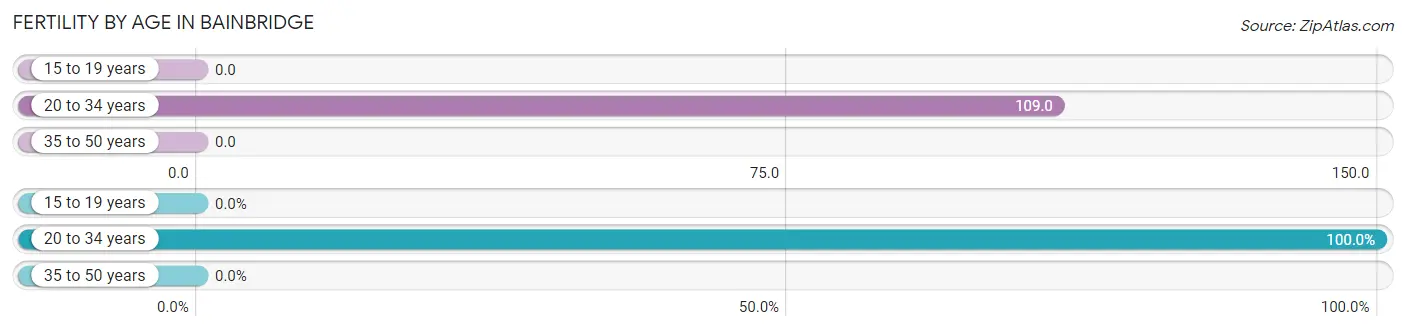
| Age Bracket | Women with Births | Births / 1,000 Women |
| 15 to 19 years | 0 (0.0%) | 0.0 |
| 20 to 34 years | 136 (100.0%) | 109.0 |
| 35 to 50 years | 0 (0.0%) | 0.0 |
| Total | 136 (100.0%) | 39.0 |
Fertility by Age by Marriage Status in Bainbridge
6.6% of women with births (136) in Bainbridge are married. The highest percentage of unmarried women with births falls into 20 to 34 years age bracket with 93.4% of them unmarried at the time of birth, while the lowest percentage of unmarried women with births belong to 20 to 34 years age bracket with 93.4% of them unmarried.
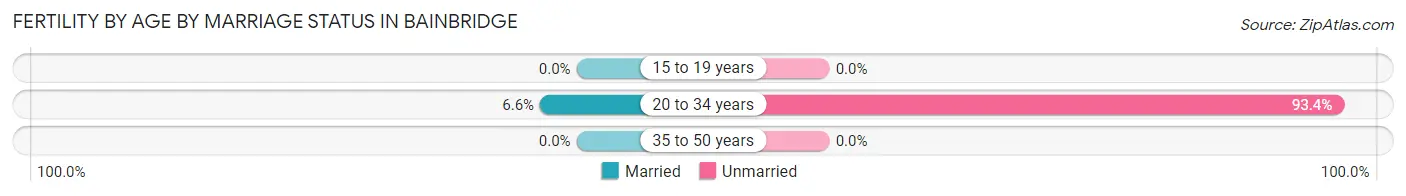
| Age Bracket | Married | Unmarried |
| 15 to 19 years | 0 (0.0%) | 0 (0.0%) |
| 20 to 34 years | 9 (6.6%) | 127 (93.4%) |
| 35 to 50 years | 0 (0.0%) | 0 (0.0%) |
| Total | 9 (6.6%) | 127 (93.4%) |
Fertility by Education in Bainbridge
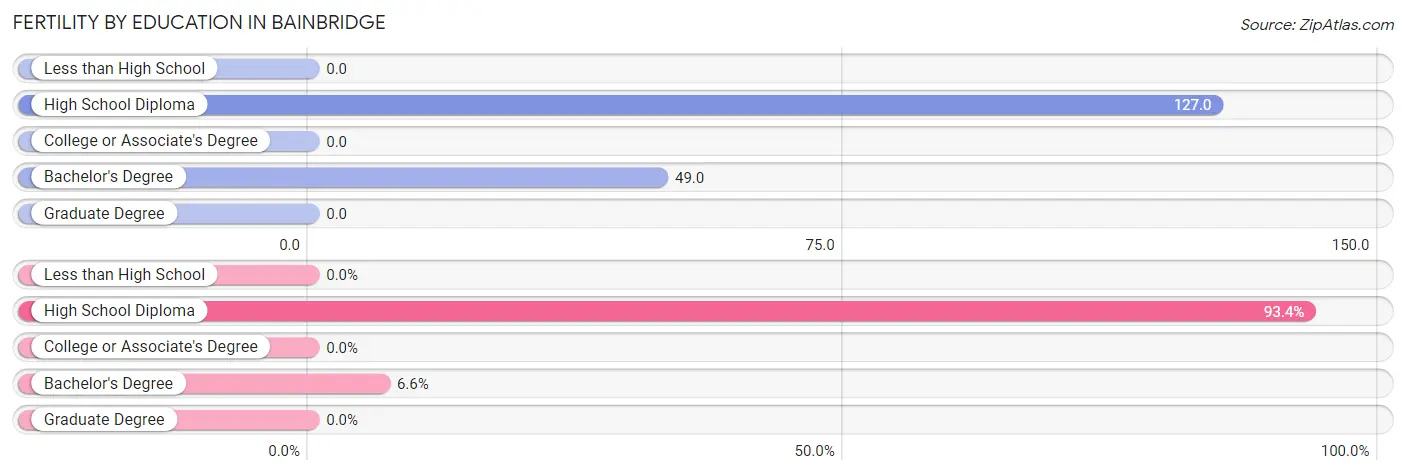
| Educational Attainment | Women with Births | Births / 1,000 Women |
| Less than High School | 0 (0.0%) | 0.0 |
| High School Diploma | 127 (93.4%) | 127.0 |
| College or Associate's Degree | 0 (0.0%) | 0.0 |
| Bachelor's Degree | 9 (6.6%) | 49.0 |
| Graduate Degree | 0 (0.0%) | 0.0 |
| Total | 136 (100.0%) | 39.0 |
Fertility by Education by Marriage Status in Bainbridge
93.4% of women with births in Bainbridge are unmarried. Women with the educational attainment of bachelor's degree are most likely to be married with 100.0% of them married at childbirth, while women with the educational attainment of high school diploma are least likely to be married with 100.0% of them unmarried at childbirth.
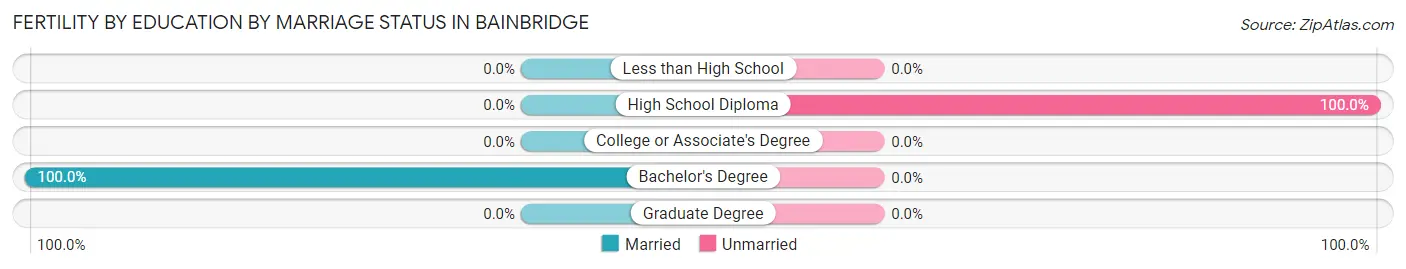
| Educational Attainment | Married | Unmarried |
| Less than High School | 0 (0.0%) | 0 (0.0%) |
| High School Diploma | 0 (0.0%) | 127 (100.0%) |
| College or Associate's Degree | 0 (0.0%) | 0 (0.0%) |
| Bachelor's Degree | 9 (100.0%) | 0 (0.0%) |
| Graduate Degree | 0 (0.0%) | 0 (0.0%) |
| Total | 9 (6.6%) | 127 (93.4%) |
Employment Characteristics in Bainbridge
Employment by Class of Employer in Bainbridge
Among the 4,766 employed individuals in Bainbridge, private company employees (3,044 | 63.9%), state government employees (482 | 10.1%), and not-for-profit organizations (407 | 8.5%) make up the most common classes of employment.
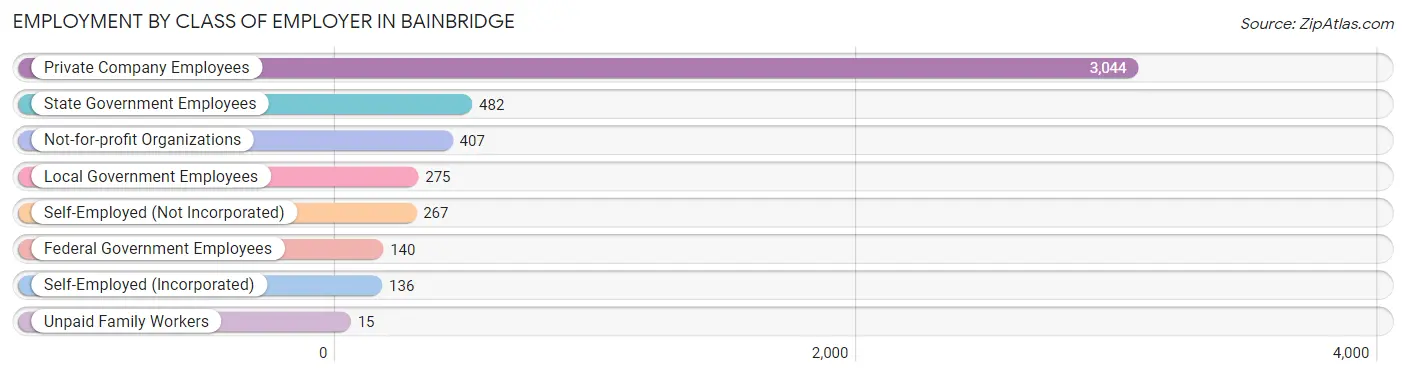
| Employer Class | # Employees | % Employees |
| Private Company Employees | 3,044 | 63.9% |
| Self-Employed (Incorporated) | 136 | 2.9% |
| Self-Employed (Not Incorporated) | 267 | 5.6% |
| Not-for-profit Organizations | 407 | 8.5% |
| Local Government Employees | 275 | 5.8% |
| State Government Employees | 482 | 10.1% |
| Federal Government Employees | 140 | 2.9% |
| Unpaid Family Workers | 15 | 0.3% |
| Total | 4,766 | 100.0% |
Employment Status by Age in Bainbridge
According to the labor force statistics for Bainbridge, out of the total population over 16 years of age (10,690), 50.3% or 5,377 individuals are in the labor force, with 9.5% or 511 of them unemployed. The age group with the highest labor force participation rate is 20 to 24 years, with 79.9% or 857 individuals in the labor force. Within the labor force, the 16 to 19 years age range has the highest percentage of unemployed individuals, with 62.0% or 88 of them being unemployed.
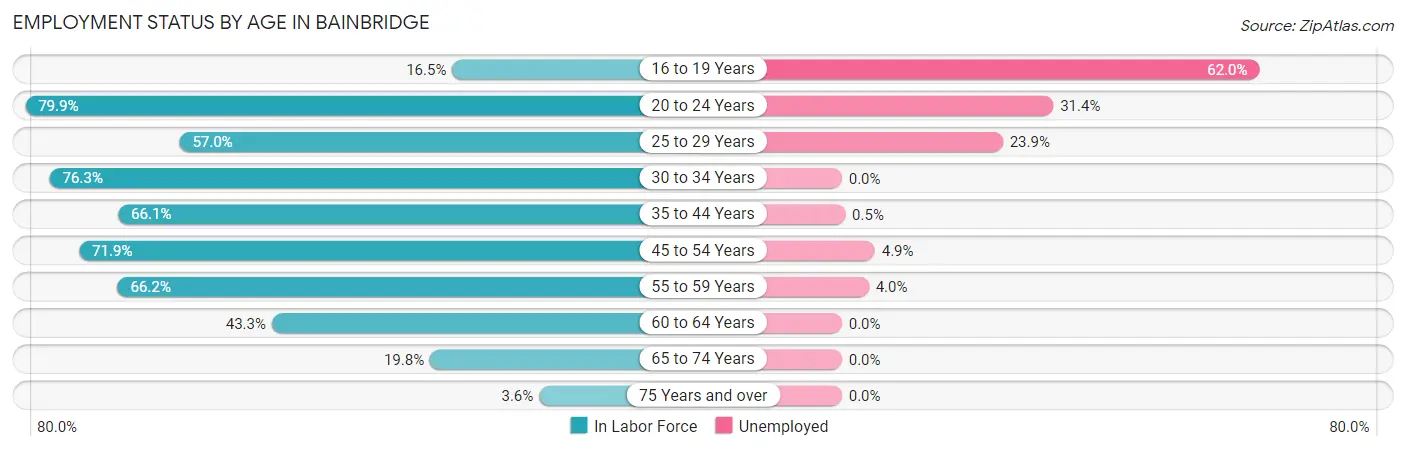
| Age Bracket | In Labor Force | Unemployed |
| 16 to 19 Years | 142 (16.5%) | 88 (62.0%) |
| 20 to 24 Years | 857 (79.9%) | 269 (31.4%) |
| 25 to 29 Years | 435 (57.0%) | 104 (23.9%) |
| 30 to 34 Years | 424 (76.3%) | 0 (0.0%) |
| 35 to 44 Years | 1,311 (66.1%) | 7 (0.5%) |
| 45 to 54 Years | 1,092 (71.9%) | 54 (4.9%) |
| 55 to 59 Years | 481 (66.2%) | 19 (4.0%) |
| 60 to 64 Years | 318 (43.3%) | 0 (0.0%) |
| 65 to 74 Years | 278 (19.8%) | 0 (0.0%) |
| 75 Years and over | 38 (3.6%) | 0 (0.0%) |
| Total | 5,377 (50.3%) | 511 (9.5%) |
Employment Status by Educational Attainment in Bainbridge
According to labor force statistics for Bainbridge, 64.6% of individuals (4,059) out of the total population between 25 and 64 years of age (6,284) are in the labor force, with 4.5% or 183 of them being unemployed. The group with the highest labor force participation rate are those with the educational attainment of bachelor's degree or higher, with 86.5% or 835 individuals in the labor force. Within the labor force, individuals with high school diploma education have the highest percentage of unemployment, with 11.8% or 137 of them being unemployed.
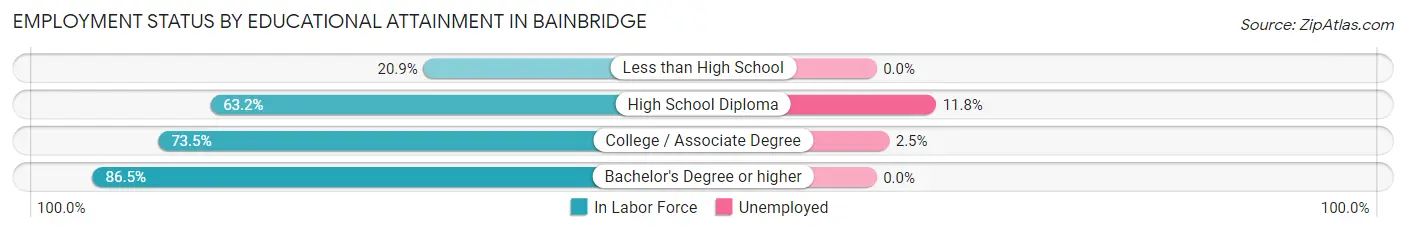
| Educational Attainment | In Labor Force | Unemployed |
| Less than High School | 197 (20.9%) | 0 (0.0%) |
| High School Diploma | 1,162 (63.2%) | 217 (11.8%) |
| College / Associate Degree | 1,867 (73.5%) | 64 (2.5%) |
| Bachelor's Degree or higher | 835 (86.5%) | 0 (0.0%) |
| Total | 4,059 (64.6%) | 283 (4.5%) |
Employment Occupations by Sex in Bainbridge
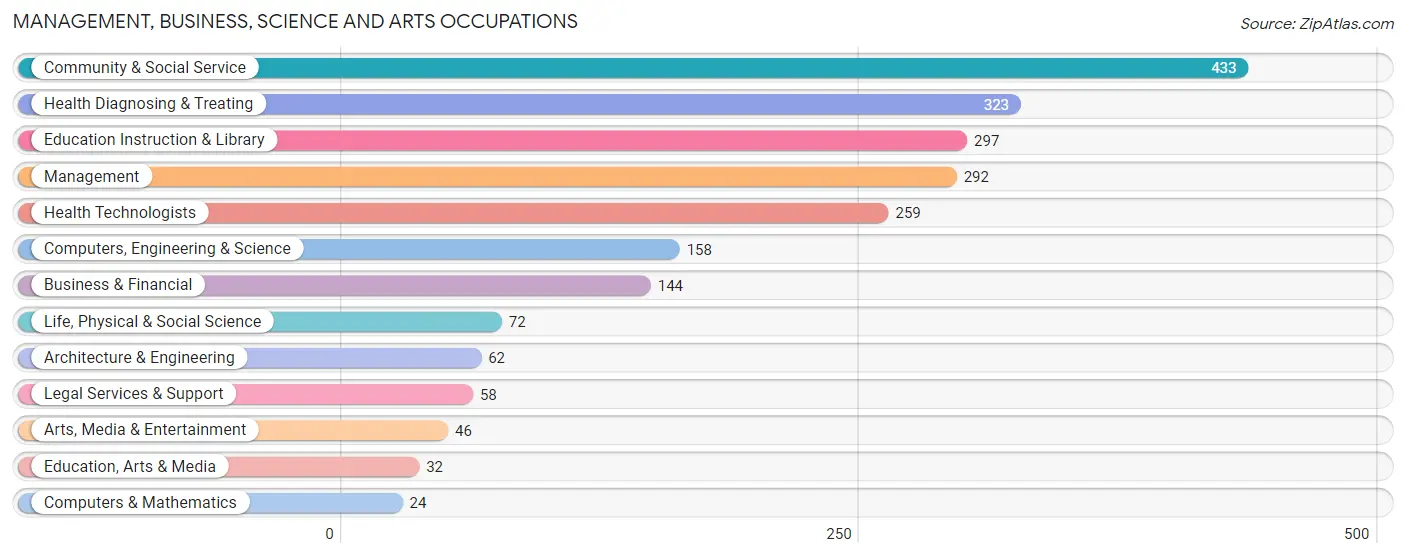
Management, Business, Science and Arts Occupations
The most common Management, Business, Science and Arts occupations in Bainbridge are Community & Social Service (433 | 9.1%), Health Diagnosing & Treating (323 | 6.8%), Education Instruction & Library (297 | 6.3%), Management (292 | 6.2%), and Health Technologists (259 | 5.5%).
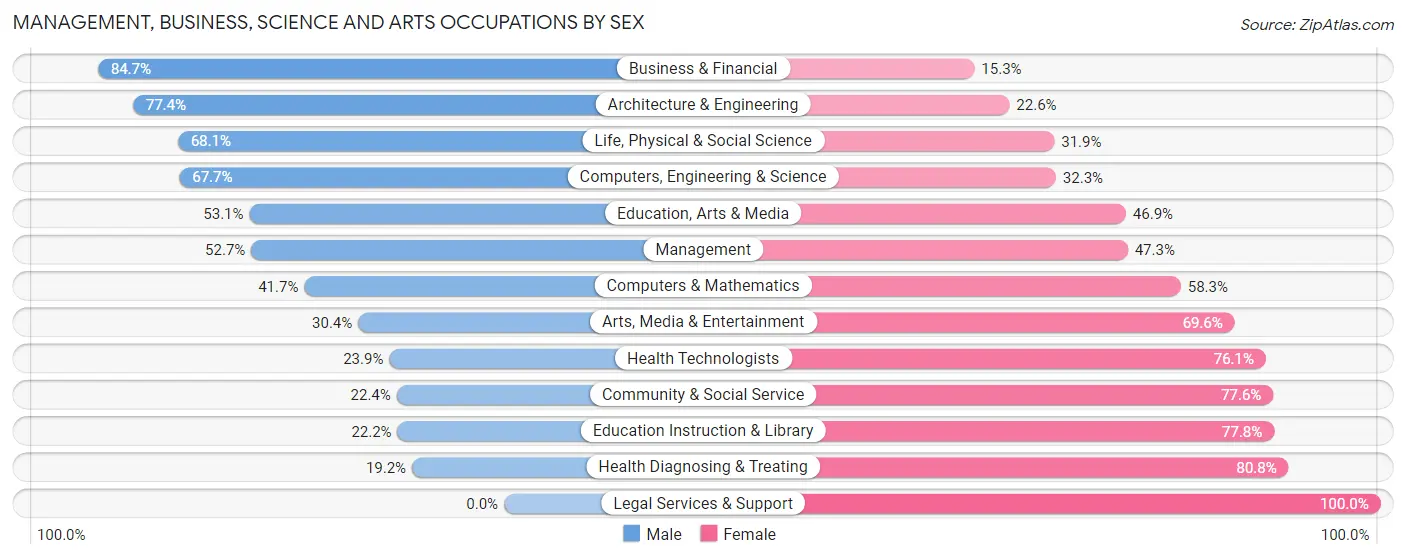
Management, Business, Science and Arts Occupations by Sex
Within the Management, Business, Science and Arts occupations in Bainbridge, the most male-oriented occupations are Business & Financial (84.7%), Architecture & Engineering (77.4%), and Life, Physical & Social Science (68.1%), while the most female-oriented occupations are Legal Services & Support (100.0%), Health Diagnosing & Treating (80.8%), and Education Instruction & Library (77.8%).
| Occupation | Male | Female |
| Management | 154 (52.7%) | 138 (47.3%) |
| Business & Financial | 122 (84.7%) | 22 (15.3%) |
| Computers, Engineering & Science | 107 (67.7%) | 51 (32.3%) |
| Computers & Mathematics | 10 (41.7%) | 14 (58.3%) |
| Architecture & Engineering | 48 (77.4%) | 14 (22.6%) |
| Life, Physical & Social Science | 49 (68.1%) | 23 (31.9%) |
| Community & Social Service | 97 (22.4%) | 336 (77.6%) |
| Education, Arts & Media | 17 (53.1%) | 15 (46.9%) |
| Legal Services & Support | 0 (0.0%) | 58 (100.0%) |
| Education Instruction & Library | 66 (22.2%) | 231 (77.8%) |
| Arts, Media & Entertainment | 14 (30.4%) | 32 (69.6%) |
| Health Diagnosing & Treating | 62 (19.2%) | 261 (80.8%) |
| Health Technologists | 62 (23.9%) | 197 (76.1%) |
| Total (Category) | 542 (40.2%) | 808 (59.9%) |
| Total (Overall) | 2,213 (46.7%) | 2,527 (53.3%) |
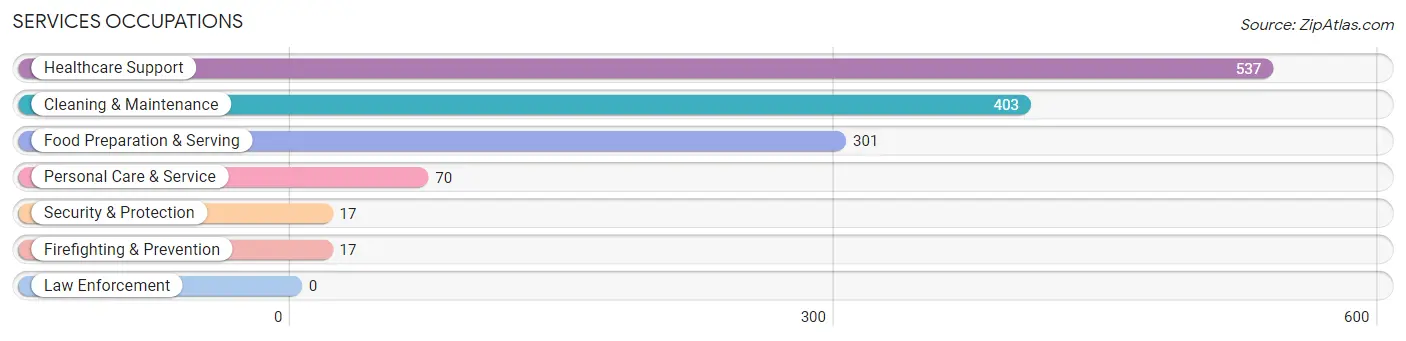
Services Occupations
The most common Services occupations in Bainbridge are Healthcare Support (537 | 11.3%), Cleaning & Maintenance (403 | 8.5%), Food Preparation & Serving (301 | 6.4%), Personal Care & Service (70 | 1.5%), and Security & Protection (17 | 0.4%).
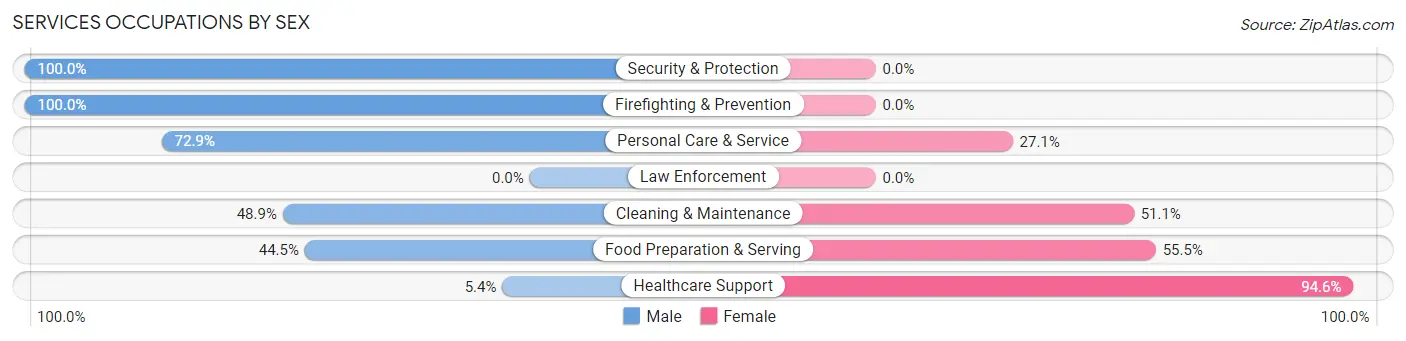
Services Occupations by Sex
Within the Services occupations in Bainbridge, the most male-oriented occupations are Security & Protection (100.0%), Firefighting & Prevention (100.0%), and Personal Care & Service (72.9%), while the most female-oriented occupations are Healthcare Support (94.6%), Food Preparation & Serving (55.5%), and Cleaning & Maintenance (51.1%).
| Occupation | Male | Female |
| Healthcare Support | 29 (5.4%) | 508 (94.6%) |
| Security & Protection | 17 (100.0%) | 0 (0.0%) |
| Firefighting & Prevention | 17 (100.0%) | 0 (0.0%) |
| Law Enforcement | 0 (0.0%) | 0 (0.0%) |
| Food Preparation & Serving | 134 (44.5%) | 167 (55.5%) |
| Cleaning & Maintenance | 197 (48.9%) | 206 (51.1%) |
| Personal Care & Service | 51 (72.9%) | 19 (27.1%) |
| Total (Category) | 428 (32.2%) | 900 (67.8%) |
| Total (Overall) | 2,213 (46.7%) | 2,527 (53.3%) |
Sales and Office Occupations
The most common Sales and Office occupations in Bainbridge are Sales & Related (540 | 11.4%), and Office & Administration (265 | 5.6%).
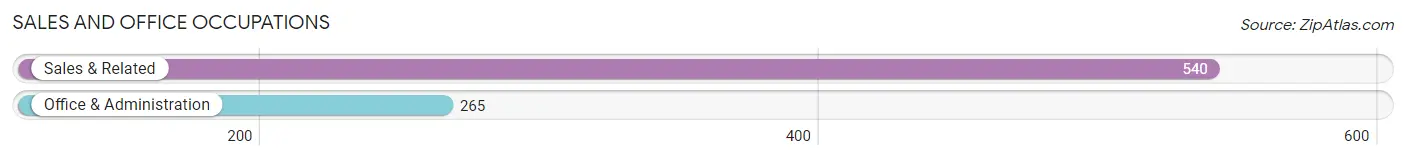
Sales and Office Occupations by Sex
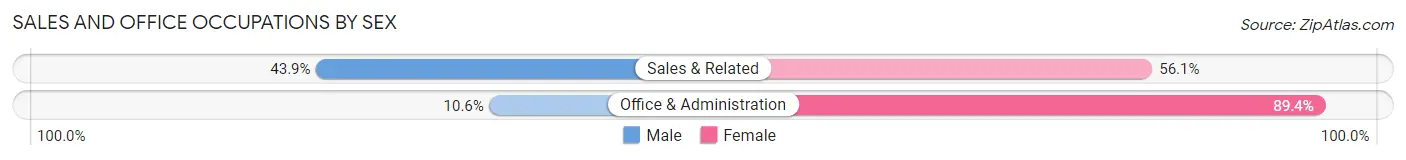
| Occupation | Male | Female |
| Sales & Related | 237 (43.9%) | 303 (56.1%) |
| Office & Administration | 28 (10.6%) | 237 (89.4%) |
| Total (Category) | 265 (32.9%) | 540 (67.1%) |
| Total (Overall) | 2,213 (46.7%) | 2,527 (53.3%) |
Natural Resources, Construction and Maintenance Occupations
The most common Natural Resources, Construction and Maintenance occupations in Bainbridge are Construction & Extraction (285 | 6.0%), Installation, Maintenance & Repair (75 | 1.6%), and Farming, Fishing & Forestry (11 | 0.2%).
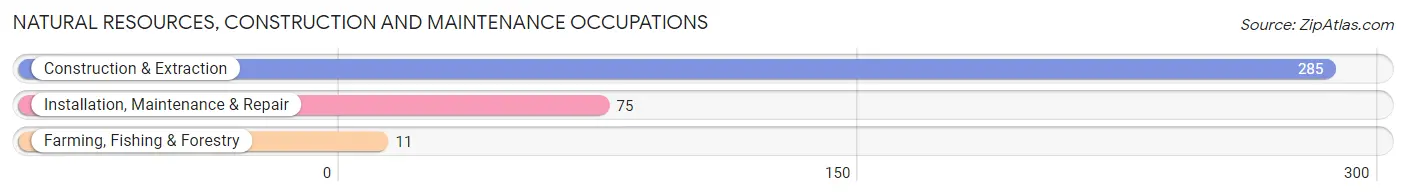
Natural Resources, Construction and Maintenance Occupations by Sex
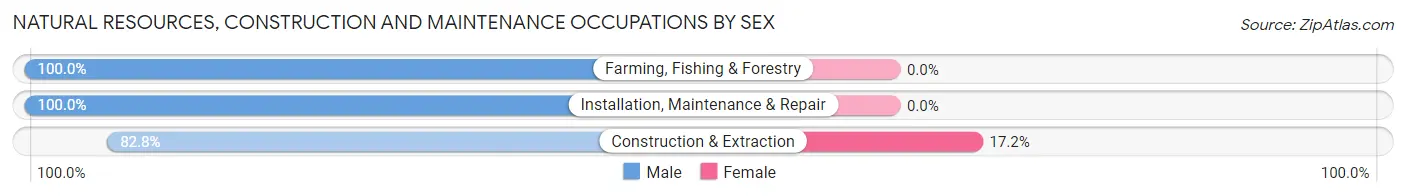
| Occupation | Male | Female |
| Farming, Fishing & Forestry | 11 (100.0%) | 0 (0.0%) |
| Construction & Extraction | 236 (82.8%) | 49 (17.2%) |
| Installation, Maintenance & Repair | 75 (100.0%) | 0 (0.0%) |
| Total (Category) | 322 (86.8%) | 49 (13.2%) |
| Total (Overall) | 2,213 (46.7%) | 2,527 (53.3%) |
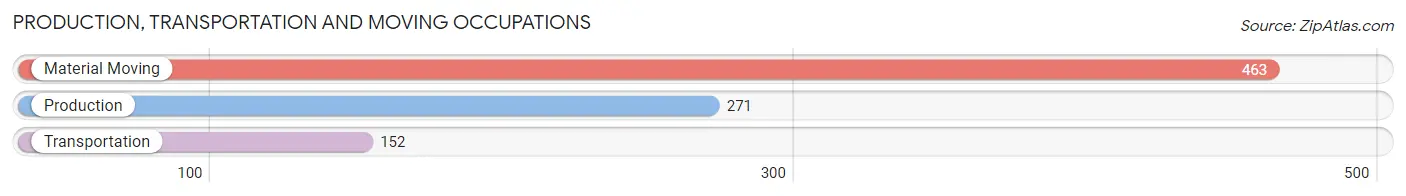
Production, Transportation and Moving Occupations
The most common Production, Transportation and Moving occupations in Bainbridge are Material Moving (463 | 9.8%), Production (271 | 5.7%), and Transportation (152 | 3.2%).
Production, Transportation and Moving Occupations by Sex
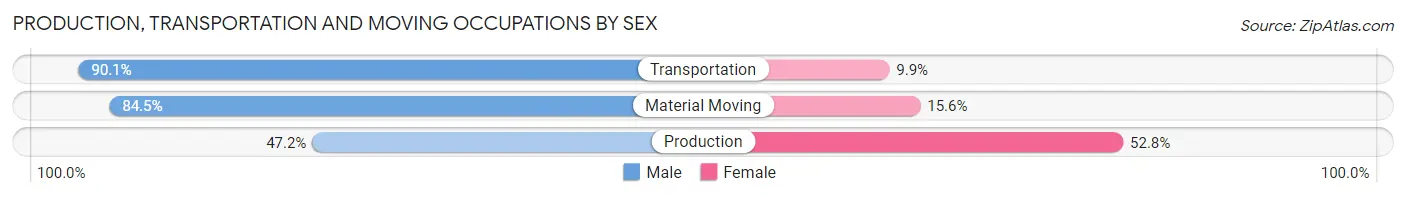
| Occupation | Male | Female |
| Production | 128 (47.2%) | 143 (52.8%) |
| Transportation | 137 (90.1%) | 15 (9.9%) |
| Material Moving | 391 (84.5%) | 72 (15.5%) |
| Total (Category) | 656 (74.0%) | 230 (26.0%) |
| Total (Overall) | 2,213 (46.7%) | 2,527 (53.3%) |
Employment Industries by Sex in Bainbridge
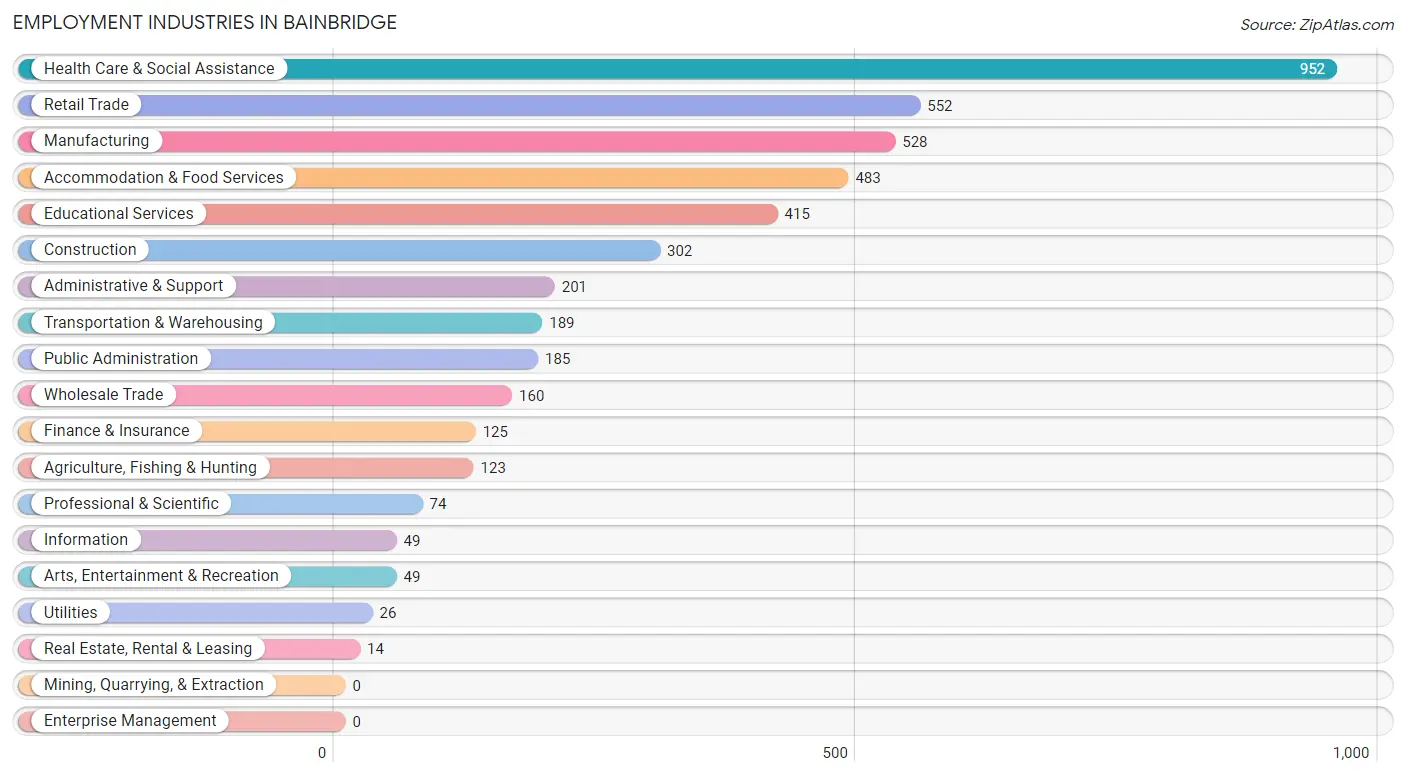
Employment Industries in Bainbridge
The major employment industries in Bainbridge include Health Care & Social Assistance (952 | 20.1%), Retail Trade (552 | 11.7%), Manufacturing (528 | 11.1%), Accommodation & Food Services (483 | 10.2%), and Educational Services (415 | 8.8%).
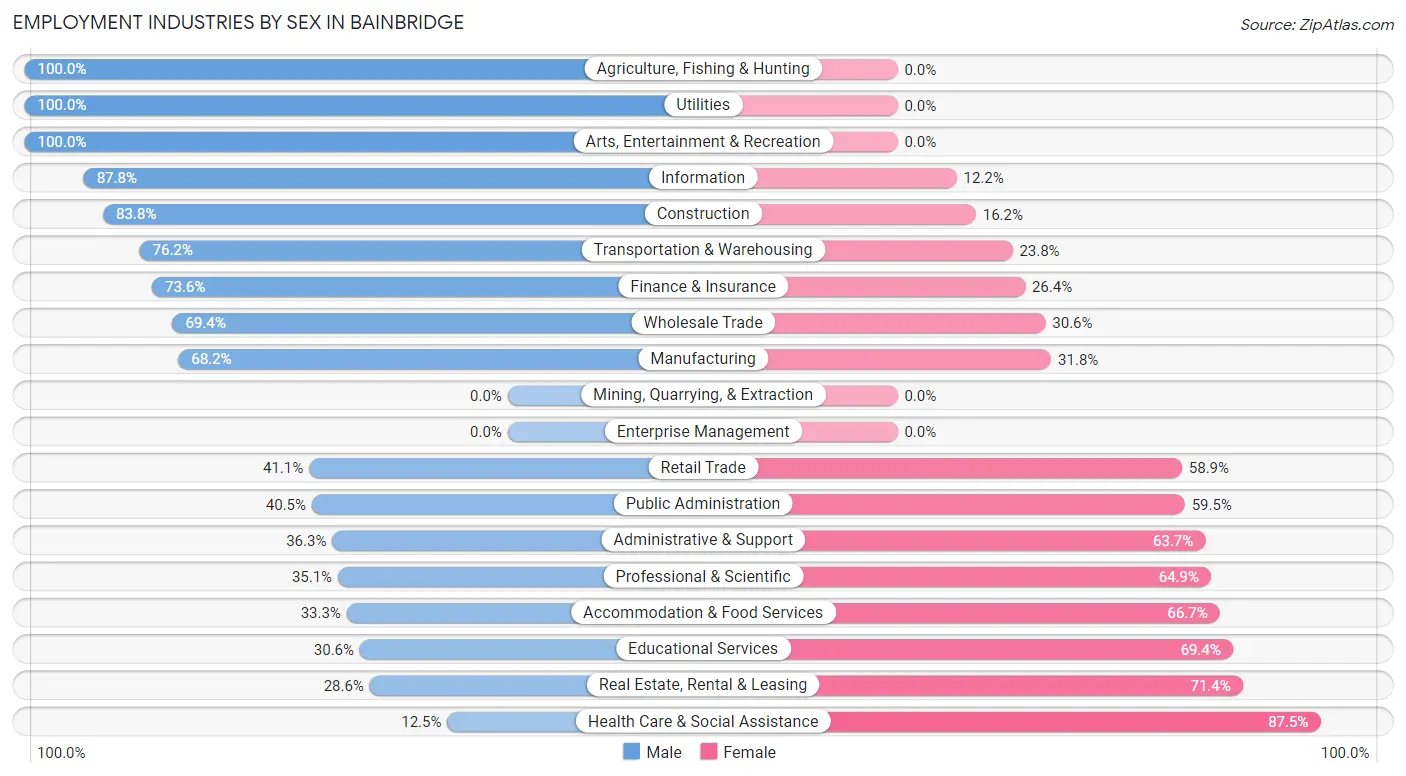
Employment Industries by Sex in Bainbridge
The Bainbridge industries that see more men than women are Agriculture, Fishing & Hunting (100.0%), Utilities (100.0%), and Arts, Entertainment & Recreation (100.0%), whereas the industries that tend to have a higher number of women are Health Care & Social Assistance (87.5%), Real Estate, Rental & Leasing (71.4%), and Educational Services (69.4%).
| Industry | Male | Female |
| Agriculture, Fishing & Hunting | 123 (100.0%) | 0 (0.0%) |
| Mining, Quarrying, & Extraction | 0 (0.0%) | 0 (0.0%) |
| Construction | 253 (83.8%) | 49 (16.2%) |
| Manufacturing | 360 (68.2%) | 168 (31.8%) |
| Wholesale Trade | 111 (69.4%) | 49 (30.6%) |
| Retail Trade | 227 (41.1%) | 325 (58.9%) |
| Transportation & Warehousing | 144 (76.2%) | 45 (23.8%) |
| Utilities | 26 (100.0%) | 0 (0.0%) |
| Information | 43 (87.8%) | 6 (12.2%) |
| Finance & Insurance | 92 (73.6%) | 33 (26.4%) |
| Real Estate, Rental & Leasing | 4 (28.6%) | 10 (71.4%) |
| Professional & Scientific | 26 (35.1%) | 48 (64.9%) |
| Enterprise Management | 0 (0.0%) | 0 (0.0%) |
| Administrative & Support | 73 (36.3%) | 128 (63.7%) |
| Educational Services | 127 (30.6%) | 288 (69.4%) |
| Health Care & Social Assistance | 119 (12.5%) | 833 (87.5%) |
| Arts, Entertainment & Recreation | 49 (100.0%) | 0 (0.0%) |
| Accommodation & Food Services | 161 (33.3%) | 322 (66.7%) |
| Public Administration | 75 (40.5%) | 110 (59.5%) |
| Total | 2,213 (46.7%) | 2,527 (53.3%) |
Education in Bainbridge
School Enrollment in Bainbridge
The most common levels of schooling among the 3,371 students in Bainbridge are middle school (999 | 29.6%), high school (874 | 25.9%), and elementary school (764 | 22.7%).
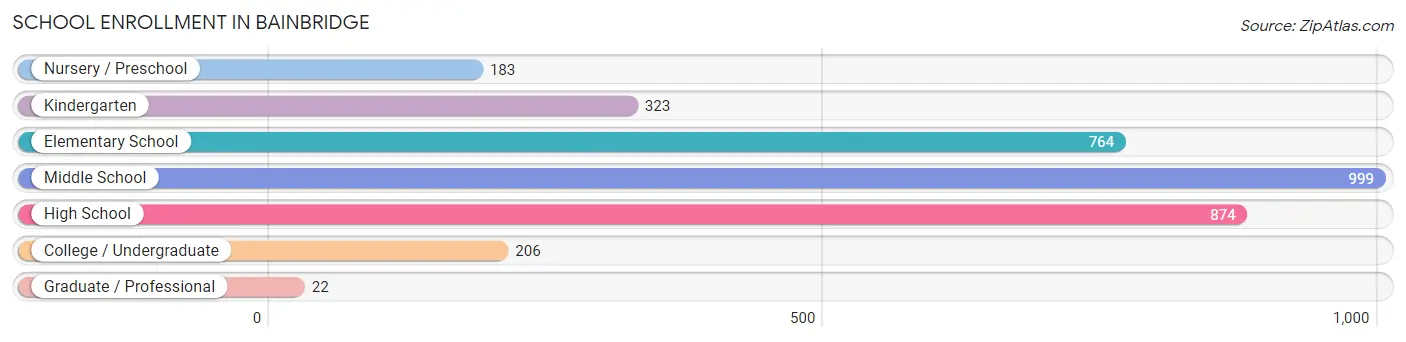
| School Level | # Students | % Students |
| Nursery / Preschool | 183 | 5.4% |
| Kindergarten | 323 | 9.6% |
| Elementary School | 764 | 22.7% |
| Middle School | 999 | 29.6% |
| High School | 874 | 25.9% |
| College / Undergraduate | 206 | 6.1% |
| Graduate / Professional | 22 | 0.6% |
| Total | 3,371 | 100.0% |
School Enrollment by Age by Funding Source in Bainbridge
Out of a total of 3,371 students who are enrolled in schools in Bainbridge, 84 (2.5%) attend a private institution, while the remaining 3,287 (97.5%) are enrolled in public schools. The age group of 15 to 17 year olds has the highest likelihood of being enrolled in private schools, with 26 (4.2% in the age bracket) enrolled. Conversely, the age group of 3 to 4 year olds has the lowest likelihood of being enrolled in a private school, with 183 (100.0% in the age bracket) attending a public institution.
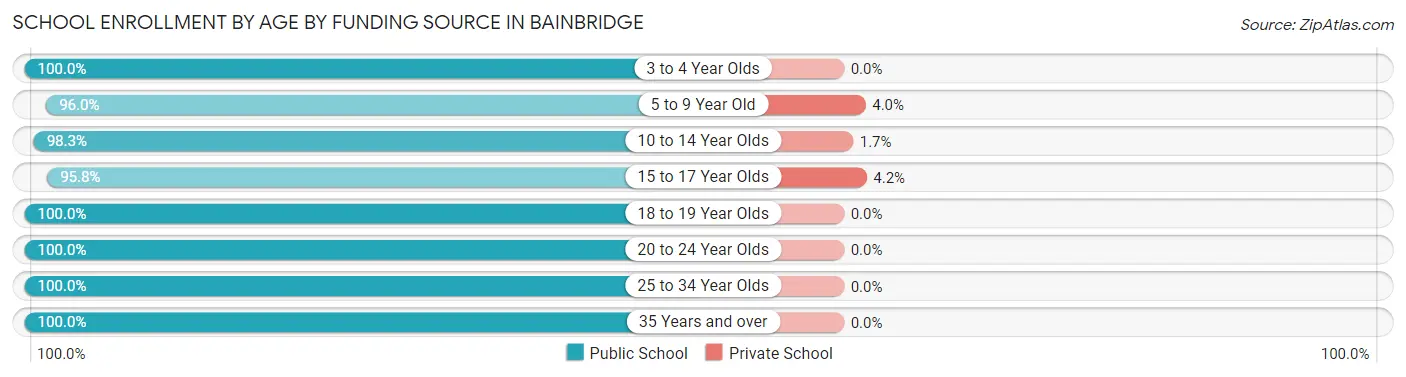
| Age Bracket | Public School | Private School |
| 3 to 4 Year Olds | 183 (100.0%) | 0 (0.0%) |
| 5 to 9 Year Old | 810 (96.0%) | 34 (4.0%) |
| 10 to 14 Year Olds | 1,332 (98.3%) | 23 (1.7%) |
| 15 to 17 Year Olds | 590 (95.8%) | 26 (4.2%) |
| 18 to 19 Year Olds | 167 (100.0%) | 0 (0.0%) |
| 20 to 24 Year Olds | 129 (100.0%) | 0 (0.0%) |
| 25 to 34 Year Olds | 43 (100.0%) | 0 (0.0%) |
| 35 Years and over | 34 (100.0%) | 0 (0.0%) |
| Total | 3,287 (97.5%) | 84 (2.5%) |
Educational Attainment by Field of Study in Bainbridge
Education (331 | 20.2%), bio, nature & agricultural (250 | 15.3%), liberal arts & history (223 | 13.6%), business (212 | 13.0%), and science & technology (191 | 11.7%) are the most common fields of study among 1,637 individuals in Bainbridge who have obtained a bachelor's degree or higher.
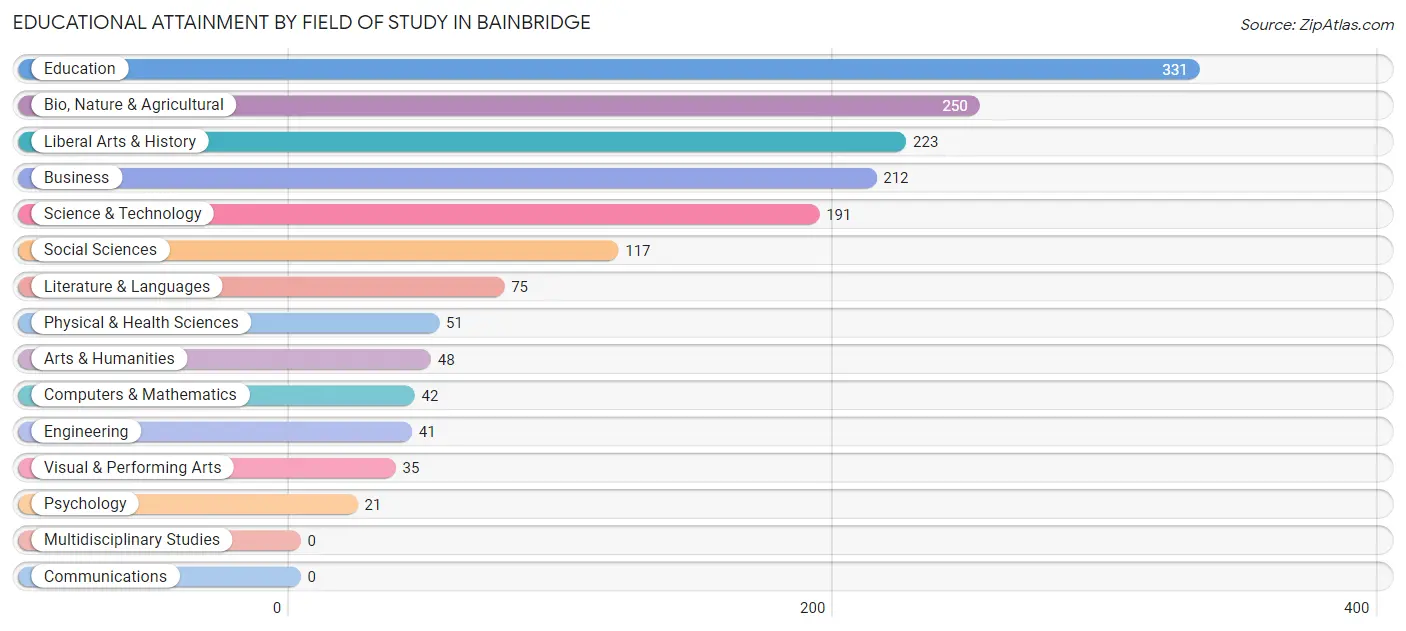
| Field of Study | # Graduates | % Graduates |
| Computers & Mathematics | 42 | 2.6% |
| Bio, Nature & Agricultural | 250 | 15.3% |
| Physical & Health Sciences | 51 | 3.1% |
| Psychology | 21 | 1.3% |
| Social Sciences | 117 | 7.1% |
| Engineering | 41 | 2.5% |
| Multidisciplinary Studies | 0 | 0.0% |
| Science & Technology | 191 | 11.7% |
| Business | 212 | 13.0% |
| Education | 331 | 20.2% |
| Literature & Languages | 75 | 4.6% |
| Liberal Arts & History | 223 | 13.6% |
| Visual & Performing Arts | 35 | 2.1% |
| Communications | 0 | 0.0% |
| Arts & Humanities | 48 | 2.9% |
| Total | 1,637 | 100.0% |
Transportation & Commute in Bainbridge
Vehicle Availability by Sex in Bainbridge
The most prevalent vehicle ownership categories in Bainbridge are males with 2 vehicles (1,383, accounting for 60.8%) and females with 2 vehicles (1,058, making up 55.5%).
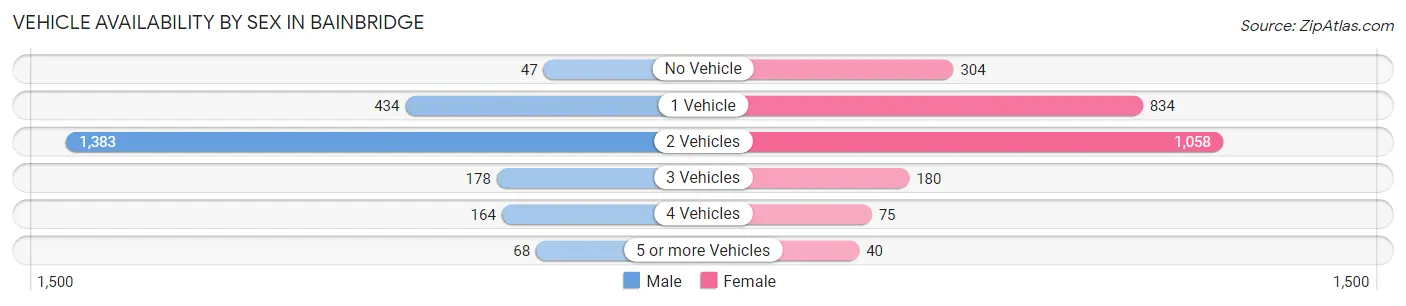
| Vehicles Available | Male | Female |
| No Vehicle | 47 (2.1%) | 304 (12.2%) |
| 1 Vehicle | 434 (19.1%) | 834 (33.5%) |
| 2 Vehicles | 1,383 (60.8%) | 1,058 (42.5%) |
| 3 Vehicles | 178 (7.8%) | 180 (7.2%) |
| 4 Vehicles | 164 (7.2%) | 75 (3.0%) |
| 5 or more Vehicles | 68 (3.0%) | 40 (1.6%) |
| Total | 2,274 (100.0%) | 2,491 (100.0%) |
Commute Time in Bainbridge
The most frequently occuring commute durations in Bainbridge are 5 to 9 minutes (1,163 commuters, 25.0%), 10 to 14 minutes (1,076 commuters, 23.1%), and 15 to 19 minutes (1,014 commuters, 21.8%).
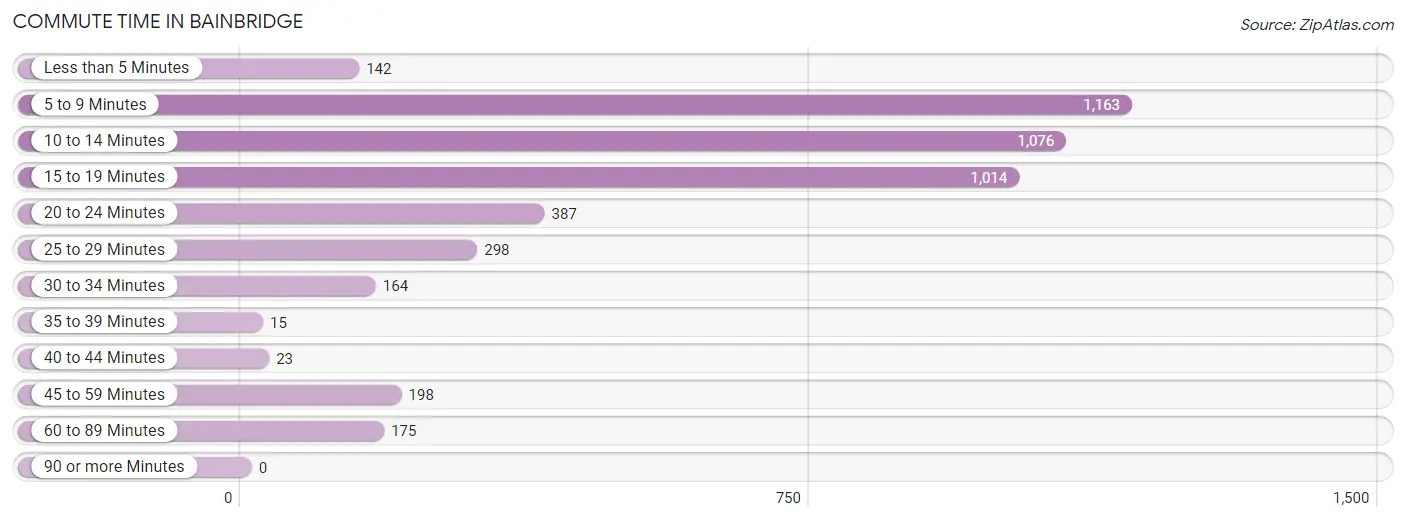
| Commute Time | # Commuters | % Commuters |
| Less than 5 Minutes | 142 | 3.0% |
| 5 to 9 Minutes | 1,163 | 25.0% |
| 10 to 14 Minutes | 1,076 | 23.1% |
| 15 to 19 Minutes | 1,014 | 21.8% |
| 20 to 24 Minutes | 387 | 8.3% |
| 25 to 29 Minutes | 298 | 6.4% |
| 30 to 34 Minutes | 164 | 3.5% |
| 35 to 39 Minutes | 15 | 0.3% |
| 40 to 44 Minutes | 23 | 0.5% |
| 45 to 59 Minutes | 198 | 4.3% |
| 60 to 89 Minutes | 175 | 3.8% |
| 90 or more Minutes | 0 | 0.0% |
Commute Time by Sex in Bainbridge
The most common commute times in Bainbridge are 5 to 9 minutes (633 commuters, 28.7%) for males and 10 to 14 minutes (759 commuters, 30.9%) for females.
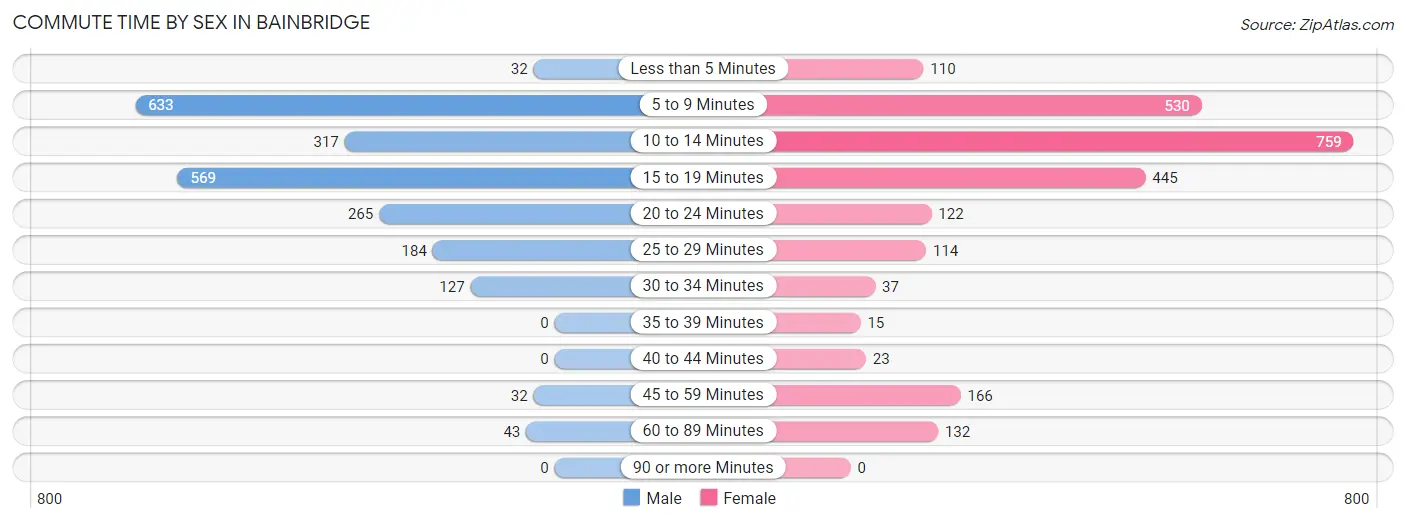
| Commute Time | Male | Female |
| Less than 5 Minutes | 32 (1.5%) | 110 (4.5%) |
| 5 to 9 Minutes | 633 (28.7%) | 530 (21.6%) |
| 10 to 14 Minutes | 317 (14.4%) | 759 (30.9%) |
| 15 to 19 Minutes | 569 (25.8%) | 445 (18.1%) |
| 20 to 24 Minutes | 265 (12.0%) | 122 (5.0%) |
| 25 to 29 Minutes | 184 (8.4%) | 114 (4.6%) |
| 30 to 34 Minutes | 127 (5.8%) | 37 (1.5%) |
| 35 to 39 Minutes | 0 (0.0%) | 15 (0.6%) |
| 40 to 44 Minutes | 0 (0.0%) | 23 (0.9%) |
| 45 to 59 Minutes | 32 (1.5%) | 166 (6.8%) |
| 60 to 89 Minutes | 43 (1.9%) | 132 (5.4%) |
| 90 or more Minutes | 0 (0.0%) | 0 (0.0%) |
Time of Departure to Work by Sex in Bainbridge
The most frequent times of departure to work in Bainbridge are 7:00 AM to 7:29 AM (405, 18.4%) for males and 7:30 AM to 7:59 AM (641, 26.1%) for females.
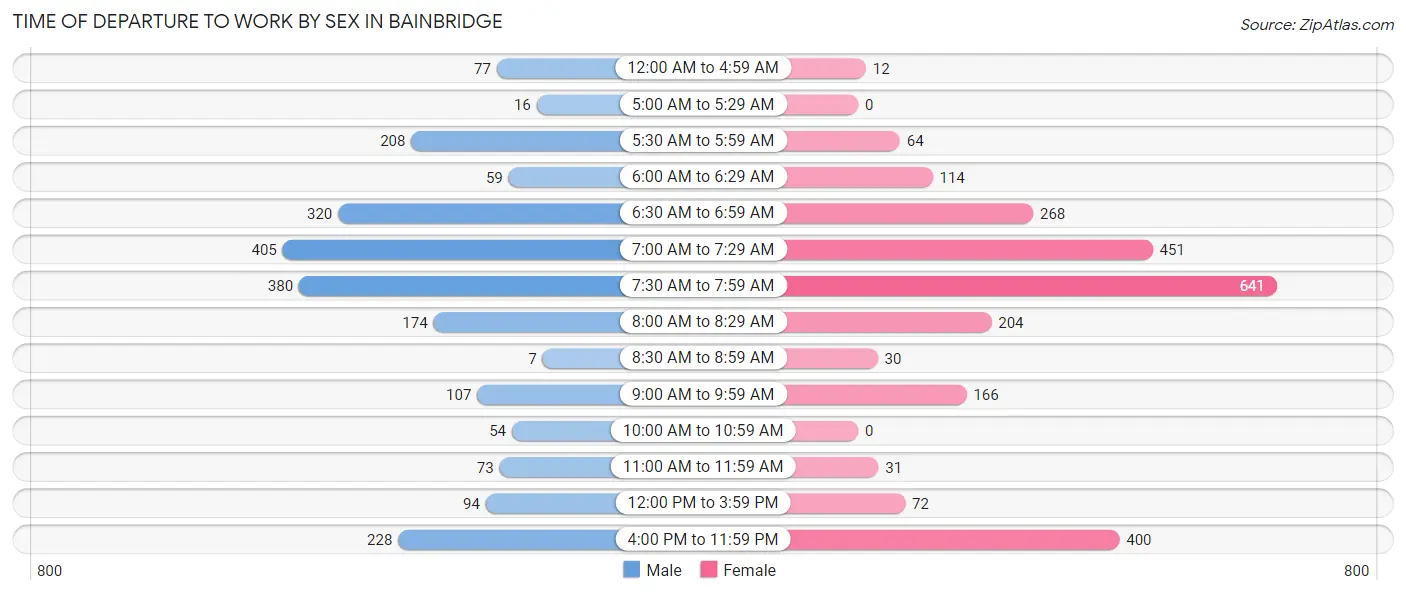
| Time of Departure | Male | Female |
| 12:00 AM to 4:59 AM | 77 (3.5%) | 12 (0.5%) |
| 5:00 AM to 5:29 AM | 16 (0.7%) | 0 (0.0%) |
| 5:30 AM to 5:59 AM | 208 (9.5%) | 64 (2.6%) |
| 6:00 AM to 6:29 AM | 59 (2.7%) | 114 (4.6%) |
| 6:30 AM to 6:59 AM | 320 (14.5%) | 268 (10.9%) |
| 7:00 AM to 7:29 AM | 405 (18.4%) | 451 (18.4%) |
| 7:30 AM to 7:59 AM | 380 (17.3%) | 641 (26.1%) |
| 8:00 AM to 8:29 AM | 174 (7.9%) | 204 (8.3%) |
| 8:30 AM to 8:59 AM | 7 (0.3%) | 30 (1.2%) |
| 9:00 AM to 9:59 AM | 107 (4.9%) | 166 (6.8%) |
| 10:00 AM to 10:59 AM | 54 (2.5%) | 0 (0.0%) |
| 11:00 AM to 11:59 AM | 73 (3.3%) | 31 (1.3%) |
| 12:00 PM to 3:59 PM | 94 (4.3%) | 72 (2.9%) |
| 4:00 PM to 11:59 PM | 228 (10.3%) | 400 (16.3%) |
| Total | 2,202 (100.0%) | 2,453 (100.0%) |
Housing Occupancy in Bainbridge
Occupancy by Ownership in Bainbridge
Of the total 5,210 dwellings in Bainbridge, owner-occupied units account for 2,547 (48.9%), while renter-occupied units make up 2,663 (51.1%).
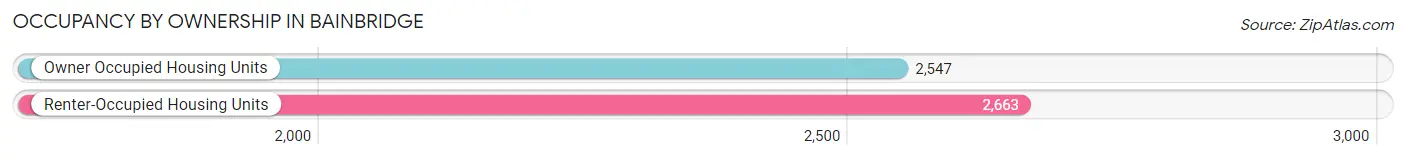
| Occupancy | # Housing Units | % Housing Units |
| Owner Occupied Housing Units | 2,547 | 48.9% |
| Renter-Occupied Housing Units | 2,663 | 51.1% |
| Total Occupied Housing Units | 5,210 | 100.0% |
Occupancy by Household Size in Bainbridge
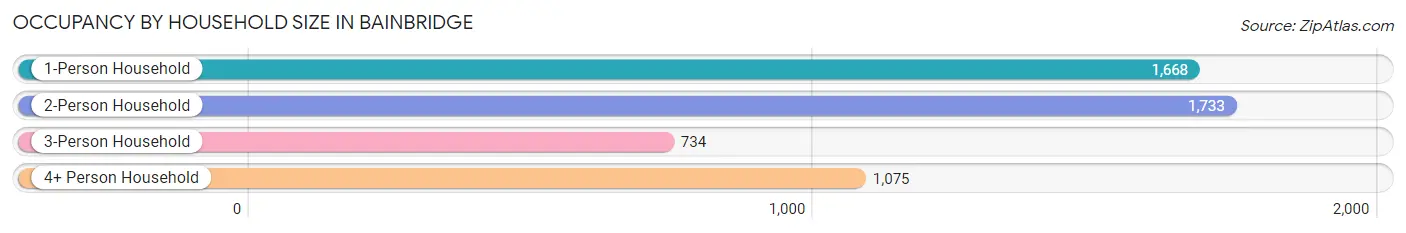
| Household Size | # Housing Units | % Housing Units |
| 1-Person Household | 1,668 | 32.0% |
| 2-Person Household | 1,733 | 33.3% |
| 3-Person Household | 734 | 14.1% |
| 4+ Person Household | 1,075 | 20.6% |
| Total Housing Units | 5,210 | 100.0% |
Occupancy by Ownership by Household Size in Bainbridge
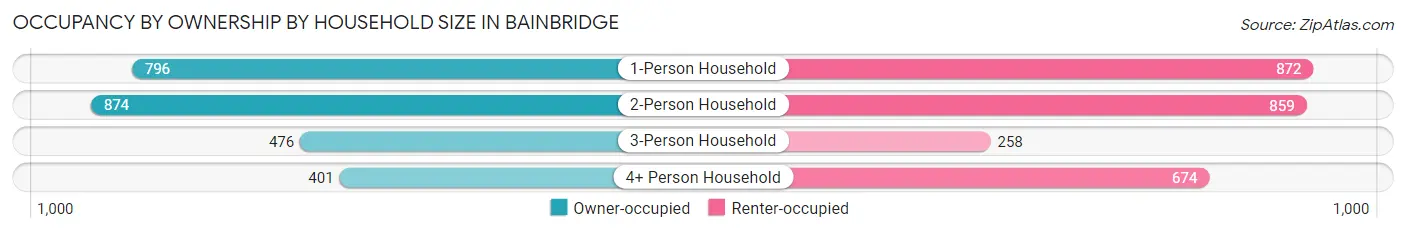
| Household Size | Owner-occupied | Renter-occupied |
| 1-Person Household | 796 (47.7%) | 872 (52.3%) |
| 2-Person Household | 874 (50.4%) | 859 (49.6%) |
| 3-Person Household | 476 (64.8%) | 258 (35.1%) |
| 4+ Person Household | 401 (37.3%) | 674 (62.7%) |
| Total Housing Units | 2,547 (48.9%) | 2,663 (51.1%) |
Occupancy by Educational Attainment in Bainbridge
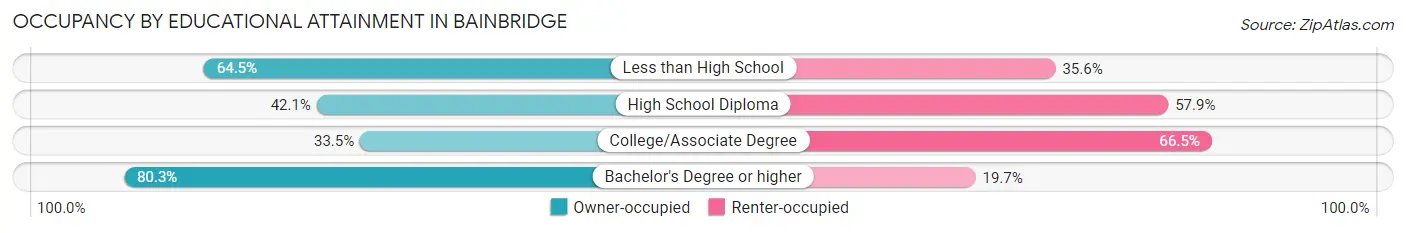
| Household Size | Owner-occupied | Renter-occupied |
| Less than High School | 544 (64.4%) | 300 (35.5%) |
| High School Diploma | 636 (42.1%) | 875 (57.9%) |
| College/Associate Degree | 662 (33.5%) | 1,315 (66.5%) |
| Bachelor's Degree or higher | 705 (80.3%) | 173 (19.7%) |
Occupancy by Age of Householder in Bainbridge
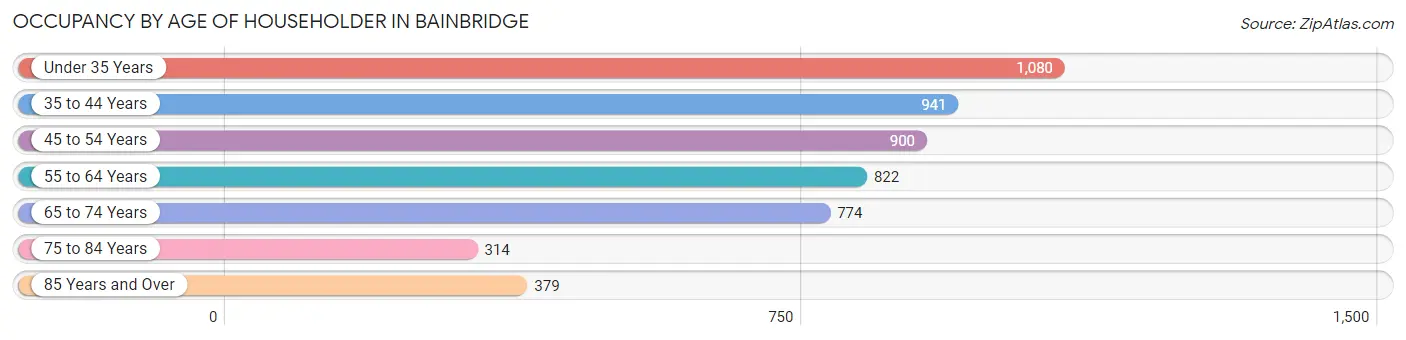
| Age Bracket | # Households | % Households |
| Under 35 Years | 1,080 | 20.7% |
| 35 to 44 Years | 941 | 18.1% |
| 45 to 54 Years | 900 | 17.3% |
| 55 to 64 Years | 822 | 15.8% |
| 65 to 74 Years | 774 | 14.9% |
| 75 to 84 Years | 314 | 6.0% |
| 85 Years and Over | 379 | 7.3% |
| Total | 5,210 | 100.0% |
Housing Finances in Bainbridge
Median Income by Occupancy in Bainbridge
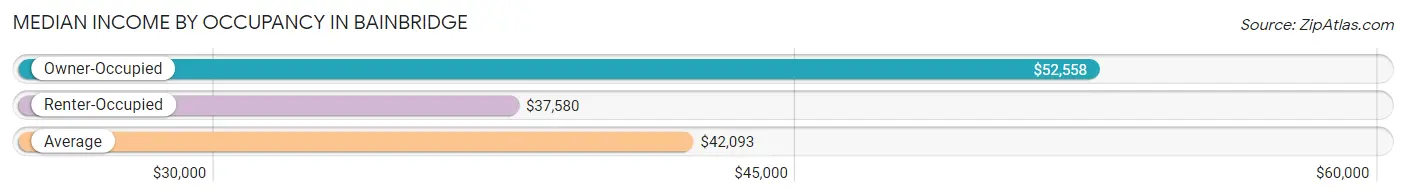
| Occupancy Type | # Households | Median Income |
| Owner-Occupied | 2,547 (48.9%) | $52,558 |
| Renter-Occupied | 2,663 (51.1%) | $37,580 |
| Average | 5,210 (100.0%) | $42,093 |
Occupancy by Householder Income Bracket in Bainbridge
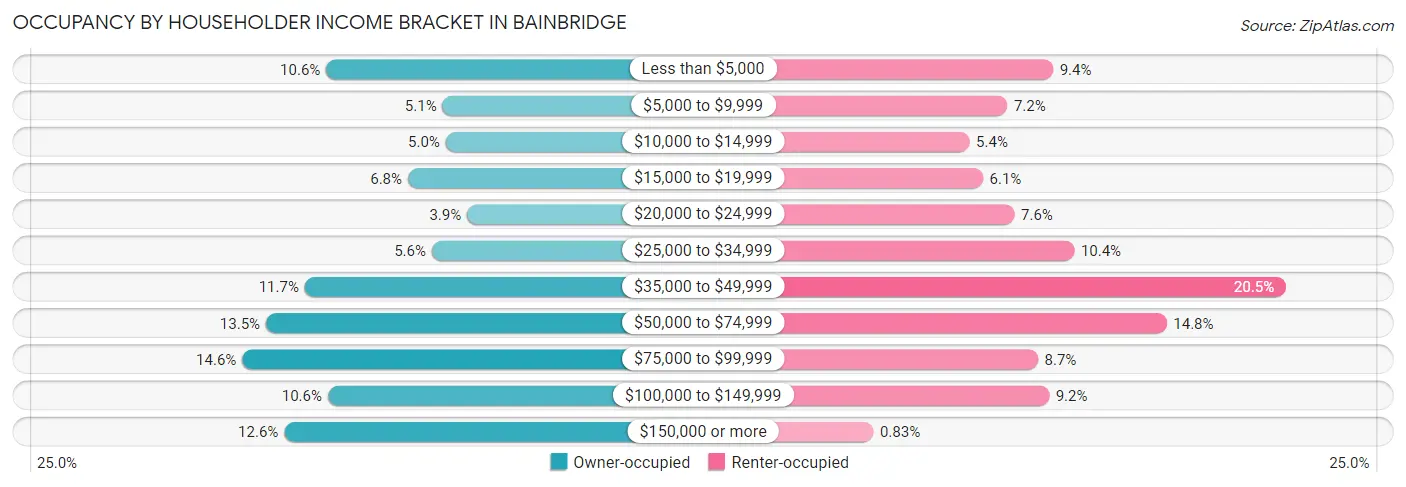
| Income Bracket | Owner-occupied | Renter-occupied |
| Less than $5,000 | 271 (10.6%) | 250 (9.4%) |
| $5,000 to $9,999 | 130 (5.1%) | 192 (7.2%) |
| $10,000 to $14,999 | 126 (5.0%) | 144 (5.4%) |
| $15,000 to $19,999 | 172 (6.8%) | 161 (6.0%) |
| $20,000 to $24,999 | 100 (3.9%) | 201 (7.5%) |
| $25,000 to $34,999 | 143 (5.6%) | 277 (10.4%) |
| $35,000 to $49,999 | 297 (11.7%) | 546 (20.5%) |
| $50,000 to $74,999 | 344 (13.5%) | 394 (14.8%) |
| $75,000 to $99,999 | 373 (14.6%) | 231 (8.7%) |
| $100,000 to $149,999 | 269 (10.6%) | 245 (9.2%) |
| $150,000 or more | 322 (12.6%) | 22 (0.8%) |
| Total | 2,547 (100.0%) | 2,663 (100.0%) |
Monthly Housing Cost Tiers in Bainbridge
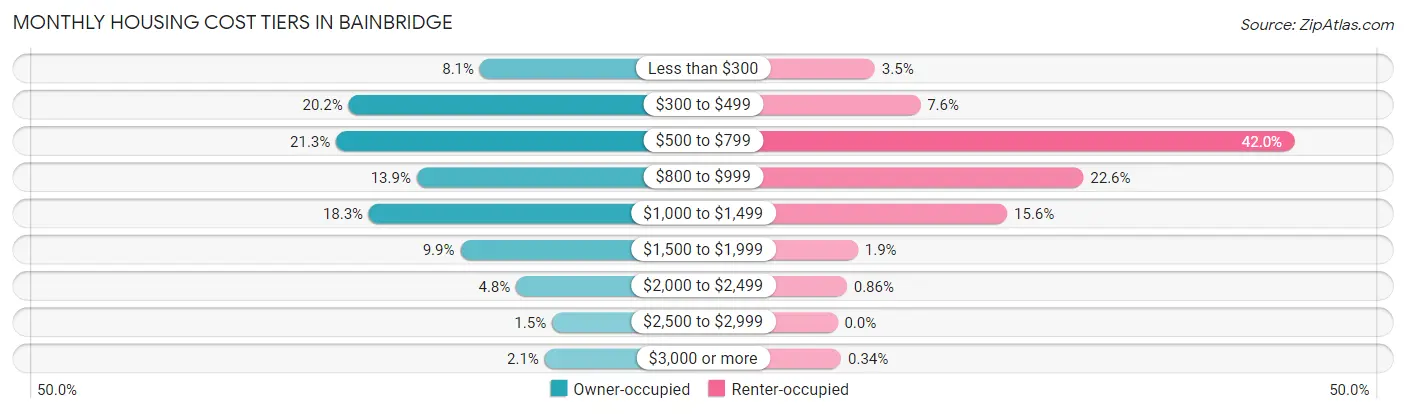
| Monthly Cost | Owner-occupied | Renter-occupied |
| Less than $300 | 206 (8.1%) | 92 (3.5%) |
| $300 to $499 | 514 (20.2%) | 203 (7.6%) |
| $500 to $799 | 543 (21.3%) | 1,119 (42.0%) |
| $800 to $999 | 354 (13.9%) | 603 (22.6%) |
| $1,000 to $1,499 | 466 (18.3%) | 416 (15.6%) |
| $1,500 to $1,999 | 252 (9.9%) | 50 (1.9%) |
| $2,000 to $2,499 | 121 (4.8%) | 23 (0.9%) |
| $2,500 to $2,999 | 37 (1.5%) | 0 (0.0%) |
| $3,000 or more | 54 (2.1%) | 9 (0.3%) |
| Total | 2,547 (100.0%) | 2,663 (100.0%) |
Physical Housing Characteristics in Bainbridge
Housing Structures in Bainbridge
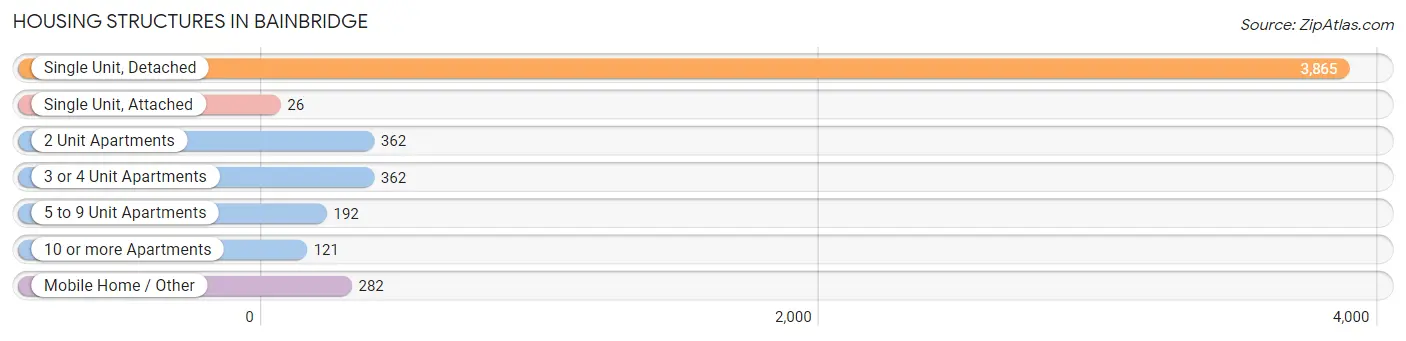
| Structure Type | # Housing Units | % Housing Units |
| Single Unit, Detached | 3,865 | 74.2% |
| Single Unit, Attached | 26 | 0.5% |
| 2 Unit Apartments | 362 | 7.0% |
| 3 or 4 Unit Apartments | 362 | 7.0% |
| 5 to 9 Unit Apartments | 192 | 3.7% |
| 10 or more Apartments | 121 | 2.3% |
| Mobile Home / Other | 282 | 5.4% |
| Total | 5,210 | 100.0% |
Housing Structures by Occupancy in Bainbridge
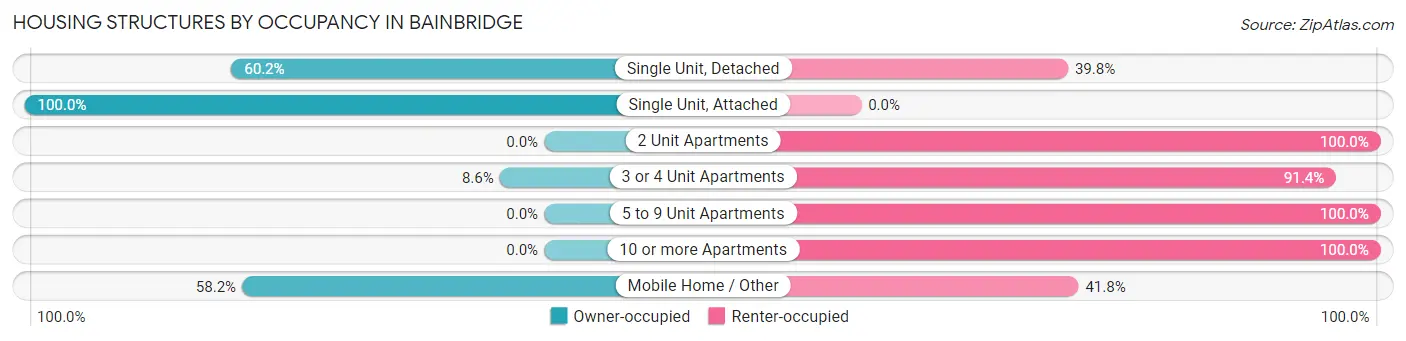
| Structure Type | Owner-occupied | Renter-occupied |
| Single Unit, Detached | 2,326 (60.2%) | 1,539 (39.8%) |
| Single Unit, Attached | 26 (100.0%) | 0 (0.0%) |
| 2 Unit Apartments | 0 (0.0%) | 362 (100.0%) |
| 3 or 4 Unit Apartments | 31 (8.6%) | 331 (91.4%) |
| 5 to 9 Unit Apartments | 0 (0.0%) | 192 (100.0%) |
| 10 or more Apartments | 0 (0.0%) | 121 (100.0%) |
| Mobile Home / Other | 164 (58.2%) | 118 (41.8%) |
| Total | 2,547 (48.9%) | 2,663 (51.1%) |
Housing Structures by Number of Rooms in Bainbridge
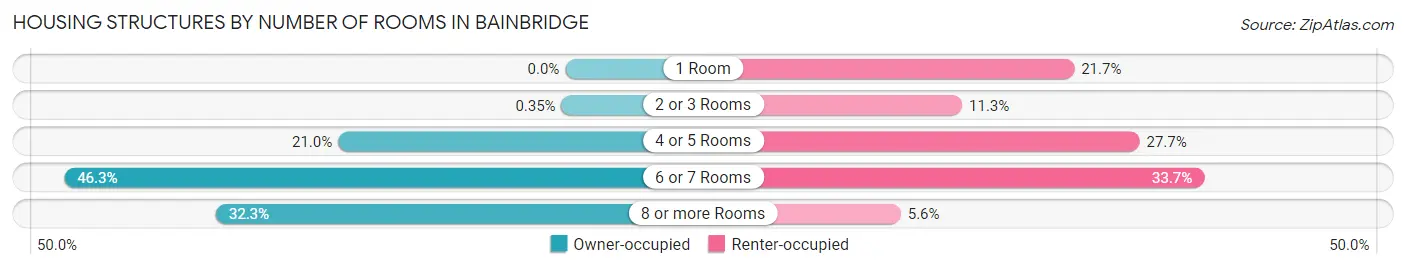
| Number of Rooms | Owner-occupied | Renter-occupied |
| 1 Room | 0 (0.0%) | 577 (21.7%) |
| 2 or 3 Rooms | 9 (0.4%) | 301 (11.3%) |
| 4 or 5 Rooms | 535 (21.0%) | 738 (27.7%) |
| 6 or 7 Rooms | 1,180 (46.3%) | 897 (33.7%) |
| 8 or more Rooms | 823 (32.3%) | 150 (5.6%) |
| Total | 2,547 (100.0%) | 2,663 (100.0%) |
Housing Structure by Heating Type in Bainbridge
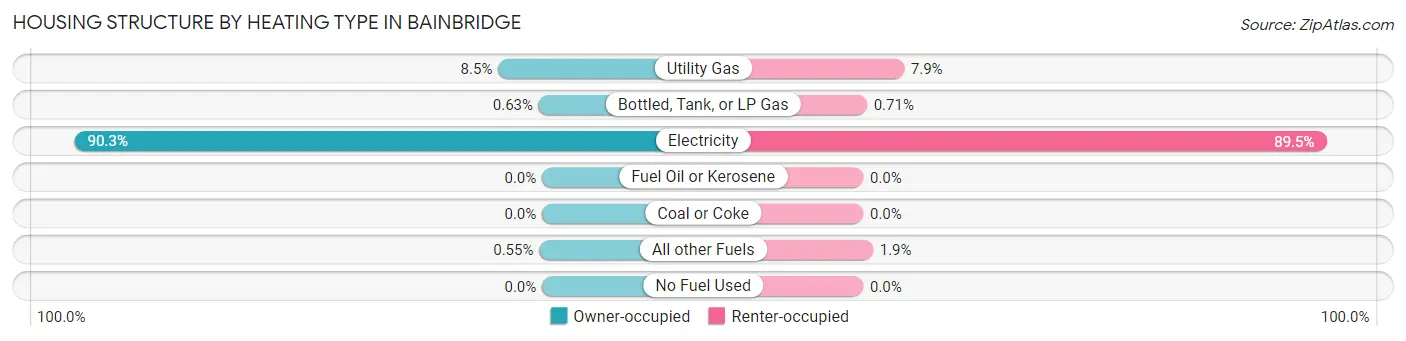
| Heating Type | Owner-occupied | Renter-occupied |
| Utility Gas | 216 (8.5%) | 210 (7.9%) |
| Bottled, Tank, or LP Gas | 16 (0.6%) | 19 (0.7%) |
| Electricity | 2,301 (90.3%) | 2,384 (89.5%) |
| Fuel Oil or Kerosene | 0 (0.0%) | 0 (0.0%) |
| Coal or Coke | 0 (0.0%) | 0 (0.0%) |
| All other Fuels | 14 (0.5%) | 50 (1.9%) |
| No Fuel Used | 0 (0.0%) | 0 (0.0%) |
| Total | 2,547 (100.0%) | 2,663 (100.0%) |
Household Vehicle Usage in Bainbridge
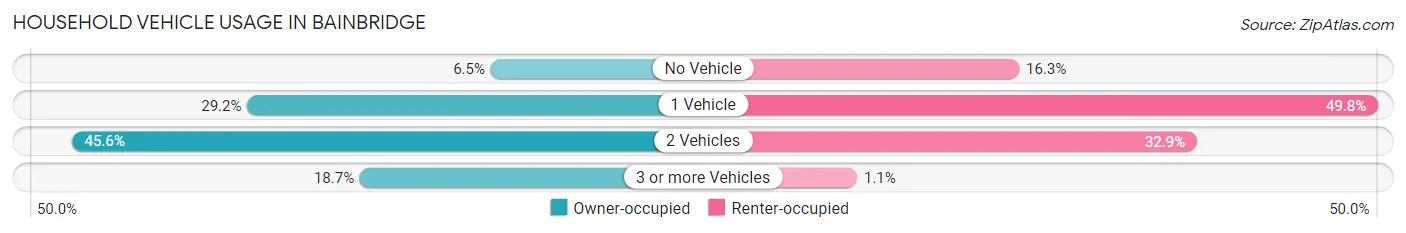
| Vehicles per Household | Owner-occupied | Renter-occupied |
| No Vehicle | 165 (6.5%) | 433 (16.3%) |
| 1 Vehicle | 744 (29.2%) | 1,325 (49.8%) |
| 2 Vehicles | 1,162 (45.6%) | 875 (32.9%) |
| 3 or more Vehicles | 476 (18.7%) | 30 (1.1%) |
| Total | 2,547 (100.0%) | 2,663 (100.0%) |
Real Estate & Mortgages in Bainbridge
Real Estate and Mortgage Overview in Bainbridge
| Characteristic | Without Mortgage | With Mortgage |
| Housing Units | 1,214 | 1,333 |
| Median Property Value | $131,400 | $142,400 |
| Median Household Income | $43,117 | $149 |
| Monthly Housing Costs | $461 | $54 |
| Real Estate Taxes | $1,210 | $4 |
Property Value by Mortgage Status in Bainbridge
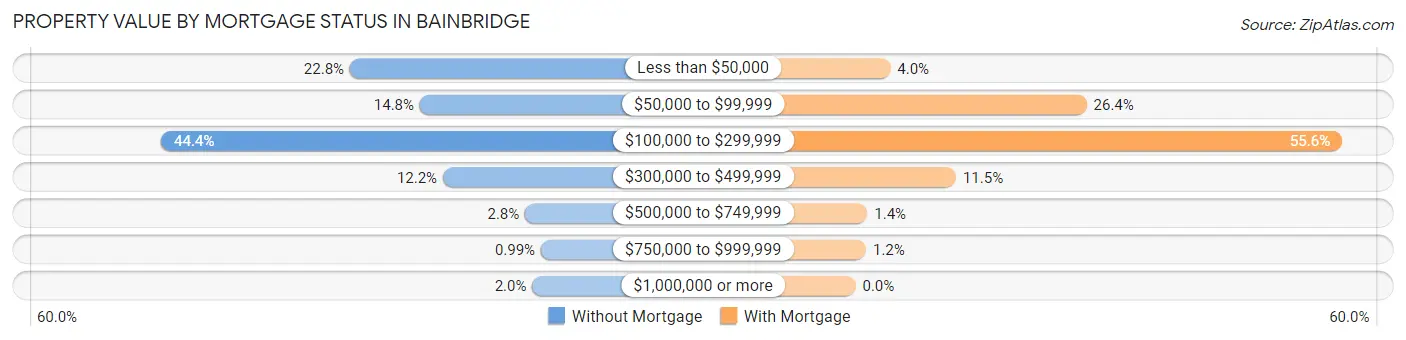
| Property Value | Without Mortgage | With Mortgage |
| Less than $50,000 | 277 (22.8%) | 53 (4.0%) |
| $50,000 to $99,999 | 180 (14.8%) | 352 (26.4%) |
| $100,000 to $299,999 | 539 (44.4%) | 741 (55.6%) |
| $300,000 to $499,999 | 148 (12.2%) | 153 (11.5%) |
| $500,000 to $749,999 | 34 (2.8%) | 18 (1.3%) |
| $750,000 to $999,999 | 12 (1.0%) | 16 (1.2%) |
| $1,000,000 or more | 24 (2.0%) | 0 (0.0%) |
| Total | 1,214 (100.0%) | 1,333 (100.0%) |
Household Income by Mortgage Status in Bainbridge
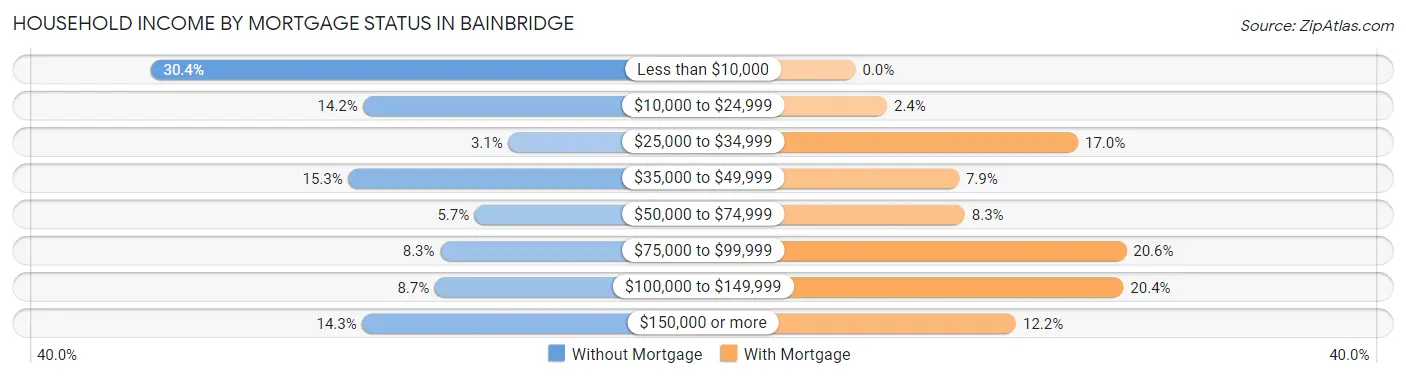
| Household Income | Without Mortgage | With Mortgage |
| Less than $10,000 | 369 (30.4%) | 0 (0.0%) |
| $10,000 to $24,999 | 172 (14.2%) | 32 (2.4%) |
| $25,000 to $34,999 | 38 (3.1%) | 226 (17.0%) |
| $35,000 to $49,999 | 186 (15.3%) | 105 (7.9%) |
| $50,000 to $74,999 | 69 (5.7%) | 111 (8.3%) |
| $75,000 to $99,999 | 101 (8.3%) | 275 (20.6%) |
| $100,000 to $149,999 | 106 (8.7%) | 272 (20.4%) |
| $150,000 or more | 173 (14.2%) | 163 (12.2%) |
| Total | 1,214 (100.0%) | 1,333 (100.0%) |
Property Value to Household Income Ratio in Bainbridge
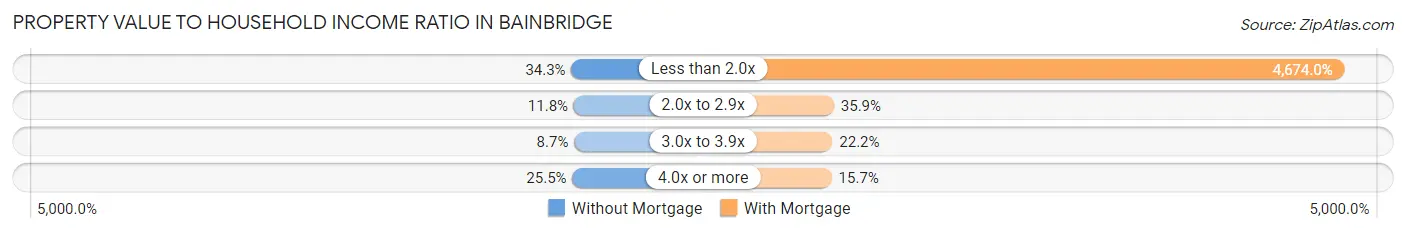
| Value-to-Income Ratio | Without Mortgage | With Mortgage |
| Less than 2.0x | 416 (34.3%) | 62,304 (4,674.0%) |
| 2.0x to 2.9x | 143 (11.8%) | 479 (35.9%) |
| 3.0x to 3.9x | 106 (8.7%) | 296 (22.2%) |
| 4.0x or more | 310 (25.5%) | 209 (15.7%) |
| Total | 1,214 (100.0%) | 1,333 (100.0%) |
Real Estate Taxes by Mortgage Status in Bainbridge
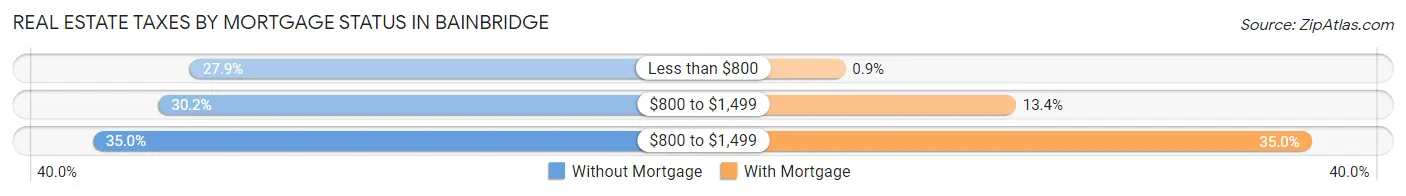
| Property Taxes | Without Mortgage | With Mortgage |
| Less than $800 | 339 (27.9%) | 12 (0.9%) |
| $800 to $1,499 | 367 (30.2%) | 178 (13.4%) |
| $800 to $1,499 | 425 (35.0%) | 466 (35.0%) |
| Total | 1,214 (100.0%) | 1,333 (100.0%) |
Health & Disability in Bainbridge
Health Insurance Coverage by Age in Bainbridge
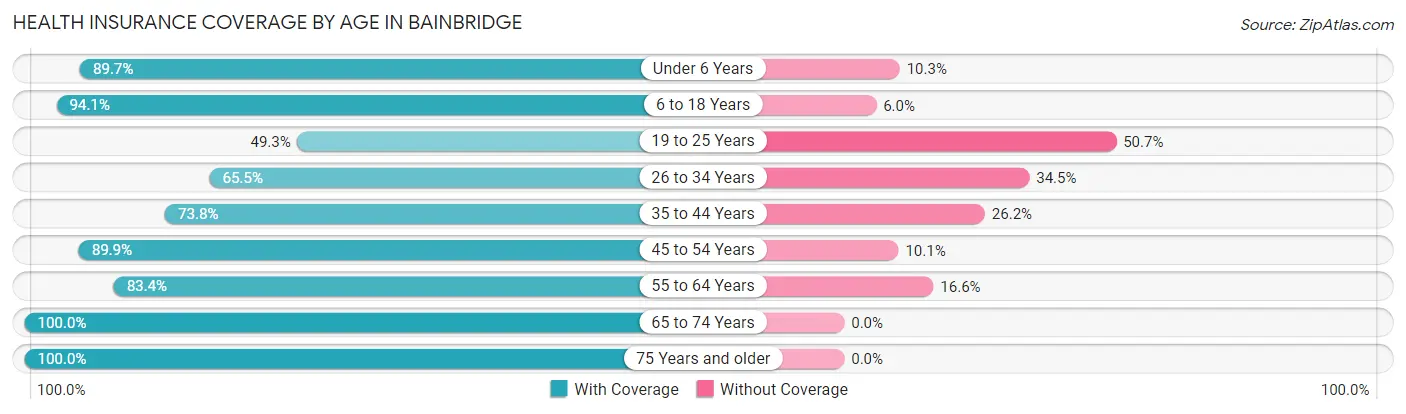
| Age Bracket | With Coverage | Without Coverage |
| Under 6 Years | 1,049 (89.7%) | 121 (10.3%) |
| 6 to 18 Years | 2,941 (94.1%) | 186 (5.9%) |
| 19 to 25 Years | 591 (49.3%) | 608 (50.7%) |
| 26 to 34 Years | 579 (65.5%) | 305 (34.5%) |
| 35 to 44 Years | 1,390 (73.8%) | 494 (26.2%) |
| 45 to 54 Years | 1,325 (89.9%) | 149 (10.1%) |
| 55 to 64 Years | 1,184 (83.4%) | 236 (16.6%) |
| 65 to 74 Years | 1,367 (100.0%) | 0 (0.0%) |
| 75 Years and older | 935 (100.0%) | 0 (0.0%) |
| Total | 11,361 (84.4%) | 2,099 (15.6%) |
Health Insurance Coverage by Citizenship Status in Bainbridge
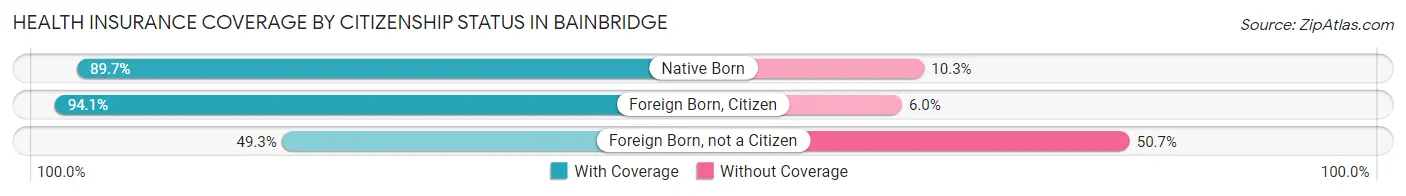
| Citizenship Status | With Coverage | Without Coverage |
| Native Born | 1,049 (89.7%) | 121 (10.3%) |
| Foreign Born, Citizen | 2,941 (94.1%) | 186 (5.9%) |
| Foreign Born, not a Citizen | 591 (49.3%) | 608 (50.7%) |
Health Insurance Coverage by Household Income in Bainbridge
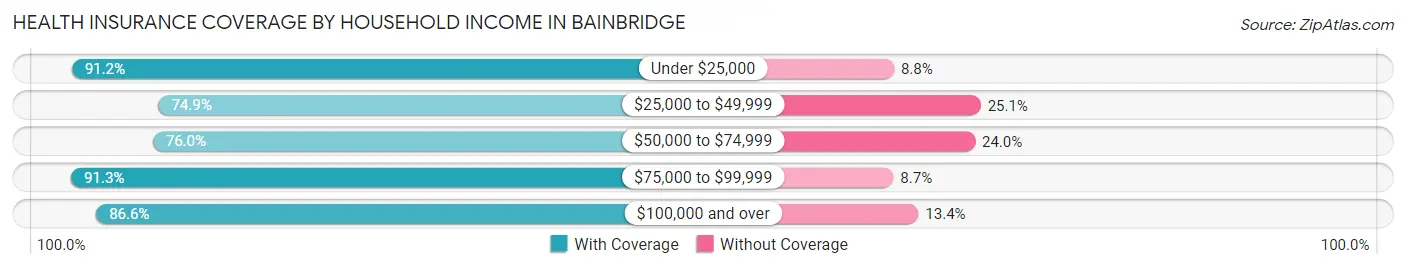
| Household Income | With Coverage | Without Coverage |
| Under $25,000 | 3,466 (91.2%) | 336 (8.8%) |
| $25,000 to $49,999 | 2,174 (74.9%) | 728 (25.1%) |
| $50,000 to $74,999 | 1,524 (76.0%) | 482 (24.0%) |
| $75,000 to $99,999 | 1,557 (91.3%) | 149 (8.7%) |
| $100,000 and over | 2,606 (86.6%) | 404 (13.4%) |
Public vs Private Health Insurance Coverage by Age in Bainbridge
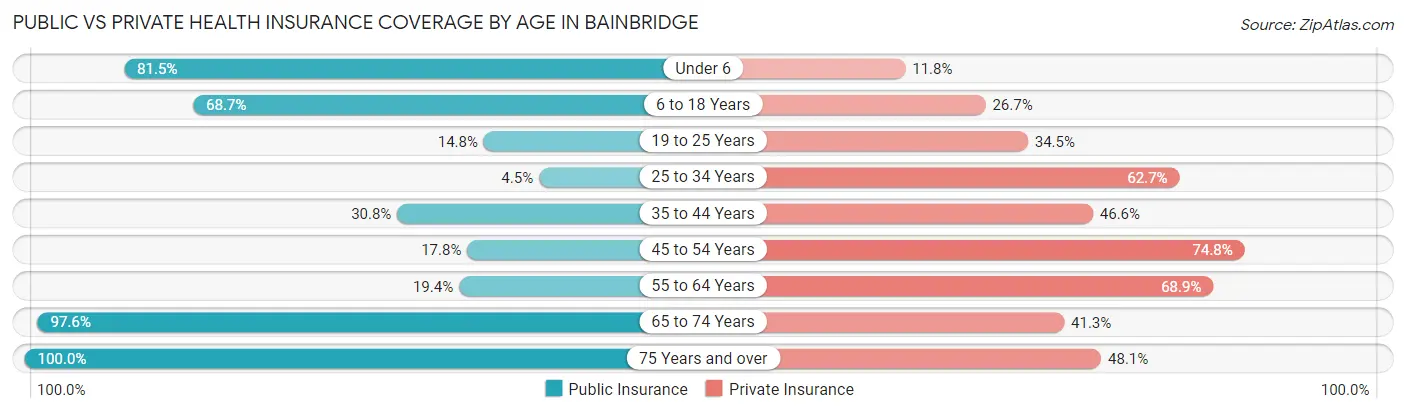
| Age Bracket | Public Insurance | Private Insurance |
| Under 6 | 954 (81.5%) | 138 (11.8%) |
| 6 to 18 Years | 2,149 (68.7%) | 834 (26.7%) |
| 19 to 25 Years | 177 (14.8%) | 414 (34.5%) |
| 25 to 34 Years | 40 (4.5%) | 554 (62.7%) |
| 35 to 44 Years | 581 (30.8%) | 878 (46.6%) |
| 45 to 54 Years | 263 (17.8%) | 1,102 (74.8%) |
| 55 to 64 Years | 275 (19.4%) | 979 (68.9%) |
| 65 to 74 Years | 1,334 (97.6%) | 564 (41.3%) |
| 75 Years and over | 935 (100.0%) | 450 (48.1%) |
| Total | 6,708 (49.8%) | 5,913 (43.9%) |
Disability Status by Sex by Age in Bainbridge
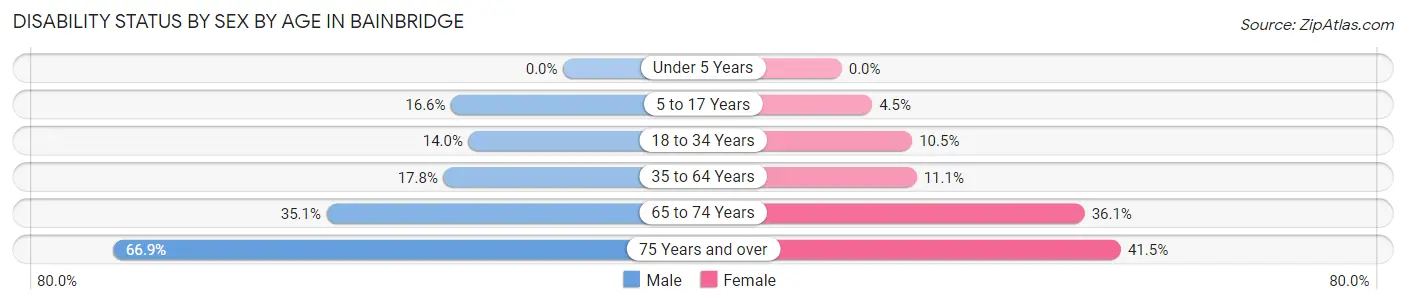
| Age Bracket | Male | Female |
| Under 5 Years | 0 (0.0%) | 0 (0.0%) |
| 5 to 17 Years | 258 (16.6%) | 66 (4.5%) |
| 18 to 34 Years | 136 (14.0%) | 160 (10.5%) |
| 35 to 64 Years | 378 (17.8%) | 295 (11.1%) |
| 65 to 74 Years | 189 (35.1%) | 299 (36.1%) |
| 75 Years and over | 214 (66.9%) | 255 (41.5%) |
Disability Class by Sex by Age in Bainbridge
Disability Class: Hearing Difficulty
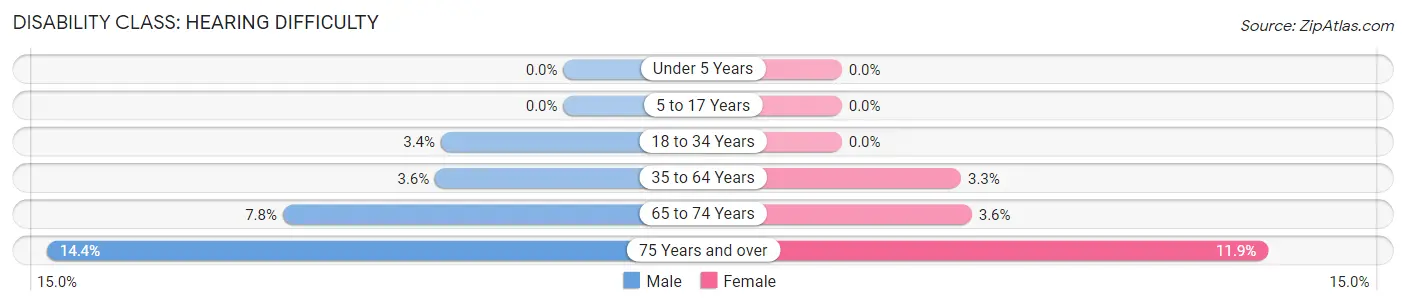
| Age Bracket | Male | Female |
| Under 5 Years | 0 (0.0%) | 0 (0.0%) |
| 5 to 17 Years | 0 (0.0%) | 0 (0.0%) |
| 18 to 34 Years | 33 (3.4%) | 0 (0.0%) |
| 35 to 64 Years | 76 (3.6%) | 88 (3.3%) |
| 65 to 74 Years | 42 (7.8%) | 30 (3.6%) |
| 75 Years and over | 46 (14.4%) | 73 (11.9%) |
Disability Class: Vision Difficulty
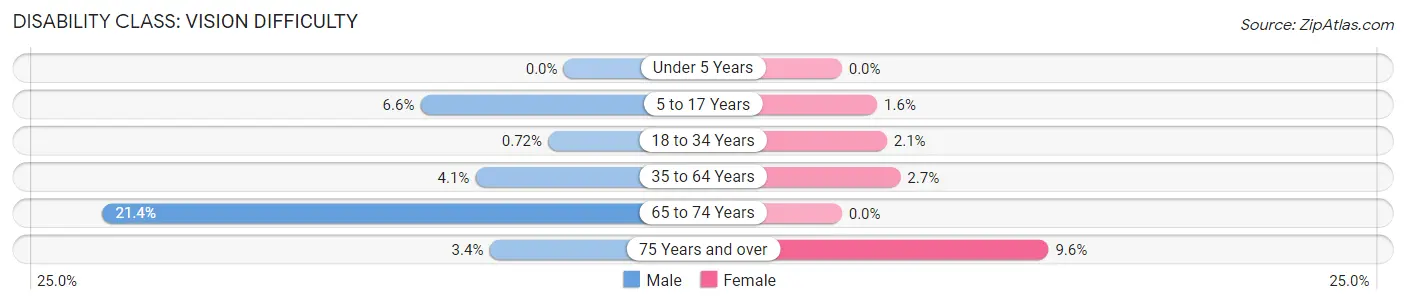
| Age Bracket | Male | Female |
| Under 5 Years | 0 (0.0%) | 0 (0.0%) |
| 5 to 17 Years | 103 (6.6%) | 24 (1.6%) |
| 18 to 34 Years | 7 (0.7%) | 32 (2.1%) |
| 35 to 64 Years | 87 (4.1%) | 72 (2.7%) |
| 65 to 74 Years | 115 (21.4%) | 0 (0.0%) |
| 75 Years and over | 11 (3.4%) | 59 (9.6%) |
Disability Class: Cognitive Difficulty
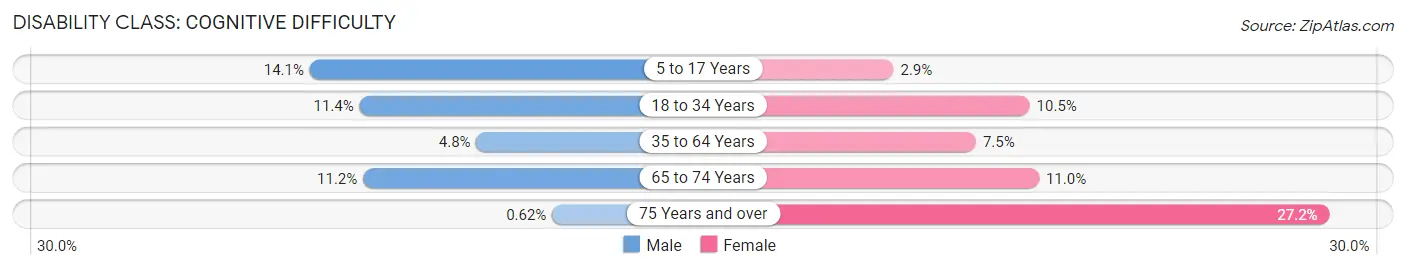
| Age Bracket | Male | Female |
| 5 to 17 Years | 219 (14.1%) | 42 (2.9%) |
| 18 to 34 Years | 110 (11.4%) | 160 (10.5%) |
| 35 to 64 Years | 103 (4.8%) | 198 (7.5%) |
| 65 to 74 Years | 60 (11.2%) | 91 (11.0%) |
| 75 Years and over | 2 (0.6%) | 167 (27.2%) |
Disability Class: Ambulatory Difficulty
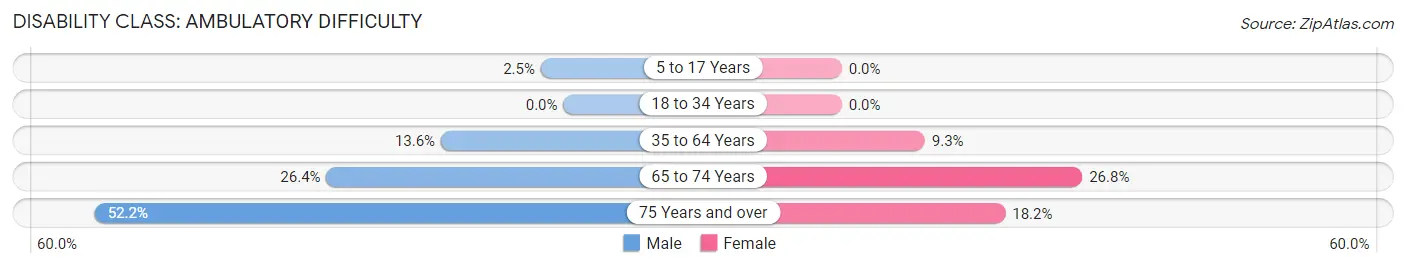
| Age Bracket | Male | Female |
| 5 to 17 Years | 39 (2.5%) | 0 (0.0%) |
| 18 to 34 Years | 0 (0.0%) | 0 (0.0%) |
| 35 to 64 Years | 290 (13.6%) | 245 (9.2%) |
| 65 to 74 Years | 142 (26.4%) | 222 (26.8%) |
| 75 Years and over | 167 (52.2%) | 112 (18.2%) |
Disability Class: Self-Care Difficulty
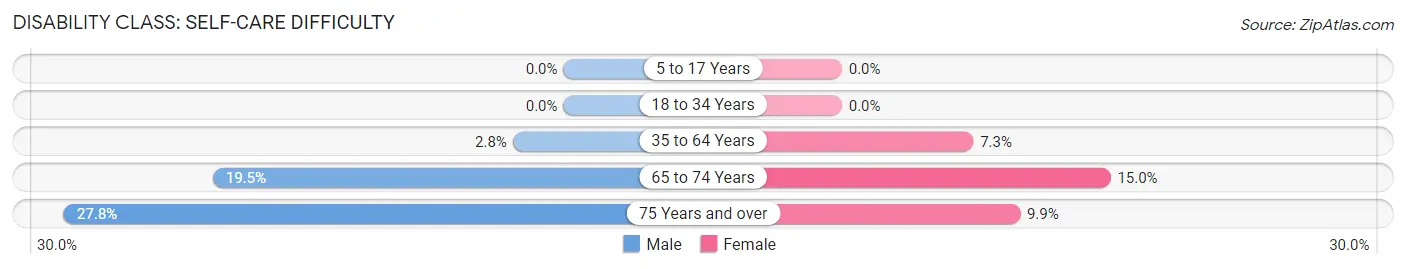
| Age Bracket | Male | Female |
| 5 to 17 Years | 0 (0.0%) | 0 (0.0%) |
| 18 to 34 Years | 0 (0.0%) | 0 (0.0%) |
| 35 to 64 Years | 60 (2.8%) | 194 (7.3%) |
| 65 to 74 Years | 105 (19.5%) | 124 (15.0%) |
| 75 Years and over | 89 (27.8%) | 61 (9.9%) |
Technology Access in Bainbridge
Computing Device Access in Bainbridge
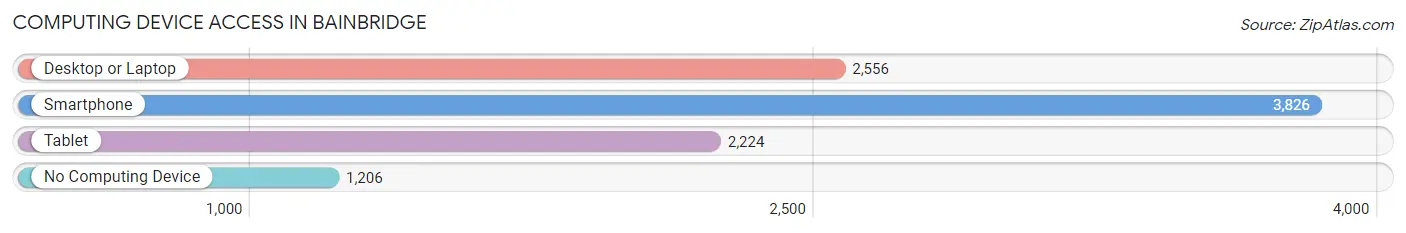
| Device Type | # Households | % Households |
| Desktop or Laptop | 2,556 | 49.1% |
| Smartphone | 3,826 | 73.4% |
| Tablet | 2,224 | 42.7% |
| No Computing Device | 1,206 | 23.2% |
| Total | 5,210 | 100.0% |
Internet Access in Bainbridge
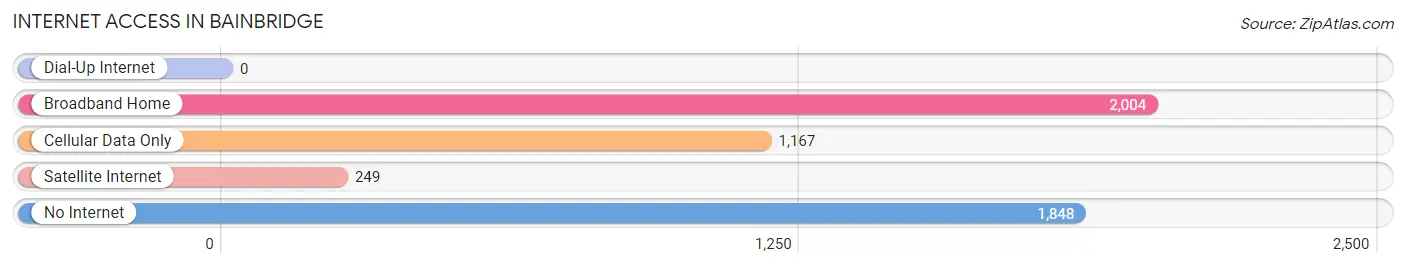
| Internet Type | # Households | % Households |
| Dial-Up Internet | 0 | 0.0% |
| Broadband Home | 2,004 | 38.5% |
| Cellular Data Only | 1,167 | 22.4% |
| Satellite Internet | 249 | 4.8% |
| No Internet | 1,848 | 35.5% |
| Total | 5,210 | 100.0% |
Bainbridge Summary
Bainbridge, Georgia is a small city located in Decatur County in the southwestern part of the state. It is the county seat and the largest city in the county. The city is situated on the Flint River, which is a major tributary of the Apalachicola River. The city is located about 90 miles south of Atlanta and about 60 miles north of Tallahassee, Florida. The population of Bainbridge was 12,697 at the 2010 census.
Geography
Bainbridge is located at 30°57'N 84°56'W (30.95, -84.93). According to the United States Census Bureau, the city has a total area of 11.2 square miles (29.0 km2), of which 11.1 square miles (28.7 km2) is land and 0.1 square miles (0.3 km2) (0.45%) is water.
The city is located in the flatwoods region of the southeastern United States. The terrain is mostly flat with some rolling hills. The climate is humid subtropical with hot, humid summers and mild winters. The average annual temperature is around 70°F (21°C).
Economy
Bainbridge is the economic center of Decatur County. The city is home to several large employers, including the Decatur County Board of Education, the Decatur County Hospital, and the Decatur County Sheriff's Office. The city is also home to several manufacturing companies, including Georgia-Pacific, Georgia-Pacific Plywood, and Georgia-Pacific Corrugated.
The city is also home to several retail stores, including Walmart, Lowe's, and Target. The city is also home to several restaurants, including Applebee's, Chili's, and Olive Garden.
Demographics
As of the 2010 census, there were 12,697 people, 4,945 households, and 3,092 families residing in the city. The population density was 1,139.2 people per square mile (440.2/km2). There were 5,541 housing units at an average density of 498.3 per square mile (192.3/km2). The racial makeup of the city was 57.2% White, 37.3% African American, 0.3% Native American, 0.7% Asian, 0.1% Pacific Islander, 2.7% from other races, and 1.9% from two or more races. Hispanic or Latino of any race were 5.2% of the population.
There were 4,945 households, out of which 28.7% had children under the age of 18 living with them, 38.2% were married couples living together, 20.2% had a female householder with no husband present, and 36.2% were non-families. 30.3% of all households were made up of individuals, and 12.7% had someone living alone who was 65 years of age or older. The average household size was 2.45 and the average family size was 3.02.
In the city, the population was spread out, with 25.2% under the age of 18, 9.2% from 18 to 24, 25.7% from 25 to 44, 22.7% from 45 to 64, and 17.2% who were 65 years of age or older. The median age was 36 years. For every 100 females, there were 87.2 males. For every 100 females age 18 and over, there were 82.3 males.
The median income for a household in the city was $27,917, and the median income for a family was $35,945. Males had a median income of $30,917 versus $21,917 for females. The per capita income for the city was $15,945. About 17.2% of families and 20.7% of the population were below the poverty line, including 28.2% of those under age 18 and 16.2% of those age 65 or over.
Common Questions
What is Per Capita Income in Bainbridge?
Per Capita income in Bainbridge is $23,115.
What is the Median Family Income in Bainbridge?
Median Family Income in Bainbridge is $52,237.
What is the Median Household income in Bainbridge?
Median Household Income in Bainbridge is $42,093.
What is Income or Wage Gap in Bainbridge?
Income or Wage Gap in Bainbridge is 29.1%.
Women in Bainbridge earn 70.9 cents for every dollar earned by a man.
What is Inequality or Gini Index in Bainbridge?
Inequality or Gini Index in Bainbridge is 0.52.
What is the Total Population of Bainbridge?
Total Population of Bainbridge is 14,234.
What is the Total Male Population of Bainbridge?
Total Male Population of Bainbridge is 6,739.
What is the Total Female Population of Bainbridge?
Total Female Population of Bainbridge is 7,495.
What is the Ratio of Males per 100 Females in Bainbridge?
There are 89.91 Males per 100 Females in Bainbridge.
What is the Ratio of Females per 100 Males in Bainbridge?
There are 111.22 Females per 100 Males in Bainbridge.
What is the Median Population Age in Bainbridge?
Median Population Age in Bainbridge is 36.2 Years.
What is the Average Family Size in Bainbridge
Average Family Size in Bainbridge is 3.3 People.
What is the Average Household Size in Bainbridge
Average Household Size in Bainbridge is 2.6 People.
How Large is the Labor Force in Bainbridge?
There are 5,377 People in the Labor Forcein in Bainbridge.
What is the Percentage of People in the Labor Force in Bainbridge?
50.3% of People are in the Labor Force in Bainbridge.
What is the Unemployment Rate in Bainbridge?
Unemployment Rate in Bainbridge is 9.5%.