Lincoln Park, GA Map & Demographics
Lincoln Park Map
Lincoln Park Overview
$28,736
PER CAPITA INCOME
$46,116
AVG HOUSEHOLD INCOME
49.2%
WAGE / INCOME GAP [ % ]
50.8¢/ $1
WAGE / INCOME GAP [ $ ]
0.30
INEQUALITY / GINI INDEX
739
TOTAL POPULATION
298
MALE POPULATION
441
FEMALE POPULATION
67.57
MALES / 100 FEMALES
147.99
FEMALES / 100 MALES
41.8
MEDIAN AGE
3.6
AVG FAMILY SIZE
1.9
AVG HOUSEHOLD SIZE
431
LABOR FORCE [ PEOPLE ]
62.1%
PERCENT IN LABOR FORCE
Income in Lincoln Park
Income Overview in Lincoln Park
| Characteristic | Number | Measure |
| Per Capita Income | 739 | $28,736 |
| Median Family Income | 99 | $0 |
| Mean Family Income | 99 | $56,231 |
| Median Household Income | 399 | $46,116 |
| Mean Household Income | 399 | $48,423 |
| Income Deficit | 99 | $0 |
| Wage / Income Gap (%) | 739 | 49.20% |
| Wage / Income Gap ($) | 739 | 50.80¢ per $1 |
| Gini / Inequality Index | 739 | 0.30 |
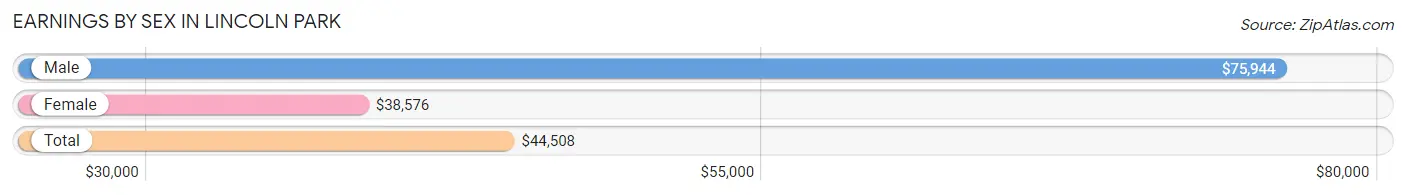
Earnings by Sex in Lincoln Park
Average Earnings in Lincoln Park are $44,508, $75,944 for men and $38,576 for women, a difference of 49.2%.
| Sex | Number | Average Earnings |
| Male | 176 (40.8%) | $75,944 |
| Female | 255 (59.2%) | $38,576 |
| Total | 431 (100.0%) | $44,508 |
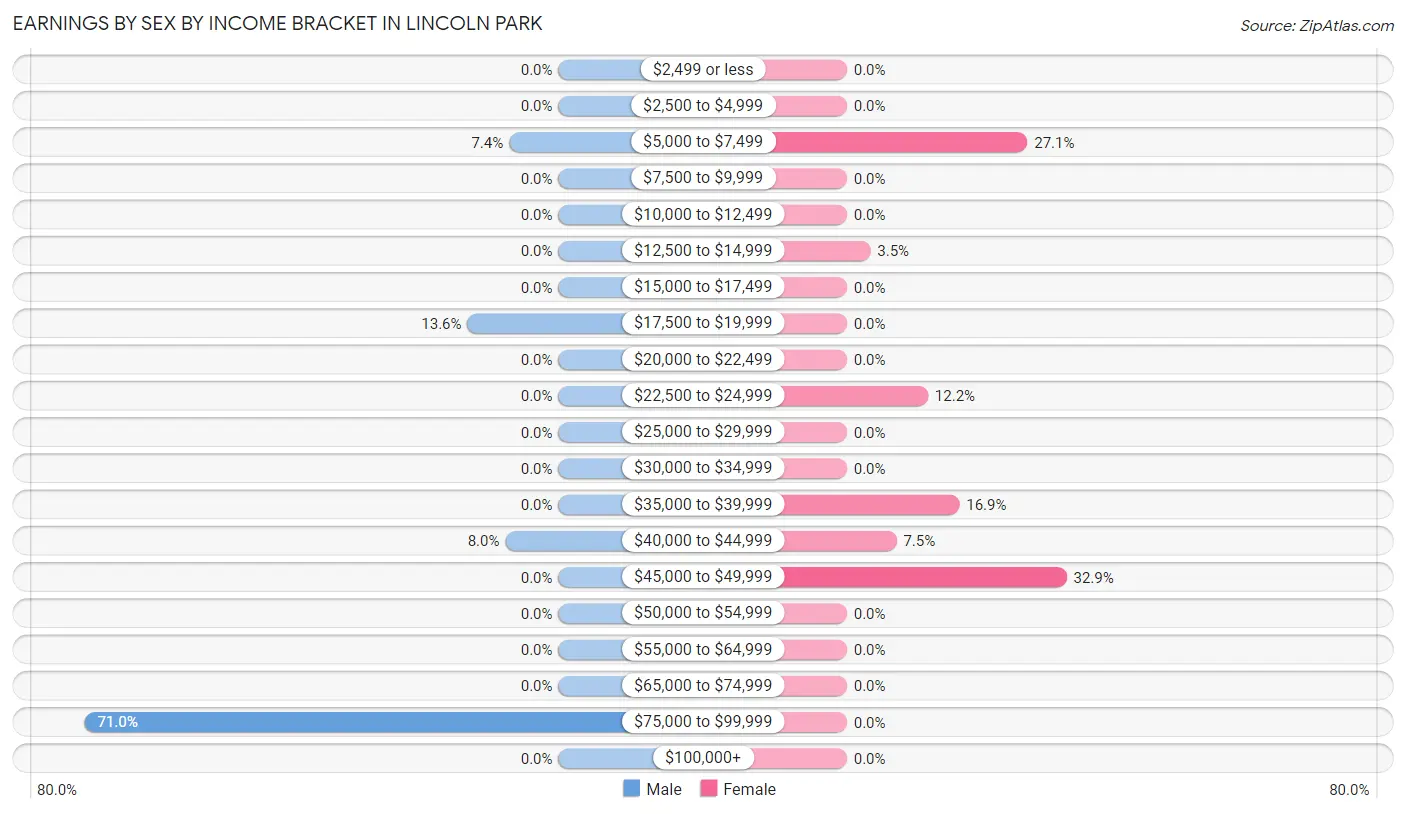
Earnings by Sex by Income Bracket in Lincoln Park
The most common earnings brackets in Lincoln Park are $75,000 to $99,999 for men (125 | 71.0%) and $45,000 to $49,999 for women (84 | 32.9%).
| Income | Male | Female |
| $2,499 or less | 0 (0.0%) | 0 (0.0%) |
| $2,500 to $4,999 | 0 (0.0%) | 0 (0.0%) |
| $5,000 to $7,499 | 13 (7.4%) | 69 (27.1%) |
| $7,500 to $9,999 | 0 (0.0%) | 0 (0.0%) |
| $10,000 to $12,499 | 0 (0.0%) | 0 (0.0%) |
| $12,500 to $14,999 | 0 (0.0%) | 9 (3.5%) |
| $15,000 to $17,499 | 0 (0.0%) | 0 (0.0%) |
| $17,500 to $19,999 | 24 (13.6%) | 0 (0.0%) |
| $20,000 to $22,499 | 0 (0.0%) | 0 (0.0%) |
| $22,500 to $24,999 | 0 (0.0%) | 31 (12.2%) |
| $25,000 to $29,999 | 0 (0.0%) | 0 (0.0%) |
| $30,000 to $34,999 | 0 (0.0%) | 0 (0.0%) |
| $35,000 to $39,999 | 0 (0.0%) | 43 (16.9%) |
| $40,000 to $44,999 | 14 (8.0%) | 19 (7.4%) |
| $45,000 to $49,999 | 0 (0.0%) | 84 (32.9%) |
| $50,000 to $54,999 | 0 (0.0%) | 0 (0.0%) |
| $55,000 to $64,999 | 0 (0.0%) | 0 (0.0%) |
| $65,000 to $74,999 | 0 (0.0%) | 0 (0.0%) |
| $75,000 to $99,999 | 125 (71.0%) | 0 (0.0%) |
| $100,000+ | 0 (0.0%) | 0 (0.0%) |
| Total | 176 (100.0%) | 255 (100.0%) |
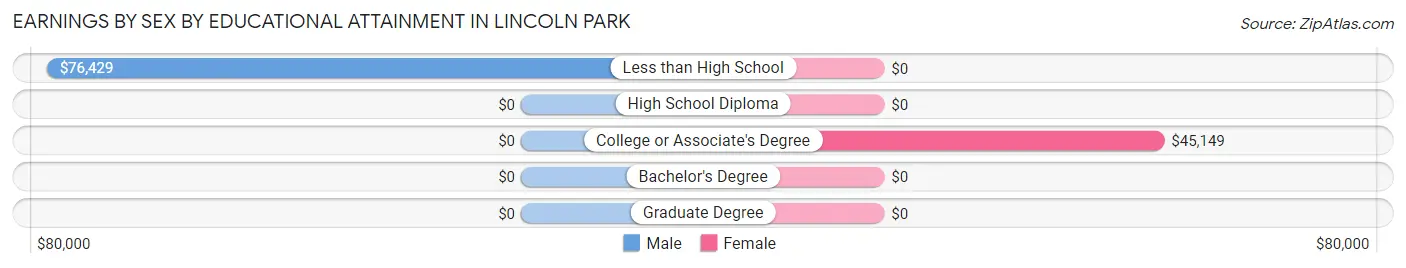
Earnings by Sex by Educational Attainment in Lincoln Park
Average earnings in Lincoln Park are $75,944 for men and $43,816 for women, a difference of 42.3%. Men with an educational attainment of less than high school enjoy the highest average annual earnings of $76,429, while those with less than high school education earn the least with $76,429. Women with an educational attainment of college or associate's degree earn the most with the average annual earnings of $45,149, while those with college or associate's degree education have the smallest earnings of $45,149.
| Educational Attainment | Male Income | Female Income |
| Less than High School | $76,429 | $0 |
| High School Diploma | - | - |
| College or Associate's Degree | - | - |
| Bachelor's Degree | - | - |
| Graduate Degree | - | - |
| Total | $75,944 | $43,816 |
Family Income in Lincoln Park
Family Income Brackets in Lincoln Park
According to the Lincoln Park family income data, there are 44 families falling into the $75,000 to $99,999 income range, which is the most common income bracket and makes up 44.4% of all families.
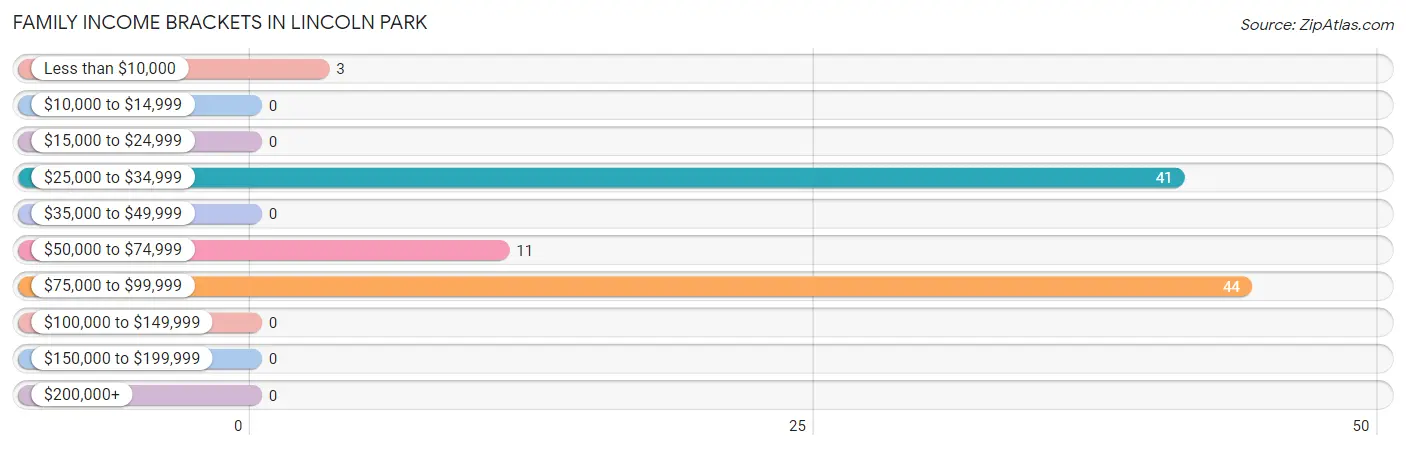
| Income Bracket | # Families | % Families |
| Less than $10,000 | 3 | 3.0% |
| $10,000 to $14,999 | 0 | 0.0% |
| $15,000 to $24,999 | 0 | 0.0% |
| $25,000 to $34,999 | 41 | 41.4% |
| $35,000 to $49,999 | 0 | 0.0% |
| $50,000 to $74,999 | 11 | 11.1% |
| $75,000 to $99,999 | 44 | 44.4% |
| $100,000 to $149,999 | 0 | 0.0% |
| $150,000 to $199,999 | 0 | 0.0% |
| $200,000+ | 0 | 0.0% |
Family Income by Famaliy Size in Lincoln Park
2-person families (57 | 57.6%) account for the highest median family income in Lincoln Park with $31,555 per family, while 2-person families (57 | 57.6%) have the highest median income of $15,778 per family member.
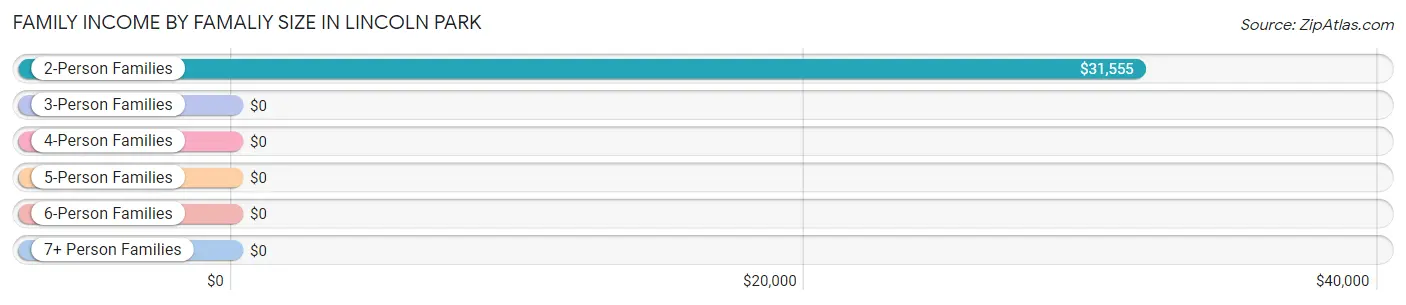
| Income Bracket | # Families | Median Income |
| 2-Person Families | 57 (57.6%) | $31,555 |
| 3-Person Families | 11 (11.1%) | $0 |
| 4-Person Families | 0 (0.0%) | $0 |
| 5-Person Families | 31 (31.3%) | $0 |
| 6-Person Families | 0 (0.0%) | $0 |
| 7+ Person Families | 0 (0.0%) | $0 |
| Total | 99 (100.0%) | $0 |
Family Income by Number of Earners in Lincoln Park
| Number of Earners | # Families | Median Income |
| No Earners | 44 (44.4%) | $0 |
| 1 Earner | 11 (11.1%) | $0 |
| 2 Earners | 13 (13.1%) | $0 |
| 3+ Earners | 31 (31.3%) | $0 |
| Total | 99 (100.0%) | $0 |
Household Income in Lincoln Park
Household Income Brackets in Lincoln Park
With 142 households falling in the category, the $75,000 to $99,999 income range is the most frequent in Lincoln Park, accounting for 35.6% of all households.
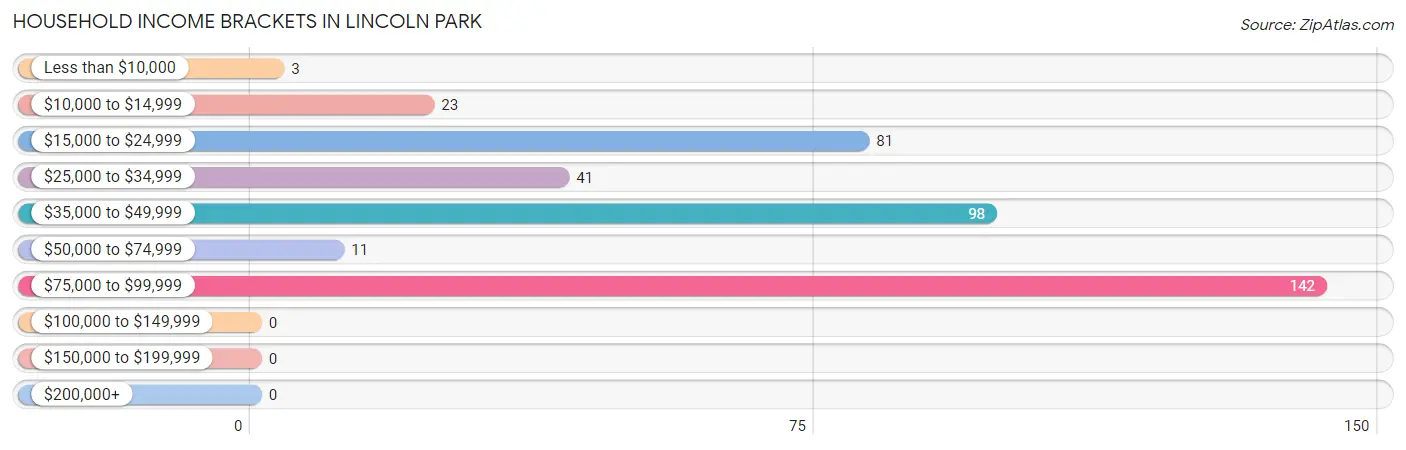
| Income Bracket | # Households | % Households |
| Less than $10,000 | 3 | 0.8% |
| $10,000 to $14,999 | 23 | 5.8% |
| $15,000 to $24,999 | 81 | 20.3% |
| $25,000 to $34,999 | 41 | 10.3% |
| $35,000 to $49,999 | 98 | 24.6% |
| $50,000 to $74,999 | 11 | 2.8% |
| $75,000 to $99,999 | 142 | 35.6% |
| $100,000 to $149,999 | 0 | 0.0% |
| $150,000 to $199,999 | 0 | 0.0% |
| $200,000+ | 0 | 0.0% |
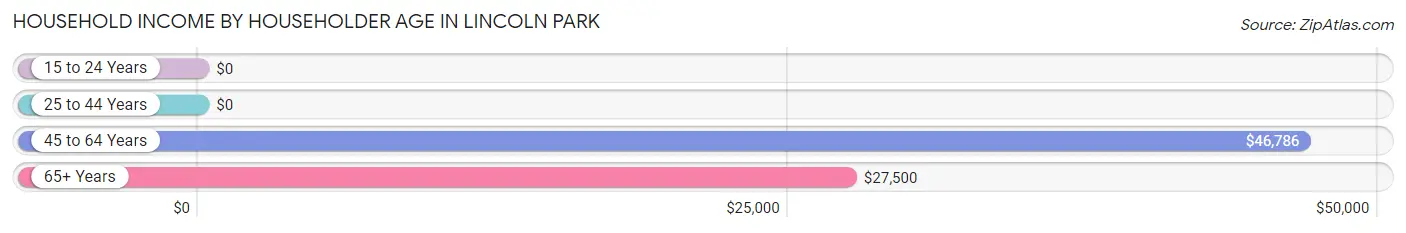
Household Income by Householder Age in Lincoln Park
The median household income in Lincoln Park is $46,116, with the highest median household income of $46,786 found in the 45 to 64 years age bracket for the primary householder. A total of 158 households (39.6%) fall into this category.
| Income Bracket | # Households | Median Income |
| 15 to 24 Years | 0 (0.0%) | $0 |
| 25 to 44 Years | 159 (39.9%) | $0 |
| 45 to 64 Years | 158 (39.6%) | $46,786 |
| 65+ Years | 82 (20.5%) | $27,500 |
| Total | 399 (100.0%) | $46,116 |
Poverty in Lincoln Park
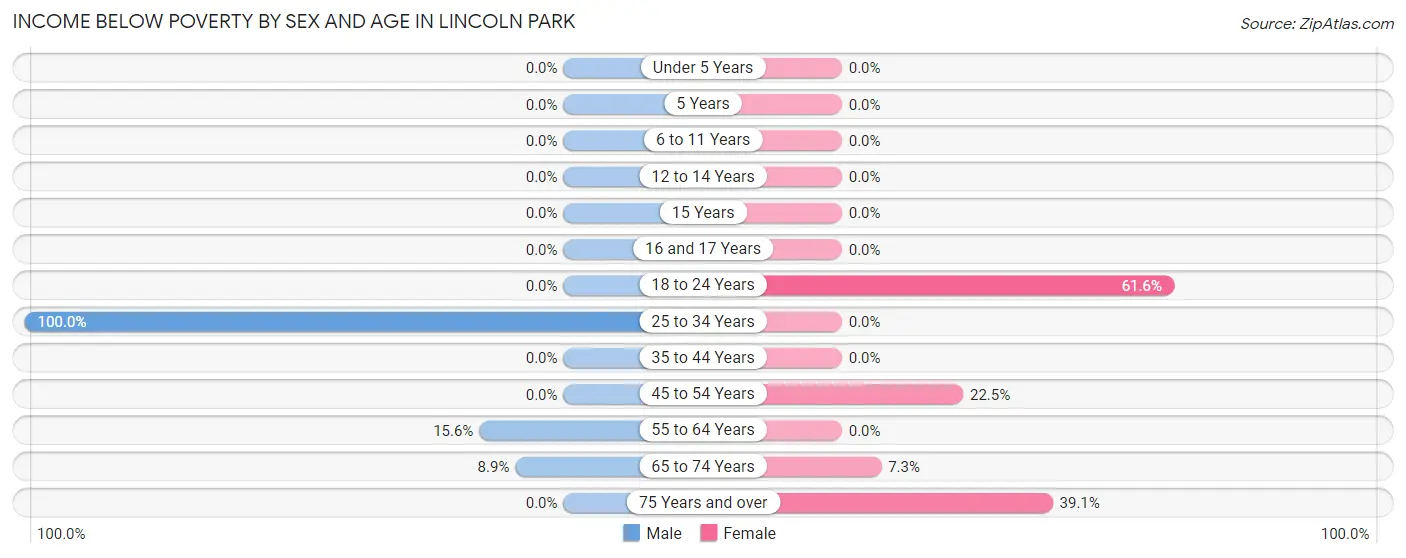
Income Below Poverty by Sex and Age in Lincoln Park
With 23.8% poverty level for males and 22.5% for females among the residents of Lincoln Park, 25 to 34 year old males and 18 to 24 year old females are the most vulnerable to poverty, with 61 males (100.0%) and 69 females (61.6%) in their respective age groups living below the poverty level.
| Age Bracket | Male | Female |
| Under 5 Years | 0 (0.0%) | 0 (0.0%) |
| 5 Years | 0 (0.0%) | 0 (0.0%) |
| 6 to 11 Years | 0 (0.0%) | 0 (0.0%) |
| 12 to 14 Years | 0 (0.0%) | 0 (0.0%) |
| 15 Years | 0 (0.0%) | 0 (0.0%) |
| 16 and 17 Years | 0 (0.0%) | 0 (0.0%) |
| 18 to 24 Years | 0 (0.0%) | 69 (61.6%) |
| 25 to 34 Years | 61 (100.0%) | 0 (0.0%) |
| 35 to 44 Years | 0 (0.0%) | 0 (0.0%) |
| 45 to 54 Years | 0 (0.0%) | 9 (22.5%) |
| 55 to 64 Years | 5 (15.6%) | 0 (0.0%) |
| 65 to 74 Years | 5 (8.9%) | 3 (7.3%) |
| 75 Years and over | 0 (0.0%) | 18 (39.1%) |
| Total | 71 (23.8%) | 99 (22.5%) |
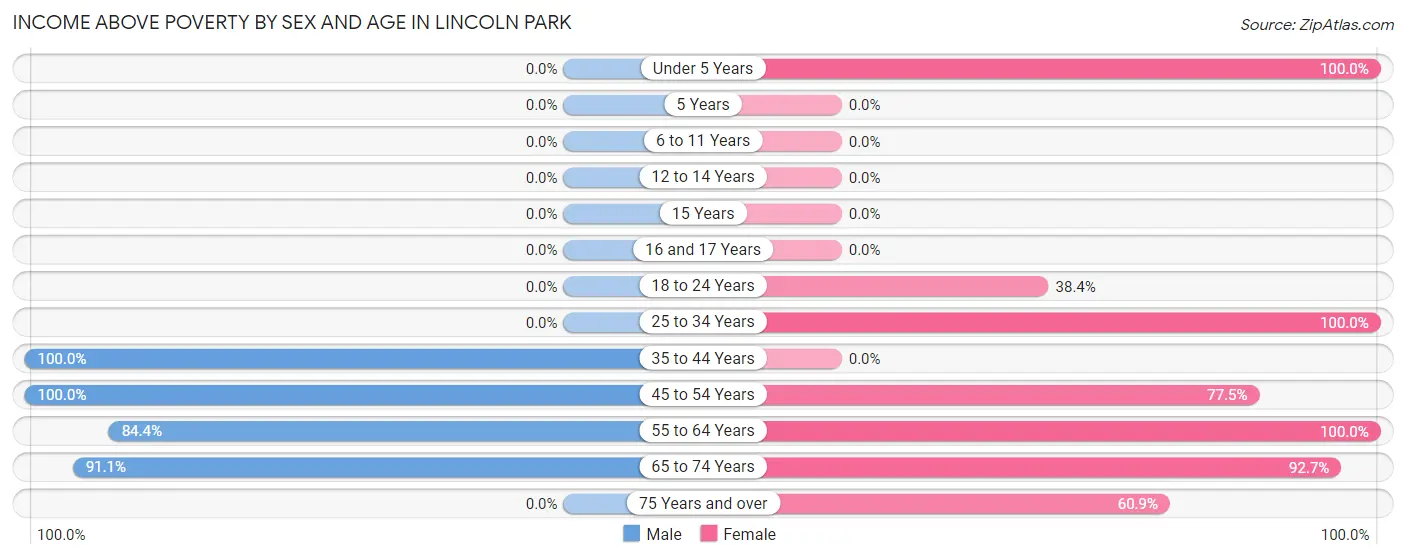
Income Above Poverty by Sex and Age in Lincoln Park
According to the poverty statistics in Lincoln Park, males aged 35 to 44 years and females aged under 5 years are the age groups that are most secure financially, with 100.0% of males and 100.0% of females in these age groups living above the poverty line.
| Age Bracket | Male | Female |
| Under 5 Years | 0 (0.0%) | 45 (100.0%) |
| 5 Years | 0 (0.0%) | 0 (0.0%) |
| 6 to 11 Years | 0 (0.0%) | 0 (0.0%) |
| 12 to 14 Years | 0 (0.0%) | 0 (0.0%) |
| 15 Years | 0 (0.0%) | 0 (0.0%) |
| 16 and 17 Years | 0 (0.0%) | 0 (0.0%) |
| 18 to 24 Years | 0 (0.0%) | 43 (38.4%) |
| 25 to 34 Years | 0 (0.0%) | 43 (100.0%) |
| 35 to 44 Years | 125 (100.0%) | 0 (0.0%) |
| 45 to 54 Years | 24 (100.0%) | 31 (77.5%) |
| 55 to 64 Years | 27 (84.4%) | 114 (100.0%) |
| 65 to 74 Years | 51 (91.1%) | 38 (92.7%) |
| 75 Years and over | 0 (0.0%) | 28 (60.9%) |
| Total | 227 (76.2%) | 342 (77.5%) |
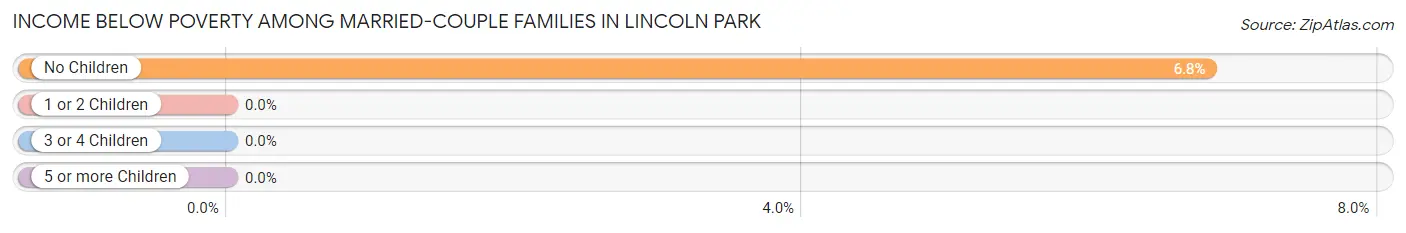
Income Below Poverty Among Married-Couple Families in Lincoln Park
The poverty statistics for married-couple families in Lincoln Park show that 4.0% or 3 of the total 75 families live below the poverty line. Families with no children have the highest poverty rate of 6.8%, comprising of 3 families. On the other hand, families with 1 or 2 children have the lowest poverty rate of 0.0%, which includes 0 families.
| Children | Above Poverty | Below Poverty |
| No Children | 41 (93.2%) | 3 (6.8%) |
| 1 or 2 Children | 31 (100.0%) | 0 (0.0%) |
| 3 or 4 Children | 0 (0.0%) | 0 (0.0%) |
| 5 or more Children | 0 (0.0%) | 0 (0.0%) |
| Total | 72 (96.0%) | 3 (4.0%) |
Income Below Poverty Among Single-Parent Households in Lincoln Park
| Children | Single Father | Single Mother |
| No Children | 0 (0.0%) | 0 (0.0%) |
| 1 or 2 Children | 0 (0.0%) | 0 (0.0%) |
| 3 or 4 Children | 0 (0.0%) | 0 (0.0%) |
| 5 or more Children | 0 (0.0%) | 0 (0.0%) |
| Total | 0 (0.0%) | 0 (0.0%) |
Income Below Poverty Among Married-Couple vs Single-Parent Households in Lincoln Park
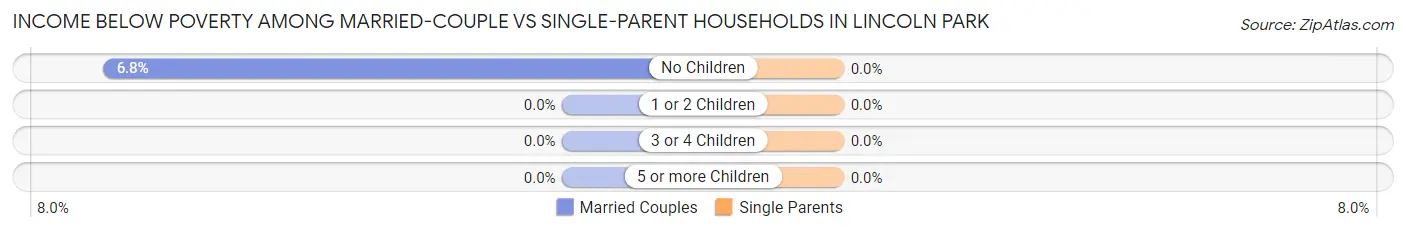
| Children | Married-Couple Families | Single-Parent Households |
| No Children | 3 (6.8%) | 0 (0.0%) |
| 1 or 2 Children | 0 (0.0%) | 0 (0.0%) |
| 3 or 4 Children | 0 (0.0%) | 0 (0.0%) |
| 5 or more Children | 0 (0.0%) | 0 (0.0%) |
| Total | 3 (4.0%) | 0 (0.0%) |
Race in Lincoln Park
The most populous races in Lincoln Park are , and Black / African American (739 | 100.0%).
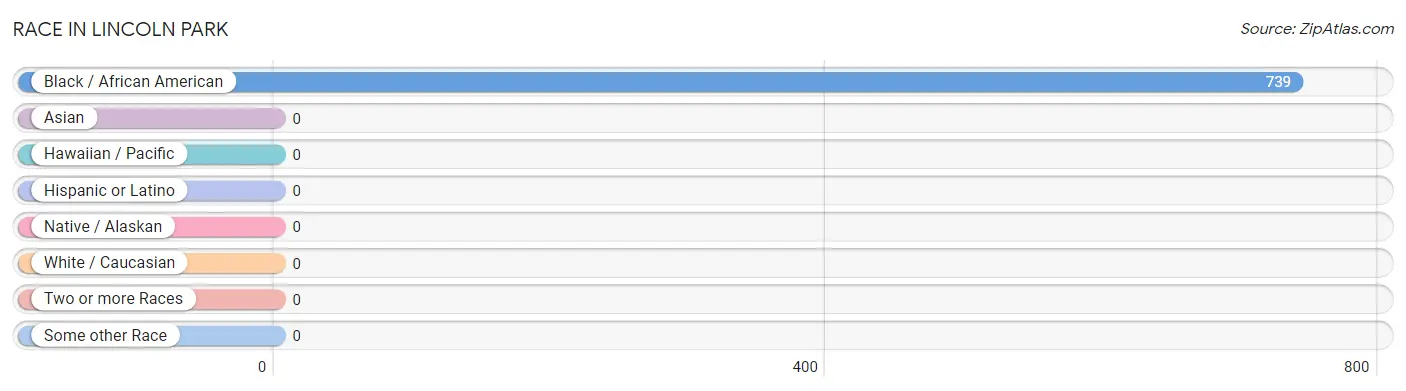
| Race | # Population | % Population |
| Asian | 0 | 0.0% |
| Black / African American | 739 | 100.0% |
| Hawaiian / Pacific | 0 | 0.0% |
| Hispanic or Latino | 0 | 0.0% |
| Native / Alaskan | 0 | 0.0% |
| White / Caucasian | 0 | 0.0% |
| Two or more Races | 0 | 0.0% |
| Some other Race | 0 | 0.0% |
| Total | 739 | 100.0% |
Ancestry in Lincoln Park
The most populous ancestries reported in Lincoln Park are , and American (58 | 7.9%), together accounting for 7.9% of all Lincoln Park residents.

| Ancestry | # Population | % Population |
| American | 58 | 7.9% | View All 1 Rows |
Immigrants in Lincoln Park

| Immigration Origin | # Population | % Population | View All 0 Rows |
Sex and Age in Lincoln Park
Sex and Age in Lincoln Park
The most populous age groups in Lincoln Park are 40 to 44 Years (98 | 32.9%) for men and 55 to 59 Years (103 | 23.4%) for women.
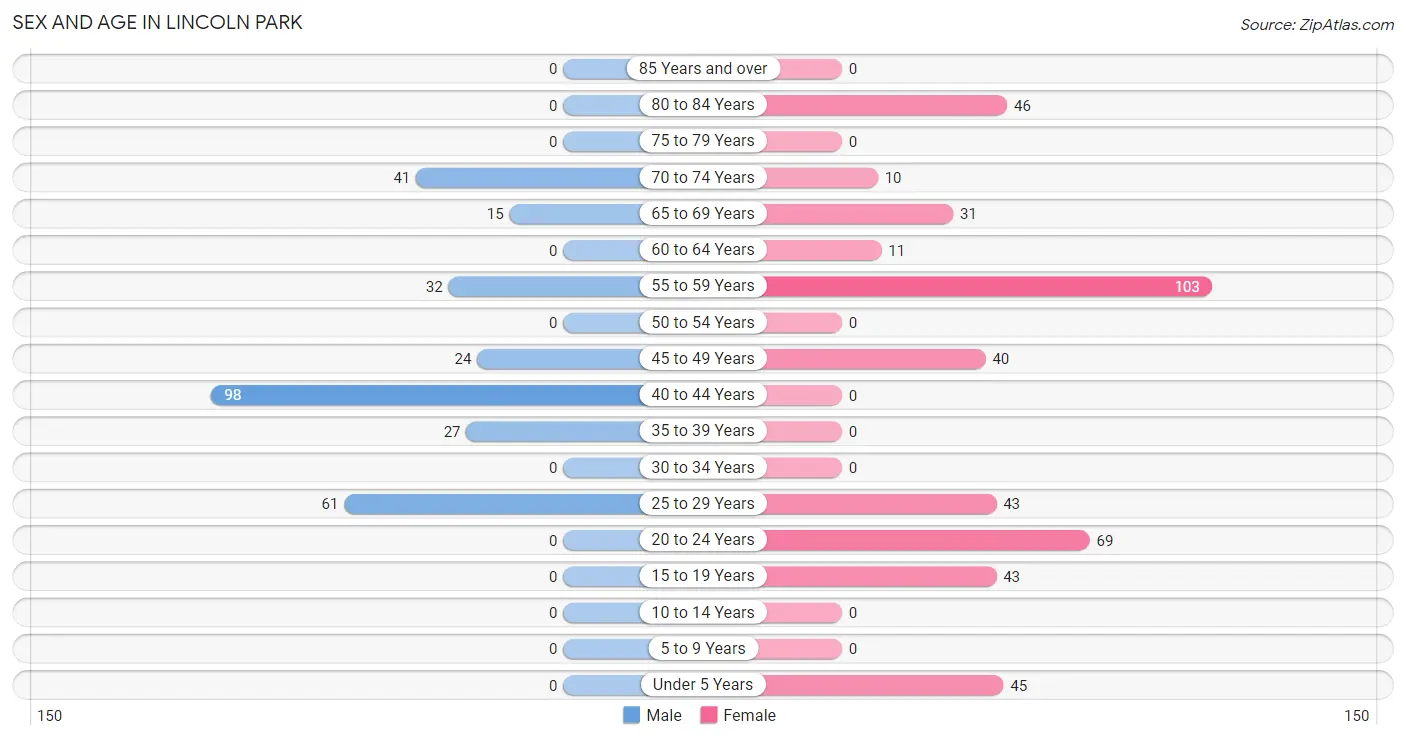
| Age Bracket | Male | Female |
| Under 5 Years | 0 (0.0%) | 45 (10.2%) |
| 5 to 9 Years | 0 (0.0%) | 0 (0.0%) |
| 10 to 14 Years | 0 (0.0%) | 0 (0.0%) |
| 15 to 19 Years | 0 (0.0%) | 43 (9.8%) |
| 20 to 24 Years | 0 (0.0%) | 69 (15.7%) |
| 25 to 29 Years | 61 (20.5%) | 43 (9.8%) |
| 30 to 34 Years | 0 (0.0%) | 0 (0.0%) |
| 35 to 39 Years | 27 (9.1%) | 0 (0.0%) |
| 40 to 44 Years | 98 (32.9%) | 0 (0.0%) |
| 45 to 49 Years | 24 (8.1%) | 40 (9.1%) |
| 50 to 54 Years | 0 (0.0%) | 0 (0.0%) |
| 55 to 59 Years | 32 (10.7%) | 103 (23.4%) |
| 60 to 64 Years | 0 (0.0%) | 11 (2.5%) |
| 65 to 69 Years | 15 (5.0%) | 31 (7.0%) |
| 70 to 74 Years | 41 (13.8%) | 10 (2.3%) |
| 75 to 79 Years | 0 (0.0%) | 0 (0.0%) |
| 80 to 84 Years | 0 (0.0%) | 46 (10.4%) |
| 85 Years and over | 0 (0.0%) | 0 (0.0%) |
| Total | 298 (100.0%) | 441 (100.0%) |
Families and Households in Lincoln Park
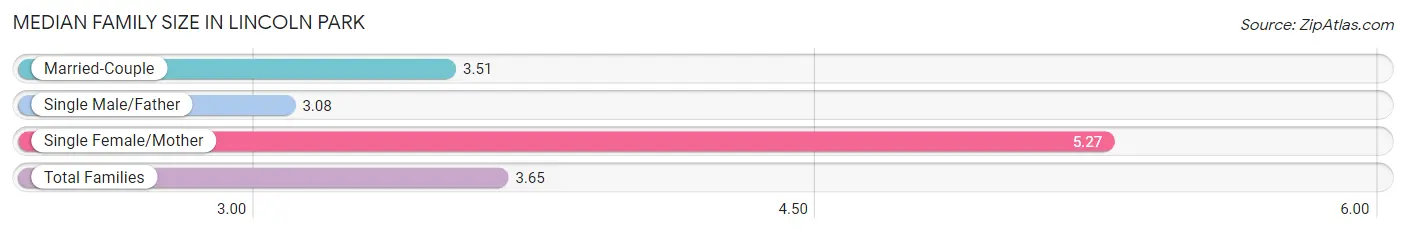
Median Family Size in Lincoln Park
The median family size in Lincoln Park is 3.65 persons per family, with single female/mother families (11 | 11.1%) accounting for the largest median family size of 5.27 persons per family. On the other hand, single male/father families (13 | 13.1%) represent the smallest median family size with 3.08 persons per family.
| Family Type | # Families | Family Size |
| Married-Couple | 75 (75.8%) | 3.51 |
| Single Male/Father | 13 (13.1%) | 3.08 |
| Single Female/Mother | 11 (11.1%) | 5.27 |
| Total Families | 99 (100.0%) | 3.65 |
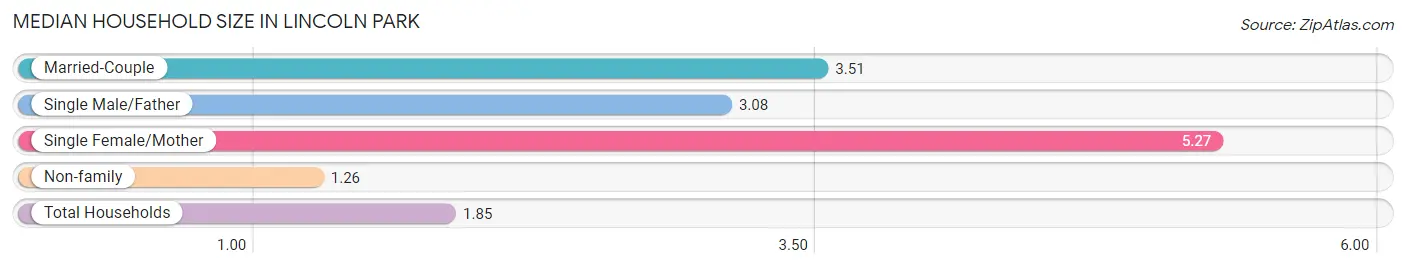
Median Household Size in Lincoln Park
The median household size in Lincoln Park is 1.85 persons per household, with single female/mother households (11 | 2.8%) accounting for the largest median household size of 5.27 persons per household. non-family households (300 | 75.2%) represent the smallest median household size with 1.26 persons per household.
| Household Type | # Households | Household Size |
| Married-Couple | 75 (18.8%) | 3.51 |
| Single Male/Father | 13 (3.3%) | 3.08 |
| Single Female/Mother | 11 (2.8%) | 5.27 |
| Non-family | 300 (75.2%) | 1.26 |
| Total Households | 399 (100.0%) | 1.85 |
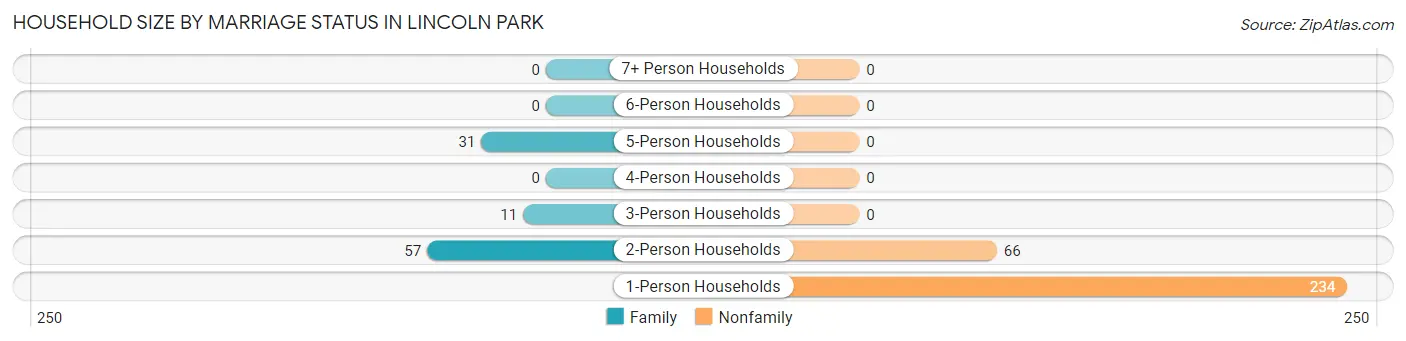
Household Size by Marriage Status in Lincoln Park
Out of a total of 399 households in Lincoln Park, 99 (24.8%) are family households, while 300 (75.2%) are nonfamily households. The most numerous type of family households are 2-person households, comprising 57, and the most common type of nonfamily households are 1-person households, comprising 234.
| Household Size | Family Households | Nonfamily Households |
| 1-Person Households | - | 234 (58.7%) |
| 2-Person Households | 57 (14.3%) | 66 (16.5%) |
| 3-Person Households | 11 (2.8%) | 0 (0.0%) |
| 4-Person Households | 0 (0.0%) | 0 (0.0%) |
| 5-Person Households | 31 (7.8%) | 0 (0.0%) |
| 6-Person Households | 0 (0.0%) | 0 (0.0%) |
| 7+ Person Households | 0 (0.0%) | 0 (0.0%) |
| Total | 99 (24.8%) | 300 (75.2%) |
Female Fertility in Lincoln Park
Fertility by Age in Lincoln Park
| Age Bracket | Women with Births | Births / 1,000 Women |
| 15 to 19 years | 0 (0.0%) | 0.0 |
| 20 to 34 years | 0 (0.0%) | 0.0 |
| 35 to 50 years | 0 (0.0%) | 0.0 |
| Total | 0 (0.0%) | 0.0 |
Fertility by Age by Marriage Status in Lincoln Park
| Age Bracket | Married | Unmarried |
| 15 to 19 years | 0 (0.0%) | 0 (0.0%) |
| 20 to 34 years | 0 (0.0%) | 0 (0.0%) |
| 35 to 50 years | 0 (0.0%) | 0 (0.0%) |
| Total | 0 (0.0%) | 0 (0.0%) |
Fertility by Education in Lincoln Park
| Educational Attainment | Women with Births | Births / 1,000 Women |
| Less than High School | 0 (0.0%) | 0.0 |
| High School Diploma | 0 (0.0%) | 0.0 |
| College or Associate's Degree | 0 (0.0%) | 0.0 |
| Bachelor's Degree | 0 (0.0%) | 0.0 |
| Graduate Degree | 0 (0.0%) | 0.0 |
| Total | 0 (0.0%) | 0.0 |
Fertility by Education by Marriage Status in Lincoln Park
| Educational Attainment | Married | Unmarried |
| Less than High School | 0 (0.0%) | 0 (0.0%) |
| High School Diploma | 0 (0.0%) | 0 (0.0%) |
| College or Associate's Degree | 0 (0.0%) | 0 (0.0%) |
| Bachelor's Degree | 0 (0.0%) | 0 (0.0%) |
| Graduate Degree | 0 (0.0%) | 0 (0.0%) |
| Total | 0 (0.0%) | 0 (0.0%) |
Employment Characteristics in Lincoln Park
Employment by Class of Employer in Lincoln Park
Among the 431 employed individuals in Lincoln Park, private company employees (251 | 58.2%), federal government employees (98 | 22.7%), and not-for-profit organizations (69 | 16.0%) make up the most common classes of employment.
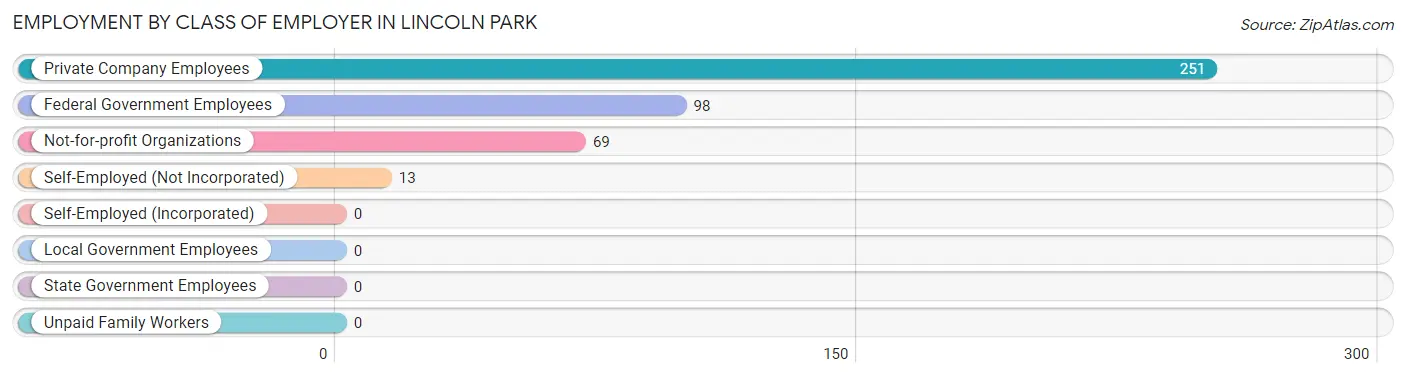
| Employer Class | # Employees | % Employees |
| Private Company Employees | 251 | 58.2% |
| Self-Employed (Incorporated) | 0 | 0.0% |
| Self-Employed (Not Incorporated) | 13 | 3.0% |
| Not-for-profit Organizations | 69 | 16.0% |
| Local Government Employees | 0 | 0.0% |
| State Government Employees | 0 | 0.0% |
| Federal Government Employees | 98 | 22.7% |
| Unpaid Family Workers | 0 | 0.0% |
| Total | 431 | 100.0% |
Employment Status by Age in Lincoln Park
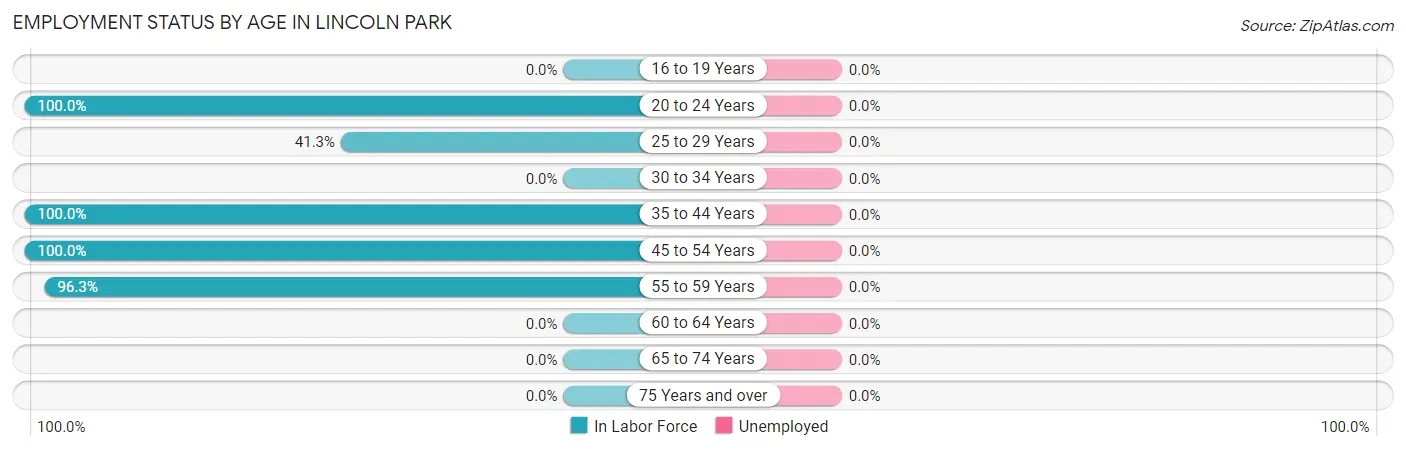
| Age Bracket | In Labor Force | Unemployed |
| 16 to 19 Years | 0 (0.0%) | 0 (0.0%) |
| 20 to 24 Years | 69 (100.0%) | 0 (0.0%) |
| 25 to 29 Years | 43 (41.3%) | 0 (0.0%) |
| 30 to 34 Years | 0 (0.0%) | 0 (0.0%) |
| 35 to 44 Years | 125 (100.0%) | 0 (0.0%) |
| 45 to 54 Years | 64 (100.0%) | 0 (0.0%) |
| 55 to 59 Years | 130 (96.3%) | 0 (0.0%) |
| 60 to 64 Years | 0 (0.0%) | 0 (0.0%) |
| 65 to 74 Years | 0 (0.0%) | 0 (0.0%) |
| 75 Years and over | 0 (0.0%) | 0 (0.0%) |
| Total | 431 (62.1%) | 0 (0.0%) |
Employment Status by Educational Attainment in Lincoln Park
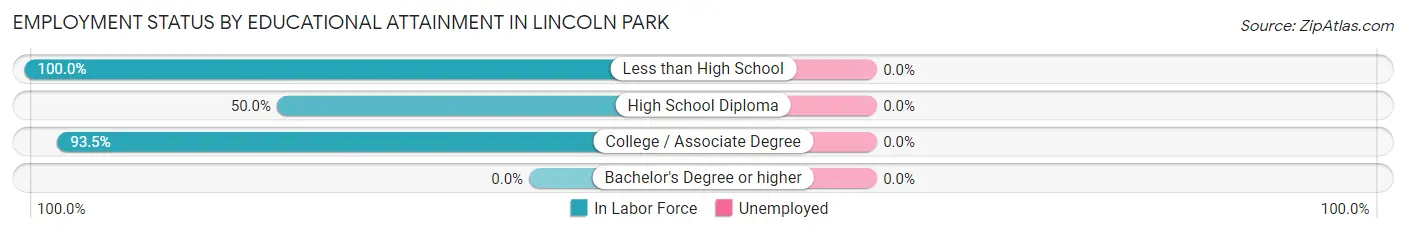
| Educational Attainment | In Labor Force | Unemployed |
| Less than High School | 138 (100.0%) | 0 (0.0%) |
| High School Diploma | 66 (50.0%) | 0 (0.0%) |
| College / Associate Degree | 158 (93.5%) | 0 (0.0%) |
| Bachelor's Degree or higher | 0 (0.0%) | 0 (0.0%) |
| Total | 362 (82.5%) | 0 (0.0%) |
Employment Occupations by Sex in Lincoln Park
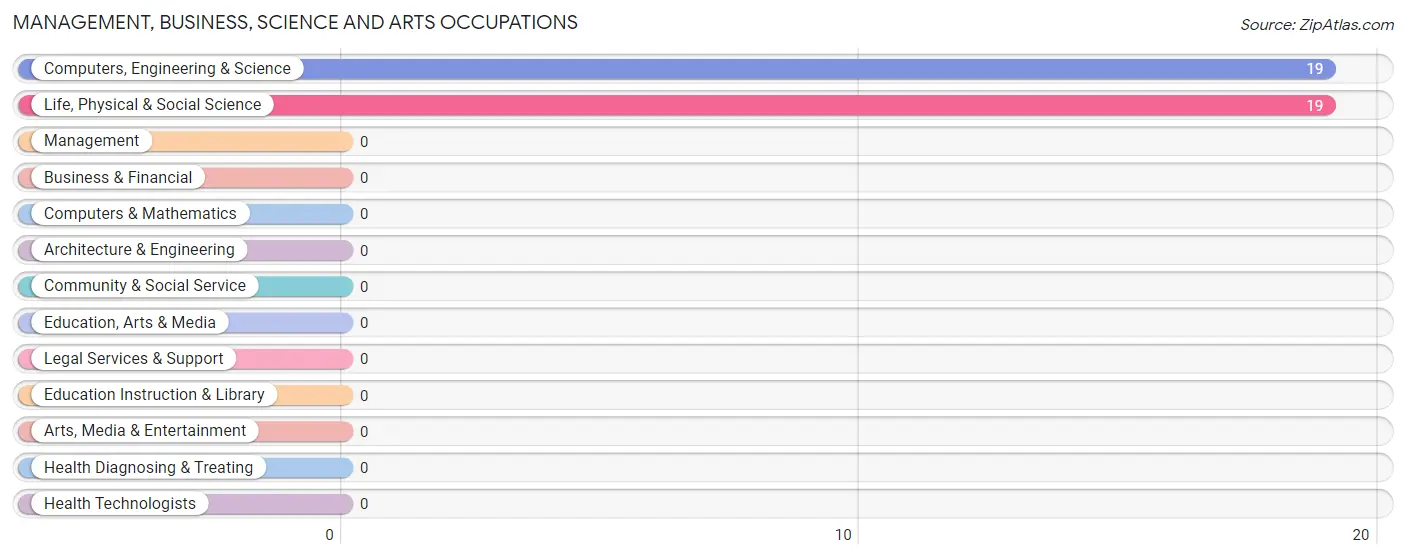
Management, Business, Science and Arts Occupations
The most common Management, Business, Science and Arts occupations in Lincoln Park are Computers, Engineering & Science (19 | 4.4%), and Life, Physical & Social Science (19 | 4.4%).
Management, Business, Science and Arts Occupations by Sex
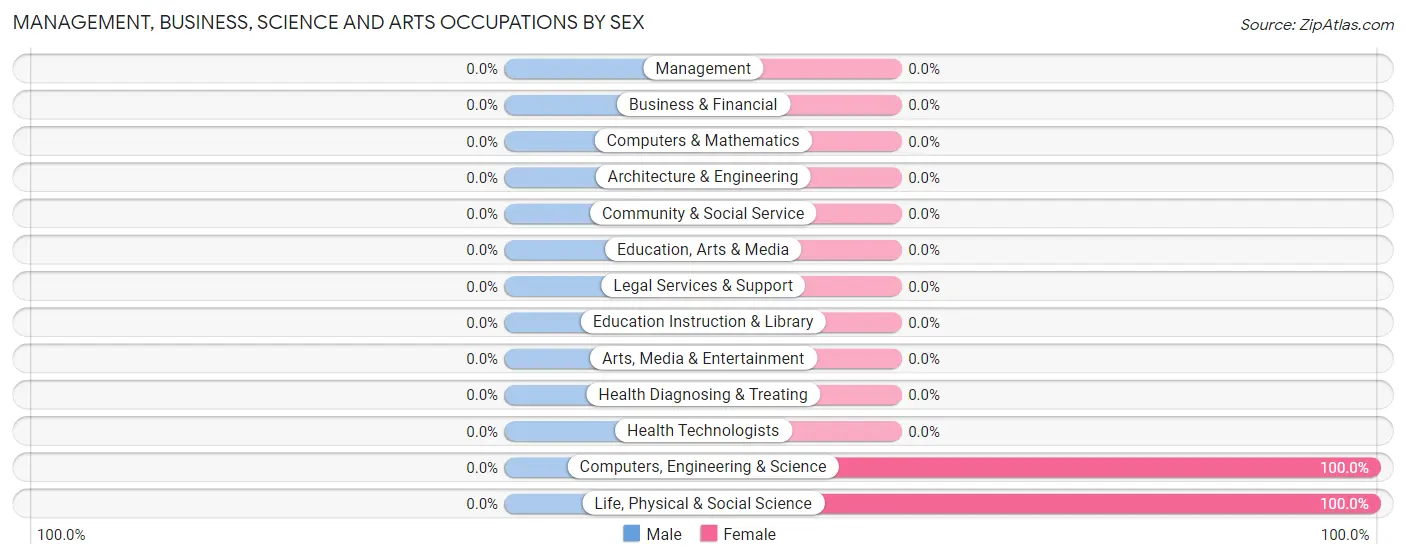
| Occupation | Male | Female |
| Management | 0 (0.0%) | 0 (0.0%) |
| Business & Financial | 0 (0.0%) | 0 (0.0%) |
| Computers, Engineering & Science | 0 (0.0%) | 19 (100.0%) |
| Computers & Mathematics | 0 (0.0%) | 0 (0.0%) |
| Architecture & Engineering | 0 (0.0%) | 0 (0.0%) |
| Life, Physical & Social Science | 0 (0.0%) | 19 (100.0%) |
| Community & Social Service | 0 (0.0%) | 0 (0.0%) |
| Education, Arts & Media | 0 (0.0%) | 0 (0.0%) |
| Legal Services & Support | 0 (0.0%) | 0 (0.0%) |
| Education Instruction & Library | 0 (0.0%) | 0 (0.0%) |
| Arts, Media & Entertainment | 0 (0.0%) | 0 (0.0%) |
| Health Diagnosing & Treating | 0 (0.0%) | 0 (0.0%) |
| Health Technologists | 0 (0.0%) | 0 (0.0%) |
| Total (Category) | 0 (0.0%) | 19 (100.0%) |
| Total (Overall) | 176 (40.8%) | 255 (59.2%) |
Services Occupations
The most common Services occupations in Lincoln Park are Healthcare Support (84 | 19.5%), Food Preparation & Serving (69 | 16.0%), Personal Care & Service (31 | 7.2%), and Cleaning & Maintenance (13 | 3.0%).
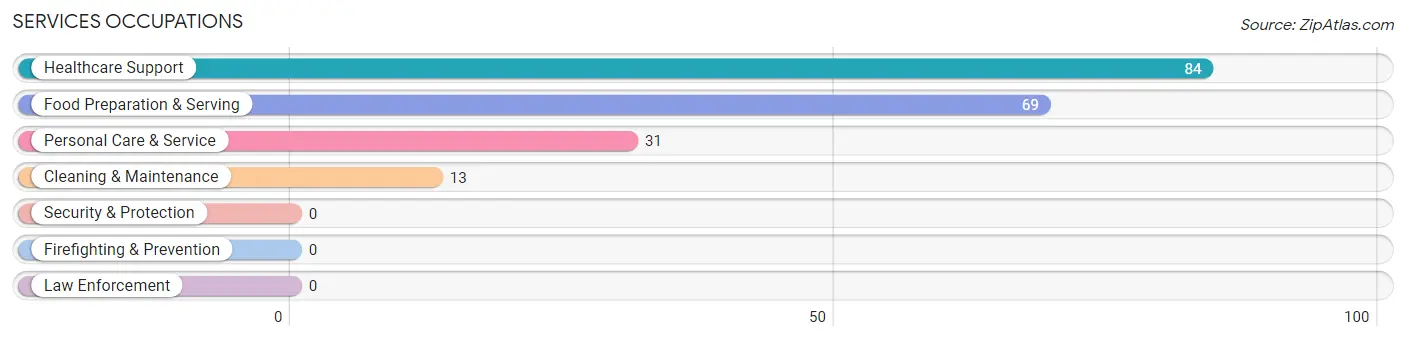
Services Occupations by Sex
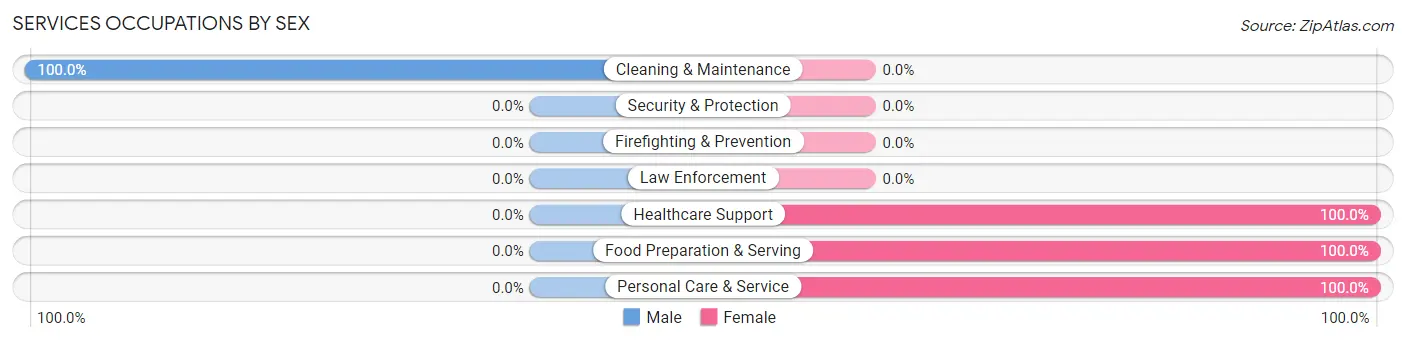
| Occupation | Male | Female |
| Healthcare Support | 0 (0.0%) | 84 (100.0%) |
| Security & Protection | 0 (0.0%) | 0 (0.0%) |
| Firefighting & Prevention | 0 (0.0%) | 0 (0.0%) |
| Law Enforcement | 0 (0.0%) | 0 (0.0%) |
| Food Preparation & Serving | 0 (0.0%) | 69 (100.0%) |
| Cleaning & Maintenance | 13 (100.0%) | 0 (0.0%) |
| Personal Care & Service | 0 (0.0%) | 31 (100.0%) |
| Total (Category) | 13 (6.6%) | 184 (93.4%) |
| Total (Overall) | 176 (40.8%) | 255 (59.2%) |
Sales and Office Occupations
The most common Sales and Office occupations in Lincoln Park are , and Office & Administration (122 | 28.3%).
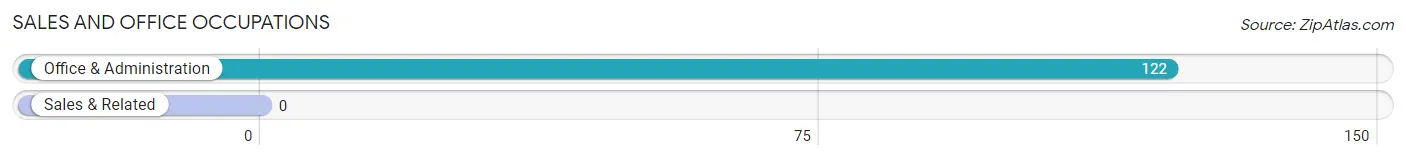
Sales and Office Occupations by Sex
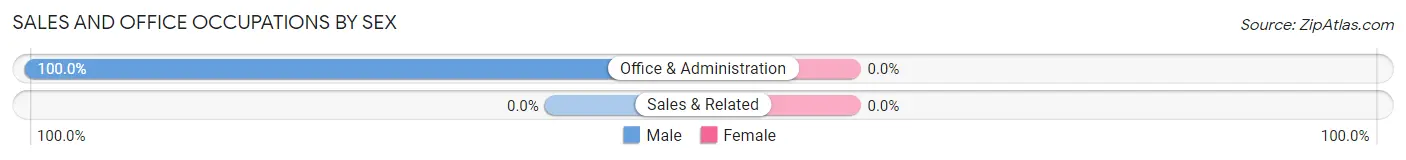
| Occupation | Male | Female |
| Sales & Related | 0 (0.0%) | 0 (0.0%) |
| Office & Administration | 122 (100.0%) | 0 (0.0%) |
| Total (Category) | 122 (100.0%) | 0 (0.0%) |
| Total (Overall) | 176 (40.8%) | 255 (59.2%) |
Natural Resources, Construction and Maintenance Occupations
The most common Natural Resources, Construction and Maintenance occupations in Lincoln Park are , and Construction & Extraction (14 | 3.3%).
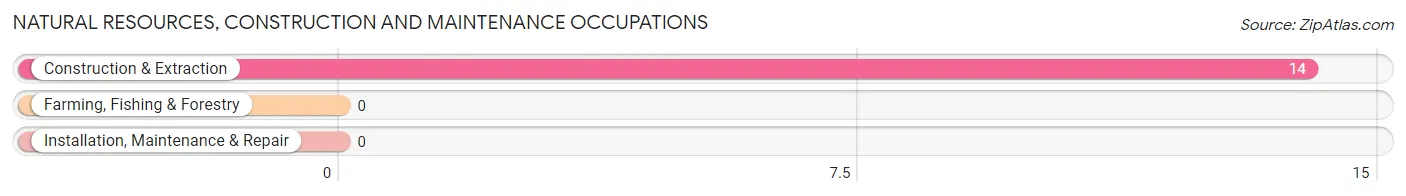
Natural Resources, Construction and Maintenance Occupations by Sex
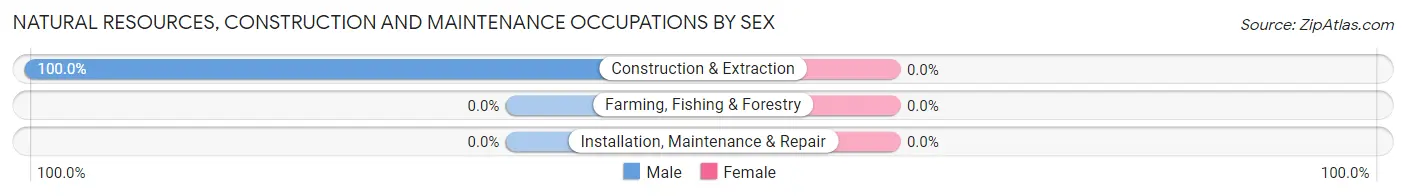
| Occupation | Male | Female |
| Farming, Fishing & Forestry | 0 (0.0%) | 0 (0.0%) |
| Construction & Extraction | 14 (100.0%) | 0 (0.0%) |
| Installation, Maintenance & Repair | 0 (0.0%) | 0 (0.0%) |
| Total (Category) | 14 (100.0%) | 0 (0.0%) |
| Total (Overall) | 176 (40.8%) | 255 (59.2%) |
Production, Transportation and Moving Occupations
The most common Production, Transportation and Moving occupations in Lincoln Park are , and Production (79 | 18.3%).
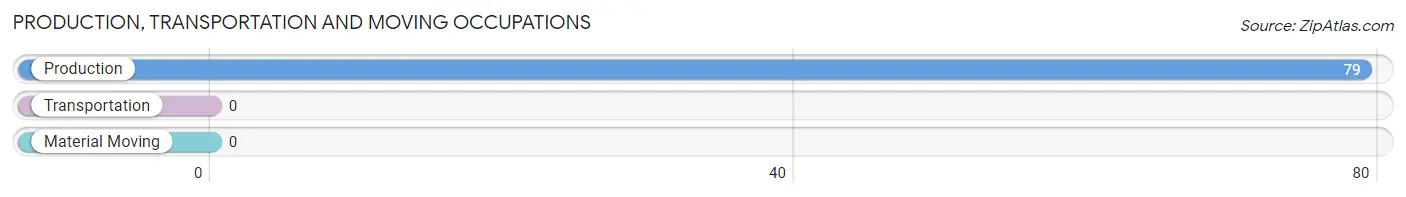
Production, Transportation and Moving Occupations by Sex
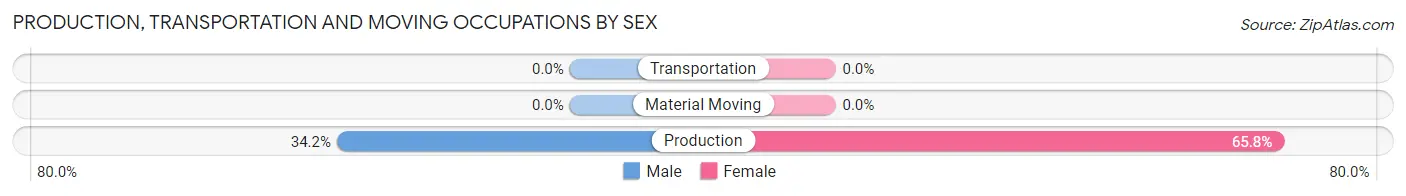
| Occupation | Male | Female |
| Production | 27 (34.2%) | 52 (65.8%) |
| Transportation | 0 (0.0%) | 0 (0.0%) |
| Material Moving | 0 (0.0%) | 0 (0.0%) |
| Total (Category) | 27 (34.2%) | 52 (65.8%) |
| Total (Overall) | 176 (40.8%) | 255 (59.2%) |
Employment Industries by Sex in Lincoln Park
Employment Industries in Lincoln Park
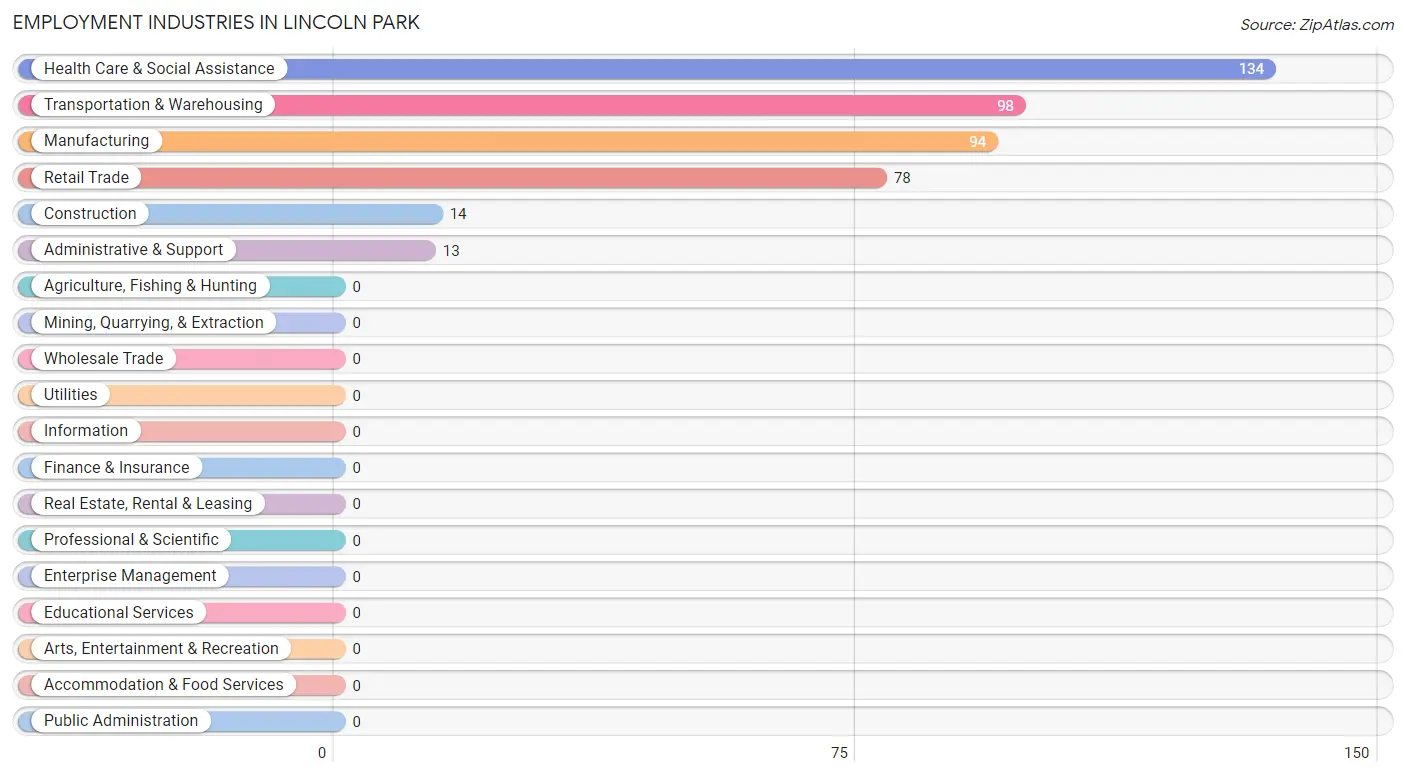
The major employment industries in Lincoln Park include Health Care & Social Assistance (134 | 31.1%), Transportation & Warehousing (98 | 22.7%), Manufacturing (94 | 21.8%), Retail Trade (78 | 18.1%), and Construction (14 | 3.3%).
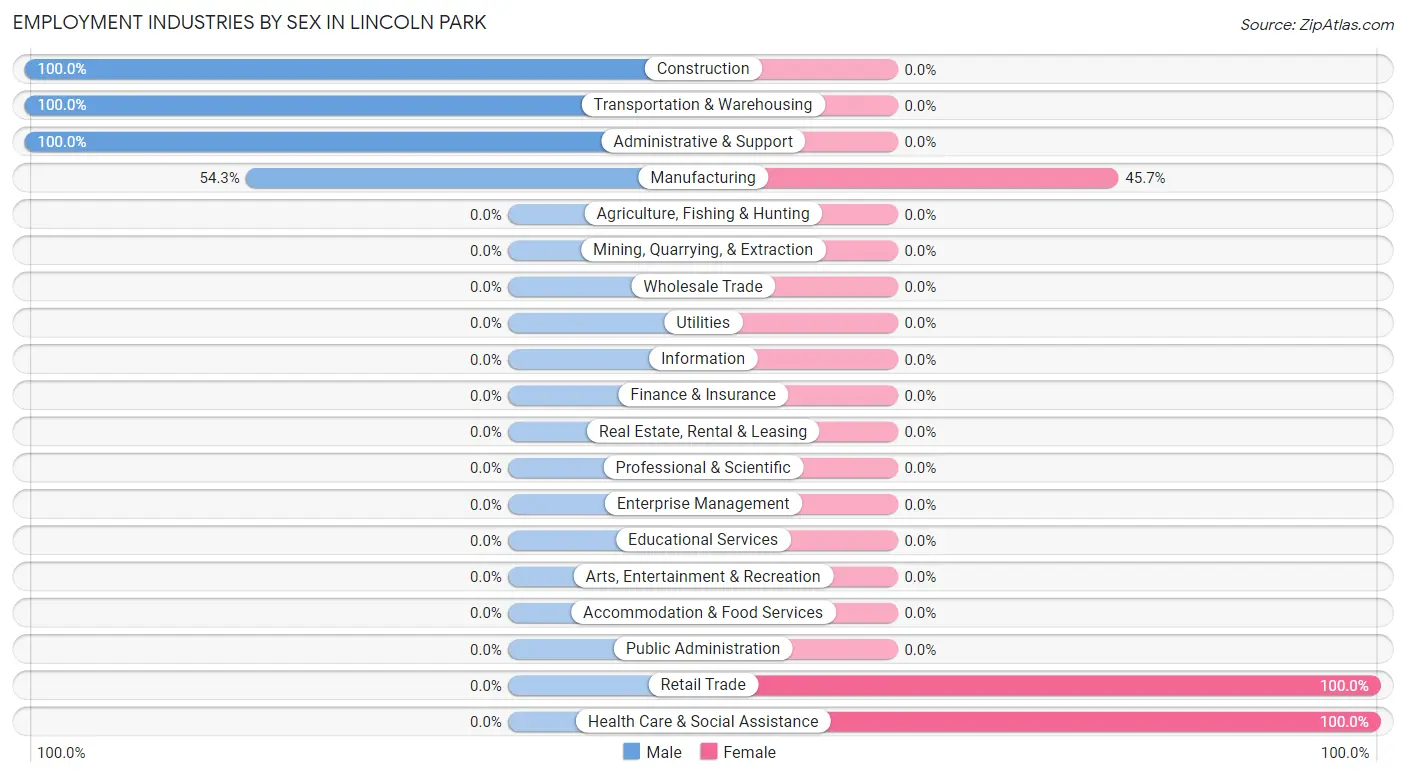
Employment Industries by Sex in Lincoln Park
The Lincoln Park industries that see more men than women are Construction (100.0%), Transportation & Warehousing (100.0%), and Administrative & Support (100.0%), whereas the industries that tend to have a higher number of women are Retail Trade (100.0%), Health Care & Social Assistance (100.0%), and Manufacturing (45.7%).
| Industry | Male | Female |
| Agriculture, Fishing & Hunting | 0 (0.0%) | 0 (0.0%) |
| Mining, Quarrying, & Extraction | 0 (0.0%) | 0 (0.0%) |
| Construction | 14 (100.0%) | 0 (0.0%) |
| Manufacturing | 51 (54.3%) | 43 (45.7%) |
| Wholesale Trade | 0 (0.0%) | 0 (0.0%) |
| Retail Trade | 0 (0.0%) | 78 (100.0%) |
| Transportation & Warehousing | 98 (100.0%) | 0 (0.0%) |
| Utilities | 0 (0.0%) | 0 (0.0%) |
| Information | 0 (0.0%) | 0 (0.0%) |
| Finance & Insurance | 0 (0.0%) | 0 (0.0%) |
| Real Estate, Rental & Leasing | 0 (0.0%) | 0 (0.0%) |
| Professional & Scientific | 0 (0.0%) | 0 (0.0%) |
| Enterprise Management | 0 (0.0%) | 0 (0.0%) |
| Administrative & Support | 13 (100.0%) | 0 (0.0%) |
| Educational Services | 0 (0.0%) | 0 (0.0%) |
| Health Care & Social Assistance | 0 (0.0%) | 134 (100.0%) |
| Arts, Entertainment & Recreation | 0 (0.0%) | 0 (0.0%) |
| Accommodation & Food Services | 0 (0.0%) | 0 (0.0%) |
| Public Administration | 0 (0.0%) | 0 (0.0%) |
| Total | 176 (40.8%) | 255 (59.2%) |
Education in Lincoln Park
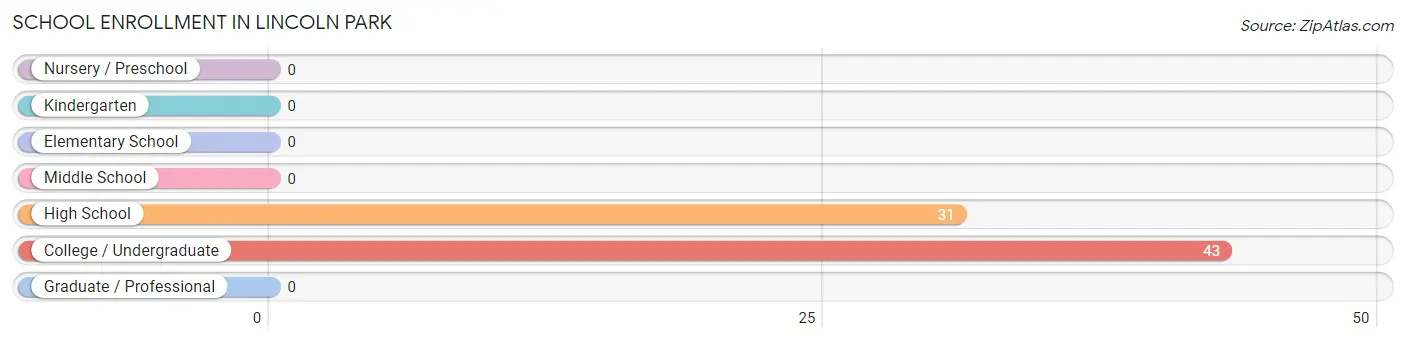
School Enrollment in Lincoln Park
The most common levels of schooling among the 74 students in Lincoln Park are college / undergraduate (43 | 58.1%), and high school (31 | 41.9%).
| School Level | # Students | % Students |
| Nursery / Preschool | 0 | 0.0% |
| Kindergarten | 0 | 0.0% |
| Elementary School | 0 | 0.0% |
| Middle School | 0 | 0.0% |
| High School | 31 | 41.9% |
| College / Undergraduate | 43 | 58.1% |
| Graduate / Professional | 0 | 0.0% |
| Total | 74 | 100.0% |
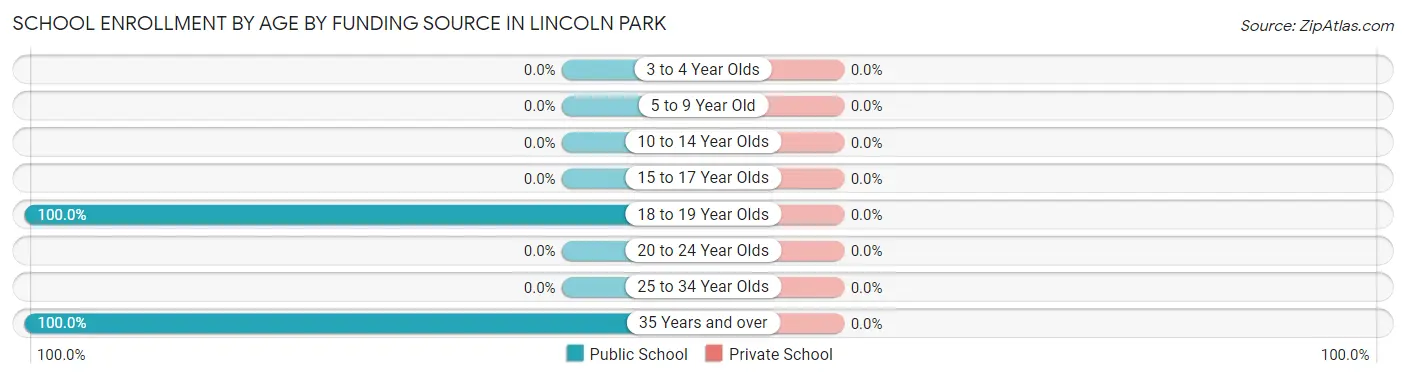
School Enrollment by Age by Funding Source in Lincoln Park
| Age Bracket | Public School | Private School |
| 3 to 4 Year Olds | 0 (0.0%) | 0 (0.0%) |
| 5 to 9 Year Old | 0 (0.0%) | 0 (0.0%) |
| 10 to 14 Year Olds | 0 (0.0%) | 0 (0.0%) |
| 15 to 17 Year Olds | 0 (0.0%) | 0 (0.0%) |
| 18 to 19 Year Olds | 43 (100.0%) | 0 (0.0%) |
| 20 to 24 Year Olds | 0 (0.0%) | 0 (0.0%) |
| 25 to 34 Year Olds | 0 (0.0%) | 0 (0.0%) |
| 35 Years and over | 31 (100.0%) | 0 (0.0%) |
| Total | 74 (100.0%) | 0 (0.0%) |
Educational Attainment by Field of Study in Lincoln Park
| Field of Study | # Graduates | % Graduates |
| Computers & Mathematics | 0 | 0.0% |
| Bio, Nature & Agricultural | 0 | 0.0% |
| Physical & Health Sciences | 0 | 0.0% |
| Psychology | 0 | 0.0% |
| Social Sciences | 0 | 0.0% |
| Engineering | 0 | 0.0% |
| Multidisciplinary Studies | 0 | 0.0% |
| Science & Technology | 0 | 0.0% |
| Business | 0 | 0.0% |
| Education | 0 | 0.0% |
| Literature & Languages | 0 | 0.0% |
| Liberal Arts & History | 0 | 0.0% |
| Visual & Performing Arts | 0 | 0.0% |
| Communications | 0 | 0.0% |
| Arts & Humanities | 0 | 0.0% |
| Total | 0 | 0.0% |
Transportation & Commute in Lincoln Park
Vehicle Availability by Sex in Lincoln Park
The most prevalent vehicle ownership categories in Lincoln Park are males with no vehicle (98, accounting for 55.7%) and females with no vehicle (97, making up 38.4%).
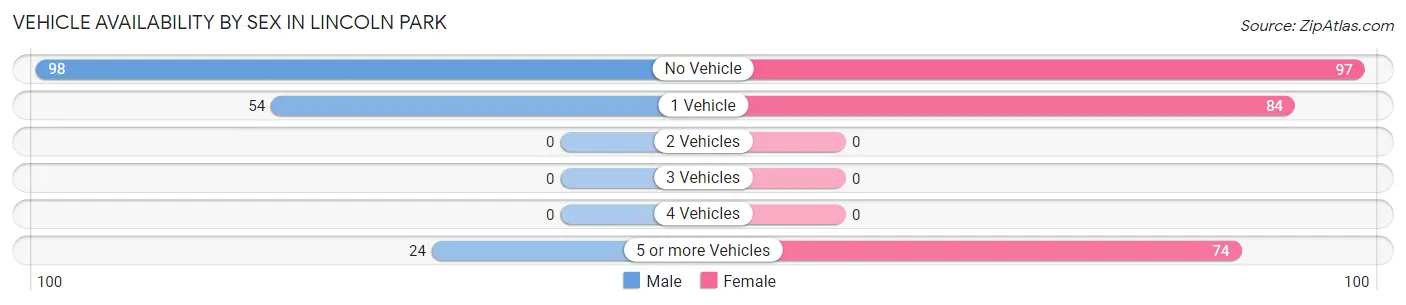
| Vehicles Available | Male | Female |
| No Vehicle | 98 (55.7%) | 97 (38.0%) |
| 1 Vehicle | 54 (30.7%) | 84 (32.9%) |
| 2 Vehicles | 0 (0.0%) | 0 (0.0%) |
| 3 Vehicles | 0 (0.0%) | 0 (0.0%) |
| 4 Vehicles | 0 (0.0%) | 0 (0.0%) |
| 5 or more Vehicles | 24 (13.6%) | 74 (29.0%) |
| Total | 176 (100.0%) | 255 (100.0%) |
Commute Time in Lincoln Park
The most frequently occuring commute durations in Lincoln Park are 60 to 89 minutes (182 commuters, 42.2%), 10 to 14 minutes (88 commuters, 20.4%), and 15 to 19 minutes (45 commuters, 10.4%).
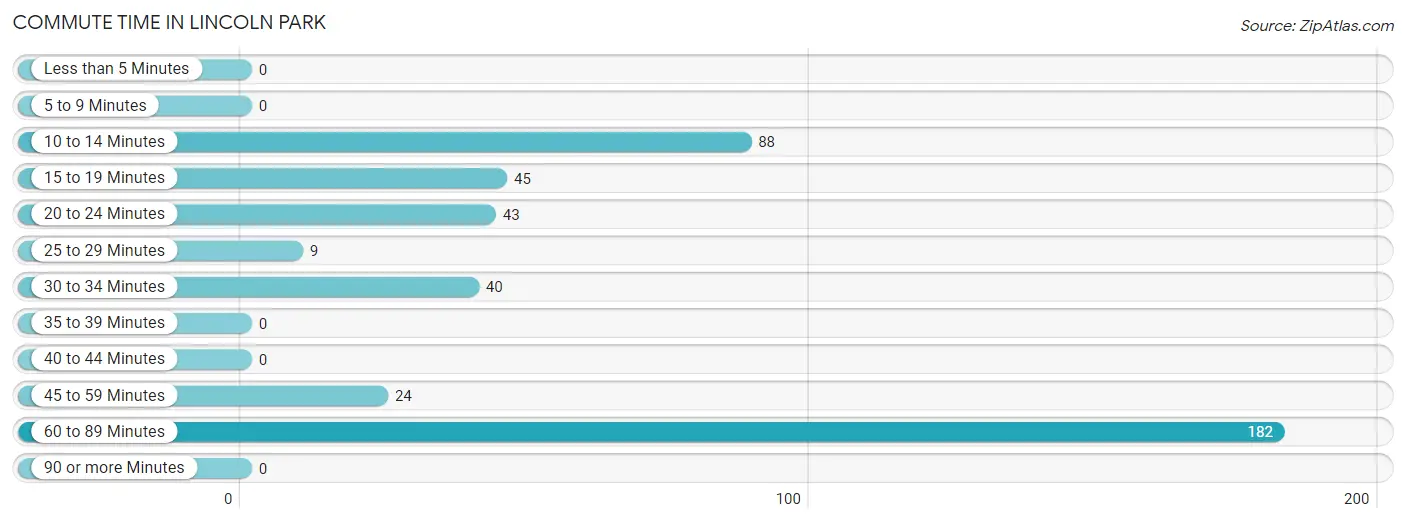
| Commute Time | # Commuters | % Commuters |
| Less than 5 Minutes | 0 | 0.0% |
| 5 to 9 Minutes | 0 | 0.0% |
| 10 to 14 Minutes | 88 | 20.4% |
| 15 to 19 Minutes | 45 | 10.4% |
| 20 to 24 Minutes | 43 | 10.0% |
| 25 to 29 Minutes | 9 | 2.1% |
| 30 to 34 Minutes | 40 | 9.3% |
| 35 to 39 Minutes | 0 | 0.0% |
| 40 to 44 Minutes | 0 | 0.0% |
| 45 to 59 Minutes | 24 | 5.6% |
| 60 to 89 Minutes | 182 | 42.2% |
| 90 or more Minutes | 0 | 0.0% |
Commute Time by Sex in Lincoln Park
The most common commute times in Lincoln Park are 60 to 89 minutes (98 commuters, 55.7%) for males and 10 to 14 minutes (88 commuters, 34.5%) for females.
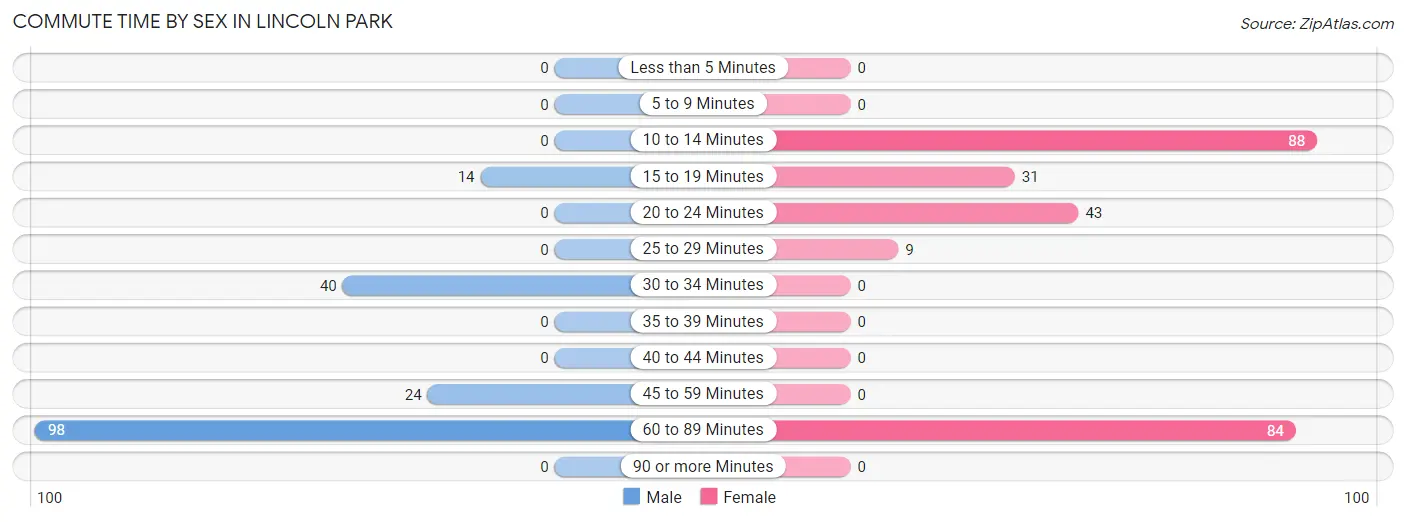
| Commute Time | Male | Female |
| Less than 5 Minutes | 0 (0.0%) | 0 (0.0%) |
| 5 to 9 Minutes | 0 (0.0%) | 0 (0.0%) |
| 10 to 14 Minutes | 0 (0.0%) | 88 (34.5%) |
| 15 to 19 Minutes | 14 (8.0%) | 31 (12.2%) |
| 20 to 24 Minutes | 0 (0.0%) | 43 (16.9%) |
| 25 to 29 Minutes | 0 (0.0%) | 9 (3.5%) |
| 30 to 34 Minutes | 40 (22.7%) | 0 (0.0%) |
| 35 to 39 Minutes | 0 (0.0%) | 0 (0.0%) |
| 40 to 44 Minutes | 0 (0.0%) | 0 (0.0%) |
| 45 to 59 Minutes | 24 (13.6%) | 0 (0.0%) |
| 60 to 89 Minutes | 98 (55.7%) | 84 (32.9%) |
| 90 or more Minutes | 0 (0.0%) | 0 (0.0%) |
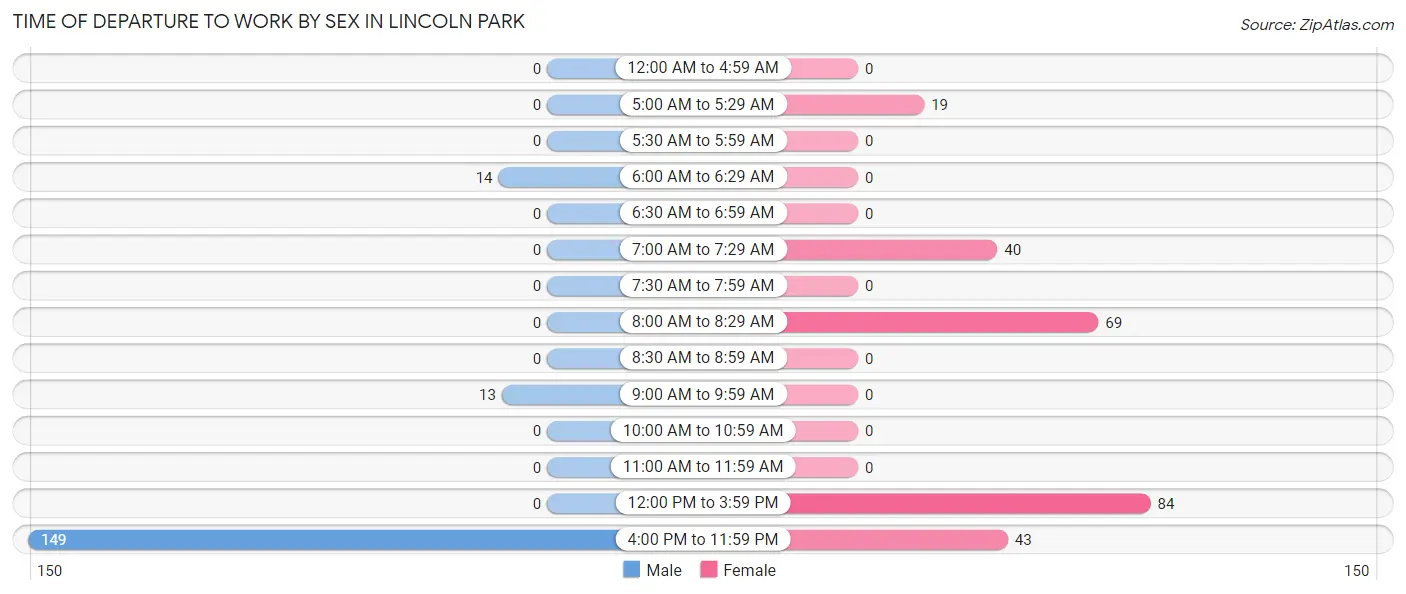
Time of Departure to Work by Sex in Lincoln Park
The most frequent times of departure to work in Lincoln Park are 4:00 PM to 11:59 PM (149, 84.7%) for males and 12:00 PM to 3:59 PM (84, 32.9%) for females.
| Time of Departure | Male | Female |
| 12:00 AM to 4:59 AM | 0 (0.0%) | 0 (0.0%) |
| 5:00 AM to 5:29 AM | 0 (0.0%) | 19 (7.4%) |
| 5:30 AM to 5:59 AM | 0 (0.0%) | 0 (0.0%) |
| 6:00 AM to 6:29 AM | 14 (8.0%) | 0 (0.0%) |
| 6:30 AM to 6:59 AM | 0 (0.0%) | 0 (0.0%) |
| 7:00 AM to 7:29 AM | 0 (0.0%) | 40 (15.7%) |
| 7:30 AM to 7:59 AM | 0 (0.0%) | 0 (0.0%) |
| 8:00 AM to 8:29 AM | 0 (0.0%) | 69 (27.1%) |
| 8:30 AM to 8:59 AM | 0 (0.0%) | 0 (0.0%) |
| 9:00 AM to 9:59 AM | 13 (7.4%) | 0 (0.0%) |
| 10:00 AM to 10:59 AM | 0 (0.0%) | 0 (0.0%) |
| 11:00 AM to 11:59 AM | 0 (0.0%) | 0 (0.0%) |
| 12:00 PM to 3:59 PM | 0 (0.0%) | 84 (32.9%) |
| 4:00 PM to 11:59 PM | 149 (84.7%) | 43 (16.9%) |
| Total | 176 (100.0%) | 255 (100.0%) |
Housing Occupancy in Lincoln Park
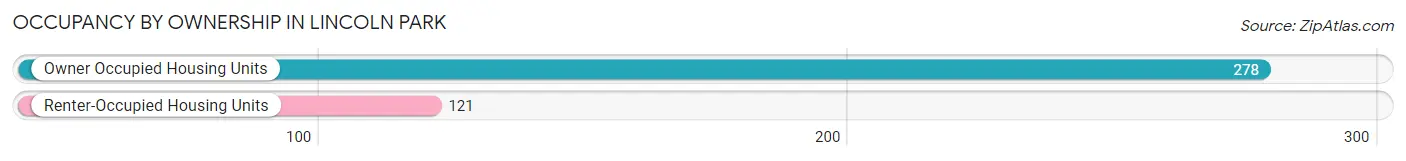
Occupancy by Ownership in Lincoln Park
Of the total 399 dwellings in Lincoln Park, owner-occupied units account for 278 (69.7%), while renter-occupied units make up 121 (30.3%).
| Occupancy | # Housing Units | % Housing Units |
| Owner Occupied Housing Units | 278 | 69.7% |
| Renter-Occupied Housing Units | 121 | 30.3% |
| Total Occupied Housing Units | 399 | 100.0% |
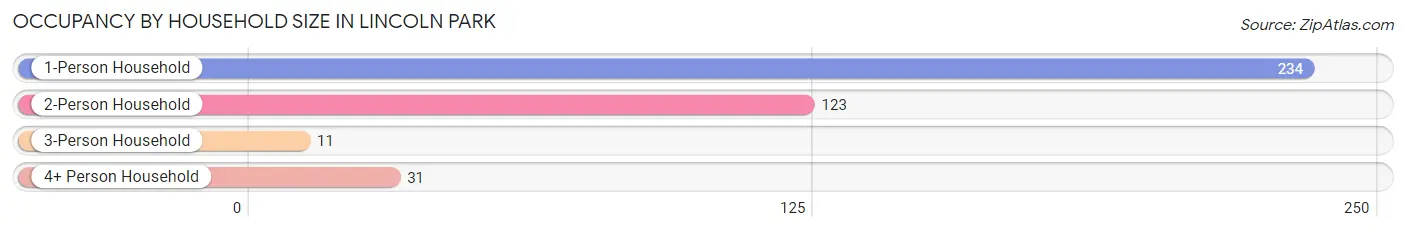
Occupancy by Household Size in Lincoln Park
| Household Size | # Housing Units | % Housing Units |
| 1-Person Household | 234 | 58.7% |
| 2-Person Household | 123 | 30.8% |
| 3-Person Household | 11 | 2.8% |
| 4+ Person Household | 31 | 7.8% |
| Total Housing Units | 399 | 100.0% |
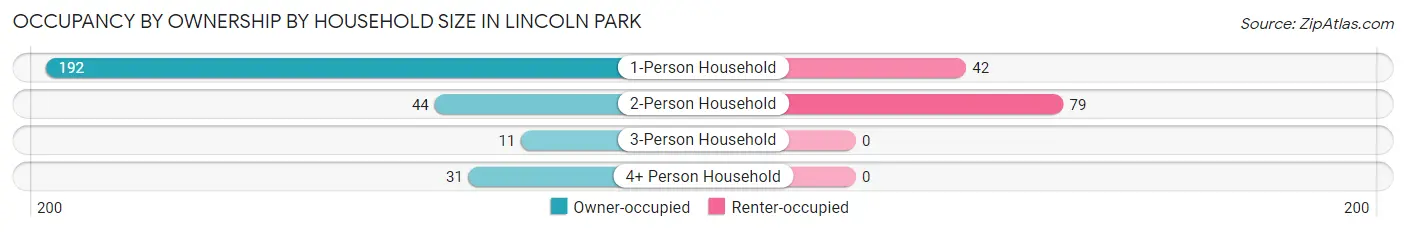
Occupancy by Ownership by Household Size in Lincoln Park
| Household Size | Owner-occupied | Renter-occupied |
| 1-Person Household | 192 (82.1%) | 42 (17.9%) |
| 2-Person Household | 44 (35.8%) | 79 (64.2%) |
| 3-Person Household | 11 (100.0%) | 0 (0.0%) |
| 4+ Person Household | 31 (100.0%) | 0 (0.0%) |
| Total Housing Units | 278 (69.7%) | 121 (30.3%) |
Occupancy by Educational Attainment in Lincoln Park
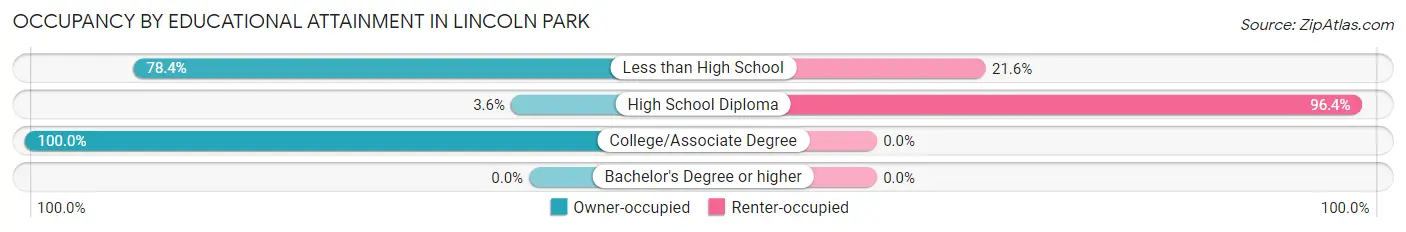
| Household Size | Owner-occupied | Renter-occupied |
| Less than High School | 149 (78.4%) | 41 (21.6%) |
| High School Diploma | 3 (3.6%) | 80 (96.4%) |
| College/Associate Degree | 126 (100.0%) | 0 (0.0%) |
| Bachelor's Degree or higher | 0 (0.0%) | 0 (0.0%) |
Occupancy by Age of Householder in Lincoln Park
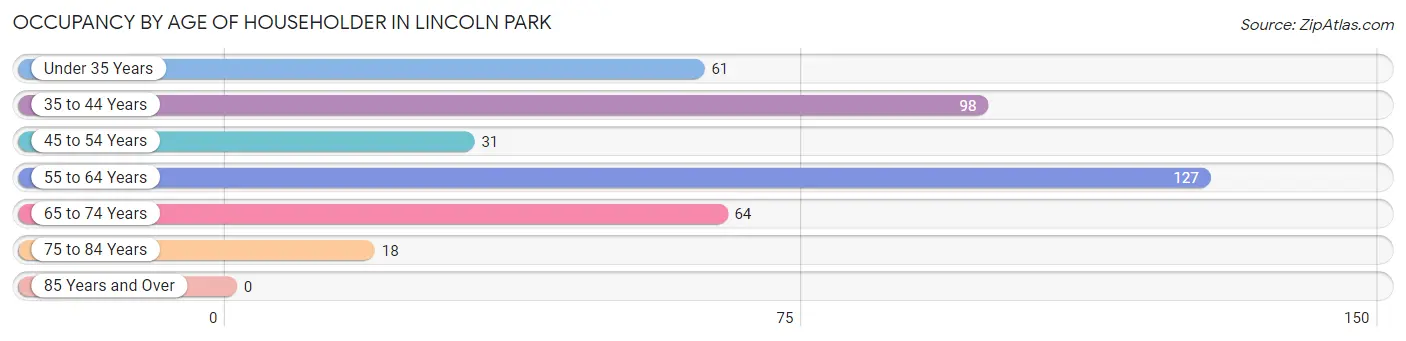
| Age Bracket | # Households | % Households |
| Under 35 Years | 61 | 15.3% |
| 35 to 44 Years | 98 | 24.6% |
| 45 to 54 Years | 31 | 7.8% |
| 55 to 64 Years | 127 | 31.8% |
| 65 to 74 Years | 64 | 16.0% |
| 75 to 84 Years | 18 | 4.5% |
| 85 Years and Over | 0 | 0.0% |
| Total | 399 | 100.0% |
Housing Finances in Lincoln Park
Median Income by Occupancy in Lincoln Park
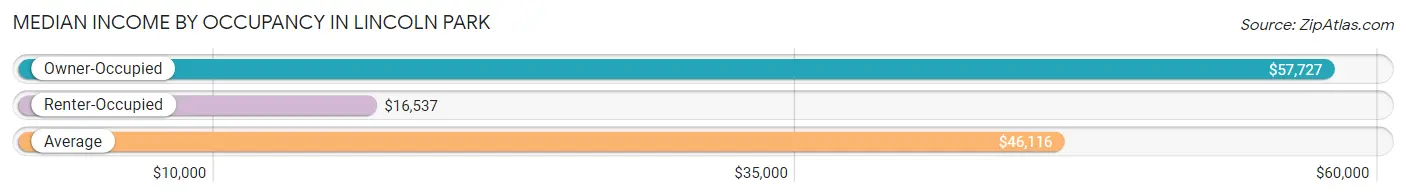
| Occupancy Type | # Households | Median Income |
| Owner-Occupied | 278 (69.7%) | $57,727 |
| Renter-Occupied | 121 (30.3%) | $16,537 |
| Average | 399 (100.0%) | $46,116 |
Occupancy by Householder Income Bracket in Lincoln Park
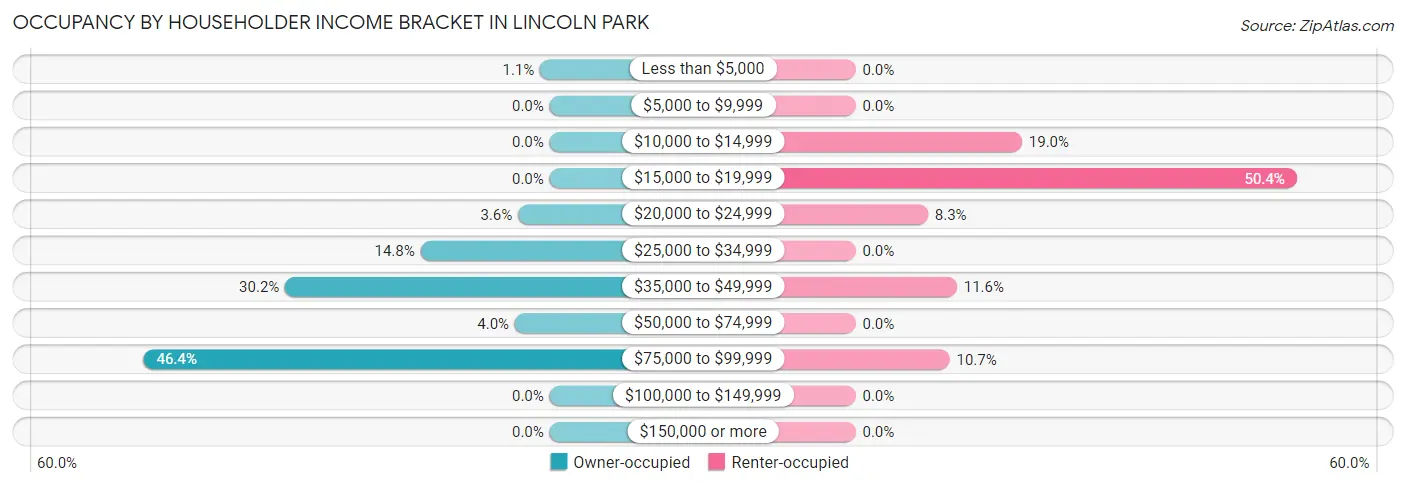
| Income Bracket | Owner-occupied | Renter-occupied |
| Less than $5,000 | 3 (1.1%) | 0 (0.0%) |
| $5,000 to $9,999 | 0 (0.0%) | 0 (0.0%) |
| $10,000 to $14,999 | 0 (0.0%) | 23 (19.0%) |
| $15,000 to $19,999 | 0 (0.0%) | 61 (50.4%) |
| $20,000 to $24,999 | 10 (3.6%) | 10 (8.3%) |
| $25,000 to $34,999 | 41 (14.7%) | 0 (0.0%) |
| $35,000 to $49,999 | 84 (30.2%) | 14 (11.6%) |
| $50,000 to $74,999 | 11 (4.0%) | 0 (0.0%) |
| $75,000 to $99,999 | 129 (46.4%) | 13 (10.7%) |
| $100,000 to $149,999 | 0 (0.0%) | 0 (0.0%) |
| $150,000 or more | 0 (0.0%) | 0 (0.0%) |
| Total | 278 (100.0%) | 121 (100.0%) |
Monthly Housing Cost Tiers in Lincoln Park
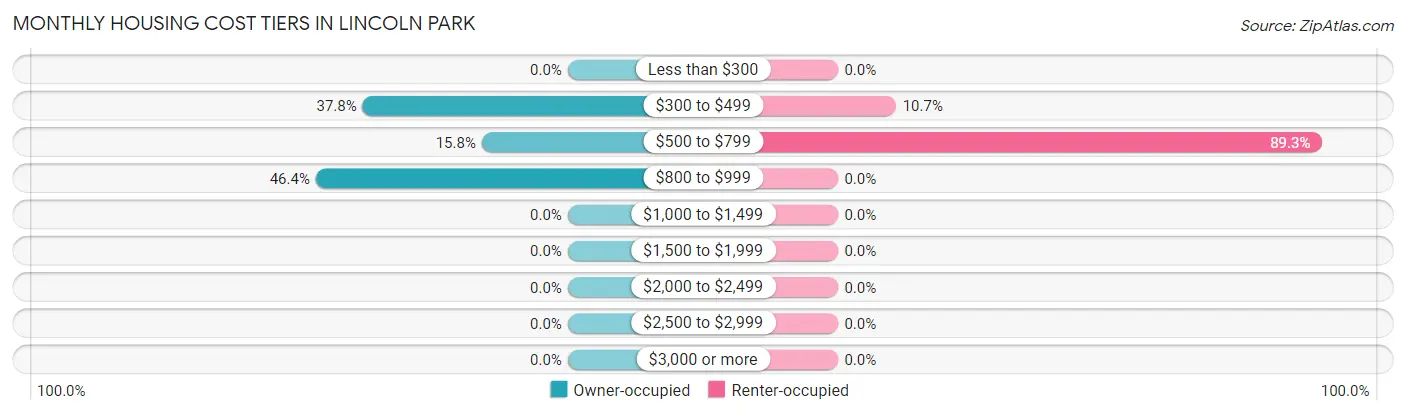
| Monthly Cost | Owner-occupied | Renter-occupied |
| Less than $300 | 0 (0.0%) | 0 (0.0%) |
| $300 to $499 | 105 (37.8%) | 13 (10.7%) |
| $500 to $799 | 44 (15.8%) | 108 (89.3%) |
| $800 to $999 | 129 (46.4%) | 0 (0.0%) |
| $1,000 to $1,499 | 0 (0.0%) | 0 (0.0%) |
| $1,500 to $1,999 | 0 (0.0%) | 0 (0.0%) |
| $2,000 to $2,499 | 0 (0.0%) | 0 (0.0%) |
| $2,500 to $2,999 | 0 (0.0%) | 0 (0.0%) |
| $3,000 or more | 0 (0.0%) | 0 (0.0%) |
| Total | 278 (100.0%) | 121 (100.0%) |
Physical Housing Characteristics in Lincoln Park
Housing Structures in Lincoln Park
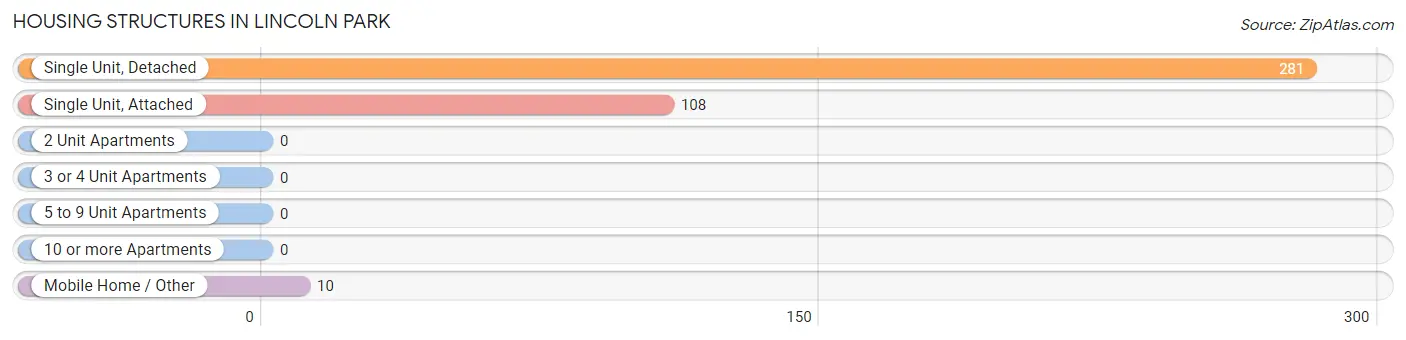
| Structure Type | # Housing Units | % Housing Units |
| Single Unit, Detached | 281 | 70.4% |
| Single Unit, Attached | 108 | 27.1% |
| 2 Unit Apartments | 0 | 0.0% |
| 3 or 4 Unit Apartments | 0 | 0.0% |
| 5 to 9 Unit Apartments | 0 | 0.0% |
| 10 or more Apartments | 0 | 0.0% |
| Mobile Home / Other | 10 | 2.5% |
| Total | 399 | 100.0% |
Housing Structures by Occupancy in Lincoln Park
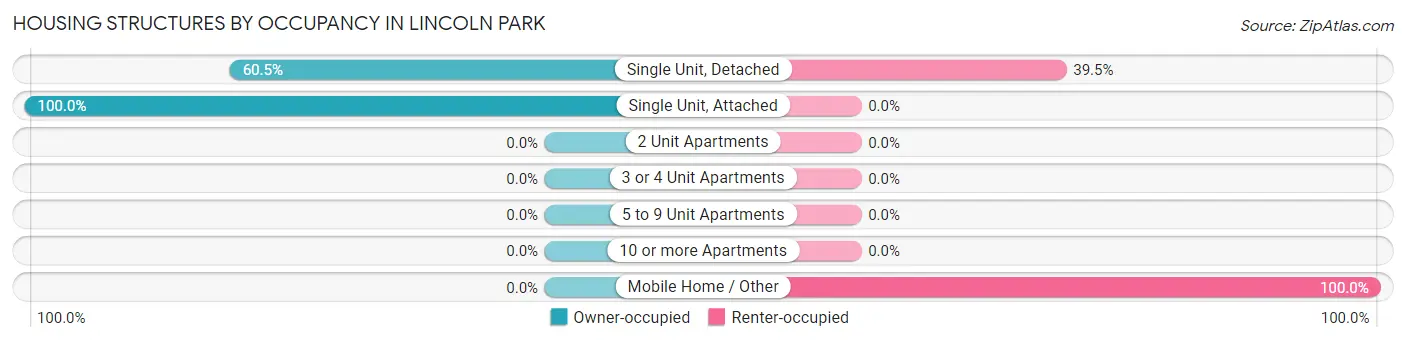
| Structure Type | Owner-occupied | Renter-occupied |
| Single Unit, Detached | 170 (60.5%) | 111 (39.5%) |
| Single Unit, Attached | 108 (100.0%) | 0 (0.0%) |
| 2 Unit Apartments | 0 (0.0%) | 0 (0.0%) |
| 3 or 4 Unit Apartments | 0 (0.0%) | 0 (0.0%) |
| 5 to 9 Unit Apartments | 0 (0.0%) | 0 (0.0%) |
| 10 or more Apartments | 0 (0.0%) | 0 (0.0%) |
| Mobile Home / Other | 0 (0.0%) | 10 (100.0%) |
| Total | 278 (69.7%) | 121 (30.3%) |
Housing Structures by Number of Rooms in Lincoln Park
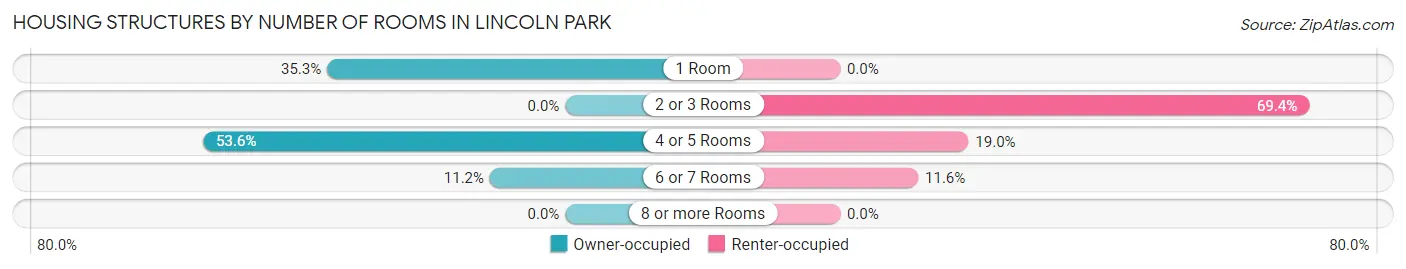
| Number of Rooms | Owner-occupied | Renter-occupied |
| 1 Room | 98 (35.2%) | 0 (0.0%) |
| 2 or 3 Rooms | 0 (0.0%) | 84 (69.4%) |
| 4 or 5 Rooms | 149 (53.6%) | 23 (19.0%) |
| 6 or 7 Rooms | 31 (11.2%) | 14 (11.6%) |
| 8 or more Rooms | 0 (0.0%) | 0 (0.0%) |
| Total | 278 (100.0%) | 121 (100.0%) |
Housing Structure by Heating Type in Lincoln Park
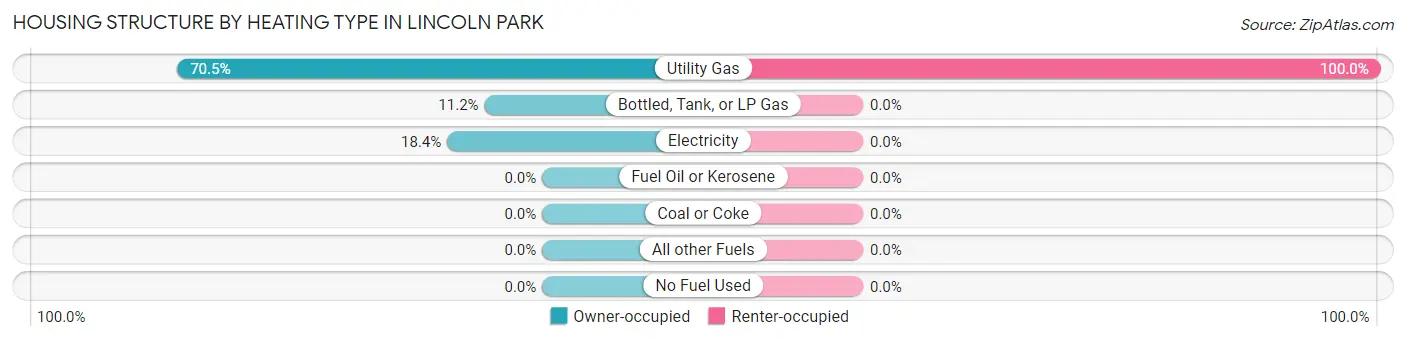
| Heating Type | Owner-occupied | Renter-occupied |
| Utility Gas | 196 (70.5%) | 121 (100.0%) |
| Bottled, Tank, or LP Gas | 31 (11.2%) | 0 (0.0%) |
| Electricity | 51 (18.3%) | 0 (0.0%) |
| Fuel Oil or Kerosene | 0 (0.0%) | 0 (0.0%) |
| Coal or Coke | 0 (0.0%) | 0 (0.0%) |
| All other Fuels | 0 (0.0%) | 0 (0.0%) |
| No Fuel Used | 0 (0.0%) | 0 (0.0%) |
| Total | 278 (100.0%) | 121 (100.0%) |
Household Vehicle Usage in Lincoln Park
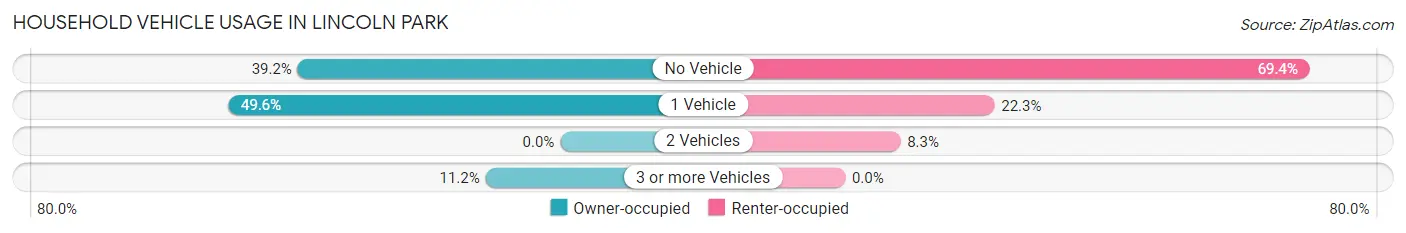
| Vehicles per Household | Owner-occupied | Renter-occupied |
| No Vehicle | 109 (39.2%) | 84 (69.4%) |
| 1 Vehicle | 138 (49.6%) | 27 (22.3%) |
| 2 Vehicles | 0 (0.0%) | 10 (8.3%) |
| 3 or more Vehicles | 31 (11.2%) | 0 (0.0%) |
| Total | 278 (100.0%) | 121 (100.0%) |
Real Estate & Mortgages in Lincoln Park
Real Estate and Mortgage Overview in Lincoln Park
| Characteristic | Without Mortgage | With Mortgage |
| Housing Units | 265 | 13 |
| Median Property Value | - | - |
| Median Household Income | $59,205 | $0 |
| Monthly Housing Costs | $791 | $0 |
| Real Estate Taxes | $1,350 | $0 |
Property Value by Mortgage Status in Lincoln Park
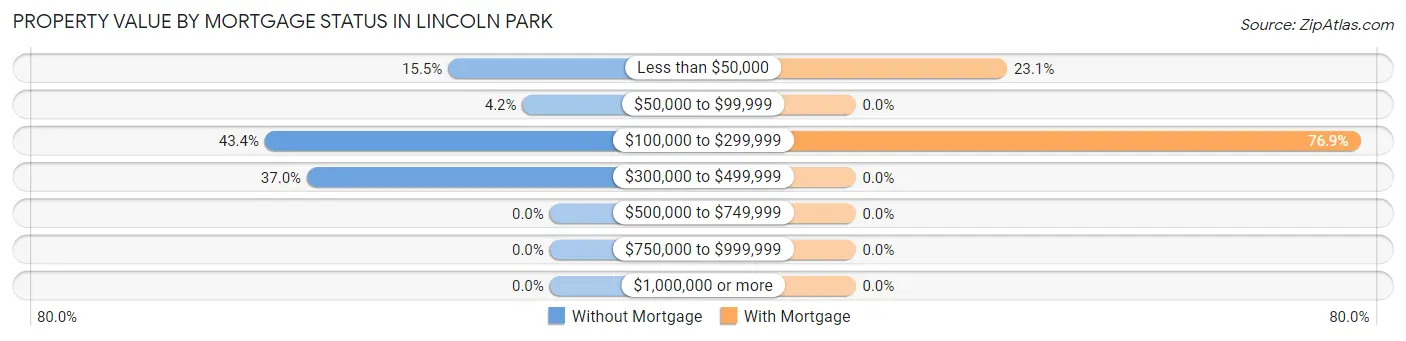
| Property Value | Without Mortgage | With Mortgage |
| Less than $50,000 | 41 (15.5%) | 3 (23.1%) |
| $50,000 to $99,999 | 11 (4.2%) | 0 (0.0%) |
| $100,000 to $299,999 | 115 (43.4%) | 10 (76.9%) |
| $300,000 to $499,999 | 98 (37.0%) | 0 (0.0%) |
| $500,000 to $749,999 | 0 (0.0%) | 0 (0.0%) |
| $750,000 to $999,999 | 0 (0.0%) | 0 (0.0%) |
| $1,000,000 or more | 0 (0.0%) | 0 (0.0%) |
| Total | 265 (100.0%) | 13 (100.0%) |
Household Income by Mortgage Status in Lincoln Park
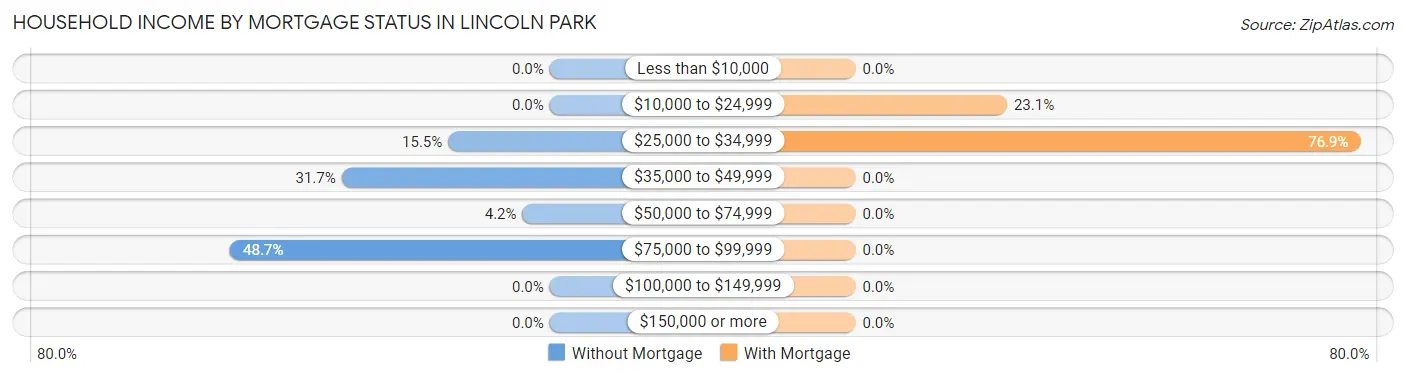
| Household Income | Without Mortgage | With Mortgage |
| Less than $10,000 | 0 (0.0%) | 0 (0.0%) |
| $10,000 to $24,999 | 0 (0.0%) | 3 (23.1%) |
| $25,000 to $34,999 | 41 (15.5%) | 10 (76.9%) |
| $35,000 to $49,999 | 84 (31.7%) | 0 (0.0%) |
| $50,000 to $74,999 | 11 (4.2%) | 0 (0.0%) |
| $75,000 to $99,999 | 129 (48.7%) | 0 (0.0%) |
| $100,000 to $149,999 | 0 (0.0%) | 0 (0.0%) |
| $150,000 or more | 0 (0.0%) | 0 (0.0%) |
| Total | 265 (100.0%) | 13 (100.0%) |
Property Value to Household Income Ratio in Lincoln Park
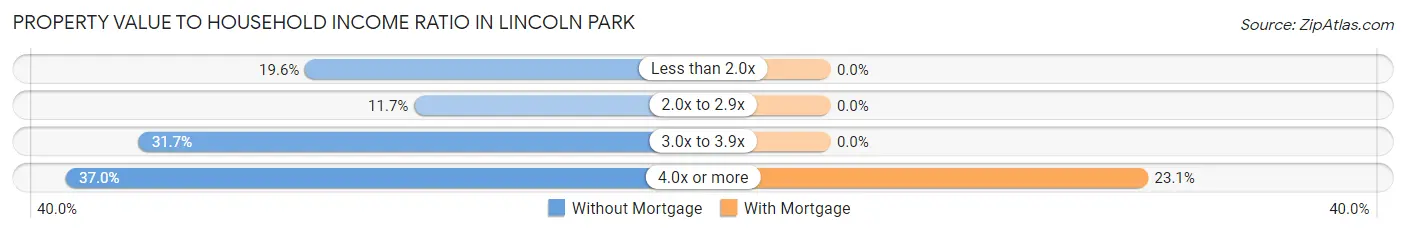
| Value-to-Income Ratio | Without Mortgage | With Mortgage |
| Less than 2.0x | 52 (19.6%) | 0 (0.0%) |
| 2.0x to 2.9x | 31 (11.7%) | 0 (0.0%) |
| 3.0x to 3.9x | 84 (31.7%) | 0 (0.0%) |
| 4.0x or more | 98 (37.0%) | 3 (23.1%) |
| Total | 265 (100.0%) | 13 (100.0%) |
Real Estate Taxes by Mortgage Status in Lincoln Park
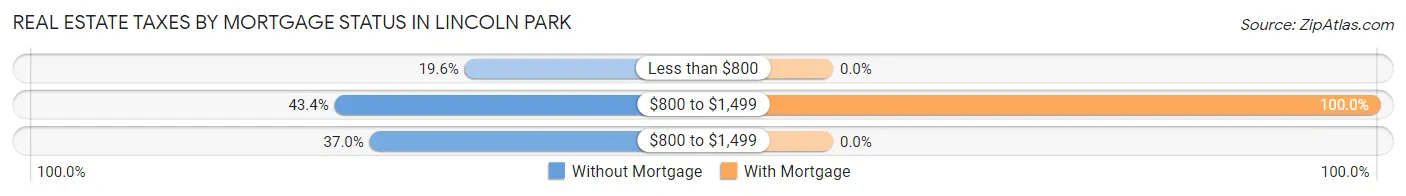
| Property Taxes | Without Mortgage | With Mortgage |
| Less than $800 | 52 (19.6%) | 0 (0.0%) |
| $800 to $1,499 | 115 (43.4%) | 13 (100.0%) |
| $800 to $1,499 | 98 (37.0%) | 0 (0.0%) |
| Total | 265 (100.0%) | 13 (100.0%) |
Health & Disability in Lincoln Park
Health Insurance Coverage by Age in Lincoln Park
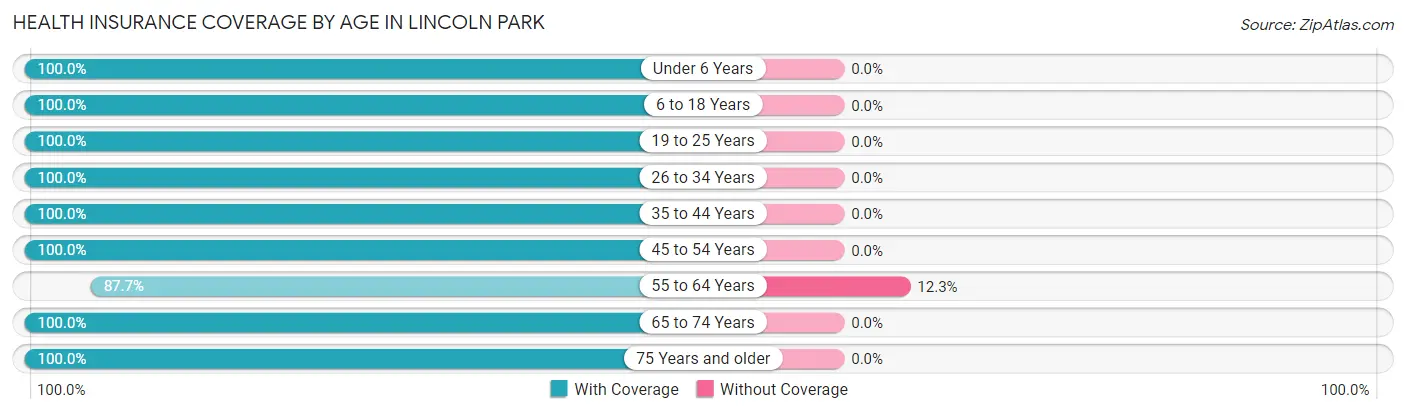
| Age Bracket | With Coverage | Without Coverage |
| Under 6 Years | 45 (100.0%) | 0 (0.0%) |
| 6 to 18 Years | 43 (100.0%) | 0 (0.0%) |
| 19 to 25 Years | 69 (100.0%) | 0 (0.0%) |
| 26 to 34 Years | 104 (100.0%) | 0 (0.0%) |
| 35 to 44 Years | 125 (100.0%) | 0 (0.0%) |
| 45 to 54 Years | 64 (100.0%) | 0 (0.0%) |
| 55 to 64 Years | 128 (87.7%) | 18 (12.3%) |
| 65 to 74 Years | 97 (100.0%) | 0 (0.0%) |
| 75 Years and older | 46 (100.0%) | 0 (0.0%) |
| Total | 721 (97.6%) | 18 (2.4%) |
Health Insurance Coverage by Citizenship Status in Lincoln Park
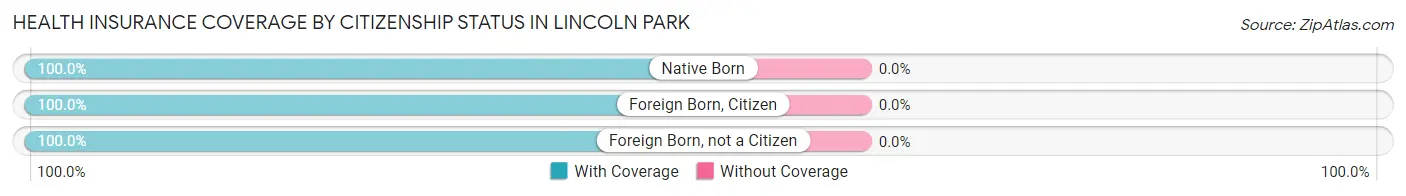
| Citizenship Status | With Coverage | Without Coverage |
| Native Born | 45 (100.0%) | 0 (0.0%) |
| Foreign Born, Citizen | 43 (100.0%) | 0 (0.0%) |
| Foreign Born, not a Citizen | 69 (100.0%) | 0 (0.0%) |
Health Insurance Coverage by Household Income in Lincoln Park
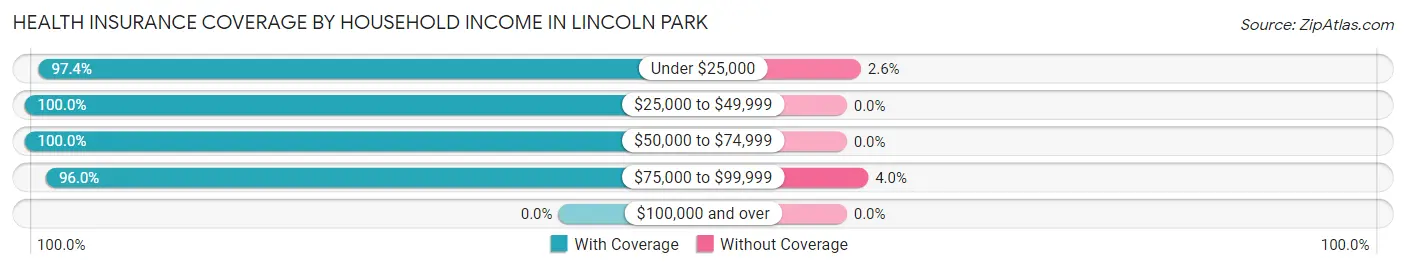
| Household Income | With Coverage | Without Coverage |
| Under $25,000 | 185 (97.4%) | 5 (2.6%) |
| $25,000 to $49,999 | 167 (100.0%) | 0 (0.0%) |
| $50,000 to $74,999 | 58 (100.0%) | 0 (0.0%) |
| $75,000 to $99,999 | 311 (96.0%) | 13 (4.0%) |
| $100,000 and over | 0 (0.0%) | 0 (0.0%) |
Public vs Private Health Insurance Coverage by Age in Lincoln Park
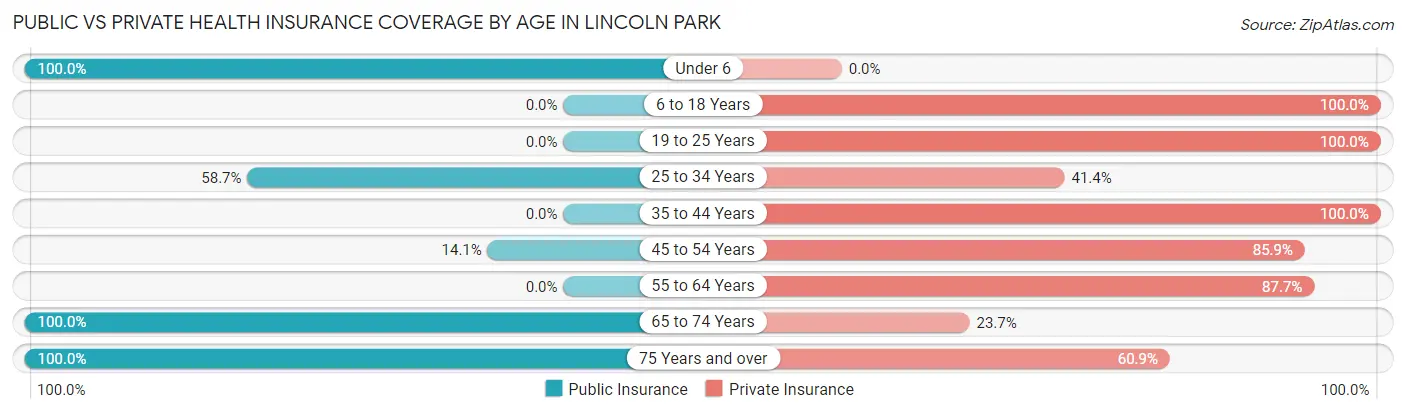
| Age Bracket | Public Insurance | Private Insurance |
| Under 6 | 45 (100.0%) | 0 (0.0%) |
| 6 to 18 Years | 0 (0.0%) | 43 (100.0%) |
| 19 to 25 Years | 0 (0.0%) | 69 (100.0%) |
| 25 to 34 Years | 61 (58.7%) | 43 (41.3%) |
| 35 to 44 Years | 0 (0.0%) | 125 (100.0%) |
| 45 to 54 Years | 9 (14.1%) | 55 (85.9%) |
| 55 to 64 Years | 0 (0.0%) | 128 (87.7%) |
| 65 to 74 Years | 97 (100.0%) | 23 (23.7%) |
| 75 Years and over | 46 (100.0%) | 28 (60.9%) |
| Total | 258 (34.9%) | 514 (69.6%) |
Disability Status by Sex by Age in Lincoln Park
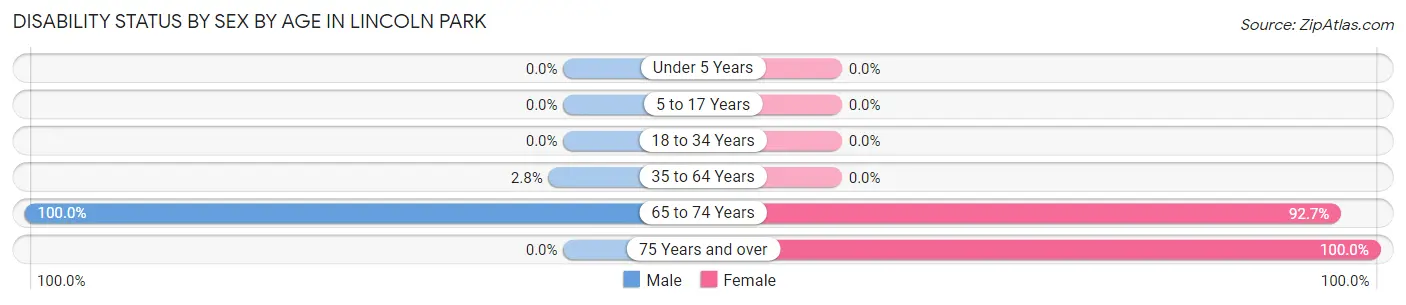
| Age Bracket | Male | Female |
| Under 5 Years | 0 (0.0%) | 0 (0.0%) |
| 5 to 17 Years | 0 (0.0%) | 0 (0.0%) |
| 18 to 34 Years | 0 (0.0%) | 0 (0.0%) |
| 35 to 64 Years | 5 (2.8%) | 0 (0.0%) |
| 65 to 74 Years | 56 (100.0%) | 38 (92.7%) |
| 75 Years and over | 0 (0.0%) | 46 (100.0%) |
Disability Class by Sex by Age in Lincoln Park
Disability Class: Hearing Difficulty
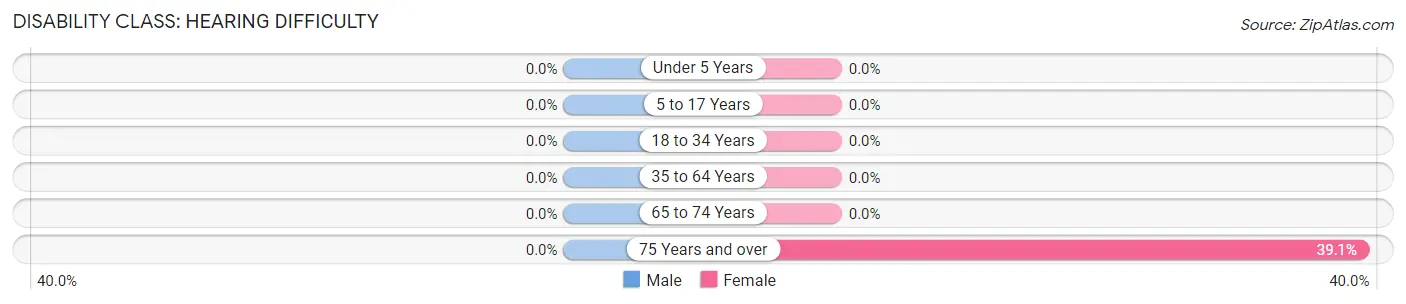
| Age Bracket | Male | Female |
| Under 5 Years | 0 (0.0%) | 0 (0.0%) |
| 5 to 17 Years | 0 (0.0%) | 0 (0.0%) |
| 18 to 34 Years | 0 (0.0%) | 0 (0.0%) |
| 35 to 64 Years | 0 (0.0%) | 0 (0.0%) |
| 65 to 74 Years | 0 (0.0%) | 0 (0.0%) |
| 75 Years and over | 0 (0.0%) | 18 (39.1%) |
Disability Class: Vision Difficulty
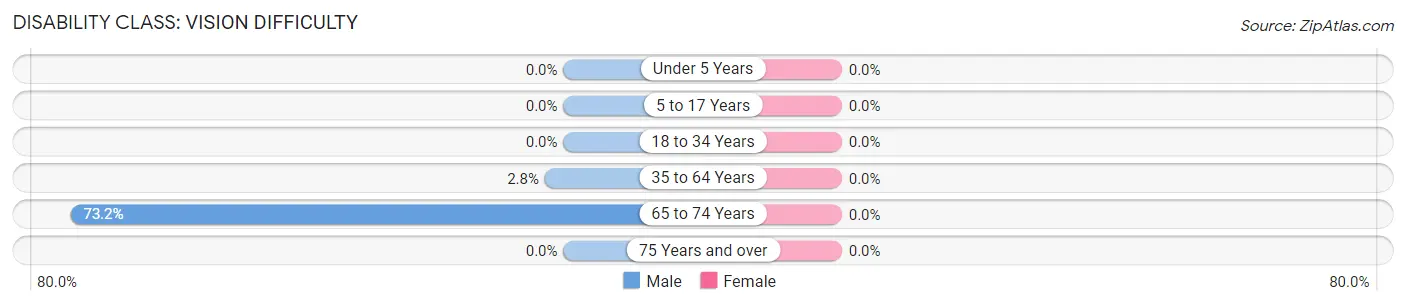
| Age Bracket | Male | Female |
| Under 5 Years | 0 (0.0%) | 0 (0.0%) |
| 5 to 17 Years | 0 (0.0%) | 0 (0.0%) |
| 18 to 34 Years | 0 (0.0%) | 0 (0.0%) |
| 35 to 64 Years | 5 (2.8%) | 0 (0.0%) |
| 65 to 74 Years | 41 (73.2%) | 0 (0.0%) |
| 75 Years and over | 0 (0.0%) | 0 (0.0%) |
Disability Class: Cognitive Difficulty
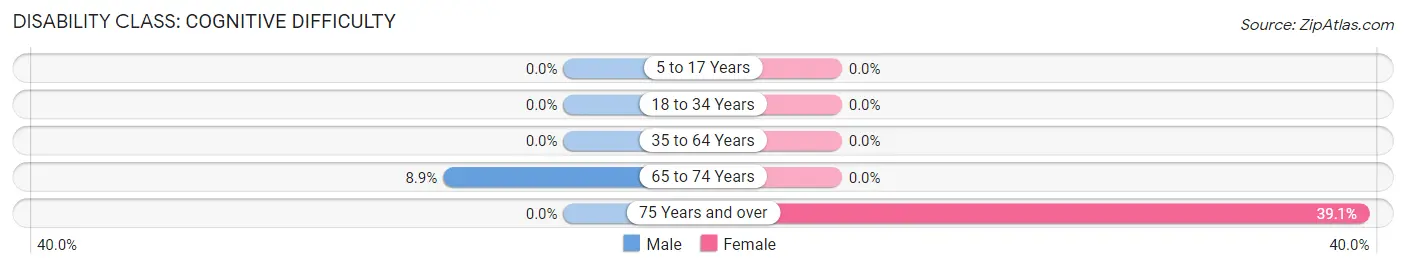
| Age Bracket | Male | Female |
| 5 to 17 Years | 0 (0.0%) | 0 (0.0%) |
| 18 to 34 Years | 0 (0.0%) | 0 (0.0%) |
| 35 to 64 Years | 0 (0.0%) | 0 (0.0%) |
| 65 to 74 Years | 5 (8.9%) | 0 (0.0%) |
| 75 Years and over | 0 (0.0%) | 18 (39.1%) |
Disability Class: Ambulatory Difficulty
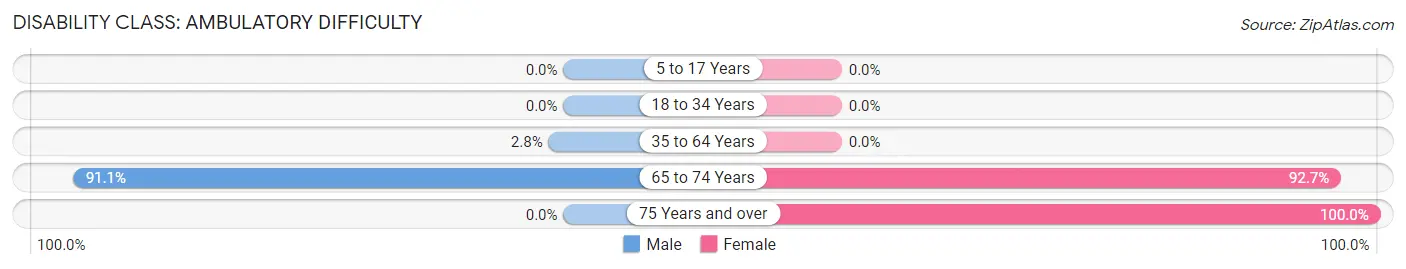
| Age Bracket | Male | Female |
| 5 to 17 Years | 0 (0.0%) | 0 (0.0%) |
| 18 to 34 Years | 0 (0.0%) | 0 (0.0%) |
| 35 to 64 Years | 5 (2.8%) | 0 (0.0%) |
| 65 to 74 Years | 51 (91.1%) | 38 (92.7%) |
| 75 Years and over | 0 (0.0%) | 46 (100.0%) |
Disability Class: Self-Care Difficulty
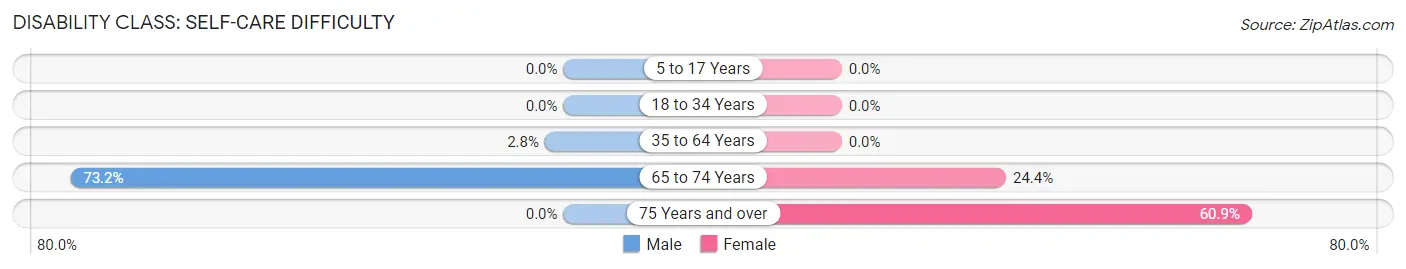
| Age Bracket | Male | Female |
| 5 to 17 Years | 0 (0.0%) | 0 (0.0%) |
| 18 to 34 Years | 0 (0.0%) | 0 (0.0%) |
| 35 to 64 Years | 5 (2.8%) | 0 (0.0%) |
| 65 to 74 Years | 41 (73.2%) | 10 (24.4%) |
| 75 Years and over | 0 (0.0%) | 28 (60.9%) |
Technology Access in Lincoln Park
Computing Device Access in Lincoln Park
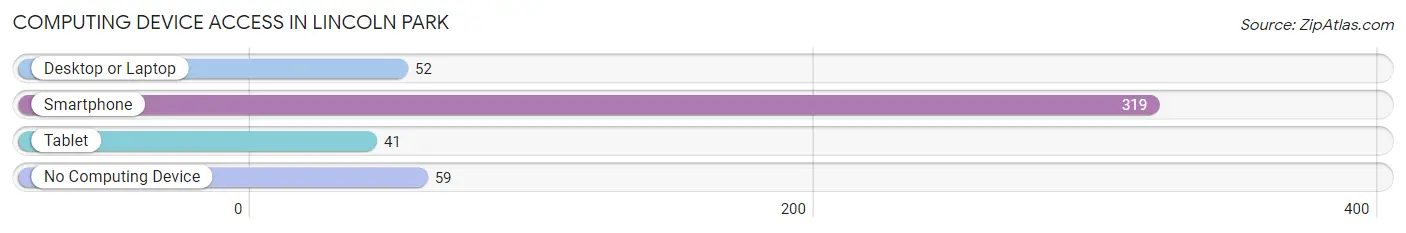
| Device Type | # Households | % Households |
| Desktop or Laptop | 52 | 13.0% |
| Smartphone | 319 | 79.9% |
| Tablet | 41 | 10.3% |
| No Computing Device | 59 | 14.8% |
| Total | 399 | 100.0% |
Internet Access in Lincoln Park
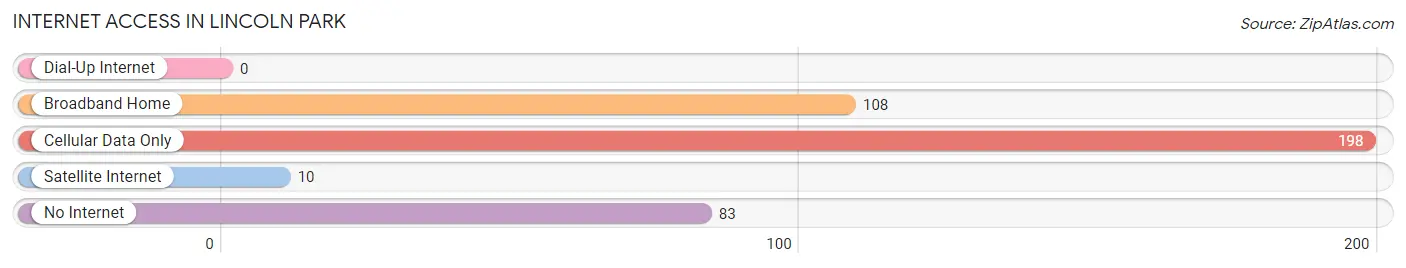
| Internet Type | # Households | % Households |
| Dial-Up Internet | 0 | 0.0% |
| Broadband Home | 108 | 27.1% |
| Cellular Data Only | 198 | 49.6% |
| Satellite Internet | 10 | 2.5% |
| No Internet | 83 | 20.8% |
| Total | 399 | 100.0% |
Lincoln Park Summary
Lincoln Park is a small city located in the state of Georgia, United States. It is situated in the southwestern part of the state, in the county of Muscogee. The city has a population of approximately 2,000 people, according to the 2010 census.
History
Lincoln Park was founded in 1887 by a group of African-American settlers who had recently moved to the area from South Carolina. The city was named after President Abraham Lincoln, who had recently been assassinated. The settlers were looking for a place to call home and found the area to be suitable for farming and other activities.
The city was incorporated in 1891 and quickly grew in population. By the early 1900s, the city had become a thriving community with a variety of businesses, churches, and schools. The city was also home to a number of African-American businesses, including a barber shop, a grocery store, and a hotel.
In the 1920s, the city experienced a period of growth and development. The city was home to a number of businesses, including a movie theater, a bank, and a post office. The city also had a number of churches, including the First African Methodist Episcopal Church, which was founded in 1921.
In the 1950s, the city experienced a period of decline. Many of the businesses and churches closed, and the population began to decline. In the 1970s, the city began to experience a period of revitalization. The city was home to a number of new businesses, including a shopping center and a library.
Geography
Lincoln Park is located in the southwestern part of the state of Georgia, in the county of Muscogee. The city is situated on the banks of the Chattahoochee River, which is the border between Georgia and Alabama. The city is located approximately 20 miles south of Columbus, the county seat of Muscogee County.
The city has a total area of 1.2 square miles, all of which is land. The city is located at an elevation of approximately 500 feet above sea level. The climate in the area is characterized by hot, humid summers and mild winters.
Economy
The economy of Lincoln Park is largely based on the service industry. The city is home to a number of businesses, including restaurants, retail stores, and medical offices. The city is also home to a number of manufacturing companies, including a furniture factory and a plastics factory.
The city is also home to a number of government offices, including the Muscogee County Courthouse and the Muscogee County Sheriff's Office. The city is also home to a number of educational institutions, including a public elementary school and a public high school.
Demographics
According to the 2010 census, the population of Lincoln Park was 2,000 people. The racial makeup of the city was 79.2% African American, 17.2% White, 1.2% Asian, 0.6% Native American, and 1.8% from other races. The median household income in the city was $25,000, and the median family income was $30,000. The per capita income in the city was $14,000.
Conclusion
Lincoln Park is a small city located in the state of Georgia, United States. It is situated in the southwestern part of the state, in the county of Muscogee. The city has a population of approximately 2,000 people, according to the 2010 census. The city was founded in 1887 by a group of African-American settlers and was named after President Abraham Lincoln. The economy of the city is largely based on the service industry, and the city is home to a number of businesses, government offices, and educational institutions. The racial makeup of the city is 79.2% African American, 17.2% White, 1.2% Asian, 0.6% Native American, and 1.8% from other races. The median household income in the city was $25,000, and the median family income was $30,000.
Common Questions
What is Per Capita Income in Lincoln Park?
Per Capita income in Lincoln Park is $28,736.
What is the Median Household income in Lincoln Park?
Median Household Income in Lincoln Park is $46,116.
What is Income or Wage Gap in Lincoln Park?
Income or Wage Gap in Lincoln Park is 49.2%.
Women in Lincoln Park earn 50.8 cents for every dollar earned by a man.
What is Inequality or Gini Index in Lincoln Park?
Inequality or Gini Index in Lincoln Park is 0.30.
What is the Total Population of Lincoln Park?
Total Population of Lincoln Park is 739.
What is the Total Male Population of Lincoln Park?
Total Male Population of Lincoln Park is 298.
What is the Total Female Population of Lincoln Park?
Total Female Population of Lincoln Park is 441.
What is the Ratio of Males per 100 Females in Lincoln Park?
There are 67.57 Males per 100 Females in Lincoln Park.
What is the Ratio of Females per 100 Males in Lincoln Park?
There are 147.99 Females per 100 Males in Lincoln Park.
What is the Median Population Age in Lincoln Park?
Median Population Age in Lincoln Park is 41.8 Years.
What is the Average Family Size in Lincoln Park
Average Family Size in Lincoln Park is 3.6 People.
What is the Average Household Size in Lincoln Park
Average Household Size in Lincoln Park is 1.9 People.
How Large is the Labor Force in Lincoln Park?
There are 431 People in the Labor Forcein in Lincoln Park.
What is the Percentage of People in the Labor Force in Lincoln Park?
62.1% of People are in the Labor Force in Lincoln Park.