Twin City, GA Map & Demographics
Twin City Map
Twin City Overview
$21,760
PER CAPITA INCOME
$38,409
AVG FAMILY INCOME
$36,498
AVG HOUSEHOLD INCOME
16.5%
WAGE / INCOME GAP [ % ]
83.5¢/ $1
WAGE / INCOME GAP [ $ ]
$16,783
FAMILY INCOME DEFICIT
0.42
INEQUALITY / GINI INDEX
1,849
TOTAL POPULATION
1,181
MALE POPULATION
668
FEMALE POPULATION
176.80
MALES / 100 FEMALES
56.56
FEMALES / 100 MALES
43.0
MEDIAN AGE
3.2
AVG FAMILY SIZE
2.5
AVG HOUSEHOLD SIZE
690
LABOR FORCE [ PEOPLE ]
42.2%
PERCENT IN LABOR FORCE
10.4%
UNEMPLOYMENT RATE
Twin City Zip Codes
Income in Twin City
Income Overview in Twin City
Per Capita Income in Twin City is $21,760, while median incomes of families and households are $38,409 and $36,498 respectively.
| Characteristic | Number | Measure |
| Per Capita Income | 1,849 | $21,760 |
| Median Family Income | 360 | $38,409 |
| Mean Family Income | 360 | $60,906 |
| Median Household Income | 597 | $36,498 |
| Mean Household Income | 597 | $48,838 |
| Income Deficit | 360 | $16,783 |
| Wage / Income Gap (%) | 1,849 | 16.54% |
| Wage / Income Gap ($) | 1,849 | 83.46¢ per $1 |
| Gini / Inequality Index | 1,849 | 0.42 |
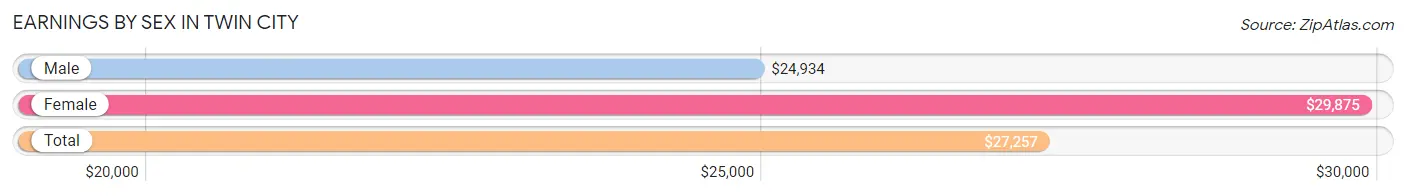
Earnings by Sex in Twin City
Average Earnings in Twin City are $27,257, $24,934 for men and $29,875 for women, a difference of 16.5%.
| Sex | Number | Average Earnings |
| Male | 597 (70.0%) | $24,934 |
| Female | 256 (30.0%) | $29,875 |
| Total | 853 (100.0%) | $27,257 |
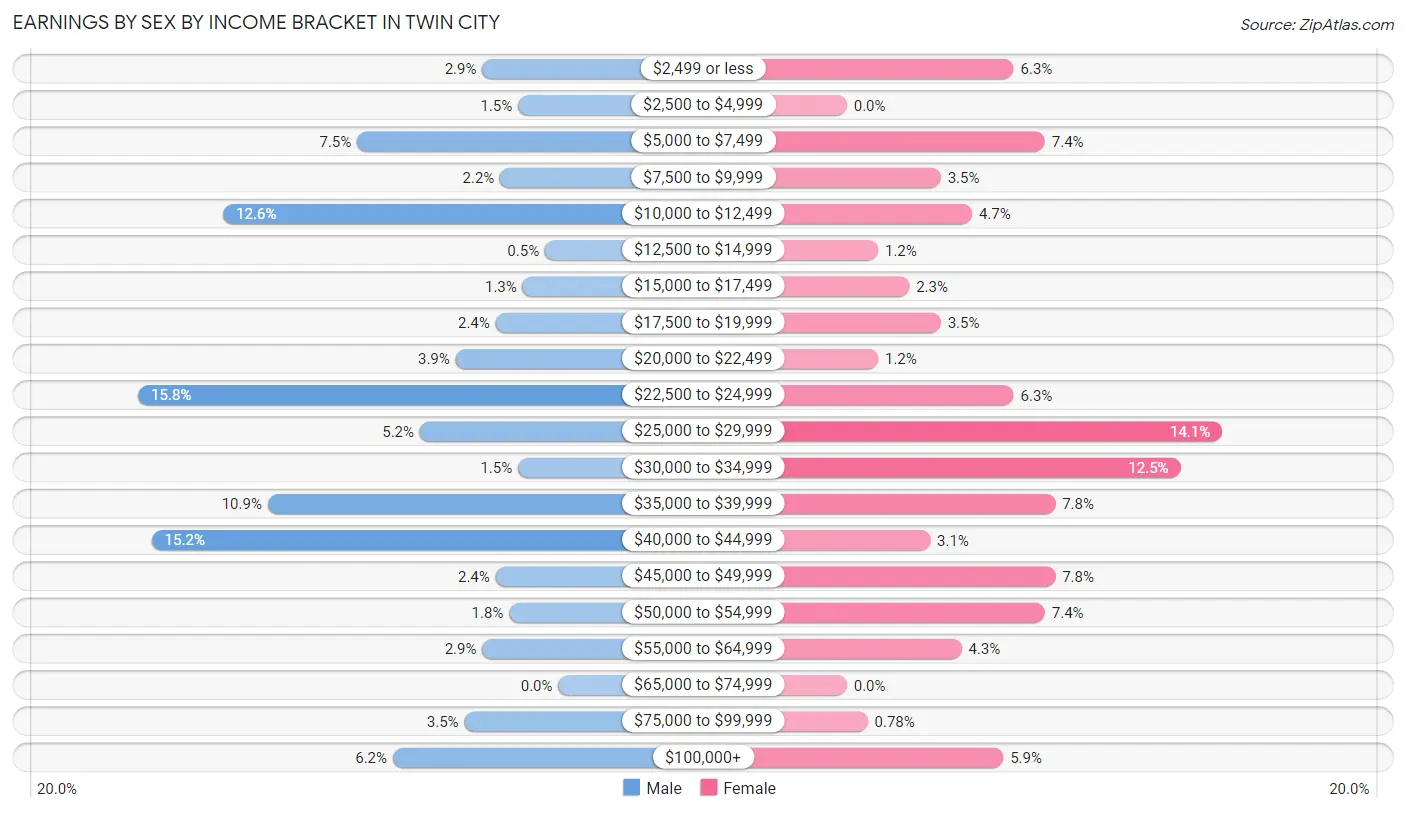
Earnings by Sex by Income Bracket in Twin City
The most common earnings brackets in Twin City are $22,500 to $24,999 for men (94 | 15.8%) and $25,000 to $29,999 for women (36 | 14.1%).
| Income | Male | Female |
| $2,499 or less | 17 (2.9%) | 16 (6.2%) |
| $2,500 to $4,999 | 9 (1.5%) | 0 (0.0%) |
| $5,000 to $7,499 | 45 (7.5%) | 19 (7.4%) |
| $7,500 to $9,999 | 13 (2.2%) | 9 (3.5%) |
| $10,000 to $12,499 | 75 (12.6%) | 12 (4.7%) |
| $12,500 to $14,999 | 3 (0.5%) | 3 (1.2%) |
| $15,000 to $17,499 | 8 (1.3%) | 6 (2.3%) |
| $17,500 to $19,999 | 14 (2.4%) | 9 (3.5%) |
| $20,000 to $22,499 | 23 (3.8%) | 3 (1.2%) |
| $22,500 to $24,999 | 94 (15.8%) | 16 (6.2%) |
| $25,000 to $29,999 | 31 (5.2%) | 36 (14.1%) |
| $30,000 to $34,999 | 9 (1.5%) | 32 (12.5%) |
| $35,000 to $39,999 | 65 (10.9%) | 20 (7.8%) |
| $40,000 to $44,999 | 91 (15.2%) | 8 (3.1%) |
| $45,000 to $49,999 | 14 (2.4%) | 20 (7.8%) |
| $50,000 to $54,999 | 11 (1.8%) | 19 (7.4%) |
| $55,000 to $64,999 | 17 (2.9%) | 11 (4.3%) |
| $65,000 to $74,999 | 0 (0.0%) | 0 (0.0%) |
| $75,000 to $99,999 | 21 (3.5%) | 2 (0.8%) |
| $100,000+ | 37 (6.2%) | 15 (5.9%) |
| Total | 597 (100.0%) | 256 (100.0%) |
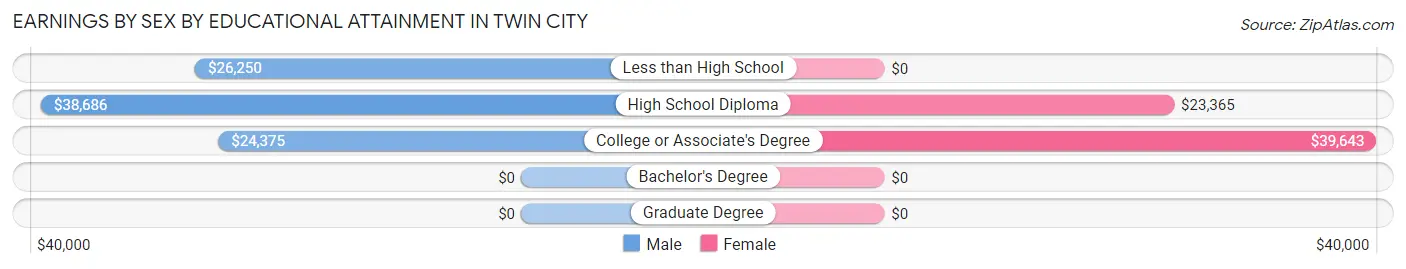
Earnings by Sex by Educational Attainment in Twin City
Average earnings in Twin City are $28,636 for men and $32,740 for women, a difference of 12.5%. Men with an educational attainment of high school diploma enjoy the highest average annual earnings of $38,686, while those with college or associate's degree education earn the least with $24,375. Women with an educational attainment of college or associate's degree earn the most with the average annual earnings of $39,643, while those with high school diploma education have the smallest earnings of $23,365.
| Educational Attainment | Male Income | Female Income |
| Less than High School | $26,250 | $0 |
| High School Diploma | $38,686 | $23,365 |
| College or Associate's Degree | $24,375 | $39,643 |
| Bachelor's Degree | - | - |
| Graduate Degree | - | - |
| Total | $28,636 | $32,740 |
Family Income in Twin City
Family Income Brackets in Twin City
According to the Twin City family income data, there are 105 families falling into the $35,000 to $49,999 income range, which is the most common income bracket and makes up 29.2% of all families. Conversely, the $200,000+ income bracket is the least frequent group with only 3 families (0.8%) belonging to this category.
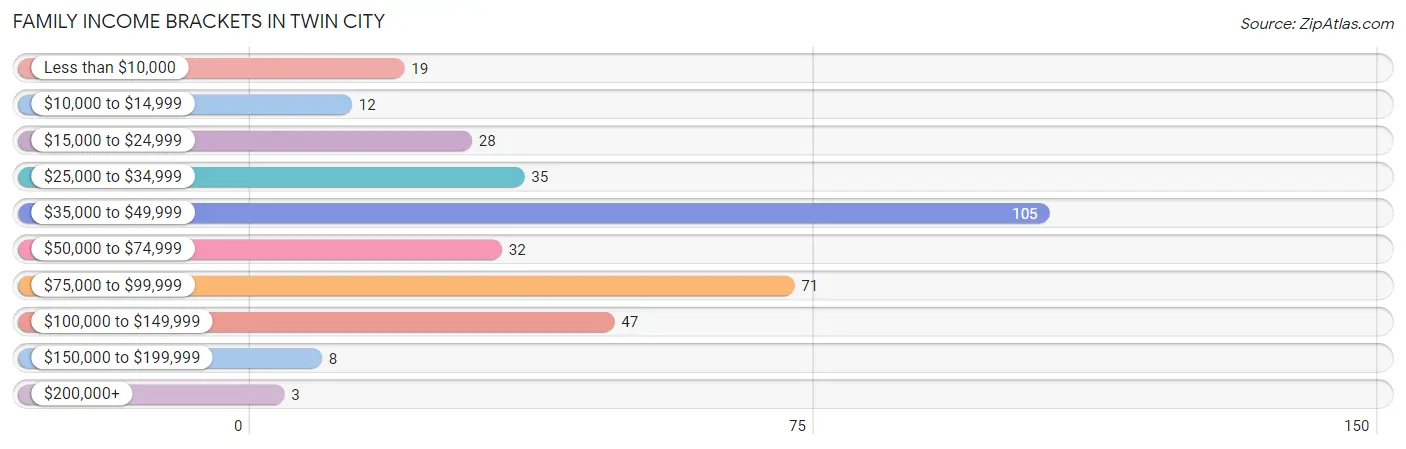
| Income Bracket | # Families | % Families |
| Less than $10,000 | 19 | 5.3% |
| $10,000 to $14,999 | 12 | 3.3% |
| $15,000 to $24,999 | 28 | 7.8% |
| $25,000 to $34,999 | 35 | 9.7% |
| $35,000 to $49,999 | 105 | 29.2% |
| $50,000 to $74,999 | 32 | 8.9% |
| $75,000 to $99,999 | 71 | 19.7% |
| $100,000 to $149,999 | 47 | 13.1% |
| $150,000 to $199,999 | 8 | 2.2% |
| $200,000+ | 3 | 0.8% |
Family Income by Famaliy Size in Twin City
4-person families (69 | 19.2%) account for the highest median family income in Twin City with $91,688 per family, while 3-person families (34 | 9.4%) have the highest median income of $23,021 per family member.
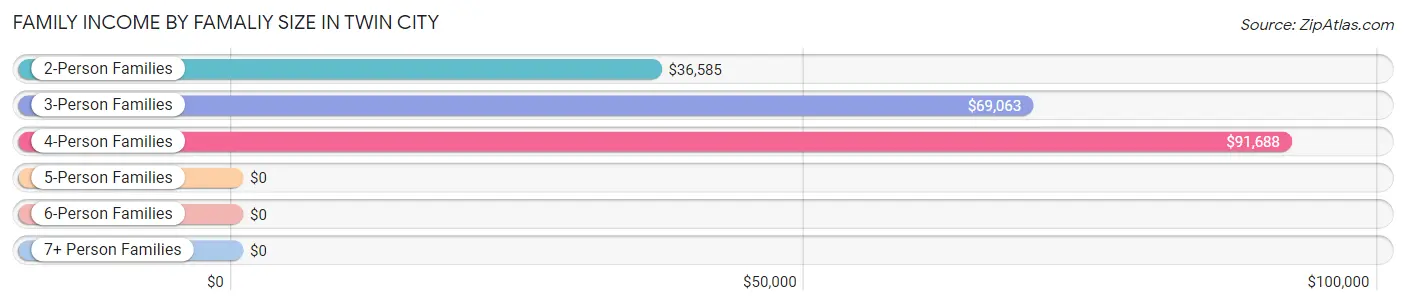
| Income Bracket | # Families | Median Income |
| 2-Person Families | 238 (66.1%) | $36,585 |
| 3-Person Families | 34 (9.4%) | $69,063 |
| 4-Person Families | 69 (19.2%) | $91,688 |
| 5-Person Families | 17 (4.7%) | $0 |
| 6-Person Families | 0 (0.0%) | $0 |
| 7+ Person Families | 2 (0.6%) | $0 |
| Total | 360 (100.0%) | $38,409 |
Family Income by Number of Earners in Twin City
The median family income in Twin City is $38,409, with families comprising 3+ earners (35) having the highest median family income of $128,672, while families with no earners (104) have the lowest median family income of $31,429, accounting for 9.7% and 28.9% of families, respectively.
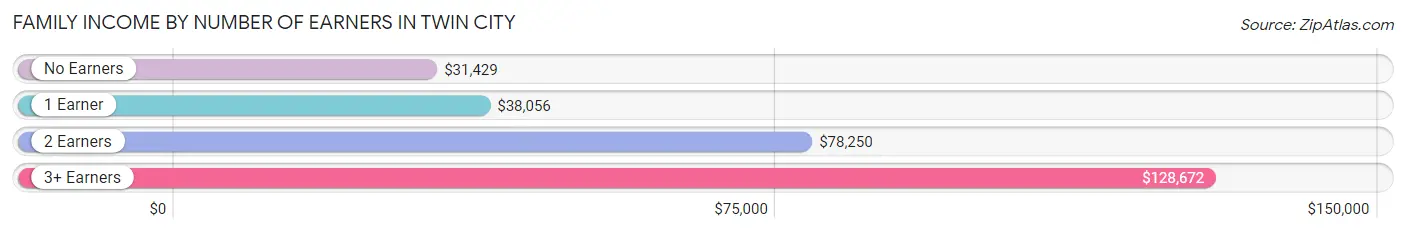
| Number of Earners | # Families | Median Income |
| No Earners | 104 (28.9%) | $31,429 |
| 1 Earner | 142 (39.4%) | $38,056 |
| 2 Earners | 79 (21.9%) | $78,250 |
| 3+ Earners | 35 (9.7%) | $128,672 |
| Total | 360 (100.0%) | $38,409 |
Household Income in Twin City
Household Income Brackets in Twin City
With 174 households falling in the category, the $35,000 to $49,999 income range is the most frequent in Twin City, accounting for 29.1% of all households. In contrast, only 3 households (0.5%) fall into the $200,000+ income bracket, making it the least populous group.
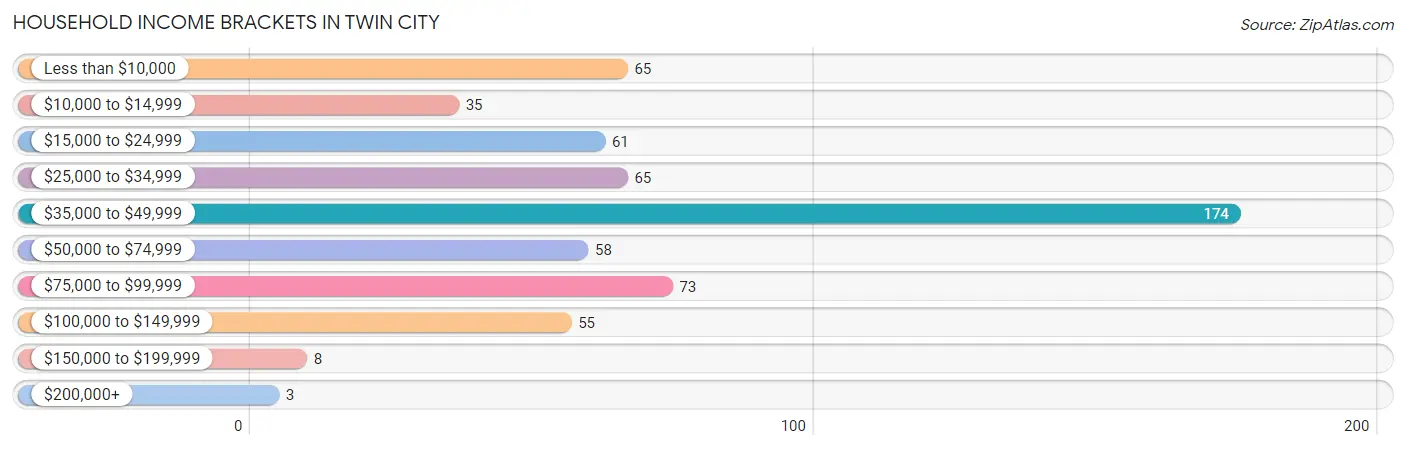
| Income Bracket | # Households | % Households |
| Less than $10,000 | 65 | 10.9% |
| $10,000 to $14,999 | 35 | 5.9% |
| $15,000 to $24,999 | 61 | 10.2% |
| $25,000 to $34,999 | 65 | 10.9% |
| $35,000 to $49,999 | 174 | 29.1% |
| $50,000 to $74,999 | 58 | 9.7% |
| $75,000 to $99,999 | 73 | 12.2% |
| $100,000 to $149,999 | 55 | 9.2% |
| $150,000 to $199,999 | 8 | 1.3% |
| $200,000+ | 3 | 0.5% |
Household Income by Householder Age in Twin City
The median household income in Twin City is $36,498, with the highest median household income of $46,250 found in the 25 to 44 years age bracket for the primary householder. A total of 128 households (21.4%) fall into this category. Meanwhile, the 15 to 24 years age bracket for the primary householder has the lowest median household income of $0, with 4 households (0.7%) in this group.
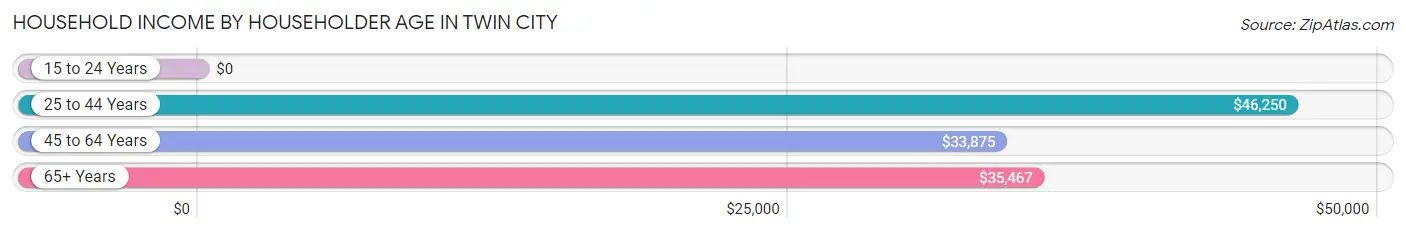
| Income Bracket | # Households | Median Income |
| 15 to 24 Years | 4 (0.7%) | $0 |
| 25 to 44 Years | 128 (21.4%) | $46,250 |
| 45 to 64 Years | 236 (39.5%) | $33,875 |
| 65+ Years | 229 (38.4%) | $35,467 |
| Total | 597 (100.0%) | $36,498 |
Poverty in Twin City
Income Below Poverty by Sex and Age in Twin City
With 18.8% poverty level for males and 24.3% for females among the residents of Twin City, 5 year old males and under 5 year old females are the most vulnerable to poverty, with 10 males (55.6%) and 4 females (50.0%) in their respective age groups living below the poverty level.
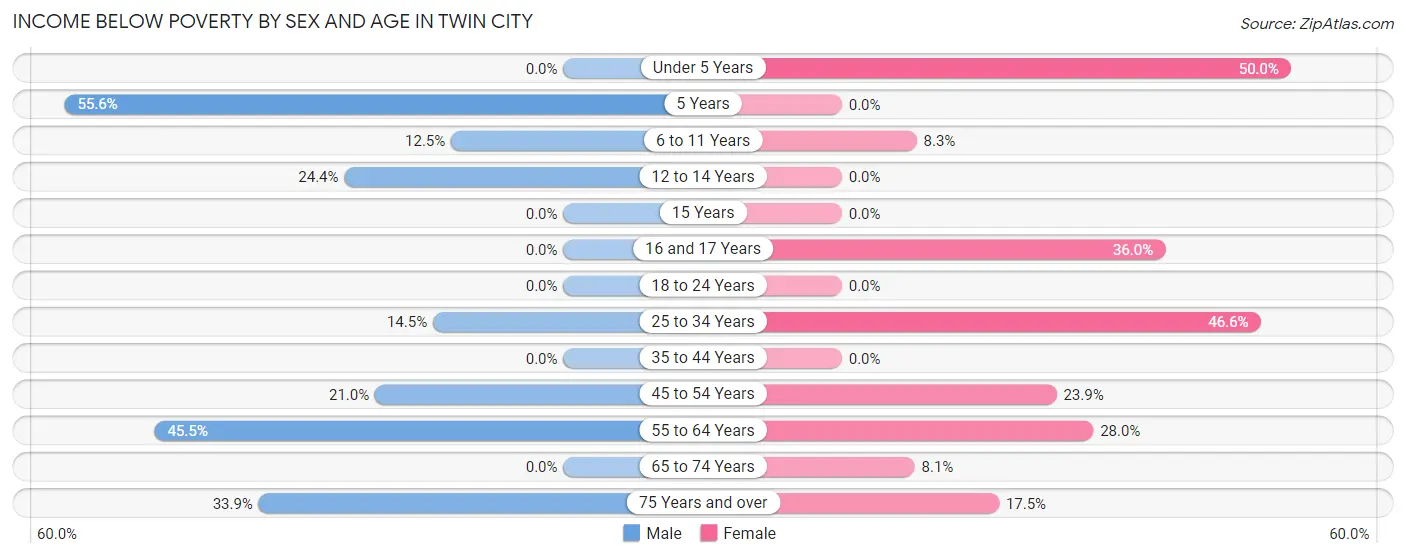
| Age Bracket | Male | Female |
| Under 5 Years | 0 (0.0%) | 4 (50.0%) |
| 5 Years | 10 (55.6%) | 0 (0.0%) |
| 6 to 11 Years | 2 (12.5%) | 2 (8.3%) |
| 12 to 14 Years | 10 (24.4%) | 0 (0.0%) |
| 15 Years | 0 (0.0%) | 0 (0.0%) |
| 16 and 17 Years | 0 (0.0%) | 9 (36.0%) |
| 18 to 24 Years | 0 (0.0%) | 0 (0.0%) |
| 25 to 34 Years | 35 (14.5%) | 62 (46.6%) |
| 35 to 44 Years | 0 (0.0%) | 0 (0.0%) |
| 45 to 54 Years | 26 (21.0%) | 22 (23.9%) |
| 55 to 64 Years | 56 (45.5%) | 28 (28.0%) |
| 65 to 74 Years | 0 (0.0%) | 6 (8.1%) |
| 75 Years and over | 19 (33.9%) | 14 (17.5%) |
| Total | 158 (18.8%) | 147 (24.3%) |
Income Above Poverty by Sex and Age in Twin City
According to the poverty statistics in Twin City, males aged under 5 years and females aged 5 years are the age groups that are most secure financially, with 100.0% of males and 100.0% of females in these age groups living above the poverty line.
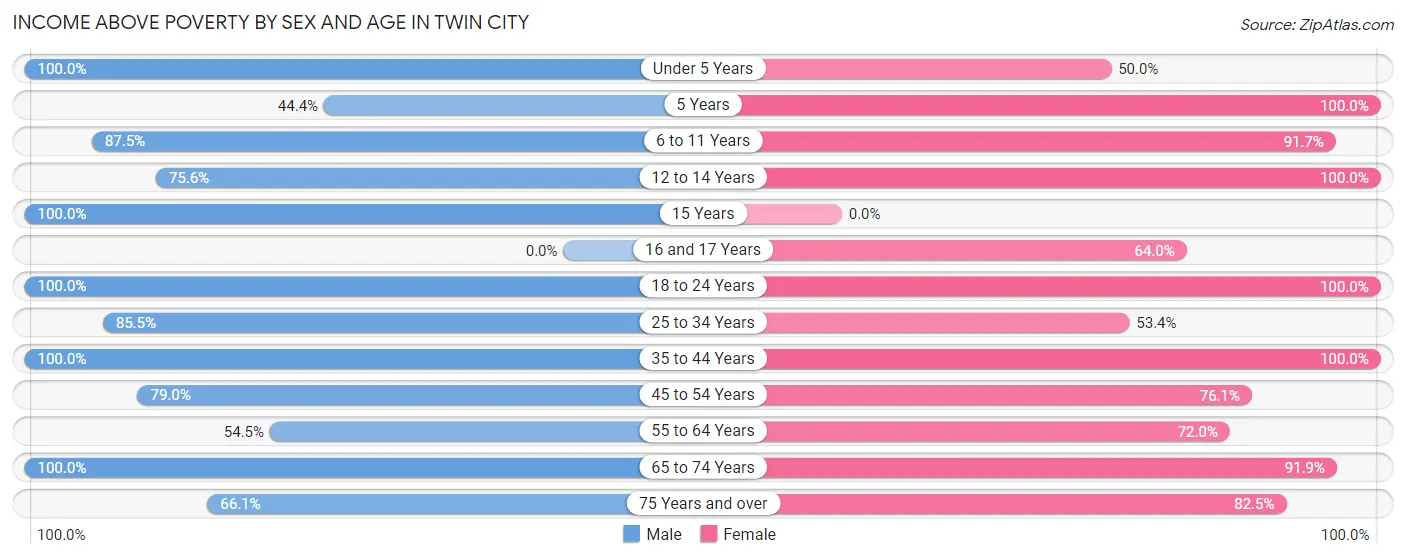
| Age Bracket | Male | Female |
| Under 5 Years | 31 (100.0%) | 4 (50.0%) |
| 5 Years | 8 (44.4%) | 9 (100.0%) |
| 6 to 11 Years | 14 (87.5%) | 22 (91.7%) |
| 12 to 14 Years | 31 (75.6%) | 12 (100.0%) |
| 15 Years | 23 (100.0%) | 0 (0.0%) |
| 16 and 17 Years | 0 (0.0%) | 16 (64.0%) |
| 18 to 24 Years | 57 (100.0%) | 3 (100.0%) |
| 25 to 34 Years | 206 (85.5%) | 71 (53.4%) |
| 35 to 44 Years | 28 (100.0%) | 45 (100.0%) |
| 45 to 54 Years | 98 (79.0%) | 70 (76.1%) |
| 55 to 64 Years | 67 (54.5%) | 72 (72.0%) |
| 65 to 74 Years | 81 (100.0%) | 68 (91.9%) |
| 75 Years and over | 37 (66.1%) | 66 (82.5%) |
| Total | 681 (81.2%) | 458 (75.7%) |
Income Below Poverty Among Married-Couple Families in Twin City
The poverty statistics for married-couple families in Twin City show that 7.9% or 16 of the total 202 families live below the poverty line. Families with no children have the highest poverty rate of 10.4%, comprising of 16 families. On the other hand, families with 1 or 2 children have the lowest poverty rate of 0.0%, which includes 0 families.
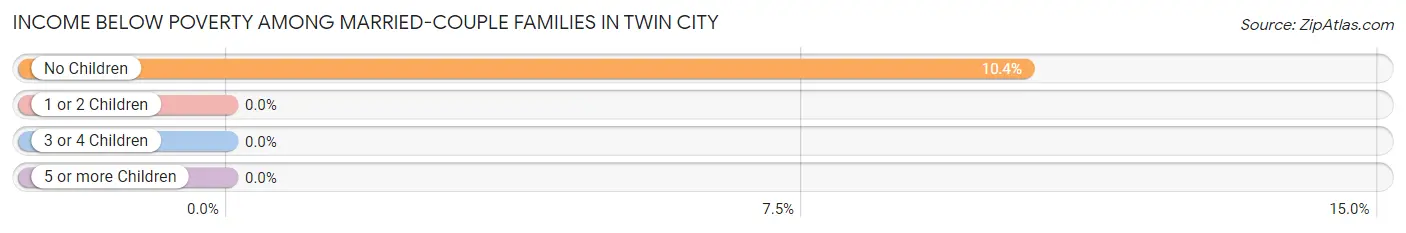
| Children | Above Poverty | Below Poverty |
| No Children | 138 (89.6%) | 16 (10.4%) |
| 1 or 2 Children | 48 (100.0%) | 0 (0.0%) |
| 3 or 4 Children | 0 (0.0%) | 0 (0.0%) |
| 5 or more Children | 0 (0.0%) | 0 (0.0%) |
| Total | 186 (92.1%) | 16 (7.9%) |
Income Below Poverty Among Single-Parent Households in Twin City
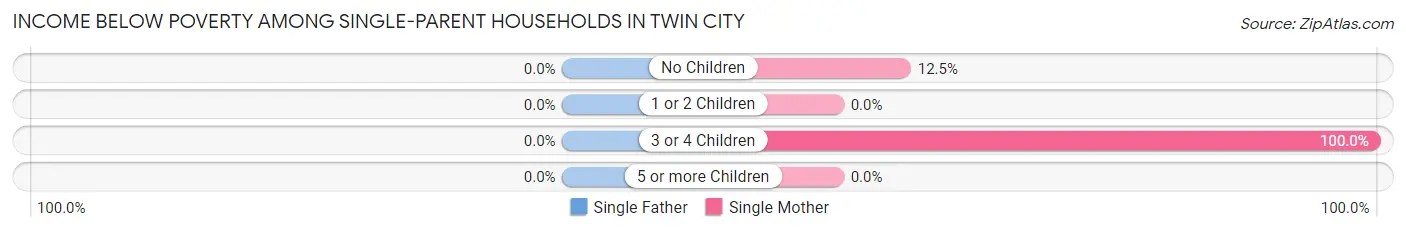
| Children | Single Father | Single Mother |
| No Children | 0 (0.0%) | 11 (12.5%) |
| 1 or 2 Children | 0 (0.0%) | 0 (0.0%) |
| 3 or 4 Children | 0 (0.0%) | 14 (100.0%) |
| 5 or more Children | 0 (0.0%) | 0 (0.0%) |
| Total | 0 (0.0%) | 25 (20.7%) |
Income Below Poverty Among Married-Couple vs Single-Parent Households in Twin City
The poverty data for Twin City shows that 16 of the married-couple family households (7.9%) and 25 of the single-parent households (15.8%) are living below the poverty level. Within the married-couple family households, those with no children have the highest poverty rate, with 16 households (10.4%) falling below the poverty line. Among the single-parent households, those with 3 or 4 children have the highest poverty rate, with 14 household (100.0%) living below poverty.
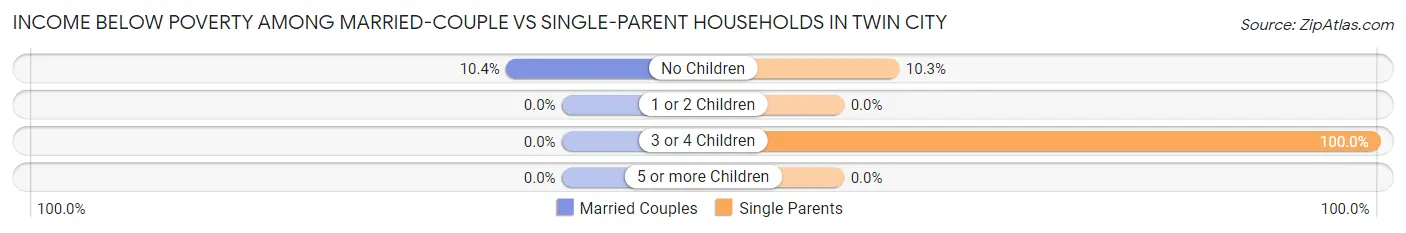
| Children | Married-Couple Families | Single-Parent Households |
| No Children | 16 (10.4%) | 11 (10.3%) |
| 1 or 2 Children | 0 (0.0%) | 0 (0.0%) |
| 3 or 4 Children | 0 (0.0%) | 14 (100.0%) |
| 5 or more Children | 0 (0.0%) | 0 (0.0%) |
| Total | 16 (7.9%) | 25 (15.8%) |
Race in Twin City
The most populous races in Twin City are Black / African American (1,044 | 56.5%), White / Caucasian (689 | 37.3%), and Two or more Races (107 | 5.8%).
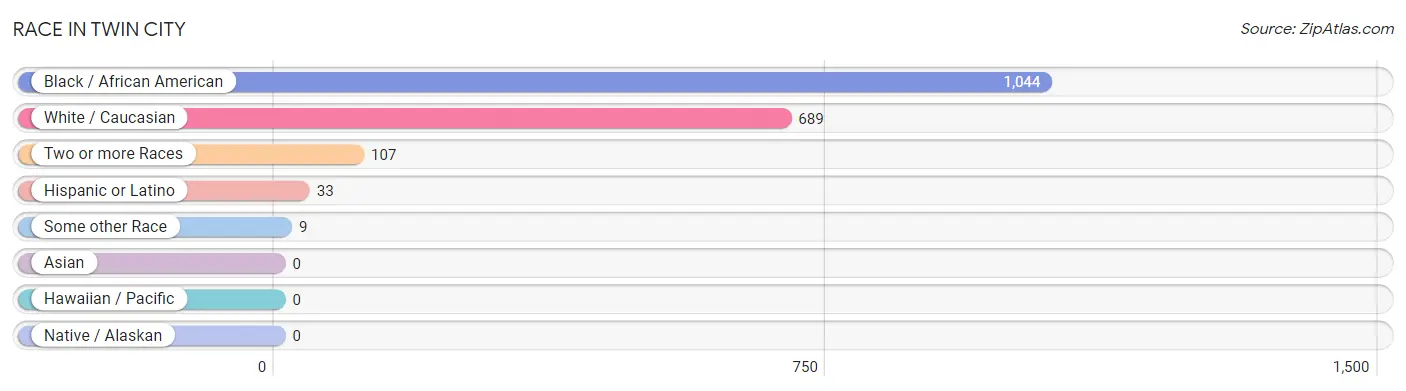
| Race | # Population | % Population |
| Asian | 0 | 0.0% |
| Black / African American | 1,044 | 56.5% |
| Hawaiian / Pacific | 0 | 0.0% |
| Hispanic or Latino | 33 | 1.8% |
| Native / Alaskan | 0 | 0.0% |
| White / Caucasian | 689 | 37.3% |
| Two or more Races | 107 | 5.8% |
| Some other Race | 9 | 0.5% |
| Total | 1,849 | 100.0% |
Ancestry in Twin City
The most populous ancestries reported in Twin City are American (142 | 7.7%), English (91 | 4.9%), Irish (78 | 4.2%), Mexican (32 | 1.7%), and Cherokee (30 | 1.6%), together accounting for 20.2% of all Twin City residents.
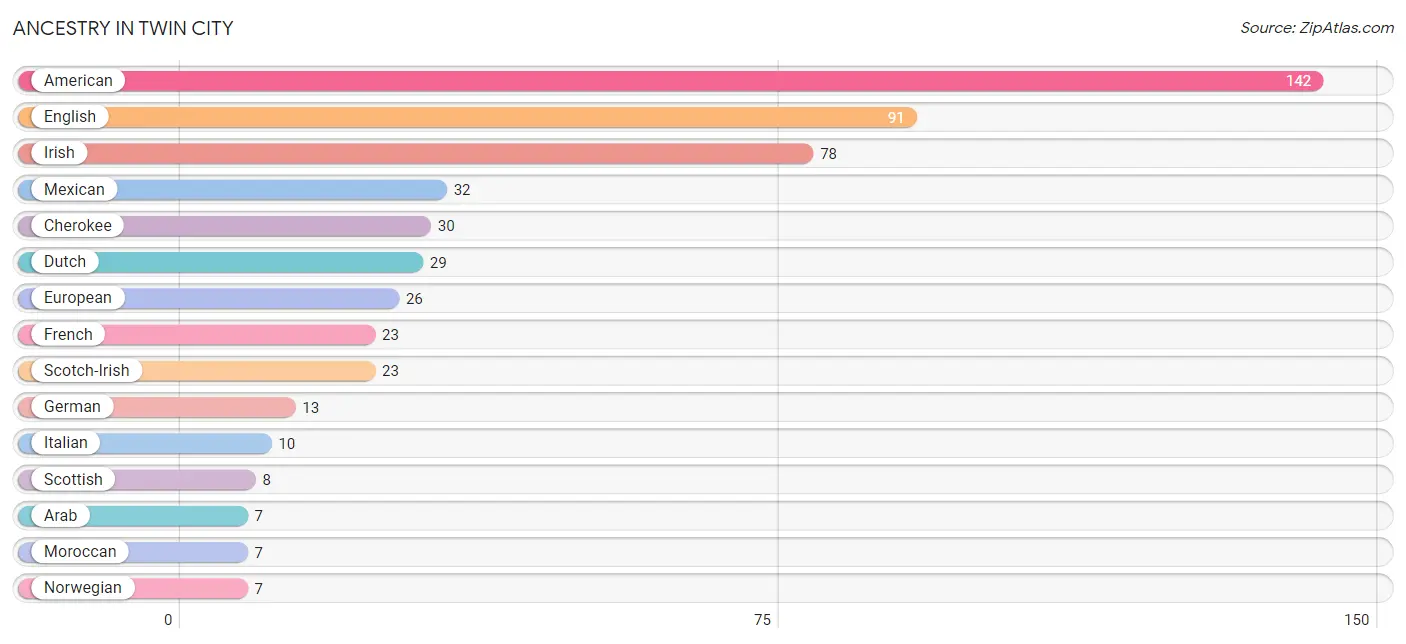
| Ancestry | # Population | % Population |
| American | 142 | 7.7% |
| Arab | 7 | 0.4% |
| Bahamian | 5 | 0.3% |
| Blackfeet | 3 | 0.2% |
| British | 4 | 0.2% |
| Cape Verdean | 1 | 0.1% |
| Cherokee | 30 | 1.6% |
| Dutch | 29 | 1.6% |
| English | 91 | 4.9% |
| European | 26 | 1.4% |
| French | 23 | 1.2% |
| German | 13 | 0.7% |
| Haitian | 4 | 0.2% |
| Irish | 78 | 4.2% |
| Italian | 10 | 0.5% |
| Jamaican | 6 | 0.3% |
| Mexican | 32 | 1.7% |
| Moroccan | 7 | 0.4% |
| Norwegian | 7 | 0.4% |
| Puerto Rican | 1 | 0.1% |
| Scotch-Irish | 23 | 1.2% |
| Scottish | 8 | 0.4% |
| Subsaharan African | 1 | 0.1% |
| Welsh | 6 | 0.3% | View All 24 Rows |
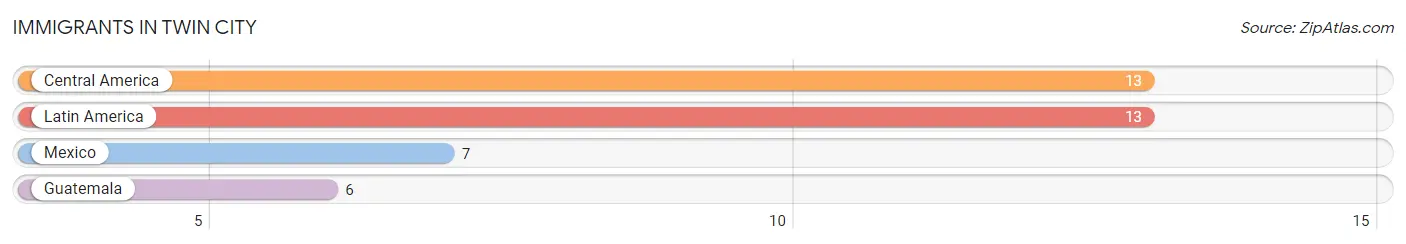
Immigrants in Twin City
The most numerous immigrant groups reported in Twin City came from Central America (13 | 0.7%), Latin America (13 | 0.7%), Mexico (7 | 0.4%), and Guatemala (6 | 0.3%), together accounting for 2.1% of all Twin City residents.
| Immigration Origin | # Population | % Population |
| Central America | 13 | 0.7% |
| Guatemala | 6 | 0.3% |
| Latin America | 13 | 0.7% |
| Mexico | 7 | 0.4% | View All 4 Rows |
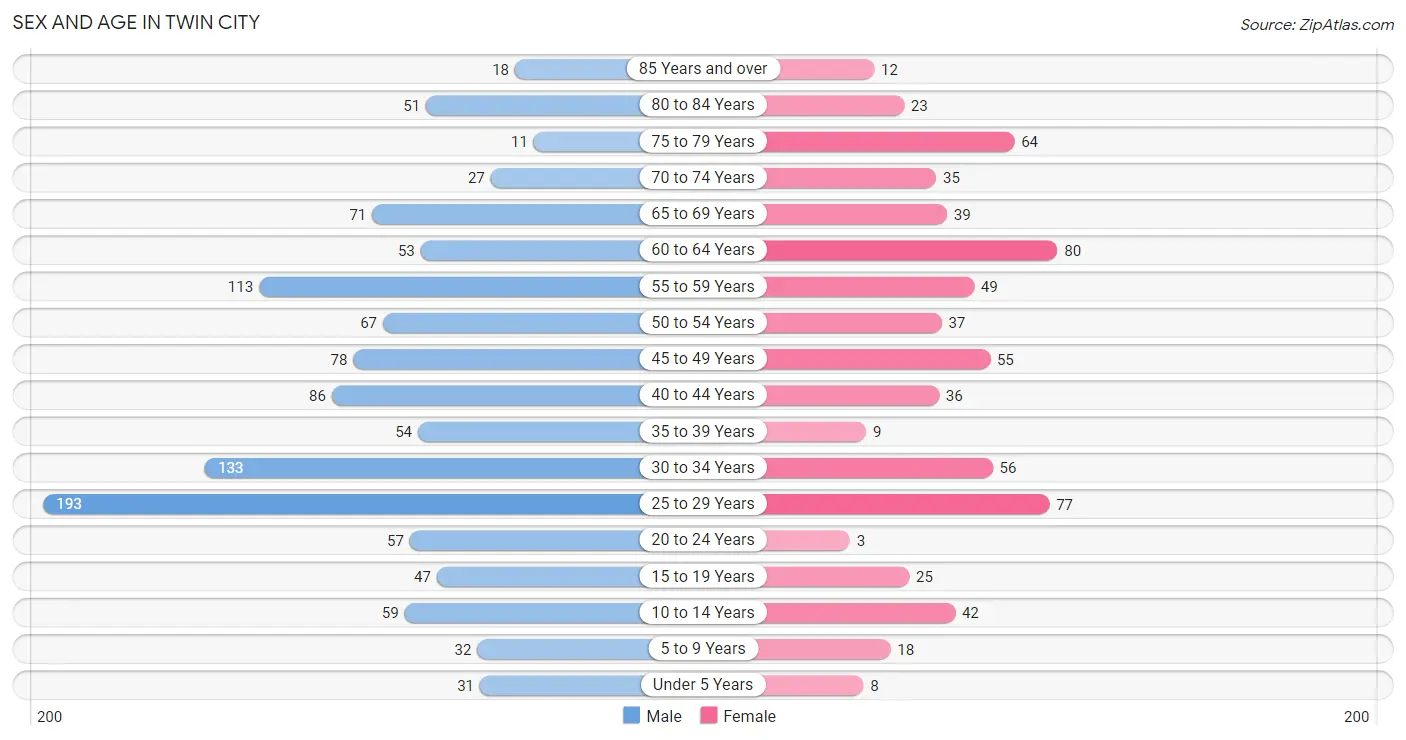
Sex and Age in Twin City
Sex and Age in Twin City
The most populous age groups in Twin City are 25 to 29 Years (193 | 16.3%) for men and 60 to 64 Years (80 | 12.0%) for women.
| Age Bracket | Male | Female |
| Under 5 Years | 31 (2.6%) | 8 (1.2%) |
| 5 to 9 Years | 32 (2.7%) | 18 (2.7%) |
| 10 to 14 Years | 59 (5.0%) | 42 (6.3%) |
| 15 to 19 Years | 47 (4.0%) | 25 (3.7%) |
| 20 to 24 Years | 57 (4.8%) | 3 (0.4%) |
| 25 to 29 Years | 193 (16.3%) | 77 (11.5%) |
| 30 to 34 Years | 133 (11.3%) | 56 (8.4%) |
| 35 to 39 Years | 54 (4.6%) | 9 (1.3%) |
| 40 to 44 Years | 86 (7.3%) | 36 (5.4%) |
| 45 to 49 Years | 78 (6.6%) | 55 (8.2%) |
| 50 to 54 Years | 67 (5.7%) | 37 (5.5%) |
| 55 to 59 Years | 113 (9.6%) | 49 (7.3%) |
| 60 to 64 Years | 53 (4.5%) | 80 (12.0%) |
| 65 to 69 Years | 71 (6.0%) | 39 (5.8%) |
| 70 to 74 Years | 27 (2.3%) | 35 (5.2%) |
| 75 to 79 Years | 11 (0.9%) | 64 (9.6%) |
| 80 to 84 Years | 51 (4.3%) | 23 (3.4%) |
| 85 Years and over | 18 (1.5%) | 12 (1.8%) |
| Total | 1,181 (100.0%) | 668 (100.0%) |
Families and Households in Twin City
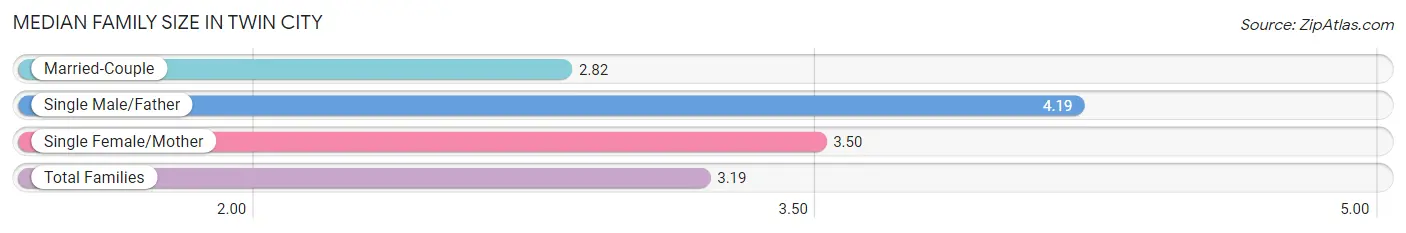
Median Family Size in Twin City
The median family size in Twin City is 3.19 persons per family, with single male/father families (37 | 10.3%) accounting for the largest median family size of 4.19 persons per family. On the other hand, married-couple families (202 | 56.1%) represent the smallest median family size with 2.82 persons per family.
| Family Type | # Families | Family Size |
| Married-Couple | 202 (56.1%) | 2.82 |
| Single Male/Father | 37 (10.3%) | 4.19 |
| Single Female/Mother | 121 (33.6%) | 3.50 |
| Total Families | 360 (100.0%) | 3.19 |
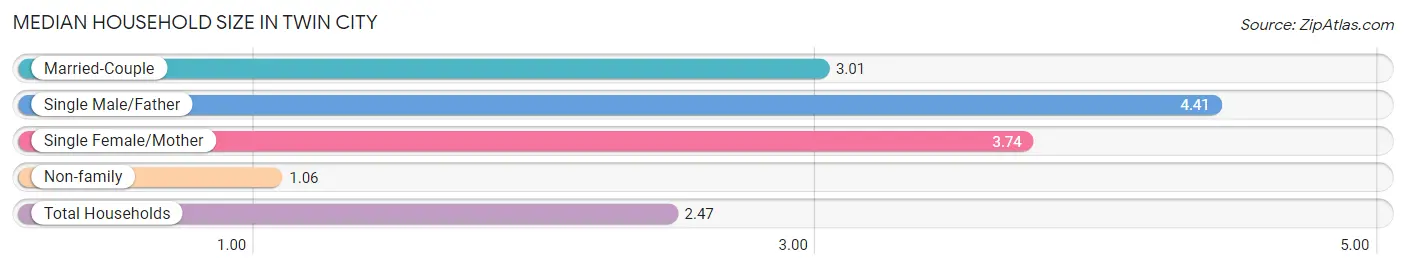
Median Household Size in Twin City
The median household size in Twin City is 2.47 persons per household, with single male/father households (37 | 6.2%) accounting for the largest median household size of 4.41 persons per household. non-family households (237 | 39.7%) represent the smallest median household size with 1.06 persons per household.
| Household Type | # Households | Household Size |
| Married-Couple | 202 (33.8%) | 3.01 |
| Single Male/Father | 37 (6.2%) | 4.41 |
| Single Female/Mother | 121 (20.3%) | 3.74 |
| Non-family | 237 (39.7%) | 1.06 |
| Total Households | 597 (100.0%) | 2.47 |
Household Size by Marriage Status in Twin City
Out of a total of 597 households in Twin City, 360 (60.3%) are family households, while 237 (39.7%) are nonfamily households. The most numerous type of family households are 2-person households, comprising 224, and the most common type of nonfamily households are 1-person households, comprising 229.
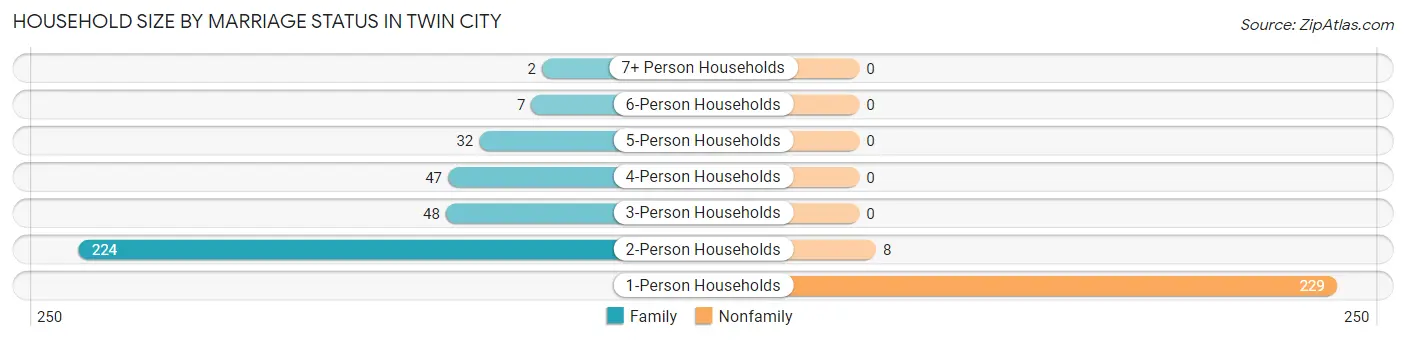
| Household Size | Family Households | Nonfamily Households |
| 1-Person Households | - | 229 (38.4%) |
| 2-Person Households | 224 (37.5%) | 8 (1.3%) |
| 3-Person Households | 48 (8.0%) | 0 (0.0%) |
| 4-Person Households | 47 (7.9%) | 0 (0.0%) |
| 5-Person Households | 32 (5.4%) | 0 (0.0%) |
| 6-Person Households | 7 (1.2%) | 0 (0.0%) |
| 7+ Person Households | 2 (0.3%) | 0 (0.0%) |
| Total | 360 (60.3%) | 237 (39.7%) |
Female Fertility in Twin City
Fertility by Age in Twin City
Average fertility rate in Twin City is 68.0 births per 1,000 women. Women in the age bracket of 20 to 34 years have the highest fertility rate with 132.0 births per 1,000 women. Women in the age bracket of 20 to 34 years acount for 100.0% of all women with births.
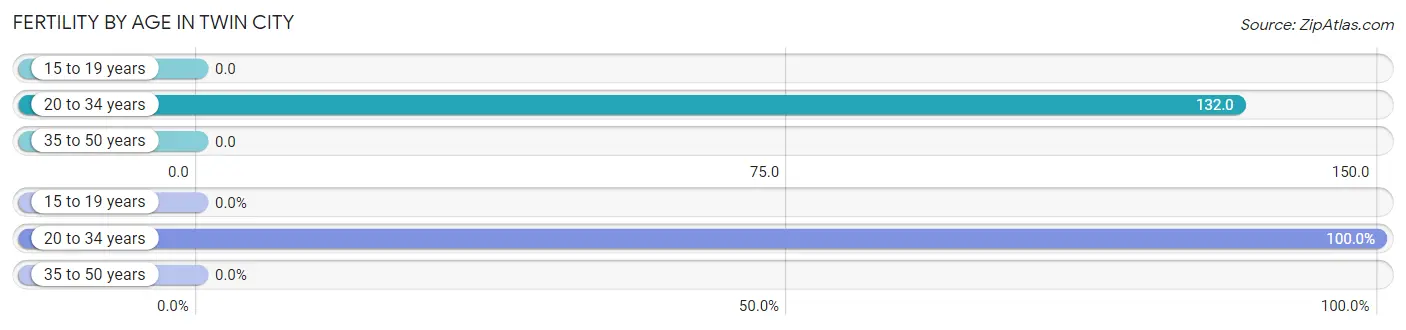
| Age Bracket | Women with Births | Births / 1,000 Women |
| 15 to 19 years | 0 (0.0%) | 0.0 |
| 20 to 34 years | 18 (100.0%) | 132.0 |
| 35 to 50 years | 0 (0.0%) | 0.0 |
| Total | 18 (100.0%) | 68.0 |
Fertility by Age by Marriage Status in Twin City
38.9% of women with births (18) in Twin City are married. The highest percentage of unmarried women with births falls into 20 to 34 years age bracket with 61.1% of them unmarried at the time of birth, while the lowest percentage of unmarried women with births belong to 20 to 34 years age bracket with 61.1% of them unmarried.
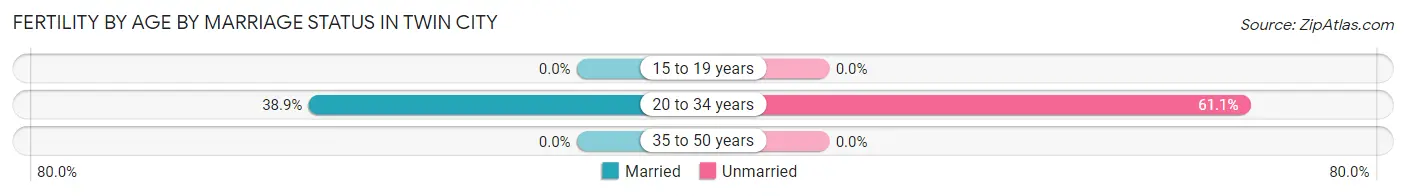
| Age Bracket | Married | Unmarried |
| 15 to 19 years | 0 (0.0%) | 0 (0.0%) |
| 20 to 34 years | 7 (38.9%) | 11 (61.1%) |
| 35 to 50 years | 0 (0.0%) | 0 (0.0%) |
| Total | 7 (38.9%) | 11 (61.1%) |
Fertility by Education in Twin City
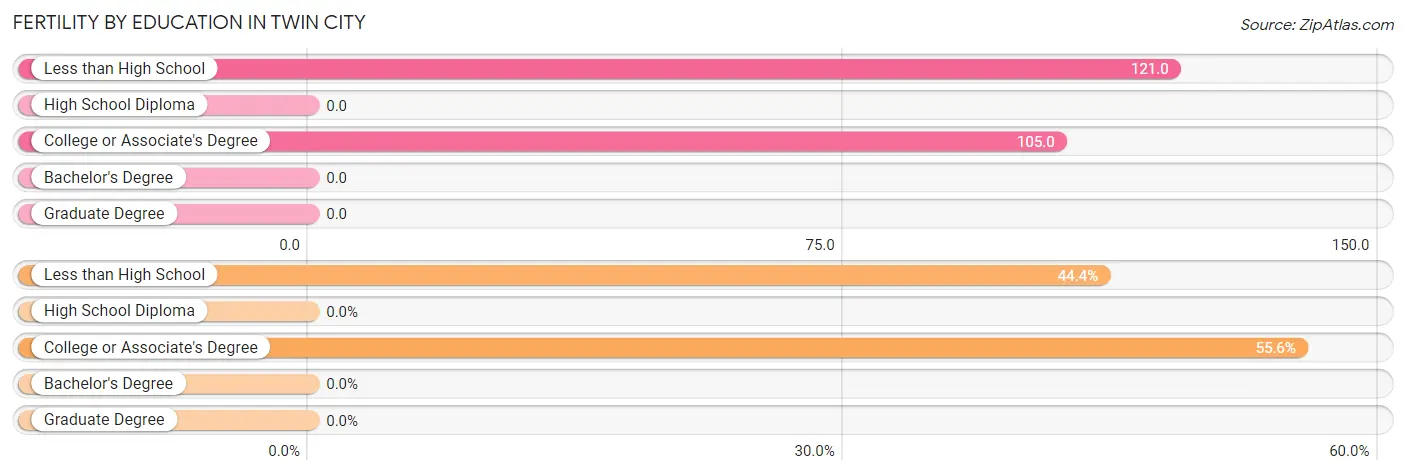
| Educational Attainment | Women with Births | Births / 1,000 Women |
| Less than High School | 8 (44.4%) | 121.0 |
| High School Diploma | 0 (0.0%) | 0.0 |
| College or Associate's Degree | 10 (55.6%) | 105.0 |
| Bachelor's Degree | 0 (0.0%) | 0.0 |
| Graduate Degree | 0 (0.0%) | 0.0 |
| Total | 18 (100.0%) | 68.0 |
Fertility by Education by Marriage Status in Twin City
61.1% of women with births in Twin City are unmarried. Women with the educational attainment of college or associate's degree are most likely to be married with 70.0% of them married at childbirth, while women with the educational attainment of less than high school are least likely to be married with 100.0% of them unmarried at childbirth.
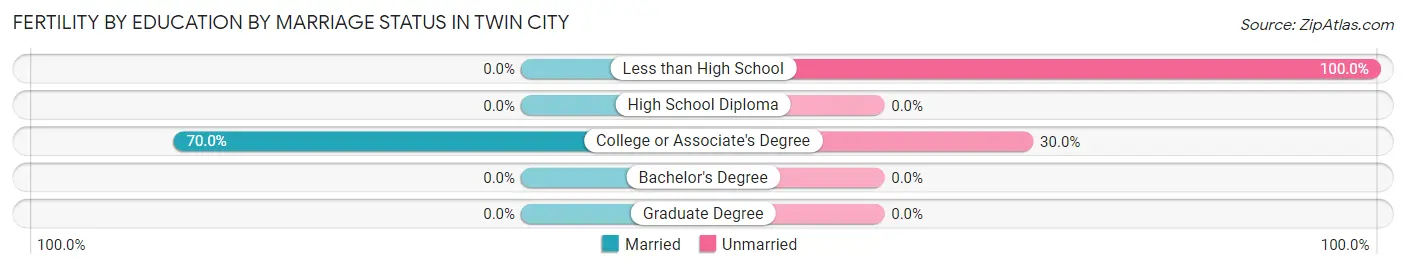
| Educational Attainment | Married | Unmarried |
| Less than High School | 0 (0.0%) | 8 (100.0%) |
| High School Diploma | 0 (0.0%) | 0 (0.0%) |
| College or Associate's Degree | 7 (70.0%) | 3 (30.0%) |
| Bachelor's Degree | 0 (0.0%) | 0 (0.0%) |
| Graduate Degree | 0 (0.0%) | 0 (0.0%) |
| Total | 7 (38.9%) | 11 (61.1%) |
Employment Characteristics in Twin City
Employment by Class of Employer in Twin City
Among the 563 employed individuals in Twin City, private company employees (430 | 76.4%), state government employees (58 | 10.3%), and not-for-profit organizations (29 | 5.1%) make up the most common classes of employment.
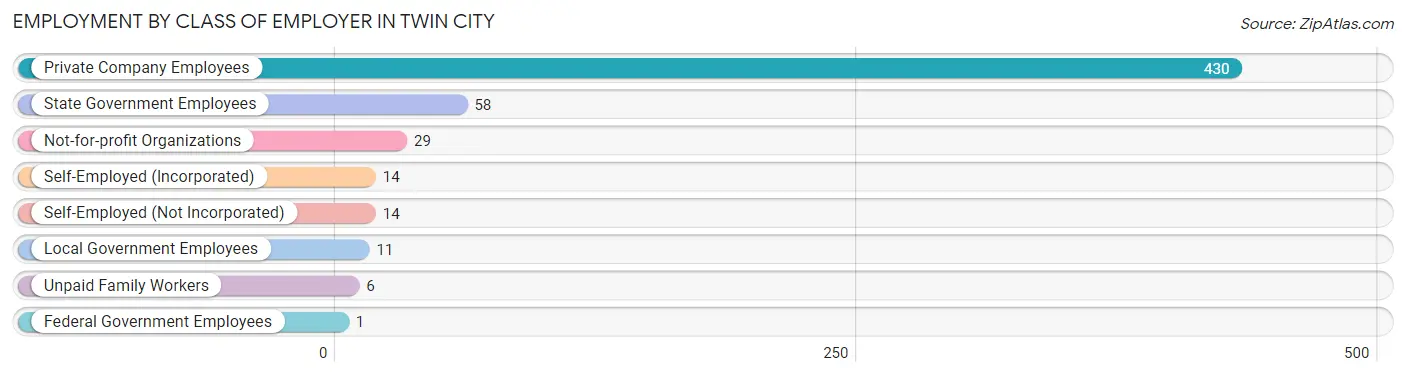
| Employer Class | # Employees | % Employees |
| Private Company Employees | 430 | 76.4% |
| Self-Employed (Incorporated) | 14 | 2.5% |
| Self-Employed (Not Incorporated) | 14 | 2.5% |
| Not-for-profit Organizations | 29 | 5.1% |
| Local Government Employees | 11 | 1.9% |
| State Government Employees | 58 | 10.3% |
| Federal Government Employees | 1 | 0.2% |
| Unpaid Family Workers | 6 | 1.1% |
| Total | 563 | 100.0% |
Employment Status by Age in Twin City
According to the labor force statistics for Twin City, out of the total population over 16 years of age (1,636), 42.2% or 690 individuals are in the labor force, with 10.4% or 72 of them unemployed. The age group with the highest labor force participation rate is 30 to 34 years, with 81.5% or 154 individuals in the labor force. Within the labor force, the 20 to 24 years age range has the highest percentage of unemployed individuals, with 62.8% or 27 of them being unemployed.
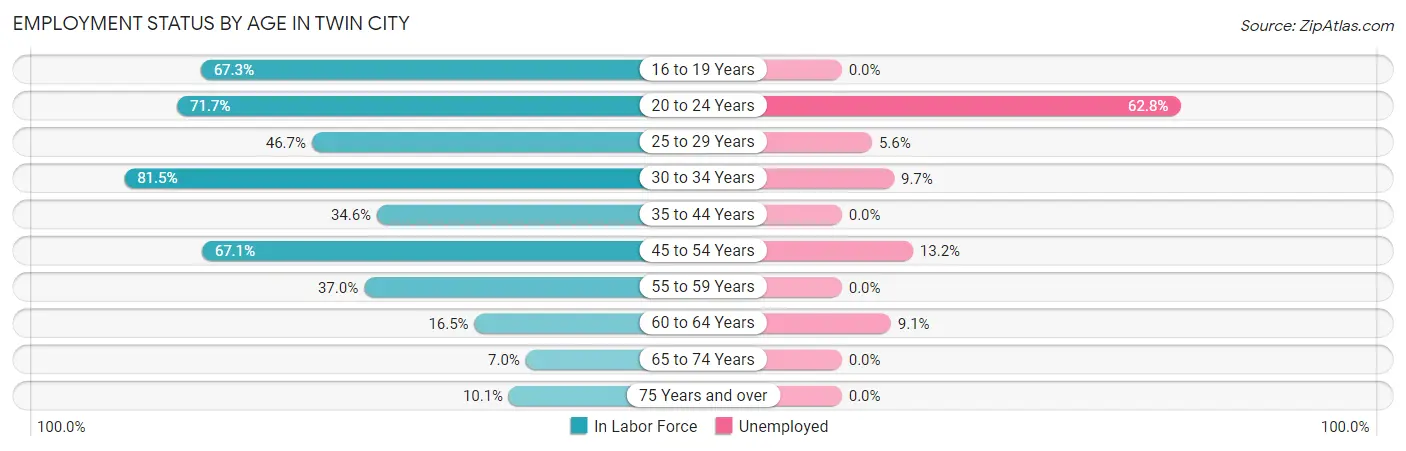
| Age Bracket | In Labor Force | Unemployed |
| 16 to 19 Years | 33 (67.3%) | 0 (0.0%) |
| 20 to 24 Years | 43 (71.7%) | 27 (62.8%) |
| 25 to 29 Years | 126 (46.7%) | 7 (5.6%) |
| 30 to 34 Years | 154 (81.5%) | 15 (9.7%) |
| 35 to 44 Years | 64 (34.6%) | 0 (0.0%) |
| 45 to 54 Years | 159 (67.1%) | 21 (13.2%) |
| 55 to 59 Years | 60 (37.0%) | 0 (0.0%) |
| 60 to 64 Years | 22 (16.5%) | 2 (9.1%) |
| 65 to 74 Years | 12 (7.0%) | 0 (0.0%) |
| 75 Years and over | 18 (10.1%) | 0 (0.0%) |
| Total | 690 (42.2%) | 72 (10.4%) |
Employment Status by Educational Attainment in Twin City
According to labor force statistics for Twin City, 49.7% of individuals (584) out of the total population between 25 and 64 years of age (1,176) are in the labor force, with 7.7% or 45 of them being unemployed. The group with the highest labor force participation rate are those with the educational attainment of college / associate degree, with 79.1% or 220 individuals in the labor force. Within the labor force, individuals with less than high school education have the highest percentage of unemployment, with 16.1% or 15 of them being unemployed.
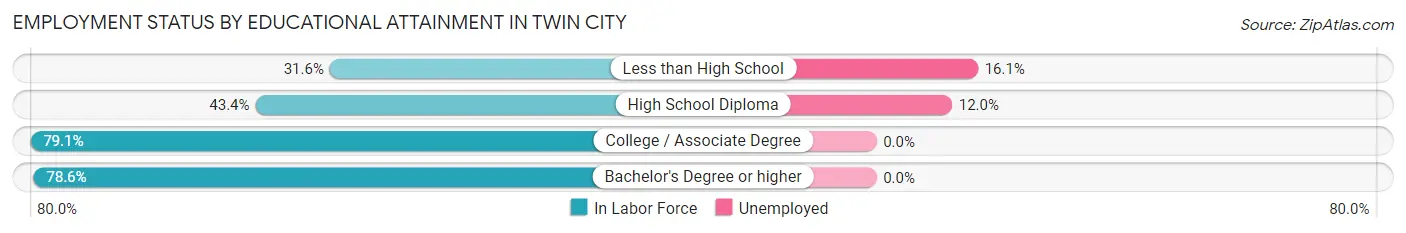
| Educational Attainment | In Labor Force | Unemployed |
| Less than High School | 93 (31.6%) | 47 (16.1%) |
| High School Diploma | 250 (43.4%) | 69 (12.0%) |
| College / Associate Degree | 220 (79.1%) | 0 (0.0%) |
| Bachelor's Degree or higher | 22 (78.6%) | 0 (0.0%) |
| Total | 584 (49.7%) | 91 (7.7%) |
Employment Occupations by Sex in Twin City
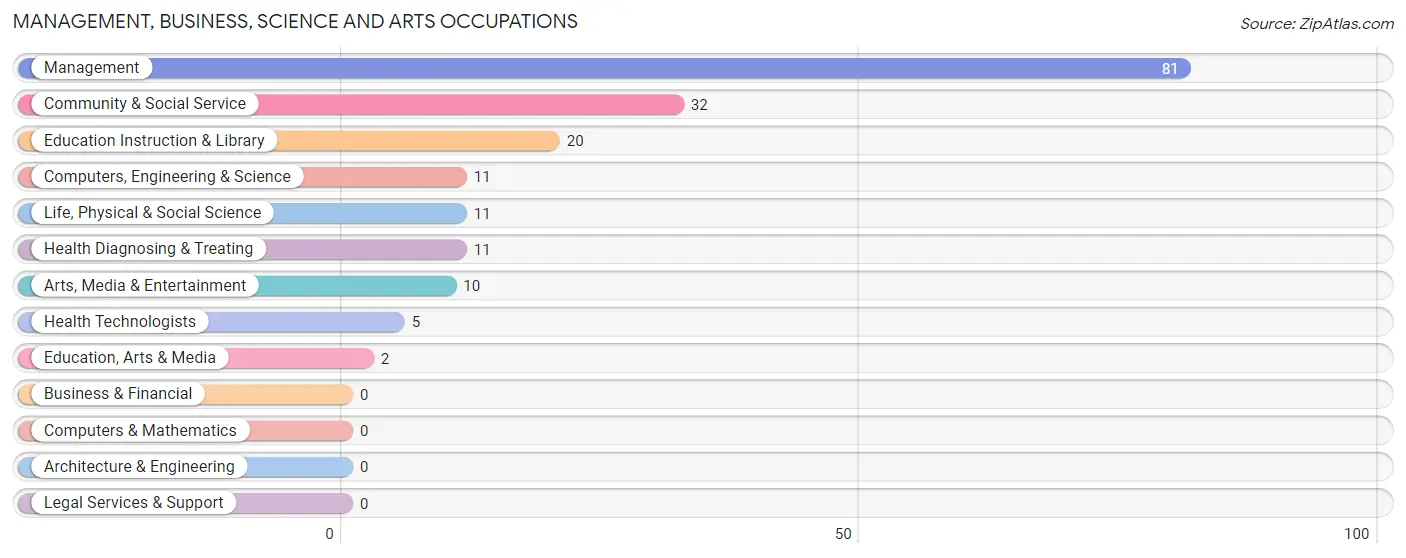
Management, Business, Science and Arts Occupations
The most common Management, Business, Science and Arts occupations in Twin City are Management (81 | 13.1%), Community & Social Service (32 | 5.2%), Education Instruction & Library (20 | 3.2%), Computers, Engineering & Science (11 | 1.8%), and Life, Physical & Social Science (11 | 1.8%).
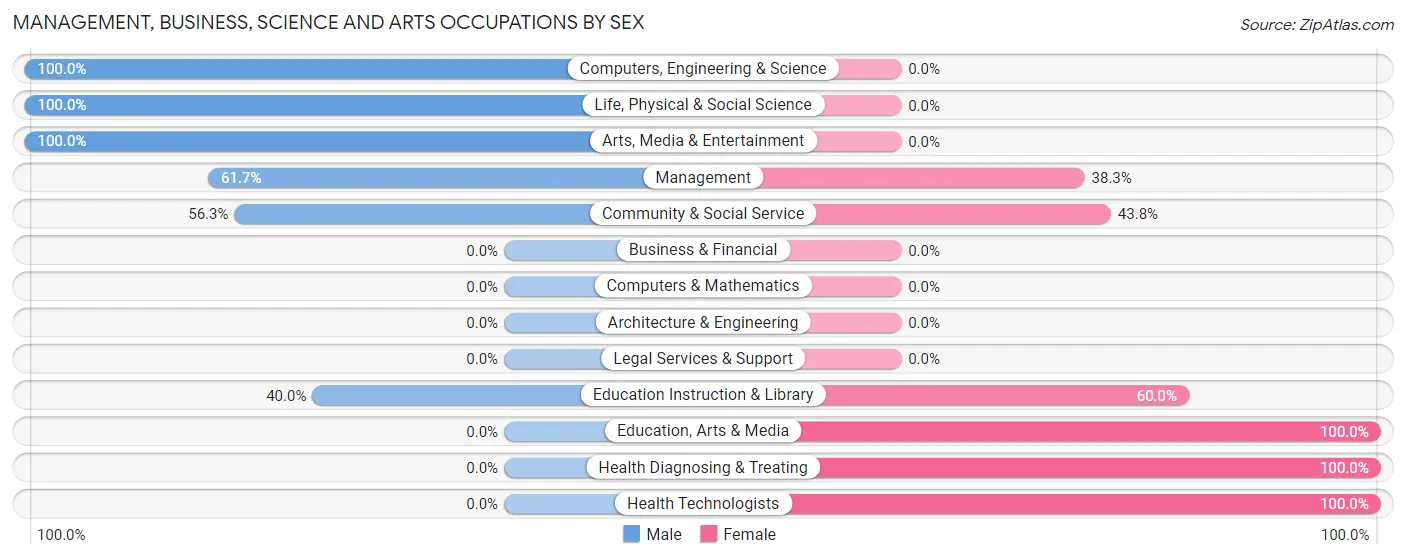
Management, Business, Science and Arts Occupations by Sex
Within the Management, Business, Science and Arts occupations in Twin City, the most male-oriented occupations are Computers, Engineering & Science (100.0%), Life, Physical & Social Science (100.0%), and Arts, Media & Entertainment (100.0%), while the most female-oriented occupations are Education, Arts & Media (100.0%), Health Diagnosing & Treating (100.0%), and Health Technologists (100.0%).
| Occupation | Male | Female |
| Management | 50 (61.7%) | 31 (38.3%) |
| Business & Financial | 0 (0.0%) | 0 (0.0%) |
| Computers, Engineering & Science | 11 (100.0%) | 0 (0.0%) |
| Computers & Mathematics | 0 (0.0%) | 0 (0.0%) |
| Architecture & Engineering | 0 (0.0%) | 0 (0.0%) |
| Life, Physical & Social Science | 11 (100.0%) | 0 (0.0%) |
| Community & Social Service | 18 (56.2%) | 14 (43.8%) |
| Education, Arts & Media | 0 (0.0%) | 2 (100.0%) |
| Legal Services & Support | 0 (0.0%) | 0 (0.0%) |
| Education Instruction & Library | 8 (40.0%) | 12 (60.0%) |
| Arts, Media & Entertainment | 10 (100.0%) | 0 (0.0%) |
| Health Diagnosing & Treating | 0 (0.0%) | 11 (100.0%) |
| Health Technologists | 0 (0.0%) | 5 (100.0%) |
| Total (Category) | 79 (58.5%) | 56 (41.5%) |
| Total (Overall) | 386 (62.4%) | 233 (37.6%) |
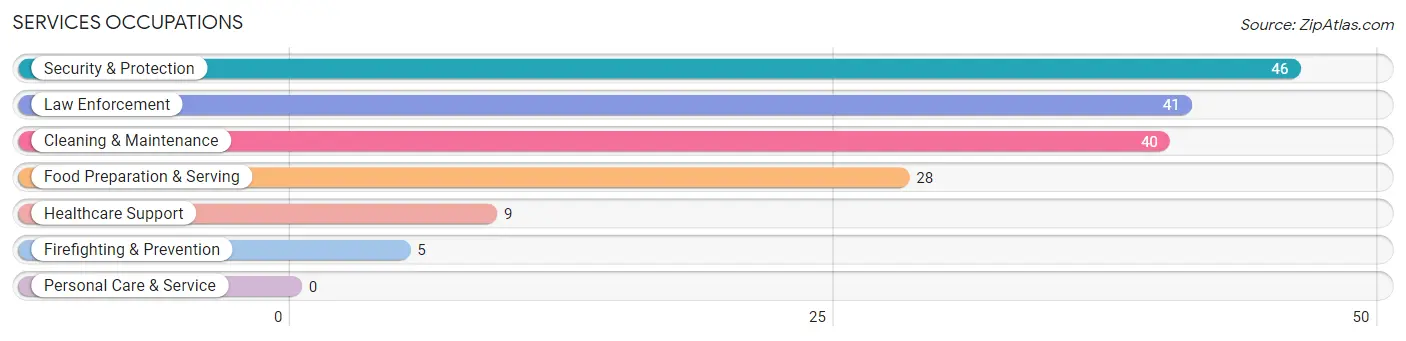
Services Occupations
The most common Services occupations in Twin City are Security & Protection (46 | 7.4%), Law Enforcement (41 | 6.6%), Cleaning & Maintenance (40 | 6.5%), Food Preparation & Serving (28 | 4.5%), and Healthcare Support (9 | 1.5%).
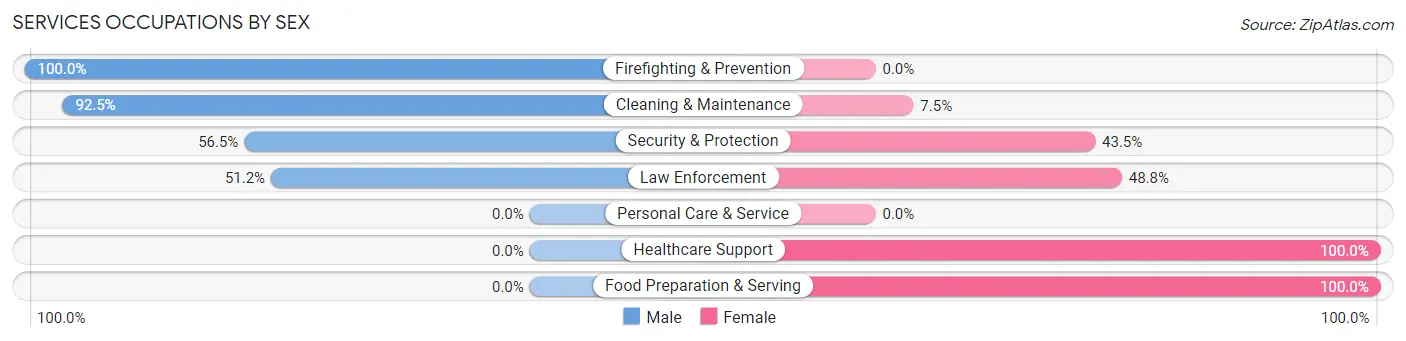
Services Occupations by Sex
Within the Services occupations in Twin City, the most male-oriented occupations are Firefighting & Prevention (100.0%), Cleaning & Maintenance (92.5%), and Security & Protection (56.5%), while the most female-oriented occupations are Healthcare Support (100.0%), Food Preparation & Serving (100.0%), and Law Enforcement (48.8%).
| Occupation | Male | Female |
| Healthcare Support | 0 (0.0%) | 9 (100.0%) |
| Security & Protection | 26 (56.5%) | 20 (43.5%) |
| Firefighting & Prevention | 5 (100.0%) | 0 (0.0%) |
| Law Enforcement | 21 (51.2%) | 20 (48.8%) |
| Food Preparation & Serving | 0 (0.0%) | 28 (100.0%) |
| Cleaning & Maintenance | 37 (92.5%) | 3 (7.5%) |
| Personal Care & Service | 0 (0.0%) | 0 (0.0%) |
| Total (Category) | 63 (51.2%) | 60 (48.8%) |
| Total (Overall) | 386 (62.4%) | 233 (37.6%) |
Sales and Office Occupations
The most common Sales and Office occupations in Twin City are Sales & Related (56 | 9.0%), and Office & Administration (25 | 4.0%).
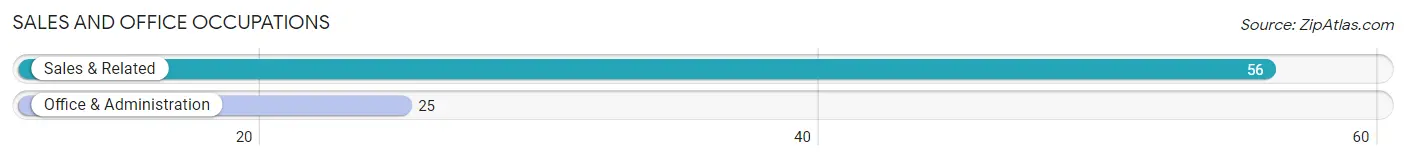
Sales and Office Occupations by Sex
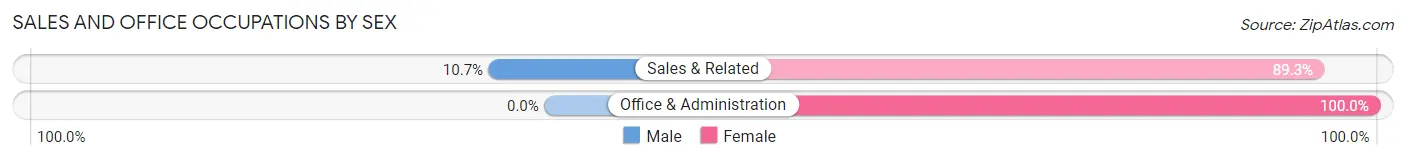
| Occupation | Male | Female |
| Sales & Related | 6 (10.7%) | 50 (89.3%) |
| Office & Administration | 0 (0.0%) | 25 (100.0%) |
| Total (Category) | 6 (7.4%) | 75 (92.6%) |
| Total (Overall) | 386 (62.4%) | 233 (37.6%) |
Natural Resources, Construction and Maintenance Occupations
The most common Natural Resources, Construction and Maintenance occupations in Twin City are Installation, Maintenance & Repair (16 | 2.6%), and Construction & Extraction (8 | 1.3%).
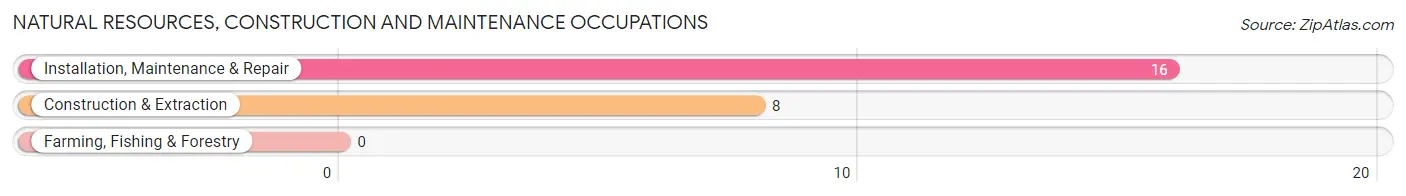
Natural Resources, Construction and Maintenance Occupations by Sex

| Occupation | Male | Female |
| Farming, Fishing & Forestry | 0 (0.0%) | 0 (0.0%) |
| Construction & Extraction | 8 (100.0%) | 0 (0.0%) |
| Installation, Maintenance & Repair | 16 (100.0%) | 0 (0.0%) |
| Total (Category) | 24 (100.0%) | 0 (0.0%) |
| Total (Overall) | 386 (62.4%) | 233 (37.6%) |
Production, Transportation and Moving Occupations
The most common Production, Transportation and Moving occupations in Twin City are Production (132 | 21.3%), Transportation (63 | 10.2%), and Material Moving (61 | 9.9%).
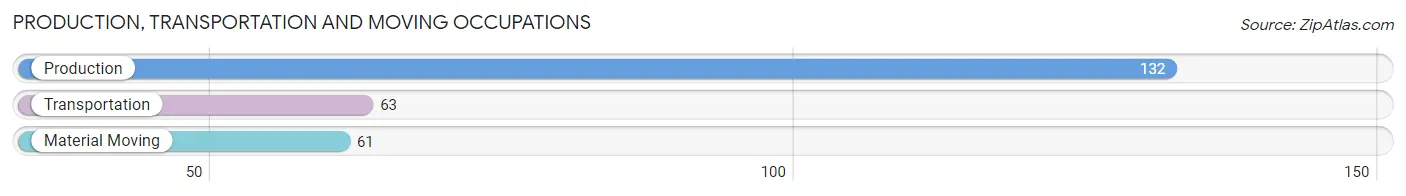
Production, Transportation and Moving Occupations by Sex
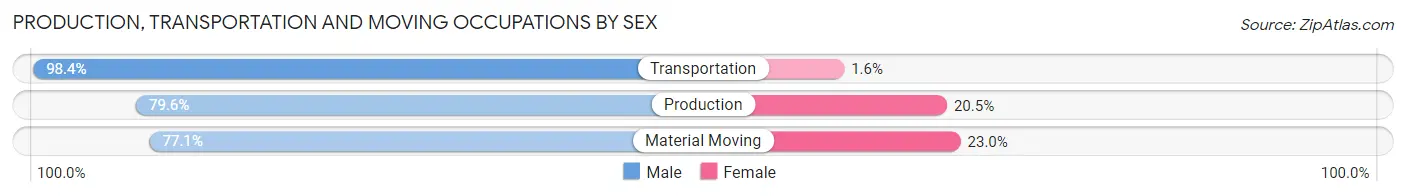
| Occupation | Male | Female |
| Production | 105 (79.5%) | 27 (20.4%) |
| Transportation | 62 (98.4%) | 1 (1.6%) |
| Material Moving | 47 (77.0%) | 14 (23.0%) |
| Total (Category) | 214 (83.6%) | 42 (16.4%) |
| Total (Overall) | 386 (62.4%) | 233 (37.6%) |
Employment Industries by Sex in Twin City
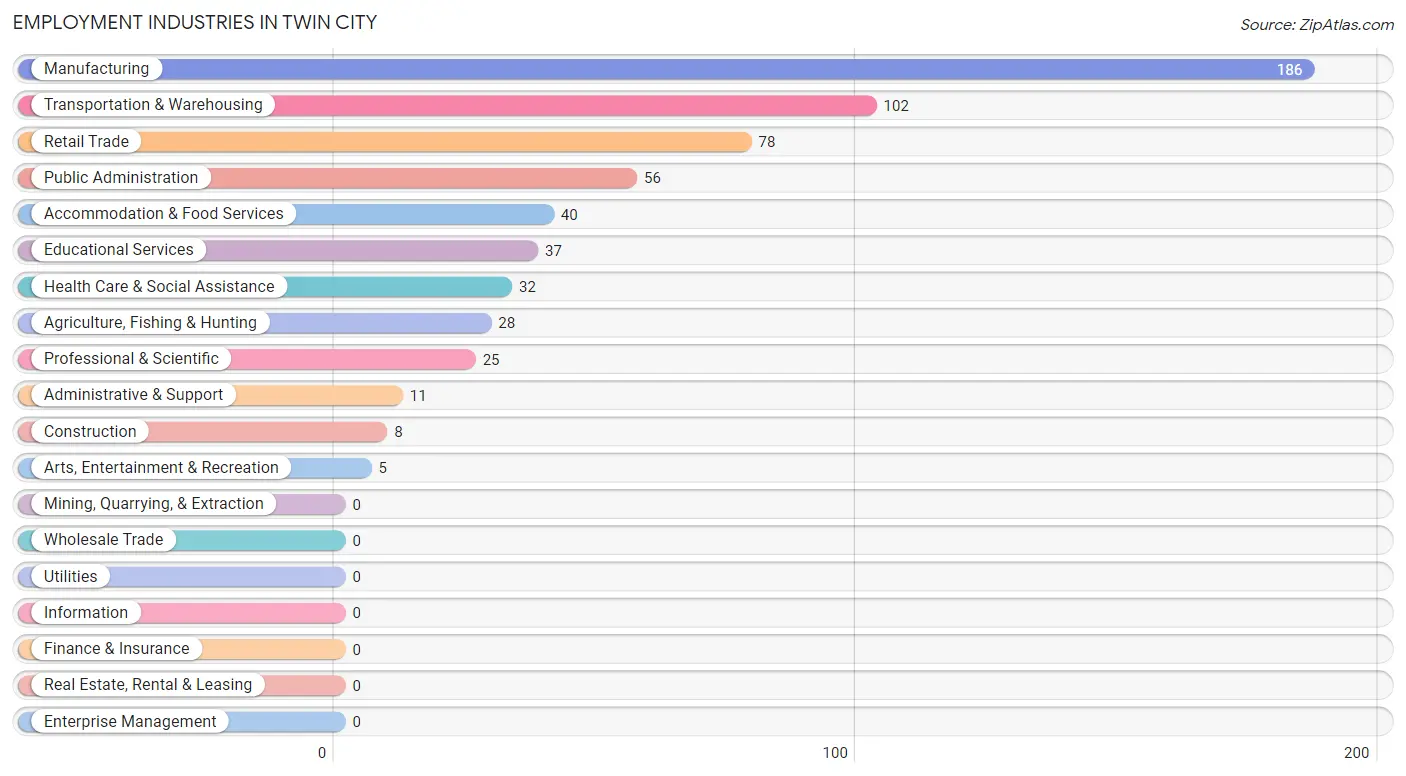
Employment Industries in Twin City
The major employment industries in Twin City include Manufacturing (186 | 30.0%), Transportation & Warehousing (102 | 16.5%), Retail Trade (78 | 12.6%), Public Administration (56 | 9.0%), and Accommodation & Food Services (40 | 6.5%).
Employment Industries by Sex in Twin City
The Twin City industries that see more men than women are Construction (100.0%), Administrative & Support (100.0%), and Arts, Entertainment & Recreation (100.0%), whereas the industries that tend to have a higher number of women are Professional & Scientific (100.0%), Health Care & Social Assistance (100.0%), and Retail Trade (82.1%).
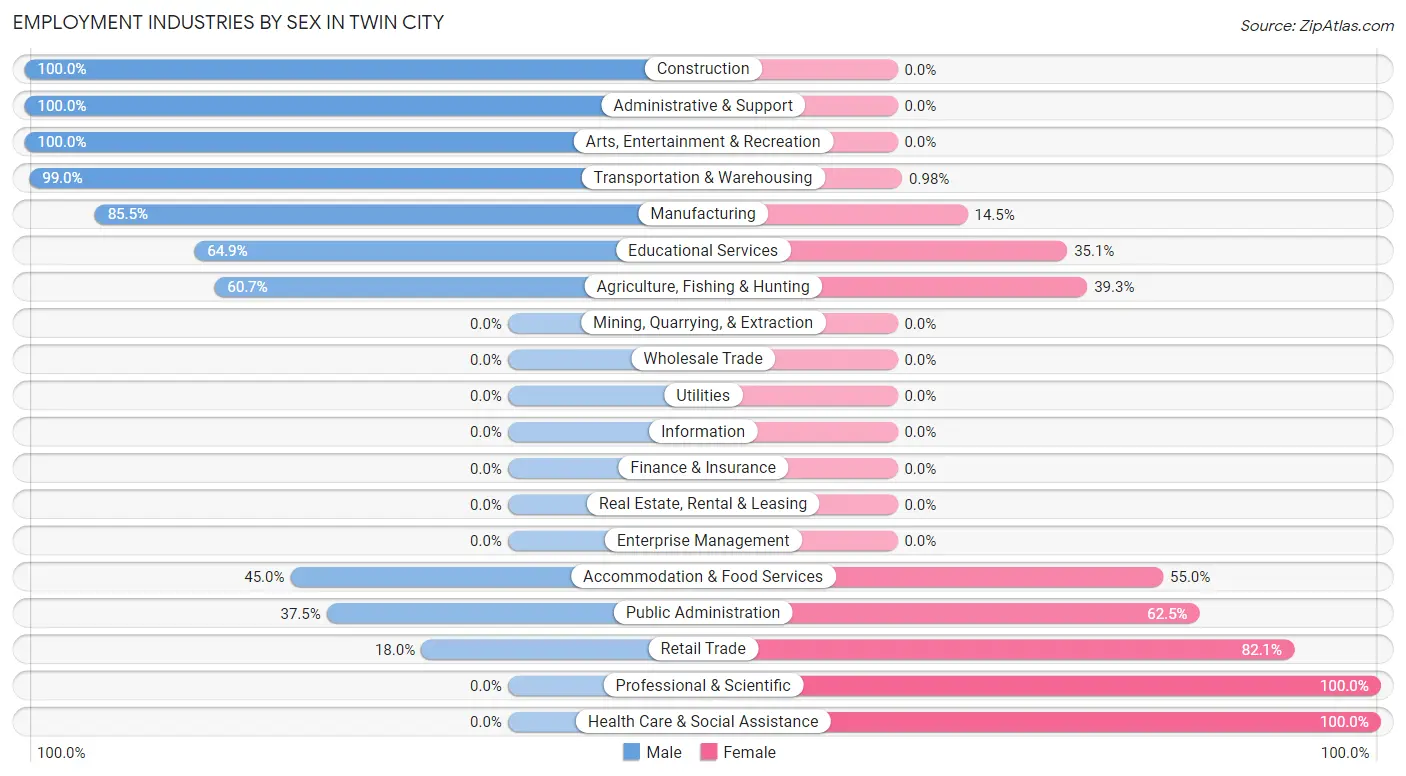
| Industry | Male | Female |
| Agriculture, Fishing & Hunting | 17 (60.7%) | 11 (39.3%) |
| Mining, Quarrying, & Extraction | 0 (0.0%) | 0 (0.0%) |
| Construction | 8 (100.0%) | 0 (0.0%) |
| Manufacturing | 159 (85.5%) | 27 (14.5%) |
| Wholesale Trade | 0 (0.0%) | 0 (0.0%) |
| Retail Trade | 14 (17.9%) | 64 (82.1%) |
| Transportation & Warehousing | 101 (99.0%) | 1 (1.0%) |
| Utilities | 0 (0.0%) | 0 (0.0%) |
| Information | 0 (0.0%) | 0 (0.0%) |
| Finance & Insurance | 0 (0.0%) | 0 (0.0%) |
| Real Estate, Rental & Leasing | 0 (0.0%) | 0 (0.0%) |
| Professional & Scientific | 0 (0.0%) | 25 (100.0%) |
| Enterprise Management | 0 (0.0%) | 0 (0.0%) |
| Administrative & Support | 11 (100.0%) | 0 (0.0%) |
| Educational Services | 24 (64.9%) | 13 (35.1%) |
| Health Care & Social Assistance | 0 (0.0%) | 32 (100.0%) |
| Arts, Entertainment & Recreation | 5 (100.0%) | 0 (0.0%) |
| Accommodation & Food Services | 18 (45.0%) | 22 (55.0%) |
| Public Administration | 21 (37.5%) | 35 (62.5%) |
| Total | 386 (62.4%) | 233 (37.6%) |
Education in Twin City
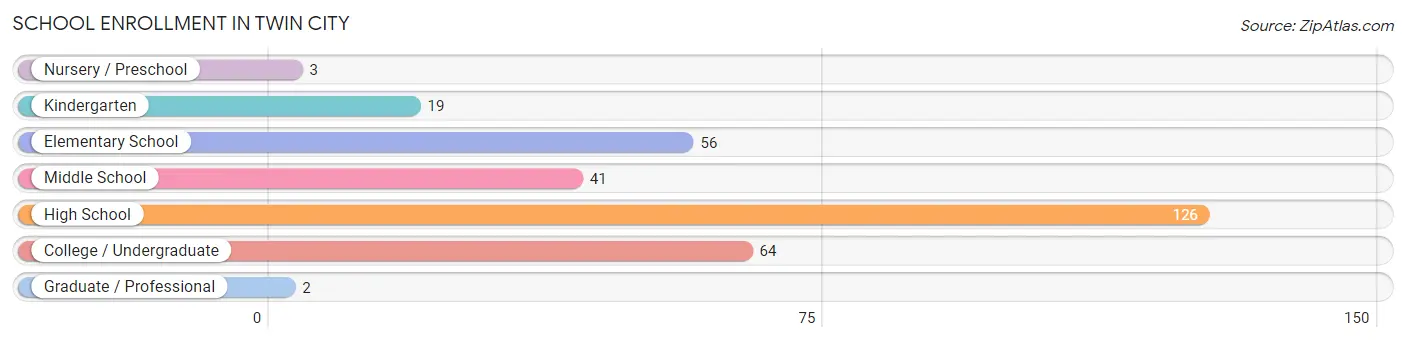
School Enrollment in Twin City
The most common levels of schooling among the 311 students in Twin City are high school (126 | 40.5%), college / undergraduate (64 | 20.6%), and elementary school (56 | 18.0%).
| School Level | # Students | % Students |
| Nursery / Preschool | 3 | 1.0% |
| Kindergarten | 19 | 6.1% |
| Elementary School | 56 | 18.0% |
| Middle School | 41 | 13.2% |
| High School | 126 | 40.5% |
| College / Undergraduate | 64 | 20.6% |
| Graduate / Professional | 2 | 0.6% |
| Total | 311 | 100.0% |
School Enrollment by Age by Funding Source in Twin City
Out of a total of 311 students who are enrolled in schools in Twin City, 25 (8.0%) attend a private institution, while the remaining 286 (92.0%) are enrolled in public schools. The age group of 3 to 4 year olds has the highest likelihood of being enrolled in private schools, with 3 (100.0% in the age bracket) enrolled. Conversely, the age group of 5 to 9 year old has the lowest likelihood of being enrolled in a private school, with 42 (100.0% in the age bracket) attending a public institution.
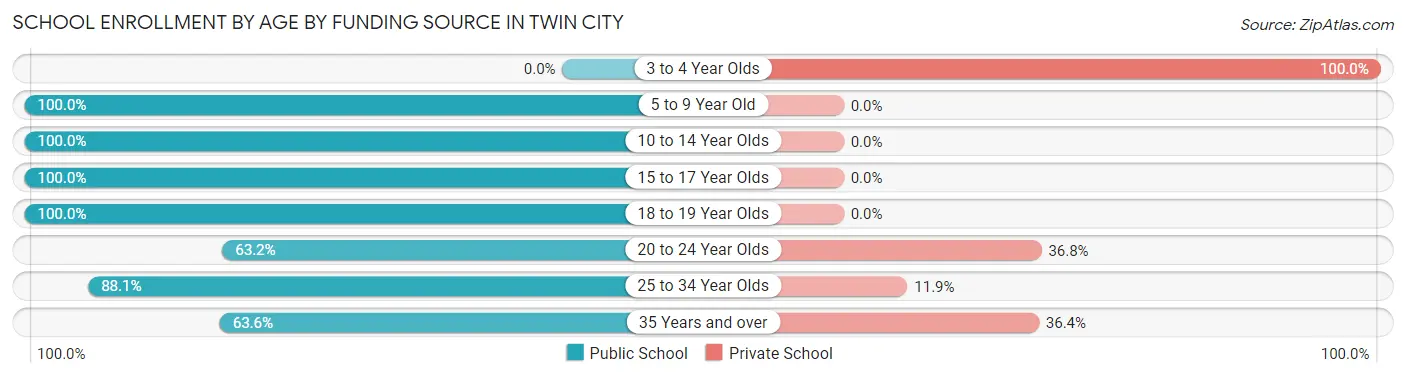
| Age Bracket | Public School | Private School |
| 3 to 4 Year Olds | 0 (0.0%) | 3 (100.0%) |
| 5 to 9 Year Old | 42 (100.0%) | 0 (0.0%) |
| 10 to 14 Year Olds | 101 (100.0%) | 0 (0.0%) |
| 15 to 17 Year Olds | 48 (100.0%) | 0 (0.0%) |
| 18 to 19 Year Olds | 17 (100.0%) | 0 (0.0%) |
| 20 to 24 Year Olds | 12 (63.2%) | 7 (36.8%) |
| 25 to 34 Year Olds | 52 (88.1%) | 7 (11.9%) |
| 35 Years and over | 14 (63.6%) | 8 (36.4%) |
| Total | 286 (92.0%) | 25 (8.0%) |
Educational Attainment by Field of Study in Twin City
Education (22 | 42.3%), arts & humanities (8 | 15.4%), physical & health sciences (6 | 11.5%), engineering (6 | 11.5%), and bio, nature & agricultural (2 | 3.8%) are the most common fields of study among 52 individuals in Twin City who have obtained a bachelor's degree or higher.
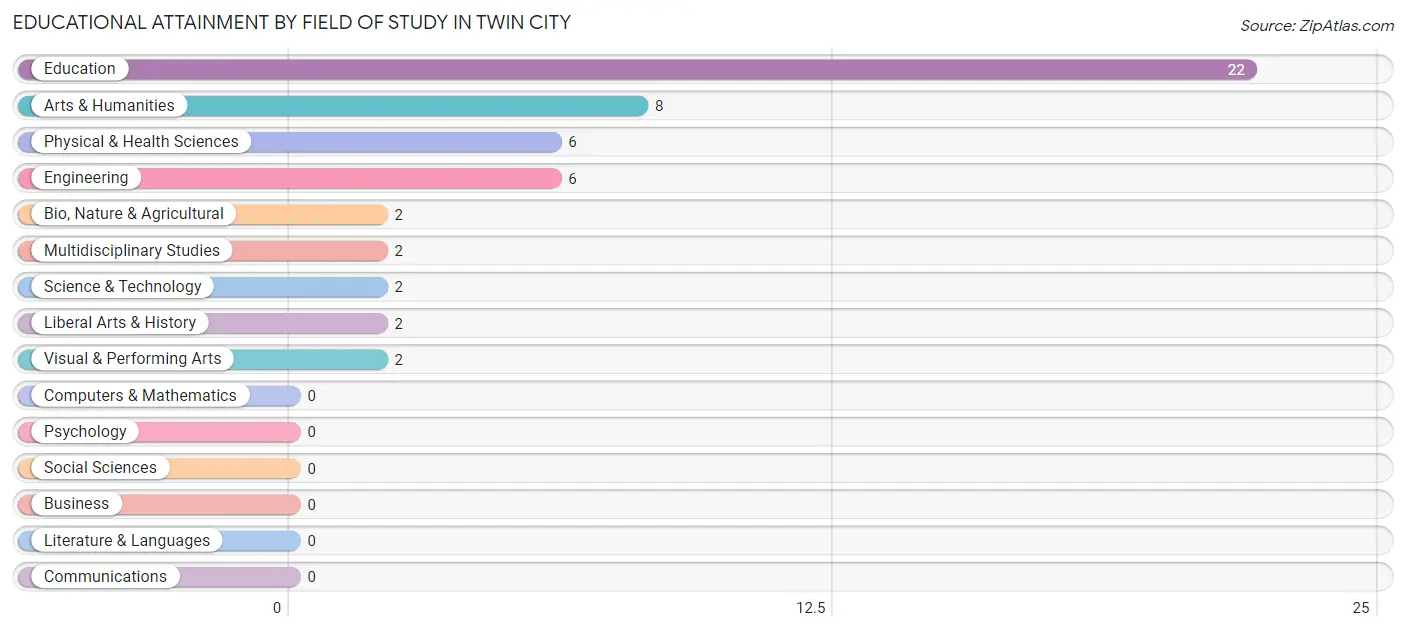
| Field of Study | # Graduates | % Graduates |
| Computers & Mathematics | 0 | 0.0% |
| Bio, Nature & Agricultural | 2 | 3.8% |
| Physical & Health Sciences | 6 | 11.5% |
| Psychology | 0 | 0.0% |
| Social Sciences | 0 | 0.0% |
| Engineering | 6 | 11.5% |
| Multidisciplinary Studies | 2 | 3.8% |
| Science & Technology | 2 | 3.8% |
| Business | 0 | 0.0% |
| Education | 22 | 42.3% |
| Literature & Languages | 0 | 0.0% |
| Liberal Arts & History | 2 | 3.8% |
| Visual & Performing Arts | 2 | 3.8% |
| Communications | 0 | 0.0% |
| Arts & Humanities | 8 | 15.4% |
| Total | 52 | 100.0% |
Transportation & Commute in Twin City
Vehicle Availability by Sex in Twin City
The most prevalent vehicle ownership categories in Twin City are males with 2 vehicles (177, accounting for 49.6%) and females with 2 vehicles (92, making up 85.9%).
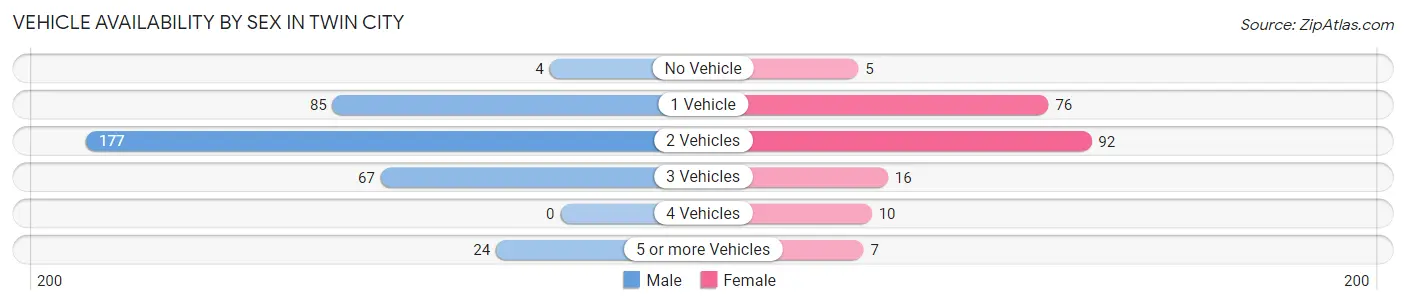
| Vehicles Available | Male | Female |
| No Vehicle | 4 (1.1%) | 5 (2.4%) |
| 1 Vehicle | 85 (23.8%) | 76 (36.9%) |
| 2 Vehicles | 177 (49.6%) | 92 (44.7%) |
| 3 Vehicles | 67 (18.8%) | 16 (7.8%) |
| 4 Vehicles | 0 (0.0%) | 10 (4.9%) |
| 5 or more Vehicles | 24 (6.7%) | 7 (3.4%) |
| Total | 357 (100.0%) | 206 (100.0%) |
Commute Time in Twin City
The most frequently occuring commute durations in Twin City are 60 to 89 minutes (92 commuters, 16.3%), 35 to 39 minutes (80 commuters, 14.2%), and 30 to 34 minutes (76 commuters, 13.5%).
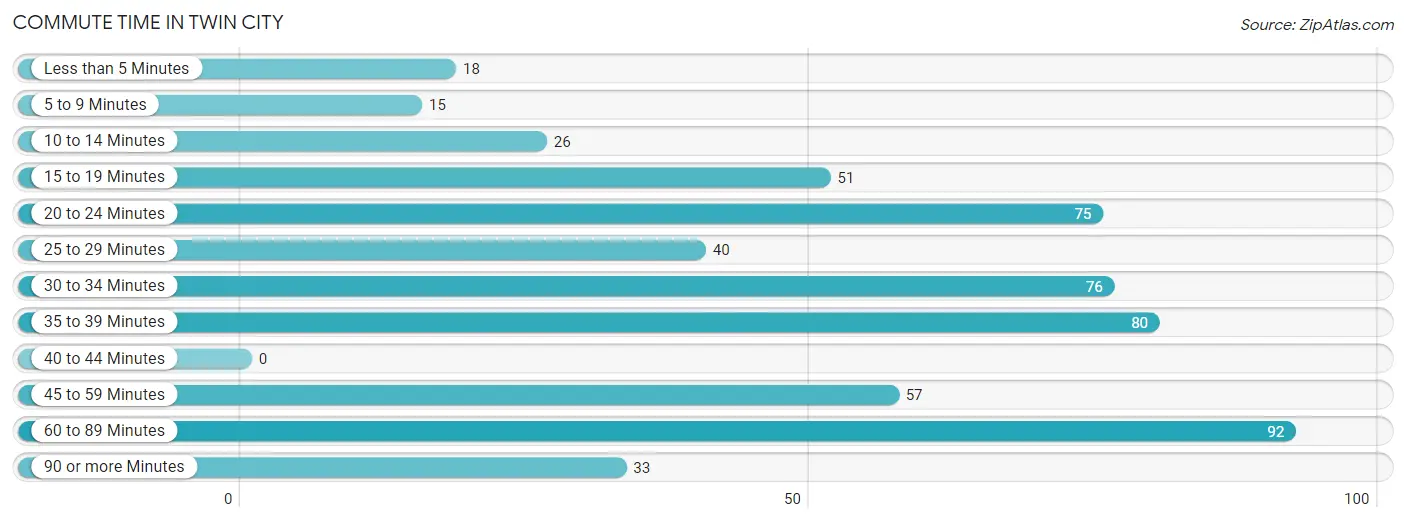
| Commute Time | # Commuters | % Commuters |
| Less than 5 Minutes | 18 | 3.2% |
| 5 to 9 Minutes | 15 | 2.7% |
| 10 to 14 Minutes | 26 | 4.6% |
| 15 to 19 Minutes | 51 | 9.1% |
| 20 to 24 Minutes | 75 | 13.3% |
| 25 to 29 Minutes | 40 | 7.1% |
| 30 to 34 Minutes | 76 | 13.5% |
| 35 to 39 Minutes | 80 | 14.2% |
| 40 to 44 Minutes | 0 | 0.0% |
| 45 to 59 Minutes | 57 | 10.1% |
| 60 to 89 Minutes | 92 | 16.3% |
| 90 or more Minutes | 33 | 5.9% |
Commute Time by Sex in Twin City
The most common commute times in Twin City are 60 to 89 minutes (92 commuters, 25.8%) for males and 30 to 34 minutes (42 commuters, 20.4%) for females.
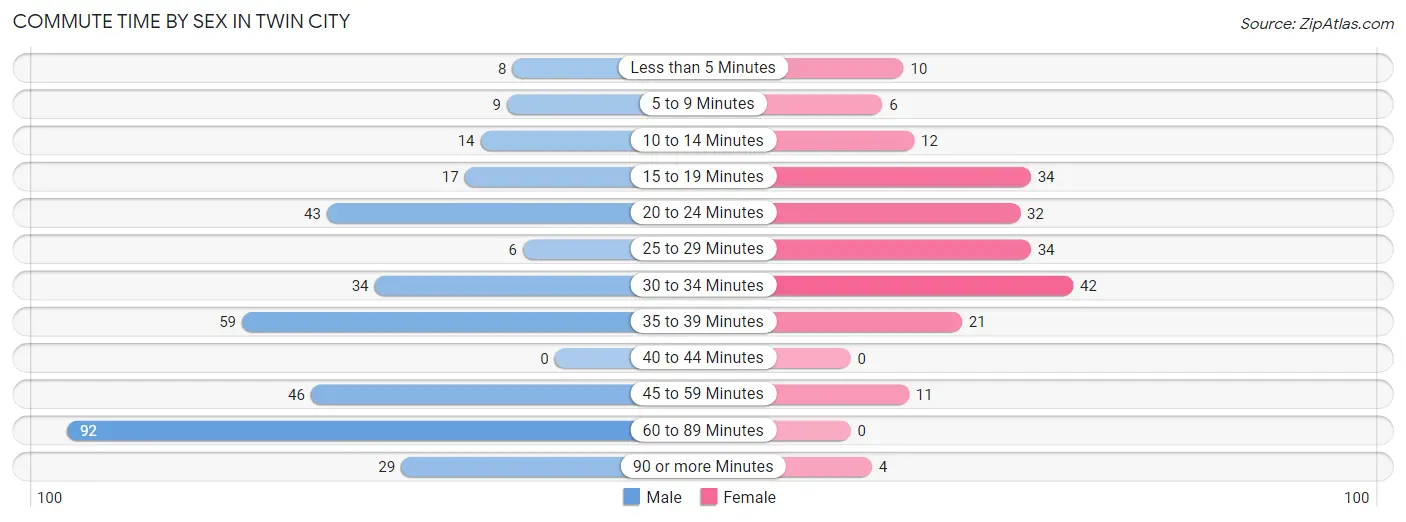
| Commute Time | Male | Female |
| Less than 5 Minutes | 8 (2.2%) | 10 (4.9%) |
| 5 to 9 Minutes | 9 (2.5%) | 6 (2.9%) |
| 10 to 14 Minutes | 14 (3.9%) | 12 (5.8%) |
| 15 to 19 Minutes | 17 (4.8%) | 34 (16.5%) |
| 20 to 24 Minutes | 43 (12.0%) | 32 (15.5%) |
| 25 to 29 Minutes | 6 (1.7%) | 34 (16.5%) |
| 30 to 34 Minutes | 34 (9.5%) | 42 (20.4%) |
| 35 to 39 Minutes | 59 (16.5%) | 21 (10.2%) |
| 40 to 44 Minutes | 0 (0.0%) | 0 (0.0%) |
| 45 to 59 Minutes | 46 (12.9%) | 11 (5.3%) |
| 60 to 89 Minutes | 92 (25.8%) | 0 (0.0%) |
| 90 or more Minutes | 29 (8.1%) | 4 (1.9%) |
Time of Departure to Work by Sex in Twin City
The most frequent times of departure to work in Twin City are 5:00 AM to 5:29 AM (81, 22.7%) for males and 12:00 AM to 4:59 AM (45, 21.8%) for females.
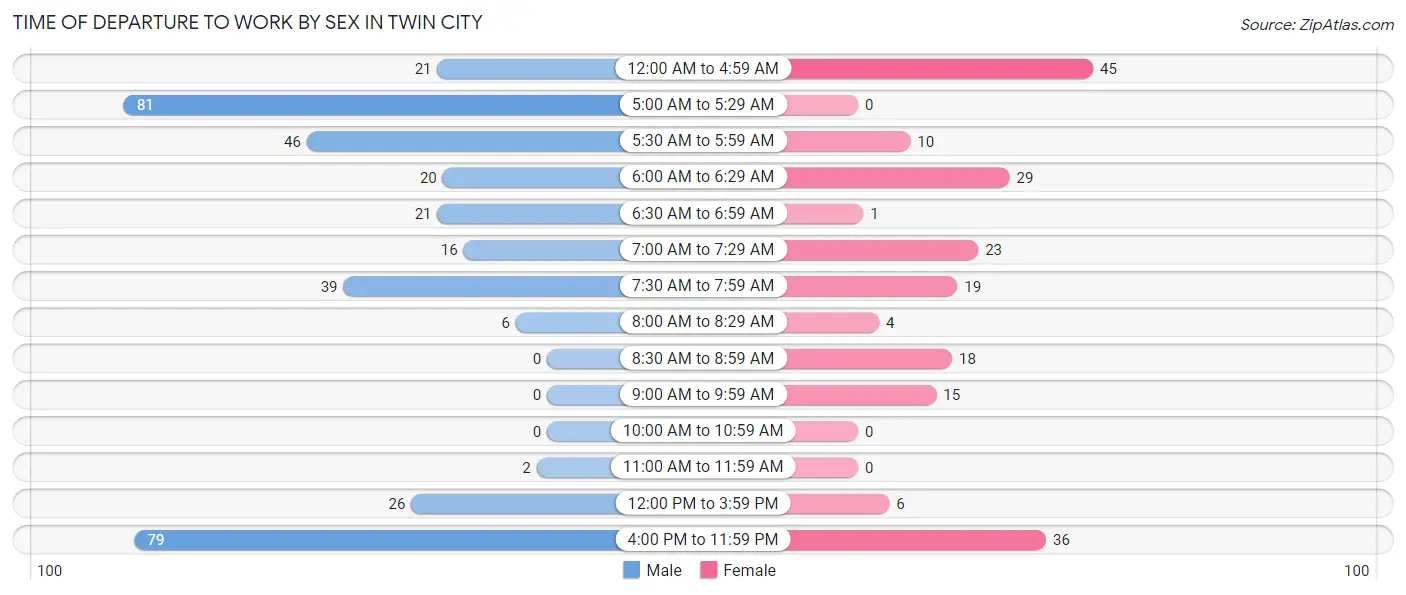
| Time of Departure | Male | Female |
| 12:00 AM to 4:59 AM | 21 (5.9%) | 45 (21.8%) |
| 5:00 AM to 5:29 AM | 81 (22.7%) | 0 (0.0%) |
| 5:30 AM to 5:59 AM | 46 (12.9%) | 10 (4.9%) |
| 6:00 AM to 6:29 AM | 20 (5.6%) | 29 (14.1%) |
| 6:30 AM to 6:59 AM | 21 (5.9%) | 1 (0.5%) |
| 7:00 AM to 7:29 AM | 16 (4.5%) | 23 (11.2%) |
| 7:30 AM to 7:59 AM | 39 (10.9%) | 19 (9.2%) |
| 8:00 AM to 8:29 AM | 6 (1.7%) | 4 (1.9%) |
| 8:30 AM to 8:59 AM | 0 (0.0%) | 18 (8.7%) |
| 9:00 AM to 9:59 AM | 0 (0.0%) | 15 (7.3%) |
| 10:00 AM to 10:59 AM | 0 (0.0%) | 0 (0.0%) |
| 11:00 AM to 11:59 AM | 2 (0.6%) | 0 (0.0%) |
| 12:00 PM to 3:59 PM | 26 (7.3%) | 6 (2.9%) |
| 4:00 PM to 11:59 PM | 79 (22.1%) | 36 (17.5%) |
| Total | 357 (100.0%) | 206 (100.0%) |
Housing Occupancy in Twin City
Occupancy by Ownership in Twin City
Of the total 597 dwellings in Twin City, owner-occupied units account for 278 (46.6%), while renter-occupied units make up 319 (53.4%).
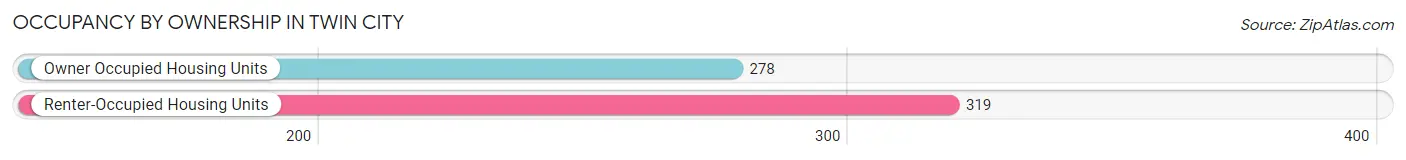
| Occupancy | # Housing Units | % Housing Units |
| Owner Occupied Housing Units | 278 | 46.6% |
| Renter-Occupied Housing Units | 319 | 53.4% |
| Total Occupied Housing Units | 597 | 100.0% |
Occupancy by Household Size in Twin City
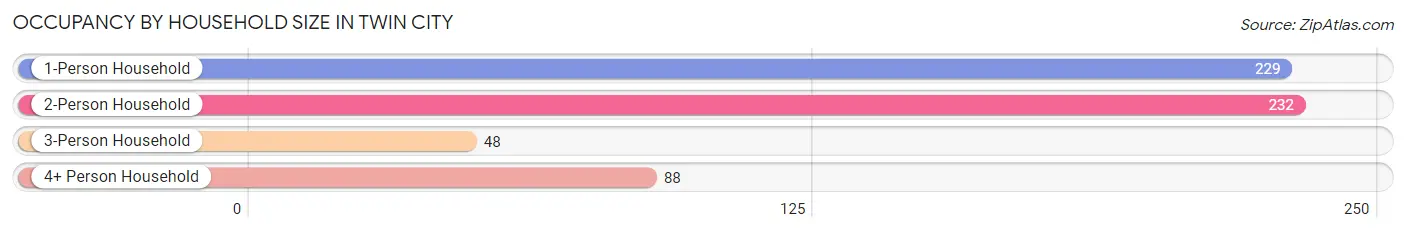
| Household Size | # Housing Units | % Housing Units |
| 1-Person Household | 229 | 38.4% |
| 2-Person Household | 232 | 38.9% |
| 3-Person Household | 48 | 8.0% |
| 4+ Person Household | 88 | 14.7% |
| Total Housing Units | 597 | 100.0% |
Occupancy by Ownership by Household Size in Twin City
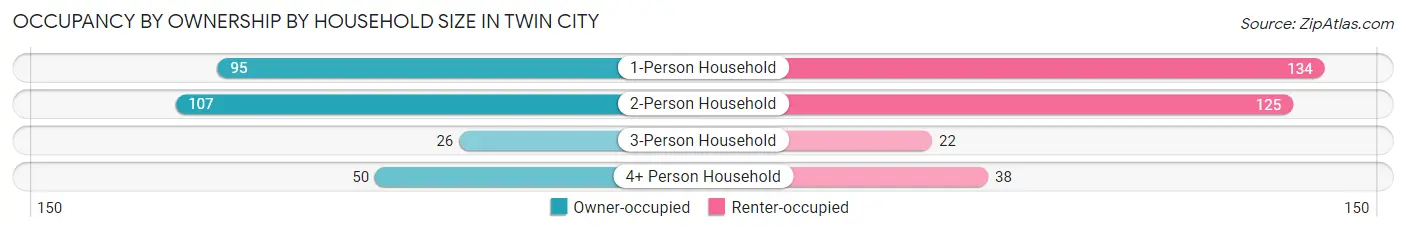
| Household Size | Owner-occupied | Renter-occupied |
| 1-Person Household | 95 (41.5%) | 134 (58.5%) |
| 2-Person Household | 107 (46.1%) | 125 (53.9%) |
| 3-Person Household | 26 (54.2%) | 22 (45.8%) |
| 4+ Person Household | 50 (56.8%) | 38 (43.2%) |
| Total Housing Units | 278 (46.6%) | 319 (53.4%) |
Occupancy by Educational Attainment in Twin City
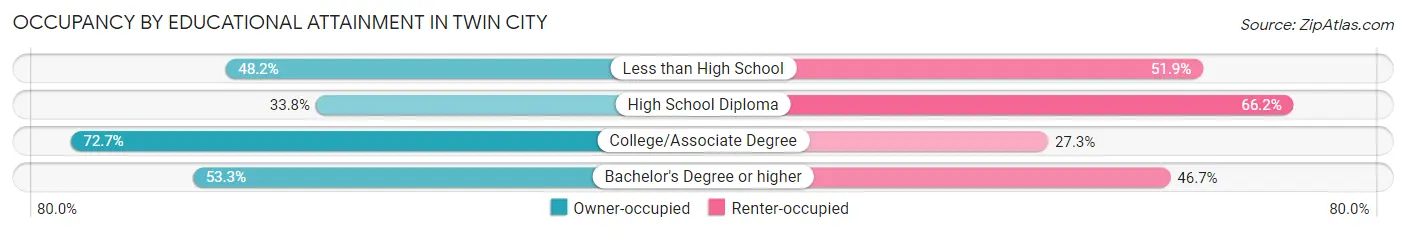
| Household Size | Owner-occupied | Renter-occupied |
| Less than High School | 78 (48.1%) | 84 (51.8%) |
| High School Diploma | 96 (33.8%) | 188 (66.2%) |
| College/Associate Degree | 88 (72.7%) | 33 (27.3%) |
| Bachelor's Degree or higher | 16 (53.3%) | 14 (46.7%) |
Occupancy by Age of Householder in Twin City
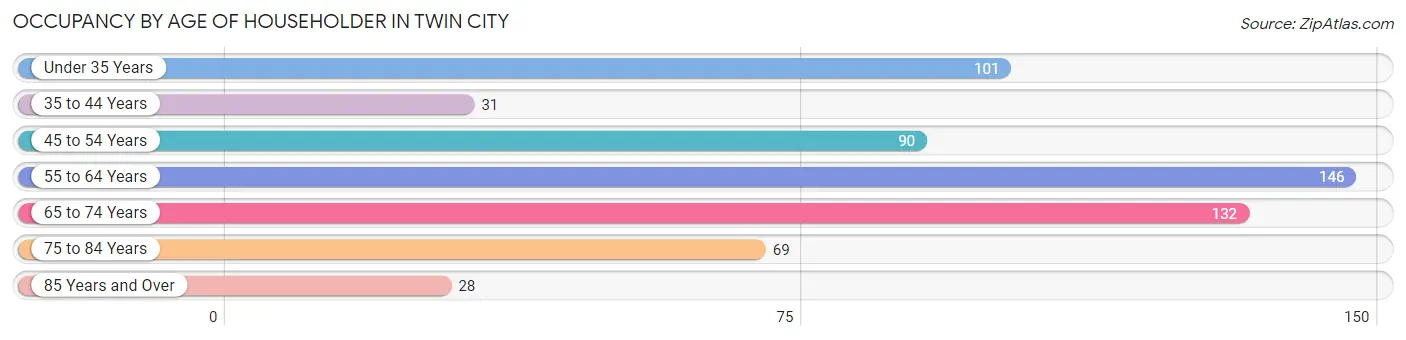
| Age Bracket | # Households | % Households |
| Under 35 Years | 101 | 16.9% |
| 35 to 44 Years | 31 | 5.2% |
| 45 to 54 Years | 90 | 15.1% |
| 55 to 64 Years | 146 | 24.5% |
| 65 to 74 Years | 132 | 22.1% |
| 75 to 84 Years | 69 | 11.6% |
| 85 Years and Over | 28 | 4.7% |
| Total | 597 | 100.0% |
Housing Finances in Twin City
Median Income by Occupancy in Twin City
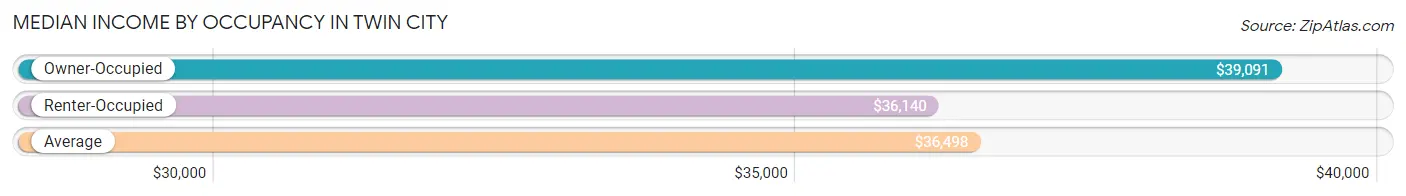
| Occupancy Type | # Households | Median Income |
| Owner-Occupied | 278 (46.6%) | $39,091 |
| Renter-Occupied | 319 (53.4%) | $36,140 |
| Average | 597 (100.0%) | $36,498 |
Occupancy by Householder Income Bracket in Twin City
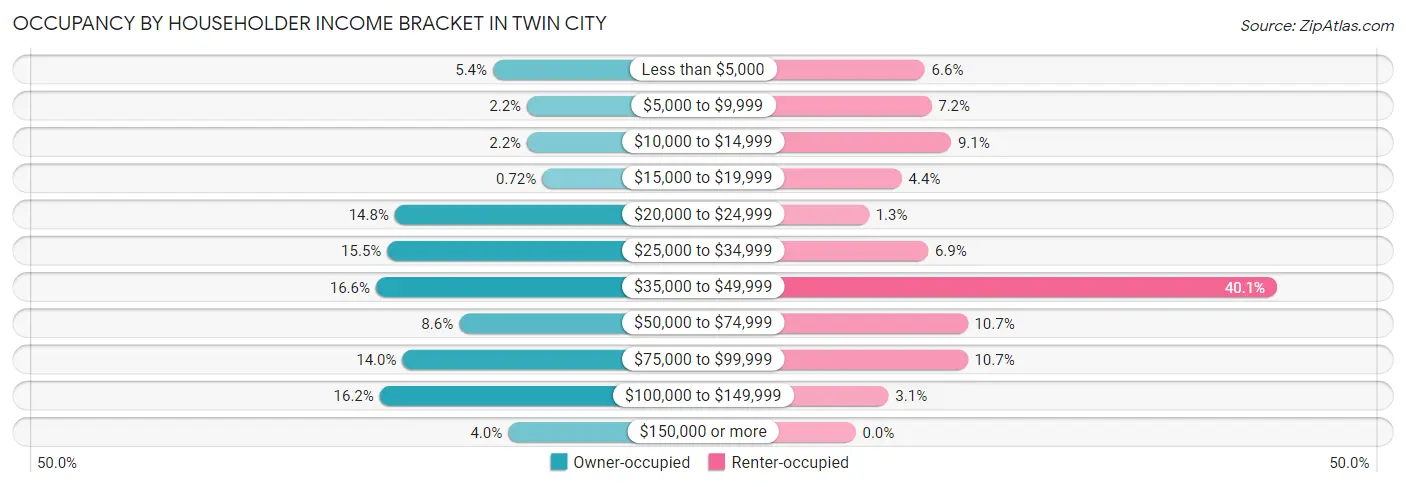
| Income Bracket | Owner-occupied | Renter-occupied |
| Less than $5,000 | 15 (5.4%) | 21 (6.6%) |
| $5,000 to $9,999 | 6 (2.2%) | 23 (7.2%) |
| $10,000 to $14,999 | 6 (2.2%) | 29 (9.1%) |
| $15,000 to $19,999 | 2 (0.7%) | 14 (4.4%) |
| $20,000 to $24,999 | 41 (14.7%) | 4 (1.3%) |
| $25,000 to $34,999 | 43 (15.5%) | 22 (6.9%) |
| $35,000 to $49,999 | 46 (16.6%) | 128 (40.1%) |
| $50,000 to $74,999 | 24 (8.6%) | 34 (10.7%) |
| $75,000 to $99,999 | 39 (14.0%) | 34 (10.7%) |
| $100,000 to $149,999 | 45 (16.2%) | 10 (3.1%) |
| $150,000 or more | 11 (4.0%) | 0 (0.0%) |
| Total | 278 (100.0%) | 319 (100.0%) |
Monthly Housing Cost Tiers in Twin City
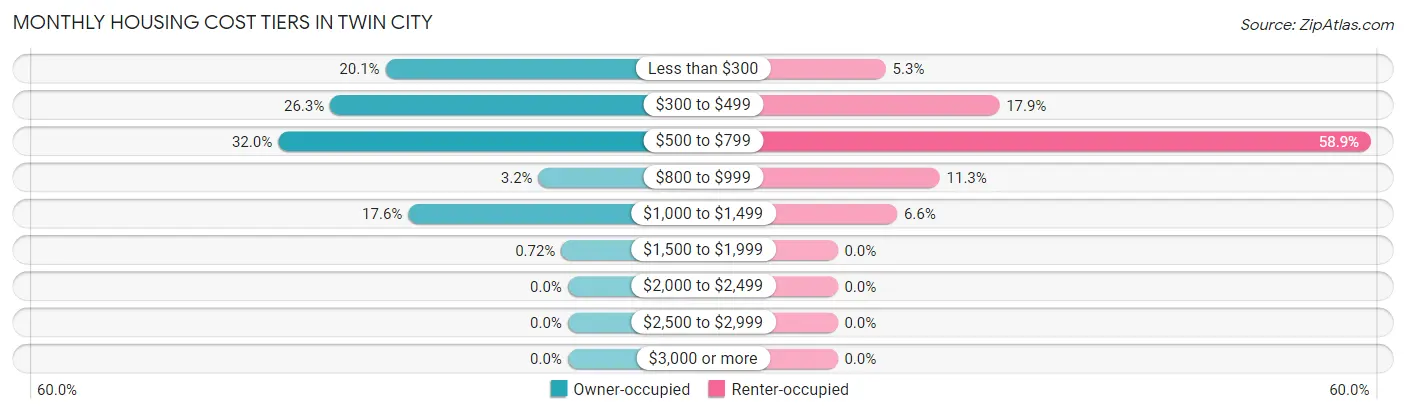
| Monthly Cost | Owner-occupied | Renter-occupied |
| Less than $300 | 56 (20.1%) | 17 (5.3%) |
| $300 to $499 | 73 (26.3%) | 57 (17.9%) |
| $500 to $799 | 89 (32.0%) | 188 (58.9%) |
| $800 to $999 | 9 (3.2%) | 36 (11.3%) |
| $1,000 to $1,499 | 49 (17.6%) | 21 (6.6%) |
| $1,500 to $1,999 | 2 (0.7%) | 0 (0.0%) |
| $2,000 to $2,499 | 0 (0.0%) | 0 (0.0%) |
| $2,500 to $2,999 | 0 (0.0%) | 0 (0.0%) |
| $3,000 or more | 0 (0.0%) | 0 (0.0%) |
| Total | 278 (100.0%) | 319 (100.0%) |
Physical Housing Characteristics in Twin City
Housing Structures in Twin City
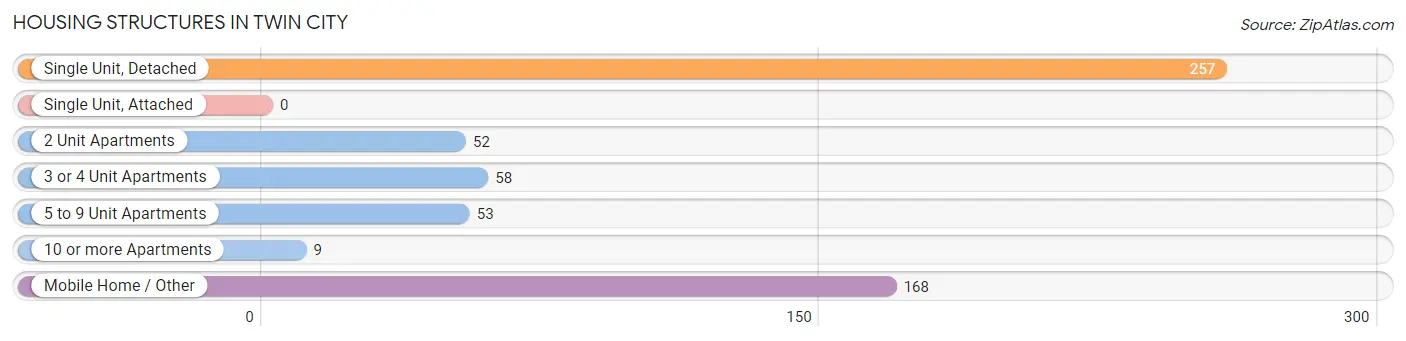
| Structure Type | # Housing Units | % Housing Units |
| Single Unit, Detached | 257 | 43.0% |
| Single Unit, Attached | 0 | 0.0% |
| 2 Unit Apartments | 52 | 8.7% |
| 3 or 4 Unit Apartments | 58 | 9.7% |
| 5 to 9 Unit Apartments | 53 | 8.9% |
| 10 or more Apartments | 9 | 1.5% |
| Mobile Home / Other | 168 | 28.1% |
| Total | 597 | 100.0% |
Housing Structures by Occupancy in Twin City
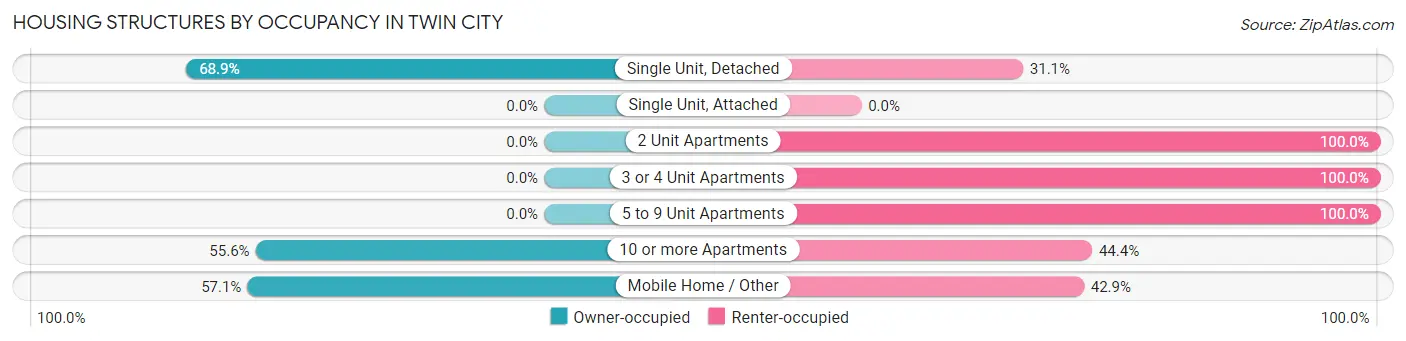
| Structure Type | Owner-occupied | Renter-occupied |
| Single Unit, Detached | 177 (68.9%) | 80 (31.1%) |
| Single Unit, Attached | 0 (0.0%) | 0 (0.0%) |
| 2 Unit Apartments | 0 (0.0%) | 52 (100.0%) |
| 3 or 4 Unit Apartments | 0 (0.0%) | 58 (100.0%) |
| 5 to 9 Unit Apartments | 0 (0.0%) | 53 (100.0%) |
| 10 or more Apartments | 5 (55.6%) | 4 (44.4%) |
| Mobile Home / Other | 96 (57.1%) | 72 (42.9%) |
| Total | 278 (46.6%) | 319 (53.4%) |
Housing Structures by Number of Rooms in Twin City
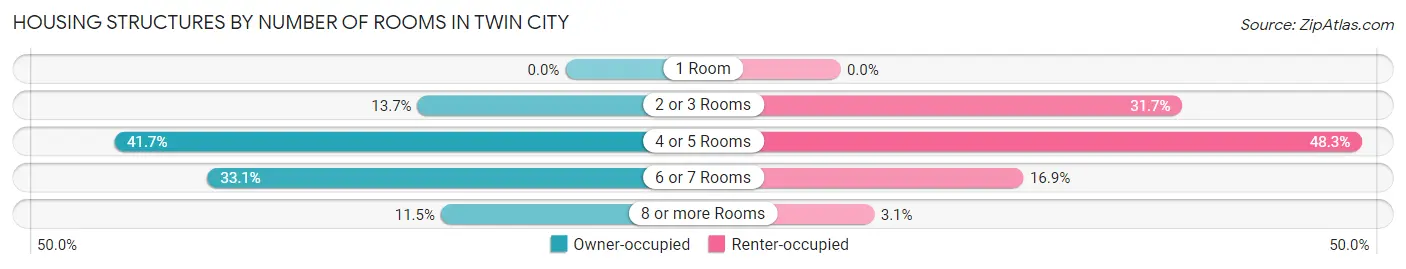
| Number of Rooms | Owner-occupied | Renter-occupied |
| 1 Room | 0 (0.0%) | 0 (0.0%) |
| 2 or 3 Rooms | 38 (13.7%) | 101 (31.7%) |
| 4 or 5 Rooms | 116 (41.7%) | 154 (48.3%) |
| 6 or 7 Rooms | 92 (33.1%) | 54 (16.9%) |
| 8 or more Rooms | 32 (11.5%) | 10 (3.1%) |
| Total | 278 (100.0%) | 319 (100.0%) |
Housing Structure by Heating Type in Twin City
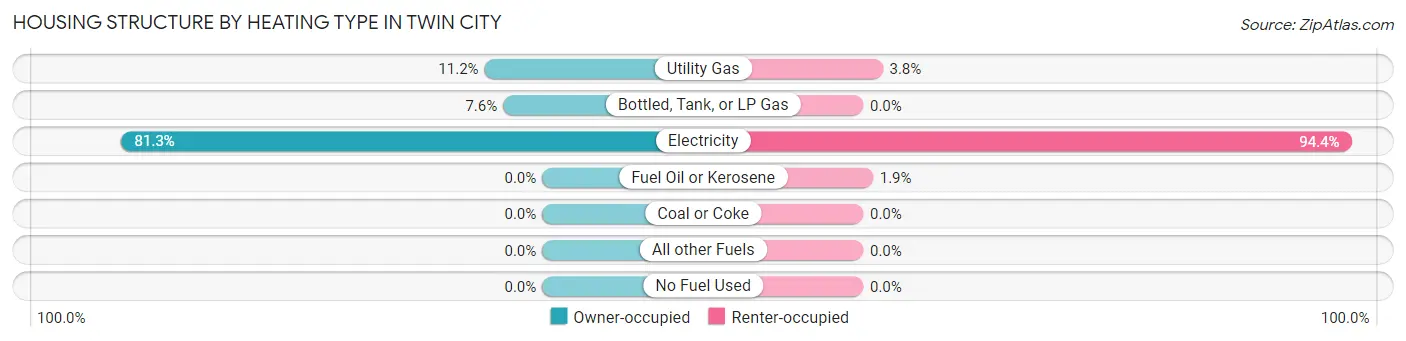
| Heating Type | Owner-occupied | Renter-occupied |
| Utility Gas | 31 (11.2%) | 12 (3.8%) |
| Bottled, Tank, or LP Gas | 21 (7.5%) | 0 (0.0%) |
| Electricity | 226 (81.3%) | 301 (94.4%) |
| Fuel Oil or Kerosene | 0 (0.0%) | 6 (1.9%) |
| Coal or Coke | 0 (0.0%) | 0 (0.0%) |
| All other Fuels | 0 (0.0%) | 0 (0.0%) |
| No Fuel Used | 0 (0.0%) | 0 (0.0%) |
| Total | 278 (100.0%) | 319 (100.0%) |
Household Vehicle Usage in Twin City
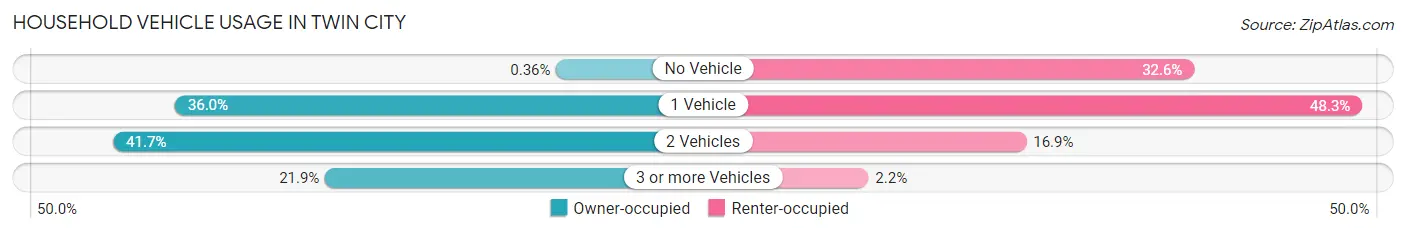
| Vehicles per Household | Owner-occupied | Renter-occupied |
| No Vehicle | 1 (0.4%) | 104 (32.6%) |
| 1 Vehicle | 100 (36.0%) | 154 (48.3%) |
| 2 Vehicles | 116 (41.7%) | 54 (16.9%) |
| 3 or more Vehicles | 61 (21.9%) | 7 (2.2%) |
| Total | 278 (100.0%) | 319 (100.0%) |
Real Estate & Mortgages in Twin City
Real Estate and Mortgage Overview in Twin City
| Characteristic | Without Mortgage | With Mortgage |
| Housing Units | 180 | 98 |
| Median Property Value | $54,000 | $104,700 |
| Median Household Income | $32,115 | $8 |
| Monthly Housing Costs | $407 | $0 |
| Real Estate Taxes | $676 | $5 |
Property Value by Mortgage Status in Twin City
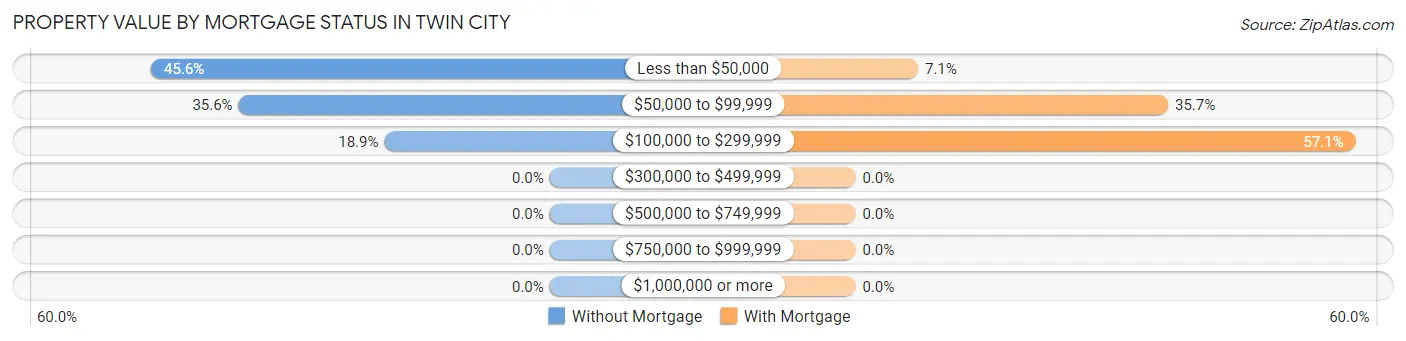
| Property Value | Without Mortgage | With Mortgage |
| Less than $50,000 | 82 (45.6%) | 7 (7.1%) |
| $50,000 to $99,999 | 64 (35.6%) | 35 (35.7%) |
| $100,000 to $299,999 | 34 (18.9%) | 56 (57.1%) |
| $300,000 to $499,999 | 0 (0.0%) | 0 (0.0%) |
| $500,000 to $749,999 | 0 (0.0%) | 0 (0.0%) |
| $750,000 to $999,999 | 0 (0.0%) | 0 (0.0%) |
| $1,000,000 or more | 0 (0.0%) | 0 (0.0%) |
| Total | 180 (100.0%) | 98 (100.0%) |
Household Income by Mortgage Status in Twin City
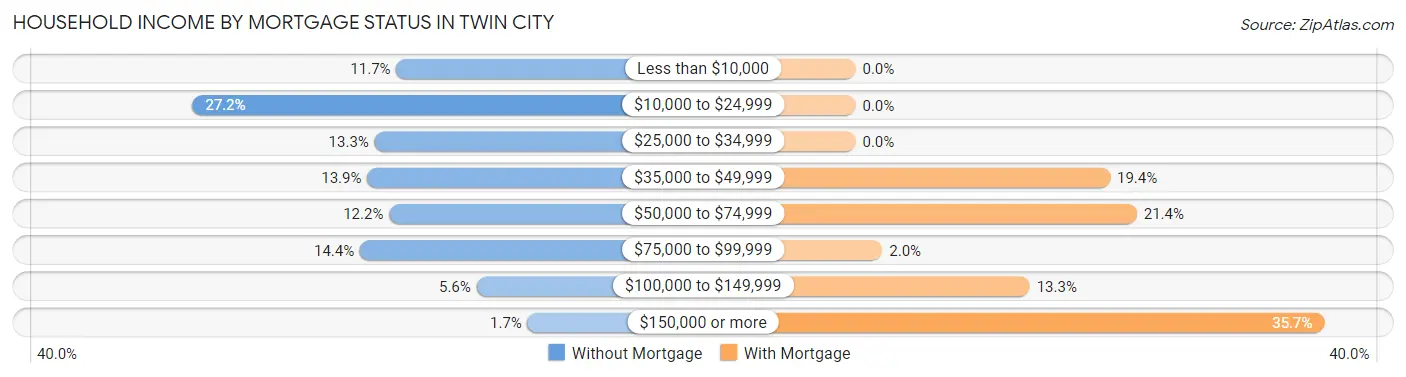
| Household Income | Without Mortgage | With Mortgage |
| Less than $10,000 | 21 (11.7%) | 0 (0.0%) |
| $10,000 to $24,999 | 49 (27.2%) | 0 (0.0%) |
| $25,000 to $34,999 | 24 (13.3%) | 0 (0.0%) |
| $35,000 to $49,999 | 25 (13.9%) | 19 (19.4%) |
| $50,000 to $74,999 | 22 (12.2%) | 21 (21.4%) |
| $75,000 to $99,999 | 26 (14.4%) | 2 (2.0%) |
| $100,000 to $149,999 | 10 (5.6%) | 13 (13.3%) |
| $150,000 or more | 3 (1.7%) | 35 (35.7%) |
| Total | 180 (100.0%) | 98 (100.0%) |
Property Value to Household Income Ratio in Twin City
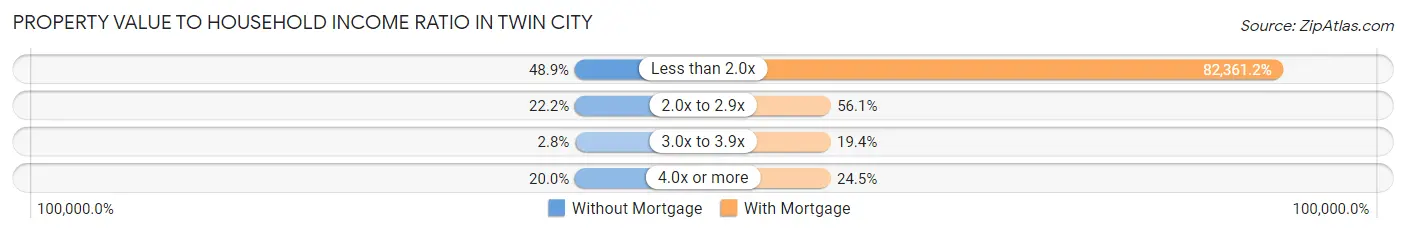
| Value-to-Income Ratio | Without Mortgage | With Mortgage |
| Less than 2.0x | 88 (48.9%) | 80,714 (82,361.2%) |
| 2.0x to 2.9x | 40 (22.2%) | 55 (56.1%) |
| 3.0x to 3.9x | 5 (2.8%) | 19 (19.4%) |
| 4.0x or more | 36 (20.0%) | 24 (24.5%) |
| Total | 180 (100.0%) | 98 (100.0%) |
Real Estate Taxes by Mortgage Status in Twin City
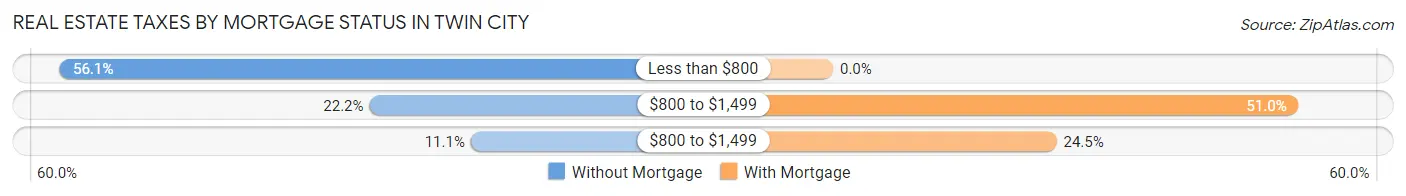
| Property Taxes | Without Mortgage | With Mortgage |
| Less than $800 | 101 (56.1%) | 0 (0.0%) |
| $800 to $1,499 | 40 (22.2%) | 50 (51.0%) |
| $800 to $1,499 | 20 (11.1%) | 24 (24.5%) |
| Total | 180 (100.0%) | 98 (100.0%) |
Health & Disability in Twin City
Health Insurance Coverage by Age in Twin City
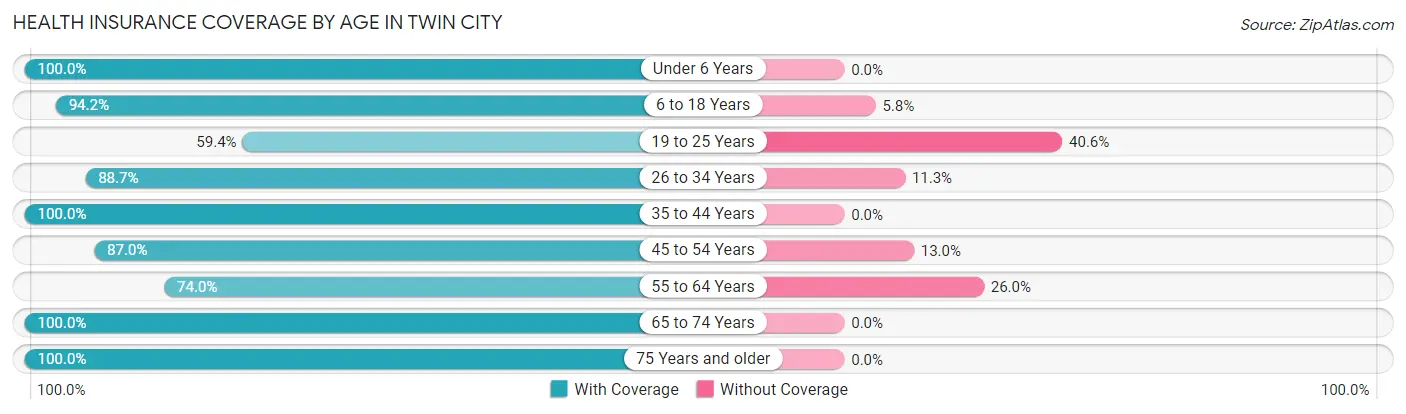
| Age Bracket | With Coverage | Without Coverage |
| Under 6 Years | 66 (100.0%) | 0 (0.0%) |
| 6 to 18 Years | 162 (94.2%) | 10 (5.8%) |
| 19 to 25 Years | 95 (59.4%) | 65 (40.6%) |
| 26 to 34 Years | 243 (88.7%) | 31 (11.3%) |
| 35 to 44 Years | 73 (100.0%) | 0 (0.0%) |
| 45 to 54 Years | 188 (87.0%) | 28 (13.0%) |
| 55 to 64 Years | 165 (74.0%) | 58 (26.0%) |
| 65 to 74 Years | 155 (100.0%) | 0 (0.0%) |
| 75 Years and older | 136 (100.0%) | 0 (0.0%) |
| Total | 1,283 (87.0%) | 192 (13.0%) |
Health Insurance Coverage by Citizenship Status in Twin City
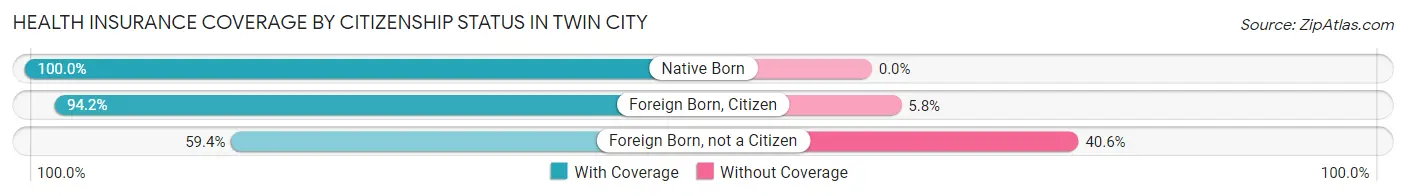
| Citizenship Status | With Coverage | Without Coverage |
| Native Born | 66 (100.0%) | 0 (0.0%) |
| Foreign Born, Citizen | 162 (94.2%) | 10 (5.8%) |
| Foreign Born, not a Citizen | 95 (59.4%) | 65 (40.6%) |
Health Insurance Coverage by Household Income in Twin City
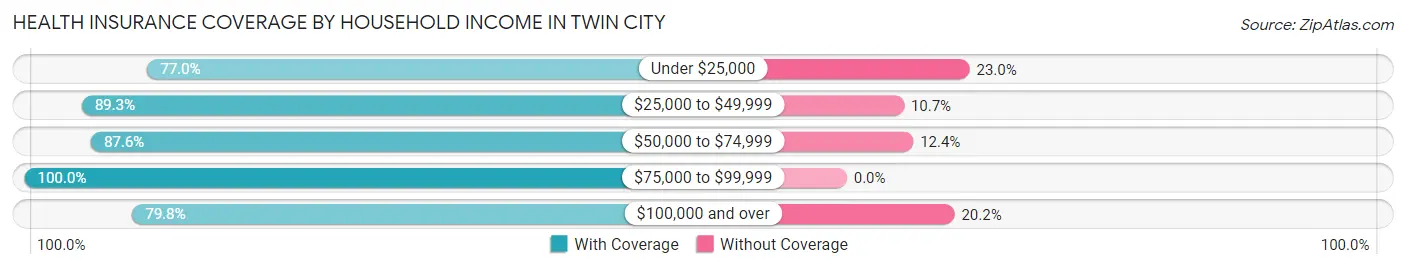
| Household Income | With Coverage | Without Coverage |
| Under $25,000 | 231 (77.0%) | 69 (23.0%) |
| $25,000 to $49,999 | 417 (89.3%) | 50 (10.7%) |
| $50,000 to $74,999 | 197 (87.6%) | 28 (12.4%) |
| $75,000 to $99,999 | 260 (100.0%) | 0 (0.0%) |
| $100,000 and over | 178 (79.8%) | 45 (20.2%) |
Public vs Private Health Insurance Coverage by Age in Twin City
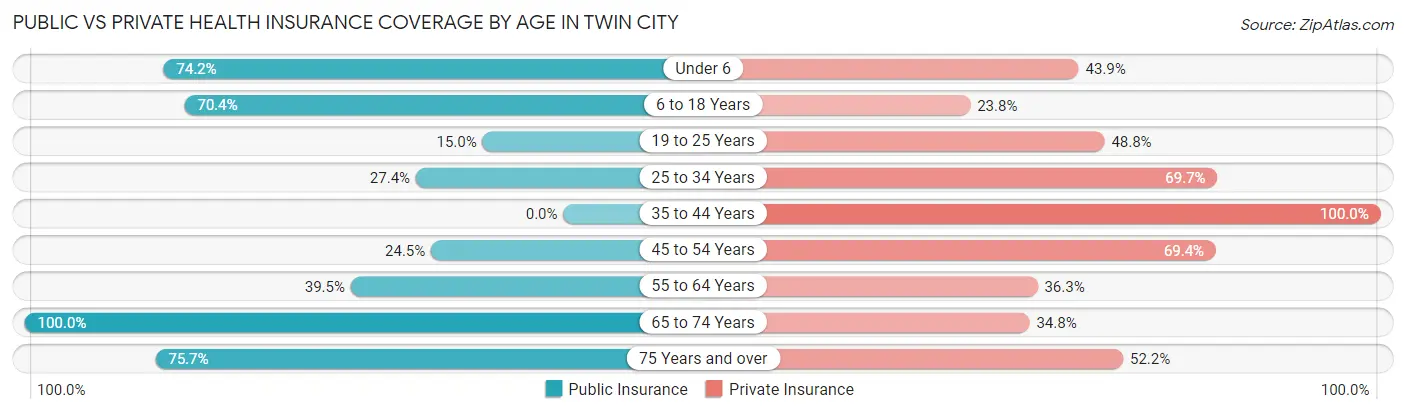
| Age Bracket | Public Insurance | Private Insurance |
| Under 6 | 49 (74.2%) | 29 (43.9%) |
| 6 to 18 Years | 121 (70.4%) | 41 (23.8%) |
| 19 to 25 Years | 24 (15.0%) | 78 (48.7%) |
| 25 to 34 Years | 75 (27.4%) | 191 (69.7%) |
| 35 to 44 Years | 0 (0.0%) | 73 (100.0%) |
| 45 to 54 Years | 53 (24.5%) | 150 (69.4%) |
| 55 to 64 Years | 88 (39.5%) | 81 (36.3%) |
| 65 to 74 Years | 155 (100.0%) | 54 (34.8%) |
| 75 Years and over | 103 (75.7%) | 71 (52.2%) |
| Total | 668 (45.3%) | 768 (52.1%) |
Disability Status by Sex by Age in Twin City
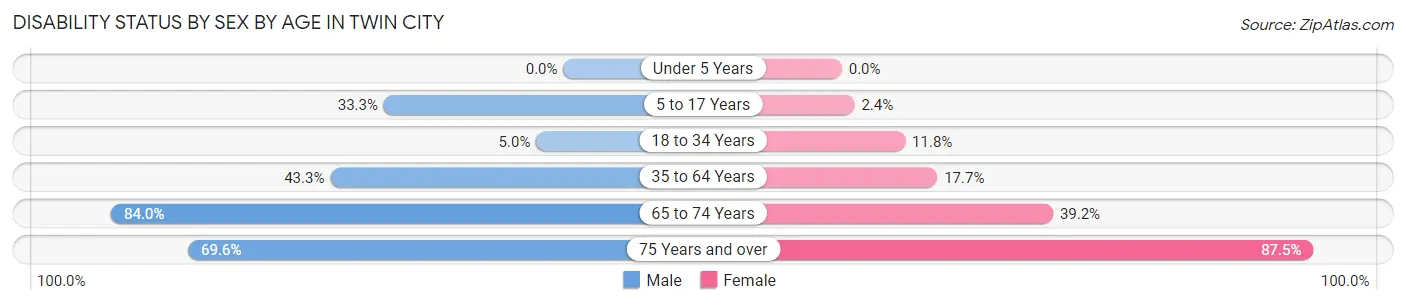
| Age Bracket | Male | Female |
| Under 5 Years | 0 (0.0%) | 0 (0.0%) |
| 5 to 17 Years | 38 (33.3%) | 2 (2.4%) |
| 18 to 34 Years | 15 (5.0%) | 16 (11.8%) |
| 35 to 64 Years | 119 (43.3%) | 42 (17.7%) |
| 65 to 74 Years | 68 (84.0%) | 29 (39.2%) |
| 75 Years and over | 39 (69.6%) | 70 (87.5%) |
Disability Class by Sex by Age in Twin City
Disability Class: Hearing Difficulty
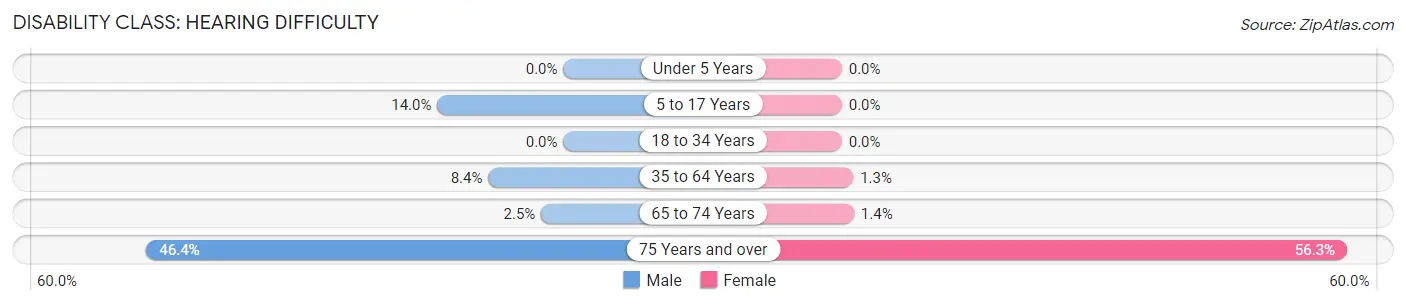
| Age Bracket | Male | Female |
| Under 5 Years | 0 (0.0%) | 0 (0.0%) |
| 5 to 17 Years | 16 (14.0%) | 0 (0.0%) |
| 18 to 34 Years | 0 (0.0%) | 0 (0.0%) |
| 35 to 64 Years | 23 (8.4%) | 3 (1.3%) |
| 65 to 74 Years | 2 (2.5%) | 1 (1.3%) |
| 75 Years and over | 26 (46.4%) | 45 (56.2%) |
Disability Class: Vision Difficulty
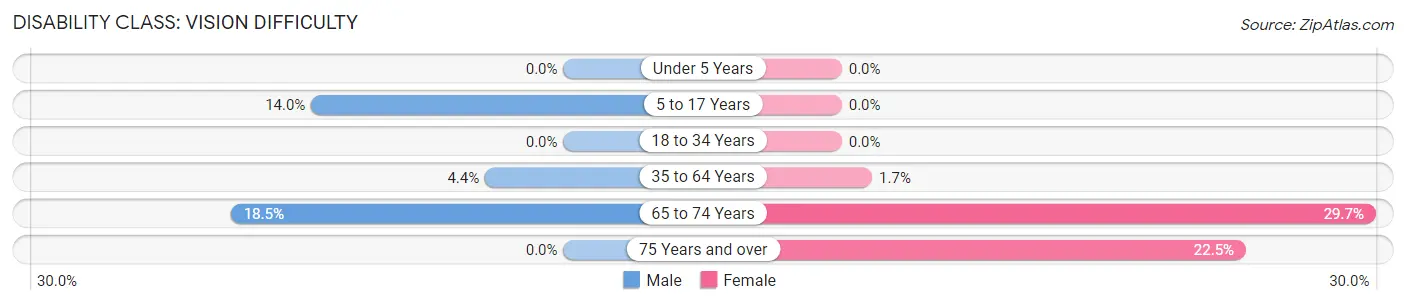
| Age Bracket | Male | Female |
| Under 5 Years | 0 (0.0%) | 0 (0.0%) |
| 5 to 17 Years | 16 (14.0%) | 0 (0.0%) |
| 18 to 34 Years | 0 (0.0%) | 0 (0.0%) |
| 35 to 64 Years | 12 (4.4%) | 4 (1.7%) |
| 65 to 74 Years | 15 (18.5%) | 22 (29.7%) |
| 75 Years and over | 0 (0.0%) | 18 (22.5%) |
Disability Class: Cognitive Difficulty
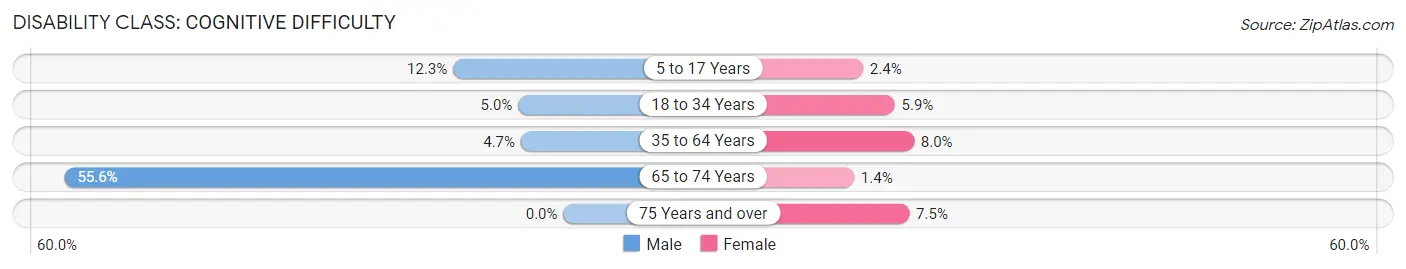
| Age Bracket | Male | Female |
| 5 to 17 Years | 14 (12.3%) | 2 (2.4%) |
| 18 to 34 Years | 15 (5.0%) | 8 (5.9%) |
| 35 to 64 Years | 13 (4.7%) | 19 (8.0%) |
| 65 to 74 Years | 45 (55.6%) | 1 (1.3%) |
| 75 Years and over | 0 (0.0%) | 6 (7.5%) |
Disability Class: Ambulatory Difficulty
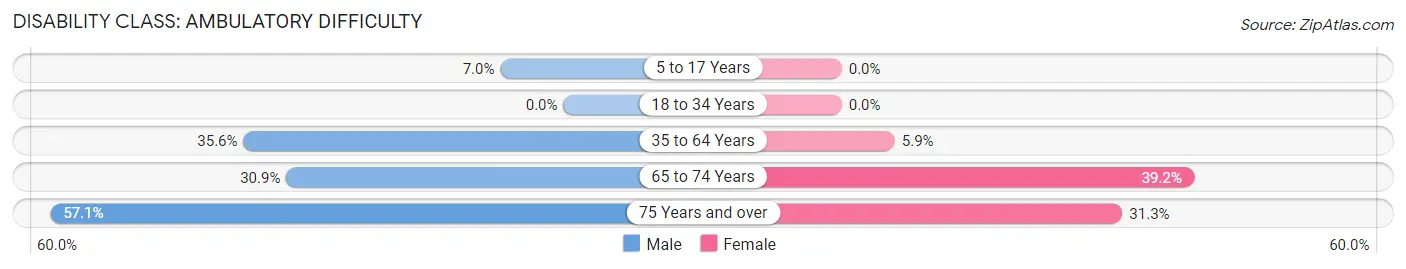
| Age Bracket | Male | Female |
| 5 to 17 Years | 8 (7.0%) | 0 (0.0%) |
| 18 to 34 Years | 0 (0.0%) | 0 (0.0%) |
| 35 to 64 Years | 98 (35.6%) | 14 (5.9%) |
| 65 to 74 Years | 25 (30.9%) | 29 (39.2%) |
| 75 Years and over | 32 (57.1%) | 25 (31.2%) |
Disability Class: Self-Care Difficulty
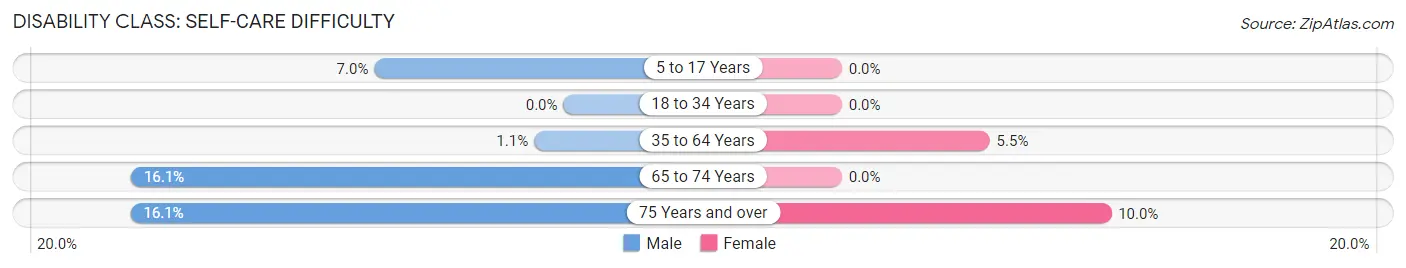
| Age Bracket | Male | Female |
| 5 to 17 Years | 8 (7.0%) | 0 (0.0%) |
| 18 to 34 Years | 0 (0.0%) | 0 (0.0%) |
| 35 to 64 Years | 3 (1.1%) | 13 (5.5%) |
| 65 to 74 Years | 13 (16.1%) | 0 (0.0%) |
| 75 Years and over | 9 (16.1%) | 8 (10.0%) |
Technology Access in Twin City
Computing Device Access in Twin City
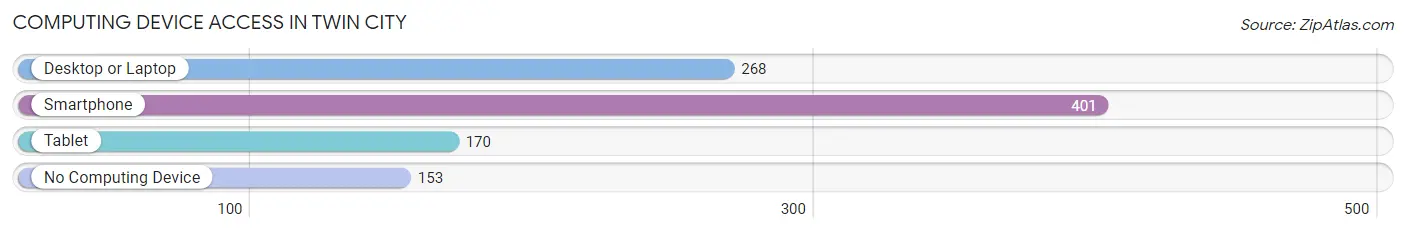
| Device Type | # Households | % Households |
| Desktop or Laptop | 268 | 44.9% |
| Smartphone | 401 | 67.2% |
| Tablet | 170 | 28.5% |
| No Computing Device | 153 | 25.6% |
| Total | 597 | 100.0% |
Internet Access in Twin City
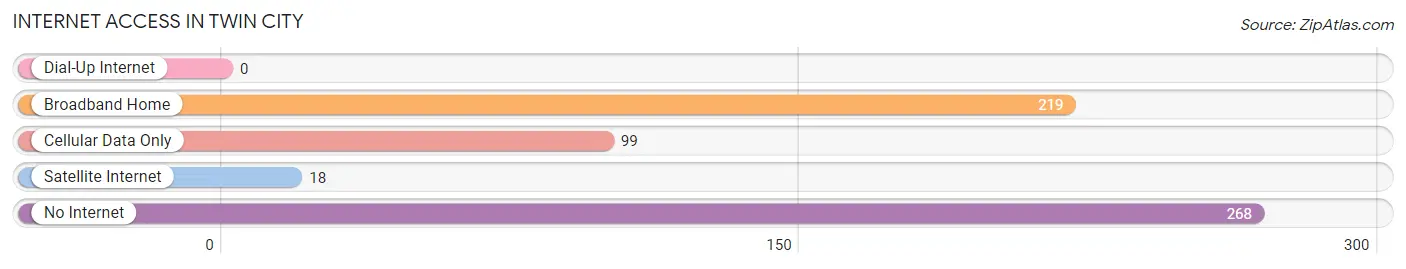
| Internet Type | # Households | % Households |
| Dial-Up Internet | 0 | 0.0% |
| Broadband Home | 219 | 36.7% |
| Cellular Data Only | 99 | 16.6% |
| Satellite Internet | 18 | 3.0% |
| No Internet | 268 | 44.9% |
| Total | 597 | 100.0% |
Twin City Summary
Twin City is a small town located in Emanuel County, Georgia. It is situated in the southeastern part of the state, about halfway between Savannah and Augusta. The town was founded in 1891 and has a population of approximately 1,000 people.
Twin City is located in the heart of Emanuel County, which is part of the Central Savannah River Area (CSRA). The town is situated on the Ogeechee River, which is a major tributary of the Savannah River. The town is surrounded by a variety of natural features, including the Oconee National Forest, the Ogeechee River, and the Oconee River Wildlife Management Area.
Twin City is a small town with a rich history. The town was founded in 1891 by two brothers, William and John Smith, who named it after their hometown of Twin City, Tennessee. The town was originally a farming community, but it soon developed into a small industrial center. The town was home to several factories, including a cotton mill, a sawmill, and a gristmill.
Twin City has a humid subtropical climate, with hot, humid summers and mild winters. The average annual temperature is around 70 degrees Fahrenheit, and the average annual precipitation is around 50 inches.
Twin City has a diverse economy. The town is home to several small businesses, including a grocery store, a hardware store, and a restaurant. The town also has a few larger employers, including a manufacturing plant and a trucking company. The town is also home to a number of farms, which produce a variety of crops, including cotton, corn, and soybeans.
Twin City has a population of approximately 1,000 people. The town is predominantly white, with a small African American population. The median household income is around $30,000, and the median home value is around $90,000. The town has a low unemployment rate, and the poverty rate is below the national average.
Twin City is a small town with a rich history and a diverse economy. The town is home to a variety of businesses, and it has a low unemployment rate and a low poverty rate. The town is also home to a number of farms, which produce a variety of crops. Twin City is a great place to live and work, and it is a great place to raise a family.
Common Questions
What is Per Capita Income in Twin City?
Per Capita income in Twin City is $21,760.
What is the Median Family Income in Twin City?
Median Family Income in Twin City is $38,409.
What is the Median Household income in Twin City?
Median Household Income in Twin City is $36,498.
What is Income or Wage Gap in Twin City?
Income or Wage Gap in Twin City is 16.5%.
Women in Twin City earn 83.5 cents for every dollar earned by a man.
What is Family Income Deficit in Twin City?
Family Income Deficit in Twin City is $16,783.
Families that are below poverty line in Twin City earn $16,783 less on average than the poverty threshold level.
What is Inequality or Gini Index in Twin City?
Inequality or Gini Index in Twin City is 0.42.
What is the Total Population of Twin City?
Total Population of Twin City is 1,849.
What is the Total Male Population of Twin City?
Total Male Population of Twin City is 1,181.
What is the Total Female Population of Twin City?
Total Female Population of Twin City is 668.
What is the Ratio of Males per 100 Females in Twin City?
There are 176.80 Males per 100 Females in Twin City.
What is the Ratio of Females per 100 Males in Twin City?
There are 56.56 Females per 100 Males in Twin City.
What is the Median Population Age in Twin City?
Median Population Age in Twin City is 43.0 Years.
What is the Average Family Size in Twin City
Average Family Size in Twin City is 3.2 People.
What is the Average Household Size in Twin City
Average Household Size in Twin City is 2.5 People.
How Large is the Labor Force in Twin City?
There are 690 People in the Labor Forcein in Twin City.
What is the Percentage of People in the Labor Force in Twin City?
42.2% of People are in the Labor Force in Twin City.
What is the Unemployment Rate in Twin City?
Unemployment Rate in Twin City is 10.4%.