Sylvester, GA Map & Demographics
Sylvester Map
Sylvester Overview
$27,319
PER CAPITA INCOME
$58,460
AVG FAMILY INCOME
$48,599
AVG HOUSEHOLD INCOME
31.8%
WAGE / INCOME GAP [ % ]
68.2¢/ $1
WAGE / INCOME GAP [ $ ]
0.51
INEQUALITY / GINI INDEX
5,622
TOTAL POPULATION
2,290
MALE POPULATION
3,332
FEMALE POPULATION
68.73
MALES / 100 FEMALES
145.50
FEMALES / 100 MALES
38.1
MEDIAN AGE
3.0
AVG FAMILY SIZE
2.4
AVG HOUSEHOLD SIZE
2,579
LABOR FORCE [ PEOPLE ]
59.4%
PERCENT IN LABOR FORCE
8.0%
UNEMPLOYMENT RATE
Sylvester Zip Codes
Sylvester Area Codes
Income in Sylvester
Income Overview in Sylvester
Per Capita Income in Sylvester is $27,319, while median incomes of families and households are $58,460 and $48,599 respectively.
| Characteristic | Number | Measure |
| Per Capita Income | 5,622 | $27,319 |
| Median Family Income | 1,500 | $58,460 |
| Mean Family Income | 1,500 | $80,421 |
| Median Household Income | 2,229 | $48,599 |
| Mean Household Income | 2,229 | $67,863 |
| Income Deficit | 1,500 | $0 |
| Wage / Income Gap (%) | 5,622 | 31.80% |
| Wage / Income Gap ($) | 5,622 | 68.20¢ per $1 |
| Gini / Inequality Index | 5,622 | 0.51 |
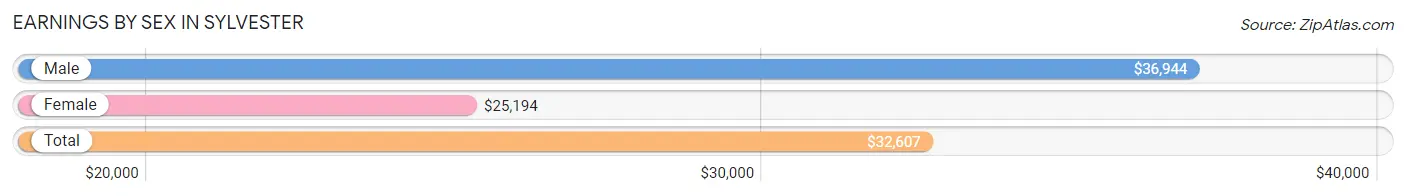
Earnings by Sex in Sylvester
Average Earnings in Sylvester are $32,607, $36,944 for men and $25,194 for women, a difference of 31.8%.
| Sex | Number | Average Earnings |
| Male | 1,240 (47.7%) | $36,944 |
| Female | 1,357 (52.2%) | $25,194 |
| Total | 2,597 (100.0%) | $32,607 |
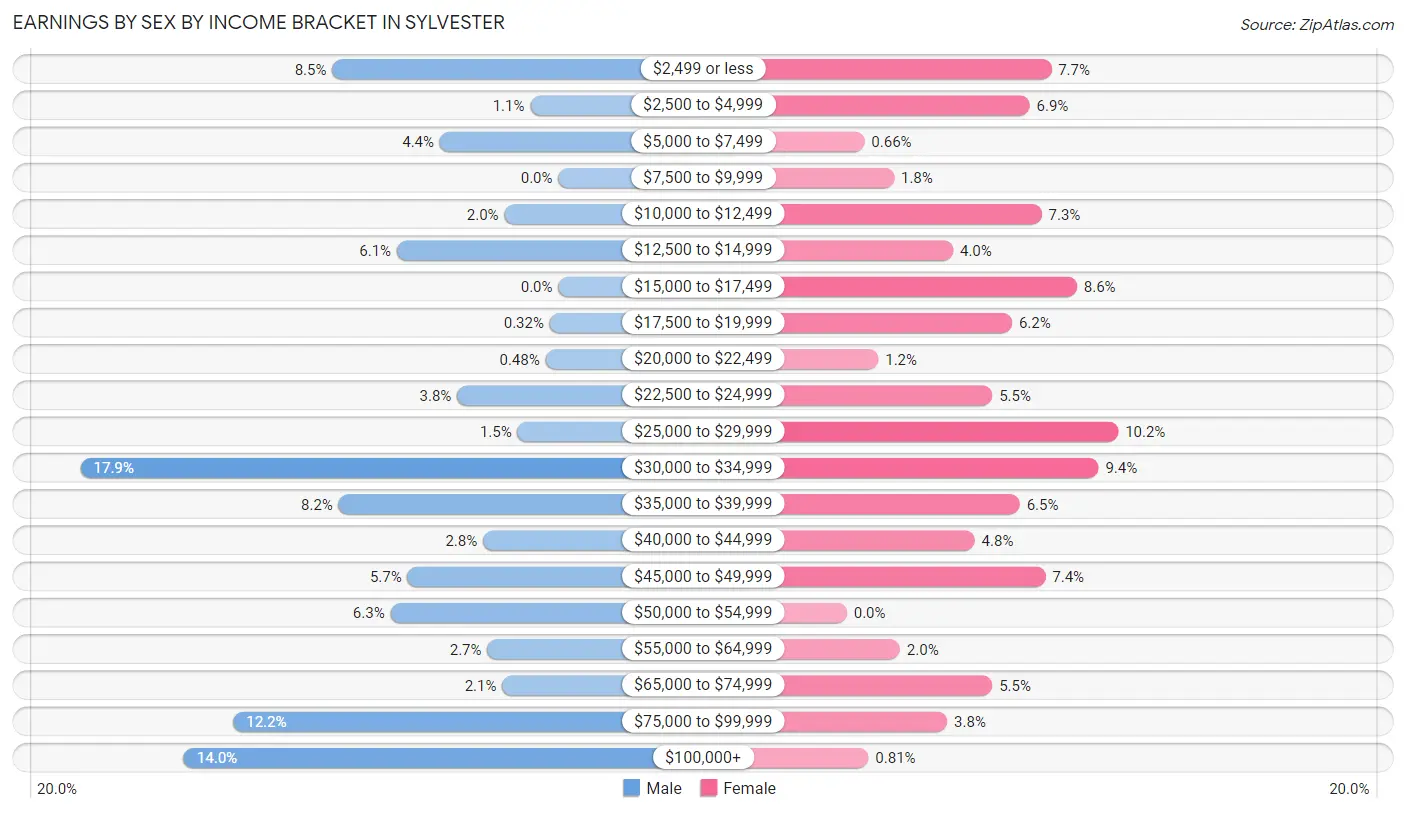
Earnings by Sex by Income Bracket in Sylvester
The most common earnings brackets in Sylvester are $30,000 to $34,999 for men (222 | 17.9%) and $25,000 to $29,999 for women (138 | 10.2%).
| Income | Male | Female |
| $2,499 or less | 105 (8.5%) | 104 (7.7%) |
| $2,500 to $4,999 | 13 (1.1%) | 93 (6.9%) |
| $5,000 to $7,499 | 55 (4.4%) | 9 (0.7%) |
| $7,500 to $9,999 | 0 (0.0%) | 24 (1.8%) |
| $10,000 to $12,499 | 25 (2.0%) | 99 (7.3%) |
| $12,500 to $14,999 | 75 (6.0%) | 54 (4.0%) |
| $15,000 to $17,499 | 0 (0.0%) | 117 (8.6%) |
| $17,500 to $19,999 | 4 (0.3%) | 84 (6.2%) |
| $20,000 to $22,499 | 6 (0.5%) | 16 (1.2%) |
| $22,500 to $24,999 | 47 (3.8%) | 74 (5.4%) |
| $25,000 to $29,999 | 19 (1.5%) | 138 (10.2%) |
| $30,000 to $34,999 | 222 (17.9%) | 128 (9.4%) |
| $35,000 to $39,999 | 102 (8.2%) | 88 (6.5%) |
| $40,000 to $44,999 | 35 (2.8%) | 65 (4.8%) |
| $45,000 to $49,999 | 70 (5.7%) | 101 (7.4%) |
| $50,000 to $54,999 | 78 (6.3%) | 0 (0.0%) |
| $55,000 to $64,999 | 33 (2.7%) | 27 (2.0%) |
| $65,000 to $74,999 | 26 (2.1%) | 74 (5.4%) |
| $75,000 to $99,999 | 151 (12.2%) | 51 (3.8%) |
| $100,000+ | 174 (14.0%) | 11 (0.8%) |
| Total | 1,240 (100.0%) | 1,357 (100.0%) |
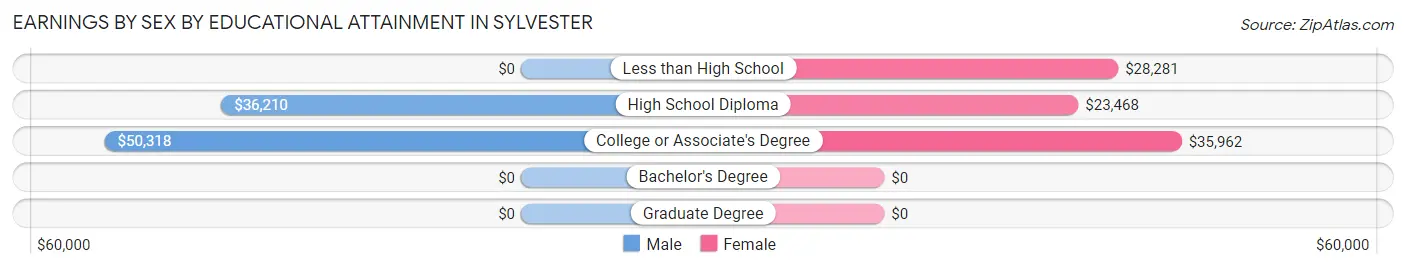
Earnings by Sex by Educational Attainment in Sylvester
Average earnings in Sylvester are $41,705 for men and $28,875 for women, a difference of 30.8%. Men with an educational attainment of college or associate's degree enjoy the highest average annual earnings of $50,318, while those with high school diploma education earn the least with $36,210. Women with an educational attainment of college or associate's degree earn the most with the average annual earnings of $35,962, while those with high school diploma education have the smallest earnings of $23,468.
| Educational Attainment | Male Income | Female Income |
| Less than High School | - | - |
| High School Diploma | $36,210 | $23,468 |
| College or Associate's Degree | $50,318 | $35,962 |
| Bachelor's Degree | - | - |
| Graduate Degree | - | - |
| Total | $41,705 | $28,875 |
Family Income in Sylvester
Family Income Brackets in Sylvester
According to the Sylvester family income data, there are 308 families falling into the $50,000 to $74,999 income range, which is the most common income bracket and makes up 20.5% of all families. Conversely, the $150,000 to $199,999 income bracket is the least frequent group with only 50 families (3.3%) belonging to this category.
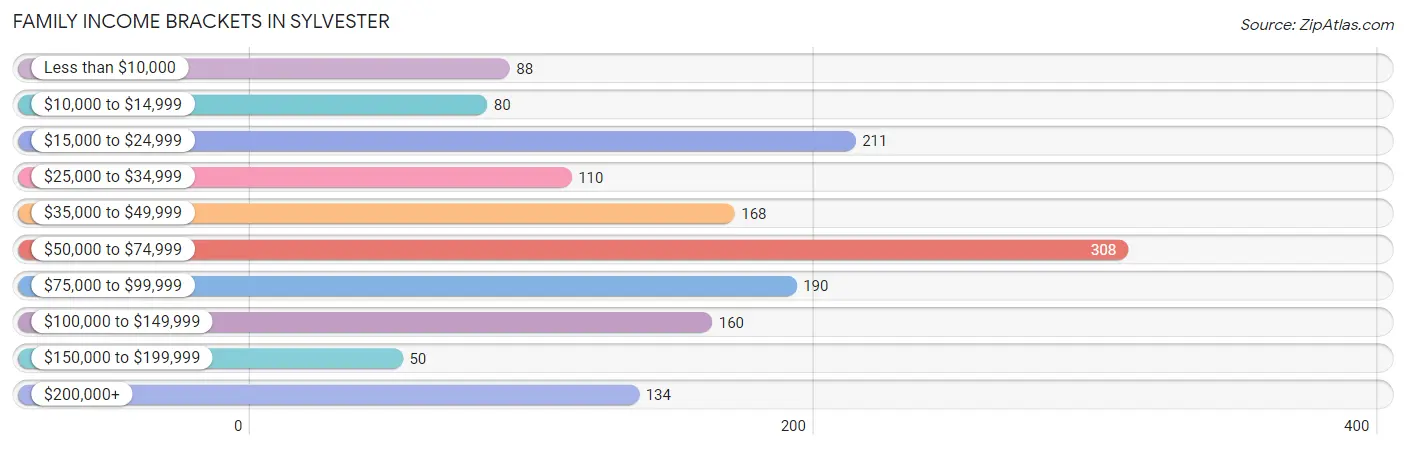
| Income Bracket | # Families | % Families |
| Less than $10,000 | 88 | 5.9% |
| $10,000 to $14,999 | 80 | 5.3% |
| $15,000 to $24,999 | 211 | 14.1% |
| $25,000 to $34,999 | 110 | 7.3% |
| $35,000 to $49,999 | 168 | 11.2% |
| $50,000 to $74,999 | 308 | 20.5% |
| $75,000 to $99,999 | 190 | 12.7% |
| $100,000 to $149,999 | 160 | 10.7% |
| $150,000 to $199,999 | 50 | 3.3% |
| $200,000+ | 134 | 8.9% |
Family Income by Famaliy Size in Sylvester
5-person families (68 | 4.5%) account for the highest median family income in Sylvester with $96,447 per family, while 2-person families (675 | 45.0%) have the highest median income of $28,875 per family member.
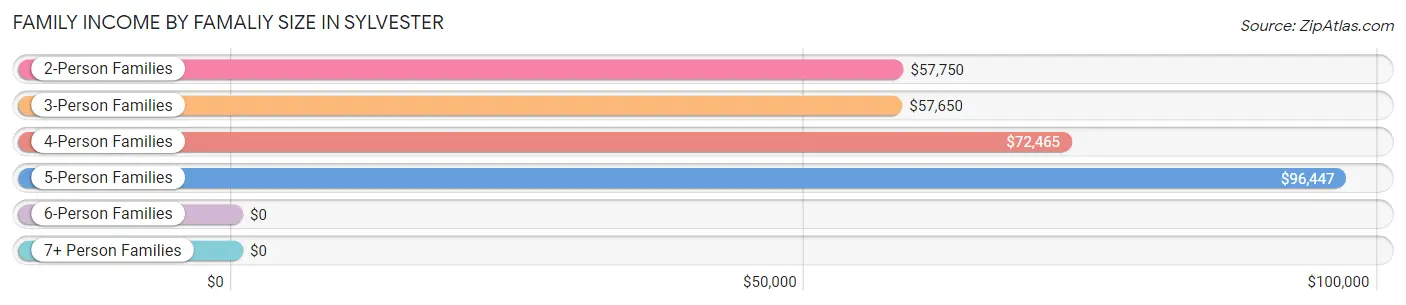
| Income Bracket | # Families | Median Income |
| 2-Person Families | 675 (45.0%) | $57,750 |
| 3-Person Families | 550 (36.7%) | $57,650 |
| 4-Person Families | 193 (12.9%) | $72,465 |
| 5-Person Families | 68 (4.5%) | $96,447 |
| 6-Person Families | 8 (0.5%) | $0 |
| 7+ Person Families | 6 (0.4%) | $0 |
| Total | 1,500 (100.0%) | $58,460 |
Family Income by Number of Earners in Sylvester
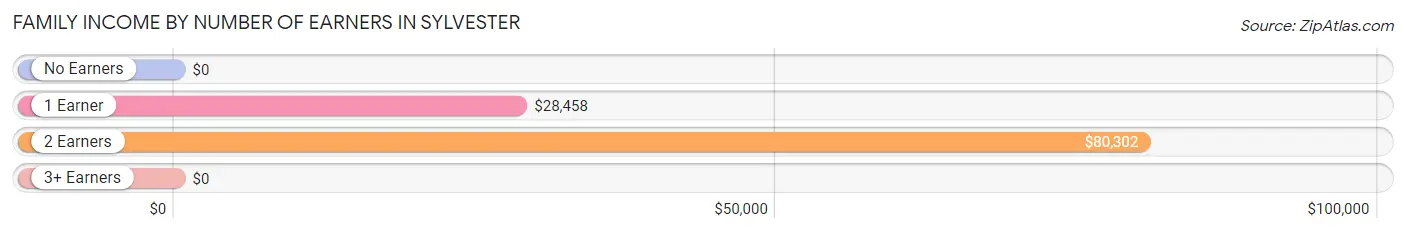
| Number of Earners | # Families | Median Income |
| No Earners | 215 (14.3%) | $0 |
| 1 Earner | 591 (39.4%) | $28,458 |
| 2 Earners | 601 (40.1%) | $80,302 |
| 3+ Earners | 93 (6.2%) | $0 |
| Total | 1,500 (100.0%) | $58,460 |
Household Income in Sylvester
Household Income Brackets in Sylvester
With 383 households falling in the category, the $50,000 to $74,999 income range is the most frequent in Sylvester, accounting for 17.2% of all households. In contrast, only 49 households (2.2%) fall into the $150,000 to $199,999 income bracket, making it the least populous group.
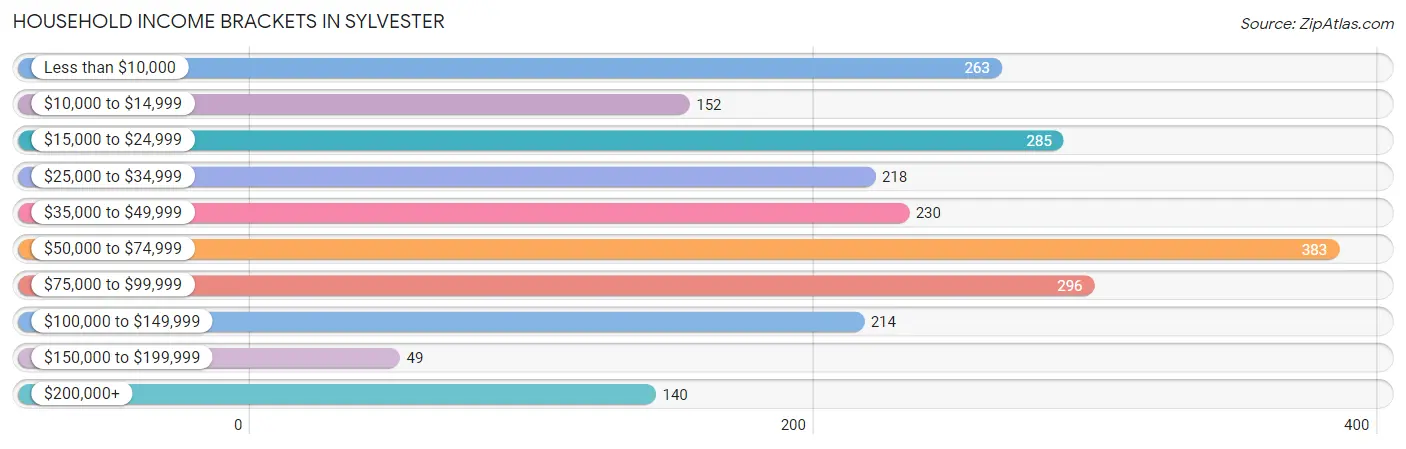
| Income Bracket | # Households | % Households |
| Less than $10,000 | 263 | 11.8% |
| $10,000 to $14,999 | 152 | 6.8% |
| $15,000 to $24,999 | 285 | 12.8% |
| $25,000 to $34,999 | 218 | 9.8% |
| $35,000 to $49,999 | 230 | 10.3% |
| $50,000 to $74,999 | 383 | 17.2% |
| $75,000 to $99,999 | 296 | 13.3% |
| $100,000 to $149,999 | 214 | 9.6% |
| $150,000 to $199,999 | 49 | 2.2% |
| $200,000+ | 140 | 6.3% |
Household Income by Householder Age in Sylvester
The median household income in Sylvester is $48,599, with the highest median household income of $67,440 found in the 45 to 64 years age bracket for the primary householder. A total of 735 households (33.0%) fall into this category. Meanwhile, the 15 to 24 years age bracket for the primary householder has the lowest median household income of $0, with 189 households (8.5%) in this group.
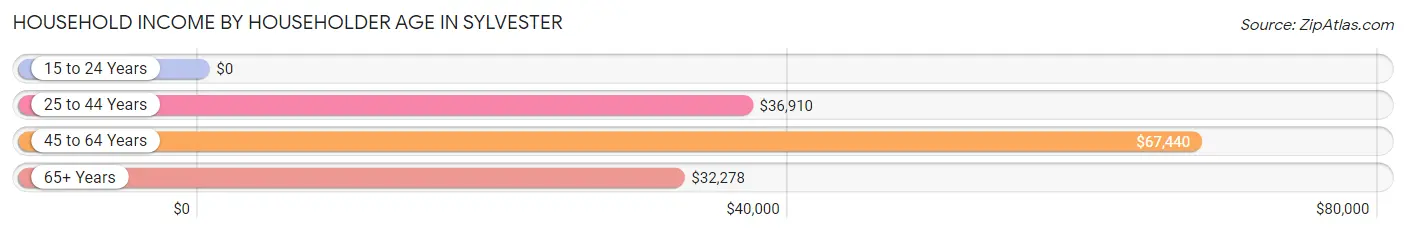
| Income Bracket | # Households | Median Income |
| 15 to 24 Years | 189 (8.5%) | $0 |
| 25 to 44 Years | 653 (29.3%) | $36,910 |
| 45 to 64 Years | 735 (33.0%) | $67,440 |
| 65+ Years | 652 (29.2%) | $32,278 |
| Total | 2,229 (100.0%) | $48,599 |
Poverty in Sylvester
Income Below Poverty by Sex and Age in Sylvester
With 21.3% poverty level for males and 33.1% for females among the residents of Sylvester, 15 year old males and 5 year old females are the most vulnerable to poverty, with 26 males (100.0%) and 14 females (100.0%) in their respective age groups living below the poverty level.
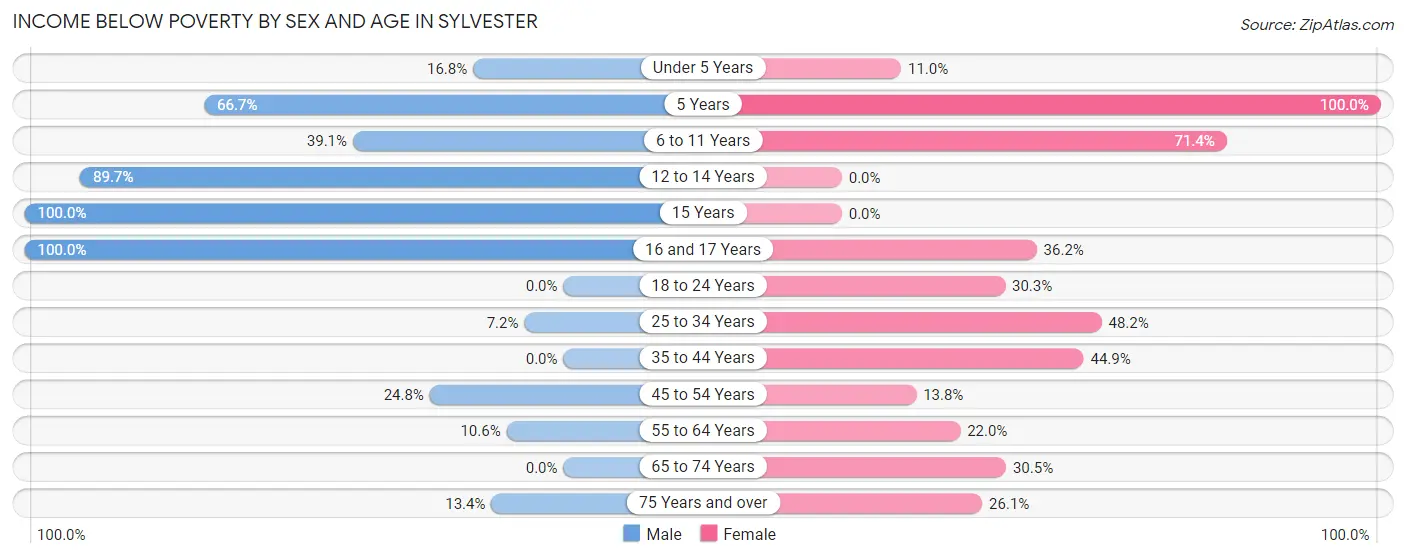
| Age Bracket | Male | Female |
| Under 5 Years | 26 (16.8%) | 32 (11.0%) |
| 5 Years | 20 (66.7%) | 14 (100.0%) |
| 6 to 11 Years | 84 (39.1%) | 255 (71.4%) |
| 12 to 14 Years | 87 (89.7%) | 0 (0.0%) |
| 15 Years | 26 (100.0%) | 0 (0.0%) |
| 16 and 17 Years | 69 (100.0%) | 17 (36.2%) |
| 18 to 24 Years | 0 (0.0%) | 150 (30.3%) |
| 25 to 34 Years | 21 (7.2%) | 148 (48.2%) |
| 35 to 44 Years | 0 (0.0%) | 140 (44.9%) |
| 45 to 54 Years | 65 (24.8%) | 37 (13.8%) |
| 55 to 64 Years | 46 (10.5%) | 71 (22.0%) |
| 65 to 74 Years | 0 (0.0%) | 96 (30.5%) |
| 75 Years and over | 23 (13.4%) | 112 (26.1%) |
| Total | 467 (21.3%) | 1,072 (33.1%) |
Income Above Poverty by Sex and Age in Sylvester
According to the poverty statistics in Sylvester, males aged 18 to 24 years and females aged 12 to 14 years are the age groups that are most secure financially, with 100.0% of males and 100.0% of females in these age groups living above the poverty line.
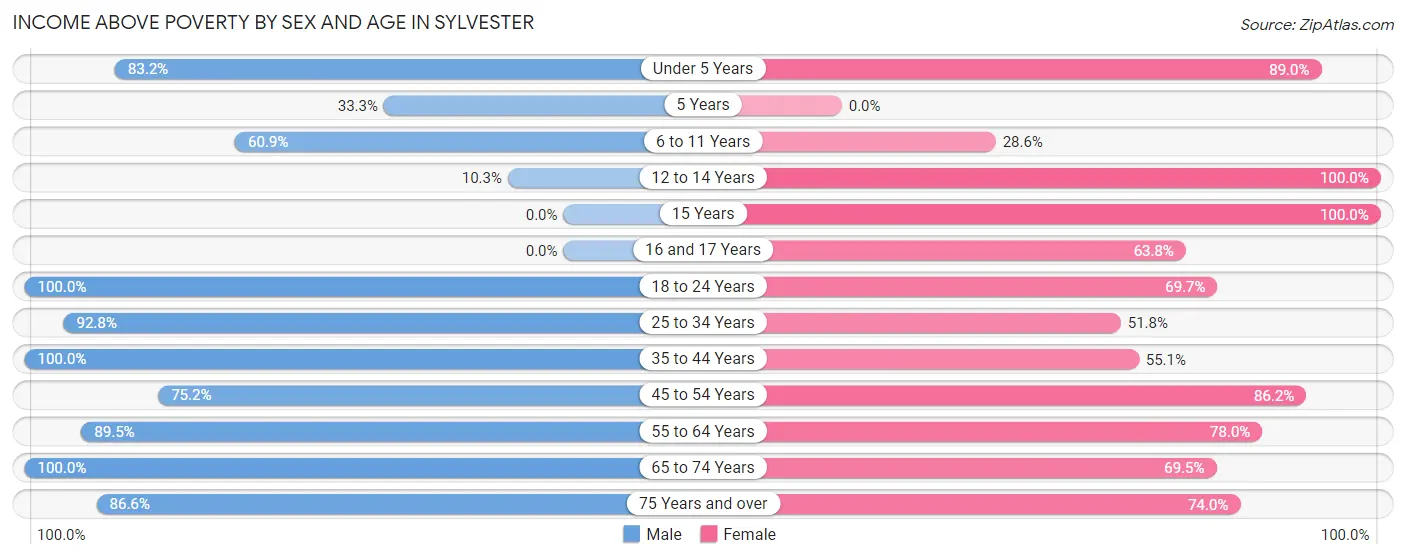
| Age Bracket | Male | Female |
| Under 5 Years | 129 (83.2%) | 259 (89.0%) |
| 5 Years | 10 (33.3%) | 0 (0.0%) |
| 6 to 11 Years | 131 (60.9%) | 102 (28.6%) |
| 12 to 14 Years | 10 (10.3%) | 46 (100.0%) |
| 15 Years | 0 (0.0%) | 33 (100.0%) |
| 16 and 17 Years | 0 (0.0%) | 30 (63.8%) |
| 18 to 24 Years | 108 (100.0%) | 345 (69.7%) |
| 25 to 34 Years | 269 (92.8%) | 159 (51.8%) |
| 35 to 44 Years | 228 (100.0%) | 172 (55.1%) |
| 45 to 54 Years | 197 (75.2%) | 231 (86.2%) |
| 55 to 64 Years | 390 (89.4%) | 252 (78.0%) |
| 65 to 74 Years | 103 (100.0%) | 219 (69.5%) |
| 75 Years and over | 149 (86.6%) | 318 (74.0%) |
| Total | 1,724 (78.7%) | 2,166 (66.9%) |
Income Below Poverty Among Married-Couple Families in Sylvester
The poverty statistics for married-couple families in Sylvester show that 6.5% or 50 of the total 772 families live below the poverty line. Families with no children have the highest poverty rate of 9.8%, comprising of 50 families. On the other hand, families with 1 or 2 children have the lowest poverty rate of 0.0%, which includes 0 families.
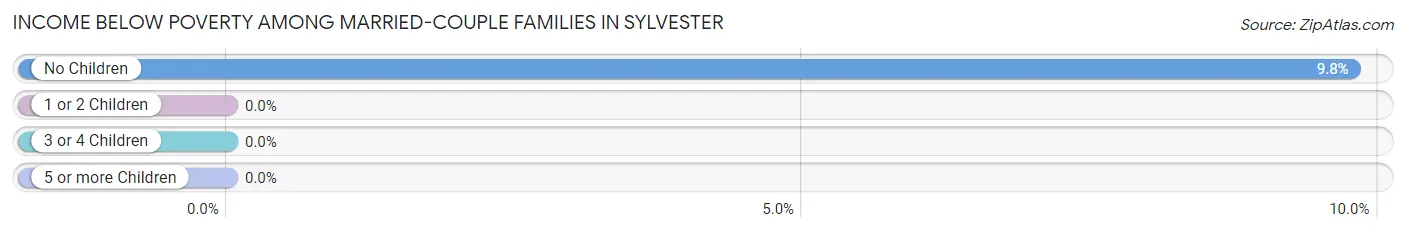
| Children | Above Poverty | Below Poverty |
| No Children | 462 (90.2%) | 50 (9.8%) |
| 1 or 2 Children | 228 (100.0%) | 0 (0.0%) |
| 3 or 4 Children | 32 (100.0%) | 0 (0.0%) |
| 5 or more Children | 0 (0.0%) | 0 (0.0%) |
| Total | 722 (93.5%) | 50 (6.5%) |
Income Below Poverty Among Single-Parent Households in Sylvester
According to the poverty data in Sylvester, 24.5% or 47 single-father households and 48.1% or 258 single-mother households are living below the poverty line. Among single-father households, those with 1 or 2 children have the highest poverty rate, with 34 households (51.5%) experiencing poverty. Likewise, among single-mother households, those with 5 or more children have the highest poverty rate, with 6 households (100.0%) falling below the poverty line.
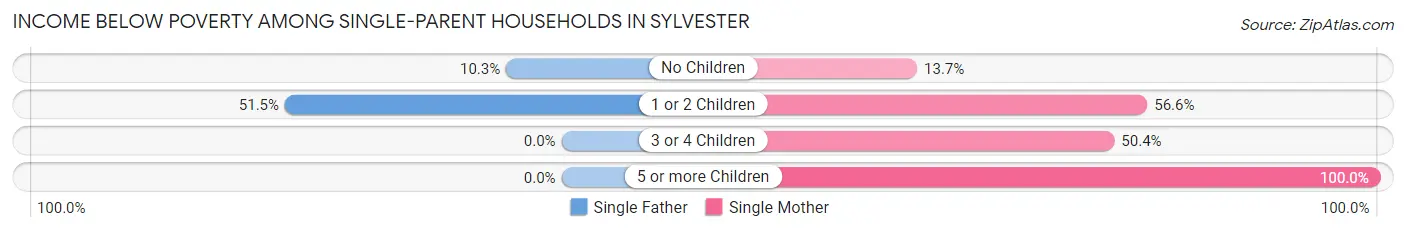
| Children | Single Father | Single Mother |
| No Children | 13 (10.3%) | 13 (13.7%) |
| 1 or 2 Children | 34 (51.5%) | 181 (56.6%) |
| 3 or 4 Children | 0 (0.0%) | 58 (50.4%) |
| 5 or more Children | 0 (0.0%) | 6 (100.0%) |
| Total | 47 (24.5%) | 258 (48.1%) |
Income Below Poverty Among Married-Couple vs Single-Parent Households in Sylvester
The poverty data for Sylvester shows that 50 of the married-couple family households (6.5%) and 305 of the single-parent households (41.9%) are living below the poverty level. Within the married-couple family households, those with no children have the highest poverty rate, with 50 households (9.8%) falling below the poverty line. Among the single-parent households, those with 5 or more children have the highest poverty rate, with 6 household (100.0%) living below poverty.
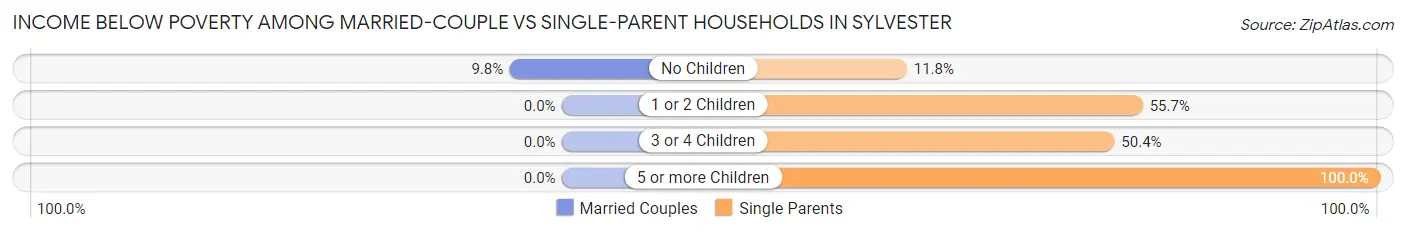
| Children | Married-Couple Families | Single-Parent Households |
| No Children | 50 (9.8%) | 26 (11.8%) |
| 1 or 2 Children | 0 (0.0%) | 215 (55.7%) |
| 3 or 4 Children | 0 (0.0%) | 58 (50.4%) |
| 5 or more Children | 0 (0.0%) | 6 (100.0%) |
| Total | 50 (6.5%) | 305 (41.9%) |
Race in Sylvester
The most populous races in Sylvester are Black / African American (3,377 | 60.1%), White / Caucasian (1,990 | 35.4%), and Two or more Races (193 | 3.4%).
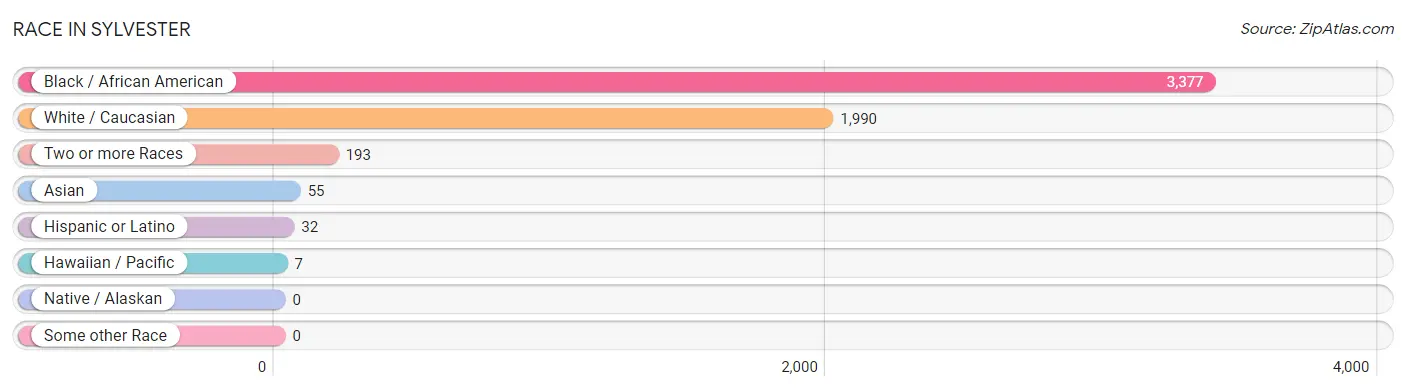
| Race | # Population | % Population |
| Asian | 55 | 1.0% |
| Black / African American | 3,377 | 60.1% |
| Hawaiian / Pacific | 7 | 0.1% |
| Hispanic or Latino | 32 | 0.6% |
| Native / Alaskan | 0 | 0.0% |
| White / Caucasian | 1,990 | 35.4% |
| Two or more Races | 193 | 3.4% |
| Some other Race | 0 | 0.0% |
| Total | 5,622 | 100.0% |
Ancestry in Sylvester
The most populous ancestries reported in Sylvester are English (744 | 13.2%), American (338 | 6.0%), Irish (240 | 4.3%), European (202 | 3.6%), and German (179 | 3.2%), together accounting for 30.3% of all Sylvester residents.
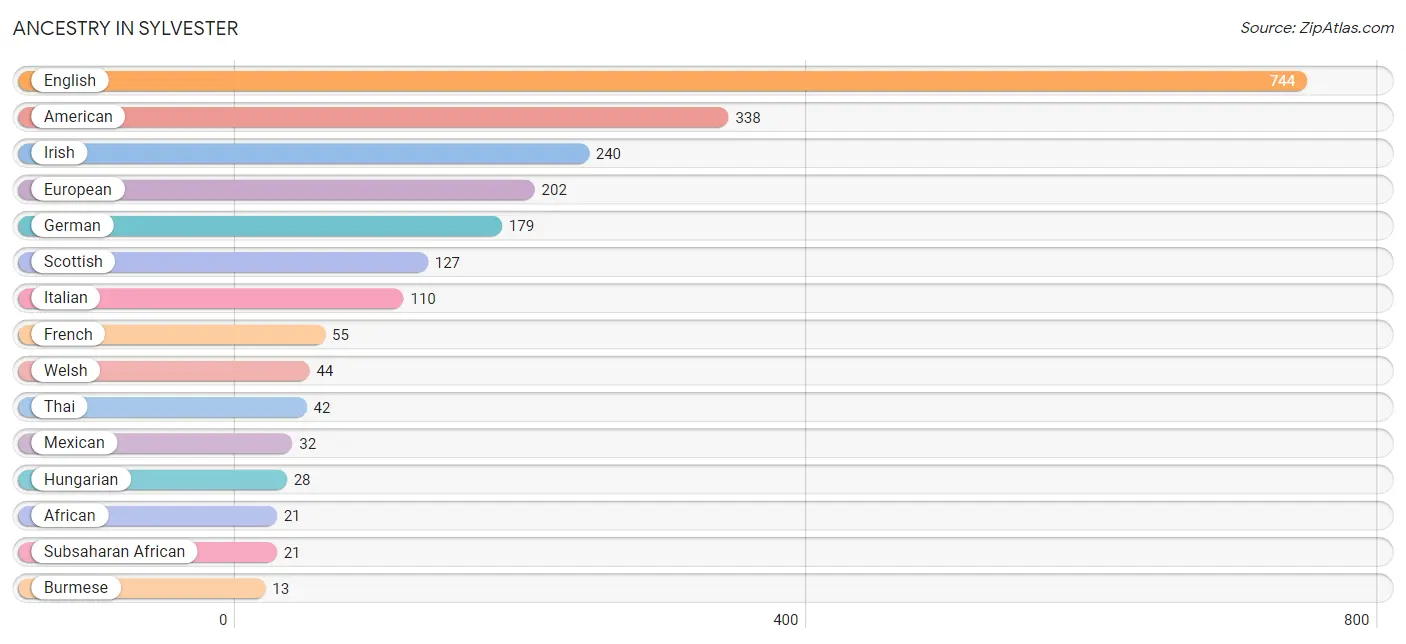
| Ancestry | # Population | % Population |
| African | 21 | 0.4% |
| American | 338 | 6.0% |
| Burmese | 13 | 0.2% |
| Cherokee | 11 | 0.2% |
| English | 744 | 13.2% |
| European | 202 | 3.6% |
| French | 55 | 1.0% |
| German | 179 | 3.2% |
| Guamanian / Chamorro | 3 | 0.1% |
| Hungarian | 28 | 0.5% |
| Irish | 240 | 4.3% |
| Italian | 110 | 2.0% |
| Mexican | 32 | 0.6% |
| Native Hawaiian | 12 | 0.2% |
| Polish | 11 | 0.2% |
| Scotch-Irish | 7 | 0.1% |
| Scottish | 127 | 2.3% |
| Subsaharan African | 21 | 0.4% |
| Thai | 42 | 0.7% |
| Welsh | 44 | 0.8% | View All 20 Rows |
Immigrants in Sylvester
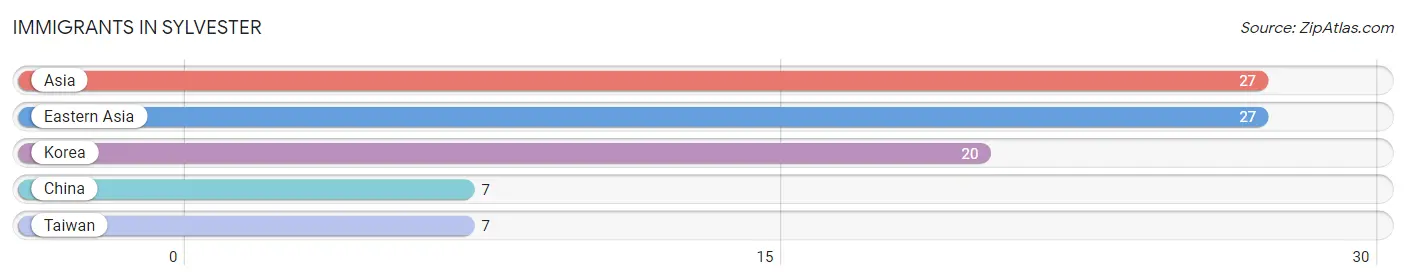
The most numerous immigrant groups reported in Sylvester came from Asia (27 | 0.5%), Eastern Asia (27 | 0.5%), Korea (20 | 0.4%), China (7 | 0.1%), and Taiwan (7 | 0.1%), together accounting for 1.6% of all Sylvester residents.
| Immigration Origin | # Population | % Population |
| Asia | 27 | 0.5% |
| China | 7 | 0.1% |
| Eastern Asia | 27 | 0.5% |
| Korea | 20 | 0.4% |
| Taiwan | 7 | 0.1% | View All 5 Rows |
Sex and Age in Sylvester
Sex and Age in Sylvester
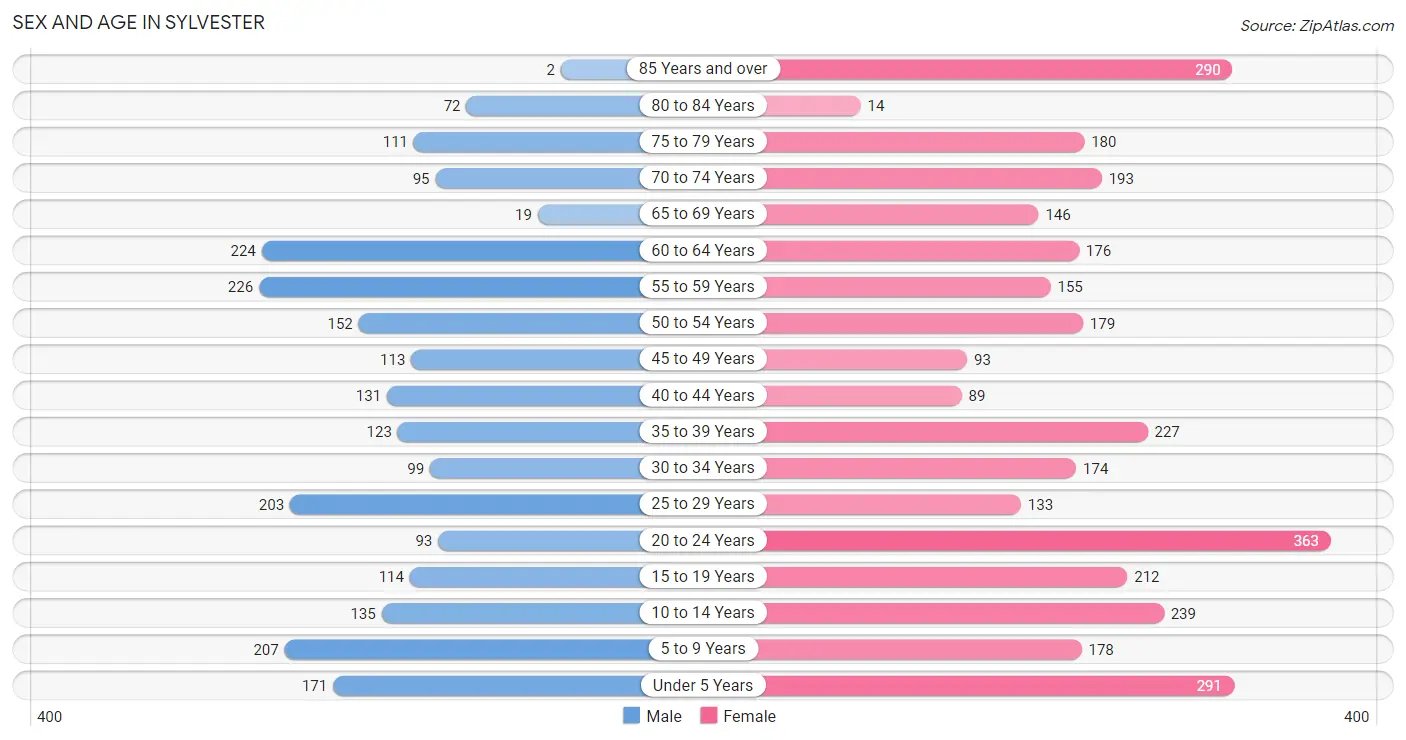
The most populous age groups in Sylvester are 55 to 59 Years (226 | 9.9%) for men and 20 to 24 Years (363 | 10.9%) for women.
| Age Bracket | Male | Female |
| Under 5 Years | 171 (7.5%) | 291 (8.7%) |
| 5 to 9 Years | 207 (9.0%) | 178 (5.3%) |
| 10 to 14 Years | 135 (5.9%) | 239 (7.2%) |
| 15 to 19 Years | 114 (5.0%) | 212 (6.4%) |
| 20 to 24 Years | 93 (4.1%) | 363 (10.9%) |
| 25 to 29 Years | 203 (8.9%) | 133 (4.0%) |
| 30 to 34 Years | 99 (4.3%) | 174 (5.2%) |
| 35 to 39 Years | 123 (5.4%) | 227 (6.8%) |
| 40 to 44 Years | 131 (5.7%) | 89 (2.7%) |
| 45 to 49 Years | 113 (4.9%) | 93 (2.8%) |
| 50 to 54 Years | 152 (6.6%) | 179 (5.4%) |
| 55 to 59 Years | 226 (9.9%) | 155 (4.6%) |
| 60 to 64 Years | 224 (9.8%) | 176 (5.3%) |
| 65 to 69 Years | 19 (0.8%) | 146 (4.4%) |
| 70 to 74 Years | 95 (4.2%) | 193 (5.8%) |
| 75 to 79 Years | 111 (4.9%) | 180 (5.4%) |
| 80 to 84 Years | 72 (3.1%) | 14 (0.4%) |
| 85 Years and over | 2 (0.1%) | 290 (8.7%) |
| Total | 2,290 (100.0%) | 3,332 (100.0%) |
Families and Households in Sylvester
Median Family Size in Sylvester
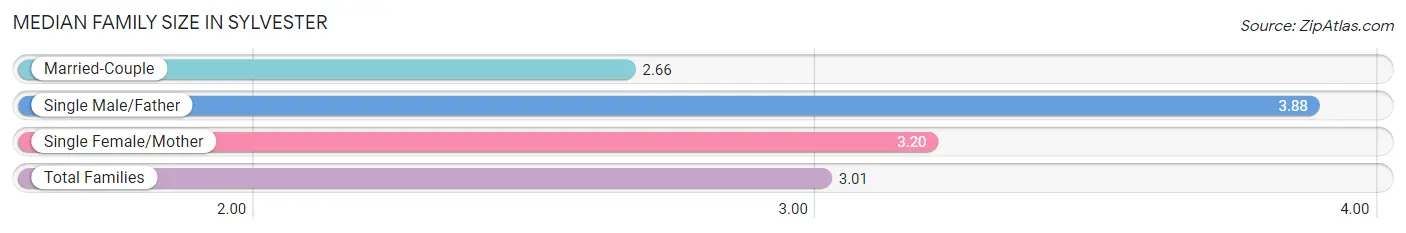
The median family size in Sylvester is 3.01 persons per family, with single male/father families (192 | 12.8%) accounting for the largest median family size of 3.88 persons per family. On the other hand, married-couple families (772 | 51.5%) represent the smallest median family size with 2.66 persons per family.
| Family Type | # Families | Family Size |
| Married-Couple | 772 (51.5%) | 2.66 |
| Single Male/Father | 192 (12.8%) | 3.88 |
| Single Female/Mother | 536 (35.7%) | 3.20 |
| Total Families | 1,500 (100.0%) | 3.01 |
Median Household Size in Sylvester
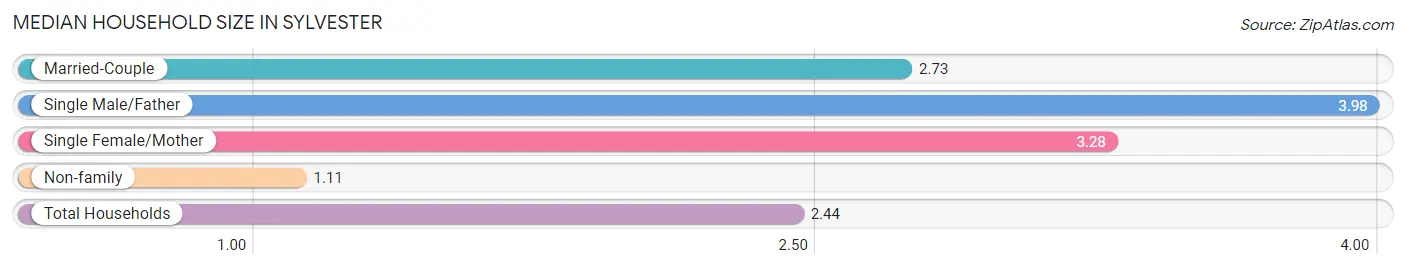
The median household size in Sylvester is 2.44 persons per household, with single male/father households (192 | 8.6%) accounting for the largest median household size of 3.98 persons per household. non-family households (729 | 32.7%) represent the smallest median household size with 1.11 persons per household.
| Household Type | # Households | Household Size |
| Married-Couple | 772 (34.6%) | 2.73 |
| Single Male/Father | 192 (8.6%) | 3.98 |
| Single Female/Mother | 536 (24.0%) | 3.28 |
| Non-family | 729 (32.7%) | 1.11 |
| Total Households | 2,229 (100.0%) | 2.44 |
Household Size by Marriage Status in Sylvester
Out of a total of 2,229 households in Sylvester, 1,500 (67.3%) are family households, while 729 (32.7%) are nonfamily households. The most numerous type of family households are 2-person households, comprising 641, and the most common type of nonfamily households are 1-person households, comprising 671.
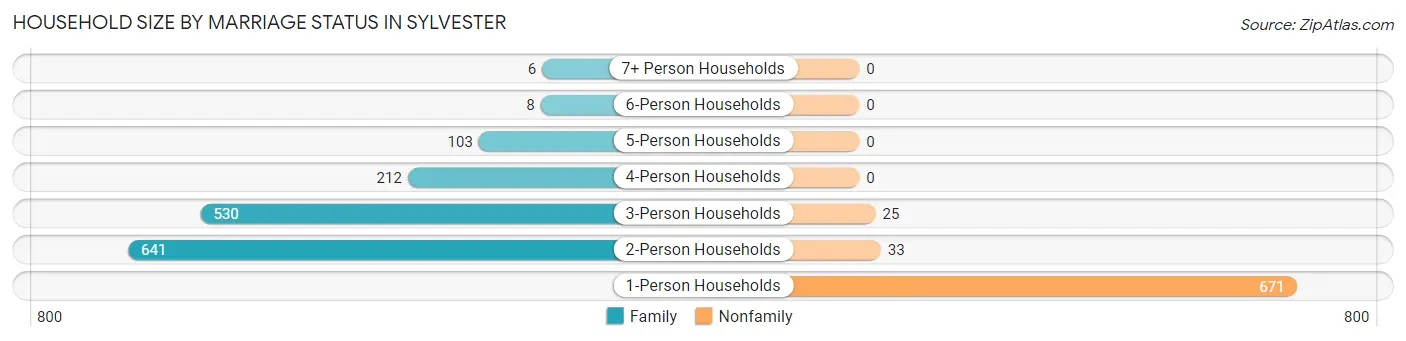
| Household Size | Family Households | Nonfamily Households |
| 1-Person Households | - | 671 (30.1%) |
| 2-Person Households | 641 (28.8%) | 33 (1.5%) |
| 3-Person Households | 530 (23.8%) | 25 (1.1%) |
| 4-Person Households | 212 (9.5%) | 0 (0.0%) |
| 5-Person Households | 103 (4.6%) | 0 (0.0%) |
| 6-Person Households | 8 (0.4%) | 0 (0.0%) |
| 7+ Person Households | 6 (0.3%) | 0 (0.0%) |
| Total | 1,500 (67.3%) | 729 (32.7%) |
Female Fertility in Sylvester
Fertility by Age in Sylvester
Average fertility rate in Sylvester is 90.0 births per 1,000 women. Women in the age bracket of 15 to 19 years have the highest fertility rate with 382.0 births per 1,000 women. Women in the age bracket of 15 to 19 years acount for 69.2% of all women with births.
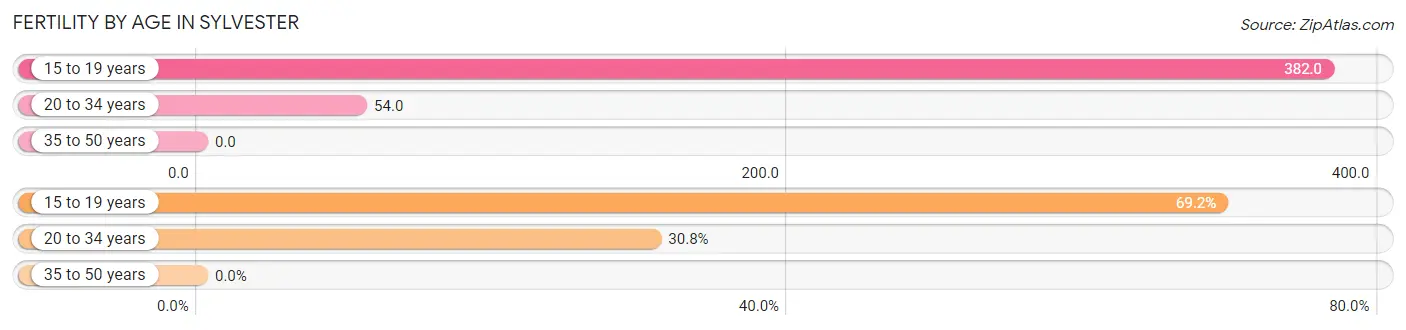
| Age Bracket | Women with Births | Births / 1,000 Women |
| 15 to 19 years | 81 (69.2%) | 382.0 |
| 20 to 34 years | 36 (30.8%) | 54.0 |
| 35 to 50 years | 0 (0.0%) | 0.0 |
| Total | 117 (100.0%) | 90.0 |
Fertility by Age by Marriage Status in Sylvester
12.8% of women with births (117) in Sylvester are married. The highest percentage of unmarried women with births falls into 15 to 19 years age bracket with 100.0% of them unmarried at the time of birth, while the lowest percentage of unmarried women with births belong to 20 to 34 years age bracket with 58.3% of them unmarried.
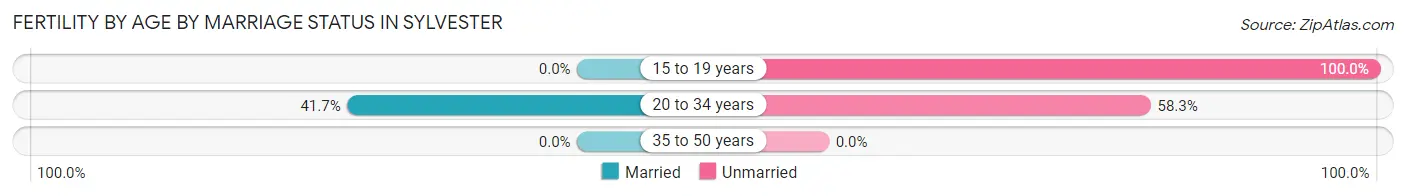
| Age Bracket | Married | Unmarried |
| 15 to 19 years | 0 (0.0%) | 81 (100.0%) |
| 20 to 34 years | 15 (41.7%) | 21 (58.3%) |
| 35 to 50 years | 0 (0.0%) | 0 (0.0%) |
| Total | 15 (12.8%) | 102 (87.2%) |
Fertility by Education in Sylvester
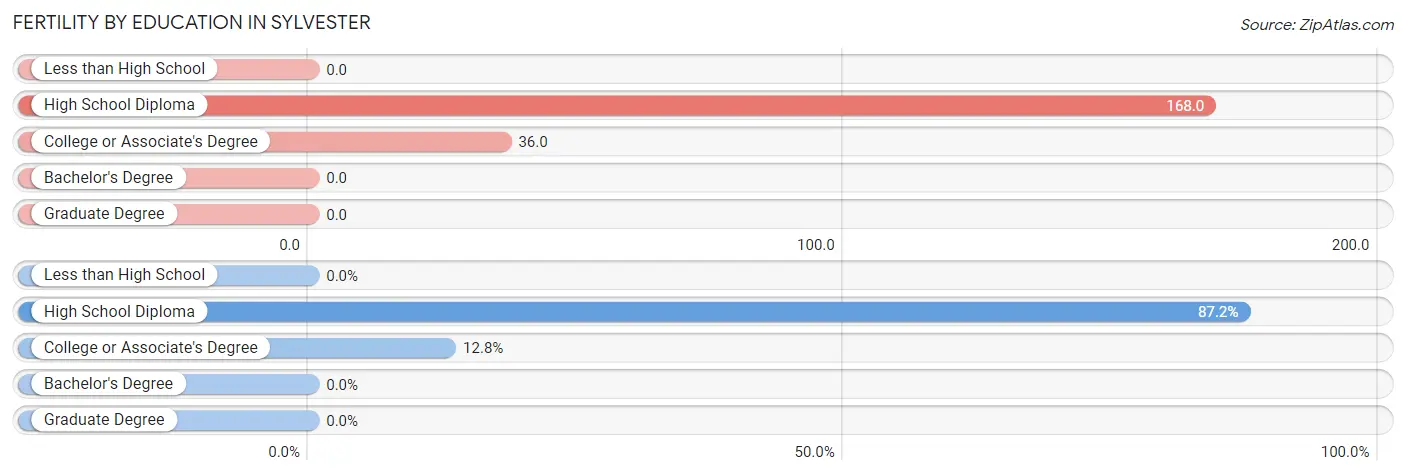
| Educational Attainment | Women with Births | Births / 1,000 Women |
| Less than High School | 0 (0.0%) | 0.0 |
| High School Diploma | 102 (87.2%) | 168.0 |
| College or Associate's Degree | 15 (12.8%) | 36.0 |
| Bachelor's Degree | 0 (0.0%) | 0.0 |
| Graduate Degree | 0 (0.0%) | 0.0 |
| Total | 117 (100.0%) | 90.0 |
Fertility by Education by Marriage Status in Sylvester
87.2% of women with births in Sylvester are unmarried. Women with the educational attainment of college or associate's degree are most likely to be married with 100.0% of them married at childbirth, while women with the educational attainment of high school diploma are least likely to be married with 100.0% of them unmarried at childbirth.
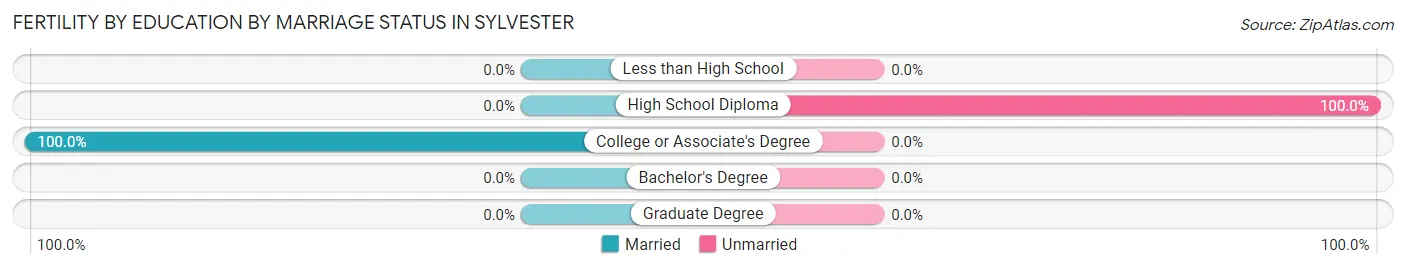
| Educational Attainment | Married | Unmarried |
| Less than High School | 0 (0.0%) | 0 (0.0%) |
| High School Diploma | 0 (0.0%) | 102 (100.0%) |
| College or Associate's Degree | 15 (100.0%) | 0 (0.0%) |
| Bachelor's Degree | 0 (0.0%) | 0 (0.0%) |
| Graduate Degree | 0 (0.0%) | 0 (0.0%) |
| Total | 15 (12.8%) | 102 (87.2%) |
Employment Characteristics in Sylvester
Employment by Class of Employer in Sylvester
Among the 2,343 employed individuals in Sylvester, private company employees (1,754 | 74.9%), self-employed (not incorporated) (196 | 8.4%), and local government employees (151 | 6.4%) make up the most common classes of employment.
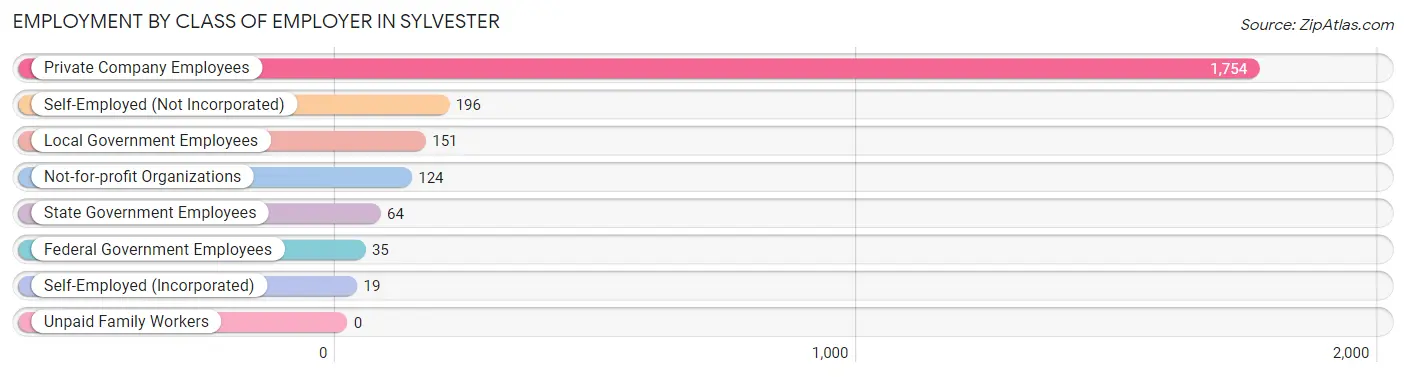
| Employer Class | # Employees | % Employees |
| Private Company Employees | 1,754 | 74.9% |
| Self-Employed (Incorporated) | 19 | 0.8% |
| Self-Employed (Not Incorporated) | 196 | 8.4% |
| Not-for-profit Organizations | 124 | 5.3% |
| Local Government Employees | 151 | 6.4% |
| State Government Employees | 64 | 2.7% |
| Federal Government Employees | 35 | 1.5% |
| Unpaid Family Workers | 0 | 0.0% |
| Total | 2,343 | 100.0% |
Employment Status by Age in Sylvester
According to the labor force statistics for Sylvester, out of the total population over 16 years of age (4,342), 59.4% or 2,579 individuals are in the labor force, with 8.0% or 206 of them unemployed. The age group with the highest labor force participation rate is 30 to 34 years, with 93.0% or 254 individuals in the labor force. Within the labor force, the 16 to 19 years age range has the highest percentage of unemployed individuals, with 24.7% or 47 of them being unemployed.
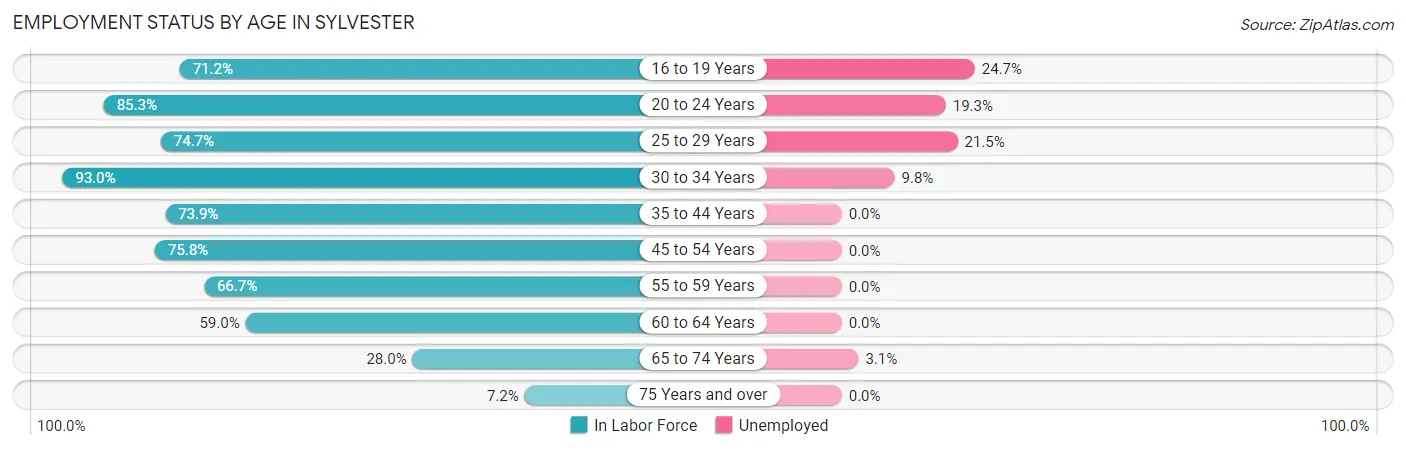
| Age Bracket | In Labor Force | Unemployed |
| 16 to 19 Years | 190 (71.2%) | 47 (24.7%) |
| 20 to 24 Years | 389 (85.3%) | 75 (19.3%) |
| 25 to 29 Years | 251 (74.7%) | 54 (21.5%) |
| 30 to 34 Years | 254 (93.0%) | 25 (9.8%) |
| 35 to 44 Years | 421 (73.9%) | 0 (0.0%) |
| 45 to 54 Years | 407 (75.8%) | 0 (0.0%) |
| 55 to 59 Years | 254 (66.7%) | 0 (0.0%) |
| 60 to 64 Years | 236 (59.0%) | 0 (0.0%) |
| 65 to 74 Years | 127 (28.0%) | 4 (3.1%) |
| 75 Years and over | 48 (7.2%) | 0 (0.0%) |
| Total | 2,579 (59.4%) | 206 (8.0%) |
Employment Status by Educational Attainment in Sylvester
According to labor force statistics for Sylvester, 73.0% of individuals (1,823) out of the total population between 25 and 64 years of age (2,497) are in the labor force, with 4.3% or 78 of them being unemployed. The group with the highest labor force participation rate are those with the educational attainment of bachelor's degree or higher, with 98.7% or 227 individuals in the labor force. Within the labor force, individuals with less than high school education have the highest percentage of unemployment, with 18.8% or 19 of them being unemployed.
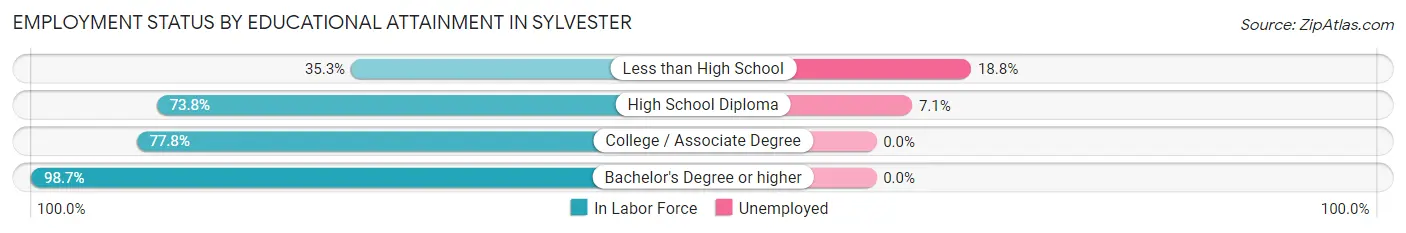
| Educational Attainment | In Labor Force | Unemployed |
| Less than High School | 101 (35.3%) | 54 (18.8%) |
| High School Diploma | 841 (73.8%) | 81 (7.1%) |
| College / Associate Degree | 654 (77.8%) | 0 (0.0%) |
| Bachelor's Degree or higher | 227 (98.7%) | 0 (0.0%) |
| Total | 1,823 (73.0%) | 107 (4.3%) |
Employment Occupations by Sex in Sylvester
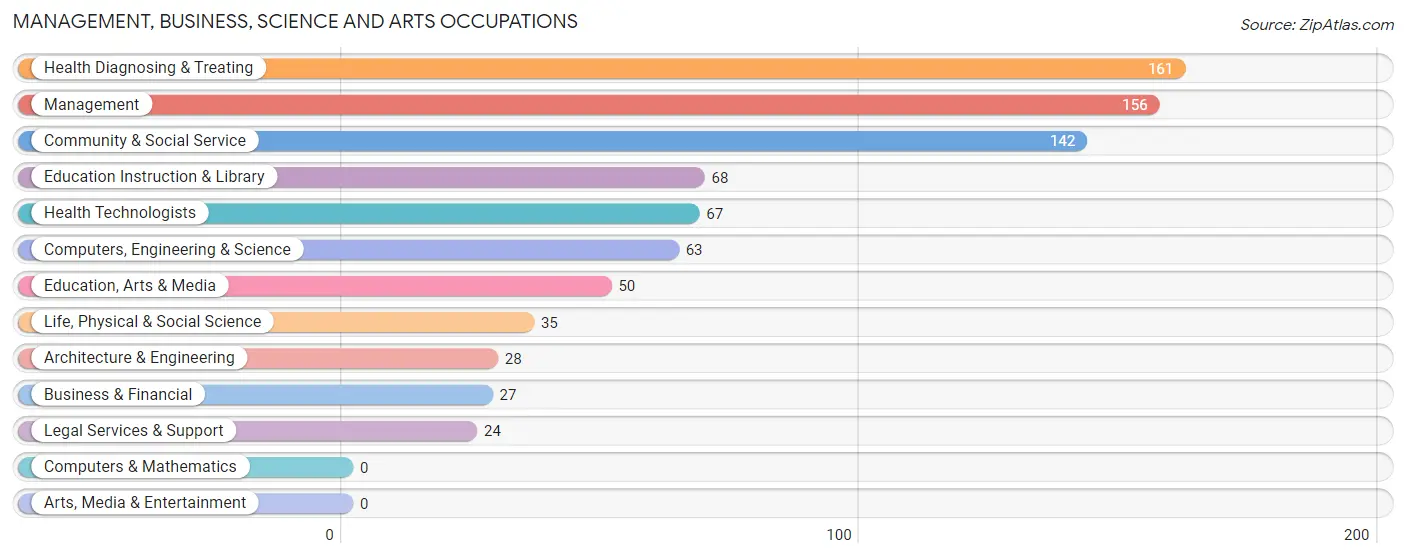
Management, Business, Science and Arts Occupations
The most common Management, Business, Science and Arts occupations in Sylvester are Health Diagnosing & Treating (161 | 6.8%), Management (156 | 6.6%), Community & Social Service (142 | 6.0%), Education Instruction & Library (68 | 2.9%), and Health Technologists (67 | 2.8%).
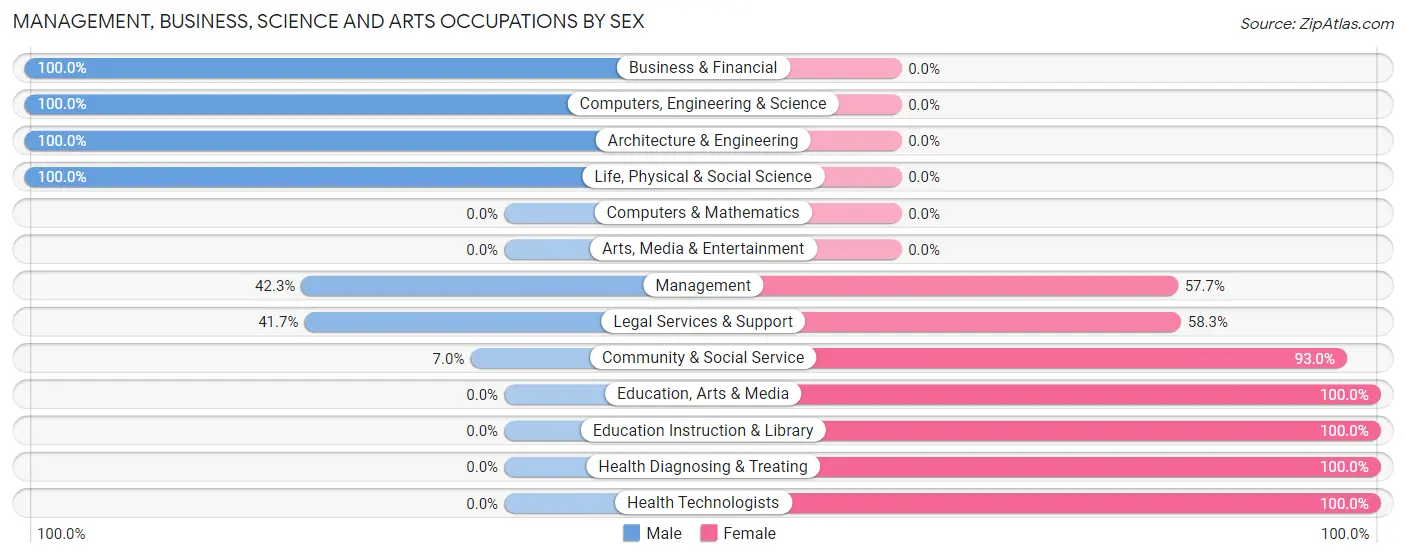
Management, Business, Science and Arts Occupations by Sex
Within the Management, Business, Science and Arts occupations in Sylvester, the most male-oriented occupations are Business & Financial (100.0%), Computers, Engineering & Science (100.0%), and Architecture & Engineering (100.0%), while the most female-oriented occupations are Education, Arts & Media (100.0%), Education Instruction & Library (100.0%), and Health Diagnosing & Treating (100.0%).
| Occupation | Male | Female |
| Management | 66 (42.3%) | 90 (57.7%) |
| Business & Financial | 27 (100.0%) | 0 (0.0%) |
| Computers, Engineering & Science | 63 (100.0%) | 0 (0.0%) |
| Computers & Mathematics | 0 (0.0%) | 0 (0.0%) |
| Architecture & Engineering | 28 (100.0%) | 0 (0.0%) |
| Life, Physical & Social Science | 35 (100.0%) | 0 (0.0%) |
| Community & Social Service | 10 (7.0%) | 132 (93.0%) |
| Education, Arts & Media | 0 (0.0%) | 50 (100.0%) |
| Legal Services & Support | 10 (41.7%) | 14 (58.3%) |
| Education Instruction & Library | 0 (0.0%) | 68 (100.0%) |
| Arts, Media & Entertainment | 0 (0.0%) | 0 (0.0%) |
| Health Diagnosing & Treating | 0 (0.0%) | 161 (100.0%) |
| Health Technologists | 0 (0.0%) | 67 (100.0%) |
| Total (Category) | 166 (30.2%) | 383 (69.8%) |
| Total (Overall) | 1,123 (47.3%) | 1,249 (52.7%) |
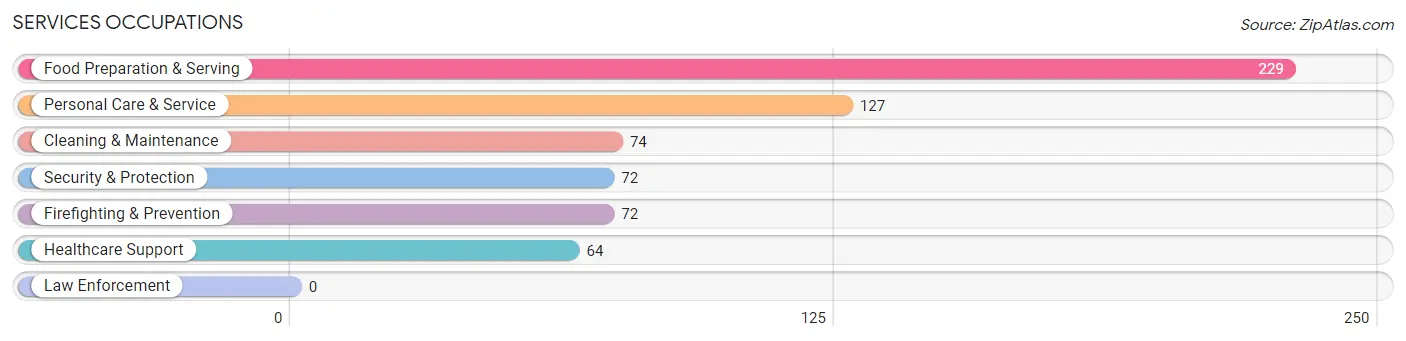
Services Occupations
The most common Services occupations in Sylvester are Food Preparation & Serving (229 | 9.7%), Personal Care & Service (127 | 5.3%), Cleaning & Maintenance (74 | 3.1%), Security & Protection (72 | 3.0%), and Firefighting & Prevention (72 | 3.0%).
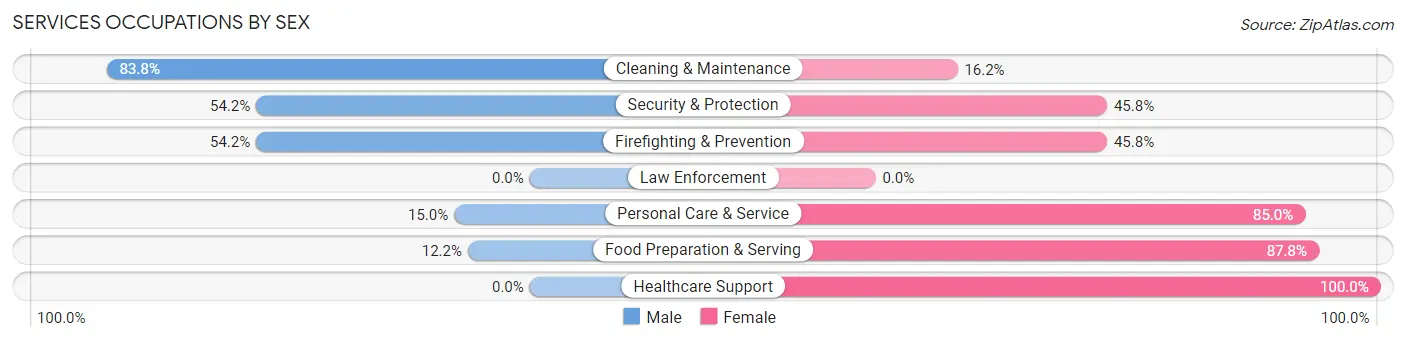
Services Occupations by Sex
Within the Services occupations in Sylvester, the most male-oriented occupations are Cleaning & Maintenance (83.8%), Security & Protection (54.2%), and Firefighting & Prevention (54.2%), while the most female-oriented occupations are Healthcare Support (100.0%), Food Preparation & Serving (87.8%), and Personal Care & Service (85.0%).
| Occupation | Male | Female |
| Healthcare Support | 0 (0.0%) | 64 (100.0%) |
| Security & Protection | 39 (54.2%) | 33 (45.8%) |
| Firefighting & Prevention | 39 (54.2%) | 33 (45.8%) |
| Law Enforcement | 0 (0.0%) | 0 (0.0%) |
| Food Preparation & Serving | 28 (12.2%) | 201 (87.8%) |
| Cleaning & Maintenance | 62 (83.8%) | 12 (16.2%) |
| Personal Care & Service | 19 (15.0%) | 108 (85.0%) |
| Total (Category) | 148 (26.2%) | 418 (73.9%) |
| Total (Overall) | 1,123 (47.3%) | 1,249 (52.7%) |
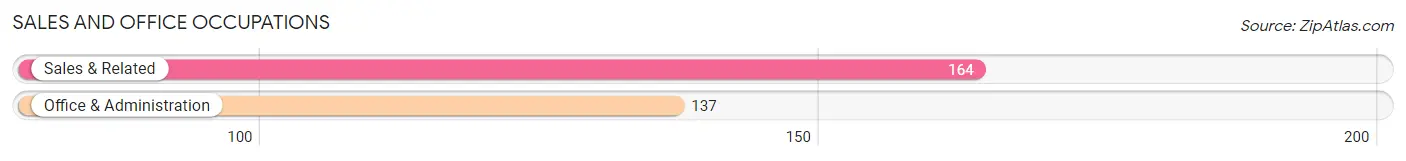
Sales and Office Occupations
The most common Sales and Office occupations in Sylvester are Sales & Related (164 | 6.9%), and Office & Administration (137 | 5.8%).
Sales and Office Occupations by Sex
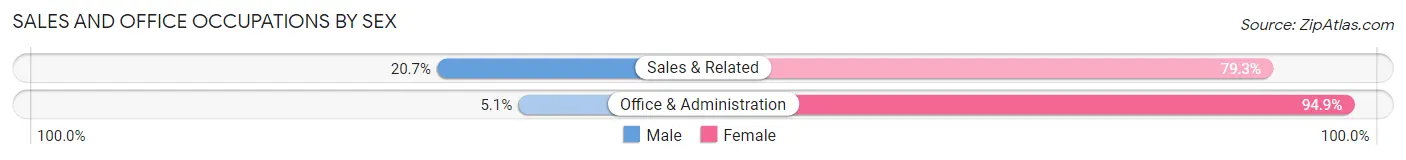
| Occupation | Male | Female |
| Sales & Related | 34 (20.7%) | 130 (79.3%) |
| Office & Administration | 7 (5.1%) | 130 (94.9%) |
| Total (Category) | 41 (13.6%) | 260 (86.4%) |
| Total (Overall) | 1,123 (47.3%) | 1,249 (52.7%) |
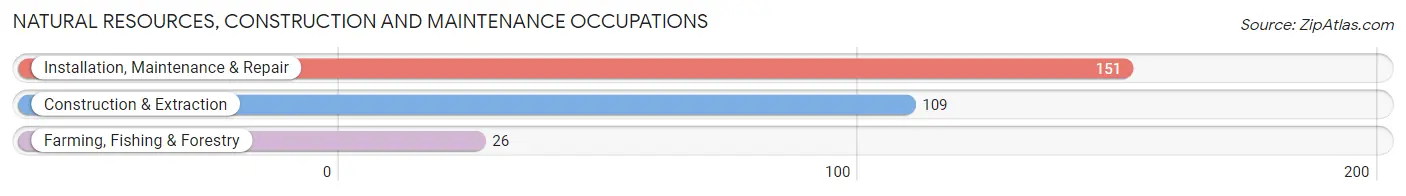
Natural Resources, Construction and Maintenance Occupations
The most common Natural Resources, Construction and Maintenance occupations in Sylvester are Installation, Maintenance & Repair (151 | 6.4%), Construction & Extraction (109 | 4.6%), and Farming, Fishing & Forestry (26 | 1.1%).
Natural Resources, Construction and Maintenance Occupations by Sex
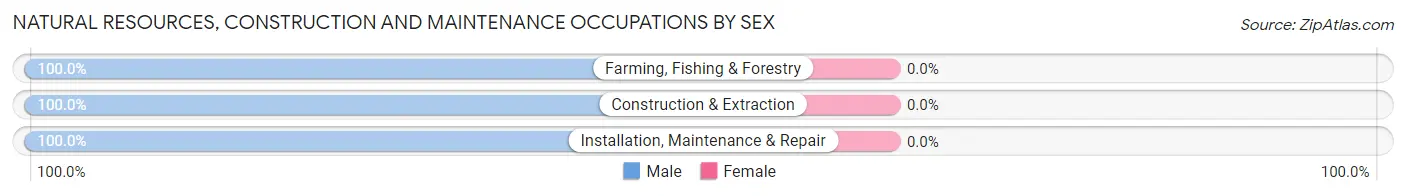
| Occupation | Male | Female |
| Farming, Fishing & Forestry | 26 (100.0%) | 0 (0.0%) |
| Construction & Extraction | 109 (100.0%) | 0 (0.0%) |
| Installation, Maintenance & Repair | 151 (100.0%) | 0 (0.0%) |
| Total (Category) | 286 (100.0%) | 0 (0.0%) |
| Total (Overall) | 1,123 (47.3%) | 1,249 (52.7%) |
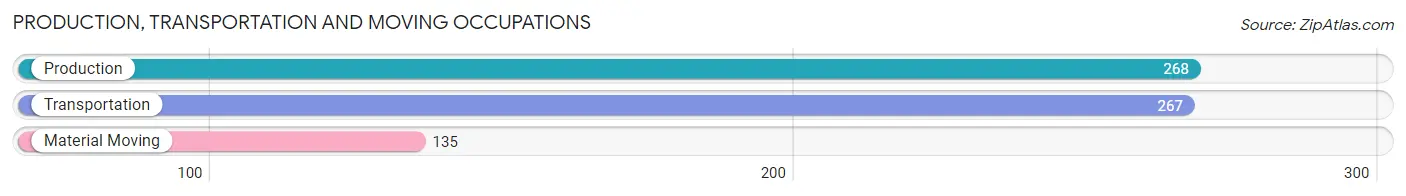
Production, Transportation and Moving Occupations
The most common Production, Transportation and Moving occupations in Sylvester are Production (268 | 11.3%), Transportation (267 | 11.3%), and Material Moving (135 | 5.7%).
Production, Transportation and Moving Occupations by Sex
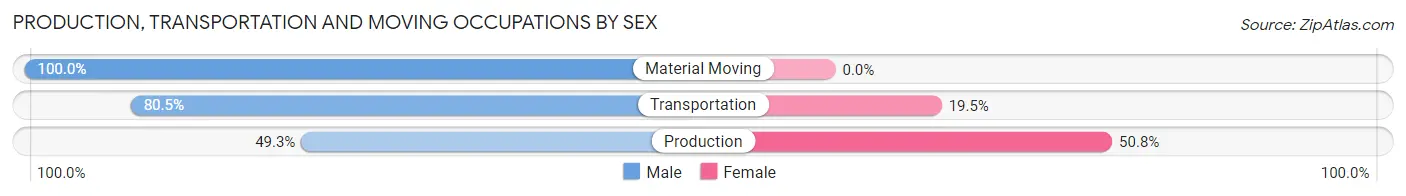
| Occupation | Male | Female |
| Production | 132 (49.2%) | 136 (50.7%) |
| Transportation | 215 (80.5%) | 52 (19.5%) |
| Material Moving | 135 (100.0%) | 0 (0.0%) |
| Total (Category) | 482 (71.9%) | 188 (28.1%) |
| Total (Overall) | 1,123 (47.3%) | 1,249 (52.7%) |
Employment Industries by Sex in Sylvester
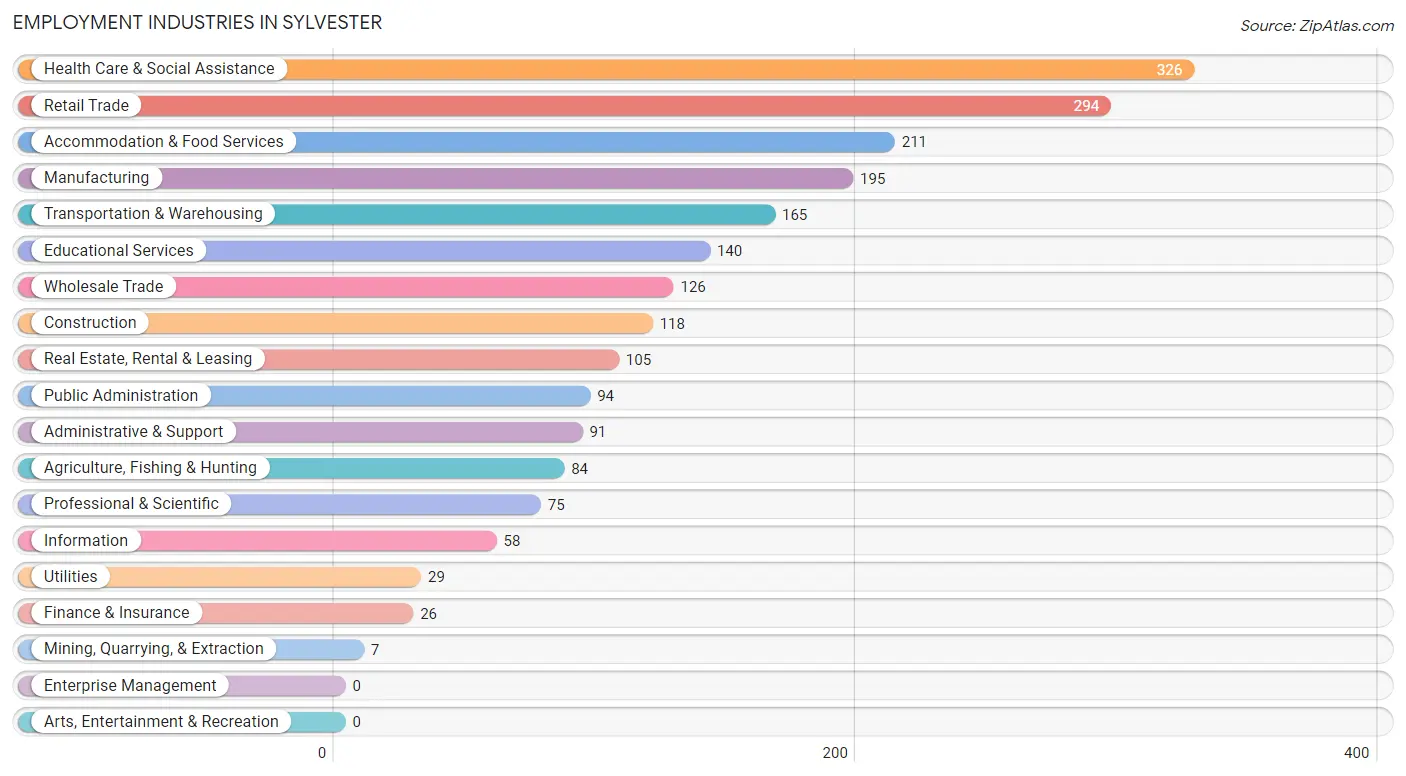
Employment Industries in Sylvester
The major employment industries in Sylvester include Health Care & Social Assistance (326 | 13.7%), Retail Trade (294 | 12.4%), Accommodation & Food Services (211 | 8.9%), Manufacturing (195 | 8.2%), and Transportation & Warehousing (165 | 7.0%).
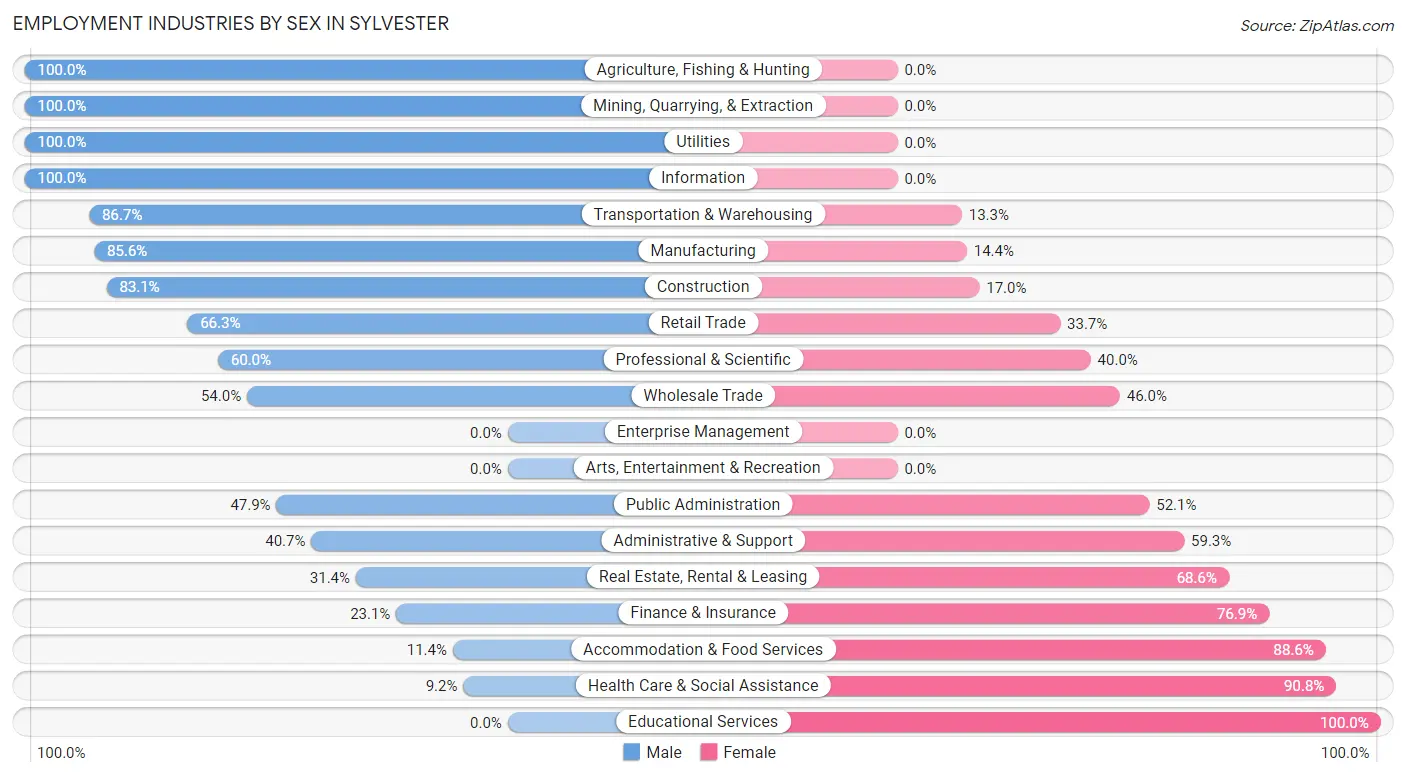
Employment Industries by Sex in Sylvester
The Sylvester industries that see more men than women are Agriculture, Fishing & Hunting (100.0%), Mining, Quarrying, & Extraction (100.0%), and Utilities (100.0%), whereas the industries that tend to have a higher number of women are Educational Services (100.0%), Health Care & Social Assistance (90.8%), and Accommodation & Food Services (88.6%).
| Industry | Male | Female |
| Agriculture, Fishing & Hunting | 84 (100.0%) | 0 (0.0%) |
| Mining, Quarrying, & Extraction | 7 (100.0%) | 0 (0.0%) |
| Construction | 98 (83.1%) | 20 (17.0%) |
| Manufacturing | 167 (85.6%) | 28 (14.4%) |
| Wholesale Trade | 68 (54.0%) | 58 (46.0%) |
| Retail Trade | 195 (66.3%) | 99 (33.7%) |
| Transportation & Warehousing | 143 (86.7%) | 22 (13.3%) |
| Utilities | 29 (100.0%) | 0 (0.0%) |
| Information | 58 (100.0%) | 0 (0.0%) |
| Finance & Insurance | 6 (23.1%) | 20 (76.9%) |
| Real Estate, Rental & Leasing | 33 (31.4%) | 72 (68.6%) |
| Professional & Scientific | 45 (60.0%) | 30 (40.0%) |
| Enterprise Management | 0 (0.0%) | 0 (0.0%) |
| Administrative & Support | 37 (40.7%) | 54 (59.3%) |
| Educational Services | 0 (0.0%) | 140 (100.0%) |
| Health Care & Social Assistance | 30 (9.2%) | 296 (90.8%) |
| Arts, Entertainment & Recreation | 0 (0.0%) | 0 (0.0%) |
| Accommodation & Food Services | 24 (11.4%) | 187 (88.6%) |
| Public Administration | 45 (47.9%) | 49 (52.1%) |
| Total | 1,123 (47.3%) | 1,249 (52.7%) |
Education in Sylvester
School Enrollment in Sylvester
The most common levels of schooling among the 1,372 students in Sylvester are elementary school (405 | 29.5%), college / undergraduate (321 | 23.4%), and middle school (209 | 15.2%).
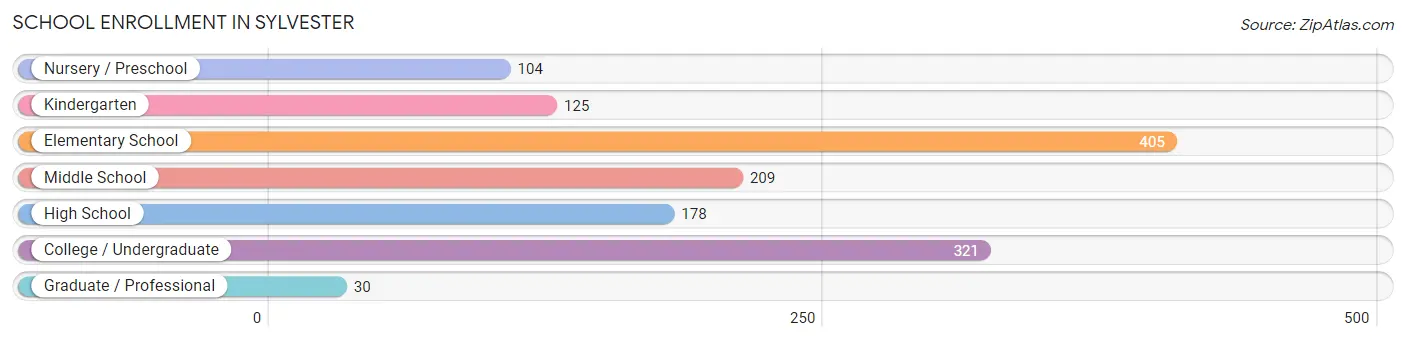
| School Level | # Students | % Students |
| Nursery / Preschool | 104 | 7.6% |
| Kindergarten | 125 | 9.1% |
| Elementary School | 405 | 29.5% |
| Middle School | 209 | 15.2% |
| High School | 178 | 13.0% |
| College / Undergraduate | 321 | 23.4% |
| Graduate / Professional | 30 | 2.2% |
| Total | 1,372 | 100.0% |
School Enrollment by Age by Funding Source in Sylvester
Out of a total of 1,372 students who are enrolled in schools in Sylvester, 97 (7.1%) attend a private institution, while the remaining 1,275 (92.9%) are enrolled in public schools. The age group of 20 to 24 year olds has the highest likelihood of being enrolled in private schools, with 88 (33.7% in the age bracket) enrolled. Conversely, the age group of 3 to 4 year olds has the lowest likelihood of being enrolled in a private school, with 104 (100.0% in the age bracket) attending a public institution.
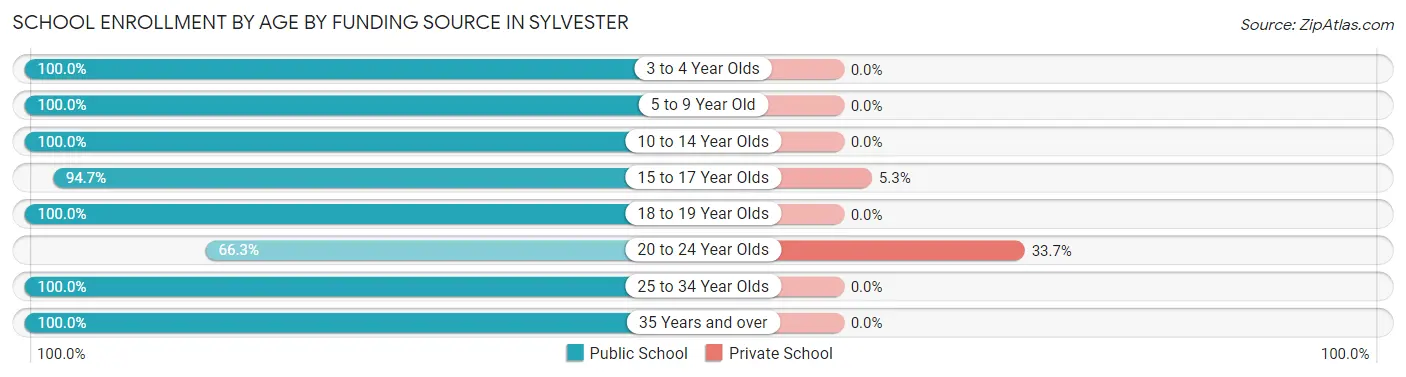
| Age Bracket | Public School | Private School |
| 3 to 4 Year Olds | 104 (100.0%) | 0 (0.0%) |
| 5 to 9 Year Old | 372 (100.0%) | 0 (0.0%) |
| 10 to 14 Year Olds | 374 (100.0%) | 0 (0.0%) |
| 15 to 17 Year Olds | 162 (94.7%) | 9 (5.3%) |
| 18 to 19 Year Olds | 42 (100.0%) | 0 (0.0%) |
| 20 to 24 Year Olds | 173 (66.3%) | 88 (33.7%) |
| 25 to 34 Year Olds | 25 (100.0%) | 0 (0.0%) |
| 35 Years and over | 23 (100.0%) | 0 (0.0%) |
| Total | 1,275 (92.9%) | 97 (7.1%) |
Educational Attainment by Field of Study in Sylvester
Education (164 | 31.6%), business (125 | 24.1%), bio, nature & agricultural (63 | 12.1%), engineering (61 | 11.7%), and social sciences (59 | 11.4%) are the most common fields of study among 519 individuals in Sylvester who have obtained a bachelor's degree or higher.
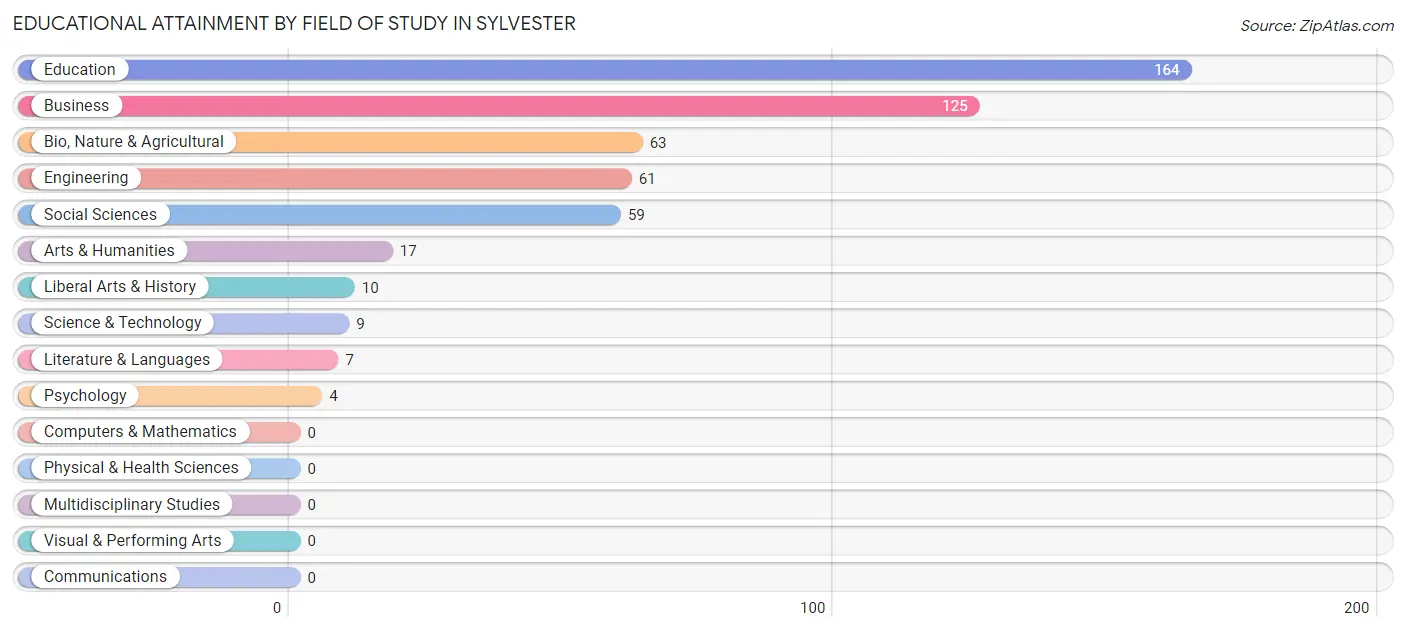
| Field of Study | # Graduates | % Graduates |
| Computers & Mathematics | 0 | 0.0% |
| Bio, Nature & Agricultural | 63 | 12.1% |
| Physical & Health Sciences | 0 | 0.0% |
| Psychology | 4 | 0.8% |
| Social Sciences | 59 | 11.4% |
| Engineering | 61 | 11.7% |
| Multidisciplinary Studies | 0 | 0.0% |
| Science & Technology | 9 | 1.7% |
| Business | 125 | 24.1% |
| Education | 164 | 31.6% |
| Literature & Languages | 7 | 1.3% |
| Liberal Arts & History | 10 | 1.9% |
| Visual & Performing Arts | 0 | 0.0% |
| Communications | 0 | 0.0% |
| Arts & Humanities | 17 | 3.3% |
| Total | 519 | 100.0% |
Transportation & Commute in Sylvester
Vehicle Availability by Sex in Sylvester
The most prevalent vehicle ownership categories in Sylvester are males with 2 vehicles (393, accounting for 35.9%) and females with 2 vehicles (354, making up 31.5%).
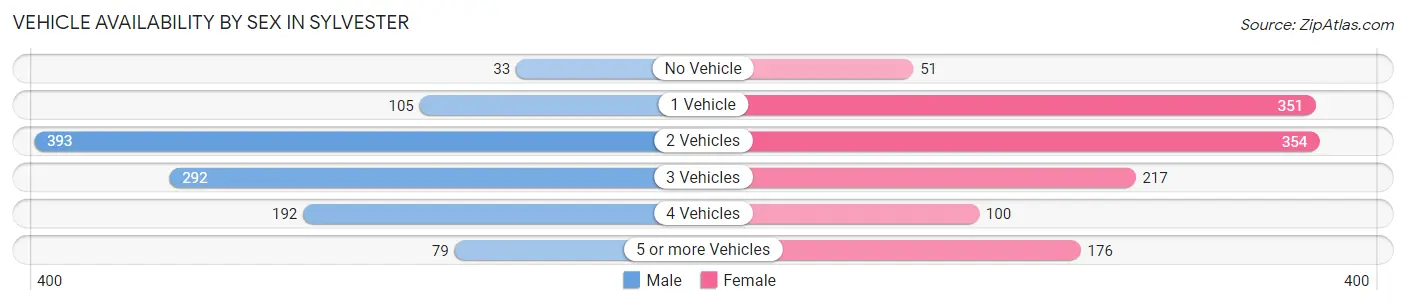
| Vehicles Available | Male | Female |
| No Vehicle | 33 (3.0%) | 51 (4.1%) |
| 1 Vehicle | 105 (9.6%) | 351 (28.1%) |
| 2 Vehicles | 393 (35.9%) | 354 (28.3%) |
| 3 Vehicles | 292 (26.7%) | 217 (17.4%) |
| 4 Vehicles | 192 (17.5%) | 100 (8.0%) |
| 5 or more Vehicles | 79 (7.2%) | 176 (14.1%) |
| Total | 1,094 (100.0%) | 1,249 (100.0%) |
Commute Time in Sylvester
The most frequently occuring commute durations in Sylvester are 5 to 9 minutes (663 commuters, 30.0%), 30 to 34 minutes (414 commuters, 18.7%), and 20 to 24 minutes (259 commuters, 11.7%).
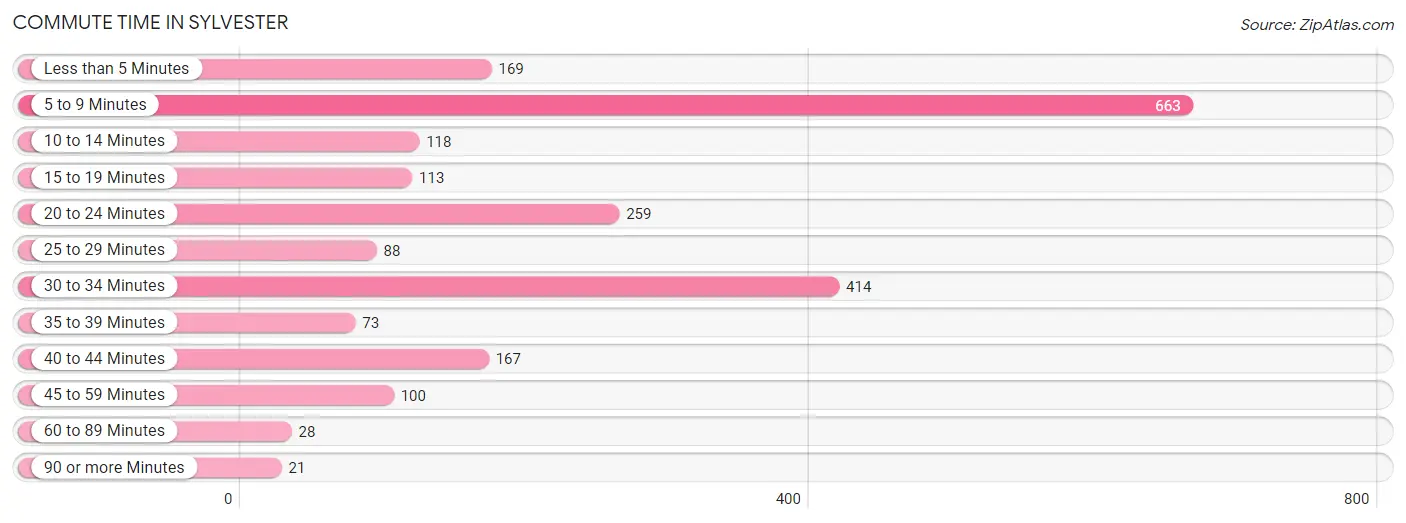
| Commute Time | # Commuters | % Commuters |
| Less than 5 Minutes | 169 | 7.6% |
| 5 to 9 Minutes | 663 | 30.0% |
| 10 to 14 Minutes | 118 | 5.3% |
| 15 to 19 Minutes | 113 | 5.1% |
| 20 to 24 Minutes | 259 | 11.7% |
| 25 to 29 Minutes | 88 | 4.0% |
| 30 to 34 Minutes | 414 | 18.7% |
| 35 to 39 Minutes | 73 | 3.3% |
| 40 to 44 Minutes | 167 | 7.5% |
| 45 to 59 Minutes | 100 | 4.5% |
| 60 to 89 Minutes | 28 | 1.3% |
| 90 or more Minutes | 21 | 0.9% |
Commute Time by Sex in Sylvester
The most common commute times in Sylvester are 30 to 34 minutes (310 commuters, 29.5%) for males and 5 to 9 minutes (505 commuters, 43.4%) for females.
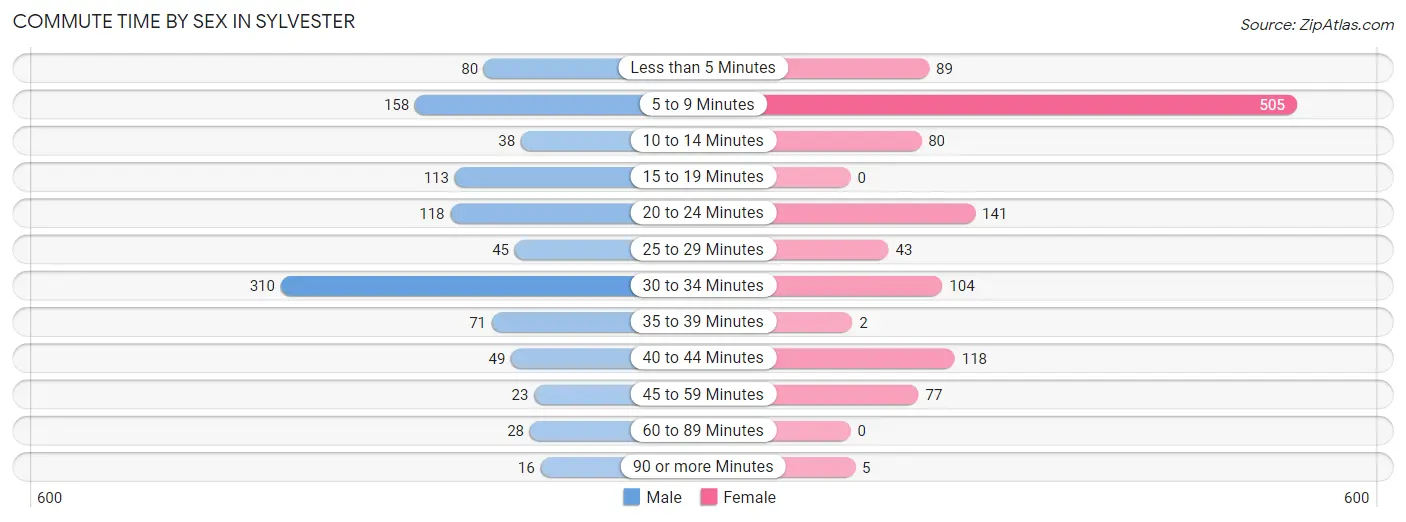
| Commute Time | Male | Female |
| Less than 5 Minutes | 80 (7.6%) | 89 (7.6%) |
| 5 to 9 Minutes | 158 (15.1%) | 505 (43.4%) |
| 10 to 14 Minutes | 38 (3.6%) | 80 (6.9%) |
| 15 to 19 Minutes | 113 (10.8%) | 0 (0.0%) |
| 20 to 24 Minutes | 118 (11.3%) | 141 (12.1%) |
| 25 to 29 Minutes | 45 (4.3%) | 43 (3.7%) |
| 30 to 34 Minutes | 310 (29.5%) | 104 (8.9%) |
| 35 to 39 Minutes | 71 (6.8%) | 2 (0.2%) |
| 40 to 44 Minutes | 49 (4.7%) | 118 (10.1%) |
| 45 to 59 Minutes | 23 (2.2%) | 77 (6.6%) |
| 60 to 89 Minutes | 28 (2.7%) | 0 (0.0%) |
| 90 or more Minutes | 16 (1.5%) | 5 (0.4%) |
Time of Departure to Work by Sex in Sylvester
The most frequent times of departure to work in Sylvester are 7:30 AM to 7:59 AM (211, 20.1%) for males and 7:00 AM to 7:29 AM (176, 15.1%) for females.
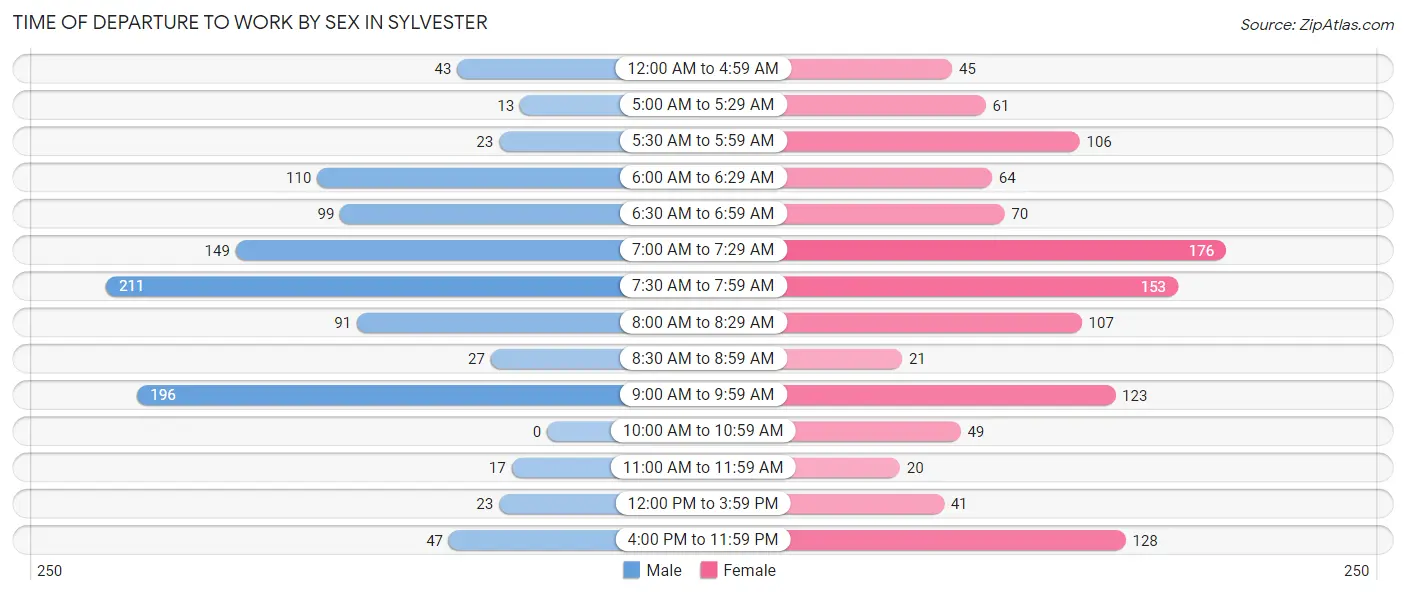
| Time of Departure | Male | Female |
| 12:00 AM to 4:59 AM | 43 (4.1%) | 45 (3.9%) |
| 5:00 AM to 5:29 AM | 13 (1.2%) | 61 (5.2%) |
| 5:30 AM to 5:59 AM | 23 (2.2%) | 106 (9.1%) |
| 6:00 AM to 6:29 AM | 110 (10.5%) | 64 (5.5%) |
| 6:30 AM to 6:59 AM | 99 (9.4%) | 70 (6.0%) |
| 7:00 AM to 7:29 AM | 149 (14.2%) | 176 (15.1%) |
| 7:30 AM to 7:59 AM | 211 (20.1%) | 153 (13.1%) |
| 8:00 AM to 8:29 AM | 91 (8.7%) | 107 (9.2%) |
| 8:30 AM to 8:59 AM | 27 (2.6%) | 21 (1.8%) |
| 9:00 AM to 9:59 AM | 196 (18.7%) | 123 (10.6%) |
| 10:00 AM to 10:59 AM | 0 (0.0%) | 49 (4.2%) |
| 11:00 AM to 11:59 AM | 17 (1.6%) | 20 (1.7%) |
| 12:00 PM to 3:59 PM | 23 (2.2%) | 41 (3.5%) |
| 4:00 PM to 11:59 PM | 47 (4.5%) | 128 (11.0%) |
| Total | 1,049 (100.0%) | 1,164 (100.0%) |
Housing Occupancy in Sylvester
Occupancy by Ownership in Sylvester
Of the total 2,229 dwellings in Sylvester, owner-occupied units account for 1,296 (58.1%), while renter-occupied units make up 933 (41.9%).
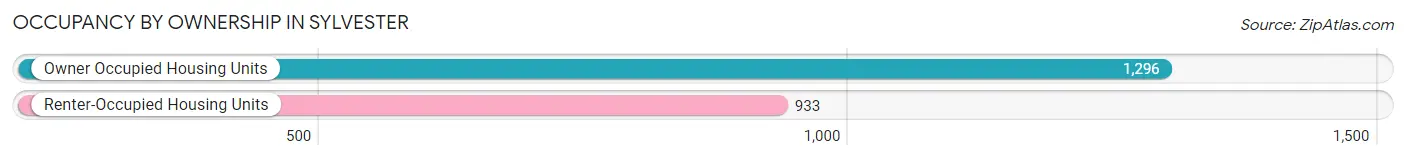
| Occupancy | # Housing Units | % Housing Units |
| Owner Occupied Housing Units | 1,296 | 58.1% |
| Renter-Occupied Housing Units | 933 | 41.9% |
| Total Occupied Housing Units | 2,229 | 100.0% |
Occupancy by Household Size in Sylvester
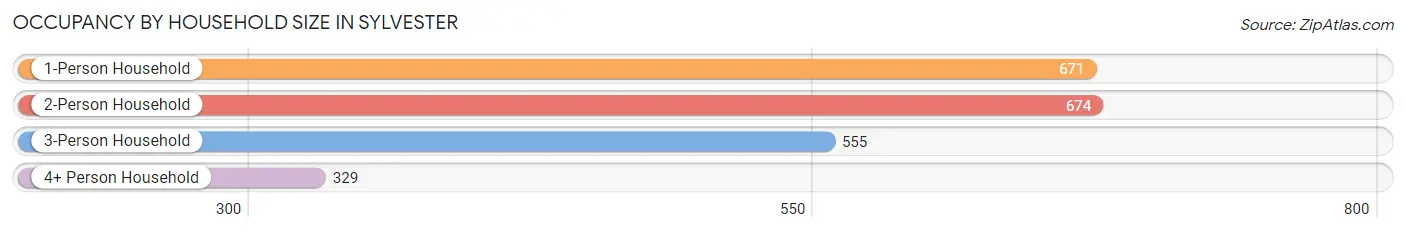
| Household Size | # Housing Units | % Housing Units |
| 1-Person Household | 671 | 30.1% |
| 2-Person Household | 674 | 30.2% |
| 3-Person Household | 555 | 24.9% |
| 4+ Person Household | 329 | 14.8% |
| Total Housing Units | 2,229 | 100.0% |
Occupancy by Ownership by Household Size in Sylvester
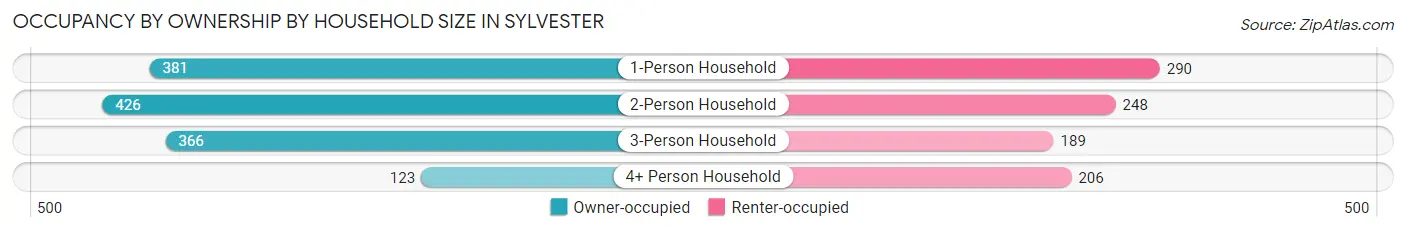
| Household Size | Owner-occupied | Renter-occupied |
| 1-Person Household | 381 (56.8%) | 290 (43.2%) |
| 2-Person Household | 426 (63.2%) | 248 (36.8%) |
| 3-Person Household | 366 (65.9%) | 189 (34.1%) |
| 4+ Person Household | 123 (37.4%) | 206 (62.6%) |
| Total Housing Units | 1,296 (58.1%) | 933 (41.9%) |
Occupancy by Educational Attainment in Sylvester
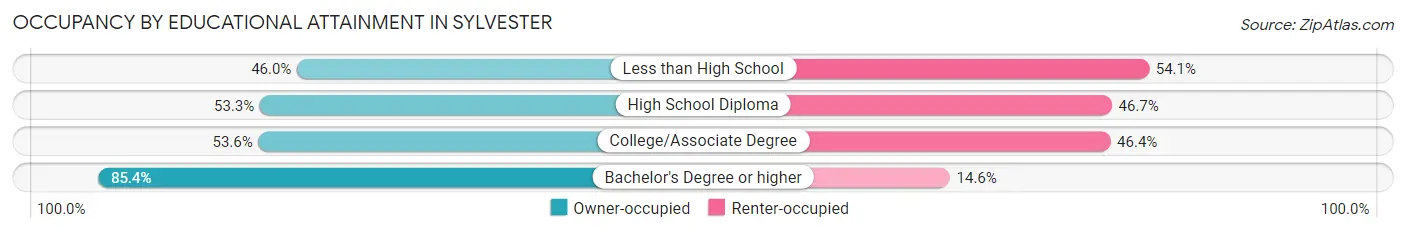
| Household Size | Owner-occupied | Renter-occupied |
| Less than High School | 85 (46.0%) | 100 (54.0%) |
| High School Diploma | 538 (53.3%) | 471 (46.7%) |
| College/Associate Degree | 356 (53.6%) | 308 (46.4%) |
| Bachelor's Degree or higher | 317 (85.4%) | 54 (14.6%) |
Occupancy by Age of Householder in Sylvester
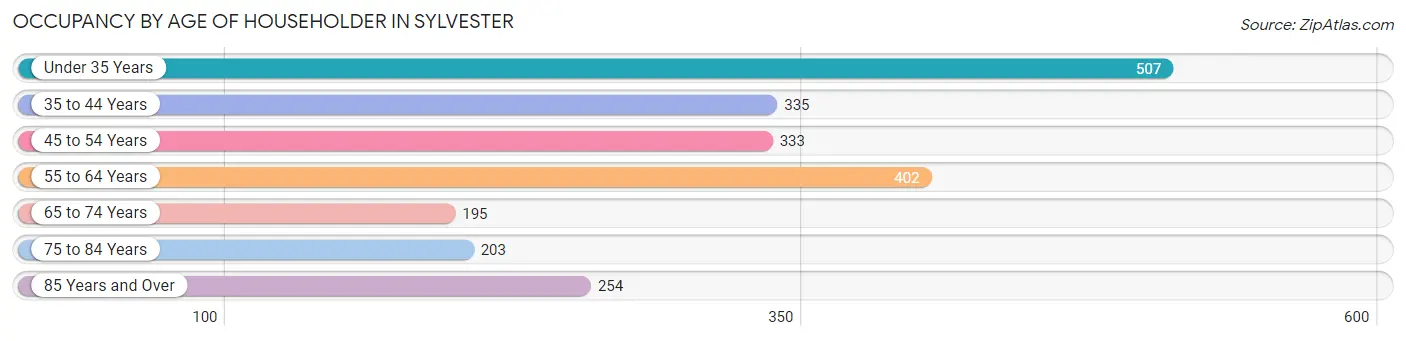
| Age Bracket | # Households | % Households |
| Under 35 Years | 507 | 22.8% |
| 35 to 44 Years | 335 | 15.0% |
| 45 to 54 Years | 333 | 14.9% |
| 55 to 64 Years | 402 | 18.0% |
| 65 to 74 Years | 195 | 8.7% |
| 75 to 84 Years | 203 | 9.1% |
| 85 Years and Over | 254 | 11.4% |
| Total | 2,229 | 100.0% |
Housing Finances in Sylvester
Median Income by Occupancy in Sylvester
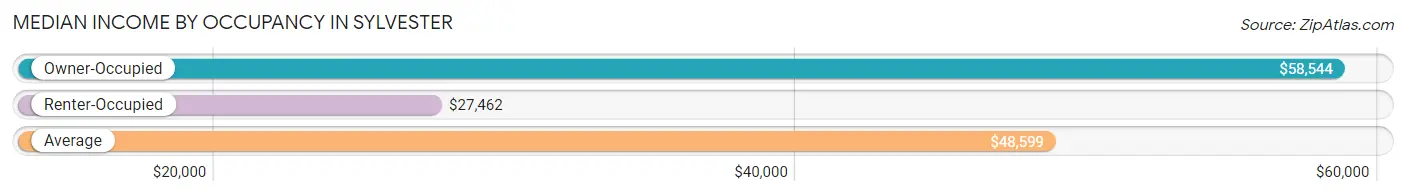
| Occupancy Type | # Households | Median Income |
| Owner-Occupied | 1,296 (58.1%) | $58,544 |
| Renter-Occupied | 933 (41.9%) | $27,462 |
| Average | 2,229 (100.0%) | $48,599 |
Occupancy by Householder Income Bracket in Sylvester
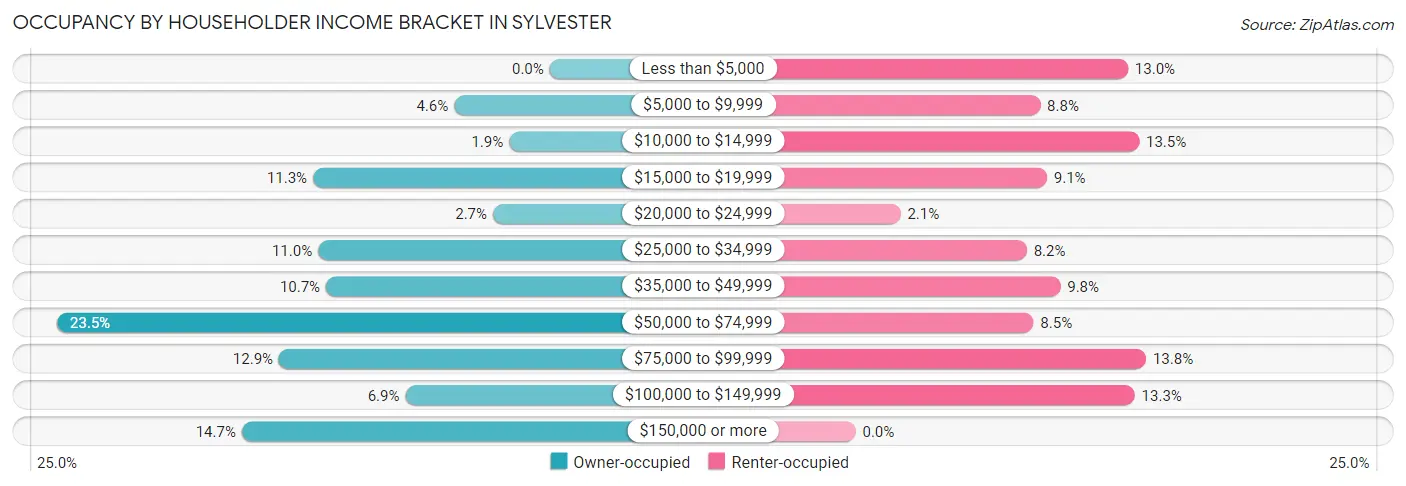
| Income Bracket | Owner-occupied | Renter-occupied |
| Less than $5,000 | 0 (0.0%) | 121 (13.0%) |
| $5,000 to $9,999 | 59 (4.5%) | 82 (8.8%) |
| $10,000 to $14,999 | 25 (1.9%) | 126 (13.5%) |
| $15,000 to $19,999 | 146 (11.3%) | 85 (9.1%) |
| $20,000 to $24,999 | 35 (2.7%) | 20 (2.1%) |
| $25,000 to $34,999 | 143 (11.0%) | 76 (8.2%) |
| $35,000 to $49,999 | 138 (10.6%) | 91 (9.8%) |
| $50,000 to $74,999 | 304 (23.5%) | 79 (8.5%) |
| $75,000 to $99,999 | 167 (12.9%) | 129 (13.8%) |
| $100,000 to $149,999 | 89 (6.9%) | 124 (13.3%) |
| $150,000 or more | 190 (14.7%) | 0 (0.0%) |
| Total | 1,296 (100.0%) | 933 (100.0%) |
Monthly Housing Cost Tiers in Sylvester
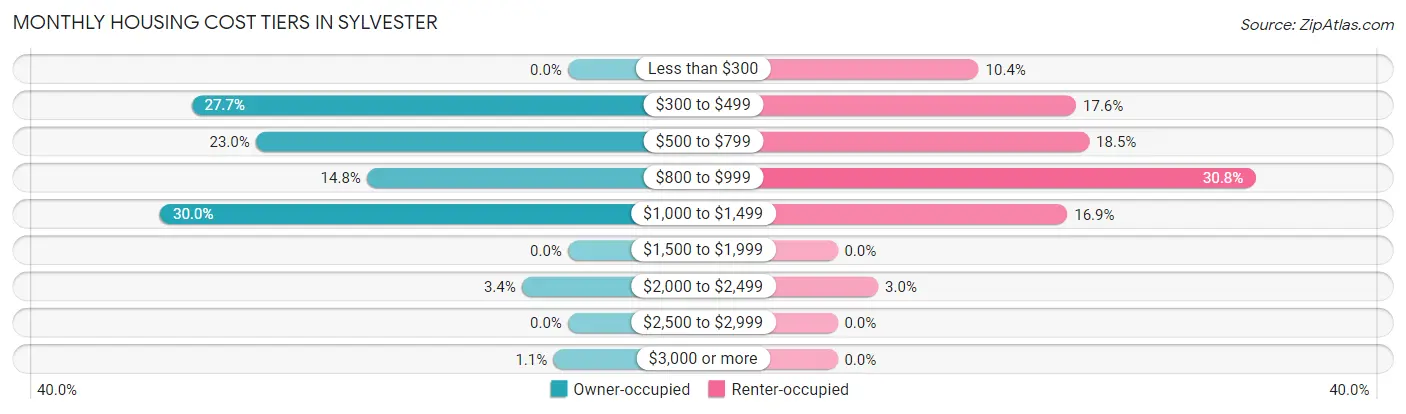
| Monthly Cost | Owner-occupied | Renter-occupied |
| Less than $300 | 0 (0.0%) | 97 (10.4%) |
| $300 to $499 | 359 (27.7%) | 164 (17.6%) |
| $500 to $799 | 298 (23.0%) | 173 (18.5%) |
| $800 to $999 | 192 (14.8%) | 287 (30.8%) |
| $1,000 to $1,499 | 389 (30.0%) | 158 (16.9%) |
| $1,500 to $1,999 | 0 (0.0%) | 0 (0.0%) |
| $2,000 to $2,499 | 44 (3.4%) | 28 (3.0%) |
| $2,500 to $2,999 | 0 (0.0%) | 0 (0.0%) |
| $3,000 or more | 14 (1.1%) | 0 (0.0%) |
| Total | 1,296 (100.0%) | 933 (100.0%) |
Physical Housing Characteristics in Sylvester
Housing Structures in Sylvester
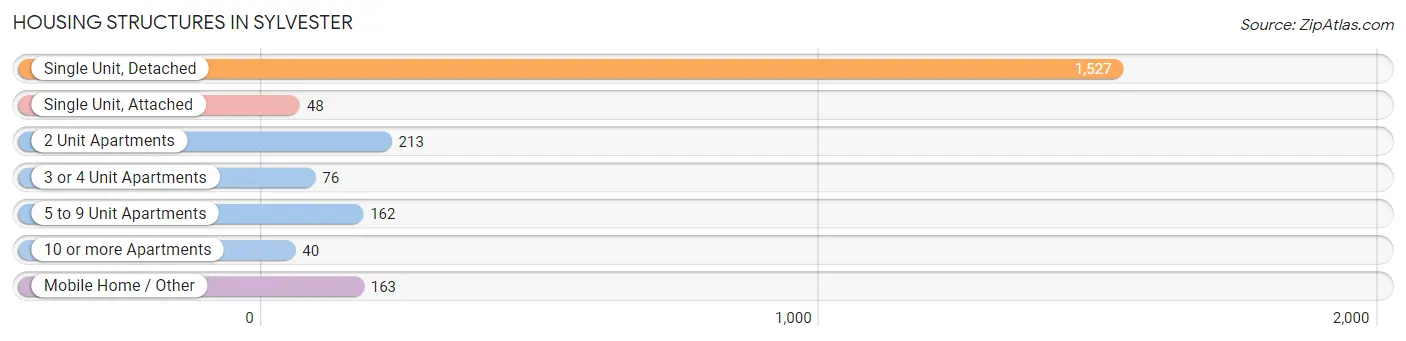
| Structure Type | # Housing Units | % Housing Units |
| Single Unit, Detached | 1,527 | 68.5% |
| Single Unit, Attached | 48 | 2.1% |
| 2 Unit Apartments | 213 | 9.6% |
| 3 or 4 Unit Apartments | 76 | 3.4% |
| 5 to 9 Unit Apartments | 162 | 7.3% |
| 10 or more Apartments | 40 | 1.8% |
| Mobile Home / Other | 163 | 7.3% |
| Total | 2,229 | 100.0% |
Housing Structures by Occupancy in Sylvester
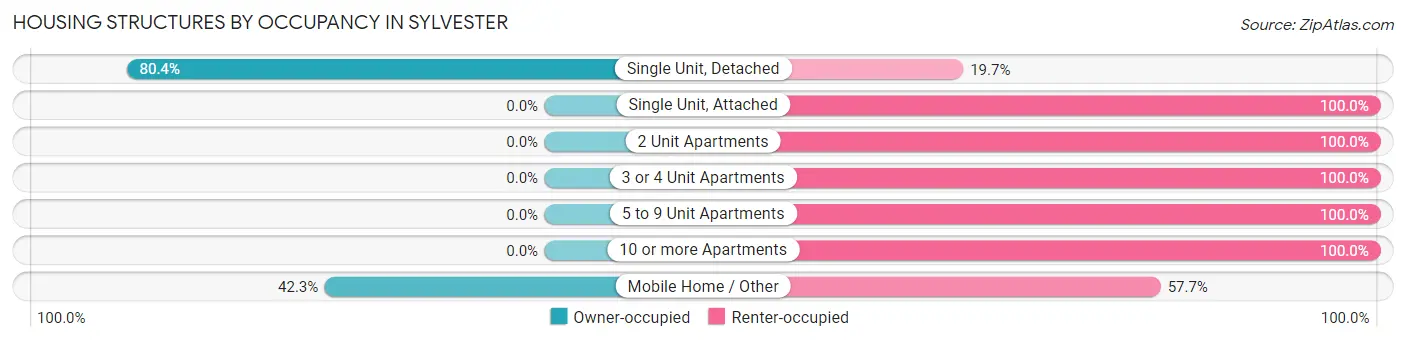
| Structure Type | Owner-occupied | Renter-occupied |
| Single Unit, Detached | 1,227 (80.3%) | 300 (19.7%) |
| Single Unit, Attached | 0 (0.0%) | 48 (100.0%) |
| 2 Unit Apartments | 0 (0.0%) | 213 (100.0%) |
| 3 or 4 Unit Apartments | 0 (0.0%) | 76 (100.0%) |
| 5 to 9 Unit Apartments | 0 (0.0%) | 162 (100.0%) |
| 10 or more Apartments | 0 (0.0%) | 40 (100.0%) |
| Mobile Home / Other | 69 (42.3%) | 94 (57.7%) |
| Total | 1,296 (58.1%) | 933 (41.9%) |
Housing Structures by Number of Rooms in Sylvester
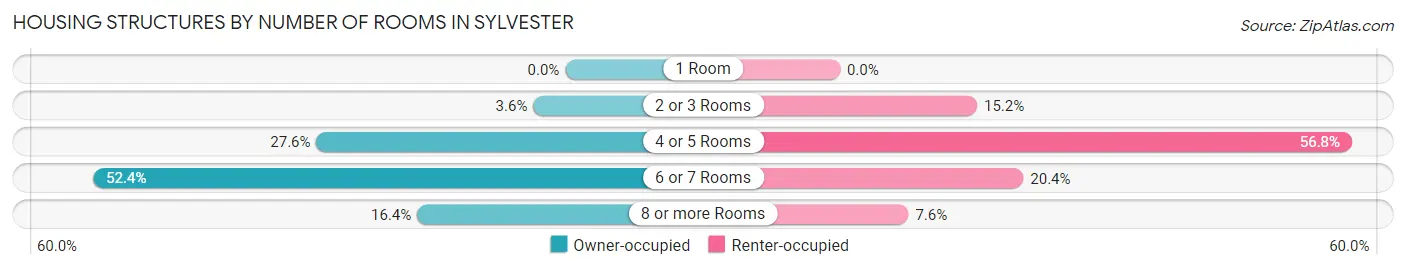
| Number of Rooms | Owner-occupied | Renter-occupied |
| 1 Room | 0 (0.0%) | 0 (0.0%) |
| 2 or 3 Rooms | 46 (3.5%) | 142 (15.2%) |
| 4 or 5 Rooms | 358 (27.6%) | 530 (56.8%) |
| 6 or 7 Rooms | 679 (52.4%) | 190 (20.4%) |
| 8 or more Rooms | 213 (16.4%) | 71 (7.6%) |
| Total | 1,296 (100.0%) | 933 (100.0%) |
Housing Structure by Heating Type in Sylvester
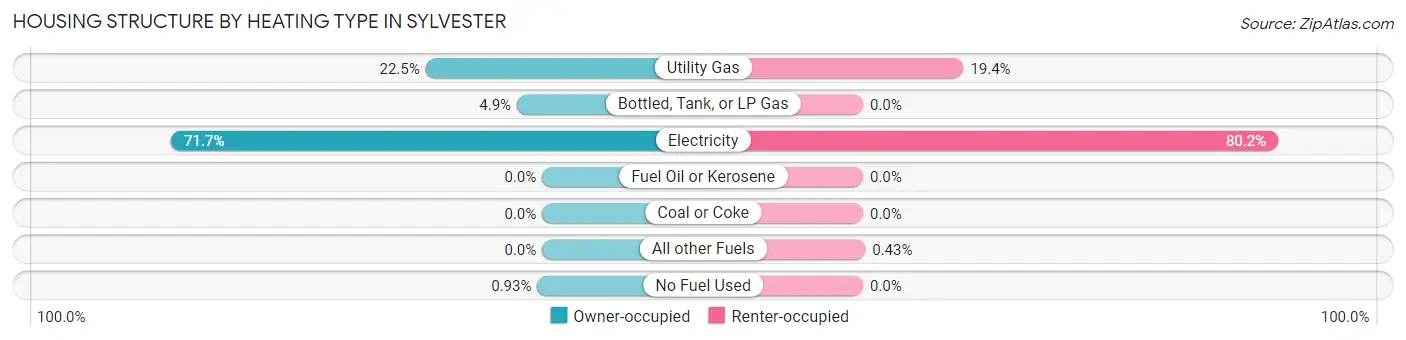
| Heating Type | Owner-occupied | Renter-occupied |
| Utility Gas | 292 (22.5%) | 181 (19.4%) |
| Bottled, Tank, or LP Gas | 63 (4.9%) | 0 (0.0%) |
| Electricity | 929 (71.7%) | 748 (80.2%) |
| Fuel Oil or Kerosene | 0 (0.0%) | 0 (0.0%) |
| Coal or Coke | 0 (0.0%) | 0 (0.0%) |
| All other Fuels | 0 (0.0%) | 4 (0.4%) |
| No Fuel Used | 12 (0.9%) | 0 (0.0%) |
| Total | 1,296 (100.0%) | 933 (100.0%) |
Household Vehicle Usage in Sylvester
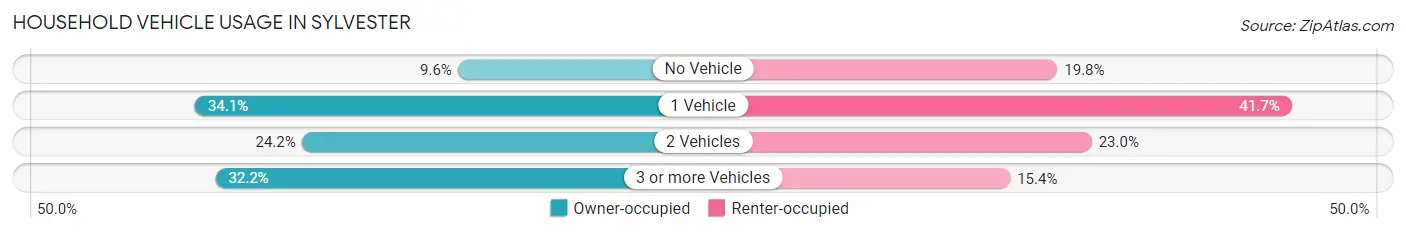
| Vehicles per Household | Owner-occupied | Renter-occupied |
| No Vehicle | 124 (9.6%) | 185 (19.8%) |
| 1 Vehicle | 442 (34.1%) | 389 (41.7%) |
| 2 Vehicles | 313 (24.1%) | 215 (23.0%) |
| 3 or more Vehicles | 417 (32.2%) | 144 (15.4%) |
| Total | 1,296 (100.0%) | 933 (100.0%) |
Real Estate & Mortgages in Sylvester
Real Estate and Mortgage Overview in Sylvester
| Characteristic | Without Mortgage | With Mortgage |
| Housing Units | 722 | 574 |
| Median Property Value | $109,100 | $96,900 |
| Median Household Income | $59,233 | $114 |
| Monthly Housing Costs | $619 | $14 |
| Real Estate Taxes | $1,295 | $27 |
Property Value by Mortgage Status in Sylvester
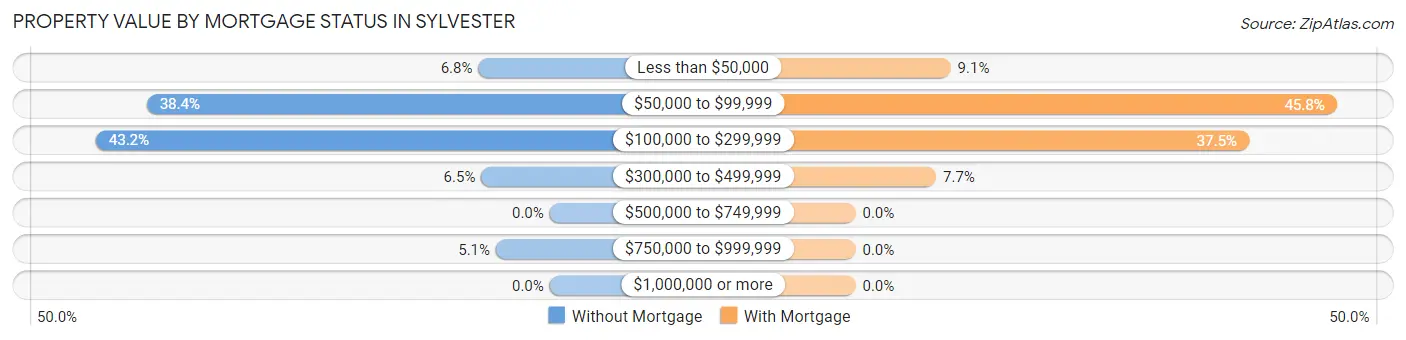
| Property Value | Without Mortgage | With Mortgage |
| Less than $50,000 | 49 (6.8%) | 52 (9.1%) |
| $50,000 to $99,999 | 277 (38.4%) | 263 (45.8%) |
| $100,000 to $299,999 | 312 (43.2%) | 215 (37.5%) |
| $300,000 to $499,999 | 47 (6.5%) | 44 (7.7%) |
| $500,000 to $749,999 | 0 (0.0%) | 0 (0.0%) |
| $750,000 to $999,999 | 37 (5.1%) | 0 (0.0%) |
| $1,000,000 or more | 0 (0.0%) | 0 (0.0%) |
| Total | 722 (100.0%) | 574 (100.0%) |
Household Income by Mortgage Status in Sylvester
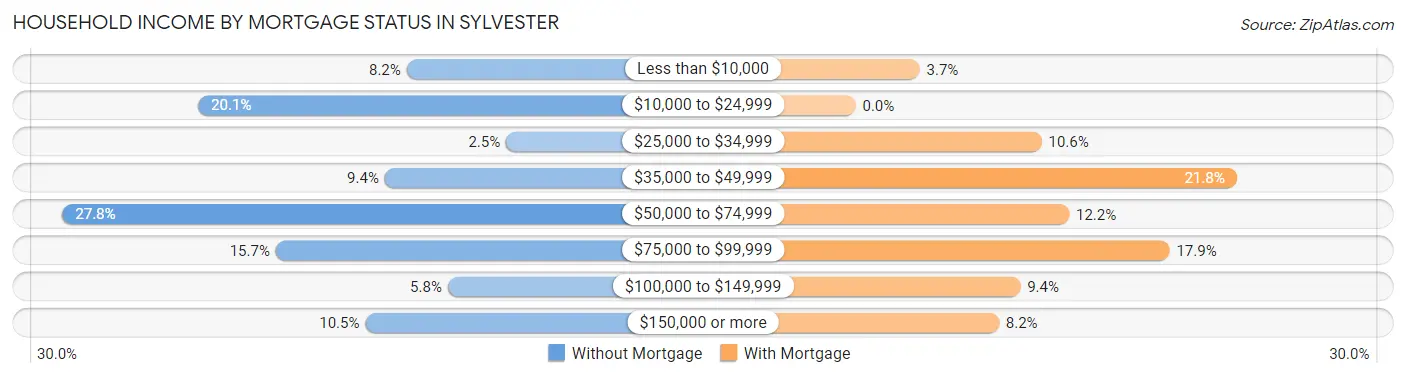
| Household Income | Without Mortgage | With Mortgage |
| Less than $10,000 | 59 (8.2%) | 21 (3.7%) |
| $10,000 to $24,999 | 145 (20.1%) | 0 (0.0%) |
| $25,000 to $34,999 | 18 (2.5%) | 61 (10.6%) |
| $35,000 to $49,999 | 68 (9.4%) | 125 (21.8%) |
| $50,000 to $74,999 | 201 (27.8%) | 70 (12.2%) |
| $75,000 to $99,999 | 113 (15.7%) | 103 (17.9%) |
| $100,000 to $149,999 | 42 (5.8%) | 54 (9.4%) |
| $150,000 or more | 76 (10.5%) | 47 (8.2%) |
| Total | 722 (100.0%) | 574 (100.0%) |
Property Value to Household Income Ratio in Sylvester
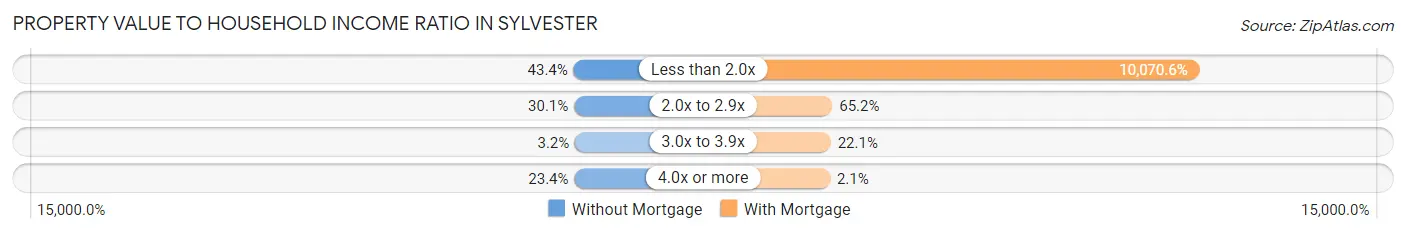
| Value-to-Income Ratio | Without Mortgage | With Mortgage |
| Less than 2.0x | 313 (43.3%) | 57,805 (10,070.6%) |
| 2.0x to 2.9x | 217 (30.1%) | 374 (65.2%) |
| 3.0x to 3.9x | 23 (3.2%) | 127 (22.1%) |
| 4.0x or more | 169 (23.4%) | 12 (2.1%) |
| Total | 722 (100.0%) | 574 (100.0%) |
Real Estate Taxes by Mortgage Status in Sylvester
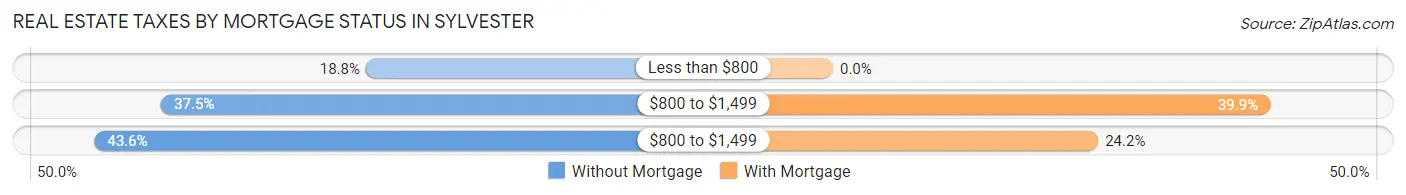
| Property Taxes | Without Mortgage | With Mortgage |
| Less than $800 | 136 (18.8%) | 0 (0.0%) |
| $800 to $1,499 | 271 (37.5%) | 229 (39.9%) |
| $800 to $1,499 | 315 (43.6%) | 139 (24.2%) |
| Total | 722 (100.0%) | 574 (100.0%) |
Health & Disability in Sylvester
Health Insurance Coverage by Age in Sylvester
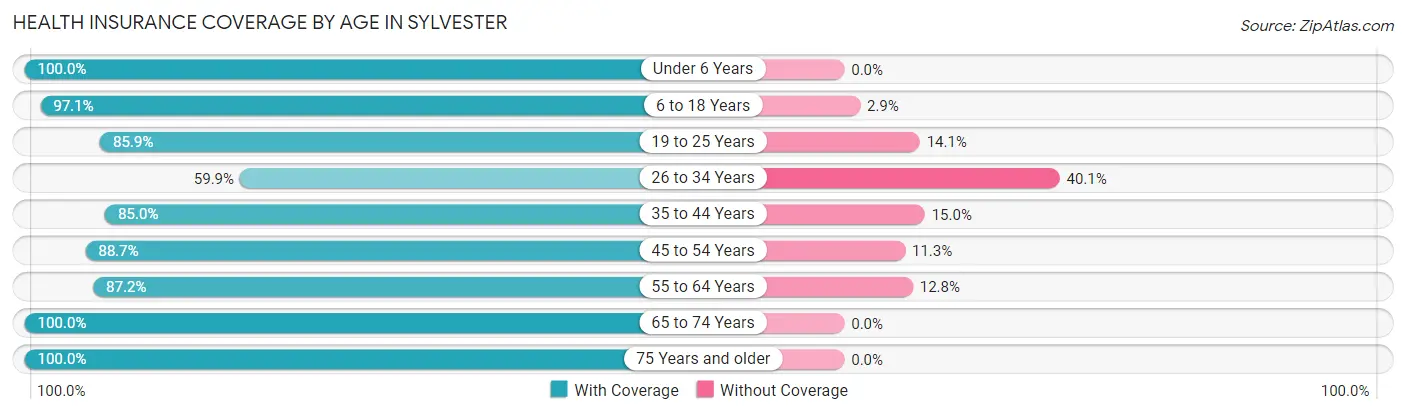
| Age Bracket | With Coverage | Without Coverage |
| Under 6 Years | 506 (100.0%) | 0 (0.0%) |
| 6 to 18 Years | 928 (97.1%) | 28 (2.9%) |
| 19 to 25 Years | 495 (85.9%) | 81 (14.1%) |
| 26 to 34 Years | 334 (59.9%) | 224 (40.1%) |
| 35 to 44 Years | 459 (85.0%) | 81 (15.0%) |
| 45 to 54 Years | 470 (88.7%) | 60 (11.3%) |
| 55 to 64 Years | 662 (87.2%) | 97 (12.8%) |
| 65 to 74 Years | 418 (100.0%) | 0 (0.0%) |
| 75 Years and older | 602 (100.0%) | 0 (0.0%) |
| Total | 4,874 (89.5%) | 571 (10.5%) |
Health Insurance Coverage by Citizenship Status in Sylvester
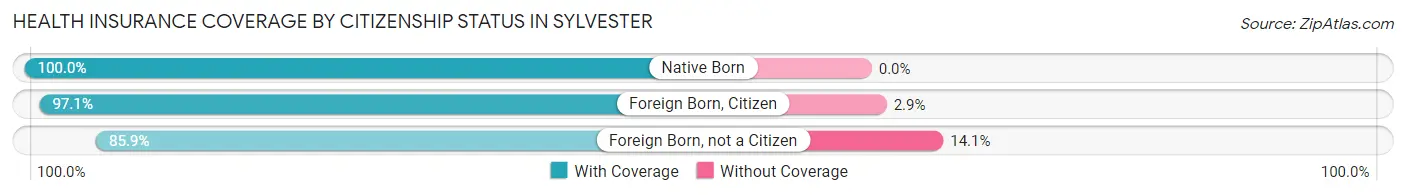
| Citizenship Status | With Coverage | Without Coverage |
| Native Born | 506 (100.0%) | 0 (0.0%) |
| Foreign Born, Citizen | 928 (97.1%) | 28 (2.9%) |
| Foreign Born, not a Citizen | 495 (85.9%) | 81 (14.1%) |
Health Insurance Coverage by Household Income in Sylvester
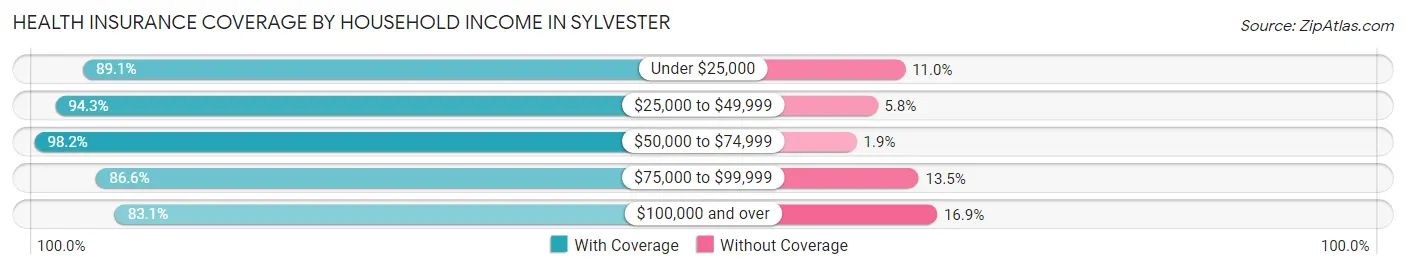
| Household Income | With Coverage | Without Coverage |
| Under $25,000 | 1,325 (89.0%) | 163 (11.0%) |
| $25,000 to $49,999 | 934 (94.3%) | 57 (5.8%) |
| $50,000 to $74,999 | 798 (98.2%) | 15 (1.8%) |
| $75,000 to $99,999 | 753 (86.6%) | 117 (13.5%) |
| $100,000 and over | 1,062 (83.1%) | 216 (16.9%) |
Public vs Private Health Insurance Coverage by Age in Sylvester
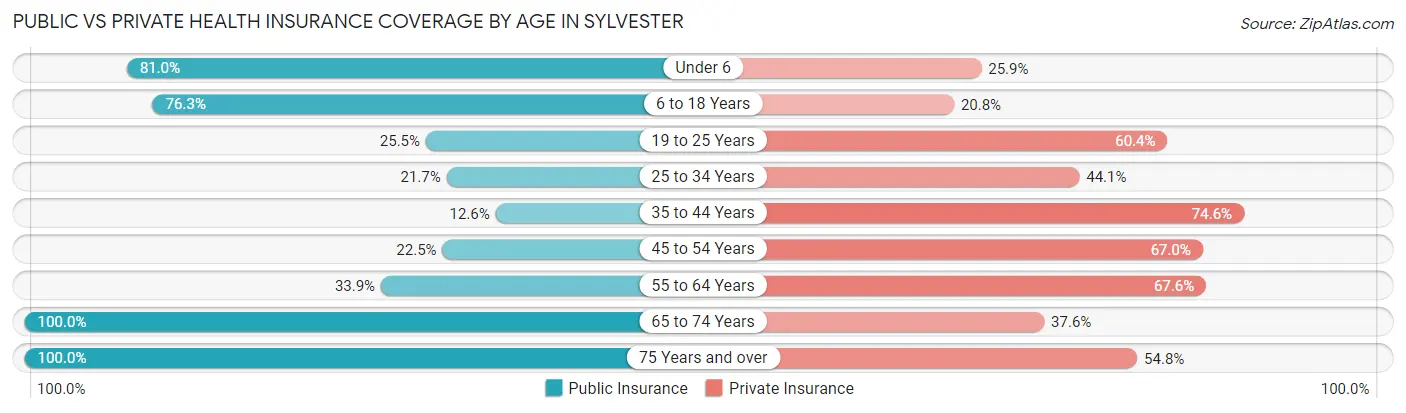
| Age Bracket | Public Insurance | Private Insurance |
| Under 6 | 410 (81.0%) | 131 (25.9%) |
| 6 to 18 Years | 729 (76.3%) | 199 (20.8%) |
| 19 to 25 Years | 147 (25.5%) | 348 (60.4%) |
| 25 to 34 Years | 121 (21.7%) | 246 (44.1%) |
| 35 to 44 Years | 68 (12.6%) | 403 (74.6%) |
| 45 to 54 Years | 119 (22.5%) | 355 (67.0%) |
| 55 to 64 Years | 257 (33.9%) | 513 (67.6%) |
| 65 to 74 Years | 418 (100.0%) | 157 (37.6%) |
| 75 Years and over | 602 (100.0%) | 330 (54.8%) |
| Total | 2,871 (52.7%) | 2,682 (49.3%) |
Disability Status by Sex by Age in Sylvester
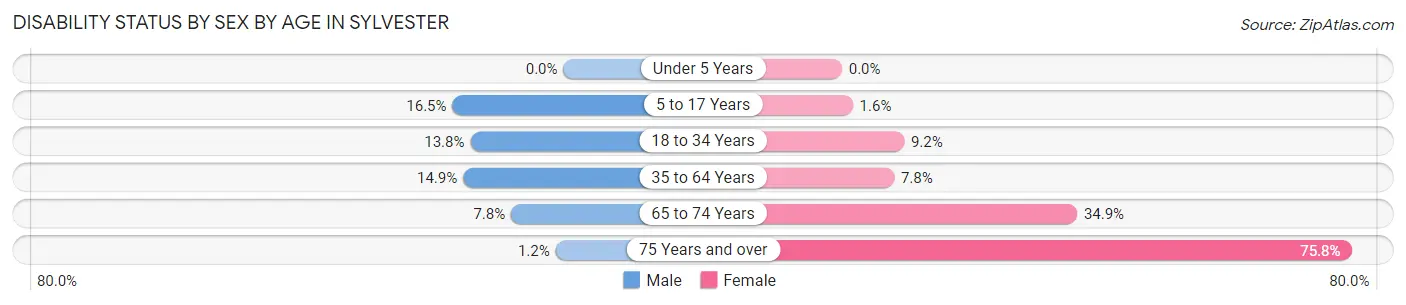
| Age Bracket | Male | Female |
| Under 5 Years | 0 (0.0%) | 0 (0.0%) |
| 5 to 17 Years | 72 (16.5%) | 8 (1.6%) |
| 18 to 34 Years | 55 (13.8%) | 74 (9.2%) |
| 35 to 64 Years | 138 (14.9%) | 70 (7.7%) |
| 65 to 74 Years | 8 (7.8%) | 110 (34.9%) |
| 75 Years and over | 2 (1.2%) | 326 (75.8%) |
Disability Class by Sex by Age in Sylvester
Disability Class: Hearing Difficulty
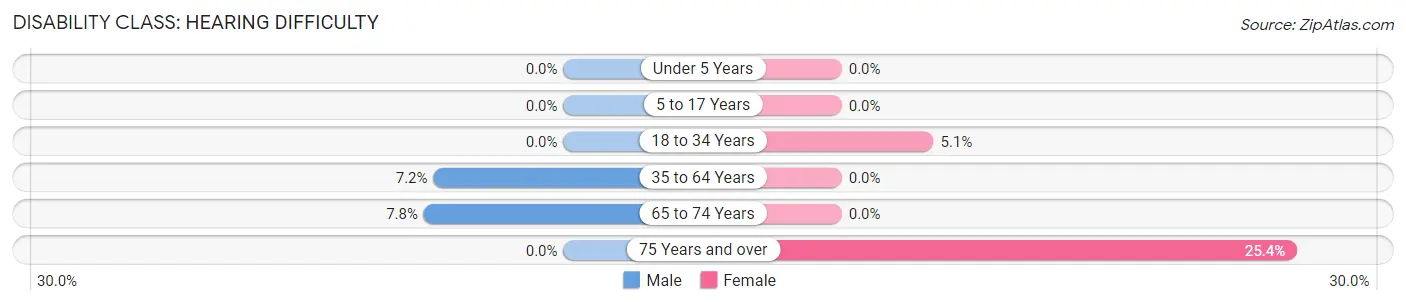
| Age Bracket | Male | Female |
| Under 5 Years | 0 (0.0%) | 0 (0.0%) |
| 5 to 17 Years | 0 (0.0%) | 0 (0.0%) |
| 18 to 34 Years | 0 (0.0%) | 41 (5.1%) |
| 35 to 64 Years | 67 (7.2%) | 0 (0.0%) |
| 65 to 74 Years | 8 (7.8%) | 0 (0.0%) |
| 75 Years and over | 0 (0.0%) | 109 (25.4%) |
Disability Class: Vision Difficulty
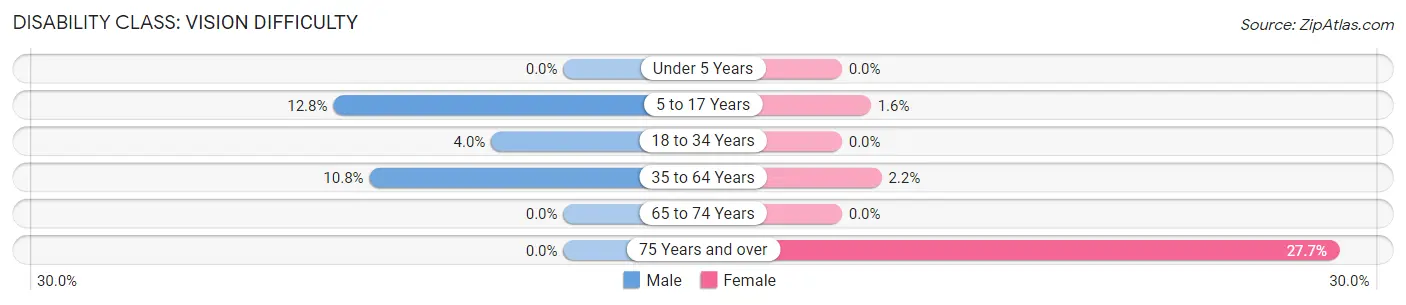
| Age Bracket | Male | Female |
| Under 5 Years | 0 (0.0%) | 0 (0.0%) |
| 5 to 17 Years | 56 (12.8%) | 8 (1.6%) |
| 18 to 34 Years | 16 (4.0%) | 0 (0.0%) |
| 35 to 64 Years | 100 (10.8%) | 20 (2.2%) |
| 65 to 74 Years | 0 (0.0%) | 0 (0.0%) |
| 75 Years and over | 0 (0.0%) | 119 (27.7%) |
Disability Class: Cognitive Difficulty
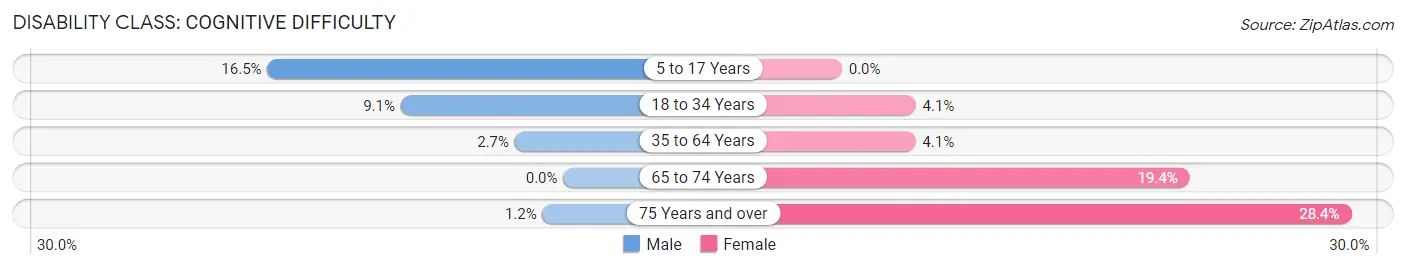
| Age Bracket | Male | Female |
| 5 to 17 Years | 72 (16.5%) | 0 (0.0%) |
| 18 to 34 Years | 36 (9.0%) | 33 (4.1%) |
| 35 to 64 Years | 25 (2.7%) | 37 (4.1%) |
| 65 to 74 Years | 0 (0.0%) | 61 (19.4%) |
| 75 Years and over | 2 (1.2%) | 122 (28.4%) |
Disability Class: Ambulatory Difficulty
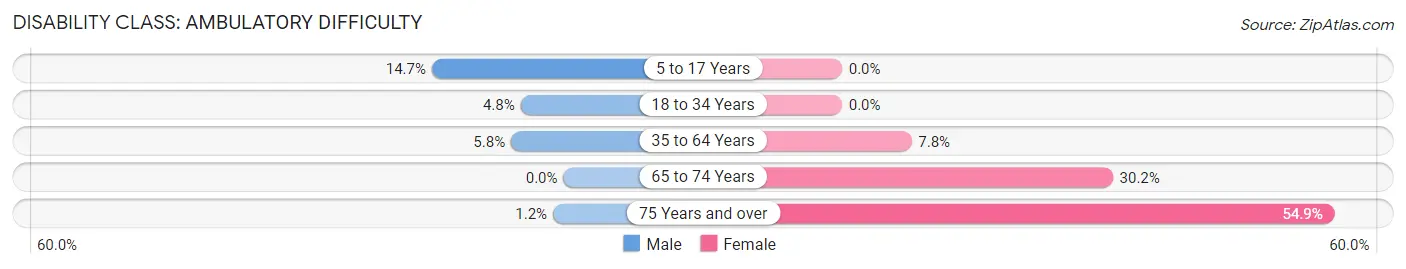
| Age Bracket | Male | Female |
| 5 to 17 Years | 64 (14.6%) | 0 (0.0%) |
| 18 to 34 Years | 19 (4.8%) | 0 (0.0%) |
| 35 to 64 Years | 54 (5.8%) | 70 (7.7%) |
| 65 to 74 Years | 0 (0.0%) | 95 (30.2%) |
| 75 Years and over | 2 (1.2%) | 236 (54.9%) |
Disability Class: Self-Care Difficulty
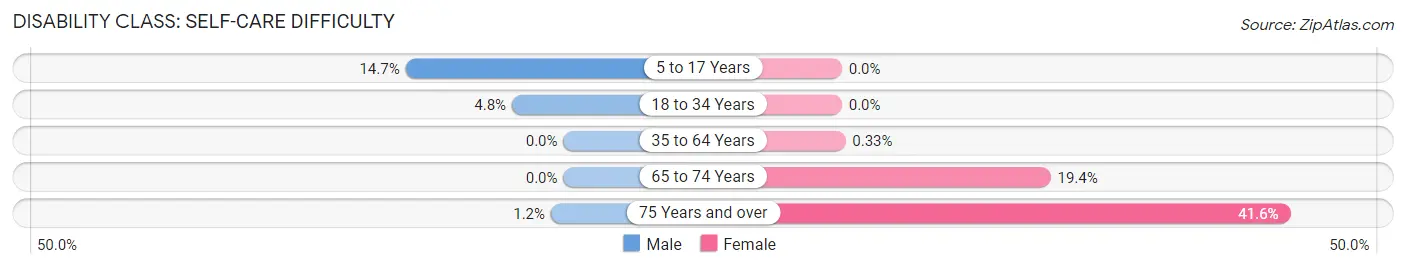
| Age Bracket | Male | Female |
| 5 to 17 Years | 64 (14.6%) | 0 (0.0%) |
| 18 to 34 Years | 19 (4.8%) | 0 (0.0%) |
| 35 to 64 Years | 0 (0.0%) | 3 (0.3%) |
| 65 to 74 Years | 0 (0.0%) | 61 (19.4%) |
| 75 Years and over | 2 (1.2%) | 179 (41.6%) |
Technology Access in Sylvester
Computing Device Access in Sylvester
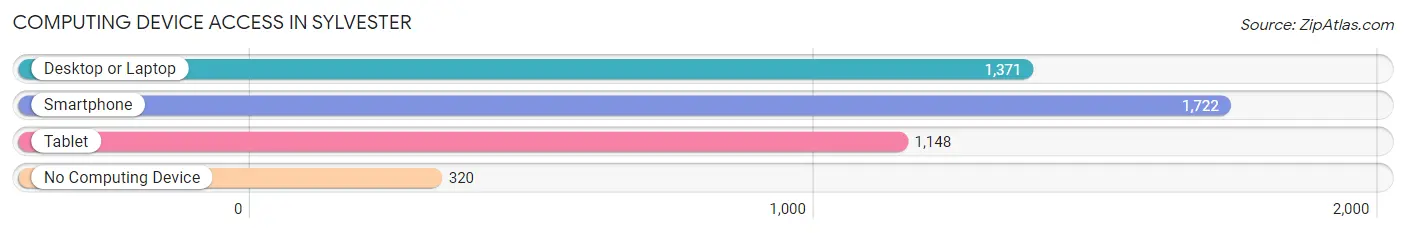
| Device Type | # Households | % Households |
| Desktop or Laptop | 1,371 | 61.5% |
| Smartphone | 1,722 | 77.2% |
| Tablet | 1,148 | 51.5% |
| No Computing Device | 320 | 14.4% |
| Total | 2,229 | 100.0% |
Internet Access in Sylvester
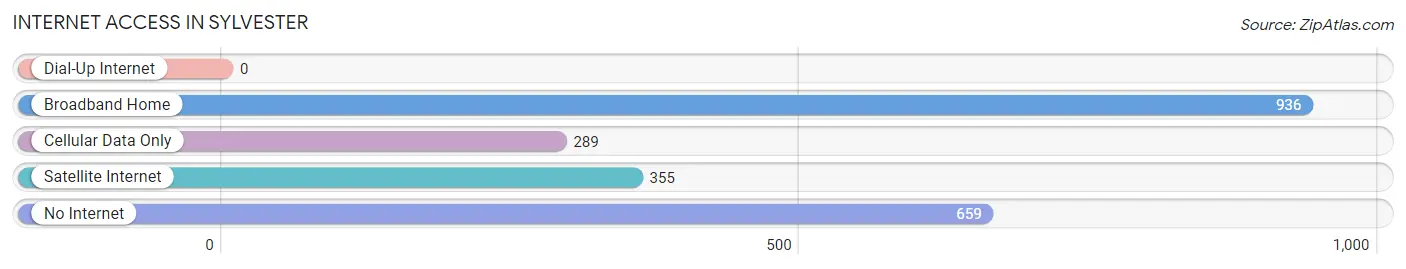
| Internet Type | # Households | % Households |
| Dial-Up Internet | 0 | 0.0% |
| Broadband Home | 936 | 42.0% |
| Cellular Data Only | 289 | 13.0% |
| Satellite Internet | 355 | 15.9% |
| No Internet | 659 | 29.6% |
| Total | 2,229 | 100.0% |
Sylvester Summary
Sylvester, Georgia is a small city located in Worth County, in the southwestern part of the state. It is situated about halfway between Albany and Tifton, and is the county seat of Worth County. The city was named after Sylvester Smith, a local landowner who donated the land for the city. The population of Sylvester was 5,912 at the 2010 census, making it the largest city in Worth County.
History
Sylvester was founded in 1883, when the county seat of Worth County was moved from Sumner to Sylvester. The city was named after Sylvester Smith, a local landowner who donated the land for the city. The city was incorporated in 1885.
In the early 1900s, Sylvester was a thriving agricultural center, with cotton, corn, and peanuts being the main crops. The city was also home to several sawmills and turpentine stills. In the 1920s, the city began to experience a period of growth, with the construction of a new courthouse, a new school, and several new businesses.
Geography
Sylvester is located at 31°30'N 83°51'W (31.50, -83.85). According to the United States Census Bureau, the city has a total area of 5.2 square miles (13.4 km2), all land.
Economy
Sylvester's economy is largely based on agriculture, with cotton, corn, and peanuts being the main crops. The city is also home to several manufacturing companies, including a paper mill, a furniture factory, and a plastics plant. The city is also home to several retail stores, restaurants, and other businesses.
Demographics
As of the 2010 census, there were 5,912 people, 2,093 households, and 1,521 families residing in the city. The population density was 1,139.2 people per square mile (440.2/km2). There were 2,309 housing units at an average density of 447.2 per square mile (172.7/km2). The racial makeup of the city was 57.2% White, 39.3% African American, 0.3% Native American, 0.7% Asian, 0.1% Pacific Islander, 1.2% from other races, and 1.3% from two or more races. Hispanic or Latino of any race were 2.7% of the population.
There were 2,093 households, out of which 33.2% had children under the age of 18 living with them, 44.2% were married couples living together, 20.2% had a female householder with no husband present, and 30.2% were non-families. 25.7% of all households were made up of individuals, and 11.2% had someone living alone who was 65 years of age or older. The average household size was 2.60 and the average family size was 3.09.
In the city, the population was spread out, with 27.2% under the age of 18, 8.7% from 18 to 24, 27.2% from 25 to 44, 22.2% from 45 to 64, and 14.7% who were 65 years of age or older. The median age was 36 years. For every 100 females, there were 86.2 males. For every 100 females age 18 and over, there were 81.2 males.
The median income for a household in the city was $27,917, and the median income for a family was $32,917. Males had a median income of $27,917 versus $20,000 for females. The per capita income for the city was $14,917. About 17.2% of families and 20.2% of the population were below the poverty line, including 28.2% of those under age 18 and 16.2% of those age 65 or over.
Common Questions
What is Per Capita Income in Sylvester?
Per Capita income in Sylvester is $27,319.
What is the Median Family Income in Sylvester?
Median Family Income in Sylvester is $58,460.
What is the Median Household income in Sylvester?
Median Household Income in Sylvester is $48,599.
What is Income or Wage Gap in Sylvester?
Income or Wage Gap in Sylvester is 31.8%.
Women in Sylvester earn 68.2 cents for every dollar earned by a man.
What is Inequality or Gini Index in Sylvester?
Inequality or Gini Index in Sylvester is 0.51.
What is the Total Population of Sylvester?
Total Population of Sylvester is 5,622.
What is the Total Male Population of Sylvester?
Total Male Population of Sylvester is 2,290.
What is the Total Female Population of Sylvester?
Total Female Population of Sylvester is 3,332.
What is the Ratio of Males per 100 Females in Sylvester?
There are 68.73 Males per 100 Females in Sylvester.
What is the Ratio of Females per 100 Males in Sylvester?
There are 145.50 Females per 100 Males in Sylvester.
What is the Median Population Age in Sylvester?
Median Population Age in Sylvester is 38.1 Years.
What is the Average Family Size in Sylvester
Average Family Size in Sylvester is 3.0 People.
What is the Average Household Size in Sylvester
Average Household Size in Sylvester is 2.4 People.
How Large is the Labor Force in Sylvester?
There are 2,579 People in the Labor Forcein in Sylvester.
What is the Percentage of People in the Labor Force in Sylvester?
59.4% of People are in the Labor Force in Sylvester.
What is the Unemployment Rate in Sylvester?
Unemployment Rate in Sylvester is 8.0%.