Brooklet, GA Map & Demographics
Brooklet Map
Brooklet Overview
$32,469
PER CAPITA INCOME
$83,472
AVG FAMILY INCOME
$63,462
AVG HOUSEHOLD INCOME
44.3%
WAGE / INCOME GAP [ % ]
55.7¢/ $1
WAGE / INCOME GAP [ $ ]
0.46
INEQUALITY / GINI INDEX
1,528
TOTAL POPULATION
764
MALE POPULATION
764
FEMALE POPULATION
100.00
MALES / 100 FEMALES
100.00
FEMALES / 100 MALES
45.0
MEDIAN AGE
3.0
AVG FAMILY SIZE
2.3
AVG HOUSEHOLD SIZE
712
LABOR FORCE [ PEOPLE ]
56.8%
PERCENT IN LABOR FORCE
0.3%
UNEMPLOYMENT RATE
Brooklet Zip Codes
Brooklet Area Codes
Income in Brooklet
Income Overview in Brooklet
Per Capita Income in Brooklet is $32,469, while median incomes of families and households are $83,472 and $63,462 respectively.
| Characteristic | Number | Measure |
| Per Capita Income | 1,528 | $32,469 |
| Median Family Income | 409 | $83,472 |
| Mean Family Income | 409 | $97,816 |
| Median Household Income | 674 | $63,462 |
| Mean Household Income | 674 | $73,354 |
| Income Deficit | 409 | $0 |
| Wage / Income Gap (%) | 1,528 | 44.28% |
| Wage / Income Gap ($) | 1,528 | 55.72¢ per $1 |
| Gini / Inequality Index | 1,528 | 0.46 |
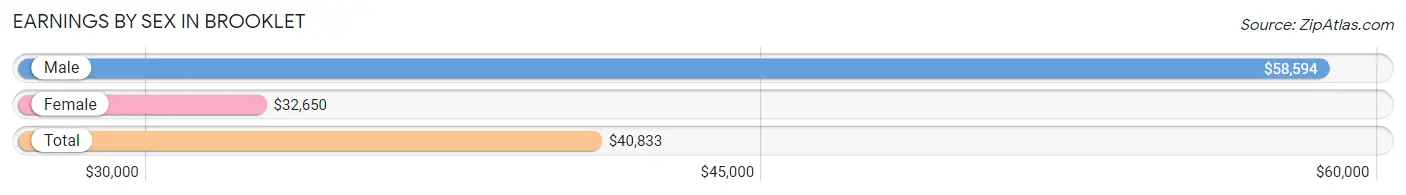
Earnings by Sex in Brooklet
Average Earnings in Brooklet are $40,833, $58,594 for men and $32,650 for women, a difference of 44.3%.
| Sex | Number | Average Earnings |
| Male | 351 (49.2%) | $58,594 |
| Female | 363 (50.8%) | $32,650 |
| Total | 714 (100.0%) | $40,833 |
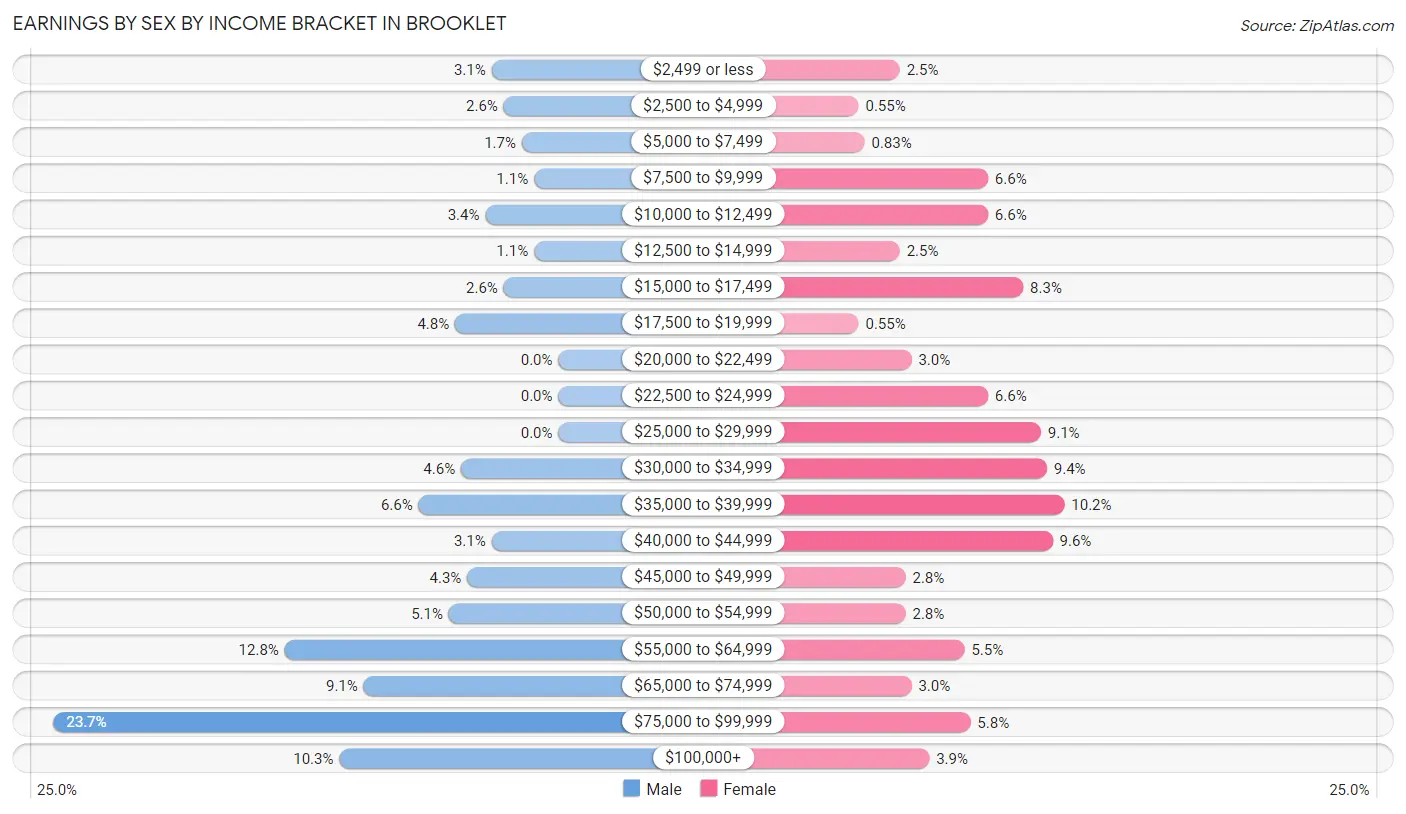
Earnings by Sex by Income Bracket in Brooklet
The most common earnings brackets in Brooklet are $75,000 to $99,999 for men (83 | 23.6%) and $35,000 to $39,999 for women (37 | 10.2%).
| Income | Male | Female |
| $2,499 or less | 11 (3.1%) | 9 (2.5%) |
| $2,500 to $4,999 | 9 (2.6%) | 2 (0.5%) |
| $5,000 to $7,499 | 6 (1.7%) | 3 (0.8%) |
| $7,500 to $9,999 | 4 (1.1%) | 24 (6.6%) |
| $10,000 to $12,499 | 12 (3.4%) | 24 (6.6%) |
| $12,500 to $14,999 | 4 (1.1%) | 9 (2.5%) |
| $15,000 to $17,499 | 9 (2.6%) | 30 (8.3%) |
| $17,500 to $19,999 | 17 (4.8%) | 2 (0.5%) |
| $20,000 to $22,499 | 0 (0.0%) | 11 (3.0%) |
| $22,500 to $24,999 | 0 (0.0%) | 24 (6.6%) |
| $25,000 to $29,999 | 0 (0.0%) | 33 (9.1%) |
| $30,000 to $34,999 | 16 (4.6%) | 34 (9.4%) |
| $35,000 to $39,999 | 23 (6.6%) | 37 (10.2%) |
| $40,000 to $44,999 | 11 (3.1%) | 35 (9.6%) |
| $45,000 to $49,999 | 15 (4.3%) | 10 (2.8%) |
| $50,000 to $54,999 | 18 (5.1%) | 10 (2.8%) |
| $55,000 to $64,999 | 45 (12.8%) | 20 (5.5%) |
| $65,000 to $74,999 | 32 (9.1%) | 11 (3.0%) |
| $75,000 to $99,999 | 83 (23.6%) | 21 (5.8%) |
| $100,000+ | 36 (10.3%) | 14 (3.9%) |
| Total | 351 (100.0%) | 363 (100.0%) |
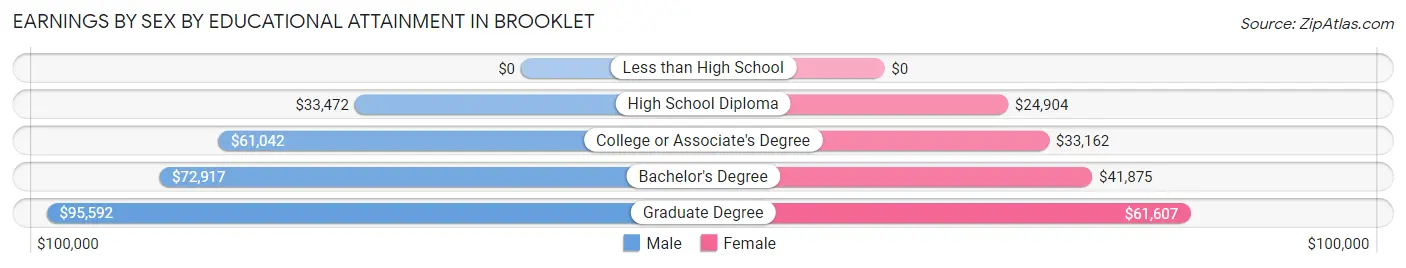
Earnings by Sex by Educational Attainment in Brooklet
Average earnings in Brooklet are $63,958 for men and $34,200 for women, a difference of 46.5%. Men with an educational attainment of graduate degree enjoy the highest average annual earnings of $95,592, while those with high school diploma education earn the least with $33,472. Women with an educational attainment of graduate degree earn the most with the average annual earnings of $61,607, while those with high school diploma education have the smallest earnings of $24,904.
| Educational Attainment | Male Income | Female Income |
| Less than High School | - | - |
| High School Diploma | $33,472 | $24,904 |
| College or Associate's Degree | $61,042 | $33,162 |
| Bachelor's Degree | $72,917 | $41,875 |
| Graduate Degree | $95,592 | $61,607 |
| Total | $63,958 | $34,200 |
Family Income in Brooklet
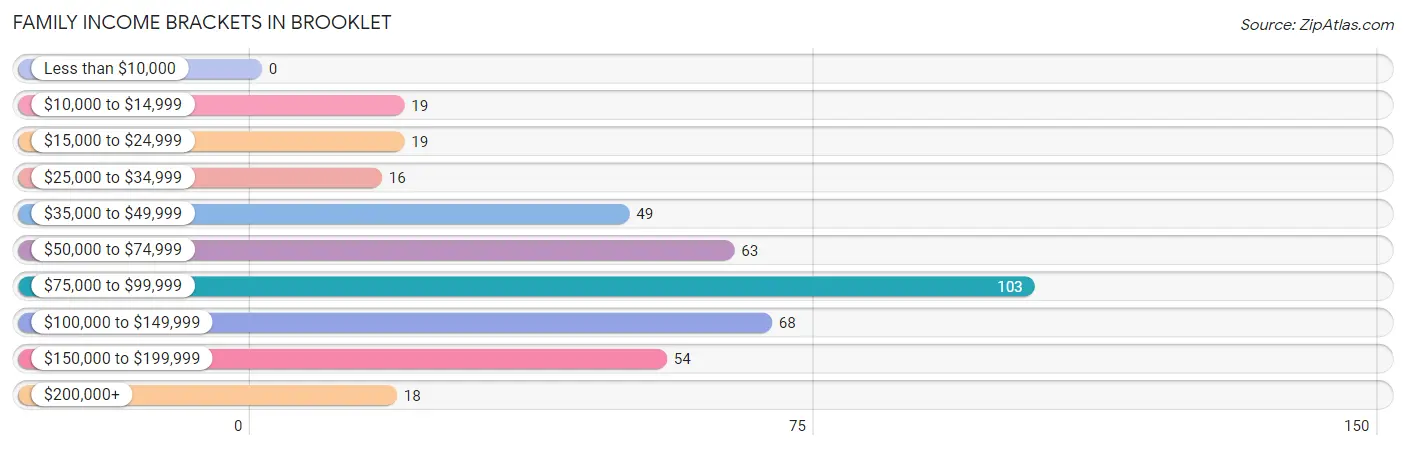
Family Income Brackets in Brooklet
According to the Brooklet family income data, there are 103 families falling into the $75,000 to $99,999 income range, which is the most common income bracket and makes up 25.2% of all families.
| Income Bracket | # Families | % Families |
| Less than $10,000 | 0 | 0.0% |
| $10,000 to $14,999 | 19 | 4.6% |
| $15,000 to $24,999 | 19 | 4.6% |
| $25,000 to $34,999 | 16 | 3.9% |
| $35,000 to $49,999 | 49 | 12.0% |
| $50,000 to $74,999 | 63 | 15.4% |
| $75,000 to $99,999 | 103 | 25.2% |
| $100,000 to $149,999 | 68 | 16.6% |
| $150,000 to $199,999 | 54 | 13.2% |
| $200,000+ | 18 | 4.4% |
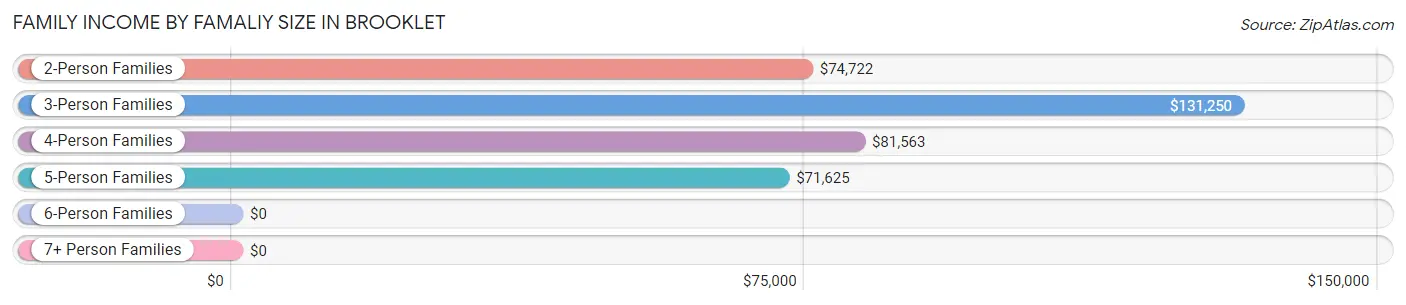
Family Income by Famaliy Size in Brooklet
3-person families (105 | 25.7%) account for the highest median family income in Brooklet with $131,250 per family, while 3-person families (105 | 25.7%) have the highest median income of $43,750 per family member.
| Income Bracket | # Families | Median Income |
| 2-Person Families | 186 (45.5%) | $74,722 |
| 3-Person Families | 105 (25.7%) | $131,250 |
| 4-Person Families | 74 (18.1%) | $81,563 |
| 5-Person Families | 33 (8.1%) | $71,625 |
| 6-Person Families | 7 (1.7%) | $0 |
| 7+ Person Families | 4 (1.0%) | $0 |
| Total | 409 (100.0%) | $83,472 |
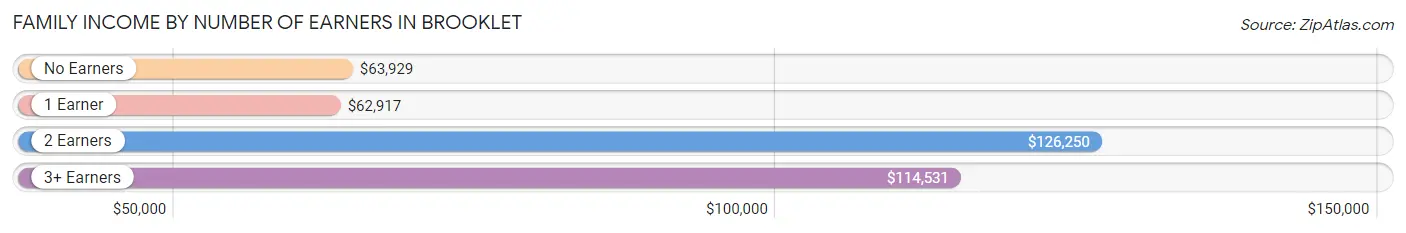
Family Income by Number of Earners in Brooklet
The median family income in Brooklet is $83,472, with families comprising 2 earners (140) having the highest median family income of $126,250, while families with 1 earner (158) have the lowest median family income of $62,917, accounting for 34.2% and 38.6% of families, respectively.
| Number of Earners | # Families | Median Income |
| No Earners | 54 (13.2%) | $63,929 |
| 1 Earner | 158 (38.6%) | $62,917 |
| 2 Earners | 140 (34.2%) | $126,250 |
| 3+ Earners | 57 (13.9%) | $114,531 |
| Total | 409 (100.0%) | $83,472 |
Household Income in Brooklet
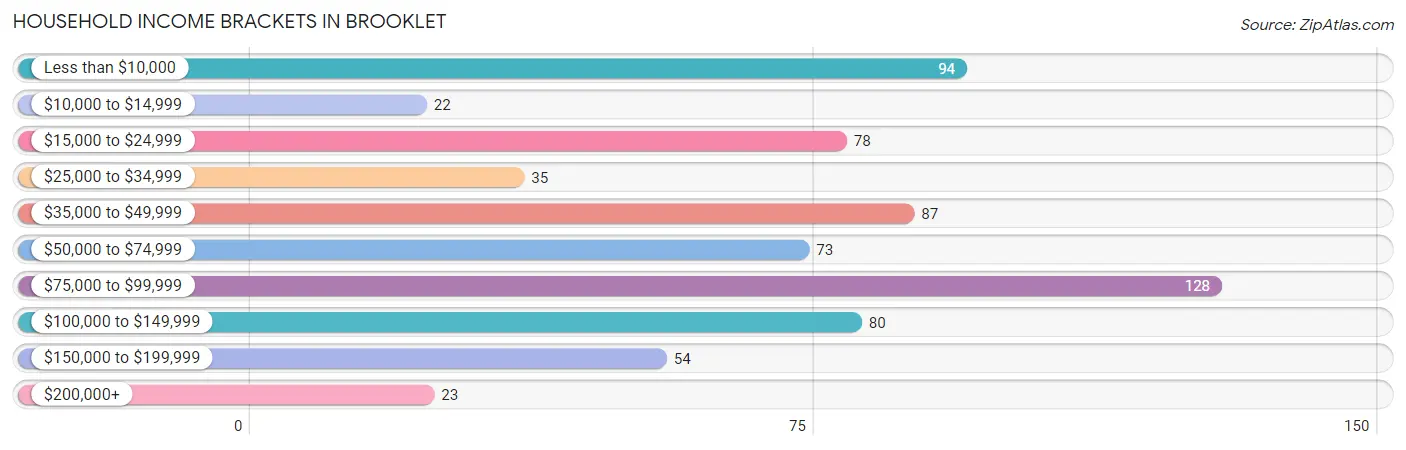
Household Income Brackets in Brooklet
With 128 households falling in the category, the $75,000 to $99,999 income range is the most frequent in Brooklet, accounting for 19.0% of all households. In contrast, only 22 households (3.3%) fall into the $10,000 to $14,999 income bracket, making it the least populous group.
| Income Bracket | # Households | % Households |
| Less than $10,000 | 94 | 13.9% |
| $10,000 to $14,999 | 22 | 3.3% |
| $15,000 to $24,999 | 78 | 11.6% |
| $25,000 to $34,999 | 35 | 5.2% |
| $35,000 to $49,999 | 87 | 12.9% |
| $50,000 to $74,999 | 73 | 10.8% |
| $75,000 to $99,999 | 128 | 19.0% |
| $100,000 to $149,999 | 80 | 11.9% |
| $150,000 to $199,999 | 54 | 8.0% |
| $200,000+ | 23 | 3.4% |
Household Income by Householder Age in Brooklet
The median household income in Brooklet is $63,462, with the highest median household income of $93,571 found in the 45 to 64 years age bracket for the primary householder. A total of 194 households (28.8%) fall into this category. Meanwhile, the 15 to 24 years age bracket for the primary householder has the lowest median household income of $0, with 5 households (0.7%) in this group.
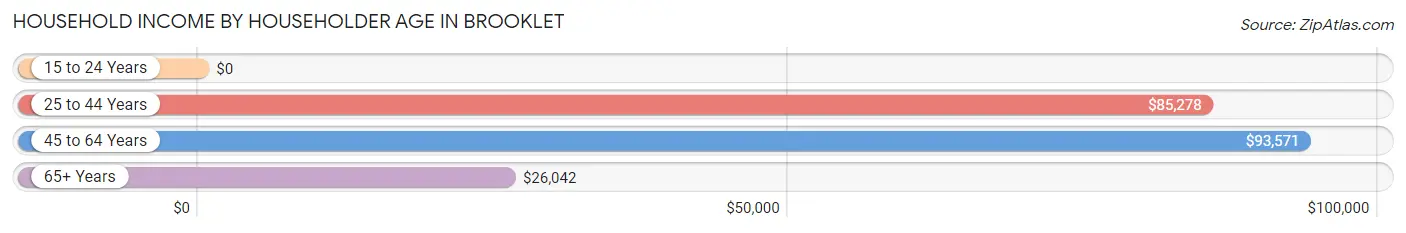
| Income Bracket | # Households | Median Income |
| 15 to 24 Years | 5 (0.7%) | $0 |
| 25 to 44 Years | 158 (23.4%) | $85,278 |
| 45 to 64 Years | 194 (28.8%) | $93,571 |
| 65+ Years | 317 (47.0%) | $26,042 |
| Total | 674 (100.0%) | $63,462 |
Poverty in Brooklet
Income Below Poverty by Sex and Age in Brooklet
With 21.9% poverty level for males and 6.7% for females among the residents of Brooklet, 16 and 17 year old males and 5 year old females are the most vulnerable to poverty, with 20 males (66.7%) and 2 females (25.0%) in their respective age groups living below the poverty level.
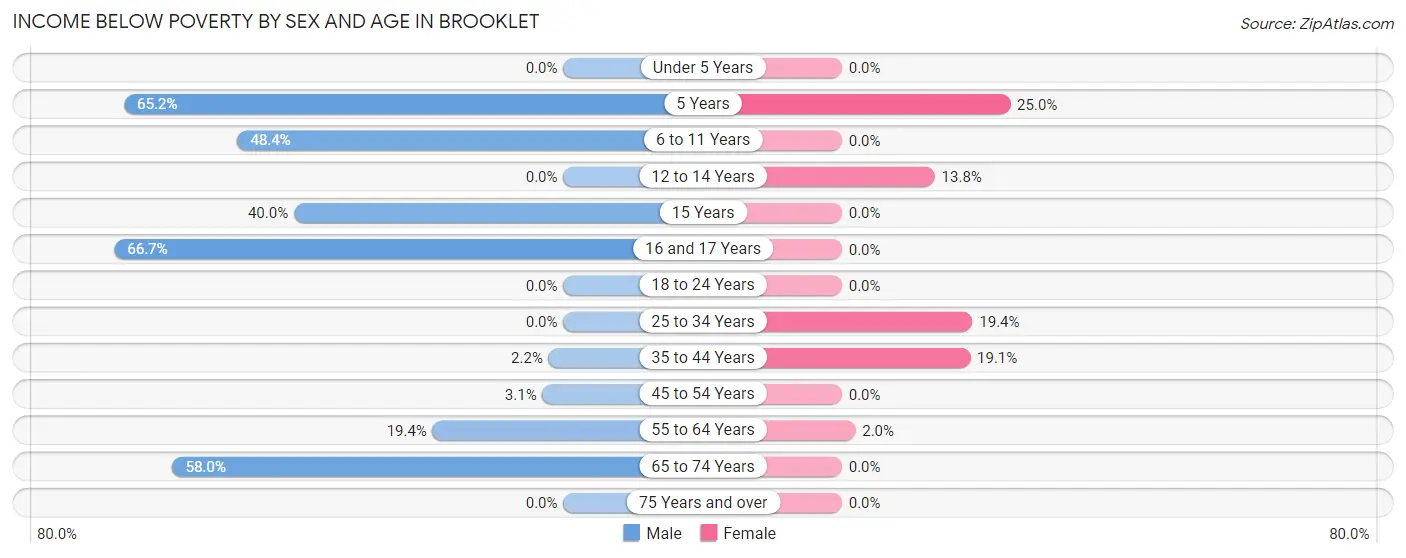
| Age Bracket | Male | Female |
| Under 5 Years | 0 (0.0%) | 0 (0.0%) |
| 5 Years | 15 (65.2%) | 2 (25.0%) |
| 6 to 11 Years | 15 (48.4%) | 0 (0.0%) |
| 12 to 14 Years | 0 (0.0%) | 4 (13.8%) |
| 15 Years | 4 (40.0%) | 0 (0.0%) |
| 16 and 17 Years | 20 (66.7%) | 0 (0.0%) |
| 18 to 24 Years | 0 (0.0%) | 0 (0.0%) |
| 25 to 34 Years | 0 (0.0%) | 19 (19.4%) |
| 35 to 44 Years | 2 (2.2%) | 24 (19.1%) |
| 45 to 54 Years | 4 (3.1%) | 0 (0.0%) |
| 55 to 64 Years | 13 (19.4%) | 2 (2.0%) |
| 65 to 74 Years | 94 (58.0%) | 0 (0.0%) |
| 75 Years and over | 0 (0.0%) | 0 (0.0%) |
| Total | 167 (21.9%) | 51 (6.7%) |
Income Above Poverty by Sex and Age in Brooklet
According to the poverty statistics in Brooklet, males aged under 5 years and females aged under 5 years are the age groups that are most secure financially, with 100.0% of males and 100.0% of females in these age groups living above the poverty line.
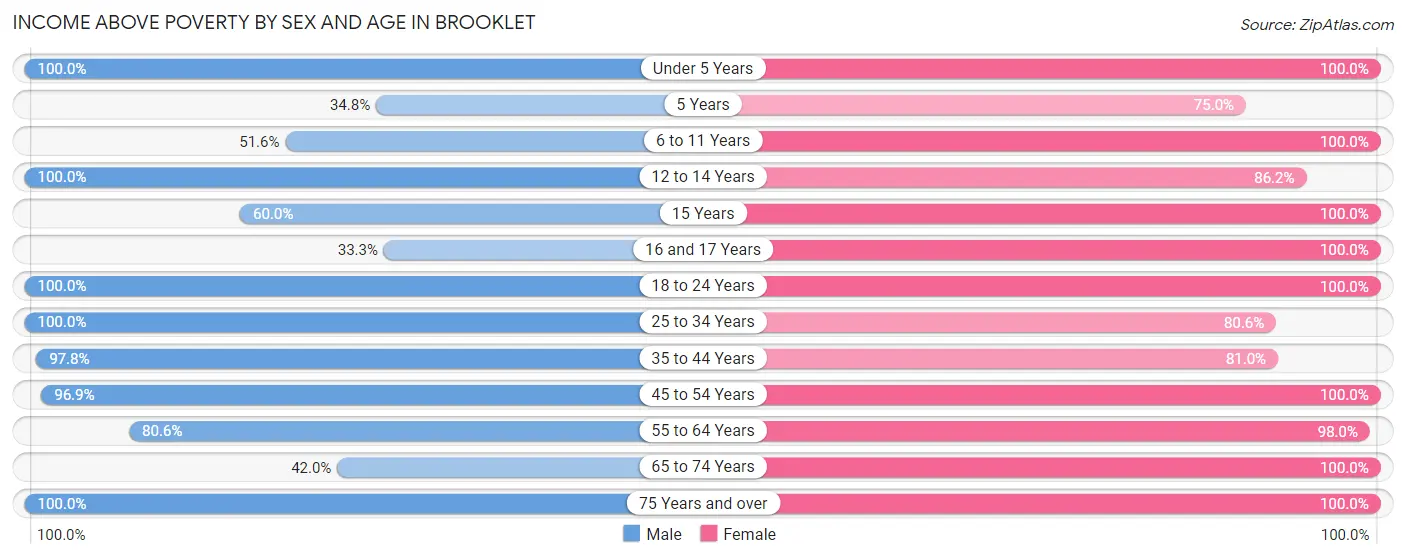
| Age Bracket | Male | Female |
| Under 5 Years | 26 (100.0%) | 42 (100.0%) |
| 5 Years | 8 (34.8%) | 6 (75.0%) |
| 6 to 11 Years | 16 (51.6%) | 43 (100.0%) |
| 12 to 14 Years | 52 (100.0%) | 25 (86.2%) |
| 15 Years | 6 (60.0%) | 10 (100.0%) |
| 16 and 17 Years | 10 (33.3%) | 12 (100.0%) |
| 18 to 24 Years | 36 (100.0%) | 37 (100.0%) |
| 25 to 34 Years | 59 (100.0%) | 79 (80.6%) |
| 35 to 44 Years | 90 (97.8%) | 102 (80.9%) |
| 45 to 54 Years | 125 (96.9%) | 80 (100.0%) |
| 55 to 64 Years | 54 (80.6%) | 98 (98.0%) |
| 65 to 74 Years | 68 (42.0%) | 87 (100.0%) |
| 75 Years and over | 47 (100.0%) | 92 (100.0%) |
| Total | 597 (78.1%) | 713 (93.3%) |
Income Below Poverty Among Married-Couple Families in Brooklet
The poverty statistics for married-couple families in Brooklet show that 0.6% or 2 of the total 313 families live below the poverty line. Families with 3 or 4 children have the highest poverty rate of 5.3%, comprising of 2 families. On the other hand, families with no children have the lowest poverty rate of 0.0%, which includes 0 families.
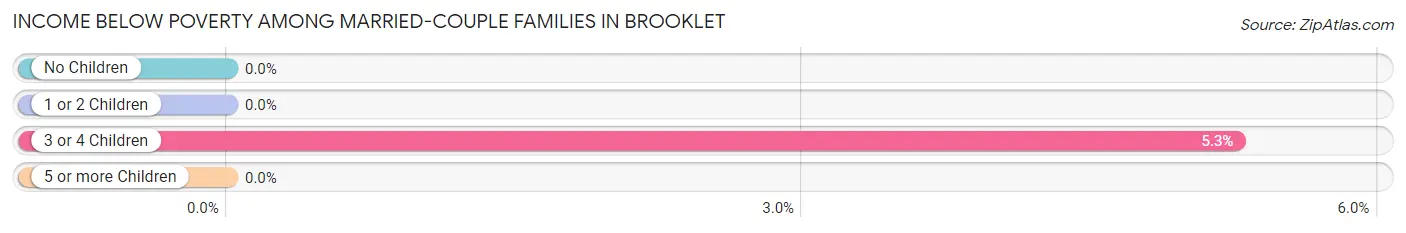
| Children | Above Poverty | Below Poverty |
| No Children | 169 (100.0%) | 0 (0.0%) |
| 1 or 2 Children | 105 (100.0%) | 0 (0.0%) |
| 3 or 4 Children | 36 (94.7%) | 2 (5.3%) |
| 5 or more Children | 1 (100.0%) | 0 (0.0%) |
| Total | 311 (99.4%) | 2 (0.6%) |
Income Below Poverty Among Single-Parent Households in Brooklet
According to the poverty data in Brooklet, 61.1% or 11 single-father households and 30.8% or 24 single-mother households are living below the poverty line. Among single-father households, those with no children have the highest poverty rate, with 11 households (78.6%) experiencing poverty. Likewise, among single-mother households, those with 3 or 4 children have the highest poverty rate, with 19 households (100.0%) falling below the poverty line.
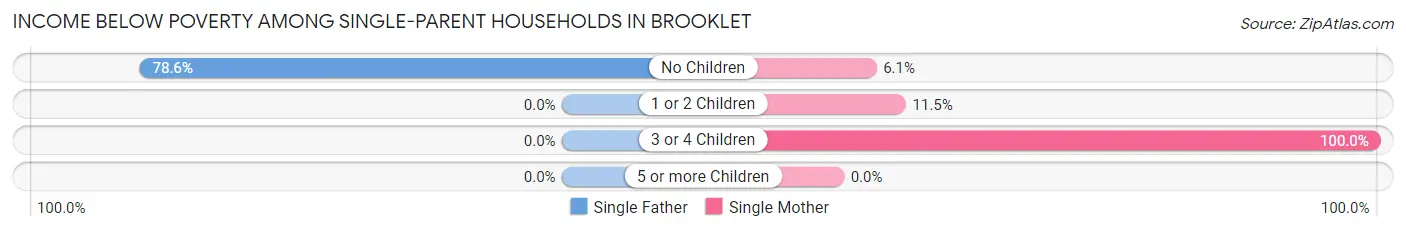
| Children | Single Father | Single Mother |
| No Children | 11 (78.6%) | 2 (6.1%) |
| 1 or 2 Children | 0 (0.0%) | 3 (11.5%) |
| 3 or 4 Children | 0 (0.0%) | 19 (100.0%) |
| 5 or more Children | 0 (0.0%) | 0 (0.0%) |
| Total | 11 (61.1%) | 24 (30.8%) |
Income Below Poverty Among Married-Couple vs Single-Parent Households in Brooklet
The poverty data for Brooklet shows that 2 of the married-couple family households (0.6%) and 35 of the single-parent households (36.5%) are living below the poverty level. Within the married-couple family households, those with 3 or 4 children have the highest poverty rate, with 2 households (5.3%) falling below the poverty line. Among the single-parent households, those with 3 or 4 children have the highest poverty rate, with 19 household (100.0%) living below poverty.
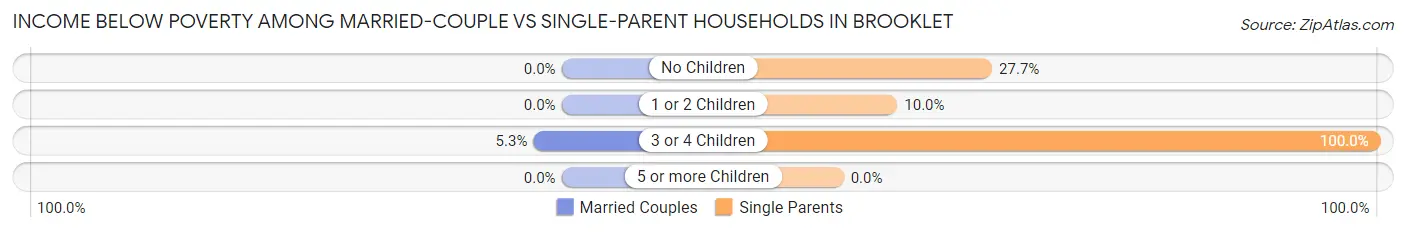
| Children | Married-Couple Families | Single-Parent Households |
| No Children | 0 (0.0%) | 13 (27.7%) |
| 1 or 2 Children | 0 (0.0%) | 3 (10.0%) |
| 3 or 4 Children | 2 (5.3%) | 19 (100.0%) |
| 5 or more Children | 0 (0.0%) | 0 (0.0%) |
| Total | 2 (0.6%) | 35 (36.5%) |
Race in Brooklet
The most populous races in Brooklet are White / Caucasian (1,237 | 81.0%), Black / African American (151 | 9.9%), and Two or more Races (132 | 8.6%).
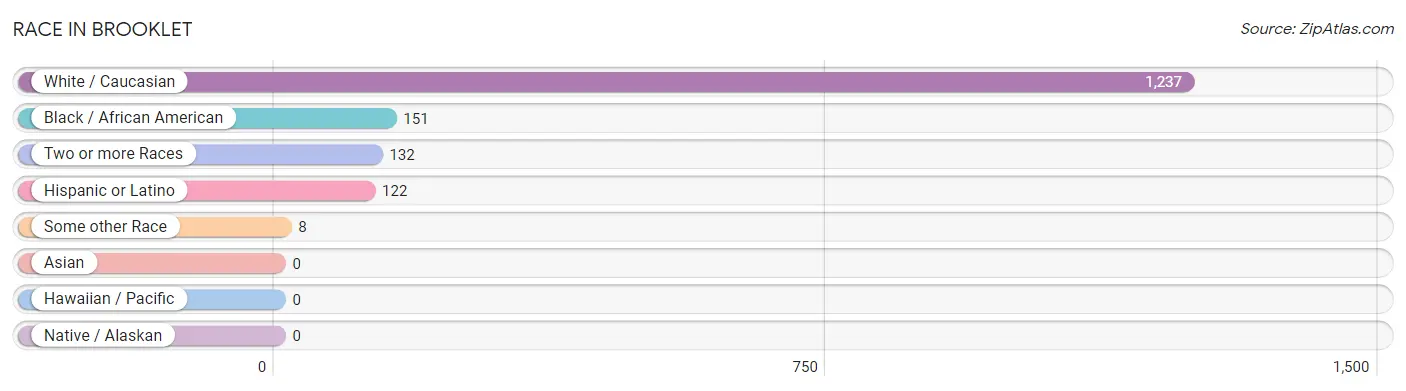
| Race | # Population | % Population |
| Asian | 0 | 0.0% |
| Black / African American | 151 | 9.9% |
| Hawaiian / Pacific | 0 | 0.0% |
| Hispanic or Latino | 122 | 8.0% |
| Native / Alaskan | 0 | 0.0% |
| White / Caucasian | 1,237 | 81.0% |
| Two or more Races | 132 | 8.6% |
| Some other Race | 8 | 0.5% |
| Total | 1,528 | 100.0% |
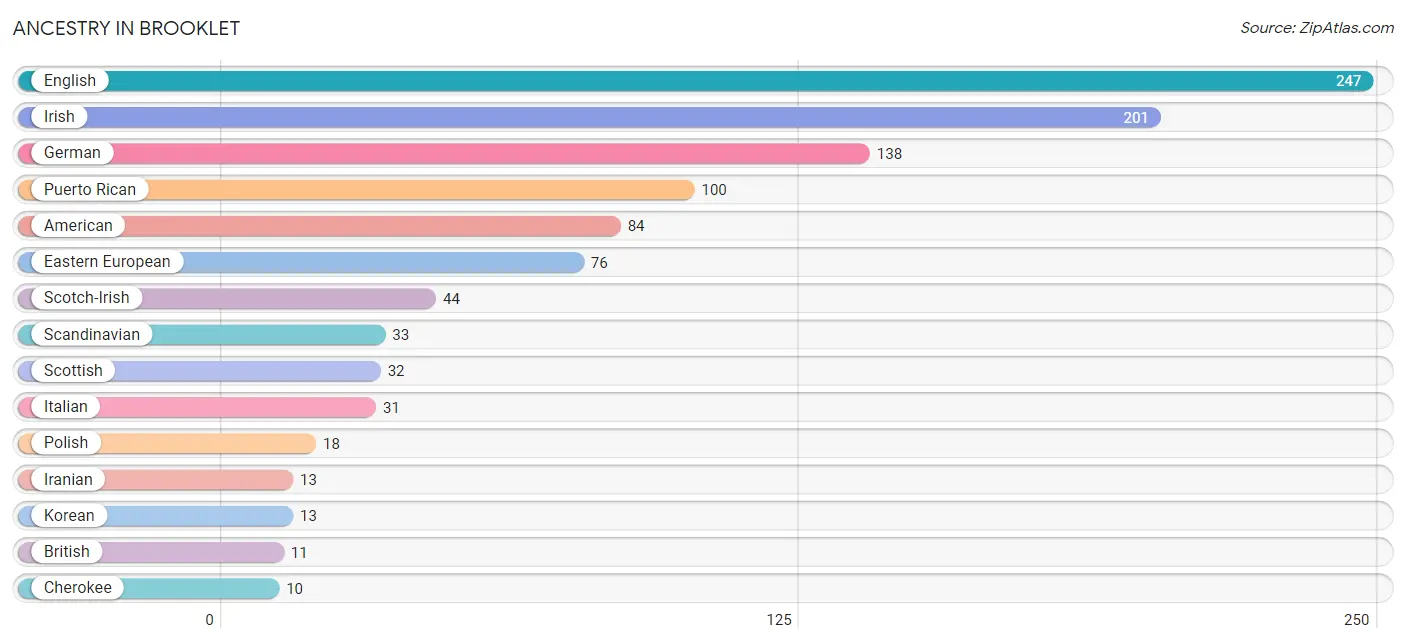
Ancestry in Brooklet
The most populous ancestries reported in Brooklet are English (247 | 16.2%), Irish (201 | 13.2%), German (138 | 9.0%), Puerto Rican (100 | 6.5%), and American (84 | 5.5%), together accounting for 50.4% of all Brooklet residents.
| Ancestry | # Population | % Population |
| African | 4 | 0.3% |
| American | 84 | 5.5% |
| British | 11 | 0.7% |
| Cherokee | 10 | 0.6% |
| Eastern European | 76 | 5.0% |
| English | 247 | 16.2% |
| European | 9 | 0.6% |
| French | 10 | 0.6% |
| French Canadian | 2 | 0.1% |
| German | 138 | 9.0% |
| Greek | 4 | 0.3% |
| Iranian | 13 | 0.9% |
| Irish | 201 | 13.2% |
| Italian | 31 | 2.0% |
| Korean | 13 | 0.9% |
| Mexican | 9 | 0.6% |
| Native Hawaiian | 3 | 0.2% |
| Norwegian | 4 | 0.3% |
| Polish | 18 | 1.2% |
| Puerto Rican | 100 | 6.5% |
| Scandinavian | 33 | 2.2% |
| Scotch-Irish | 44 | 2.9% |
| Scottish | 32 | 2.1% |
| Subsaharan African | 4 | 0.3% | View All 24 Rows |
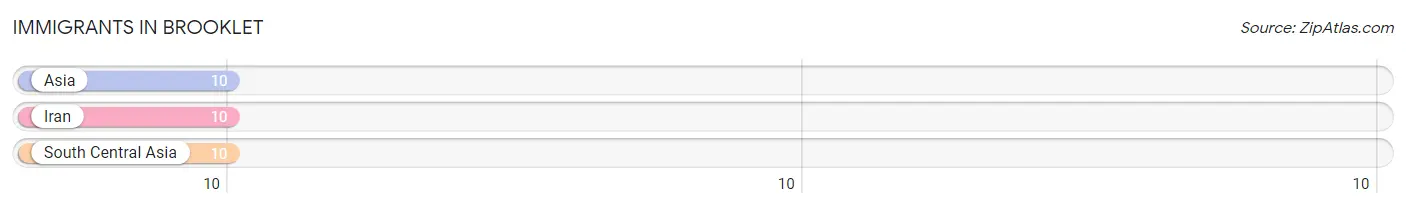
Immigrants in Brooklet
The most numerous immigrant groups reported in Brooklet came from Asia (10 | 0.6%), Iran (10 | 0.6%), and South Central Asia (10 | 0.6%), together accounting for 1.9% of all Brooklet residents.
| Immigration Origin | # Population | % Population |
| Asia | 10 | 0.6% |
| Iran | 10 | 0.6% |
| South Central Asia | 10 | 0.6% | View All 3 Rows |
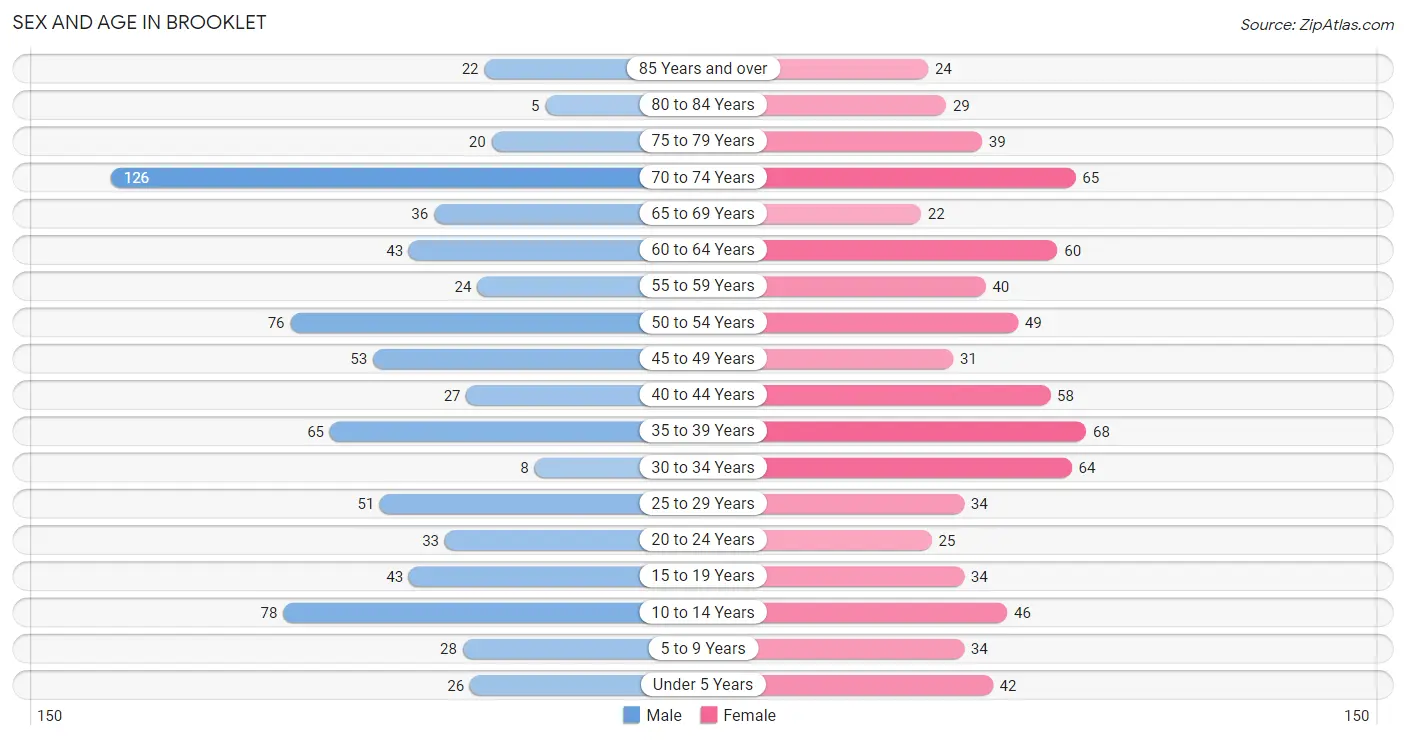
Sex and Age in Brooklet
Sex and Age in Brooklet
The most populous age groups in Brooklet are 70 to 74 Years (126 | 16.5%) for men and 35 to 39 Years (68 | 8.9%) for women.
| Age Bracket | Male | Female |
| Under 5 Years | 26 (3.4%) | 42 (5.5%) |
| 5 to 9 Years | 28 (3.7%) | 34 (4.4%) |
| 10 to 14 Years | 78 (10.2%) | 46 (6.0%) |
| 15 to 19 Years | 43 (5.6%) | 34 (4.4%) |
| 20 to 24 Years | 33 (4.3%) | 25 (3.3%) |
| 25 to 29 Years | 51 (6.7%) | 34 (4.4%) |
| 30 to 34 Years | 8 (1.1%) | 64 (8.4%) |
| 35 to 39 Years | 65 (8.5%) | 68 (8.9%) |
| 40 to 44 Years | 27 (3.5%) | 58 (7.6%) |
| 45 to 49 Years | 53 (6.9%) | 31 (4.1%) |
| 50 to 54 Years | 76 (10.0%) | 49 (6.4%) |
| 55 to 59 Years | 24 (3.1%) | 40 (5.2%) |
| 60 to 64 Years | 43 (5.6%) | 60 (7.9%) |
| 65 to 69 Years | 36 (4.7%) | 22 (2.9%) |
| 70 to 74 Years | 126 (16.5%) | 65 (8.5%) |
| 75 to 79 Years | 20 (2.6%) | 39 (5.1%) |
| 80 to 84 Years | 5 (0.6%) | 29 (3.8%) |
| 85 Years and over | 22 (2.9%) | 24 (3.1%) |
| Total | 764 (100.0%) | 764 (100.0%) |
Families and Households in Brooklet
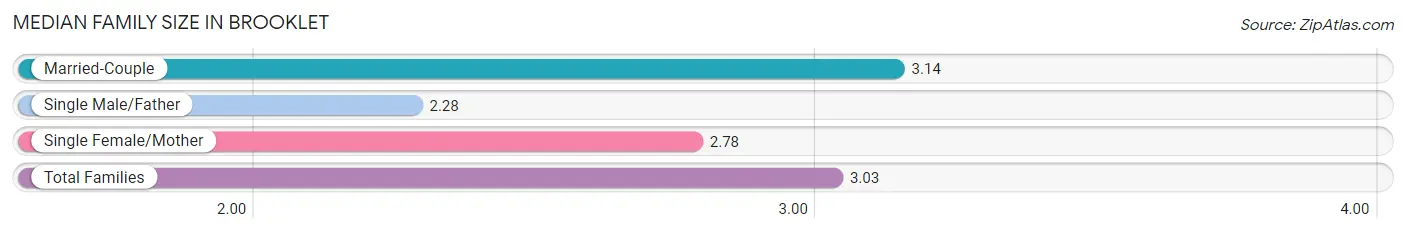
Median Family Size in Brooklet
The median family size in Brooklet is 3.03 persons per family, with married-couple families (313 | 76.5%) accounting for the largest median family size of 3.14 persons per family. On the other hand, single male/father families (18 | 4.4%) represent the smallest median family size with 2.28 persons per family.
| Family Type | # Families | Family Size |
| Married-Couple | 313 (76.5%) | 3.14 |
| Single Male/Father | 18 (4.4%) | 2.28 |
| Single Female/Mother | 78 (19.1%) | 2.78 |
| Total Families | 409 (100.0%) | 3.03 |
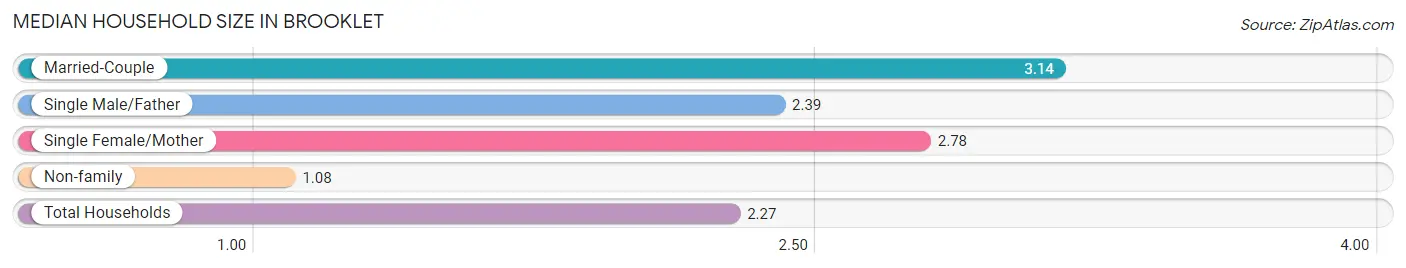
Median Household Size in Brooklet
The median household size in Brooklet is 2.27 persons per household, with married-couple households (313 | 46.4%) accounting for the largest median household size of 3.14 persons per household. non-family households (265 | 39.3%) represent the smallest median household size with 1.08 persons per household.
| Household Type | # Households | Household Size |
| Married-Couple | 313 (46.4%) | 3.14 |
| Single Male/Father | 18 (2.7%) | 2.39 |
| Single Female/Mother | 78 (11.6%) | 2.78 |
| Non-family | 265 (39.3%) | 1.08 |
| Total Households | 674 (100.0%) | 2.27 |
Household Size by Marriage Status in Brooklet
Out of a total of 674 households in Brooklet, 409 (60.7%) are family households, while 265 (39.3%) are nonfamily households. The most numerous type of family households are 2-person households, comprising 182, and the most common type of nonfamily households are 1-person households, comprising 254.
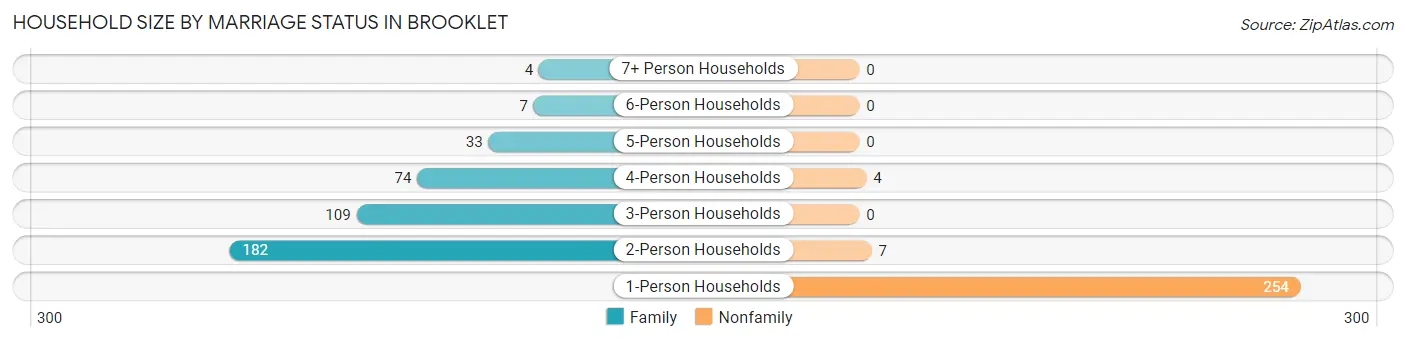
| Household Size | Family Households | Nonfamily Households |
| 1-Person Households | - | 254 (37.7%) |
| 2-Person Households | 182 (27.0%) | 7 (1.0%) |
| 3-Person Households | 109 (16.2%) | 0 (0.0%) |
| 4-Person Households | 74 (11.0%) | 4 (0.6%) |
| 5-Person Households | 33 (4.9%) | 0 (0.0%) |
| 6-Person Households | 7 (1.0%) | 0 (0.0%) |
| 7+ Person Households | 4 (0.6%) | 0 (0.0%) |
| Total | 409 (60.7%) | 265 (39.3%) |
Female Fertility in Brooklet
Fertility by Age in Brooklet
Average fertility rate in Brooklet is 40.0 births per 1,000 women. Women in the age bracket of 20 to 34 years have the highest fertility rate with 81.0 births per 1,000 women. Women in the age bracket of 20 to 34 years acount for 76.9% of all women with births.
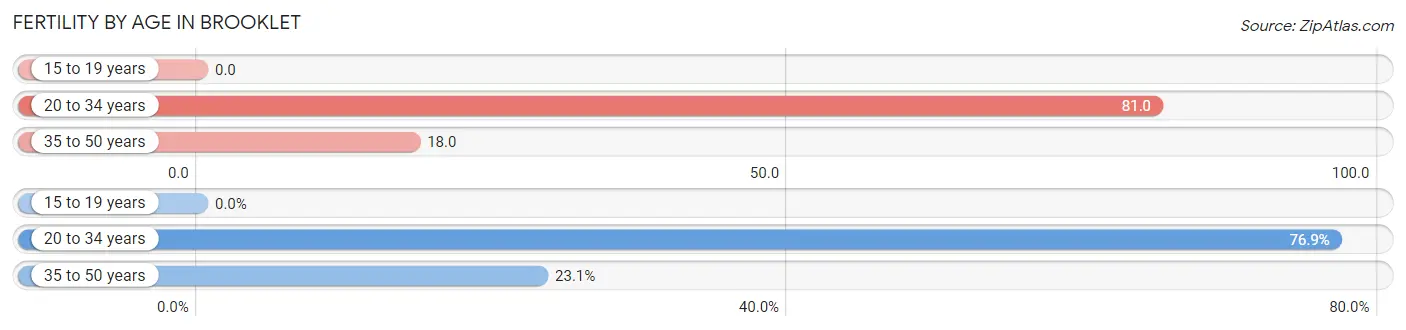
| Age Bracket | Women with Births | Births / 1,000 Women |
| 15 to 19 years | 0 (0.0%) | 0.0 |
| 20 to 34 years | 10 (76.9%) | 81.0 |
| 35 to 50 years | 3 (23.1%) | 18.0 |
| Total | 13 (100.0%) | 40.0 |
Fertility by Age by Marriage Status in Brooklet
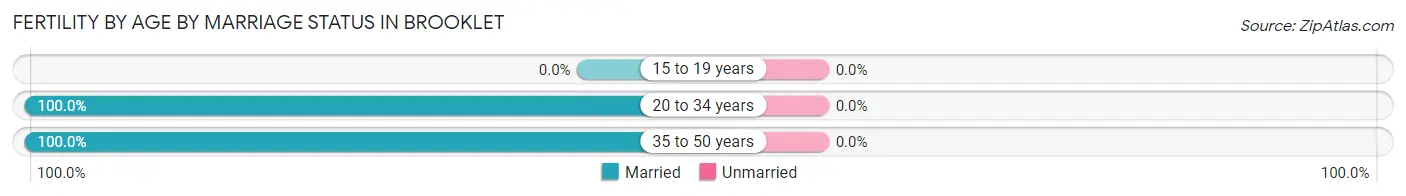
| Age Bracket | Married | Unmarried |
| 15 to 19 years | 0 (0.0%) | 0 (0.0%) |
| 20 to 34 years | 10 (100.0%) | 0 (0.0%) |
| 35 to 50 years | 3 (100.0%) | 0 (0.0%) |
| Total | 13 (100.0%) | 0 (0.0%) |
Fertility by Education in Brooklet
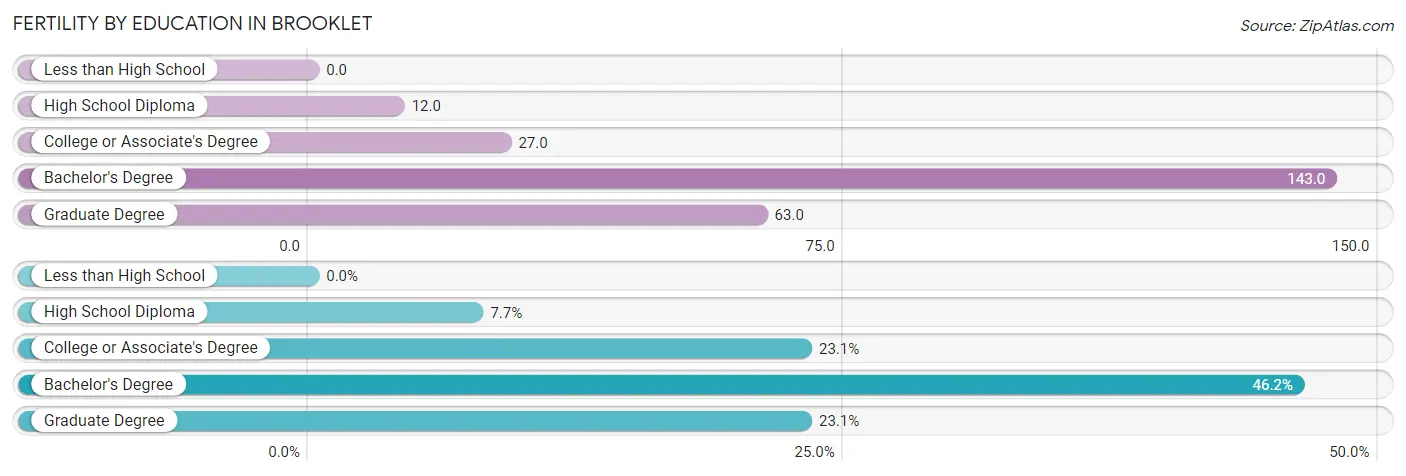
| Educational Attainment | Women with Births | Births / 1,000 Women |
| Less than High School | 0 (0.0%) | 0.0 |
| High School Diploma | 1 (7.7%) | 12.0 |
| College or Associate's Degree | 3 (23.1%) | 27.0 |
| Bachelor's Degree | 6 (46.2%) | 143.0 |
| Graduate Degree | 3 (23.1%) | 63.0 |
| Total | 13 (100.0%) | 40.0 |
Fertility by Education by Marriage Status in Brooklet
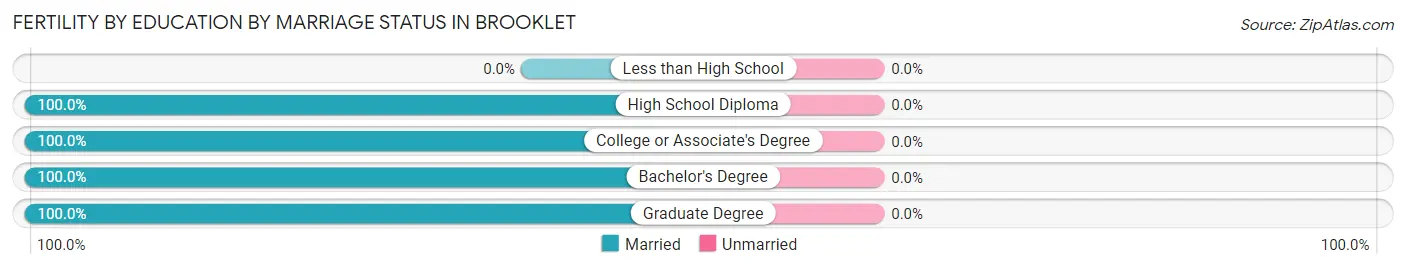
| Educational Attainment | Married | Unmarried |
| Less than High School | 0 (0.0%) | 0 (0.0%) |
| High School Diploma | 1 (100.0%) | 0 (0.0%) |
| College or Associate's Degree | 3 (100.0%) | 0 (0.0%) |
| Bachelor's Degree | 6 (100.0%) | 0 (0.0%) |
| Graduate Degree | 3 (100.0%) | 0 (0.0%) |
| Total | 13 (100.0%) | 0 (0.0%) |
Employment Characteristics in Brooklet
Employment by Class of Employer in Brooklet
Among the 682 employed individuals in Brooklet, private company employees (361 | 52.9%), state government employees (106 | 15.5%), and local government employees (105 | 15.4%) make up the most common classes of employment.
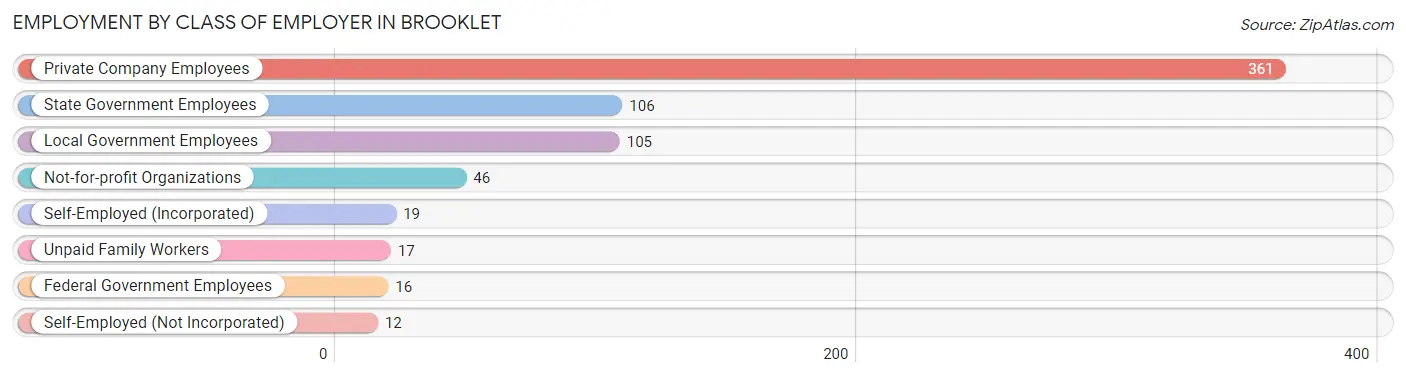
| Employer Class | # Employees | % Employees |
| Private Company Employees | 361 | 52.9% |
| Self-Employed (Incorporated) | 19 | 2.8% |
| Self-Employed (Not Incorporated) | 12 | 1.8% |
| Not-for-profit Organizations | 46 | 6.7% |
| Local Government Employees | 105 | 15.4% |
| State Government Employees | 106 | 15.5% |
| Federal Government Employees | 16 | 2.4% |
| Unpaid Family Workers | 17 | 2.5% |
| Total | 682 | 100.0% |
Employment Status by Age in Brooklet
According to the labor force statistics for Brooklet, out of the total population over 16 years of age (1,254), 56.8% or 712 individuals are in the labor force, with 0.3% or 2 of them unemployed. The age group with the highest labor force participation rate is 20 to 24 years, with 94.8% or 55 individuals in the labor force. Within the labor force, the 30 to 34 years age range has the highest percentage of unemployed individuals, with 3.7% or 2 of them being unemployed.
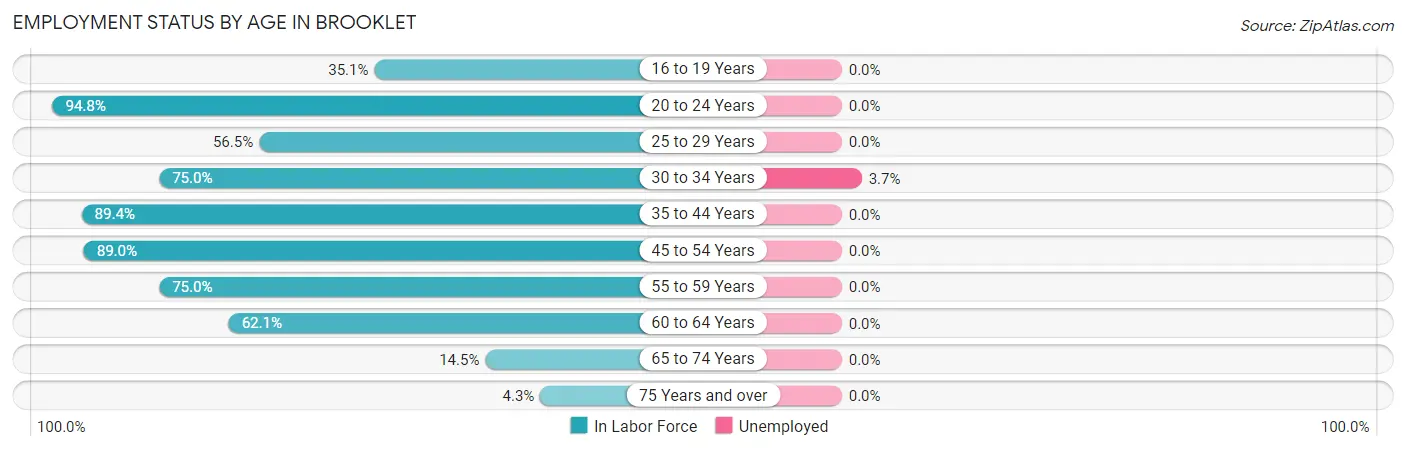
| Age Bracket | In Labor Force | Unemployed |
| 16 to 19 Years | 20 (35.1%) | 0 (0.0%) |
| 20 to 24 Years | 55 (94.8%) | 0 (0.0%) |
| 25 to 29 Years | 48 (56.5%) | 0 (0.0%) |
| 30 to 34 Years | 54 (75.0%) | 2 (3.7%) |
| 35 to 44 Years | 195 (89.4%) | 0 (0.0%) |
| 45 to 54 Years | 186 (89.0%) | 0 (0.0%) |
| 55 to 59 Years | 48 (75.0%) | 0 (0.0%) |
| 60 to 64 Years | 64 (62.1%) | 0 (0.0%) |
| 65 to 74 Years | 36 (14.5%) | 0 (0.0%) |
| 75 Years and over | 6 (4.3%) | 0 (0.0%) |
| Total | 712 (56.8%) | 2 (0.3%) |
Employment Status by Educational Attainment in Brooklet
According to labor force statistics for Brooklet, 79.2% of individuals (595) out of the total population between 25 and 64 years of age (751) are in the labor force, with 0.3% or 2 of them being unemployed. The group with the highest labor force participation rate are those with the educational attainment of bachelor's degree or higher, with 92.4% or 256 individuals in the labor force. Within the labor force, individuals with college / associate degree education have the highest percentage of unemployment, with 1.1% or 2 of them being unemployed.
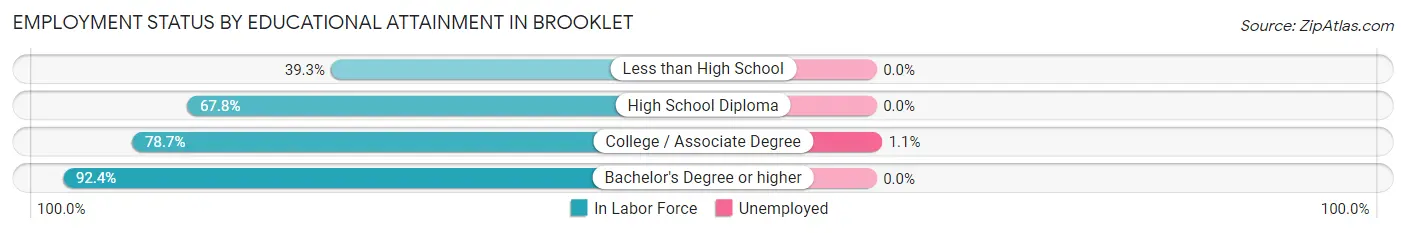
| Educational Attainment | In Labor Force | Unemployed |
| Less than High School | 11 (39.3%) | 0 (0.0%) |
| High School Diploma | 143 (67.8%) | 0 (0.0%) |
| College / Associate Degree | 185 (78.7%) | 3 (1.1%) |
| Bachelor's Degree or higher | 256 (92.4%) | 0 (0.0%) |
| Total | 595 (79.2%) | 2 (0.3%) |
Employment Occupations by Sex in Brooklet
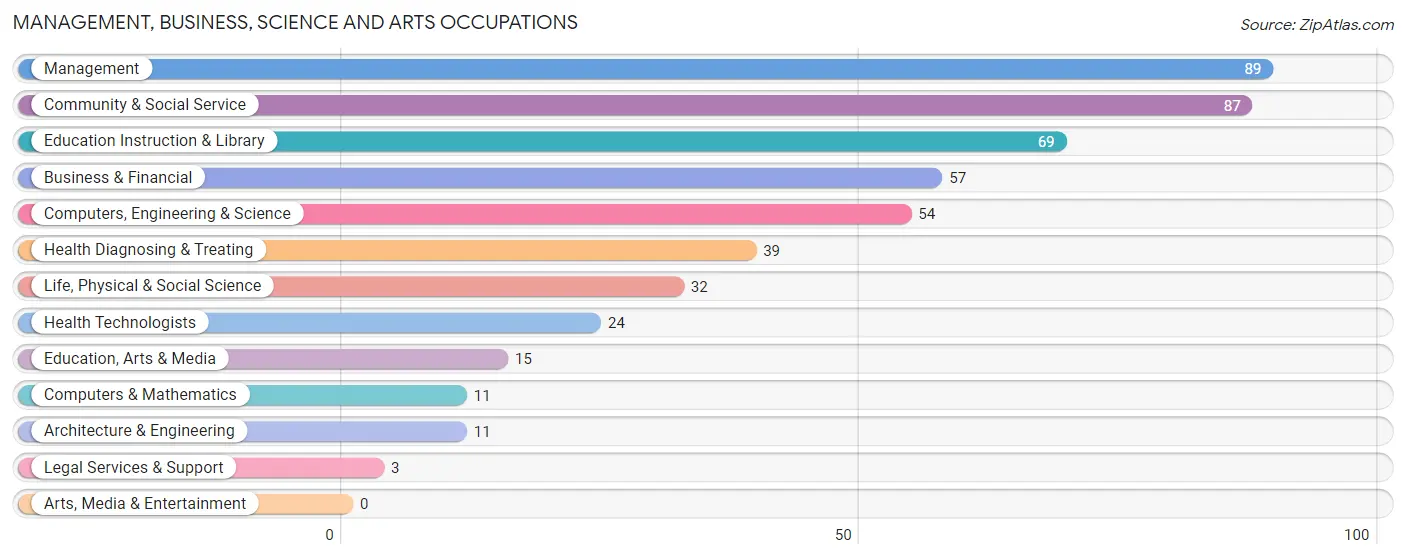
Management, Business, Science and Arts Occupations
The most common Management, Business, Science and Arts occupations in Brooklet are Management (89 | 12.5%), Community & Social Service (87 | 12.2%), Education Instruction & Library (69 | 9.7%), Business & Financial (57 | 8.0%), and Computers, Engineering & Science (54 | 7.6%).
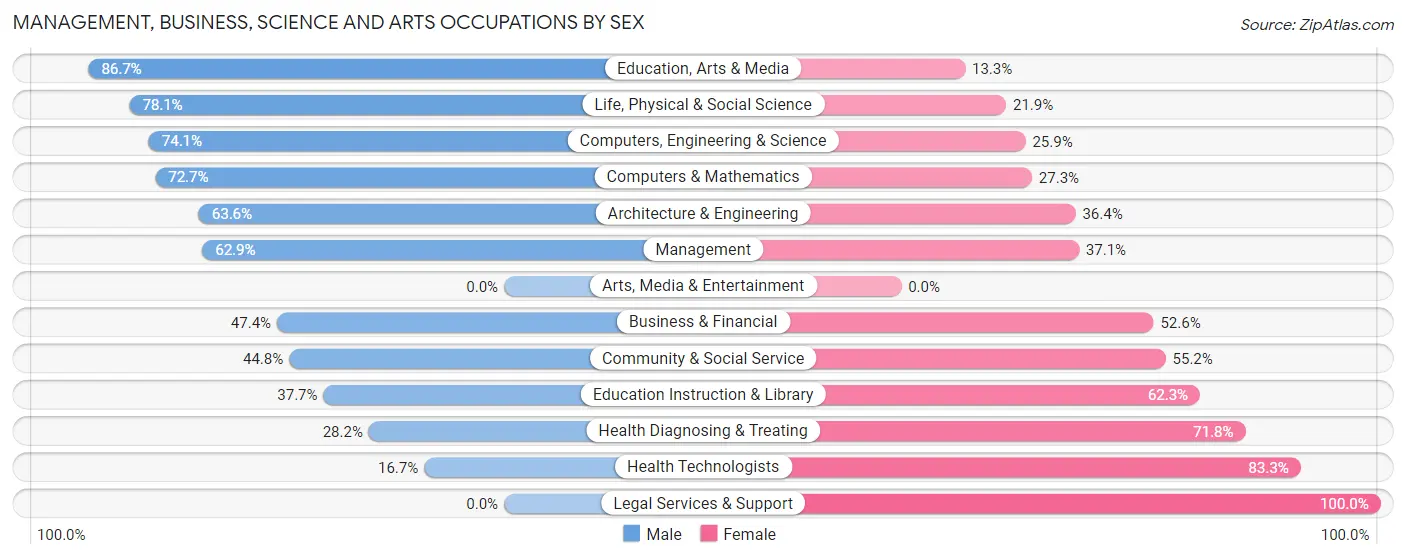
Management, Business, Science and Arts Occupations by Sex
Within the Management, Business, Science and Arts occupations in Brooklet, the most male-oriented occupations are Education, Arts & Media (86.7%), Life, Physical & Social Science (78.1%), and Computers, Engineering & Science (74.1%), while the most female-oriented occupations are Legal Services & Support (100.0%), Health Technologists (83.3%), and Health Diagnosing & Treating (71.8%).
| Occupation | Male | Female |
| Management | 56 (62.9%) | 33 (37.1%) |
| Business & Financial | 27 (47.4%) | 30 (52.6%) |
| Computers, Engineering & Science | 40 (74.1%) | 14 (25.9%) |
| Computers & Mathematics | 8 (72.7%) | 3 (27.3%) |
| Architecture & Engineering | 7 (63.6%) | 4 (36.4%) |
| Life, Physical & Social Science | 25 (78.1%) | 7 (21.9%) |
| Community & Social Service | 39 (44.8%) | 48 (55.2%) |
| Education, Arts & Media | 13 (86.7%) | 2 (13.3%) |
| Legal Services & Support | 0 (0.0%) | 3 (100.0%) |
| Education Instruction & Library | 26 (37.7%) | 43 (62.3%) |
| Arts, Media & Entertainment | 0 (0.0%) | 0 (0.0%) |
| Health Diagnosing & Treating | 11 (28.2%) | 28 (71.8%) |
| Health Technologists | 4 (16.7%) | 20 (83.3%) |
| Total (Category) | 173 (53.1%) | 153 (46.9%) |
| Total (Overall) | 347 (48.9%) | 363 (51.1%) |
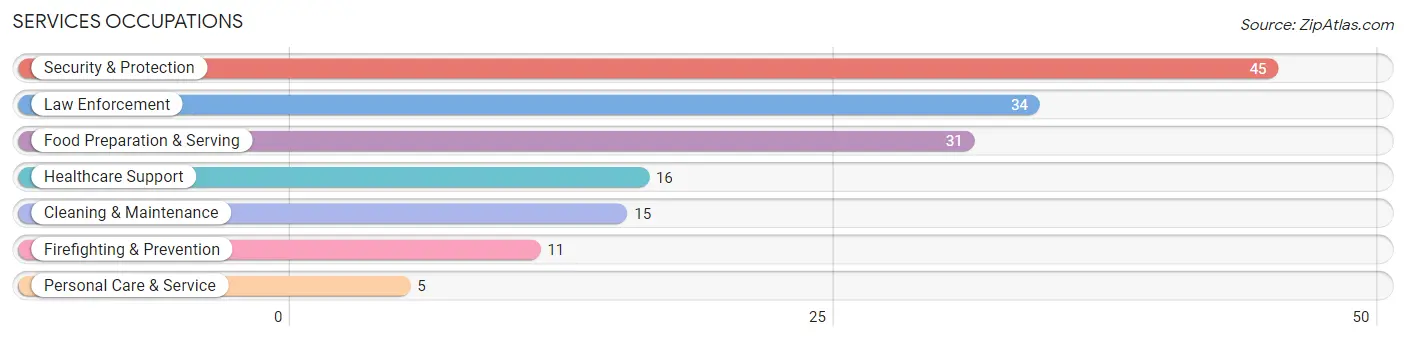
Services Occupations
The most common Services occupations in Brooklet are Security & Protection (45 | 6.3%), Law Enforcement (34 | 4.8%), Food Preparation & Serving (31 | 4.4%), Healthcare Support (16 | 2.2%), and Cleaning & Maintenance (15 | 2.1%).
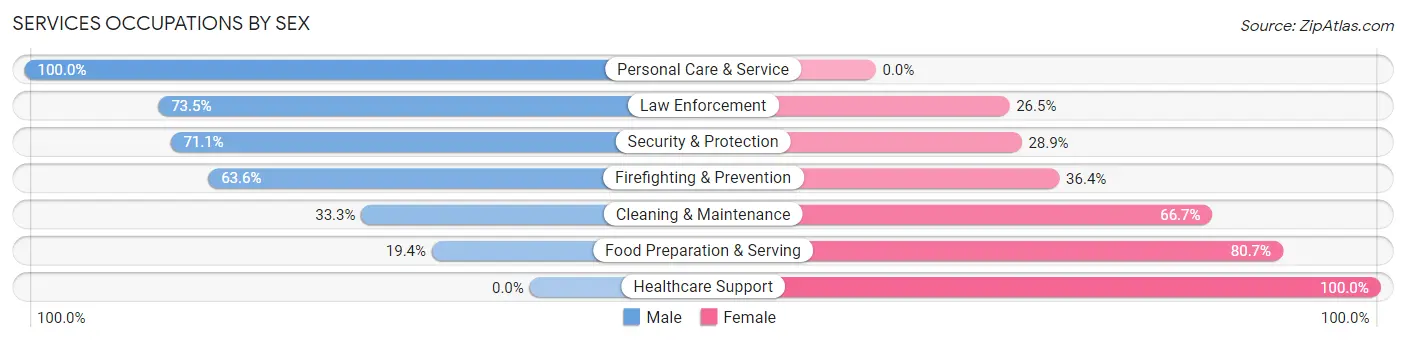
Services Occupations by Sex
Within the Services occupations in Brooklet, the most male-oriented occupations are Personal Care & Service (100.0%), Law Enforcement (73.5%), and Security & Protection (71.1%), while the most female-oriented occupations are Healthcare Support (100.0%), Food Preparation & Serving (80.6%), and Cleaning & Maintenance (66.7%).
| Occupation | Male | Female |
| Healthcare Support | 0 (0.0%) | 16 (100.0%) |
| Security & Protection | 32 (71.1%) | 13 (28.9%) |
| Firefighting & Prevention | 7 (63.6%) | 4 (36.4%) |
| Law Enforcement | 25 (73.5%) | 9 (26.5%) |
| Food Preparation & Serving | 6 (19.4%) | 25 (80.6%) |
| Cleaning & Maintenance | 5 (33.3%) | 10 (66.7%) |
| Personal Care & Service | 5 (100.0%) | 0 (0.0%) |
| Total (Category) | 48 (42.9%) | 64 (57.1%) |
| Total (Overall) | 347 (48.9%) | 363 (51.1%) |
Sales and Office Occupations
The most common Sales and Office occupations in Brooklet are Office & Administration (100 | 14.1%), and Sales & Related (86 | 12.1%).
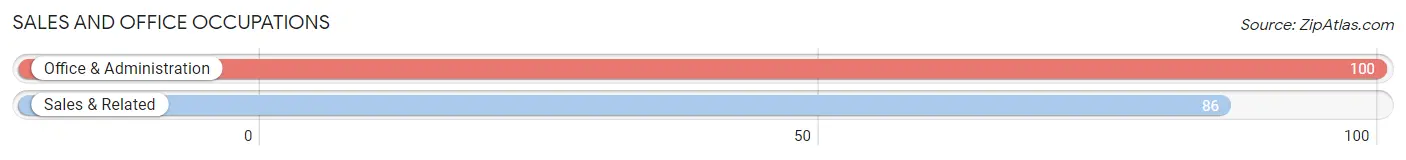
Sales and Office Occupations by Sex

| Occupation | Male | Female |
| Sales & Related | 30 (34.9%) | 56 (65.1%) |
| Office & Administration | 17 (17.0%) | 83 (83.0%) |
| Total (Category) | 47 (25.3%) | 139 (74.7%) |
| Total (Overall) | 347 (48.9%) | 363 (51.1%) |
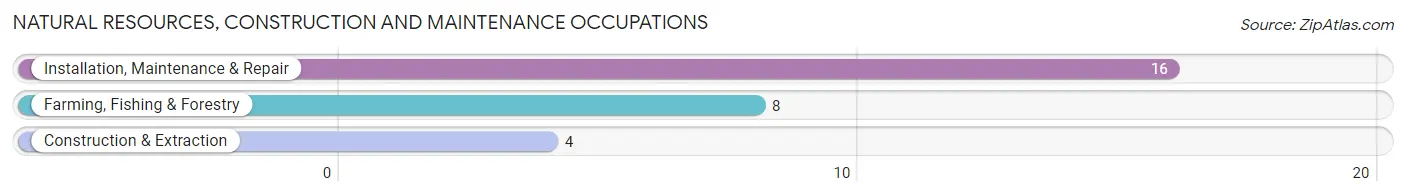
Natural Resources, Construction and Maintenance Occupations
The most common Natural Resources, Construction and Maintenance occupations in Brooklet are Installation, Maintenance & Repair (16 | 2.2%), Farming, Fishing & Forestry (8 | 1.1%), and Construction & Extraction (4 | 0.6%).
Natural Resources, Construction and Maintenance Occupations by Sex
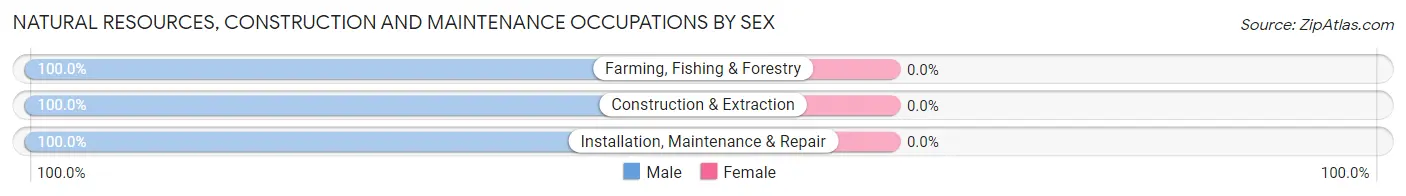
| Occupation | Male | Female |
| Farming, Fishing & Forestry | 8 (100.0%) | 0 (0.0%) |
| Construction & Extraction | 4 (100.0%) | 0 (0.0%) |
| Installation, Maintenance & Repair | 16 (100.0%) | 0 (0.0%) |
| Total (Category) | 28 (100.0%) | 0 (0.0%) |
| Total (Overall) | 347 (48.9%) | 363 (51.1%) |
Production, Transportation and Moving Occupations
The most common Production, Transportation and Moving occupations in Brooklet are Transportation (27 | 3.8%), Production (23 | 3.2%), and Material Moving (8 | 1.1%).
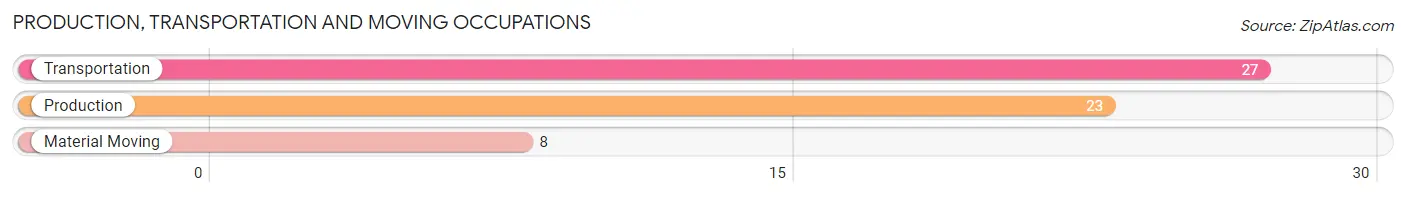
Production, Transportation and Moving Occupations by Sex
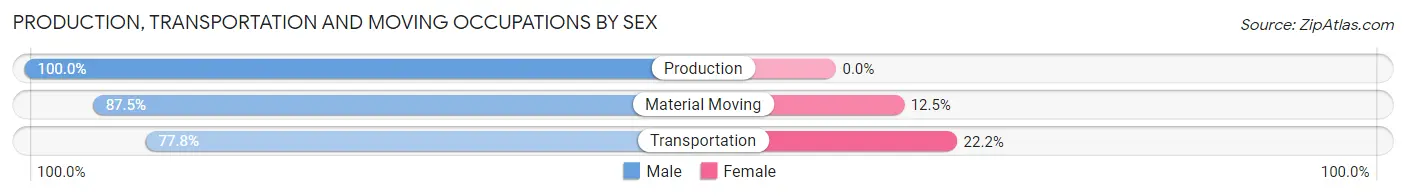
| Occupation | Male | Female |
| Production | 23 (100.0%) | 0 (0.0%) |
| Transportation | 21 (77.8%) | 6 (22.2%) |
| Material Moving | 7 (87.5%) | 1 (12.5%) |
| Total (Category) | 51 (87.9%) | 7 (12.1%) |
| Total (Overall) | 347 (48.9%) | 363 (51.1%) |
Employment Industries by Sex in Brooklet
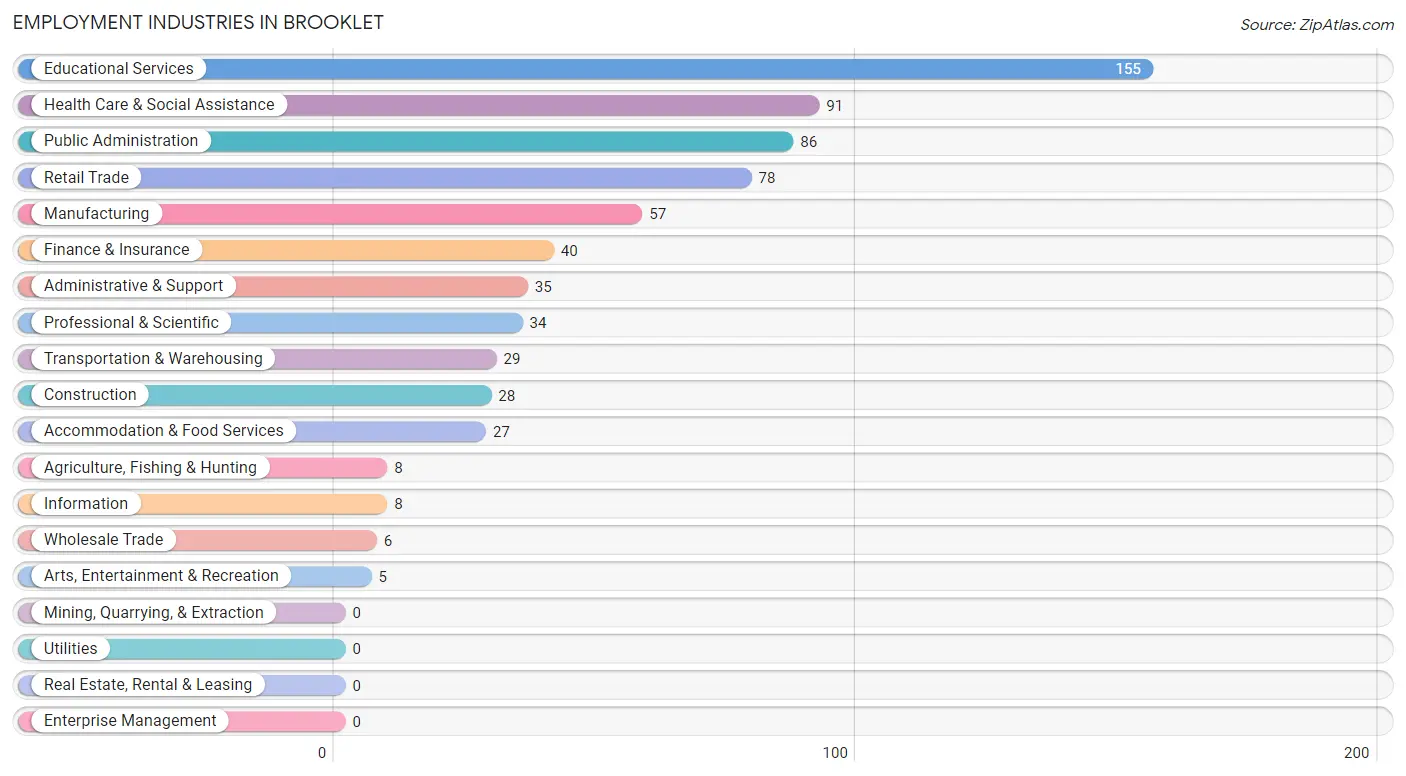
Employment Industries in Brooklet
The major employment industries in Brooklet include Educational Services (155 | 21.8%), Health Care & Social Assistance (91 | 12.8%), Public Administration (86 | 12.1%), Retail Trade (78 | 11.0%), and Manufacturing (57 | 8.0%).
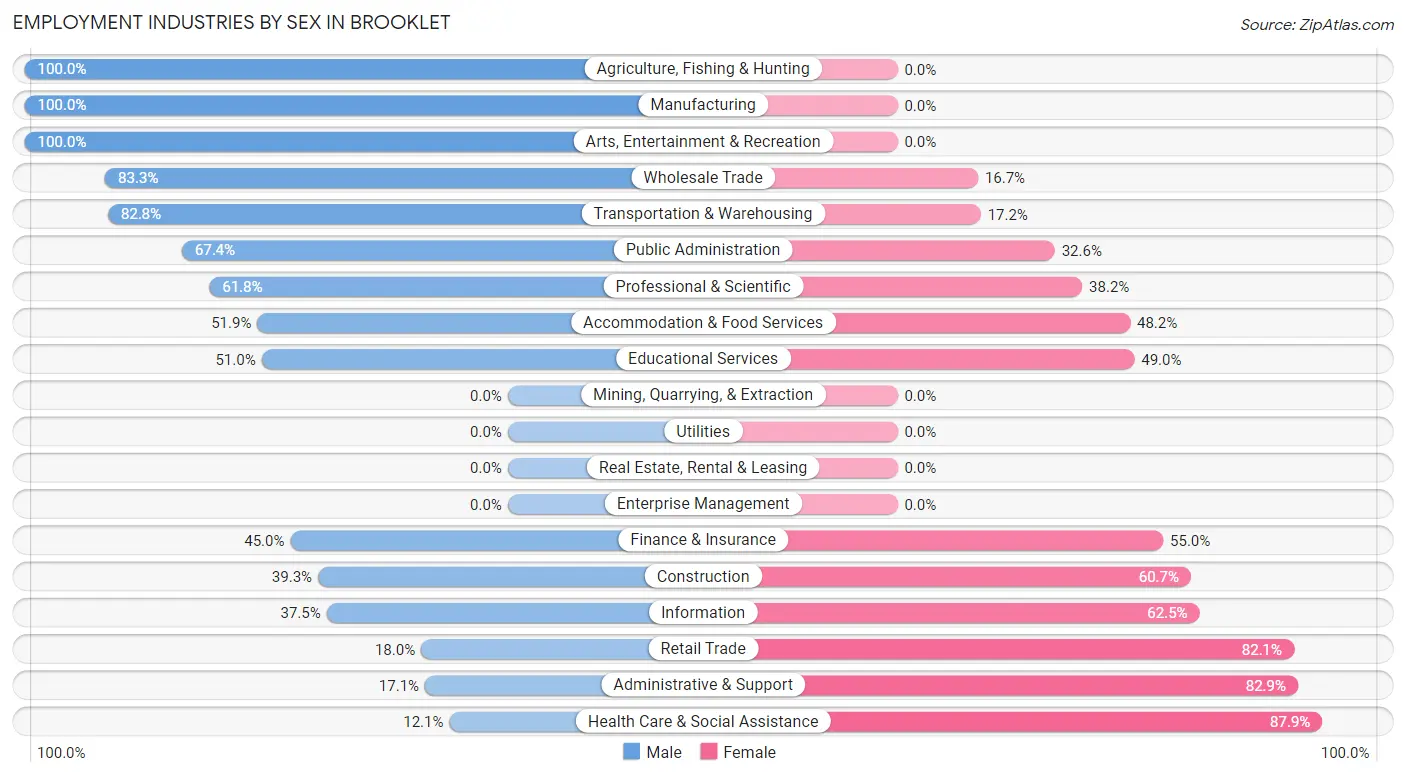
Employment Industries by Sex in Brooklet
The Brooklet industries that see more men than women are Agriculture, Fishing & Hunting (100.0%), Manufacturing (100.0%), and Arts, Entertainment & Recreation (100.0%), whereas the industries that tend to have a higher number of women are Health Care & Social Assistance (87.9%), Administrative & Support (82.9%), and Retail Trade (82.1%).
| Industry | Male | Female |
| Agriculture, Fishing & Hunting | 8 (100.0%) | 0 (0.0%) |
| Mining, Quarrying, & Extraction | 0 (0.0%) | 0 (0.0%) |
| Construction | 11 (39.3%) | 17 (60.7%) |
| Manufacturing | 57 (100.0%) | 0 (0.0%) |
| Wholesale Trade | 5 (83.3%) | 1 (16.7%) |
| Retail Trade | 14 (17.9%) | 64 (82.1%) |
| Transportation & Warehousing | 24 (82.8%) | 5 (17.2%) |
| Utilities | 0 (0.0%) | 0 (0.0%) |
| Information | 3 (37.5%) | 5 (62.5%) |
| Finance & Insurance | 18 (45.0%) | 22 (55.0%) |
| Real Estate, Rental & Leasing | 0 (0.0%) | 0 (0.0%) |
| Professional & Scientific | 21 (61.8%) | 13 (38.2%) |
| Enterprise Management | 0 (0.0%) | 0 (0.0%) |
| Administrative & Support | 6 (17.1%) | 29 (82.9%) |
| Educational Services | 79 (51.0%) | 76 (49.0%) |
| Health Care & Social Assistance | 11 (12.1%) | 80 (87.9%) |
| Arts, Entertainment & Recreation | 5 (100.0%) | 0 (0.0%) |
| Accommodation & Food Services | 14 (51.8%) | 13 (48.1%) |
| Public Administration | 58 (67.4%) | 28 (32.6%) |
| Total | 347 (48.9%) | 363 (51.1%) |
Education in Brooklet
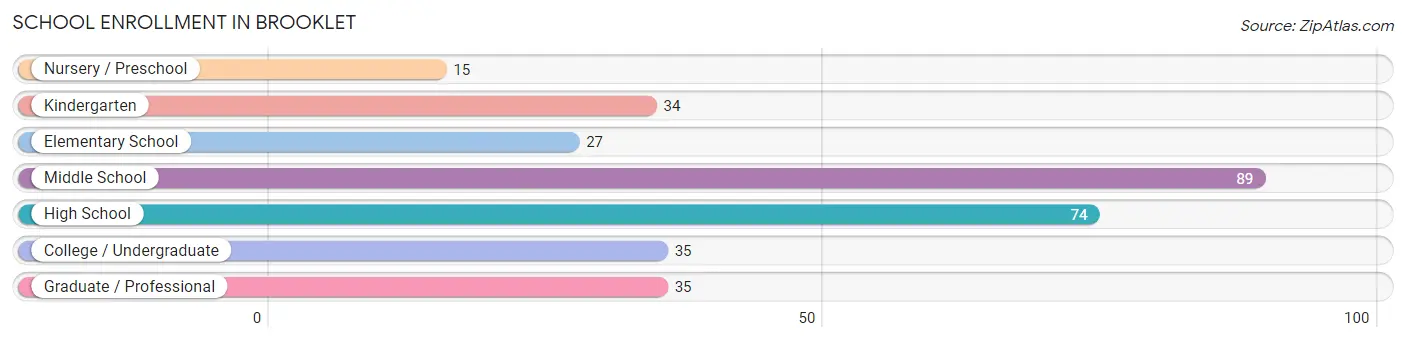
School Enrollment in Brooklet
The most common levels of schooling among the 309 students in Brooklet are middle school (89 | 28.8%), high school (74 | 23.9%), and college / undergraduate (35 | 11.3%).
| School Level | # Students | % Students |
| Nursery / Preschool | 15 | 4.9% |
| Kindergarten | 34 | 11.0% |
| Elementary School | 27 | 8.7% |
| Middle School | 89 | 28.8% |
| High School | 74 | 23.9% |
| College / Undergraduate | 35 | 11.3% |
| Graduate / Professional | 35 | 11.3% |
| Total | 309 | 100.0% |
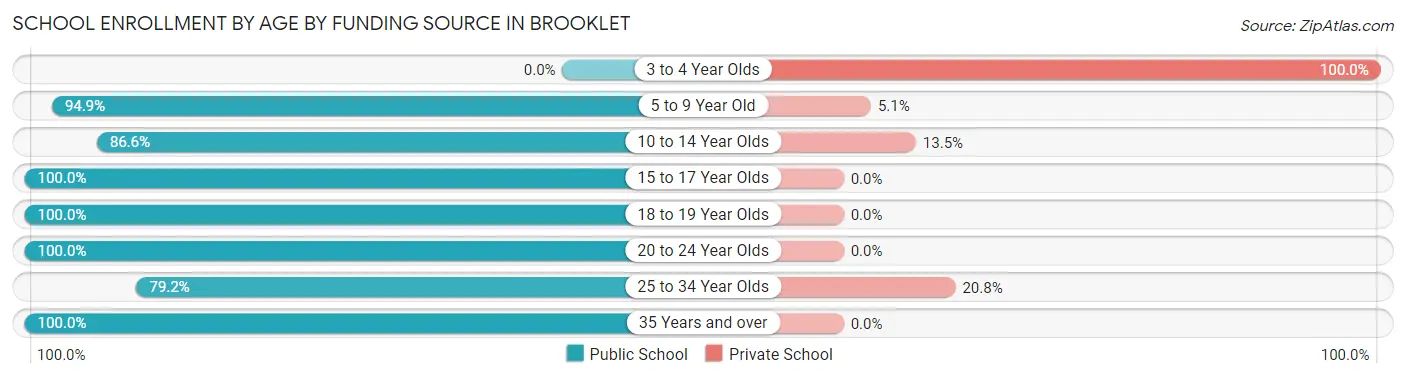
School Enrollment by Age by Funding Source in Brooklet
Out of a total of 309 students who are enrolled in schools in Brooklet, 37 (12.0%) attend a private institution, while the remaining 272 (88.0%) are enrolled in public schools. The age group of 3 to 4 year olds has the highest likelihood of being enrolled in private schools, with 13 (100.0% in the age bracket) enrolled. Conversely, the age group of 15 to 17 year olds has the lowest likelihood of being enrolled in a private school, with 45 (100.0% in the age bracket) attending a public institution.
| Age Bracket | Public School | Private School |
| 3 to 4 Year Olds | 0 (0.0%) | 13 (100.0%) |
| 5 to 9 Year Old | 56 (94.9%) | 3 (5.1%) |
| 10 to 14 Year Olds | 103 (86.6%) | 16 (13.5%) |
| 15 to 17 Year Olds | 45 (100.0%) | 0 (0.0%) |
| 18 to 19 Year Olds | 15 (100.0%) | 0 (0.0%) |
| 20 to 24 Year Olds | 18 (100.0%) | 0 (0.0%) |
| 25 to 34 Year Olds | 19 (79.2%) | 5 (20.8%) |
| 35 Years and over | 16 (100.0%) | 0 (0.0%) |
| Total | 272 (88.0%) | 37 (12.0%) |
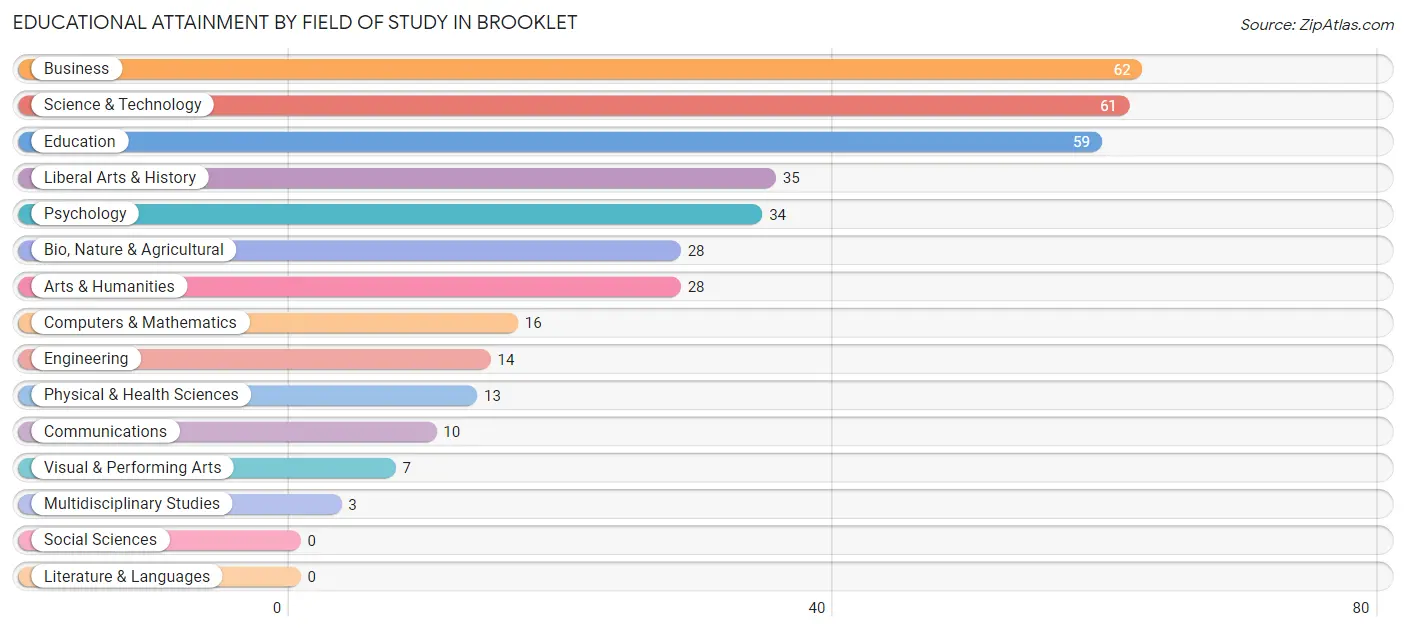
Educational Attainment by Field of Study in Brooklet
Business (62 | 16.8%), science & technology (61 | 16.5%), education (59 | 16.0%), liberal arts & history (35 | 9.5%), and psychology (34 | 9.2%) are the most common fields of study among 370 individuals in Brooklet who have obtained a bachelor's degree or higher.
| Field of Study | # Graduates | % Graduates |
| Computers & Mathematics | 16 | 4.3% |
| Bio, Nature & Agricultural | 28 | 7.6% |
| Physical & Health Sciences | 13 | 3.5% |
| Psychology | 34 | 9.2% |
| Social Sciences | 0 | 0.0% |
| Engineering | 14 | 3.8% |
| Multidisciplinary Studies | 3 | 0.8% |
| Science & Technology | 61 | 16.5% |
| Business | 62 | 16.8% |
| Education | 59 | 16.0% |
| Literature & Languages | 0 | 0.0% |
| Liberal Arts & History | 35 | 9.5% |
| Visual & Performing Arts | 7 | 1.9% |
| Communications | 10 | 2.7% |
| Arts & Humanities | 28 | 7.6% |
| Total | 370 | 100.0% |
Transportation & Commute in Brooklet
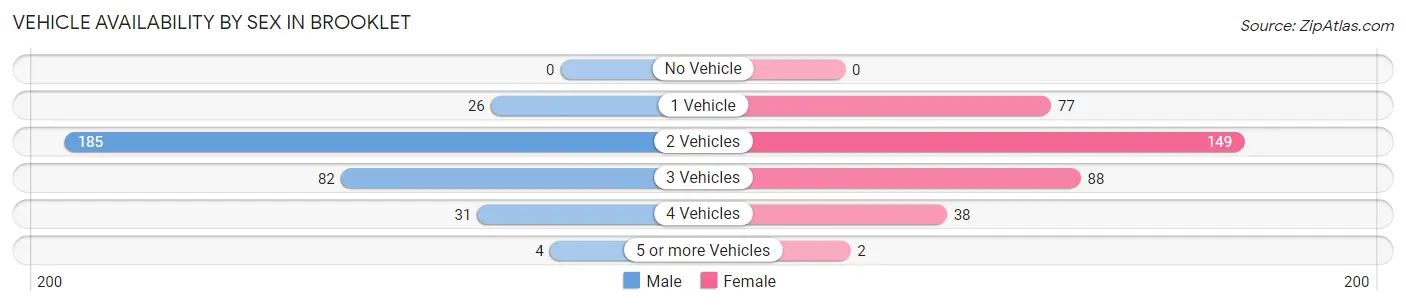
Vehicle Availability by Sex in Brooklet
The most prevalent vehicle ownership categories in Brooklet are males with 2 vehicles (185, accounting for 56.4%) and females with 2 vehicles (149, making up 52.3%).
| Vehicles Available | Male | Female |
| No Vehicle | 0 (0.0%) | 0 (0.0%) |
| 1 Vehicle | 26 (7.9%) | 77 (21.7%) |
| 2 Vehicles | 185 (56.4%) | 149 (42.1%) |
| 3 Vehicles | 82 (25.0%) | 88 (24.9%) |
| 4 Vehicles | 31 (9.5%) | 38 (10.7%) |
| 5 or more Vehicles | 4 (1.2%) | 2 (0.6%) |
| Total | 328 (100.0%) | 354 (100.0%) |
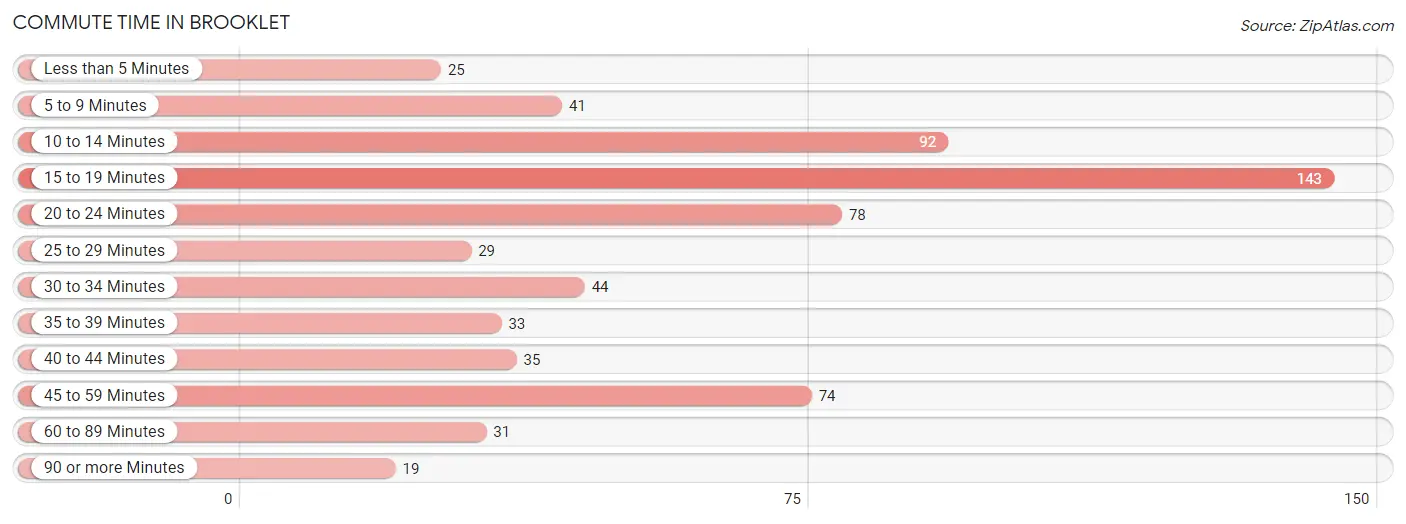
Commute Time in Brooklet
The most frequently occuring commute durations in Brooklet are 15 to 19 minutes (143 commuters, 22.2%), 10 to 14 minutes (92 commuters, 14.3%), and 20 to 24 minutes (78 commuters, 12.1%).
| Commute Time | # Commuters | % Commuters |
| Less than 5 Minutes | 25 | 3.9% |
| 5 to 9 Minutes | 41 | 6.4% |
| 10 to 14 Minutes | 92 | 14.3% |
| 15 to 19 Minutes | 143 | 22.2% |
| 20 to 24 Minutes | 78 | 12.1% |
| 25 to 29 Minutes | 29 | 4.5% |
| 30 to 34 Minutes | 44 | 6.8% |
| 35 to 39 Minutes | 33 | 5.1% |
| 40 to 44 Minutes | 35 | 5.4% |
| 45 to 59 Minutes | 74 | 11.5% |
| 60 to 89 Minutes | 31 | 4.8% |
| 90 or more Minutes | 19 | 2.9% |
Commute Time by Sex in Brooklet
The most common commute times in Brooklet are 45 to 59 minutes (47 commuters, 15.4%) for males and 15 to 19 minutes (98 commuters, 29.0%) for females.
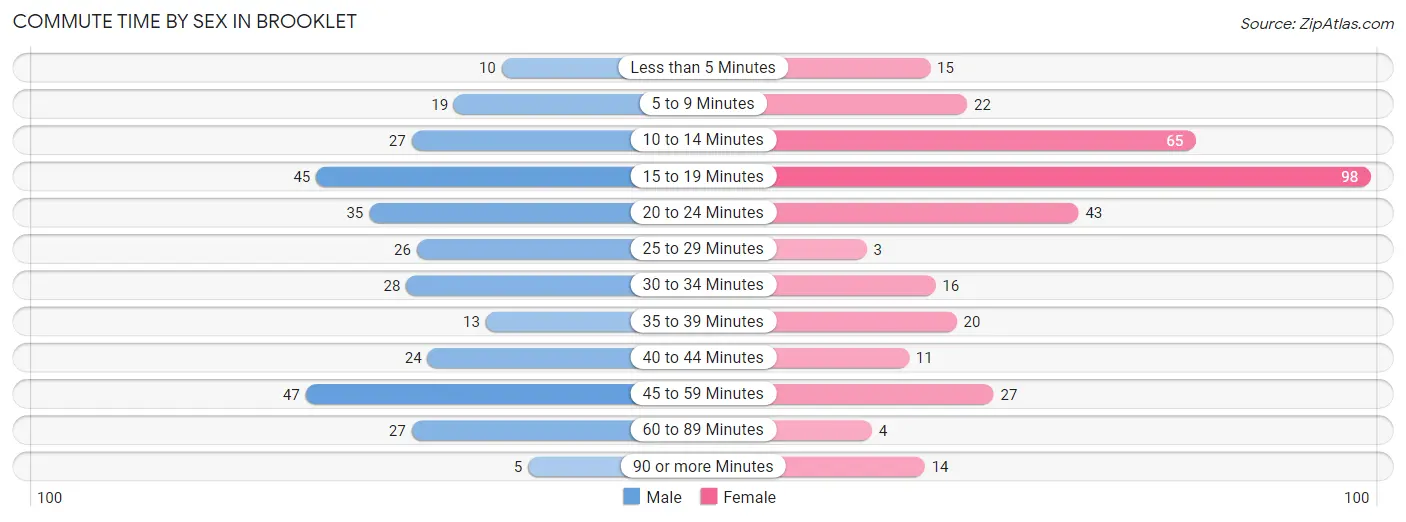
| Commute Time | Male | Female |
| Less than 5 Minutes | 10 (3.3%) | 15 (4.4%) |
| 5 to 9 Minutes | 19 (6.2%) | 22 (6.5%) |
| 10 to 14 Minutes | 27 (8.8%) | 65 (19.2%) |
| 15 to 19 Minutes | 45 (14.7%) | 98 (29.0%) |
| 20 to 24 Minutes | 35 (11.4%) | 43 (12.7%) |
| 25 to 29 Minutes | 26 (8.5%) | 3 (0.9%) |
| 30 to 34 Minutes | 28 (9.1%) | 16 (4.7%) |
| 35 to 39 Minutes | 13 (4.3%) | 20 (5.9%) |
| 40 to 44 Minutes | 24 (7.8%) | 11 (3.3%) |
| 45 to 59 Minutes | 47 (15.4%) | 27 (8.0%) |
| 60 to 89 Minutes | 27 (8.8%) | 4 (1.2%) |
| 90 or more Minutes | 5 (1.6%) | 14 (4.1%) |
Time of Departure to Work by Sex in Brooklet
The most frequent times of departure to work in Brooklet are 7:00 AM to 7:29 AM (67, 21.9%) for males and 7:00 AM to 7:29 AM (58, 17.2%) for females.
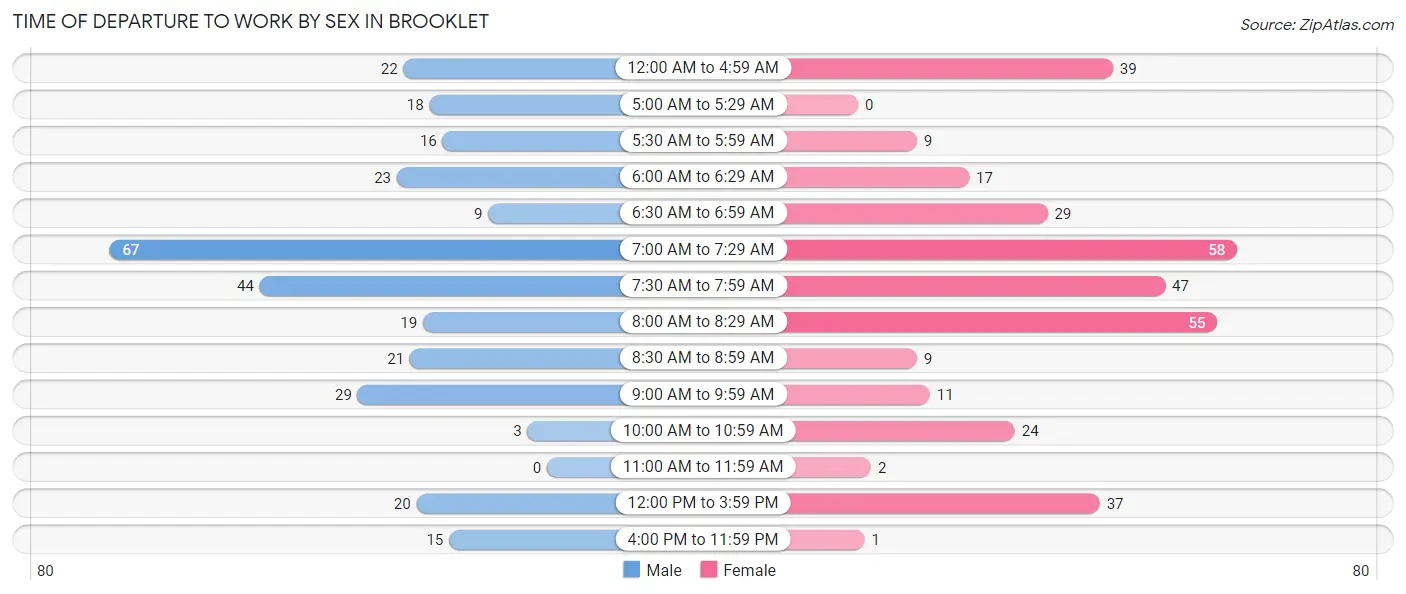
| Time of Departure | Male | Female |
| 12:00 AM to 4:59 AM | 22 (7.2%) | 39 (11.5%) |
| 5:00 AM to 5:29 AM | 18 (5.9%) | 0 (0.0%) |
| 5:30 AM to 5:59 AM | 16 (5.2%) | 9 (2.7%) |
| 6:00 AM to 6:29 AM | 23 (7.5%) | 17 (5.0%) |
| 6:30 AM to 6:59 AM | 9 (2.9%) | 29 (8.6%) |
| 7:00 AM to 7:29 AM | 67 (21.9%) | 58 (17.2%) |
| 7:30 AM to 7:59 AM | 44 (14.4%) | 47 (13.9%) |
| 8:00 AM to 8:29 AM | 19 (6.2%) | 55 (16.3%) |
| 8:30 AM to 8:59 AM | 21 (6.9%) | 9 (2.7%) |
| 9:00 AM to 9:59 AM | 29 (9.5%) | 11 (3.3%) |
| 10:00 AM to 10:59 AM | 3 (1.0%) | 24 (7.1%) |
| 11:00 AM to 11:59 AM | 0 (0.0%) | 2 (0.6%) |
| 12:00 PM to 3:59 PM | 20 (6.5%) | 37 (11.0%) |
| 4:00 PM to 11:59 PM | 15 (4.9%) | 1 (0.3%) |
| Total | 306 (100.0%) | 338 (100.0%) |
Housing Occupancy in Brooklet
Occupancy by Ownership in Brooklet
Of the total 674 dwellings in Brooklet, owner-occupied units account for 441 (65.4%), while renter-occupied units make up 233 (34.6%).
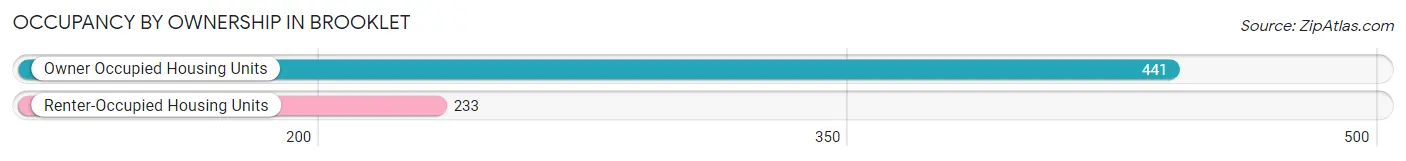
| Occupancy | # Housing Units | % Housing Units |
| Owner Occupied Housing Units | 441 | 65.4% |
| Renter-Occupied Housing Units | 233 | 34.6% |
| Total Occupied Housing Units | 674 | 100.0% |
Occupancy by Household Size in Brooklet
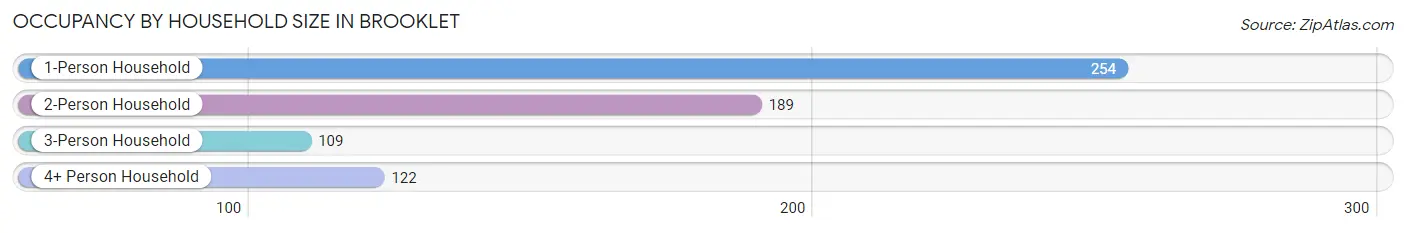
| Household Size | # Housing Units | % Housing Units |
| 1-Person Household | 254 | 37.7% |
| 2-Person Household | 189 | 28.0% |
| 3-Person Household | 109 | 16.2% |
| 4+ Person Household | 122 | 18.1% |
| Total Housing Units | 674 | 100.0% |
Occupancy by Ownership by Household Size in Brooklet
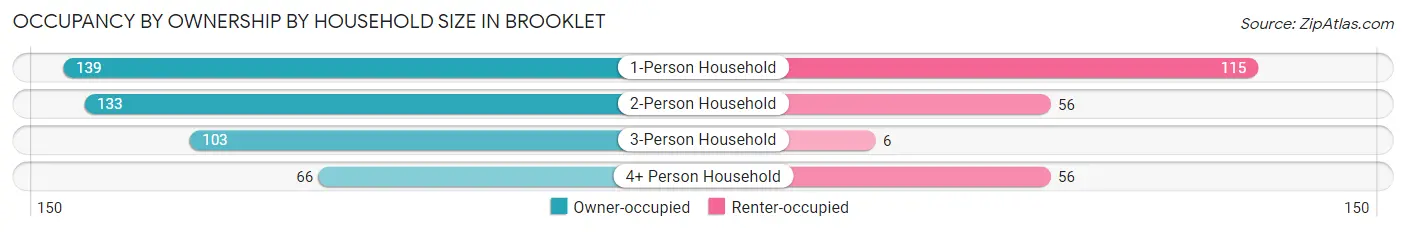
| Household Size | Owner-occupied | Renter-occupied |
| 1-Person Household | 139 (54.7%) | 115 (45.3%) |
| 2-Person Household | 133 (70.4%) | 56 (29.6%) |
| 3-Person Household | 103 (94.5%) | 6 (5.5%) |
| 4+ Person Household | 66 (54.1%) | 56 (45.9%) |
| Total Housing Units | 441 (65.4%) | 233 (34.6%) |
Occupancy by Educational Attainment in Brooklet
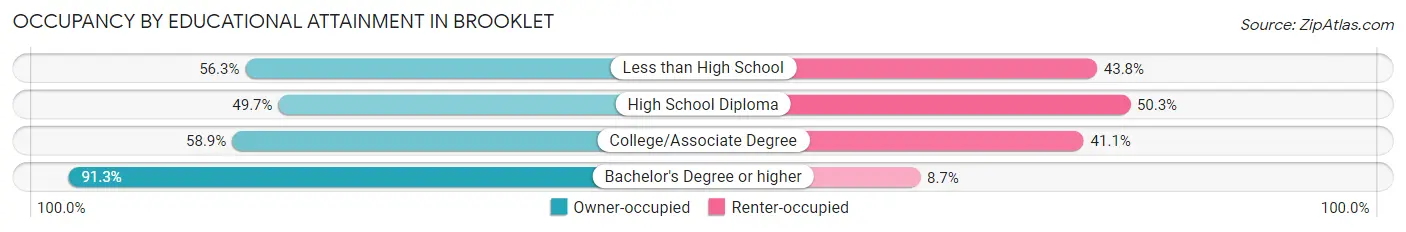
| Household Size | Owner-occupied | Renter-occupied |
| Less than High School | 18 (56.2%) | 14 (43.8%) |
| High School Diploma | 79 (49.7%) | 80 (50.3%) |
| College/Associate Degree | 176 (58.9%) | 123 (41.1%) |
| Bachelor's Degree or higher | 168 (91.3%) | 16 (8.7%) |
Occupancy by Age of Householder in Brooklet
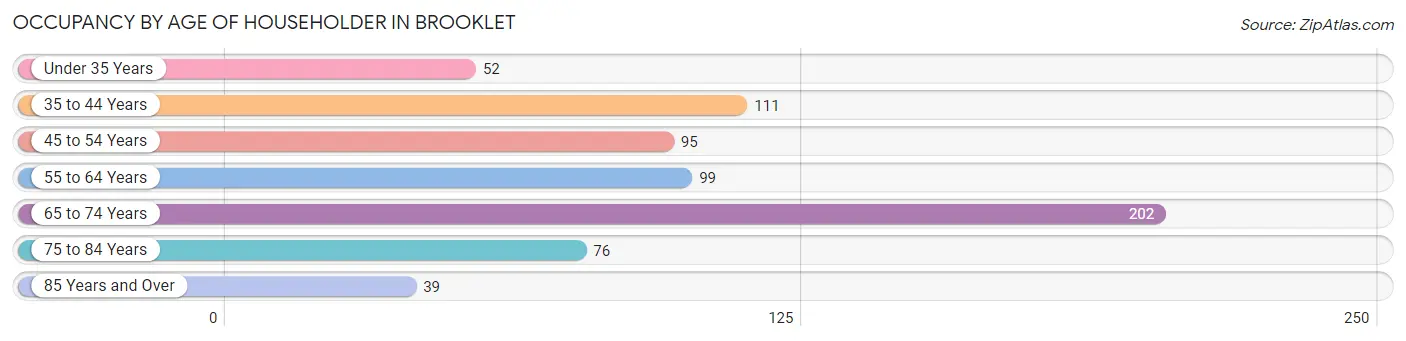
| Age Bracket | # Households | % Households |
| Under 35 Years | 52 | 7.7% |
| 35 to 44 Years | 111 | 16.5% |
| 45 to 54 Years | 95 | 14.1% |
| 55 to 64 Years | 99 | 14.7% |
| 65 to 74 Years | 202 | 30.0% |
| 75 to 84 Years | 76 | 11.3% |
| 85 Years and Over | 39 | 5.8% |
| Total | 674 | 100.0% |
Housing Finances in Brooklet
Median Income by Occupancy in Brooklet

| Occupancy Type | # Households | Median Income |
| Owner-Occupied | 441 (65.4%) | $79,464 |
| Renter-Occupied | 233 (34.6%) | $0 |
| Average | 674 (100.0%) | $63,462 |
Occupancy by Householder Income Bracket in Brooklet
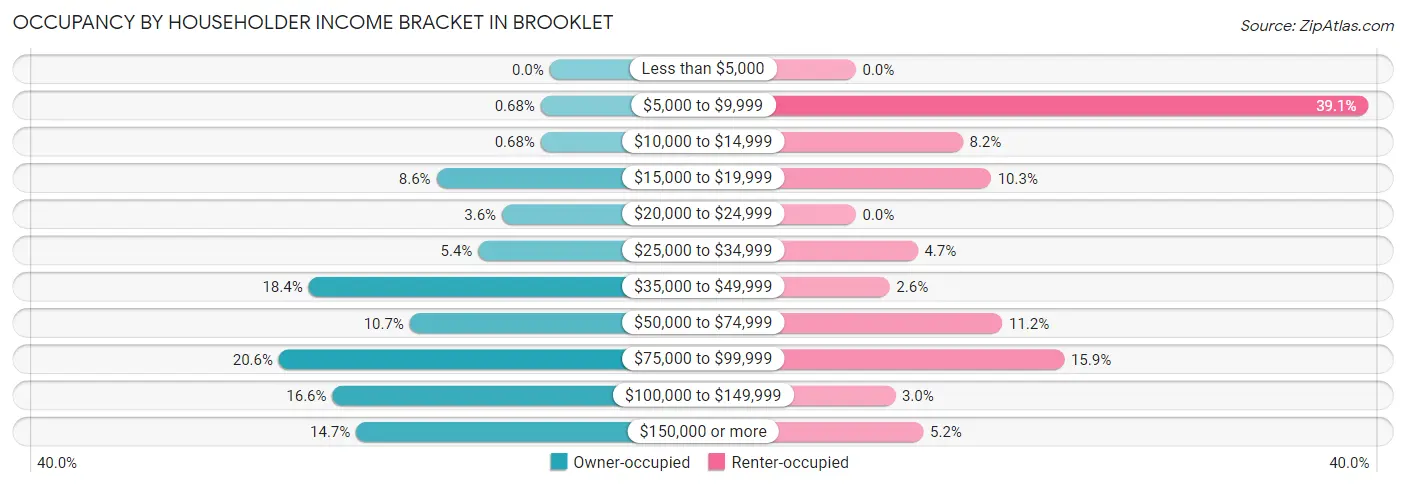
| Income Bracket | Owner-occupied | Renter-occupied |
| Less than $5,000 | 0 (0.0%) | 0 (0.0%) |
| $5,000 to $9,999 | 3 (0.7%) | 91 (39.1%) |
| $10,000 to $14,999 | 3 (0.7%) | 19 (8.2%) |
| $15,000 to $19,999 | 38 (8.6%) | 24 (10.3%) |
| $20,000 to $24,999 | 16 (3.6%) | 0 (0.0%) |
| $25,000 to $34,999 | 24 (5.4%) | 11 (4.7%) |
| $35,000 to $49,999 | 81 (18.4%) | 6 (2.6%) |
| $50,000 to $74,999 | 47 (10.7%) | 26 (11.2%) |
| $75,000 to $99,999 | 91 (20.6%) | 37 (15.9%) |
| $100,000 to $149,999 | 73 (16.6%) | 7 (3.0%) |
| $150,000 or more | 65 (14.7%) | 12 (5.1%) |
| Total | 441 (100.0%) | 233 (100.0%) |
Monthly Housing Cost Tiers in Brooklet
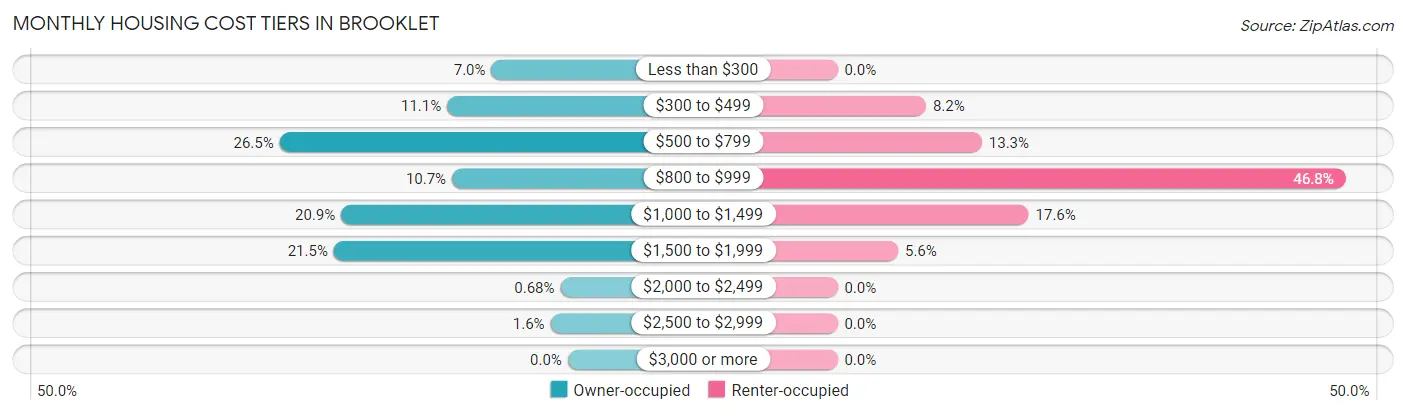
| Monthly Cost | Owner-occupied | Renter-occupied |
| Less than $300 | 31 (7.0%) | 0 (0.0%) |
| $300 to $499 | 49 (11.1%) | 19 (8.2%) |
| $500 to $799 | 117 (26.5%) | 31 (13.3%) |
| $800 to $999 | 47 (10.7%) | 109 (46.8%) |
| $1,000 to $1,499 | 92 (20.9%) | 41 (17.6%) |
| $1,500 to $1,999 | 95 (21.5%) | 13 (5.6%) |
| $2,000 to $2,499 | 3 (0.7%) | 0 (0.0%) |
| $2,500 to $2,999 | 7 (1.6%) | 0 (0.0%) |
| $3,000 or more | 0 (0.0%) | 0 (0.0%) |
| Total | 441 (100.0%) | 233 (100.0%) |
Physical Housing Characteristics in Brooklet
Housing Structures in Brooklet
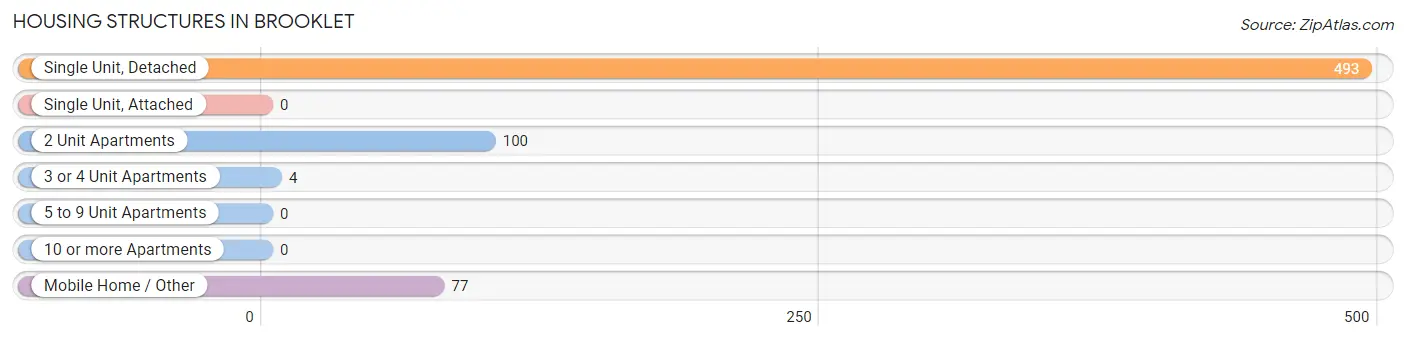
| Structure Type | # Housing Units | % Housing Units |
| Single Unit, Detached | 493 | 73.2% |
| Single Unit, Attached | 0 | 0.0% |
| 2 Unit Apartments | 100 | 14.8% |
| 3 or 4 Unit Apartments | 4 | 0.6% |
| 5 to 9 Unit Apartments | 0 | 0.0% |
| 10 or more Apartments | 0 | 0.0% |
| Mobile Home / Other | 77 | 11.4% |
| Total | 674 | 100.0% |
Housing Structures by Occupancy in Brooklet
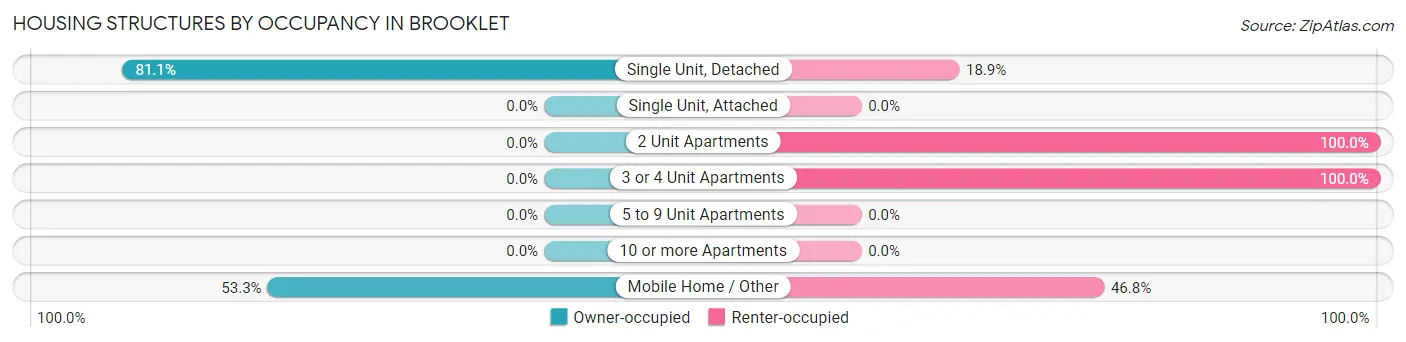
| Structure Type | Owner-occupied | Renter-occupied |
| Single Unit, Detached | 400 (81.1%) | 93 (18.9%) |
| Single Unit, Attached | 0 (0.0%) | 0 (0.0%) |
| 2 Unit Apartments | 0 (0.0%) | 100 (100.0%) |
| 3 or 4 Unit Apartments | 0 (0.0%) | 4 (100.0%) |
| 5 to 9 Unit Apartments | 0 (0.0%) | 0 (0.0%) |
| 10 or more Apartments | 0 (0.0%) | 0 (0.0%) |
| Mobile Home / Other | 41 (53.2%) | 36 (46.8%) |
| Total | 441 (65.4%) | 233 (34.6%) |
Housing Structures by Number of Rooms in Brooklet
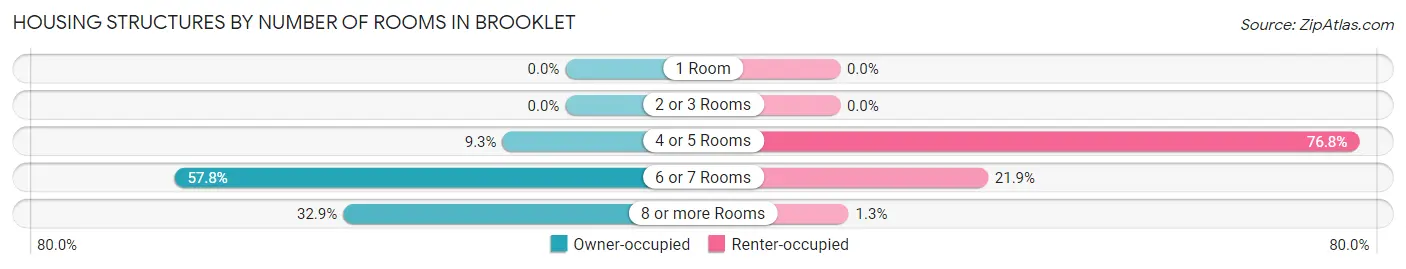
| Number of Rooms | Owner-occupied | Renter-occupied |
| 1 Room | 0 (0.0%) | 0 (0.0%) |
| 2 or 3 Rooms | 0 (0.0%) | 0 (0.0%) |
| 4 or 5 Rooms | 41 (9.3%) | 179 (76.8%) |
| 6 or 7 Rooms | 255 (57.8%) | 51 (21.9%) |
| 8 or more Rooms | 145 (32.9%) | 3 (1.3%) |
| Total | 441 (100.0%) | 233 (100.0%) |
Housing Structure by Heating Type in Brooklet
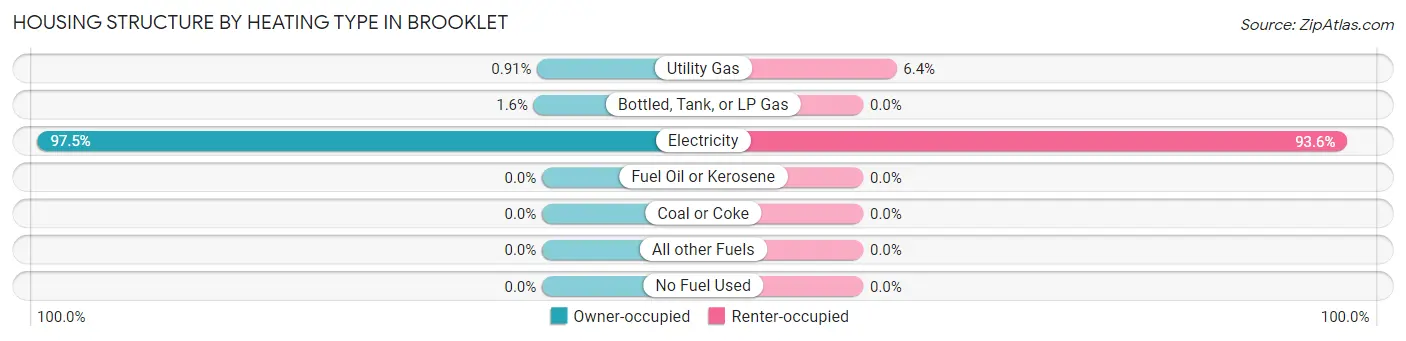
| Heating Type | Owner-occupied | Renter-occupied |
| Utility Gas | 4 (0.9%) | 15 (6.4%) |
| Bottled, Tank, or LP Gas | 7 (1.6%) | 0 (0.0%) |
| Electricity | 430 (97.5%) | 218 (93.6%) |
| Fuel Oil or Kerosene | 0 (0.0%) | 0 (0.0%) |
| Coal or Coke | 0 (0.0%) | 0 (0.0%) |
| All other Fuels | 0 (0.0%) | 0 (0.0%) |
| No Fuel Used | 0 (0.0%) | 0 (0.0%) |
| Total | 441 (100.0%) | 233 (100.0%) |
Household Vehicle Usage in Brooklet
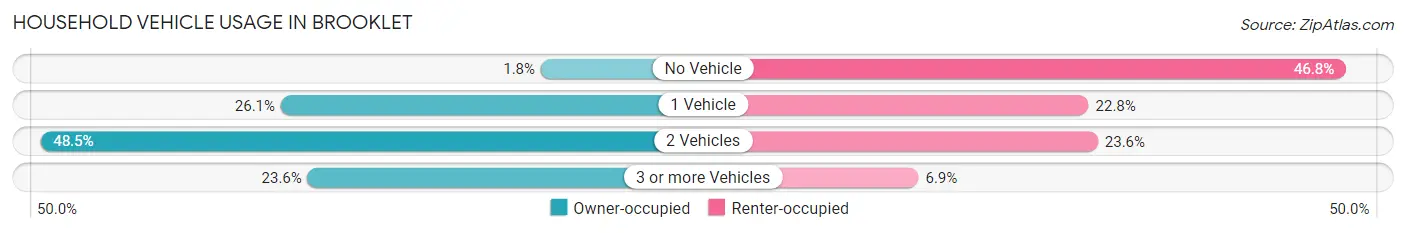
| Vehicles per Household | Owner-occupied | Renter-occupied |
| No Vehicle | 8 (1.8%) | 109 (46.8%) |
| 1 Vehicle | 115 (26.1%) | 53 (22.8%) |
| 2 Vehicles | 214 (48.5%) | 55 (23.6%) |
| 3 or more Vehicles | 104 (23.6%) | 16 (6.9%) |
| Total | 441 (100.0%) | 233 (100.0%) |
Real Estate & Mortgages in Brooklet
Real Estate and Mortgage Overview in Brooklet
| Characteristic | Without Mortgage | With Mortgage |
| Housing Units | 172 | 269 |
| Median Property Value | $202,400 | $223,100 |
| Median Household Income | $43,250 | $52 |
| Monthly Housing Costs | $519 | $0 |
| Real Estate Taxes | $1,726 | $17 |
Property Value by Mortgage Status in Brooklet
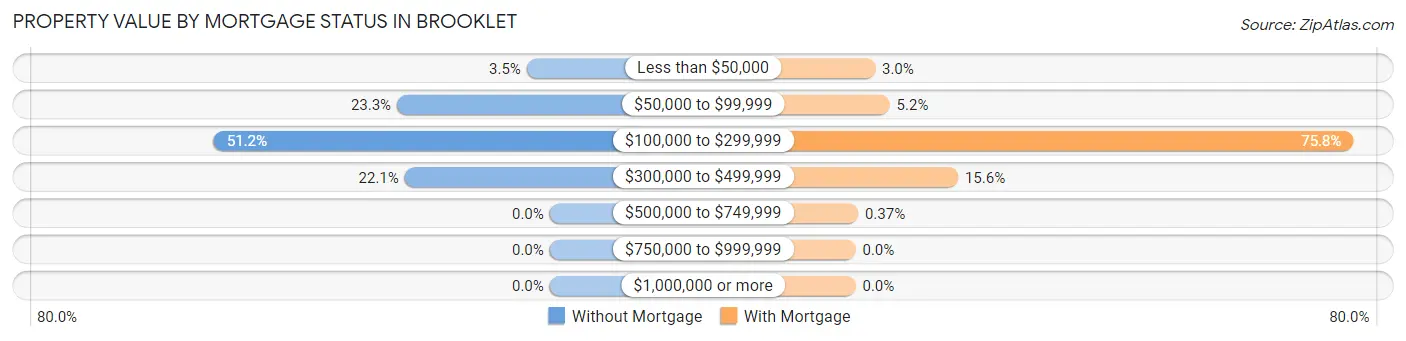
| Property Value | Without Mortgage | With Mortgage |
| Less than $50,000 | 6 (3.5%) | 8 (3.0%) |
| $50,000 to $99,999 | 40 (23.3%) | 14 (5.2%) |
| $100,000 to $299,999 | 88 (51.2%) | 204 (75.8%) |
| $300,000 to $499,999 | 38 (22.1%) | 42 (15.6%) |
| $500,000 to $749,999 | 0 (0.0%) | 1 (0.4%) |
| $750,000 to $999,999 | 0 (0.0%) | 0 (0.0%) |
| $1,000,000 or more | 0 (0.0%) | 0 (0.0%) |
| Total | 172 (100.0%) | 269 (100.0%) |
Household Income by Mortgage Status in Brooklet
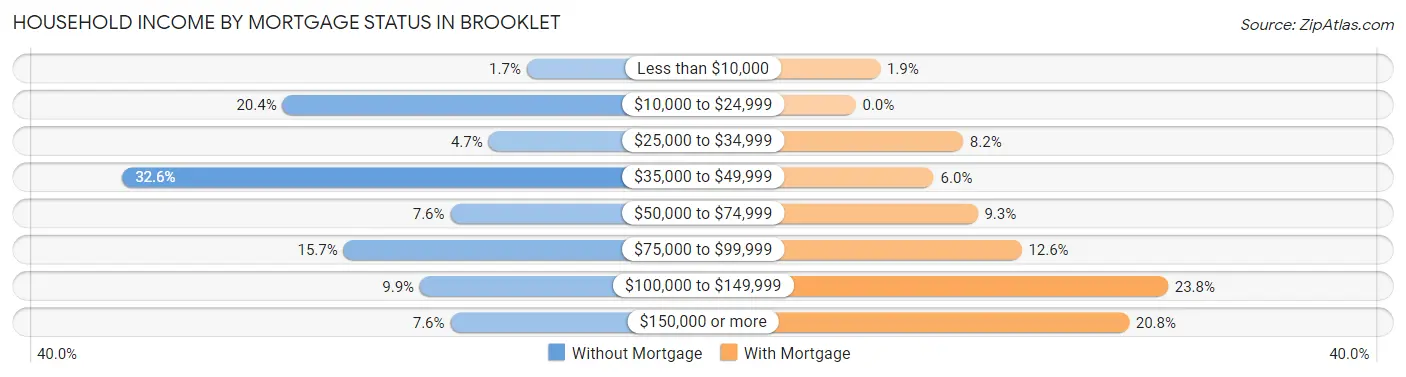
| Household Income | Without Mortgage | With Mortgage |
| Less than $10,000 | 3 (1.7%) | 5 (1.9%) |
| $10,000 to $24,999 | 35 (20.3%) | 0 (0.0%) |
| $25,000 to $34,999 | 8 (4.6%) | 22 (8.2%) |
| $35,000 to $49,999 | 56 (32.6%) | 16 (5.9%) |
| $50,000 to $74,999 | 13 (7.6%) | 25 (9.3%) |
| $75,000 to $99,999 | 27 (15.7%) | 34 (12.6%) |
| $100,000 to $149,999 | 17 (9.9%) | 64 (23.8%) |
| $150,000 or more | 13 (7.6%) | 56 (20.8%) |
| Total | 172 (100.0%) | 269 (100.0%) |
Property Value to Household Income Ratio in Brooklet
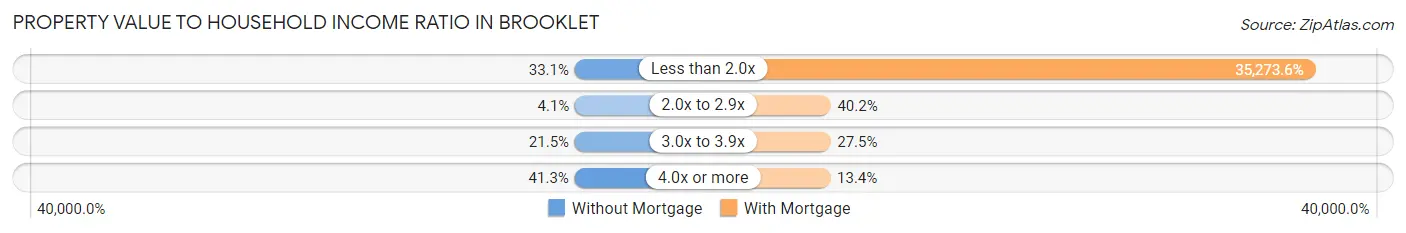
| Value-to-Income Ratio | Without Mortgage | With Mortgage |
| Less than 2.0x | 57 (33.1%) | 94,886 (35,273.6%) |
| 2.0x to 2.9x | 7 (4.1%) | 108 (40.2%) |
| 3.0x to 3.9x | 37 (21.5%) | 74 (27.5%) |
| 4.0x or more | 71 (41.3%) | 36 (13.4%) |
| Total | 172 (100.0%) | 269 (100.0%) |
Real Estate Taxes by Mortgage Status in Brooklet
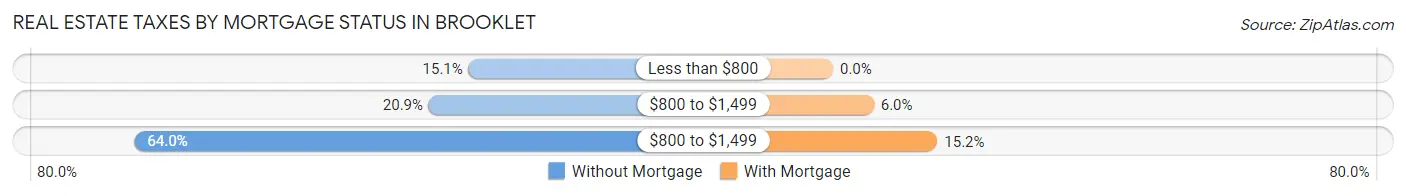
| Property Taxes | Without Mortgage | With Mortgage |
| Less than $800 | 26 (15.1%) | 0 (0.0%) |
| $800 to $1,499 | 36 (20.9%) | 16 (5.9%) |
| $800 to $1,499 | 110 (63.9%) | 41 (15.2%) |
| Total | 172 (100.0%) | 269 (100.0%) |
Health & Disability in Brooklet
Health Insurance Coverage by Age in Brooklet
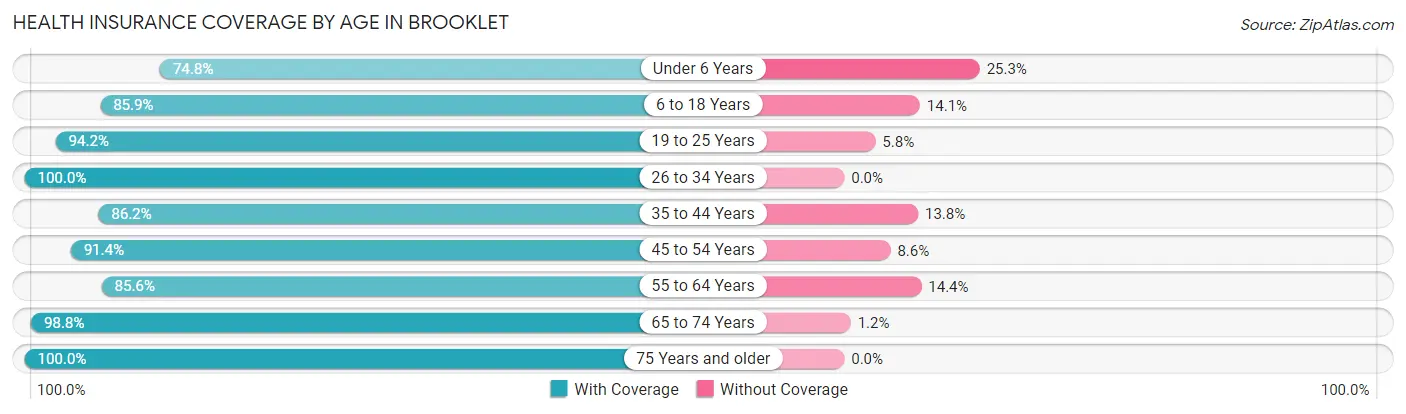
| Age Bracket | With Coverage | Without Coverage |
| Under 6 Years | 74 (74.8%) | 25 (25.3%) |
| 6 to 18 Years | 195 (85.9%) | 32 (14.1%) |
| 19 to 25 Years | 65 (94.2%) | 4 (5.8%) |
| 26 to 34 Years | 151 (100.0%) | 0 (0.0%) |
| 35 to 44 Years | 188 (86.2%) | 30 (13.8%) |
| 45 to 54 Years | 191 (91.4%) | 18 (8.6%) |
| 55 to 64 Years | 143 (85.6%) | 24 (14.4%) |
| 65 to 74 Years | 246 (98.8%) | 3 (1.2%) |
| 75 Years and older | 139 (100.0%) | 0 (0.0%) |
| Total | 1,392 (91.1%) | 136 (8.9%) |
Health Insurance Coverage by Citizenship Status in Brooklet
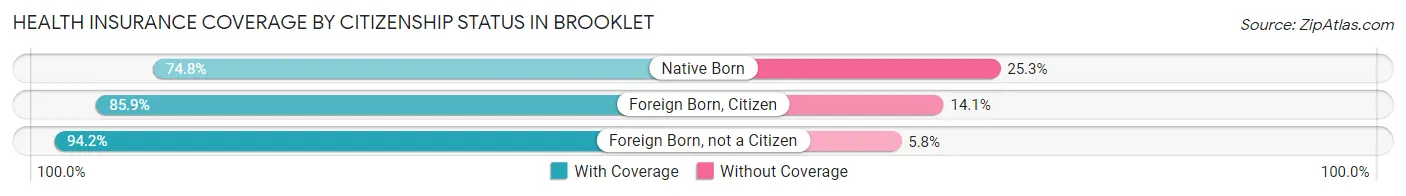
| Citizenship Status | With Coverage | Without Coverage |
| Native Born | 74 (74.8%) | 25 (25.3%) |
| Foreign Born, Citizen | 195 (85.9%) | 32 (14.1%) |
| Foreign Born, not a Citizen | 65 (94.2%) | 4 (5.8%) |
Health Insurance Coverage by Household Income in Brooklet
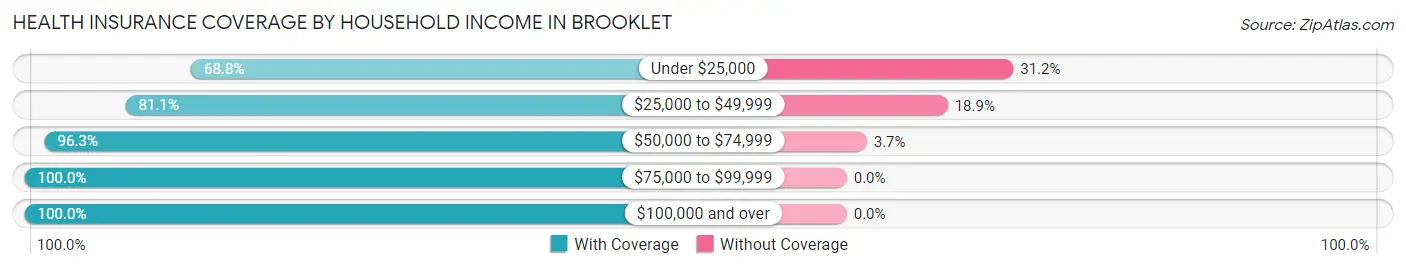
| Household Income | With Coverage | Without Coverage |
| Under $25,000 | 183 (68.8%) | 83 (31.2%) |
| $25,000 to $49,999 | 193 (81.1%) | 45 (18.9%) |
| $50,000 to $74,999 | 206 (96.3%) | 8 (3.7%) |
| $75,000 to $99,999 | 342 (100.0%) | 0 (0.0%) |
| $100,000 and over | 468 (100.0%) | 0 (0.0%) |
Public vs Private Health Insurance Coverage by Age in Brooklet
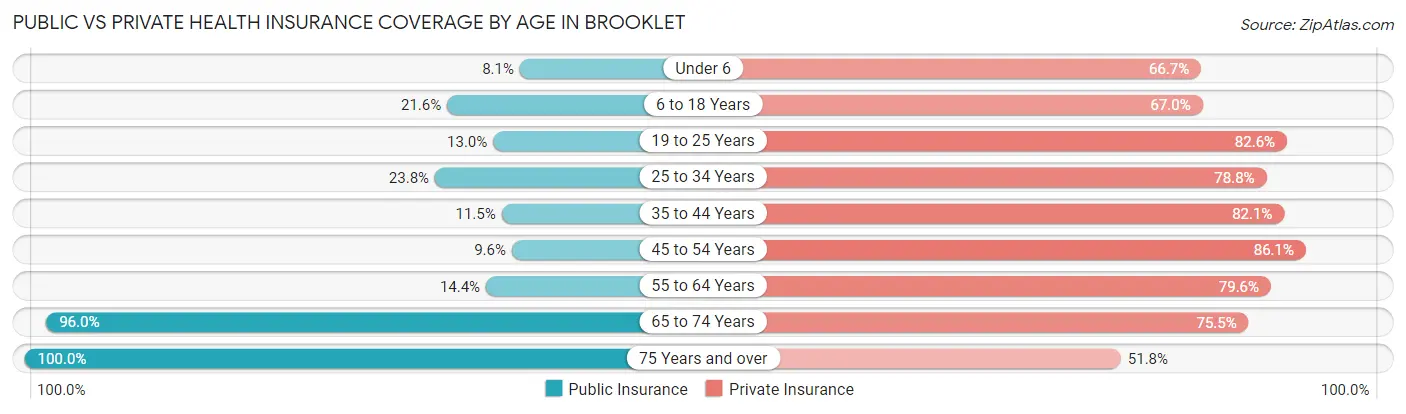
| Age Bracket | Public Insurance | Private Insurance |
| Under 6 | 8 (8.1%) | 66 (66.7%) |
| 6 to 18 Years | 49 (21.6%) | 152 (67.0%) |
| 19 to 25 Years | 9 (13.0%) | 57 (82.6%) |
| 25 to 34 Years | 36 (23.8%) | 119 (78.8%) |
| 35 to 44 Years | 25 (11.5%) | 179 (82.1%) |
| 45 to 54 Years | 20 (9.6%) | 180 (86.1%) |
| 55 to 64 Years | 24 (14.4%) | 133 (79.6%) |
| 65 to 74 Years | 239 (96.0%) | 188 (75.5%) |
| 75 Years and over | 139 (100.0%) | 72 (51.8%) |
| Total | 549 (35.9%) | 1,146 (75.0%) |
Disability Status by Sex by Age in Brooklet
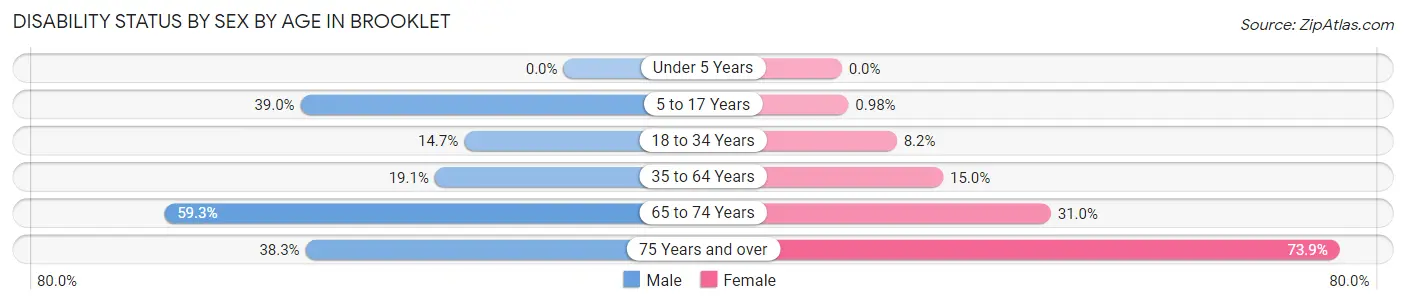
| Age Bracket | Male | Female |
| Under 5 Years | 0 (0.0%) | 0 (0.0%) |
| 5 to 17 Years | 57 (39.0%) | 1 (1.0%) |
| 18 to 34 Years | 14 (14.7%) | 11 (8.2%) |
| 35 to 64 Years | 55 (19.1%) | 46 (15.0%) |
| 65 to 74 Years | 96 (59.3%) | 27 (31.0%) |
| 75 Years and over | 18 (38.3%) | 68 (73.9%) |
Disability Class by Sex by Age in Brooklet
Disability Class: Hearing Difficulty
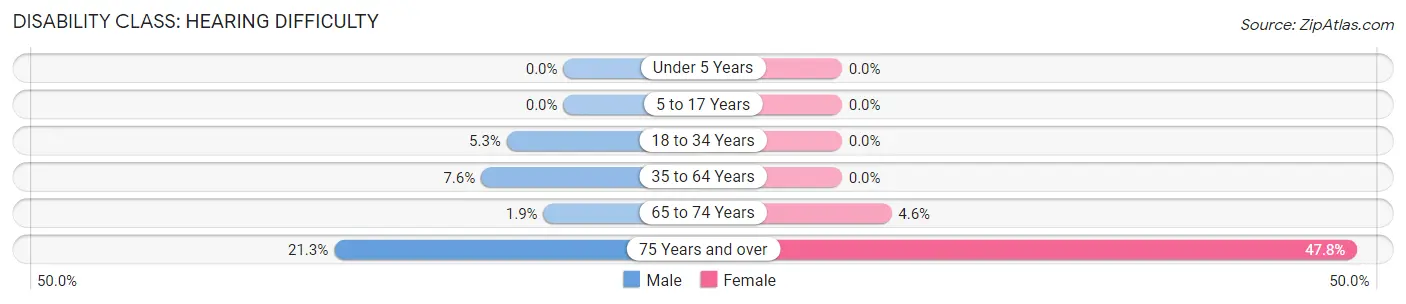
| Age Bracket | Male | Female |
| Under 5 Years | 0 (0.0%) | 0 (0.0%) |
| 5 to 17 Years | 0 (0.0%) | 0 (0.0%) |
| 18 to 34 Years | 5 (5.3%) | 0 (0.0%) |
| 35 to 64 Years | 22 (7.6%) | 0 (0.0%) |
| 65 to 74 Years | 3 (1.8%) | 4 (4.6%) |
| 75 Years and over | 10 (21.3%) | 44 (47.8%) |
Disability Class: Vision Difficulty
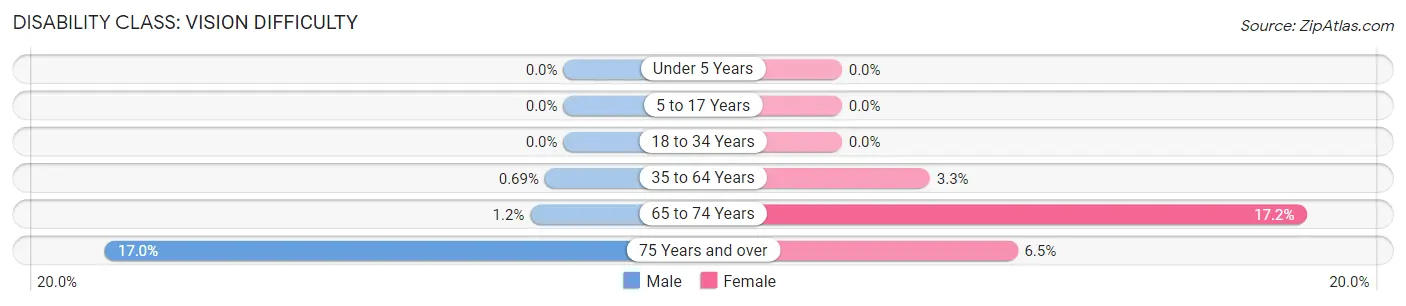
| Age Bracket | Male | Female |
| Under 5 Years | 0 (0.0%) | 0 (0.0%) |
| 5 to 17 Years | 0 (0.0%) | 0 (0.0%) |
| 18 to 34 Years | 0 (0.0%) | 0 (0.0%) |
| 35 to 64 Years | 2 (0.7%) | 10 (3.3%) |
| 65 to 74 Years | 2 (1.2%) | 15 (17.2%) |
| 75 Years and over | 8 (17.0%) | 6 (6.5%) |
Disability Class: Cognitive Difficulty
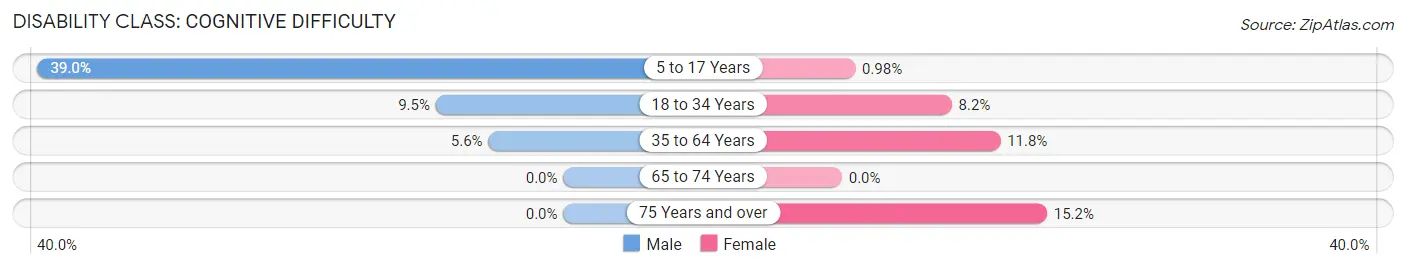
| Age Bracket | Male | Female |
| 5 to 17 Years | 57 (39.0%) | 1 (1.0%) |
| 18 to 34 Years | 9 (9.5%) | 11 (8.2%) |
| 35 to 64 Years | 16 (5.6%) | 36 (11.8%) |
| 65 to 74 Years | 0 (0.0%) | 0 (0.0%) |
| 75 Years and over | 0 (0.0%) | 14 (15.2%) |
Disability Class: Ambulatory Difficulty
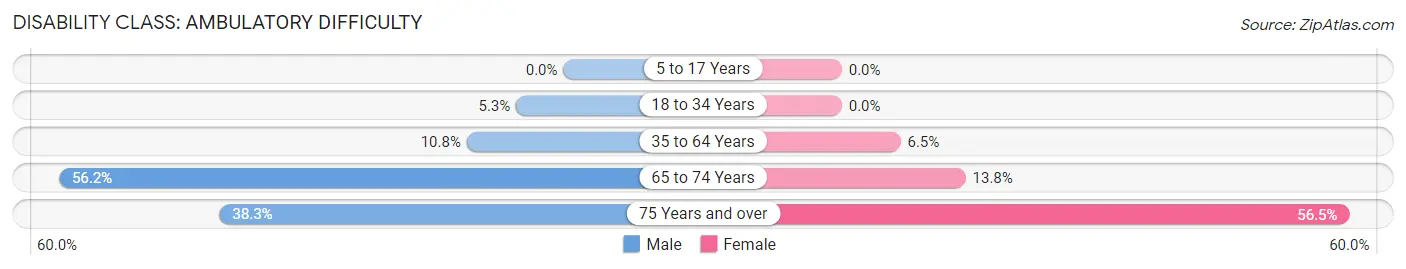
| Age Bracket | Male | Female |
| 5 to 17 Years | 0 (0.0%) | 0 (0.0%) |
| 18 to 34 Years | 5 (5.3%) | 0 (0.0%) |
| 35 to 64 Years | 31 (10.8%) | 20 (6.5%) |
| 65 to 74 Years | 91 (56.2%) | 12 (13.8%) |
| 75 Years and over | 18 (38.3%) | 52 (56.5%) |
Disability Class: Self-Care Difficulty
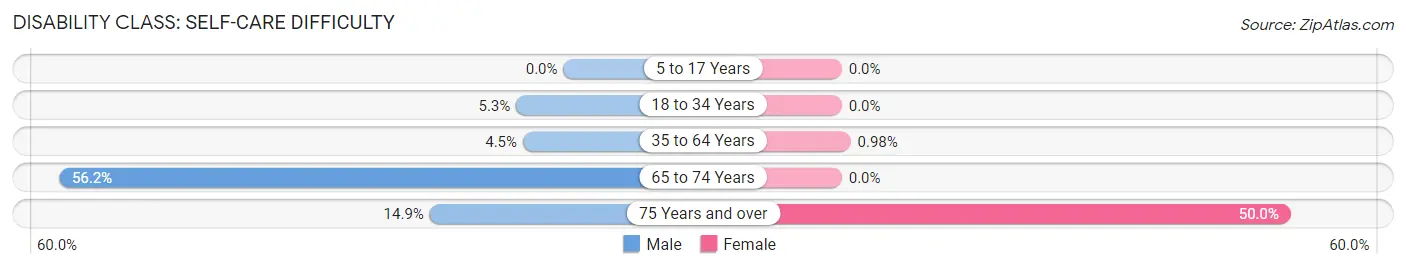
| Age Bracket | Male | Female |
| 5 to 17 Years | 0 (0.0%) | 0 (0.0%) |
| 18 to 34 Years | 5 (5.3%) | 0 (0.0%) |
| 35 to 64 Years | 13 (4.5%) | 3 (1.0%) |
| 65 to 74 Years | 91 (56.2%) | 0 (0.0%) |
| 75 Years and over | 7 (14.9%) | 46 (50.0%) |
Technology Access in Brooklet
Computing Device Access in Brooklet
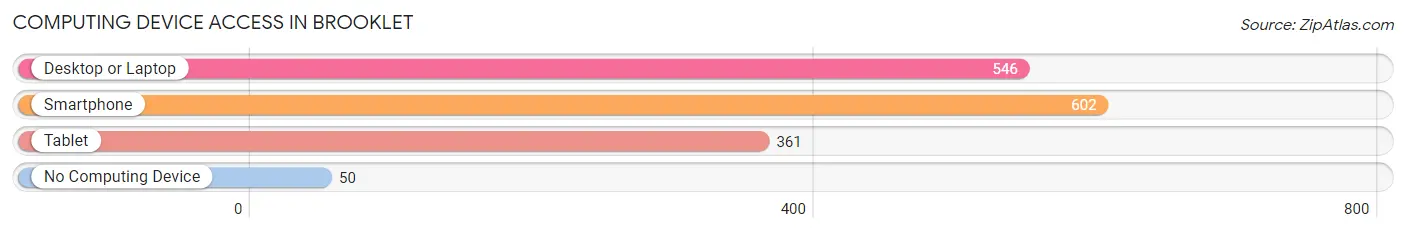
| Device Type | # Households | % Households |
| Desktop or Laptop | 546 | 81.0% |
| Smartphone | 602 | 89.3% |
| Tablet | 361 | 53.6% |
| No Computing Device | 50 | 7.4% |
| Total | 674 | 100.0% |
Internet Access in Brooklet
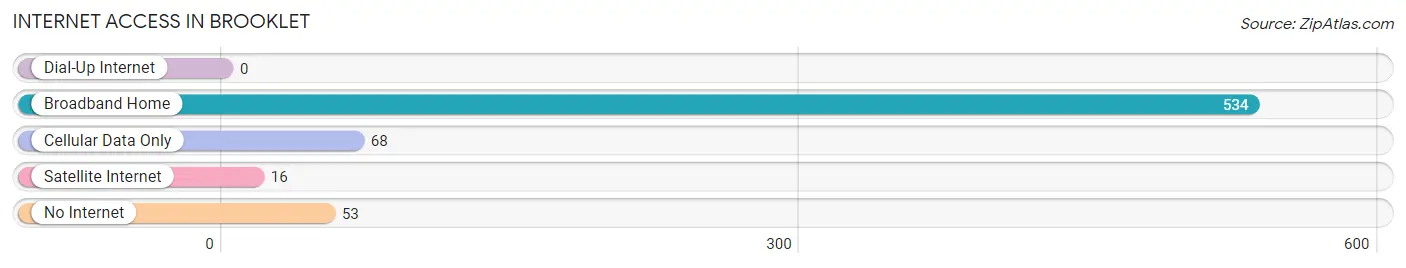
| Internet Type | # Households | % Households |
| Dial-Up Internet | 0 | 0.0% |
| Broadband Home | 534 | 79.2% |
| Cellular Data Only | 68 | 10.1% |
| Satellite Internet | 16 | 2.4% |
| No Internet | 53 | 7.9% |
| Total | 674 | 100.0% |
Brooklet Summary
Brooklet, Georgia is a small town located in Bulloch County, Georgia. It is situated in the southeastern part of the state, about 20 miles from the Atlantic Ocean. The town has a population of 1,845 people, according to the 2010 census.
History
The town of Brooklet was founded in 1891 by a group of settlers from the nearby town of Statesboro. The town was named after a nearby creek, which was named after a local Native American chief. The town was incorporated in 1895.
In the early 1900s, Brooklet was a thriving agricultural community. Cotton was the main crop grown in the area, and the town was home to several cotton gins. The town also had a sawmill, a grist mill, and a brickyard.
In the 1950s, the town began to experience a decline in population as people moved away to larger cities. The decline continued until the late 1990s, when the town began to experience a resurgence.
Geography
Brooklet is located in Bulloch County, Georgia. It is situated in the southeastern part of the state, about 20 miles from the Atlantic Ocean. The town is located on the Ogeechee River, which flows through the town.
The town is located in a rural area, and is surrounded by farmland. The town is located near several state parks, including the Ogeechee River State Park and the Georgia Southern University Nature Preserve.
Economy
The economy of Brooklet is largely based on agriculture. The town is home to several farms, which produce a variety of crops, including cotton, corn, soybeans, and peanuts. The town is also home to several small businesses, including restaurants, retail stores, and service providers.
The town is also home to several manufacturing companies, including a paper mill and a furniture factory. The town is also home to several trucking companies, which provide transportation services to the surrounding area.
Demographics
According to the 2010 census, the population of Brooklet was 1,845 people. The town is predominantly white, with a population that is 97.3% white. The town is also home to a small African American population, which makes up 1.7% of the population.
The median household income in Brooklet is $37,917, which is lower than the national average. The median age in the town is 38.7 years, which is slightly higher than the national average.
Conclusion
Brooklet, Georgia is a small town located in Bulloch County, Georgia. It is situated in the southeastern part of the state, about 20 miles from the Atlantic Ocean. The town has a population of 1,845 people, according to the 2010 census. The town is predominantly white, with a population that is 97.3% white. The economy of Brooklet is largely based on agriculture, and the town is home to several small businesses. The median household income in Brooklet is $37,917, which is lower than the national average.
Common Questions
What is Per Capita Income in Brooklet?
Per Capita income in Brooklet is $32,469.
What is the Median Family Income in Brooklet?
Median Family Income in Brooklet is $83,472.
What is the Median Household income in Brooklet?
Median Household Income in Brooklet is $63,462.
What is Income or Wage Gap in Brooklet?
Income or Wage Gap in Brooklet is 44.3%.
Women in Brooklet earn 55.7 cents for every dollar earned by a man.
What is Inequality or Gini Index in Brooklet?
Inequality or Gini Index in Brooklet is 0.46.
What is the Total Population of Brooklet?
Total Population of Brooklet is 1,528.
What is the Total Male Population of Brooklet?
Total Male Population of Brooklet is 764.
What is the Total Female Population of Brooklet?
Total Female Population of Brooklet is 764.
What is the Ratio of Males per 100 Females in Brooklet?
There are 100.00 Males per 100 Females in Brooklet.
What is the Ratio of Females per 100 Males in Brooklet?
There are 100.00 Females per 100 Males in Brooklet.
What is the Median Population Age in Brooklet?
Median Population Age in Brooklet is 45.0 Years.
What is the Average Family Size in Brooklet
Average Family Size in Brooklet is 3.0 People.
What is the Average Household Size in Brooklet
Average Household Size in Brooklet is 2.3 People.
How Large is the Labor Force in Brooklet?
There are 712 People in the Labor Forcein in Brooklet.
What is the Percentage of People in the Labor Force in Brooklet?
56.8% of People are in the Labor Force in Brooklet.
What is the Unemployment Rate in Brooklet?
Unemployment Rate in Brooklet is 0.3%.