Norman Park, GA Map & Demographics
Norman Park Map
Norman Park Overview
$22,817
PER CAPITA INCOME
$67,684
AVG FAMILY INCOME
$53,833
AVG HOUSEHOLD INCOME
28.2%
WAGE / INCOME GAP [ % ]
71.8¢/ $1
WAGE / INCOME GAP [ $ ]
0.37
INEQUALITY / GINI INDEX
1,121
TOTAL POPULATION
585
MALE POPULATION
536
FEMALE POPULATION
109.14
MALES / 100 FEMALES
91.62
FEMALES / 100 MALES
36.9
MEDIAN AGE
3.4
AVG FAMILY SIZE
2.8
AVG HOUSEHOLD SIZE
512
LABOR FORCE [ PEOPLE ]
59.0%
PERCENT IN LABOR FORCE
6.3%
UNEMPLOYMENT RATE
Norman Park Zip Codes
Norman Park Area Codes
Income in Norman Park
Income Overview in Norman Park
Per Capita Income in Norman Park is $22,817, while median incomes of families and households are $67,684 and $53,833 respectively.
| Characteristic | Number | Measure |
| Per Capita Income | 1,121 | $22,817 |
| Median Family Income | 261 | $67,684 |
| Mean Family Income | 261 | $63,925 |
| Median Household Income | 402 | $53,833 |
| Mean Household Income | 402 | $56,067 |
| Income Deficit | 261 | $0 |
| Wage / Income Gap (%) | 1,121 | 28.18% |
| Wage / Income Gap ($) | 1,121 | 71.82¢ per $1 |
| Gini / Inequality Index | 1,121 | 0.37 |
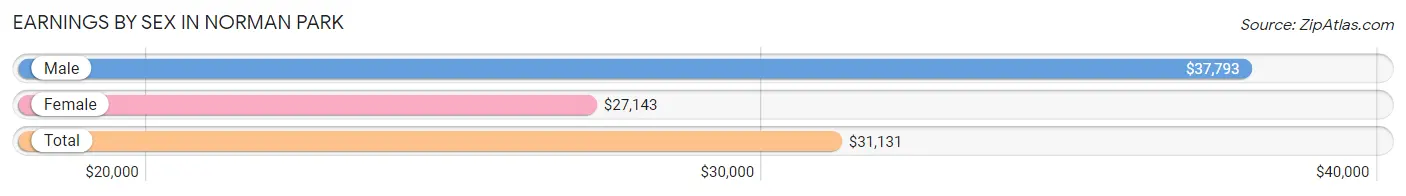
Earnings by Sex in Norman Park
Average Earnings in Norman Park are $31,131, $37,793 for men and $27,143 for women, a difference of 28.2%.
| Sex | Number | Average Earnings |
| Male | 303 (56.4%) | $37,793 |
| Female | 234 (43.6%) | $27,143 |
| Total | 537 (100.0%) | $31,131 |
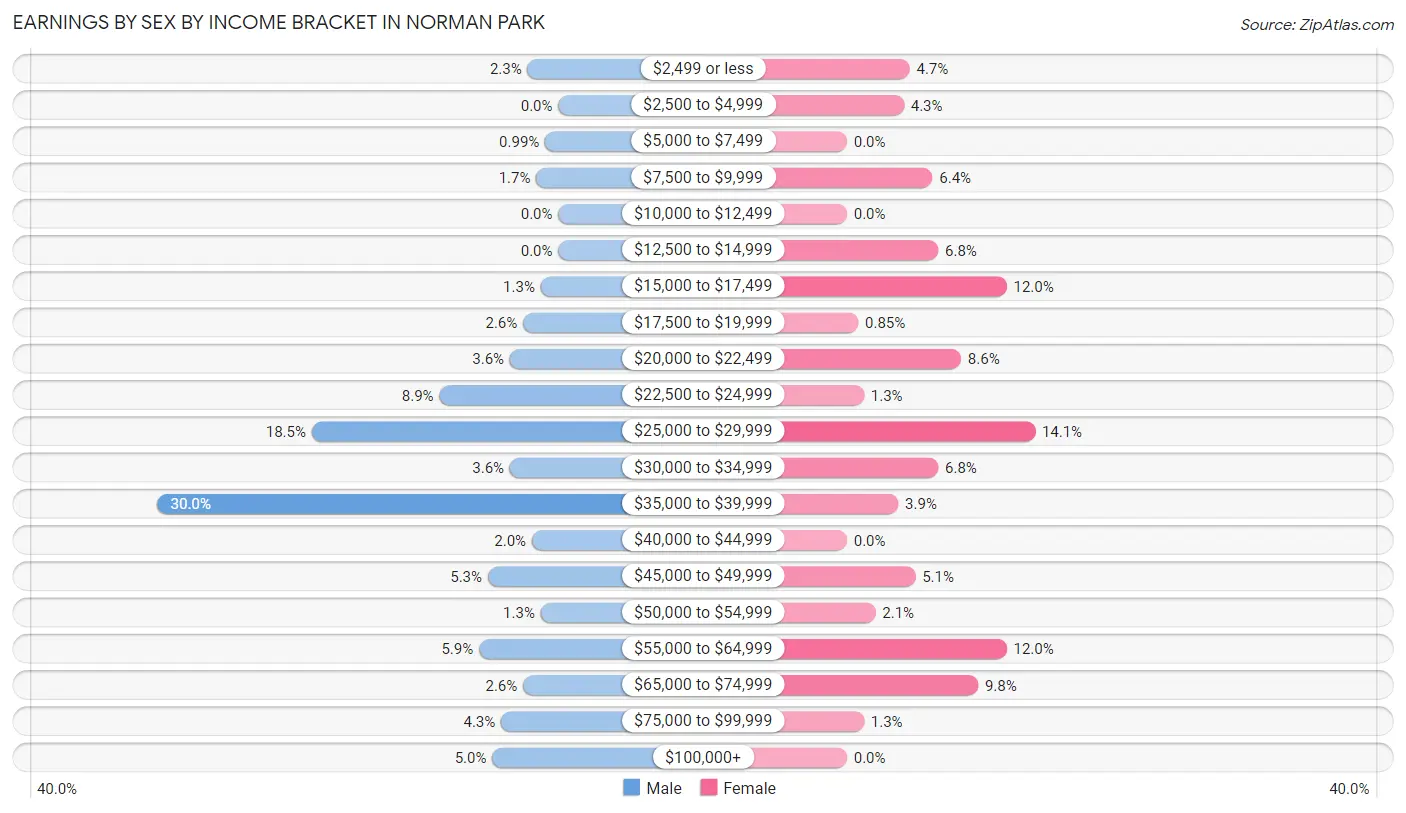
Earnings by Sex by Income Bracket in Norman Park
The most common earnings brackets in Norman Park are $35,000 to $39,999 for men (91 | 30.0%) and $25,000 to $29,999 for women (33 | 14.1%).
| Income | Male | Female |
| $2,499 or less | 7 (2.3%) | 11 (4.7%) |
| $2,500 to $4,999 | 0 (0.0%) | 10 (4.3%) |
| $5,000 to $7,499 | 3 (1.0%) | 0 (0.0%) |
| $7,500 to $9,999 | 5 (1.7%) | 15 (6.4%) |
| $10,000 to $12,499 | 0 (0.0%) | 0 (0.0%) |
| $12,500 to $14,999 | 0 (0.0%) | 16 (6.8%) |
| $15,000 to $17,499 | 4 (1.3%) | 28 (12.0%) |
| $17,500 to $19,999 | 8 (2.6%) | 2 (0.9%) |
| $20,000 to $22,499 | 11 (3.6%) | 20 (8.6%) |
| $22,500 to $24,999 | 27 (8.9%) | 3 (1.3%) |
| $25,000 to $29,999 | 56 (18.5%) | 33 (14.1%) |
| $30,000 to $34,999 | 11 (3.6%) | 16 (6.8%) |
| $35,000 to $39,999 | 91 (30.0%) | 9 (3.8%) |
| $40,000 to $44,999 | 6 (2.0%) | 0 (0.0%) |
| $45,000 to $49,999 | 16 (5.3%) | 12 (5.1%) |
| $50,000 to $54,999 | 4 (1.3%) | 5 (2.1%) |
| $55,000 to $64,999 | 18 (5.9%) | 28 (12.0%) |
| $65,000 to $74,999 | 8 (2.6%) | 23 (9.8%) |
| $75,000 to $99,999 | 13 (4.3%) | 3 (1.3%) |
| $100,000+ | 15 (5.0%) | 0 (0.0%) |
| Total | 303 (100.0%) | 234 (100.0%) |
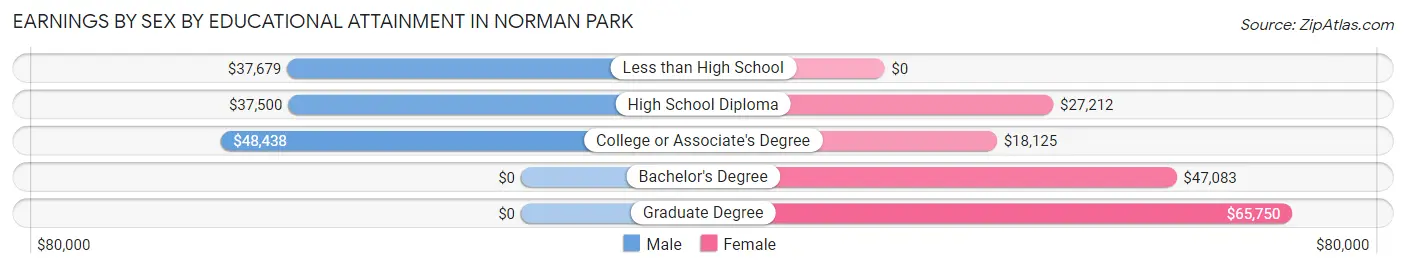
Earnings by Sex by Educational Attainment in Norman Park
Average earnings in Norman Park are $37,944 for men and $27,143 for women, a difference of 28.5%. Men with an educational attainment of college or associate's degree enjoy the highest average annual earnings of $48,438, while those with high school diploma education earn the least with $37,500. Women with an educational attainment of graduate degree earn the most with the average annual earnings of $65,750, while those with college or associate's degree education have the smallest earnings of $18,125.
| Educational Attainment | Male Income | Female Income |
| Less than High School | $37,679 | $0 |
| High School Diploma | $37,500 | $27,212 |
| College or Associate's Degree | $48,438 | $18,125 |
| Bachelor's Degree | - | - |
| Graduate Degree | - | - |
| Total | $37,944 | $27,143 |
Family Income in Norman Park
Family Income Brackets in Norman Park
According to the Norman Park family income data, there are 65 families falling into the $50,000 to $74,999 income range, which is the most common income bracket and makes up 24.9% of all families.
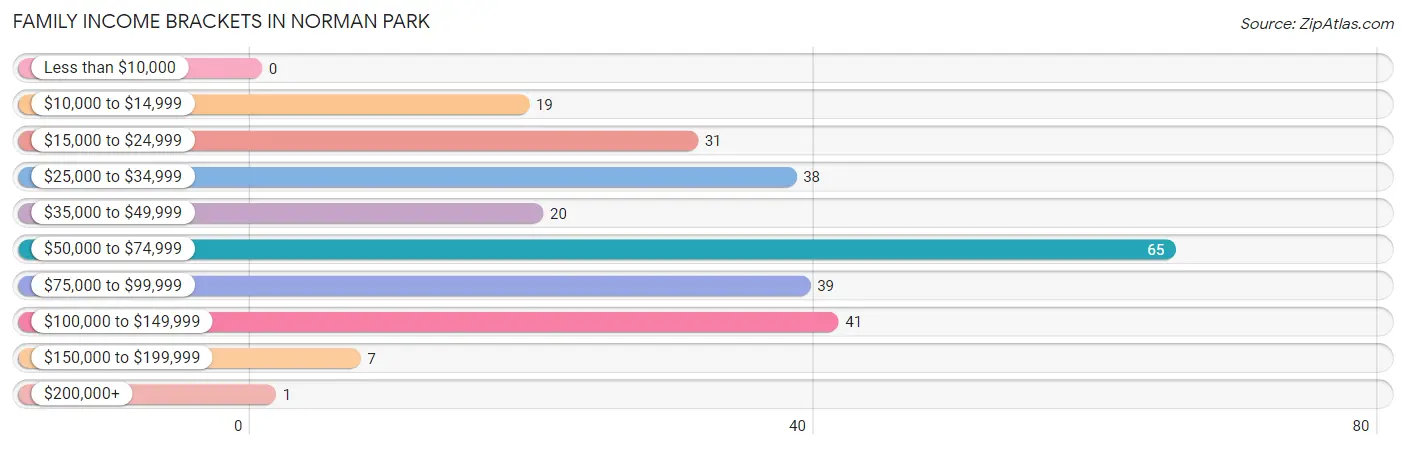
| Income Bracket | # Families | % Families |
| Less than $10,000 | 0 | 0.0% |
| $10,000 to $14,999 | 19 | 7.3% |
| $15,000 to $24,999 | 31 | 11.9% |
| $25,000 to $34,999 | 38 | 14.6% |
| $35,000 to $49,999 | 20 | 7.7% |
| $50,000 to $74,999 | 65 | 24.9% |
| $75,000 to $99,999 | 39 | 14.9% |
| $100,000 to $149,999 | 41 | 15.7% |
| $150,000 to $199,999 | 7 | 2.7% |
| $200,000+ | 1 | 0.4% |
Family Income by Famaliy Size in Norman Park
4-person families (63 | 24.1%) account for the highest median family income in Norman Park with $69,013 per family, while 2-person families (108 | 41.4%) have the highest median income of $34,166 per family member.
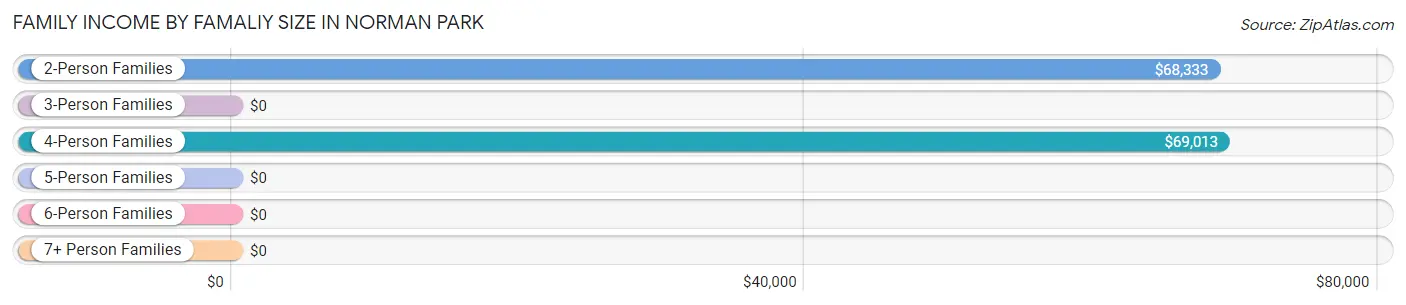
| Income Bracket | # Families | Median Income |
| 2-Person Families | 108 (41.4%) | $68,333 |
| 3-Person Families | 65 (24.9%) | $0 |
| 4-Person Families | 63 (24.1%) | $69,013 |
| 5-Person Families | 2 (0.8%) | $0 |
| 6-Person Families | 19 (7.3%) | $0 |
| 7+ Person Families | 4 (1.5%) | $0 |
| Total | 261 (100.0%) | $67,684 |
Family Income by Number of Earners in Norman Park
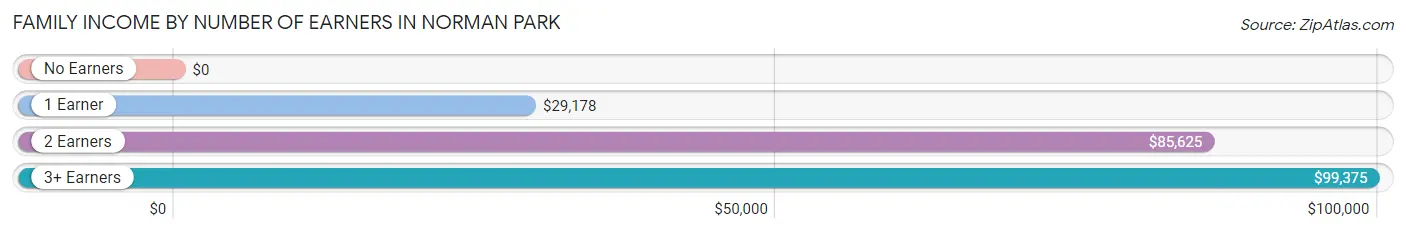
| Number of Earners | # Families | Median Income |
| No Earners | 21 (8.1%) | $0 |
| 1 Earner | 129 (49.4%) | $29,178 |
| 2 Earners | 97 (37.2%) | $85,625 |
| 3+ Earners | 14 (5.4%) | $99,375 |
| Total | 261 (100.0%) | $67,684 |
Household Income in Norman Park
Household Income Brackets in Norman Park
With 110 households falling in the category, the $50,000 to $74,999 income range is the most frequent in Norman Park, accounting for 27.4% of all households. In contrast, only 1 households (0.3%) fall into the $200,000+ income bracket, making it the least populous group.
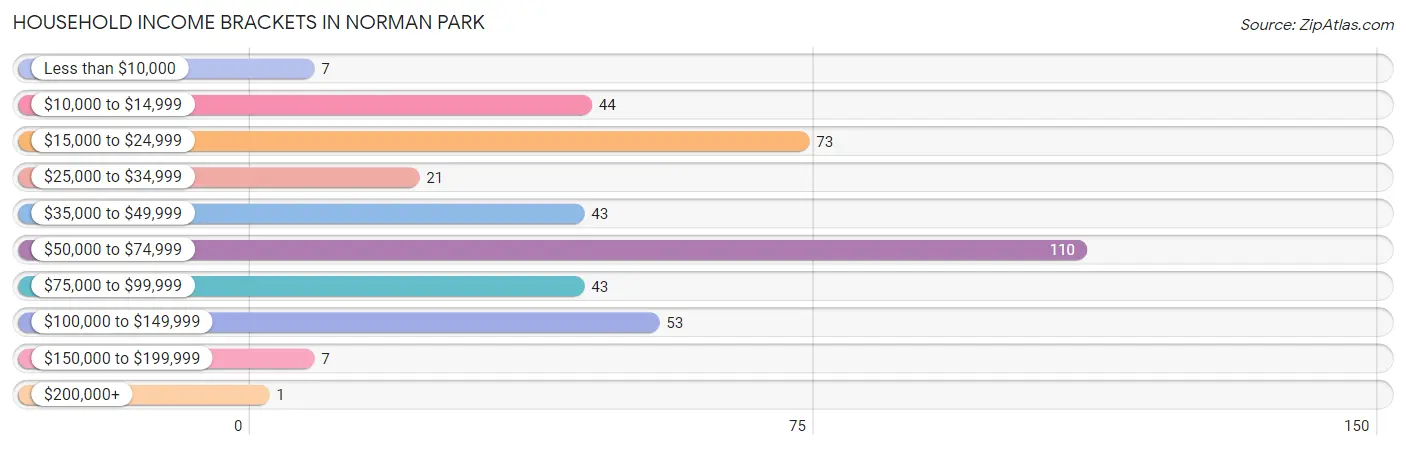
| Income Bracket | # Households | % Households |
| Less than $10,000 | 7 | 1.7% |
| $10,000 to $14,999 | 44 | 10.9% |
| $15,000 to $24,999 | 73 | 18.2% |
| $25,000 to $34,999 | 21 | 5.2% |
| $35,000 to $49,999 | 43 | 10.7% |
| $50,000 to $74,999 | 110 | 27.4% |
| $75,000 to $99,999 | 43 | 10.7% |
| $100,000 to $149,999 | 53 | 13.2% |
| $150,000 to $199,999 | 7 | 1.7% |
| $200,000+ | 1 | 0.2% |
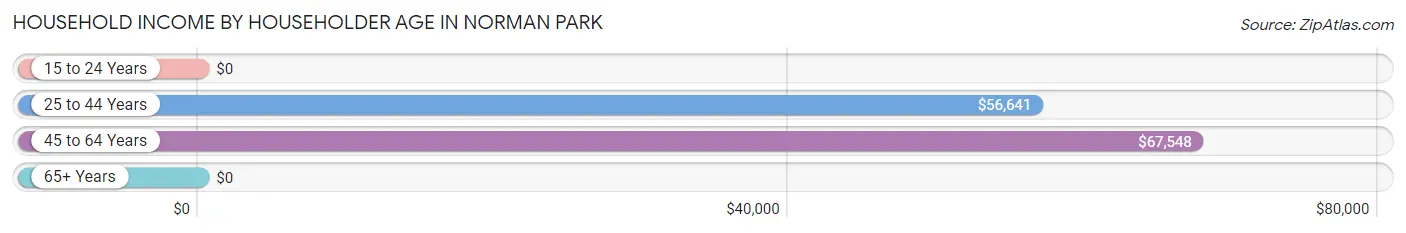
Household Income by Householder Age in Norman Park
The median household income in Norman Park is $53,833, with the highest median household income of $67,548 found in the 45 to 64 years age bracket for the primary householder. A total of 99 households (24.6%) fall into this category.
| Income Bracket | # Households | Median Income |
| 15 to 24 Years | 0 (0.0%) | $0 |
| 25 to 44 Years | 163 (40.6%) | $56,641 |
| 45 to 64 Years | 99 (24.6%) | $67,548 |
| 65+ Years | 140 (34.8%) | $0 |
| Total | 402 (100.0%) | $53,833 |
Poverty in Norman Park
Income Below Poverty by Sex and Age in Norman Park
With 25.0% poverty level for males and 22.0% for females among the residents of Norman Park, 16 and 17 year old males and 55 to 64 year old females are the most vulnerable to poverty, with 5 males (100.0%) and 40 females (62.5%) in their respective age groups living below the poverty level.
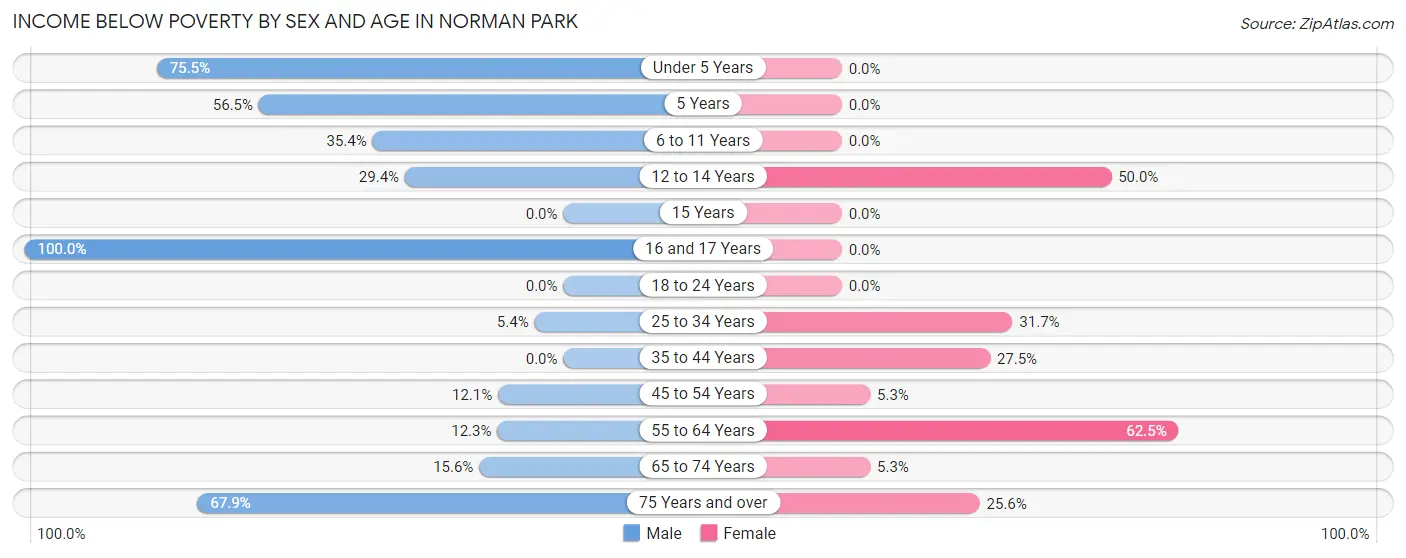
| Age Bracket | Male | Female |
| Under 5 Years | 40 (75.5%) | 0 (0.0%) |
| 5 Years | 13 (56.5%) | 0 (0.0%) |
| 6 to 11 Years | 17 (35.4%) | 0 (0.0%) |
| 12 to 14 Years | 10 (29.4%) | 10 (50.0%) |
| 15 Years | 0 (0.0%) | 0 (0.0%) |
| 16 and 17 Years | 5 (100.0%) | 0 (0.0%) |
| 18 to 24 Years | 0 (0.0%) | 0 (0.0%) |
| 25 to 34 Years | 3 (5.4%) | 38 (31.7%) |
| 35 to 44 Years | 0 (0.0%) | 11 (27.5%) |
| 45 to 54 Years | 4 (12.1%) | 5 (5.3%) |
| 55 to 64 Years | 13 (12.3%) | 40 (62.5%) |
| 65 to 74 Years | 5 (15.6%) | 3 (5.3%) |
| 75 Years and over | 36 (67.9%) | 11 (25.6%) |
| Total | 146 (25.0%) | 118 (22.0%) |
Income Above Poverty by Sex and Age in Norman Park
According to the poverty statistics in Norman Park, males aged 18 to 24 years and females aged under 5 years are the age groups that are most secure financially, with 100.0% of males and 100.0% of females in these age groups living above the poverty line.
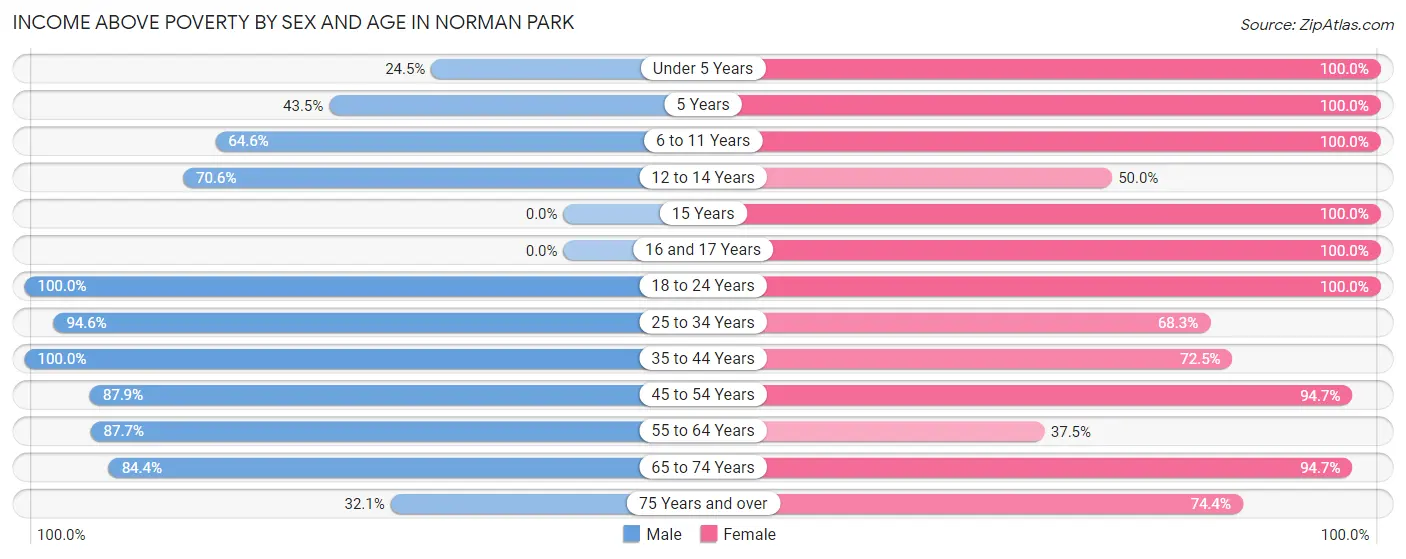
| Age Bracket | Male | Female |
| Under 5 Years | 13 (24.5%) | 34 (100.0%) |
| 5 Years | 10 (43.5%) | 11 (100.0%) |
| 6 to 11 Years | 31 (64.6%) | 21 (100.0%) |
| 12 to 14 Years | 24 (70.6%) | 10 (50.0%) |
| 15 Years | 0 (0.0%) | 9 (100.0%) |
| 16 and 17 Years | 0 (0.0%) | 12 (100.0%) |
| 18 to 24 Years | 67 (100.0%) | 10 (100.0%) |
| 25 to 34 Years | 53 (94.6%) | 82 (68.3%) |
| 35 to 44 Years | 75 (100.0%) | 29 (72.5%) |
| 45 to 54 Years | 29 (87.9%) | 90 (94.7%) |
| 55 to 64 Years | 93 (87.7%) | 24 (37.5%) |
| 65 to 74 Years | 27 (84.4%) | 54 (94.7%) |
| 75 Years and over | 17 (32.1%) | 32 (74.4%) |
| Total | 439 (75.0%) | 418 (78.0%) |
Income Below Poverty Among Married-Couple Families in Norman Park
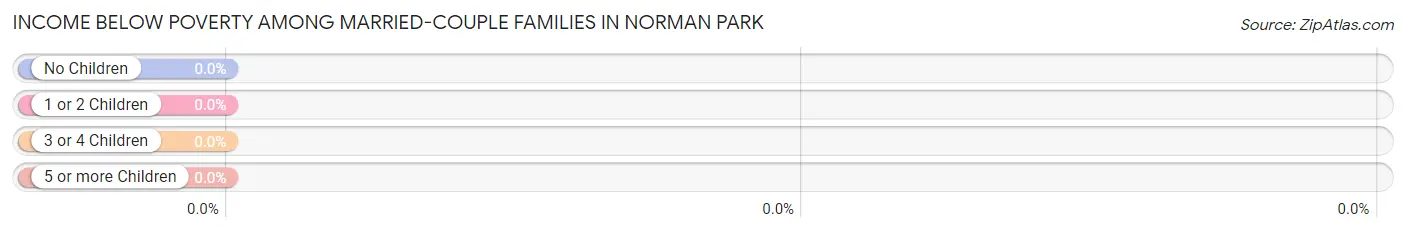
| Children | Above Poverty | Below Poverty |
| No Children | 58 (100.0%) | 0 (0.0%) |
| 1 or 2 Children | 25 (100.0%) | 0 (0.0%) |
| 3 or 4 Children | 2 (100.0%) | 0 (0.0%) |
| 5 or more Children | 0 (0.0%) | 0 (0.0%) |
| Total | 85 (100.0%) | 0 (0.0%) |
Income Below Poverty Among Single-Parent Households in Norman Park
According to the poverty data in Norman Park, 6.8% or 3 single-father households and 43.2% or 57 single-mother households are living below the poverty line. Among single-father households, those with 1 or 2 children have the highest poverty rate, with 3 households (9.1%) experiencing poverty. Likewise, among single-mother households, those with 1 or 2 children have the highest poverty rate, with 33 households (48.5%) falling below the poverty line.
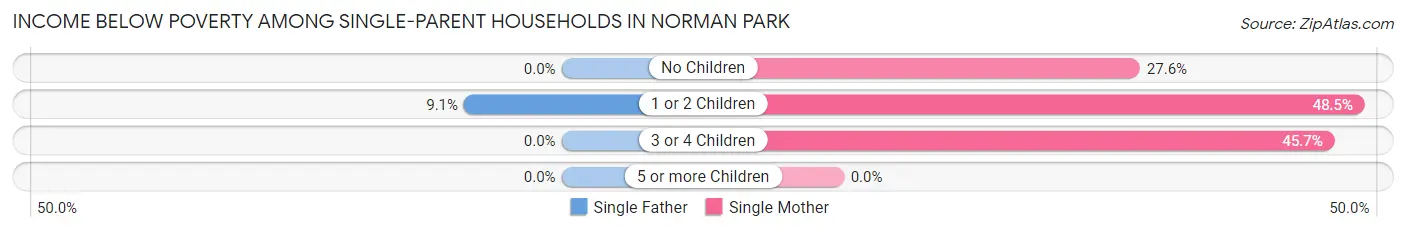
| Children | Single Father | Single Mother |
| No Children | 0 (0.0%) | 8 (27.6%) |
| 1 or 2 Children | 3 (9.1%) | 33 (48.5%) |
| 3 or 4 Children | 0 (0.0%) | 16 (45.7%) |
| 5 or more Children | 0 (0.0%) | 0 (0.0%) |
| Total | 3 (6.8%) | 57 (43.2%) |
Income Below Poverty Among Married-Couple vs Single-Parent Households in Norman Park
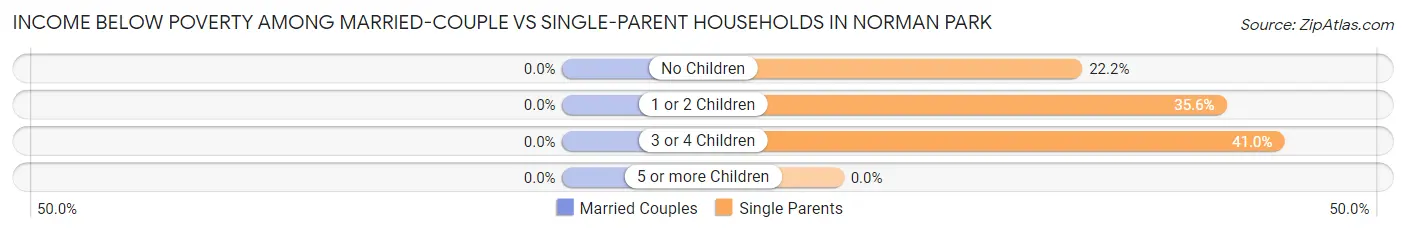
| Children | Married-Couple Families | Single-Parent Households |
| No Children | 0 (0.0%) | 8 (22.2%) |
| 1 or 2 Children | 0 (0.0%) | 36 (35.6%) |
| 3 or 4 Children | 0 (0.0%) | 16 (41.0%) |
| 5 or more Children | 0 (0.0%) | 0 (0.0%) |
| Total | 0 (0.0%) | 60 (34.1%) |
Race in Norman Park
The most populous races in Norman Park are White / Caucasian (730 | 65.1%), Black / African American (304 | 27.1%), and Two or more Races (83 | 7.4%).
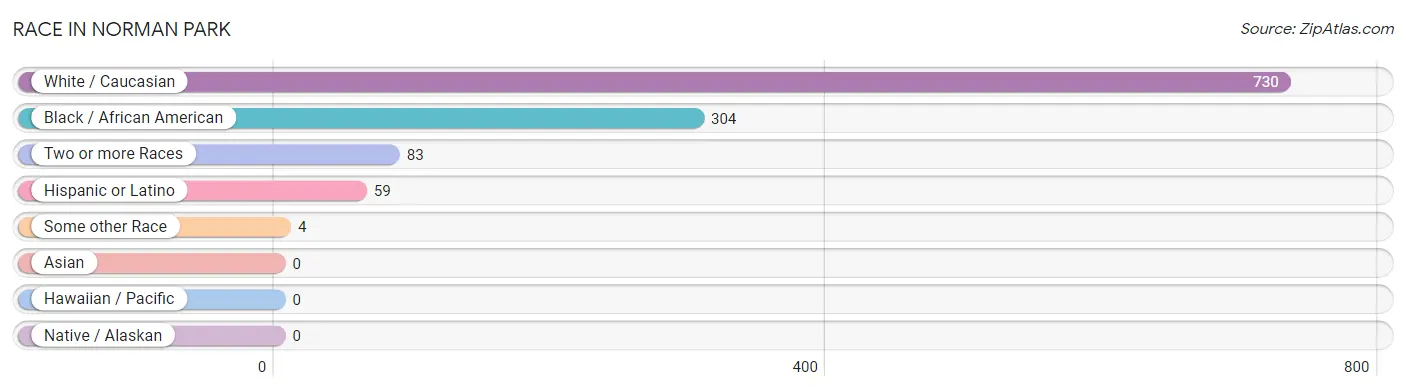
| Race | # Population | % Population |
| Asian | 0 | 0.0% |
| Black / African American | 304 | 27.1% |
| Hawaiian / Pacific | 0 | 0.0% |
| Hispanic or Latino | 59 | 5.3% |
| Native / Alaskan | 0 | 0.0% |
| White / Caucasian | 730 | 65.1% |
| Two or more Races | 83 | 7.4% |
| Some other Race | 4 | 0.4% |
| Total | 1,121 | 100.0% |
Ancestry in Norman Park
The most populous ancestries reported in Norman Park are American (250 | 22.3%), English (51 | 4.5%), Irish (43 | 3.8%), Mexican (42 | 3.7%), and German (41 | 3.7%), together accounting for 38.1% of all Norman Park residents.
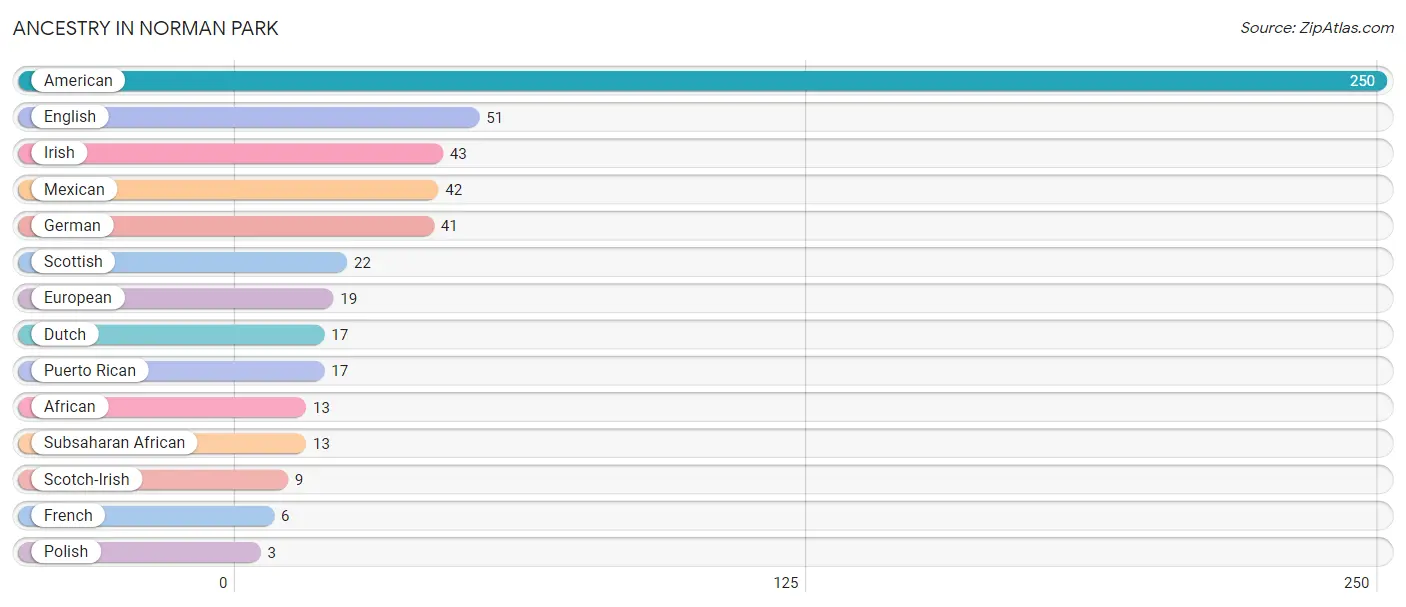
| Ancestry | # Population | % Population |
| African | 13 | 1.2% |
| American | 250 | 22.3% |
| Dutch | 17 | 1.5% |
| English | 51 | 4.5% |
| European | 19 | 1.7% |
| French | 6 | 0.5% |
| German | 41 | 3.7% |
| Irish | 43 | 3.8% |
| Mexican | 42 | 3.7% |
| Polish | 3 | 0.3% |
| Puerto Rican | 17 | 1.5% |
| Scotch-Irish | 9 | 0.8% |
| Scottish | 22 | 2.0% |
| Subsaharan African | 13 | 1.2% | View All 14 Rows |
Immigrants in Norman Park
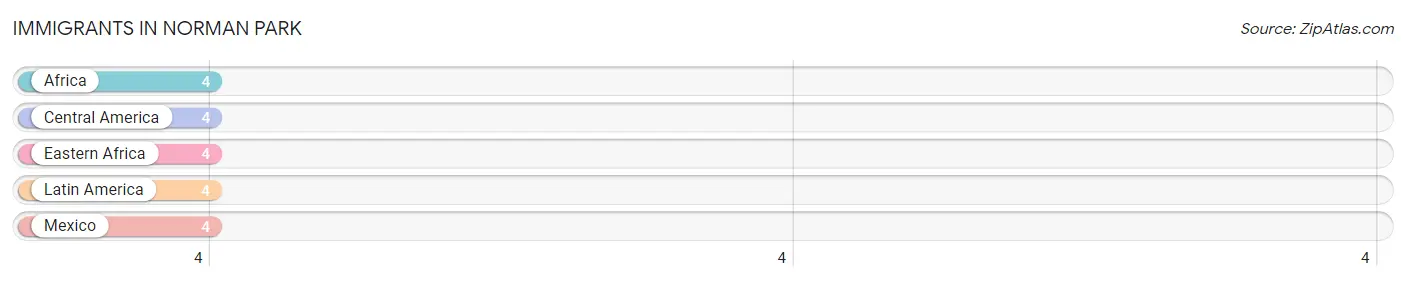
The most numerous immigrant groups reported in Norman Park came from Africa (4 | 0.4%), Central America (4 | 0.4%), Eastern Africa (4 | 0.4%), Latin America (4 | 0.4%), and Mexico (4 | 0.4%), together accounting for 1.8% of all Norman Park residents.
| Immigration Origin | # Population | % Population |
| Africa | 4 | 0.4% |
| Central America | 4 | 0.4% |
| Eastern Africa | 4 | 0.4% |
| Latin America | 4 | 0.4% |
| Mexico | 4 | 0.4% | View All 5 Rows |
Sex and Age in Norman Park
Sex and Age in Norman Park
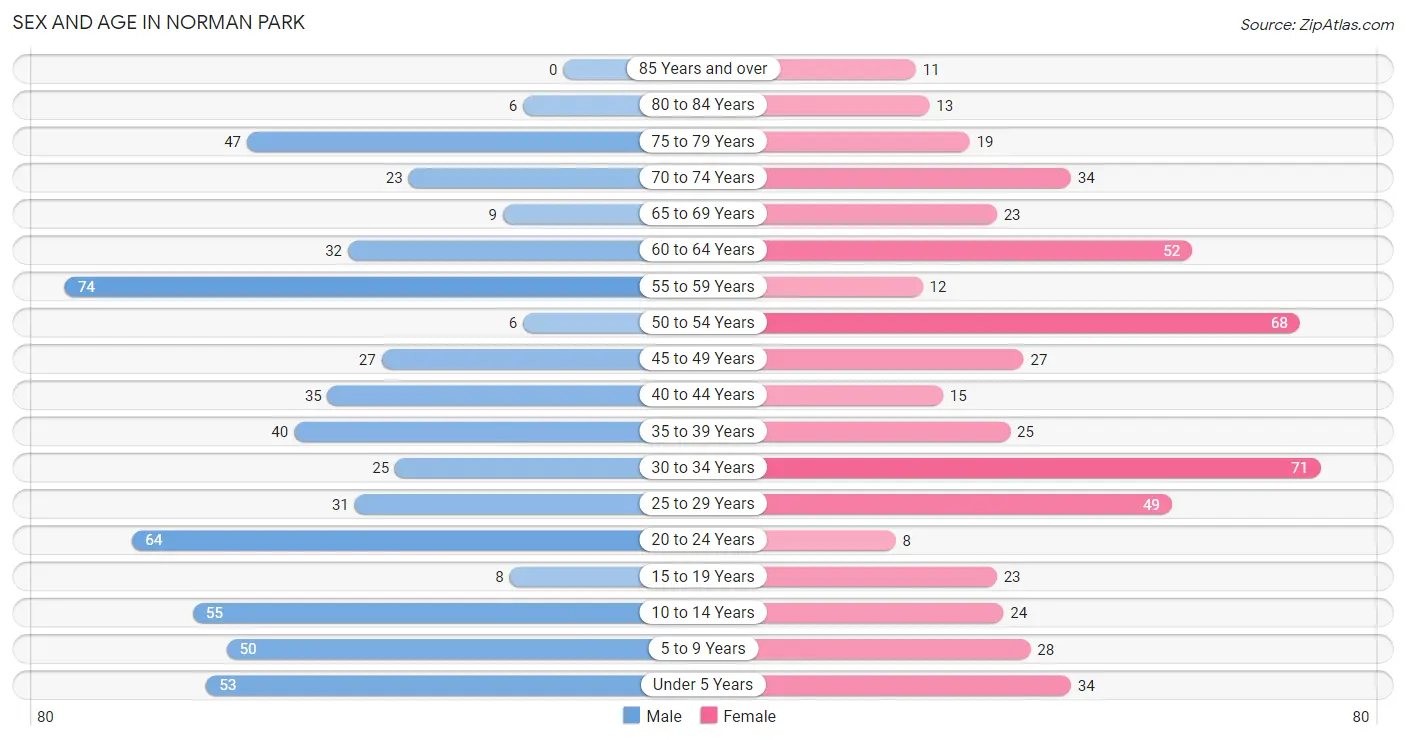
The most populous age groups in Norman Park are 55 to 59 Years (74 | 12.7%) for men and 30 to 34 Years (71 | 13.3%) for women.
| Age Bracket | Male | Female |
| Under 5 Years | 53 (9.1%) | 34 (6.3%) |
| 5 to 9 Years | 50 (8.6%) | 28 (5.2%) |
| 10 to 14 Years | 55 (9.4%) | 24 (4.5%) |
| 15 to 19 Years | 8 (1.4%) | 23 (4.3%) |
| 20 to 24 Years | 64 (10.9%) | 8 (1.5%) |
| 25 to 29 Years | 31 (5.3%) | 49 (9.1%) |
| 30 to 34 Years | 25 (4.3%) | 71 (13.3%) |
| 35 to 39 Years | 40 (6.8%) | 25 (4.7%) |
| 40 to 44 Years | 35 (6.0%) | 15 (2.8%) |
| 45 to 49 Years | 27 (4.6%) | 27 (5.0%) |
| 50 to 54 Years | 6 (1.0%) | 68 (12.7%) |
| 55 to 59 Years | 74 (12.7%) | 12 (2.2%) |
| 60 to 64 Years | 32 (5.5%) | 52 (9.7%) |
| 65 to 69 Years | 9 (1.5%) | 23 (4.3%) |
| 70 to 74 Years | 23 (3.9%) | 34 (6.3%) |
| 75 to 79 Years | 47 (8.0%) | 19 (3.5%) |
| 80 to 84 Years | 6 (1.0%) | 13 (2.4%) |
| 85 Years and over | 0 (0.0%) | 11 (2.1%) |
| Total | 585 (100.0%) | 536 (100.0%) |
Families and Households in Norman Park
Median Family Size in Norman Park
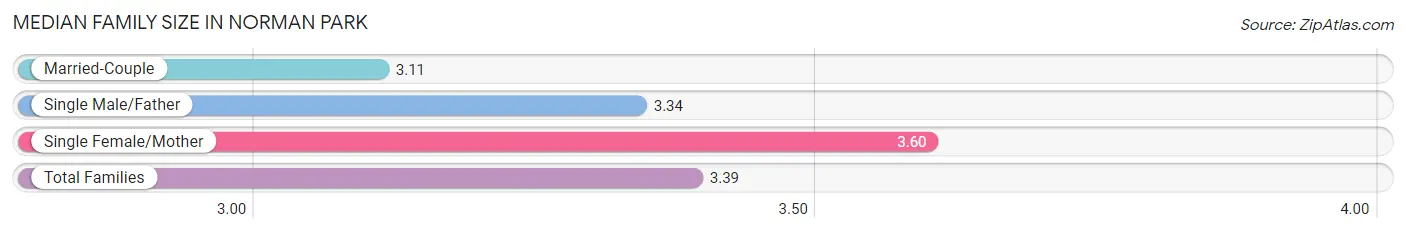
The median family size in Norman Park is 3.39 persons per family, with single female/mother families (132 | 50.6%) accounting for the largest median family size of 3.6 persons per family. On the other hand, married-couple families (85 | 32.6%) represent the smallest median family size with 3.11 persons per family.
| Family Type | # Families | Family Size |
| Married-Couple | 85 (32.6%) | 3.11 |
| Single Male/Father | 44 (16.9%) | 3.34 |
| Single Female/Mother | 132 (50.6%) | 3.60 |
| Total Families | 261 (100.0%) | 3.39 |
Median Household Size in Norman Park
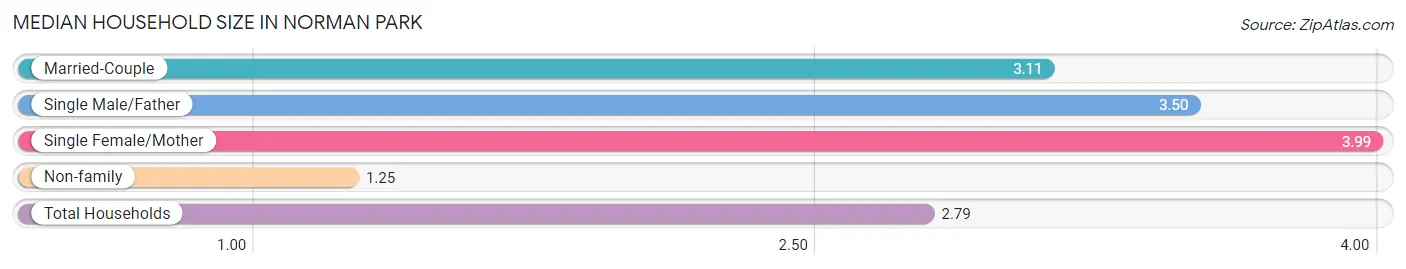
The median household size in Norman Park is 2.79 persons per household, with single female/mother households (132 | 32.8%) accounting for the largest median household size of 3.99 persons per household. non-family households (141 | 35.1%) represent the smallest median household size with 1.25 persons per household.
| Household Type | # Households | Household Size |
| Married-Couple | 85 (21.1%) | 3.11 |
| Single Male/Father | 44 (11.0%) | 3.50 |
| Single Female/Mother | 132 (32.8%) | 3.99 |
| Non-family | 141 (35.1%) | 1.25 |
| Total Households | 402 (100.0%) | 2.79 |
Household Size by Marriage Status in Norman Park
Out of a total of 402 households in Norman Park, 261 (64.9%) are family households, while 141 (35.1%) are nonfamily households. The most numerous type of family households are 2-person households, comprising 97, and the most common type of nonfamily households are 1-person households, comprising 96.
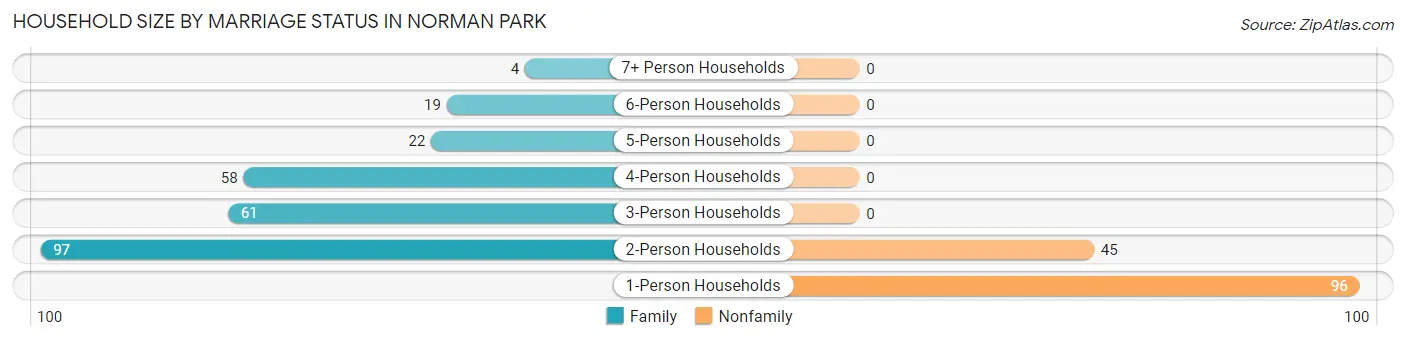
| Household Size | Family Households | Nonfamily Households |
| 1-Person Households | - | 96 (23.9%) |
| 2-Person Households | 97 (24.1%) | 45 (11.2%) |
| 3-Person Households | 61 (15.2%) | 0 (0.0%) |
| 4-Person Households | 58 (14.4%) | 0 (0.0%) |
| 5-Person Households | 22 (5.5%) | 0 (0.0%) |
| 6-Person Households | 19 (4.7%) | 0 (0.0%) |
| 7+ Person Households | 4 (1.0%) | 0 (0.0%) |
| Total | 261 (64.9%) | 141 (35.1%) |
Female Fertility in Norman Park
Fertility by Age in Norman Park
Average fertility rate in Norman Park is 22.0 births per 1,000 women. Women in the age bracket of 20 to 34 years have the highest fertility rate with 47.0 births per 1,000 women. Women in the age bracket of 20 to 34 years acount for 100.0% of all women with births.
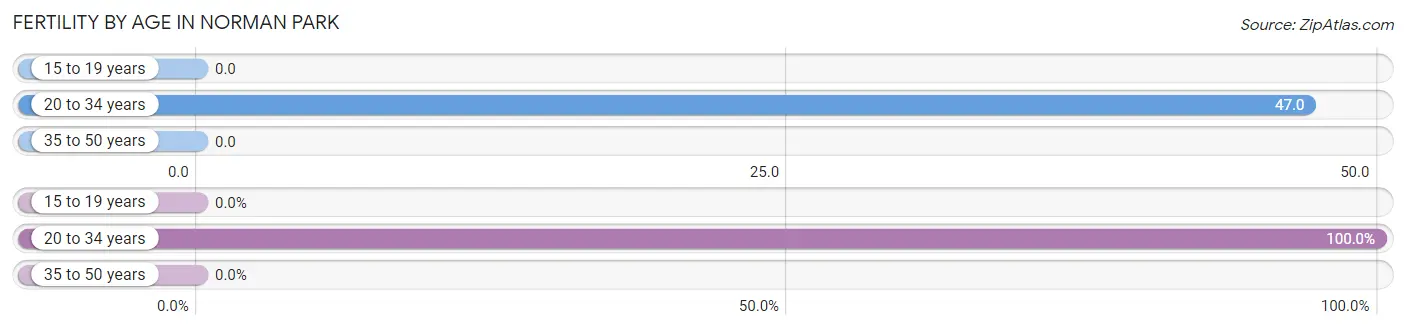
| Age Bracket | Women with Births | Births / 1,000 Women |
| 15 to 19 years | 0 (0.0%) | 0.0 |
| 20 to 34 years | 6 (100.0%) | 47.0 |
| 35 to 50 years | 0 (0.0%) | 0.0 |
| Total | 6 (100.0%) | 22.0 |
Fertility by Age by Marriage Status in Norman Park
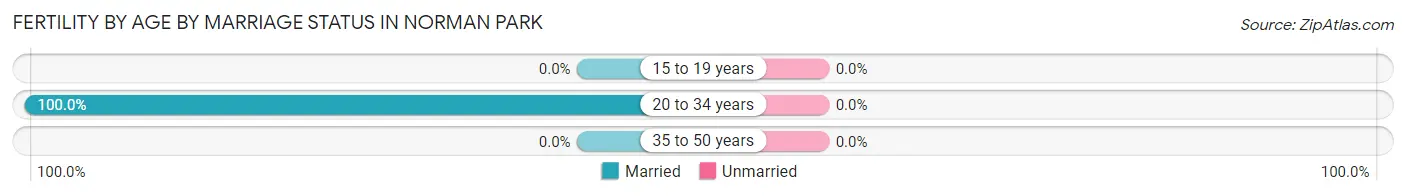
| Age Bracket | Married | Unmarried |
| 15 to 19 years | 0 (0.0%) | 0 (0.0%) |
| 20 to 34 years | 6 (100.0%) | 0 (0.0%) |
| 35 to 50 years | 0 (0.0%) | 0 (0.0%) |
| Total | 6 (100.0%) | 0 (0.0%) |
Fertility by Education in Norman Park
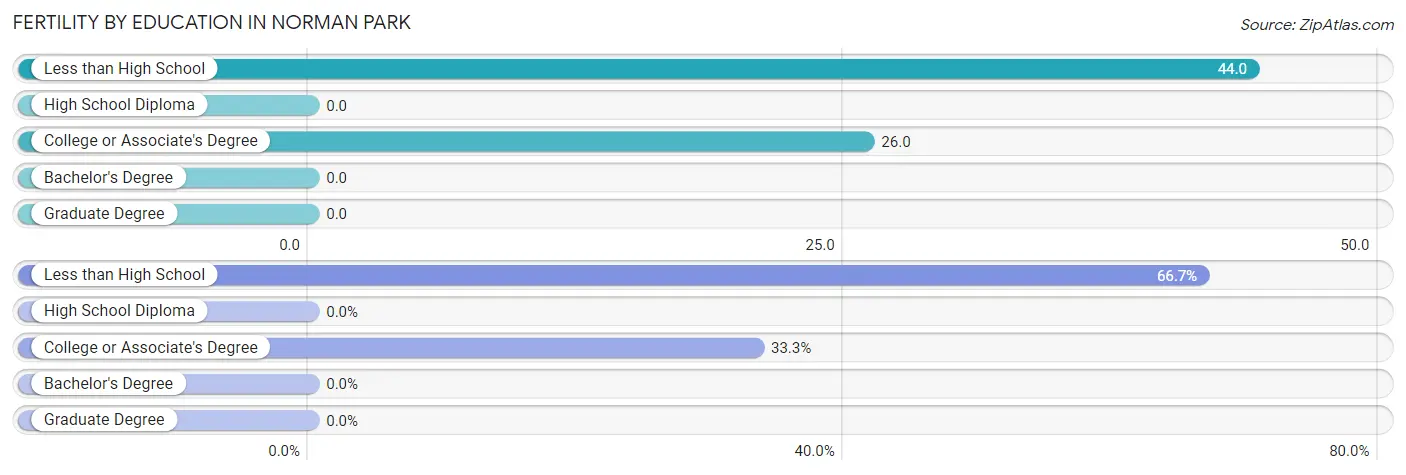
| Educational Attainment | Women with Births | Births / 1,000 Women |
| Less than High School | 4 (66.7%) | 44.0 |
| High School Diploma | 0 (0.0%) | 0.0 |
| College or Associate's Degree | 2 (33.3%) | 26.0 |
| Bachelor's Degree | 0 (0.0%) | 0.0 |
| Graduate Degree | 0 (0.0%) | 0.0 |
| Total | 6 (100.0%) | 22.0 |
Fertility by Education by Marriage Status in Norman Park
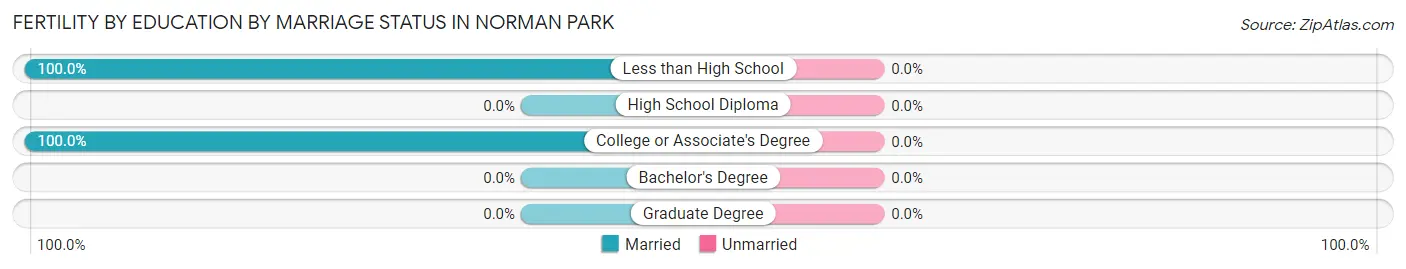
| Educational Attainment | Married | Unmarried |
| Less than High School | 4 (100.0%) | 0 (0.0%) |
| High School Diploma | 0 (0.0%) | 0 (0.0%) |
| College or Associate's Degree | 2 (100.0%) | 0 (0.0%) |
| Bachelor's Degree | 0 (0.0%) | 0 (0.0%) |
| Graduate Degree | 0 (0.0%) | 0 (0.0%) |
| Total | 6 (100.0%) | 0 (0.0%) |
Employment Characteristics in Norman Park
Employment by Class of Employer in Norman Park
Among the 480 employed individuals in Norman Park, private company employees (385 | 80.2%), local government employees (30 | 6.2%), and self-employed (incorporated) (23 | 4.8%) make up the most common classes of employment.
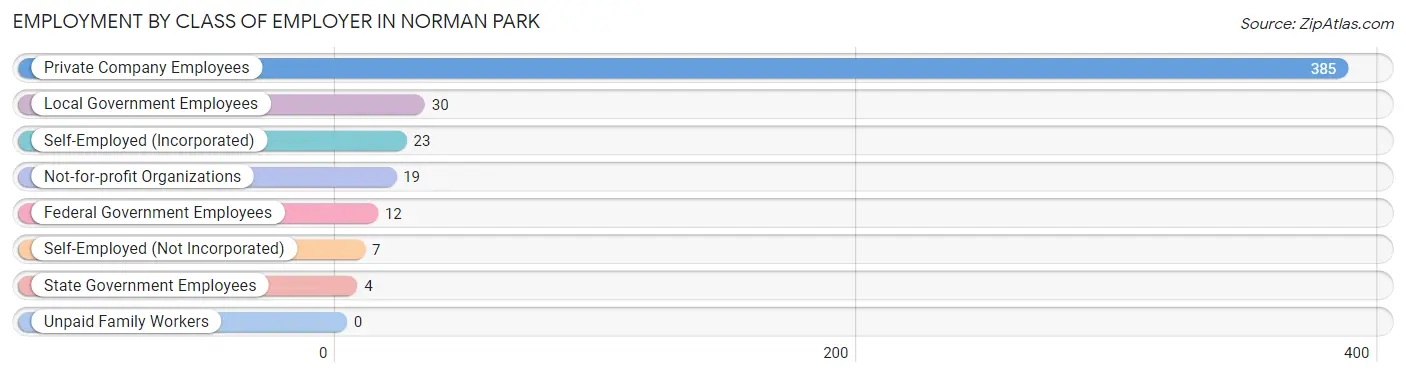
| Employer Class | # Employees | % Employees |
| Private Company Employees | 385 | 80.2% |
| Self-Employed (Incorporated) | 23 | 4.8% |
| Self-Employed (Not Incorporated) | 7 | 1.5% |
| Not-for-profit Organizations | 19 | 4.0% |
| Local Government Employees | 30 | 6.2% |
| State Government Employees | 4 | 0.8% |
| Federal Government Employees | 12 | 2.5% |
| Unpaid Family Workers | 0 | 0.0% |
| Total | 480 | 100.0% |
Employment Status by Age in Norman Park
According to the labor force statistics for Norman Park, out of the total population over 16 years of age (868), 59.0% or 512 individuals are in the labor force, with 6.3% or 32 of them unemployed. The age group with the highest labor force participation rate is 55 to 59 years, with 100.0% or 86 individuals in the labor force. Within the labor force, the 16 to 19 years age range has the highest percentage of unemployed individuals, with 100.0% or 3 of them being unemployed.
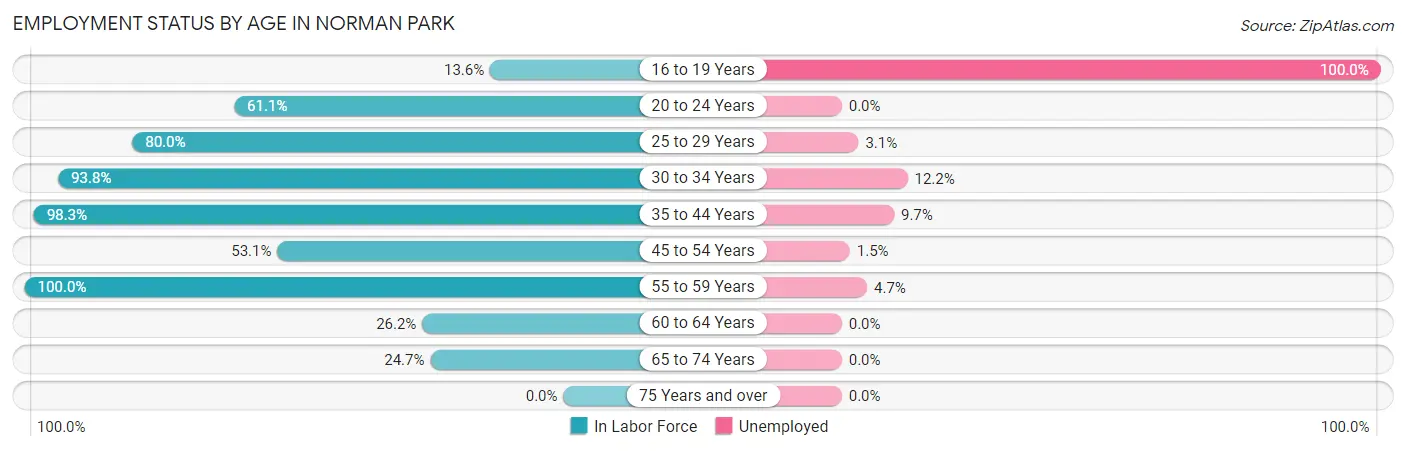
| Age Bracket | In Labor Force | Unemployed |
| 16 to 19 Years | 3 (13.6%) | 3 (100.0%) |
| 20 to 24 Years | 44 (61.1%) | 0 (0.0%) |
| 25 to 29 Years | 64 (80.0%) | 2 (3.1%) |
| 30 to 34 Years | 90 (93.8%) | 11 (12.2%) |
| 35 to 44 Years | 113 (98.3%) | 11 (9.7%) |
| 45 to 54 Years | 68 (53.1%) | 1 (1.5%) |
| 55 to 59 Years | 86 (100.0%) | 4 (4.7%) |
| 60 to 64 Years | 22 (26.2%) | 0 (0.0%) |
| 65 to 74 Years | 22 (24.7%) | 0 (0.0%) |
| 75 Years and over | 0 (0.0%) | 0 (0.0%) |
| Total | 512 (59.0%) | 32 (6.3%) |
Employment Status by Educational Attainment in Norman Park
According to labor force statistics for Norman Park, 75.2% of individuals (443) out of the total population between 25 and 64 years of age (589) are in the labor force, with 6.5% or 29 of them being unemployed. The group with the highest labor force participation rate are those with the educational attainment of college / associate degree, with 93.3% or 112 individuals in the labor force. Within the labor force, individuals with college / associate degree education have the highest percentage of unemployment, with 11.6% or 13 of them being unemployed.
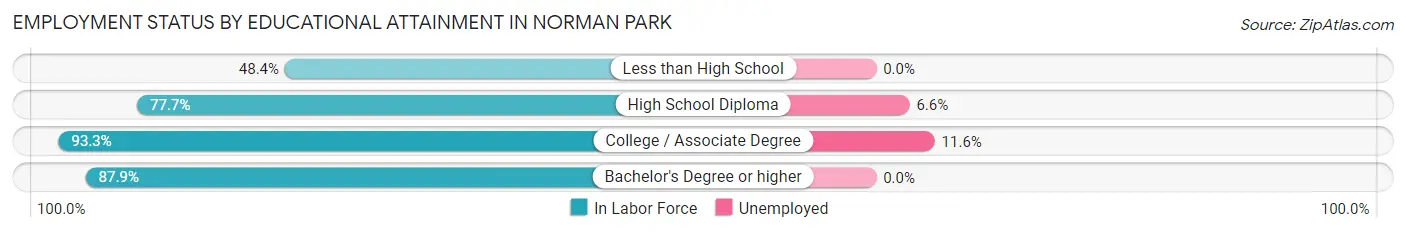
| Educational Attainment | In Labor Force | Unemployed |
| Less than High School | 61 (48.4%) | 0 (0.0%) |
| High School Diploma | 241 (77.7%) | 20 (6.6%) |
| College / Associate Degree | 112 (93.3%) | 14 (11.6%) |
| Bachelor's Degree or higher | 29 (87.9%) | 0 (0.0%) |
| Total | 443 (75.2%) | 38 (6.5%) |
Employment Occupations by Sex in Norman Park
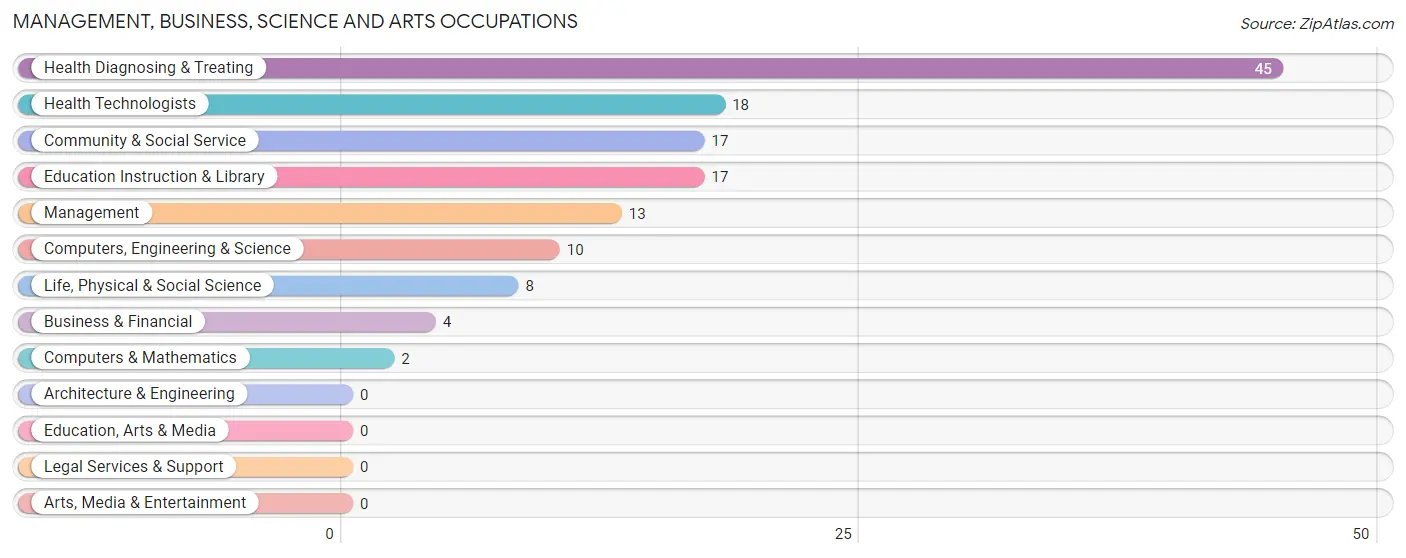
Management, Business, Science and Arts Occupations
The most common Management, Business, Science and Arts occupations in Norman Park are Health Diagnosing & Treating (45 | 9.4%), Health Technologists (18 | 3.7%), Community & Social Service (17 | 3.5%), Education Instruction & Library (17 | 3.5%), and Management (13 | 2.7%).
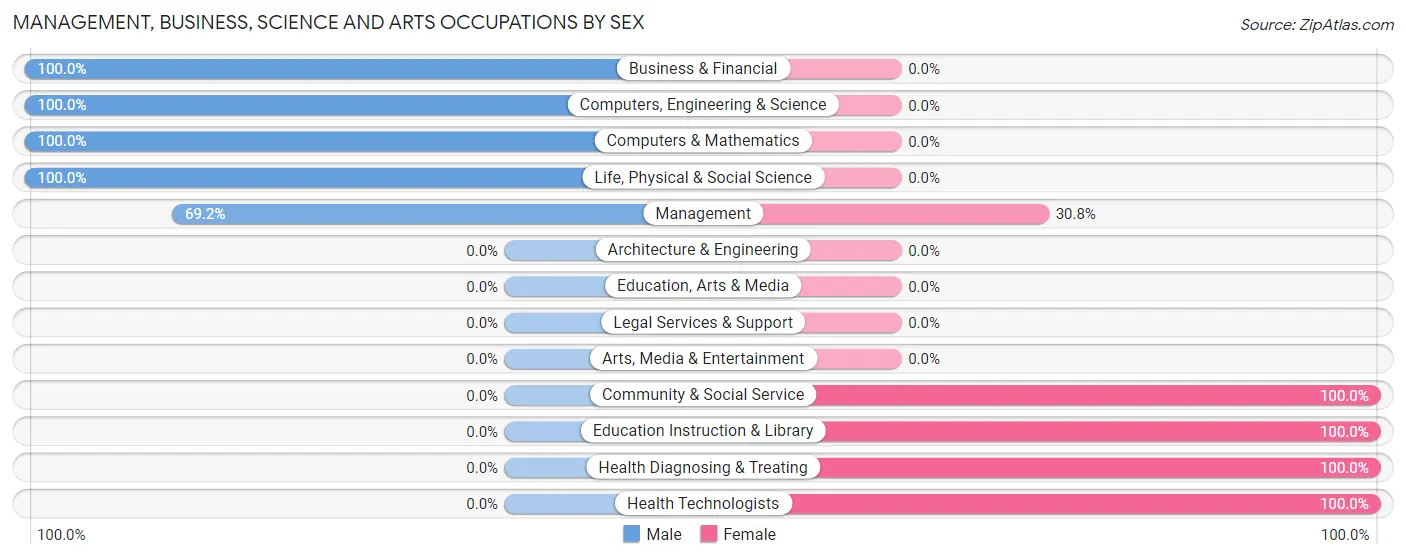
Management, Business, Science and Arts Occupations by Sex
Within the Management, Business, Science and Arts occupations in Norman Park, the most male-oriented occupations are Business & Financial (100.0%), Computers, Engineering & Science (100.0%), and Computers & Mathematics (100.0%), while the most female-oriented occupations are Community & Social Service (100.0%), Education Instruction & Library (100.0%), and Health Diagnosing & Treating (100.0%).
| Occupation | Male | Female |
| Management | 9 (69.2%) | 4 (30.8%) |
| Business & Financial | 4 (100.0%) | 0 (0.0%) |
| Computers, Engineering & Science | 10 (100.0%) | 0 (0.0%) |
| Computers & Mathematics | 2 (100.0%) | 0 (0.0%) |
| Architecture & Engineering | 0 (0.0%) | 0 (0.0%) |
| Life, Physical & Social Science | 8 (100.0%) | 0 (0.0%) |
| Community & Social Service | 0 (0.0%) | 17 (100.0%) |
| Education, Arts & Media | 0 (0.0%) | 0 (0.0%) |
| Legal Services & Support | 0 (0.0%) | 0 (0.0%) |
| Education Instruction & Library | 0 (0.0%) | 17 (100.0%) |
| Arts, Media & Entertainment | 0 (0.0%) | 0 (0.0%) |
| Health Diagnosing & Treating | 0 (0.0%) | 45 (100.0%) |
| Health Technologists | 0 (0.0%) | 18 (100.0%) |
| Total (Category) | 23 (25.8%) | 66 (74.2%) |
| Total (Overall) | 280 (58.3%) | 200 (41.7%) |
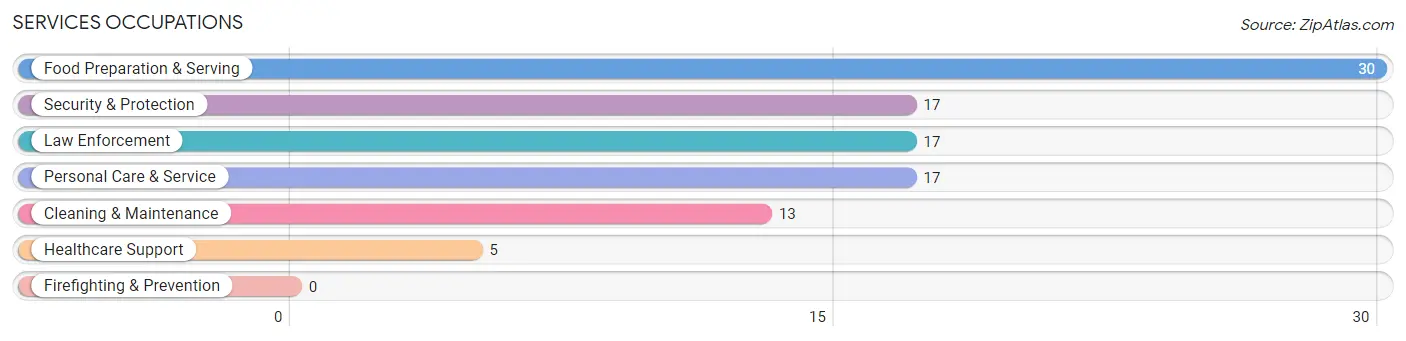
Services Occupations
The most common Services occupations in Norman Park are Food Preparation & Serving (30 | 6.2%), Security & Protection (17 | 3.5%), Law Enforcement (17 | 3.5%), Personal Care & Service (17 | 3.5%), and Cleaning & Maintenance (13 | 2.7%).
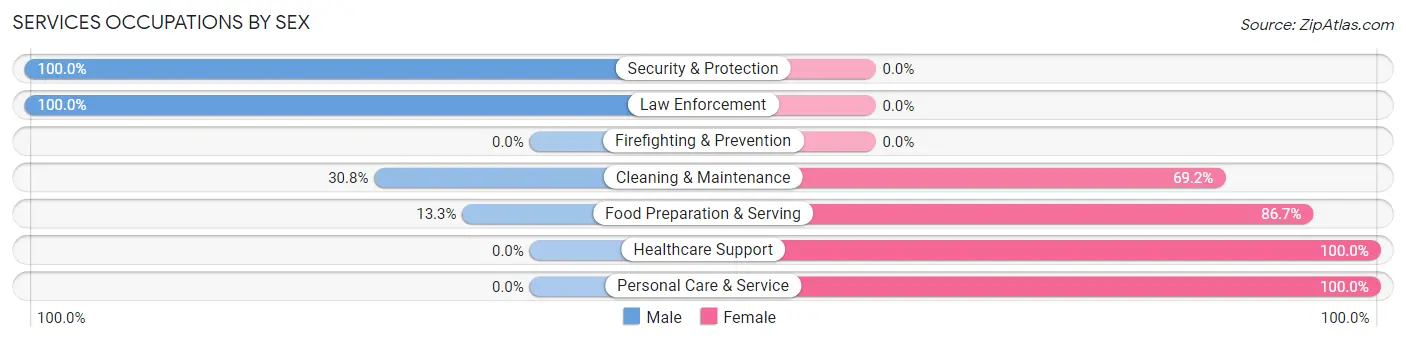
Services Occupations by Sex
Within the Services occupations in Norman Park, the most male-oriented occupations are Security & Protection (100.0%), Law Enforcement (100.0%), and Cleaning & Maintenance (30.8%), while the most female-oriented occupations are Healthcare Support (100.0%), Personal Care & Service (100.0%), and Food Preparation & Serving (86.7%).
| Occupation | Male | Female |
| Healthcare Support | 0 (0.0%) | 5 (100.0%) |
| Security & Protection | 17 (100.0%) | 0 (0.0%) |
| Firefighting & Prevention | 0 (0.0%) | 0 (0.0%) |
| Law Enforcement | 17 (100.0%) | 0 (0.0%) |
| Food Preparation & Serving | 4 (13.3%) | 26 (86.7%) |
| Cleaning & Maintenance | 4 (30.8%) | 9 (69.2%) |
| Personal Care & Service | 0 (0.0%) | 17 (100.0%) |
| Total (Category) | 25 (30.5%) | 57 (69.5%) |
| Total (Overall) | 280 (58.3%) | 200 (41.7%) |
Sales and Office Occupations
The most common Sales and Office occupations in Norman Park are Sales & Related (38 | 7.9%), and Office & Administration (24 | 5.0%).
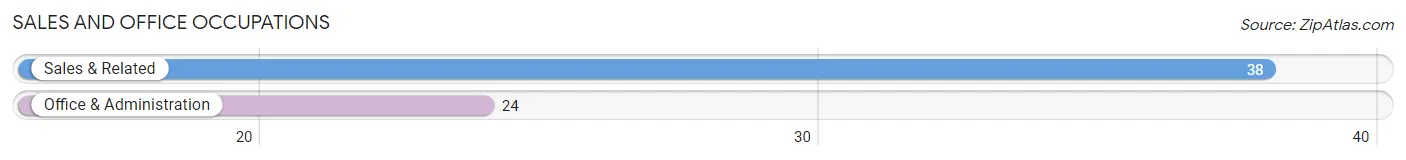
Sales and Office Occupations by Sex
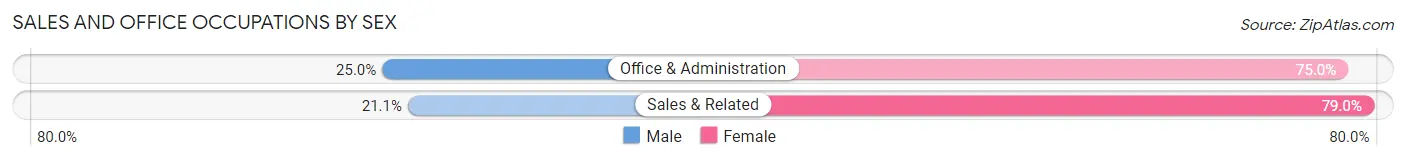
| Occupation | Male | Female |
| Sales & Related | 8 (21.0%) | 30 (78.9%) |
| Office & Administration | 6 (25.0%) | 18 (75.0%) |
| Total (Category) | 14 (22.6%) | 48 (77.4%) |
| Total (Overall) | 280 (58.3%) | 200 (41.7%) |
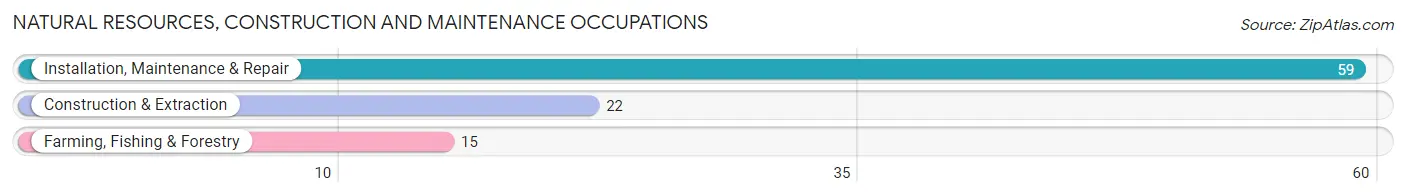
Natural Resources, Construction and Maintenance Occupations
The most common Natural Resources, Construction and Maintenance occupations in Norman Park are Installation, Maintenance & Repair (59 | 12.3%), Construction & Extraction (22 | 4.6%), and Farming, Fishing & Forestry (15 | 3.1%).
Natural Resources, Construction and Maintenance Occupations by Sex
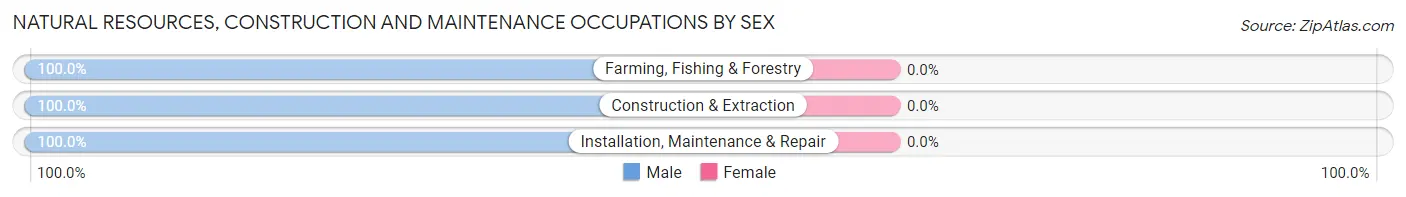
| Occupation | Male | Female |
| Farming, Fishing & Forestry | 15 (100.0%) | 0 (0.0%) |
| Construction & Extraction | 22 (100.0%) | 0 (0.0%) |
| Installation, Maintenance & Repair | 59 (100.0%) | 0 (0.0%) |
| Total (Category) | 96 (100.0%) | 0 (0.0%) |
| Total (Overall) | 280 (58.3%) | 200 (41.7%) |
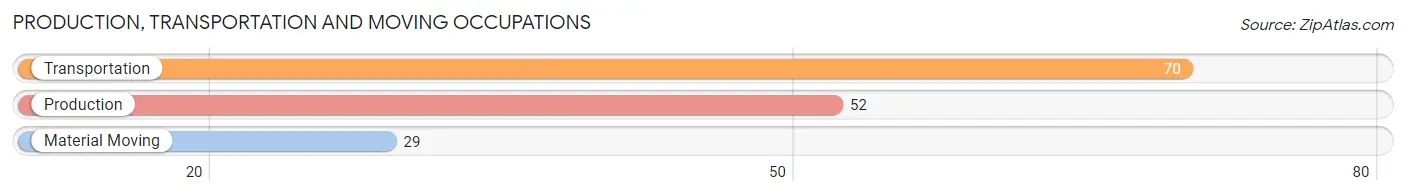
Production, Transportation and Moving Occupations
The most common Production, Transportation and Moving occupations in Norman Park are Transportation (70 | 14.6%), Production (52 | 10.8%), and Material Moving (29 | 6.0%).
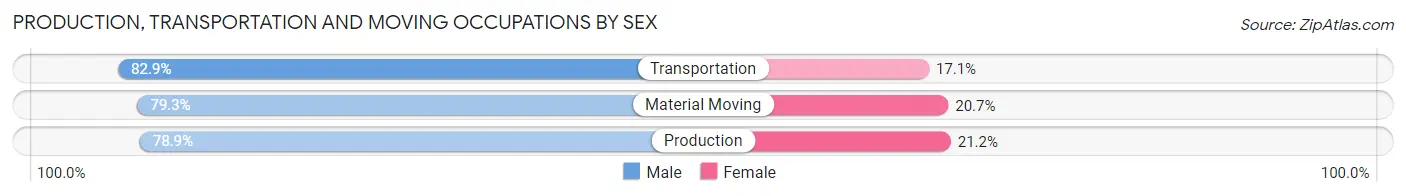
Production, Transportation and Moving Occupations by Sex
| Occupation | Male | Female |
| Production | 41 (78.8%) | 11 (21.1%) |
| Transportation | 58 (82.9%) | 12 (17.1%) |
| Material Moving | 23 (79.3%) | 6 (20.7%) |
| Total (Category) | 122 (80.8%) | 29 (19.2%) |
| Total (Overall) | 280 (58.3%) | 200 (41.7%) |
Employment Industries by Sex in Norman Park
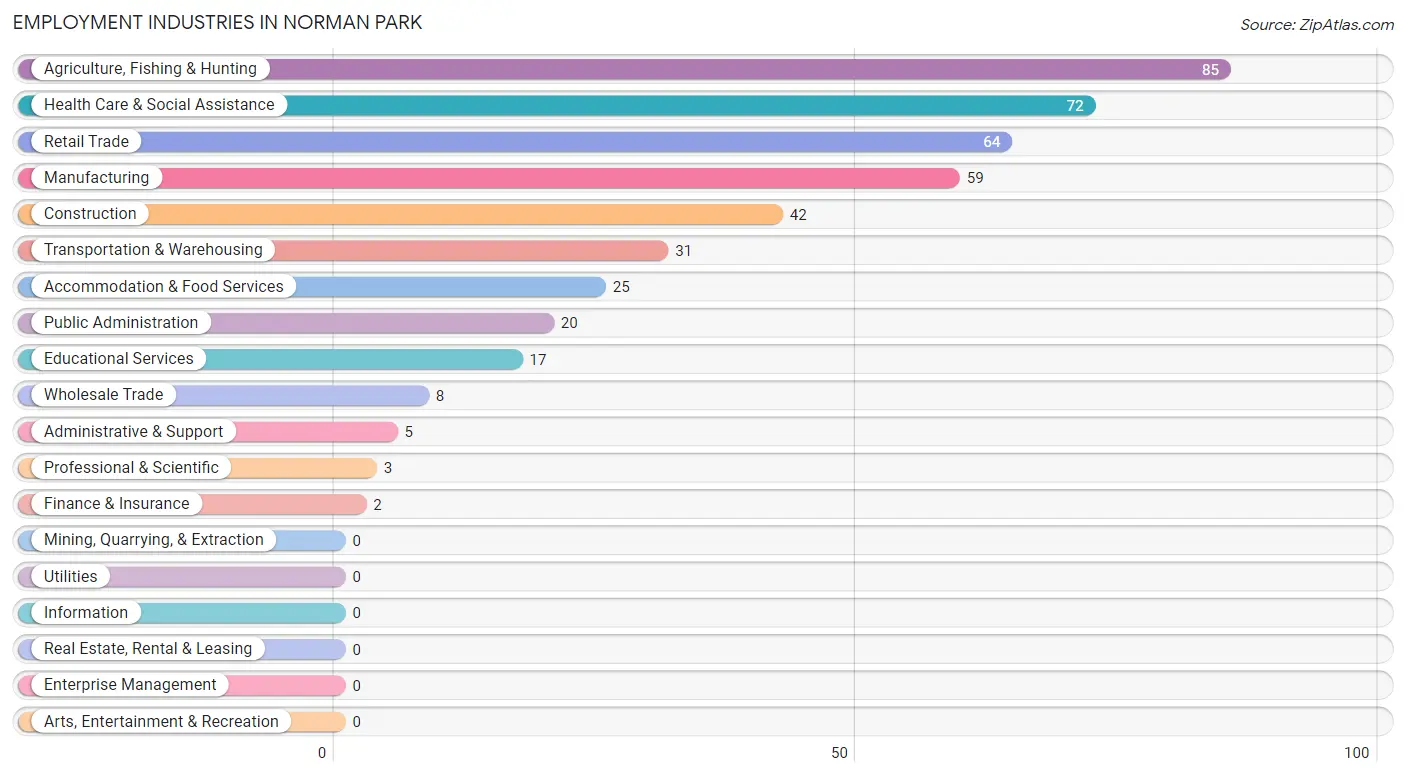
Employment Industries in Norman Park
The major employment industries in Norman Park include Agriculture, Fishing & Hunting (85 | 17.7%), Health Care & Social Assistance (72 | 15.0%), Retail Trade (64 | 13.3%), Manufacturing (59 | 12.3%), and Construction (42 | 8.7%).
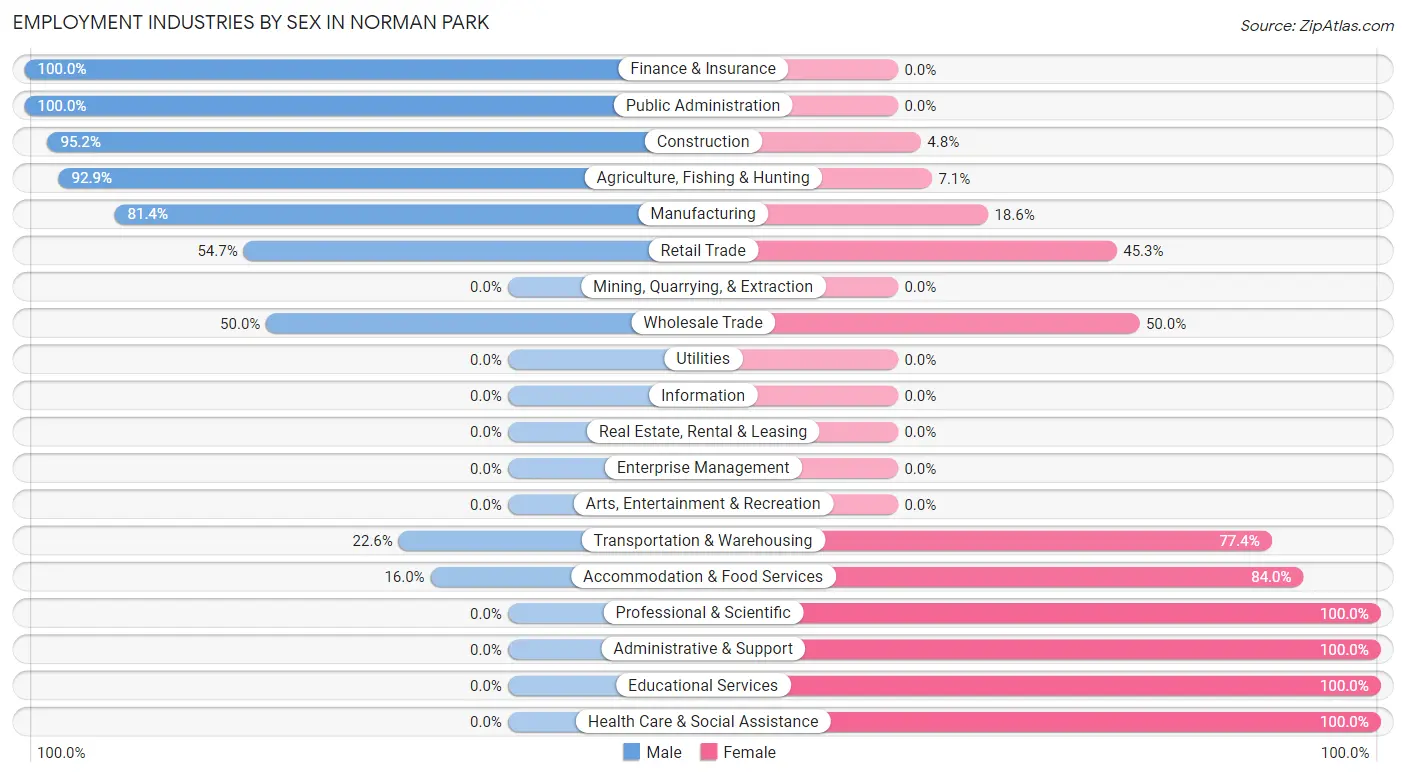
Employment Industries by Sex in Norman Park
The Norman Park industries that see more men than women are Finance & Insurance (100.0%), Public Administration (100.0%), and Construction (95.2%), whereas the industries that tend to have a higher number of women are Professional & Scientific (100.0%), Administrative & Support (100.0%), and Educational Services (100.0%).
| Industry | Male | Female |
| Agriculture, Fishing & Hunting | 79 (92.9%) | 6 (7.1%) |
| Mining, Quarrying, & Extraction | 0 (0.0%) | 0 (0.0%) |
| Construction | 40 (95.2%) | 2 (4.8%) |
| Manufacturing | 48 (81.4%) | 11 (18.6%) |
| Wholesale Trade | 4 (50.0%) | 4 (50.0%) |
| Retail Trade | 35 (54.7%) | 29 (45.3%) |
| Transportation & Warehousing | 7 (22.6%) | 24 (77.4%) |
| Utilities | 0 (0.0%) | 0 (0.0%) |
| Information | 0 (0.0%) | 0 (0.0%) |
| Finance & Insurance | 2 (100.0%) | 0 (0.0%) |
| Real Estate, Rental & Leasing | 0 (0.0%) | 0 (0.0%) |
| Professional & Scientific | 0 (0.0%) | 3 (100.0%) |
| Enterprise Management | 0 (0.0%) | 0 (0.0%) |
| Administrative & Support | 0 (0.0%) | 5 (100.0%) |
| Educational Services | 0 (0.0%) | 17 (100.0%) |
| Health Care & Social Assistance | 0 (0.0%) | 72 (100.0%) |
| Arts, Entertainment & Recreation | 0 (0.0%) | 0 (0.0%) |
| Accommodation & Food Services | 4 (16.0%) | 21 (84.0%) |
| Public Administration | 20 (100.0%) | 0 (0.0%) |
| Total | 280 (58.3%) | 200 (41.7%) |
Education in Norman Park
School Enrollment in Norman Park
The most common levels of schooling among the 200 students in Norman Park are middle school (66 | 33.0%), elementary school (60 | 30.0%), and nursery / preschool (40 | 20.0%).
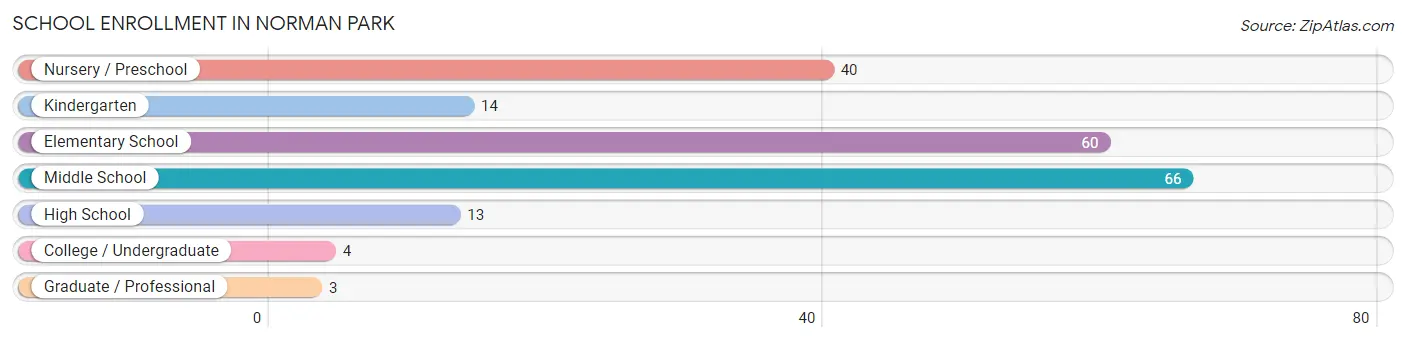
| School Level | # Students | % Students |
| Nursery / Preschool | 40 | 20.0% |
| Kindergarten | 14 | 7.0% |
| Elementary School | 60 | 30.0% |
| Middle School | 66 | 33.0% |
| High School | 13 | 6.5% |
| College / Undergraduate | 4 | 2.0% |
| Graduate / Professional | 3 | 1.5% |
| Total | 200 | 100.0% |
School Enrollment by Age by Funding Source in Norman Park
Out of a total of 200 students who are enrolled in schools in Norman Park, 16 (8.0%) attend a private institution, while the remaining 184 (92.0%) are enrolled in public schools. The age group of 3 to 4 year olds has the highest likelihood of being enrolled in private schools, with 6 (22.2% in the age bracket) enrolled. Conversely, the age group of 5 to 9 year old has the lowest likelihood of being enrolled in a private school, with 78 (100.0% in the age bracket) attending a public institution.
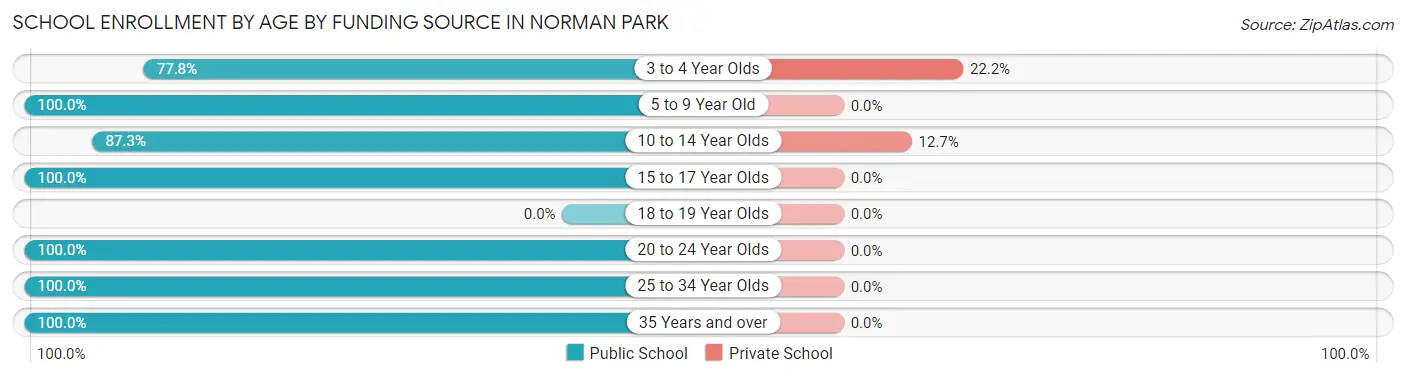
| Age Bracket | Public School | Private School |
| 3 to 4 Year Olds | 21 (77.8%) | 6 (22.2%) |
| 5 to 9 Year Old | 78 (100.0%) | 0 (0.0%) |
| 10 to 14 Year Olds | 69 (87.3%) | 10 (12.7%) |
| 15 to 17 Year Olds | 5 (100.0%) | 0 (0.0%) |
| 18 to 19 Year Olds | 0 (0.0%) | 0 (0.0%) |
| 20 to 24 Year Olds | 4 (100.0%) | 0 (0.0%) |
| 25 to 34 Year Olds | 5 (100.0%) | 0 (0.0%) |
| 35 Years and over | 2 (100.0%) | 0 (0.0%) |
| Total | 184 (92.0%) | 16 (8.0%) |
Educational Attainment by Field of Study in Norman Park
Education (21 | 46.7%), bio, nature & agricultural (8 | 17.8%), business (7 | 15.6%), physical & health sciences (4 | 8.9%), and social sciences (4 | 8.9%) are the most common fields of study among 45 individuals in Norman Park who have obtained a bachelor's degree or higher.
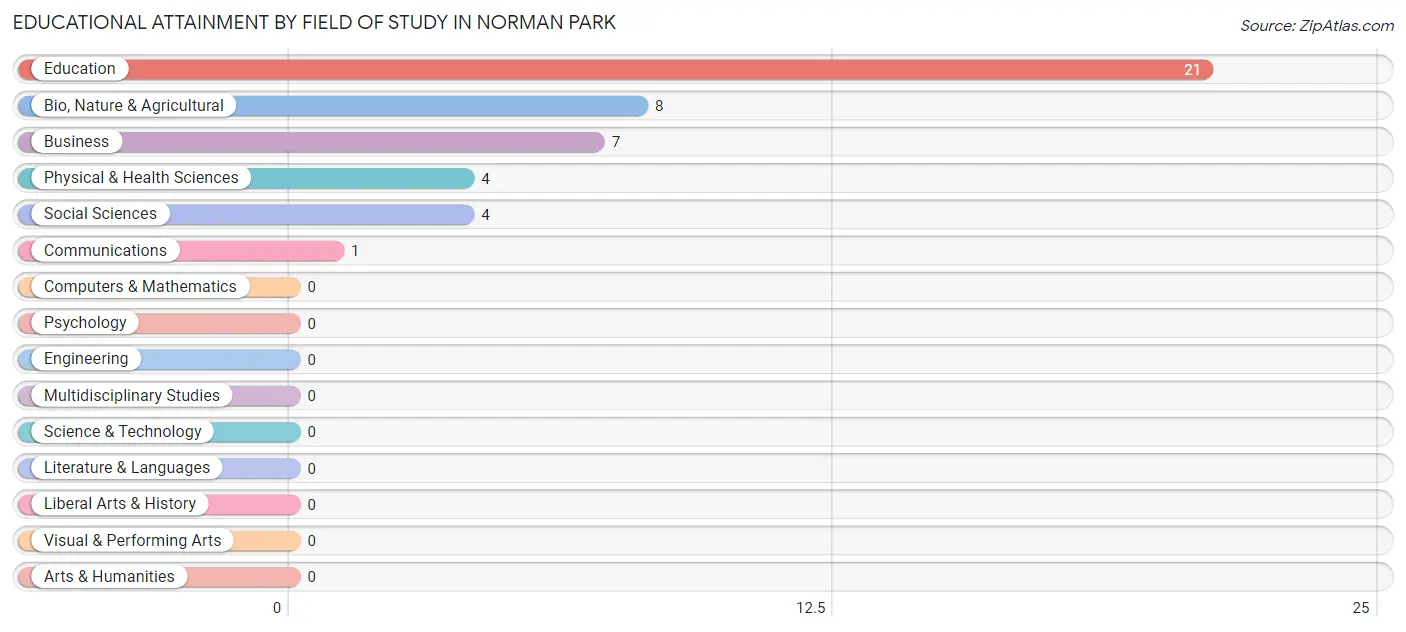
| Field of Study | # Graduates | % Graduates |
| Computers & Mathematics | 0 | 0.0% |
| Bio, Nature & Agricultural | 8 | 17.8% |
| Physical & Health Sciences | 4 | 8.9% |
| Psychology | 0 | 0.0% |
| Social Sciences | 4 | 8.9% |
| Engineering | 0 | 0.0% |
| Multidisciplinary Studies | 0 | 0.0% |
| Science & Technology | 0 | 0.0% |
| Business | 7 | 15.6% |
| Education | 21 | 46.7% |
| Literature & Languages | 0 | 0.0% |
| Liberal Arts & History | 0 | 0.0% |
| Visual & Performing Arts | 0 | 0.0% |
| Communications | 1 | 2.2% |
| Arts & Humanities | 0 | 0.0% |
| Total | 45 | 100.0% |
Transportation & Commute in Norman Park
Vehicle Availability by Sex in Norman Park
The most prevalent vehicle ownership categories in Norman Park are males with 1 vehicle (84, accounting for 30.0%) and females with 1 vehicle (94, making up 42.0%).
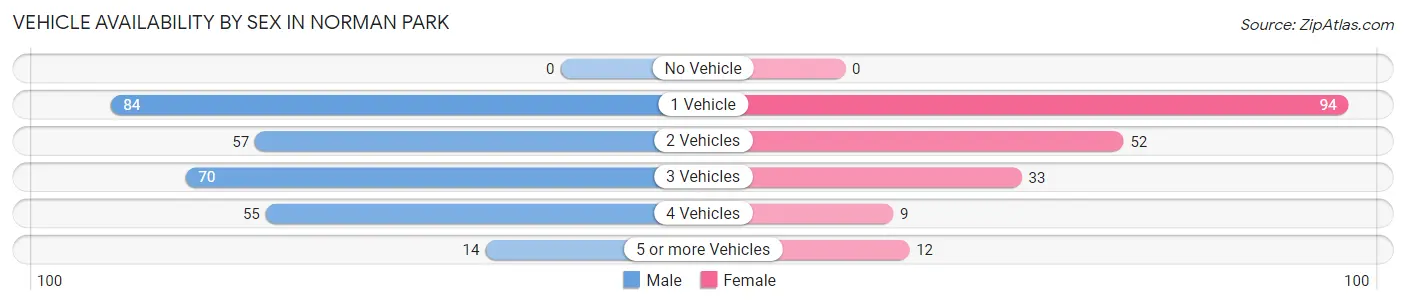
| Vehicles Available | Male | Female |
| No Vehicle | 0 (0.0%) | 0 (0.0%) |
| 1 Vehicle | 84 (30.0%) | 94 (47.0%) |
| 2 Vehicles | 57 (20.4%) | 52 (26.0%) |
| 3 Vehicles | 70 (25.0%) | 33 (16.5%) |
| 4 Vehicles | 55 (19.6%) | 9 (4.5%) |
| 5 or more Vehicles | 14 (5.0%) | 12 (6.0%) |
| Total | 280 (100.0%) | 200 (100.0%) |
Commute Time in Norman Park
The most frequently occuring commute durations in Norman Park are 30 to 34 minutes (108 commuters, 22.5%), 20 to 24 minutes (105 commuters, 21.9%), and 15 to 19 minutes (100 commuters, 20.8%).
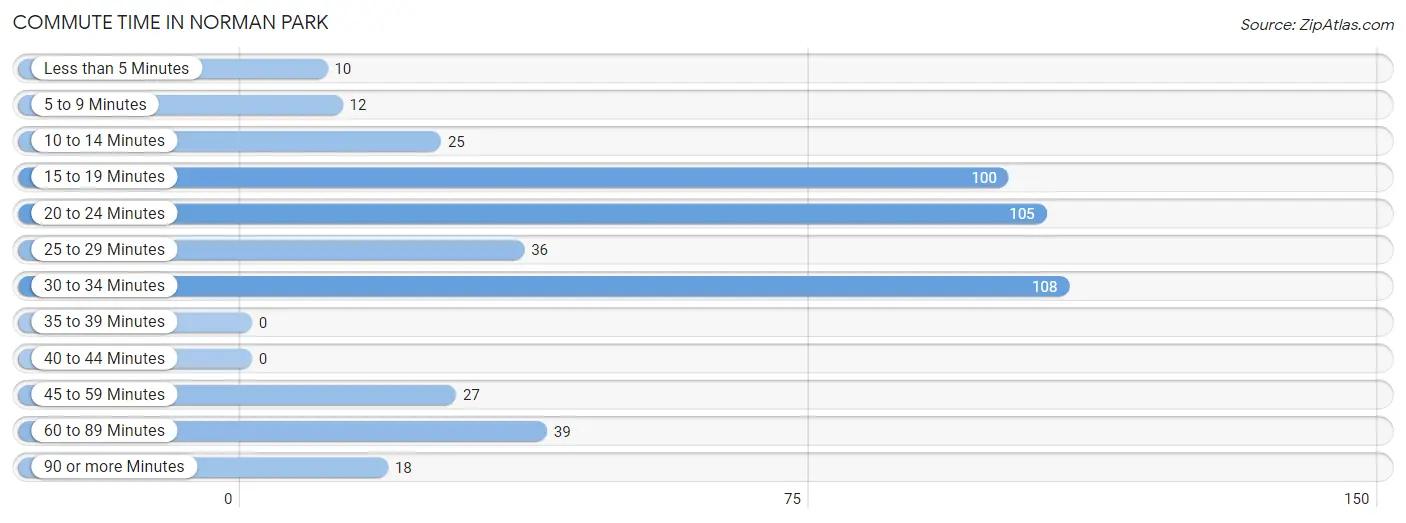
| Commute Time | # Commuters | % Commuters |
| Less than 5 Minutes | 10 | 2.1% |
| 5 to 9 Minutes | 12 | 2.5% |
| 10 to 14 Minutes | 25 | 5.2% |
| 15 to 19 Minutes | 100 | 20.8% |
| 20 to 24 Minutes | 105 | 21.9% |
| 25 to 29 Minutes | 36 | 7.5% |
| 30 to 34 Minutes | 108 | 22.5% |
| 35 to 39 Minutes | 0 | 0.0% |
| 40 to 44 Minutes | 0 | 0.0% |
| 45 to 59 Minutes | 27 | 5.6% |
| 60 to 89 Minutes | 39 | 8.1% |
| 90 or more Minutes | 18 | 3.7% |
Commute Time by Sex in Norman Park
The most common commute times in Norman Park are 30 to 34 minutes (96 commuters, 34.3%) for males and 20 to 24 minutes (65 commuters, 32.5%) for females.
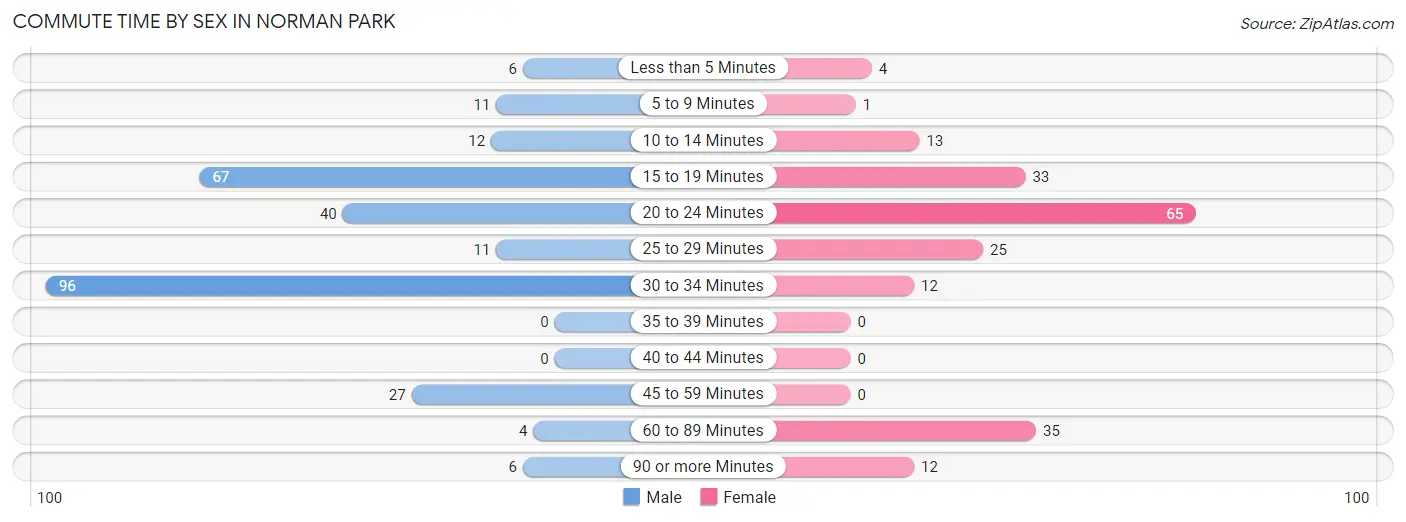
| Commute Time | Male | Female |
| Less than 5 Minutes | 6 (2.1%) | 4 (2.0%) |
| 5 to 9 Minutes | 11 (3.9%) | 1 (0.5%) |
| 10 to 14 Minutes | 12 (4.3%) | 13 (6.5%) |
| 15 to 19 Minutes | 67 (23.9%) | 33 (16.5%) |
| 20 to 24 Minutes | 40 (14.3%) | 65 (32.5%) |
| 25 to 29 Minutes | 11 (3.9%) | 25 (12.5%) |
| 30 to 34 Minutes | 96 (34.3%) | 12 (6.0%) |
| 35 to 39 Minutes | 0 (0.0%) | 0 (0.0%) |
| 40 to 44 Minutes | 0 (0.0%) | 0 (0.0%) |
| 45 to 59 Minutes | 27 (9.6%) | 0 (0.0%) |
| 60 to 89 Minutes | 4 (1.4%) | 35 (17.5%) |
| 90 or more Minutes | 6 (2.1%) | 12 (6.0%) |
Time of Departure to Work by Sex in Norman Park
The most frequent times of departure to work in Norman Park are 7:30 AM to 7:59 AM (99, 35.4%) for males and 12:00 PM to 3:59 PM (35, 17.5%) for females.
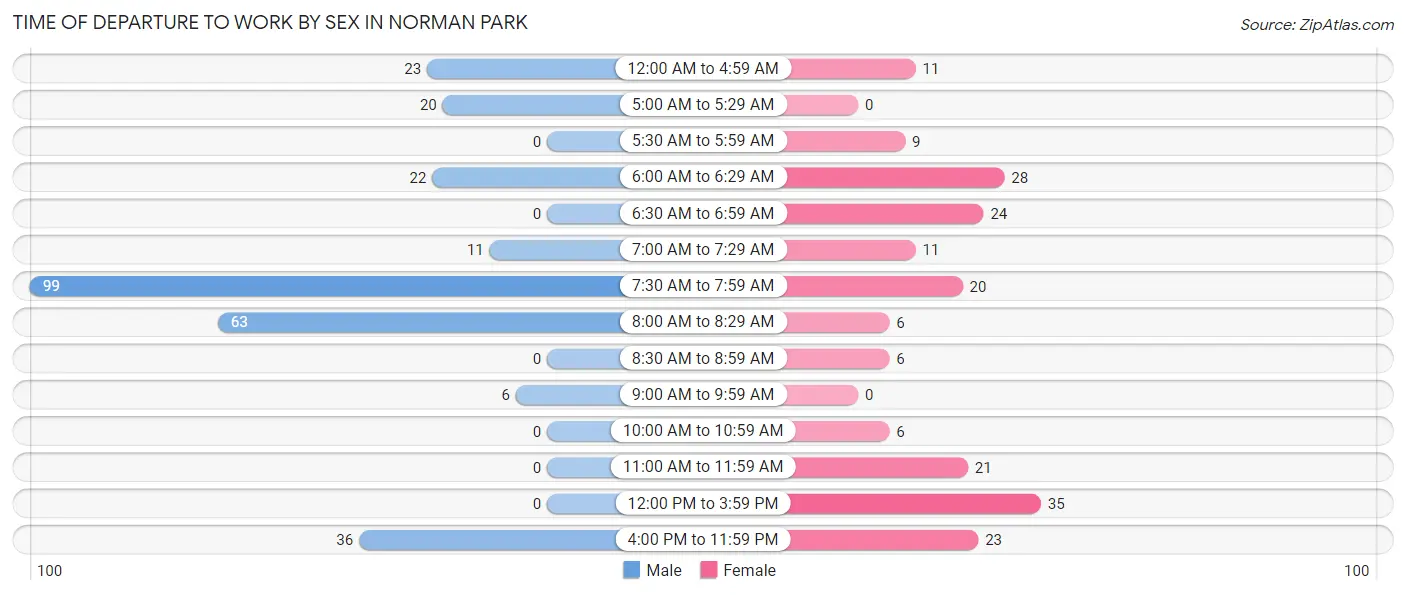
| Time of Departure | Male | Female |
| 12:00 AM to 4:59 AM | 23 (8.2%) | 11 (5.5%) |
| 5:00 AM to 5:29 AM | 20 (7.1%) | 0 (0.0%) |
| 5:30 AM to 5:59 AM | 0 (0.0%) | 9 (4.5%) |
| 6:00 AM to 6:29 AM | 22 (7.9%) | 28 (14.0%) |
| 6:30 AM to 6:59 AM | 0 (0.0%) | 24 (12.0%) |
| 7:00 AM to 7:29 AM | 11 (3.9%) | 11 (5.5%) |
| 7:30 AM to 7:59 AM | 99 (35.4%) | 20 (10.0%) |
| 8:00 AM to 8:29 AM | 63 (22.5%) | 6 (3.0%) |
| 8:30 AM to 8:59 AM | 0 (0.0%) | 6 (3.0%) |
| 9:00 AM to 9:59 AM | 6 (2.1%) | 0 (0.0%) |
| 10:00 AM to 10:59 AM | 0 (0.0%) | 6 (3.0%) |
| 11:00 AM to 11:59 AM | 0 (0.0%) | 21 (10.5%) |
| 12:00 PM to 3:59 PM | 0 (0.0%) | 35 (17.5%) |
| 4:00 PM to 11:59 PM | 36 (12.9%) | 23 (11.5%) |
| Total | 280 (100.0%) | 200 (100.0%) |
Housing Occupancy in Norman Park
Occupancy by Ownership in Norman Park
Of the total 402 dwellings in Norman Park, owner-occupied units account for 210 (52.2%), while renter-occupied units make up 192 (47.8%).
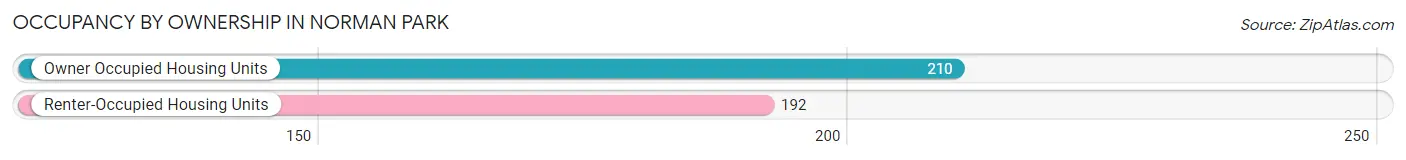
| Occupancy | # Housing Units | % Housing Units |
| Owner Occupied Housing Units | 210 | 52.2% |
| Renter-Occupied Housing Units | 192 | 47.8% |
| Total Occupied Housing Units | 402 | 100.0% |
Occupancy by Household Size in Norman Park
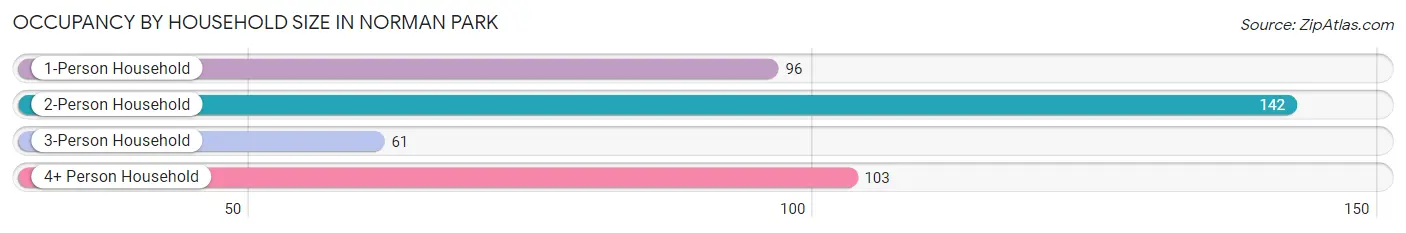
| Household Size | # Housing Units | % Housing Units |
| 1-Person Household | 96 | 23.9% |
| 2-Person Household | 142 | 35.3% |
| 3-Person Household | 61 | 15.2% |
| 4+ Person Household | 103 | 25.6% |
| Total Housing Units | 402 | 100.0% |
Occupancy by Ownership by Household Size in Norman Park
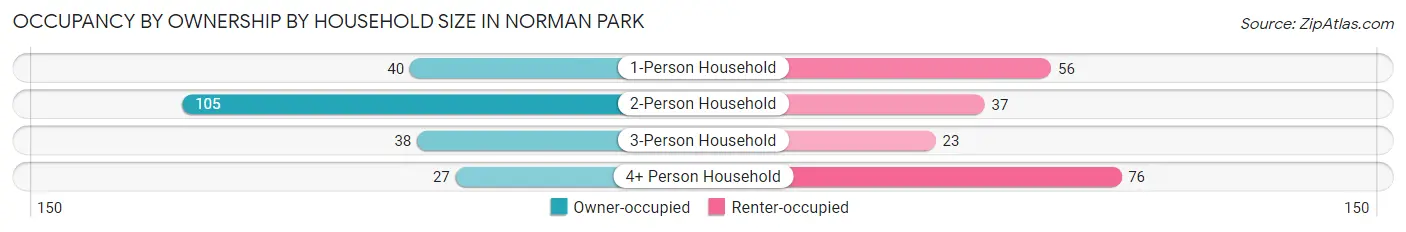
| Household Size | Owner-occupied | Renter-occupied |
| 1-Person Household | 40 (41.7%) | 56 (58.3%) |
| 2-Person Household | 105 (73.9%) | 37 (26.1%) |
| 3-Person Household | 38 (62.3%) | 23 (37.7%) |
| 4+ Person Household | 27 (26.2%) | 76 (73.8%) |
| Total Housing Units | 210 (52.2%) | 192 (47.8%) |
Occupancy by Educational Attainment in Norman Park
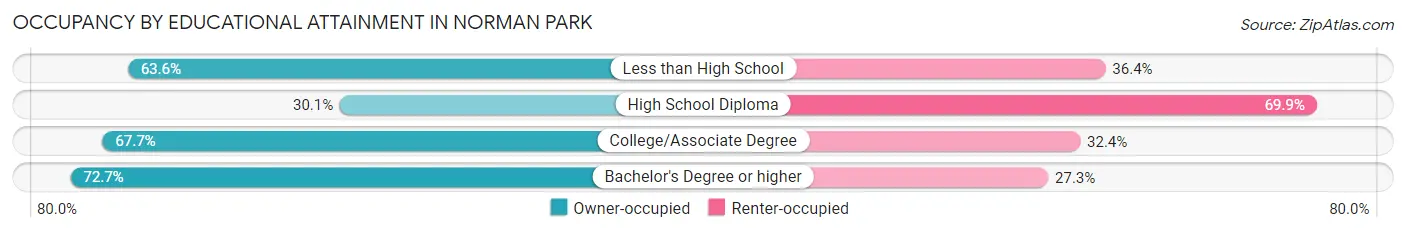
| Household Size | Owner-occupied | Renter-occupied |
| Less than High School | 63 (63.6%) | 36 (36.4%) |
| High School Diploma | 47 (30.1%) | 109 (69.9%) |
| College/Associate Degree | 92 (67.6%) | 44 (32.4%) |
| Bachelor's Degree or higher | 8 (72.7%) | 3 (27.3%) |
Occupancy by Age of Householder in Norman Park
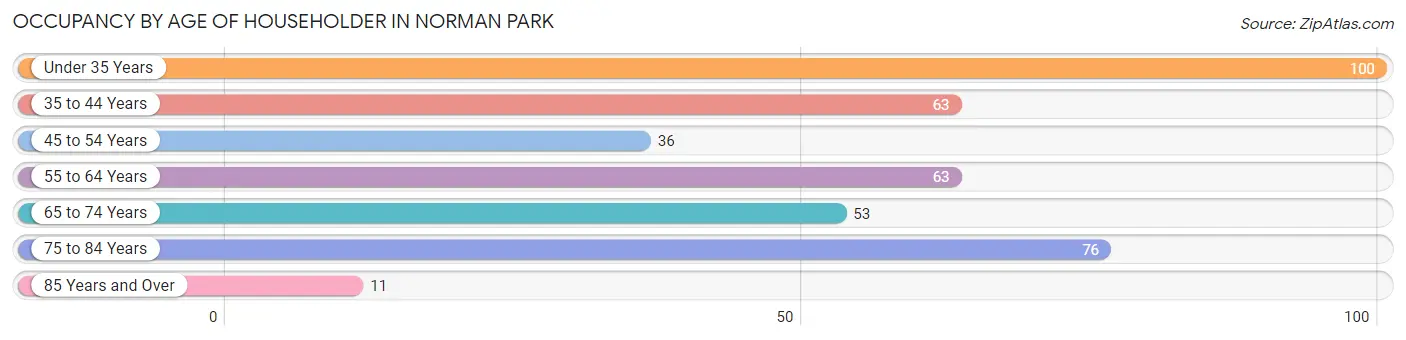
| Age Bracket | # Households | % Households |
| Under 35 Years | 100 | 24.9% |
| 35 to 44 Years | 63 | 15.7% |
| 45 to 54 Years | 36 | 9.0% |
| 55 to 64 Years | 63 | 15.7% |
| 65 to 74 Years | 53 | 13.2% |
| 75 to 84 Years | 76 | 18.9% |
| 85 Years and Over | 11 | 2.7% |
| Total | 402 | 100.0% |
Housing Finances in Norman Park
Median Income by Occupancy in Norman Park
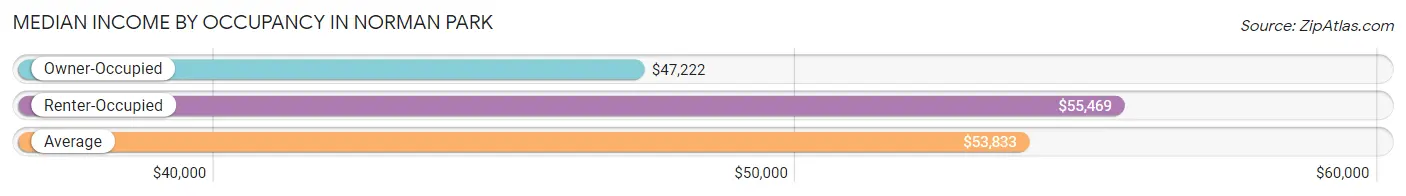
| Occupancy Type | # Households | Median Income |
| Owner-Occupied | 210 (52.2%) | $47,222 |
| Renter-Occupied | 192 (47.8%) | $55,469 |
| Average | 402 (100.0%) | $53,833 |
Occupancy by Householder Income Bracket in Norman Park
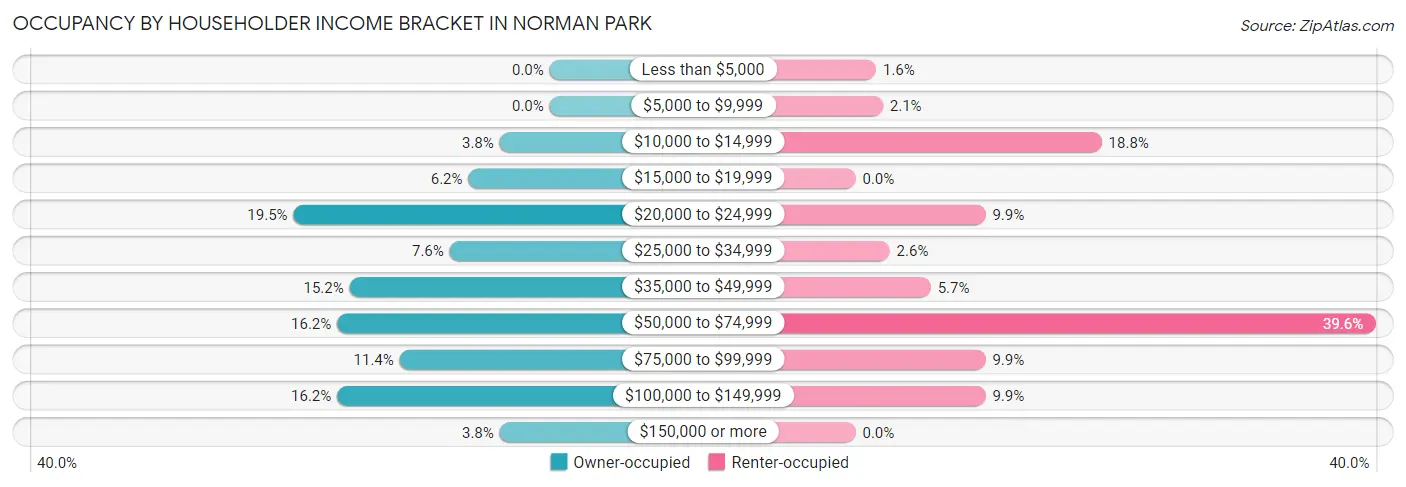
| Income Bracket | Owner-occupied | Renter-occupied |
| Less than $5,000 | 0 (0.0%) | 3 (1.6%) |
| $5,000 to $9,999 | 0 (0.0%) | 4 (2.1%) |
| $10,000 to $14,999 | 8 (3.8%) | 36 (18.8%) |
| $15,000 to $19,999 | 13 (6.2%) | 0 (0.0%) |
| $20,000 to $24,999 | 41 (19.5%) | 19 (9.9%) |
| $25,000 to $34,999 | 16 (7.6%) | 5 (2.6%) |
| $35,000 to $49,999 | 32 (15.2%) | 11 (5.7%) |
| $50,000 to $74,999 | 34 (16.2%) | 76 (39.6%) |
| $75,000 to $99,999 | 24 (11.4%) | 19 (9.9%) |
| $100,000 to $149,999 | 34 (16.2%) | 19 (9.9%) |
| $150,000 or more | 8 (3.8%) | 0 (0.0%) |
| Total | 210 (100.0%) | 192 (100.0%) |
Monthly Housing Cost Tiers in Norman Park
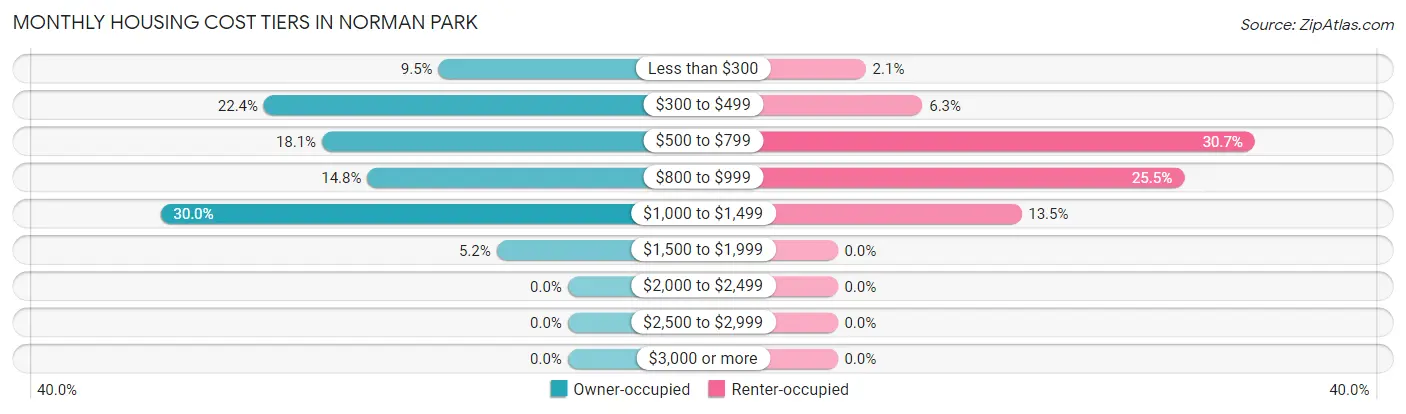
| Monthly Cost | Owner-occupied | Renter-occupied |
| Less than $300 | 20 (9.5%) | 4 (2.1%) |
| $300 to $499 | 47 (22.4%) | 12 (6.2%) |
| $500 to $799 | 38 (18.1%) | 59 (30.7%) |
| $800 to $999 | 31 (14.8%) | 49 (25.5%) |
| $1,000 to $1,499 | 63 (30.0%) | 26 (13.5%) |
| $1,500 to $1,999 | 11 (5.2%) | 0 (0.0%) |
| $2,000 to $2,499 | 0 (0.0%) | 0 (0.0%) |
| $2,500 to $2,999 | 0 (0.0%) | 0 (0.0%) |
| $3,000 or more | 0 (0.0%) | 0 (0.0%) |
| Total | 210 (100.0%) | 192 (100.0%) |
Physical Housing Characteristics in Norman Park
Housing Structures in Norman Park
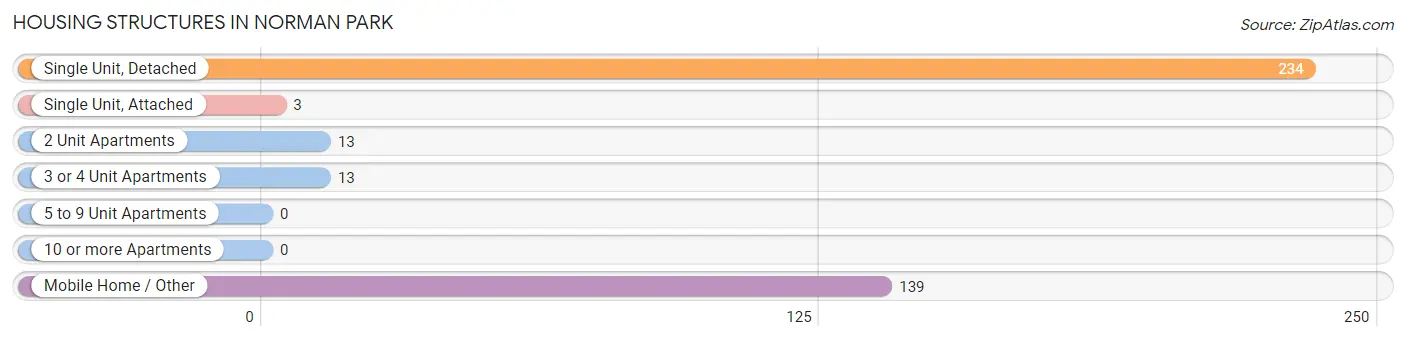
| Structure Type | # Housing Units | % Housing Units |
| Single Unit, Detached | 234 | 58.2% |
| Single Unit, Attached | 3 | 0.7% |
| 2 Unit Apartments | 13 | 3.2% |
| 3 or 4 Unit Apartments | 13 | 3.2% |
| 5 to 9 Unit Apartments | 0 | 0.0% |
| 10 or more Apartments | 0 | 0.0% |
| Mobile Home / Other | 139 | 34.6% |
| Total | 402 | 100.0% |
Housing Structures by Occupancy in Norman Park
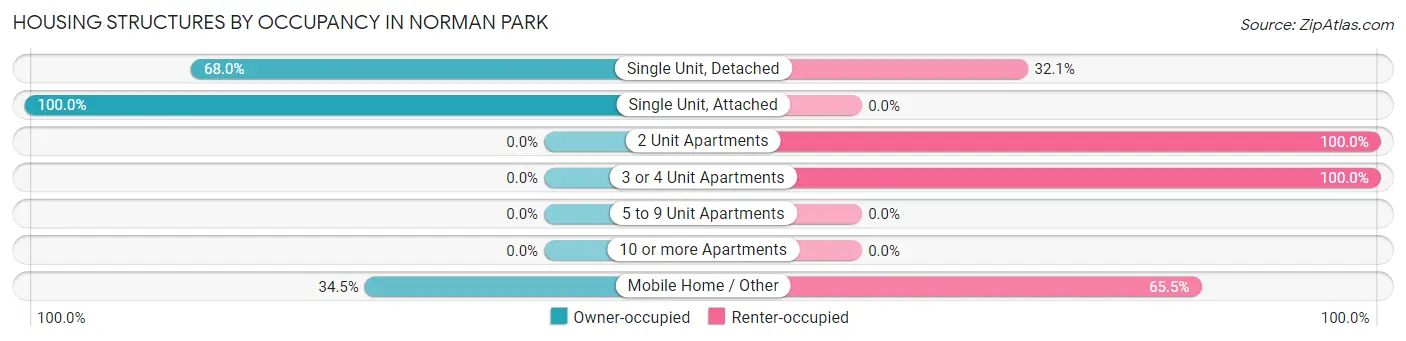
| Structure Type | Owner-occupied | Renter-occupied |
| Single Unit, Detached | 159 (67.9%) | 75 (32.1%) |
| Single Unit, Attached | 3 (100.0%) | 0 (0.0%) |
| 2 Unit Apartments | 0 (0.0%) | 13 (100.0%) |
| 3 or 4 Unit Apartments | 0 (0.0%) | 13 (100.0%) |
| 5 to 9 Unit Apartments | 0 (0.0%) | 0 (0.0%) |
| 10 or more Apartments | 0 (0.0%) | 0 (0.0%) |
| Mobile Home / Other | 48 (34.5%) | 91 (65.5%) |
| Total | 210 (52.2%) | 192 (47.8%) |
Housing Structures by Number of Rooms in Norman Park
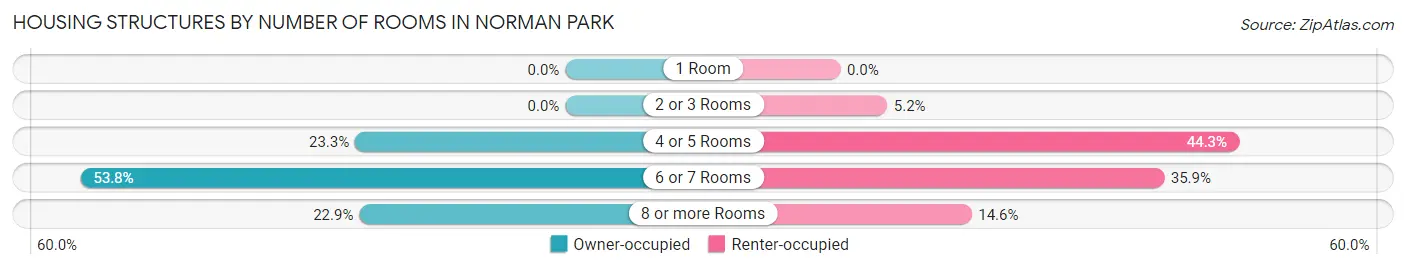
| Number of Rooms | Owner-occupied | Renter-occupied |
| 1 Room | 0 (0.0%) | 0 (0.0%) |
| 2 or 3 Rooms | 0 (0.0%) | 10 (5.2%) |
| 4 or 5 Rooms | 49 (23.3%) | 85 (44.3%) |
| 6 or 7 Rooms | 113 (53.8%) | 69 (35.9%) |
| 8 or more Rooms | 48 (22.9%) | 28 (14.6%) |
| Total | 210 (100.0%) | 192 (100.0%) |
Housing Structure by Heating Type in Norman Park
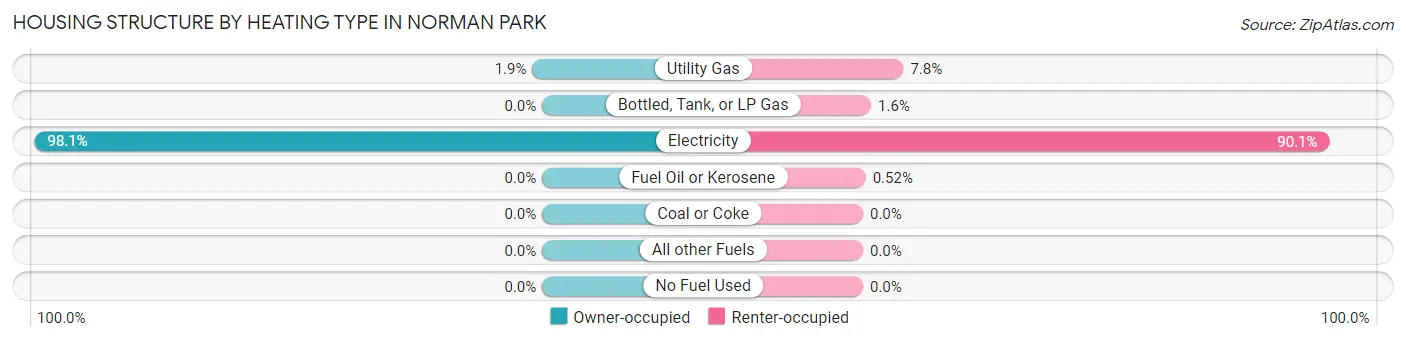
| Heating Type | Owner-occupied | Renter-occupied |
| Utility Gas | 4 (1.9%) | 15 (7.8%) |
| Bottled, Tank, or LP Gas | 0 (0.0%) | 3 (1.6%) |
| Electricity | 206 (98.1%) | 173 (90.1%) |
| Fuel Oil or Kerosene | 0 (0.0%) | 1 (0.5%) |
| Coal or Coke | 0 (0.0%) | 0 (0.0%) |
| All other Fuels | 0 (0.0%) | 0 (0.0%) |
| No Fuel Used | 0 (0.0%) | 0 (0.0%) |
| Total | 210 (100.0%) | 192 (100.0%) |
Household Vehicle Usage in Norman Park
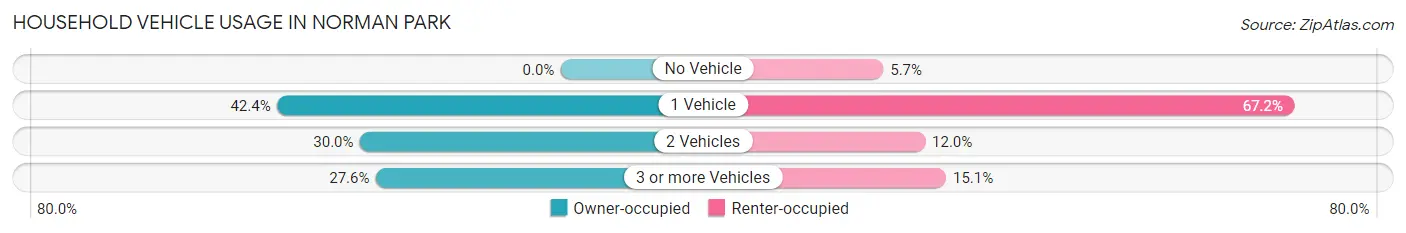
| Vehicles per Household | Owner-occupied | Renter-occupied |
| No Vehicle | 0 (0.0%) | 11 (5.7%) |
| 1 Vehicle | 89 (42.4%) | 129 (67.2%) |
| 2 Vehicles | 63 (30.0%) | 23 (12.0%) |
| 3 or more Vehicles | 58 (27.6%) | 29 (15.1%) |
| Total | 210 (100.0%) | 192 (100.0%) |
Real Estate & Mortgages in Norman Park
Real Estate and Mortgage Overview in Norman Park
| Characteristic | Without Mortgage | With Mortgage |
| Housing Units | 100 | 110 |
| Median Property Value | $58,200 | $98,700 |
| Median Household Income | $51,250 | $1 |
| Monthly Housing Costs | $426 | $0 |
| Real Estate Taxes | - | - |
Property Value by Mortgage Status in Norman Park
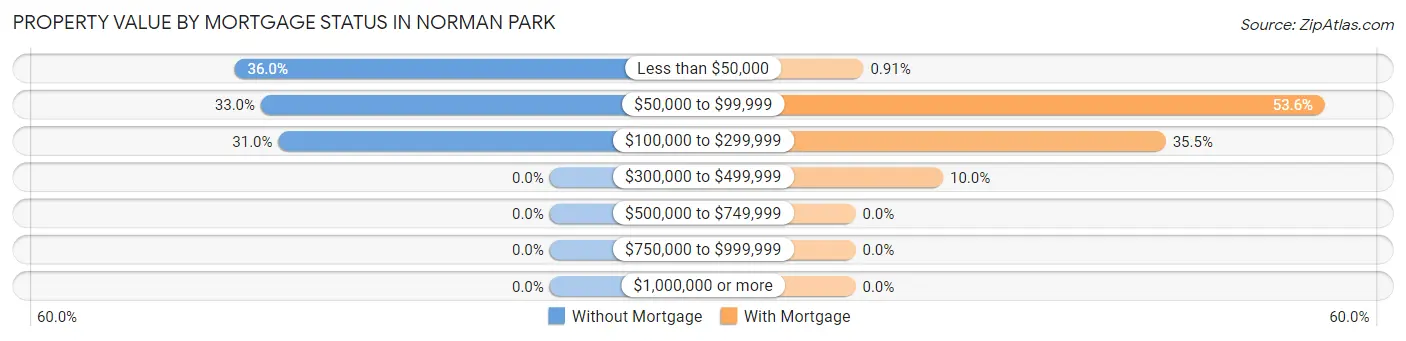
| Property Value | Without Mortgage | With Mortgage |
| Less than $50,000 | 36 (36.0%) | 1 (0.9%) |
| $50,000 to $99,999 | 33 (33.0%) | 59 (53.6%) |
| $100,000 to $299,999 | 31 (31.0%) | 39 (35.4%) |
| $300,000 to $499,999 | 0 (0.0%) | 11 (10.0%) |
| $500,000 to $749,999 | 0 (0.0%) | 0 (0.0%) |
| $750,000 to $999,999 | 0 (0.0%) | 0 (0.0%) |
| $1,000,000 or more | 0 (0.0%) | 0 (0.0%) |
| Total | 100 (100.0%) | 110 (100.0%) |
Household Income by Mortgage Status in Norman Park
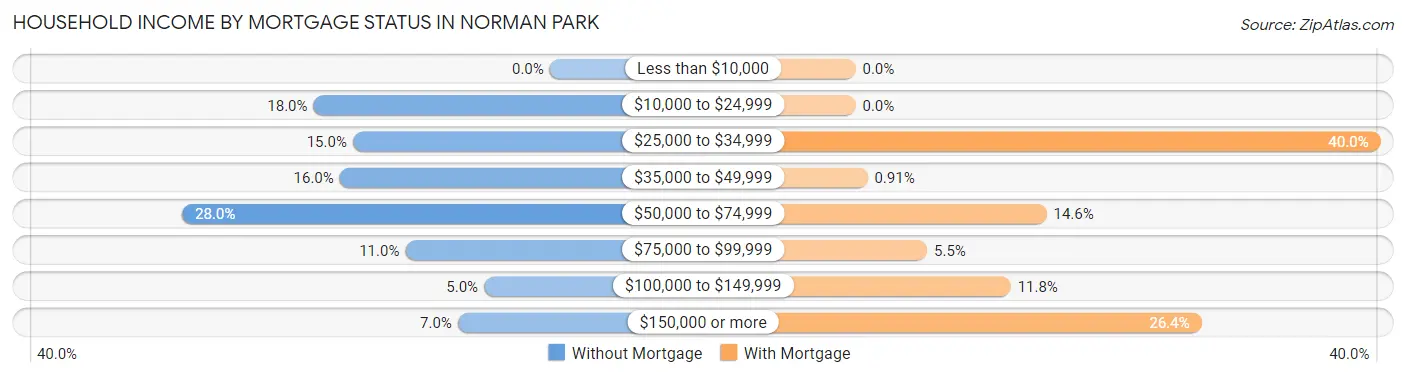
| Household Income | Without Mortgage | With Mortgage |
| Less than $10,000 | 0 (0.0%) | 0 (0.0%) |
| $10,000 to $24,999 | 18 (18.0%) | 0 (0.0%) |
| $25,000 to $34,999 | 15 (15.0%) | 44 (40.0%) |
| $35,000 to $49,999 | 16 (16.0%) | 1 (0.9%) |
| $50,000 to $74,999 | 28 (28.0%) | 16 (14.5%) |
| $75,000 to $99,999 | 11 (11.0%) | 6 (5.4%) |
| $100,000 to $149,999 | 5 (5.0%) | 13 (11.8%) |
| $150,000 or more | 7 (7.0%) | 29 (26.4%) |
| Total | 100 (100.0%) | 110 (100.0%) |
Property Value to Household Income Ratio in Norman Park
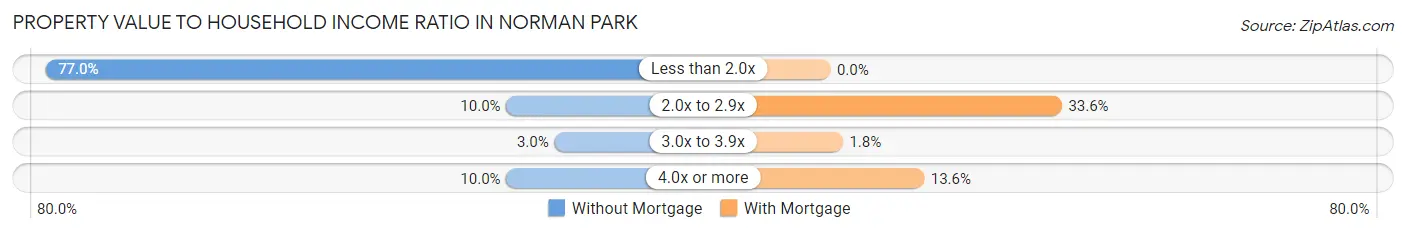
| Value-to-Income Ratio | Without Mortgage | With Mortgage |
| Less than 2.0x | 77 (77.0%) | 0 (0.0%) |
| 2.0x to 2.9x | 10 (10.0%) | 37 (33.6%) |
| 3.0x to 3.9x | 3 (3.0%) | 2 (1.8%) |
| 4.0x or more | 10 (10.0%) | 15 (13.6%) |
| Total | 100 (100.0%) | 110 (100.0%) |
Real Estate Taxes by Mortgage Status in Norman Park
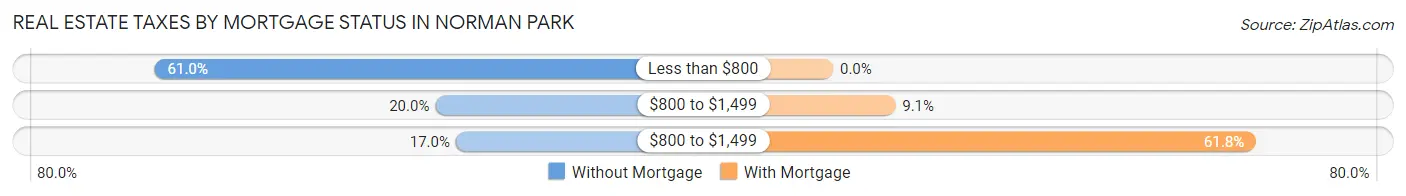
| Property Taxes | Without Mortgage | With Mortgage |
| Less than $800 | 61 (61.0%) | 0 (0.0%) |
| $800 to $1,499 | 20 (20.0%) | 10 (9.1%) |
| $800 to $1,499 | 17 (17.0%) | 68 (61.8%) |
| Total | 100 (100.0%) | 110 (100.0%) |
Health & Disability in Norman Park
Health Insurance Coverage by Age in Norman Park
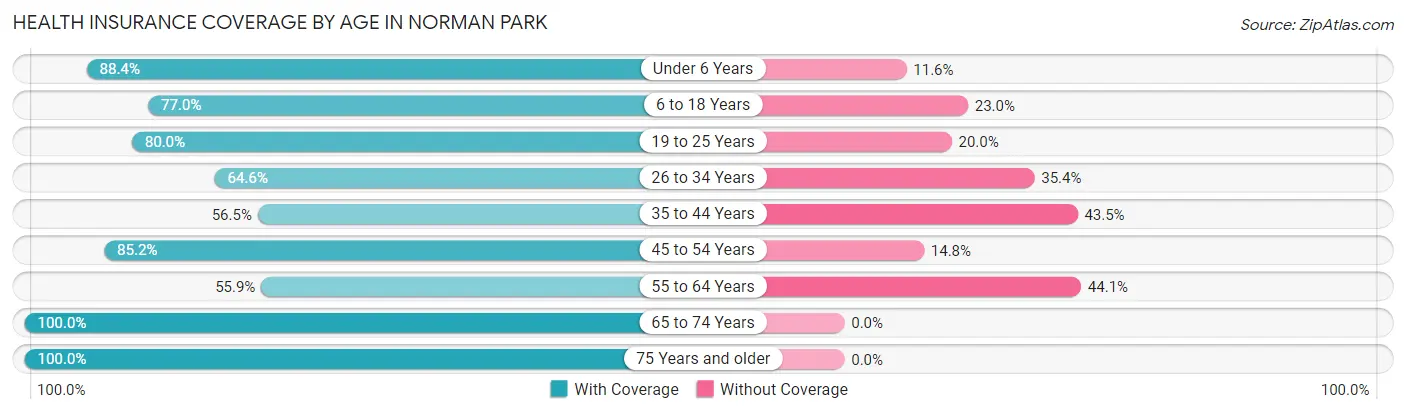
| Age Bracket | With Coverage | Without Coverage |
| Under 6 Years | 107 (88.4%) | 14 (11.6%) |
| 6 to 18 Years | 117 (77.0%) | 35 (23.0%) |
| 19 to 25 Years | 60 (80.0%) | 15 (20.0%) |
| 26 to 34 Years | 113 (64.6%) | 62 (35.4%) |
| 35 to 44 Years | 65 (56.5%) | 50 (43.5%) |
| 45 to 54 Years | 109 (85.2%) | 19 (14.8%) |
| 55 to 64 Years | 95 (55.9%) | 75 (44.1%) |
| 65 to 74 Years | 89 (100.0%) | 0 (0.0%) |
| 75 Years and older | 96 (100.0%) | 0 (0.0%) |
| Total | 851 (75.9%) | 270 (24.1%) |
Health Insurance Coverage by Citizenship Status in Norman Park
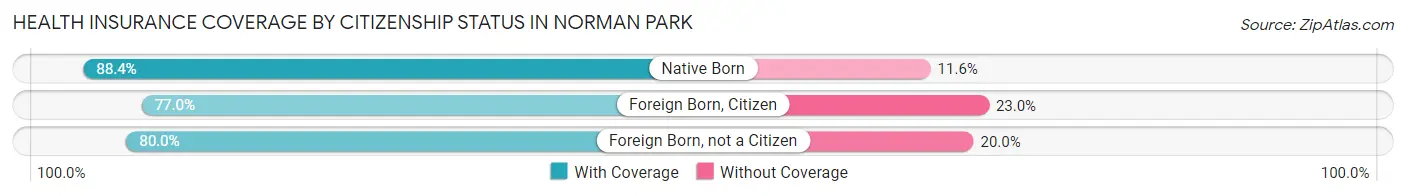
| Citizenship Status | With Coverage | Without Coverage |
| Native Born | 107 (88.4%) | 14 (11.6%) |
| Foreign Born, Citizen | 117 (77.0%) | 35 (23.0%) |
| Foreign Born, not a Citizen | 60 (80.0%) | 15 (20.0%) |
Health Insurance Coverage by Household Income in Norman Park
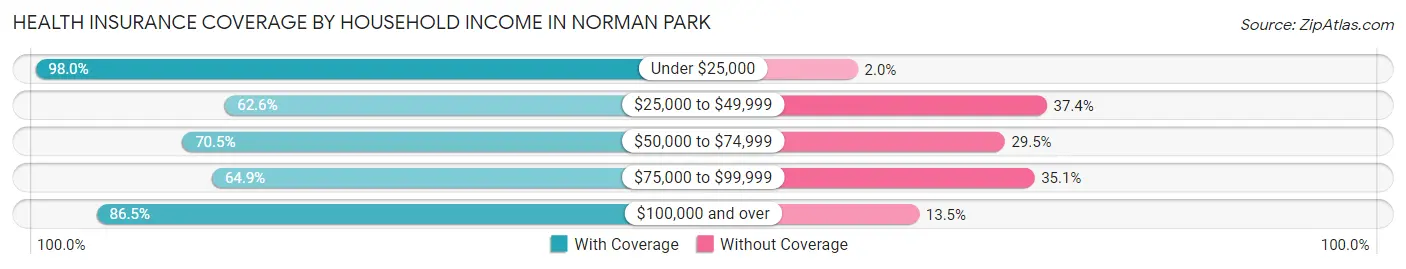
| Household Income | With Coverage | Without Coverage |
| Under $25,000 | 194 (98.0%) | 4 (2.0%) |
| $25,000 to $49,999 | 97 (62.6%) | 58 (37.4%) |
| $50,000 to $74,999 | 334 (70.5%) | 140 (29.5%) |
| $75,000 to $99,999 | 85 (64.9%) | 46 (35.1%) |
| $100,000 and over | 141 (86.5%) | 22 (13.5%) |
Public vs Private Health Insurance Coverage by Age in Norman Park
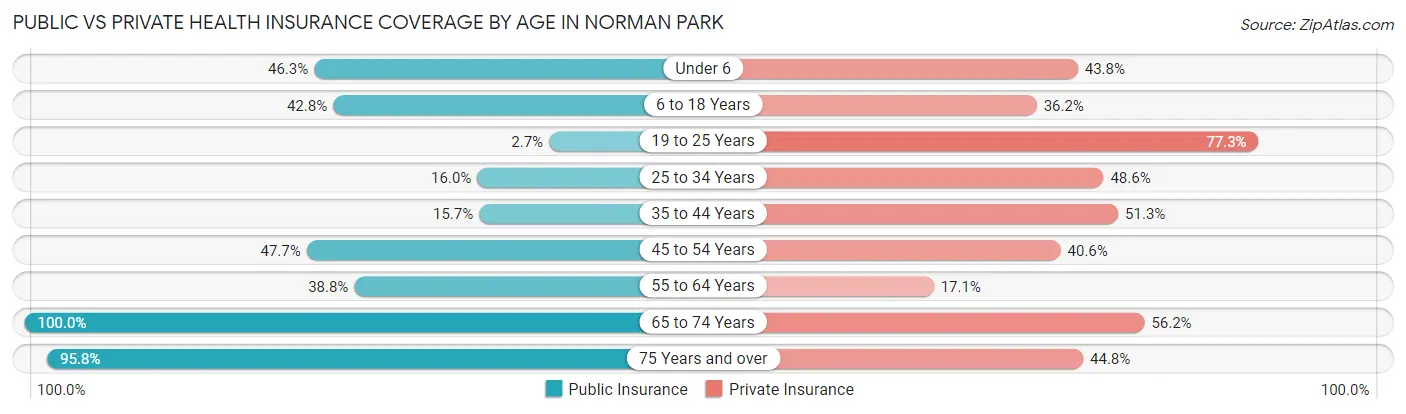
| Age Bracket | Public Insurance | Private Insurance |
| Under 6 | 56 (46.3%) | 53 (43.8%) |
| 6 to 18 Years | 65 (42.8%) | 55 (36.2%) |
| 19 to 25 Years | 2 (2.7%) | 58 (77.3%) |
| 25 to 34 Years | 28 (16.0%) | 85 (48.6%) |
| 35 to 44 Years | 18 (15.7%) | 59 (51.3%) |
| 45 to 54 Years | 61 (47.7%) | 52 (40.6%) |
| 55 to 64 Years | 66 (38.8%) | 29 (17.1%) |
| 65 to 74 Years | 89 (100.0%) | 50 (56.2%) |
| 75 Years and over | 92 (95.8%) | 43 (44.8%) |
| Total | 477 (42.5%) | 484 (43.2%) |
Disability Status by Sex by Age in Norman Park
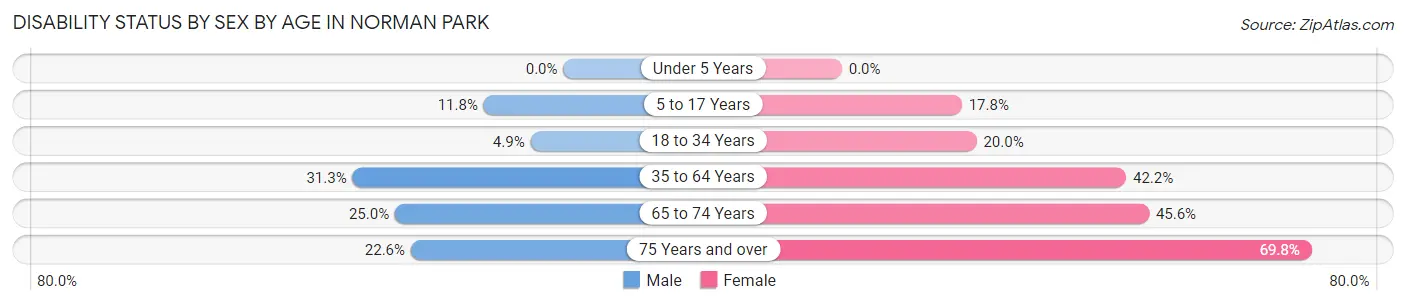
| Age Bracket | Male | Female |
| Under 5 Years | 0 (0.0%) | 0 (0.0%) |
| 5 to 17 Years | 13 (11.8%) | 13 (17.8%) |
| 18 to 34 Years | 6 (4.9%) | 26 (20.0%) |
| 35 to 64 Years | 67 (31.3%) | 84 (42.2%) |
| 65 to 74 Years | 8 (25.0%) | 26 (45.6%) |
| 75 Years and over | 12 (22.6%) | 30 (69.8%) |
Disability Class by Sex by Age in Norman Park
Disability Class: Hearing Difficulty
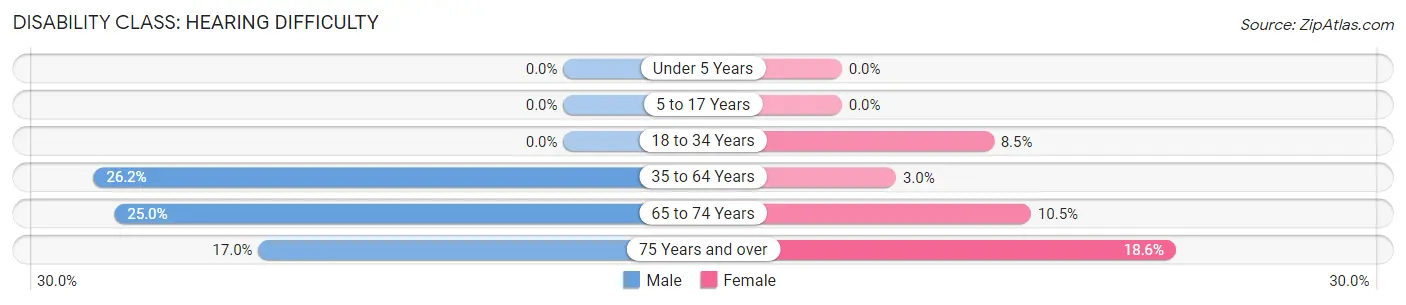
| Age Bracket | Male | Female |
| Under 5 Years | 0 (0.0%) | 0 (0.0%) |
| 5 to 17 Years | 0 (0.0%) | 0 (0.0%) |
| 18 to 34 Years | 0 (0.0%) | 11 (8.5%) |
| 35 to 64 Years | 56 (26.2%) | 6 (3.0%) |
| 65 to 74 Years | 8 (25.0%) | 6 (10.5%) |
| 75 Years and over | 9 (17.0%) | 8 (18.6%) |
Disability Class: Vision Difficulty
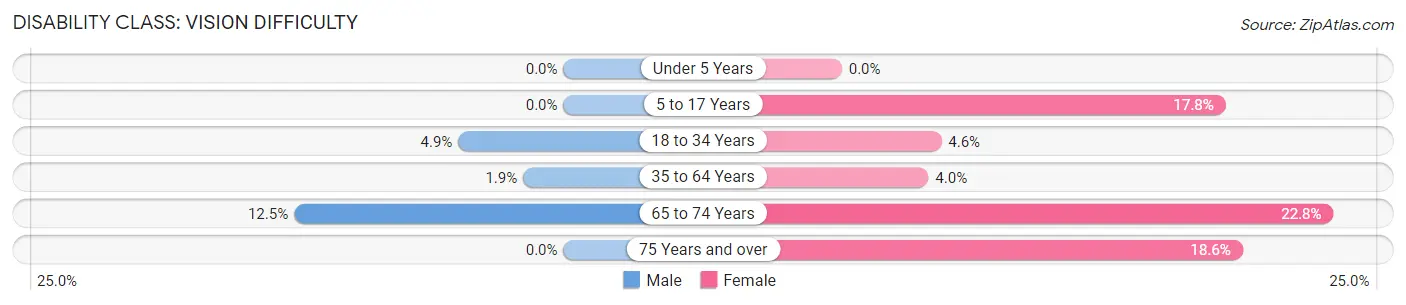
| Age Bracket | Male | Female |
| Under 5 Years | 0 (0.0%) | 0 (0.0%) |
| 5 to 17 Years | 0 (0.0%) | 13 (17.8%) |
| 18 to 34 Years | 6 (4.9%) | 6 (4.6%) |
| 35 to 64 Years | 4 (1.9%) | 8 (4.0%) |
| 65 to 74 Years | 4 (12.5%) | 13 (22.8%) |
| 75 Years and over | 0 (0.0%) | 8 (18.6%) |
Disability Class: Cognitive Difficulty
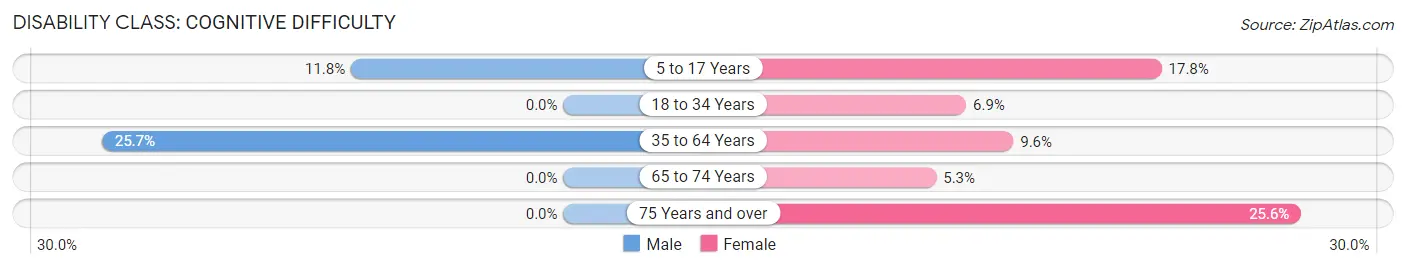
| Age Bracket | Male | Female |
| 5 to 17 Years | 13 (11.8%) | 13 (17.8%) |
| 18 to 34 Years | 0 (0.0%) | 9 (6.9%) |
| 35 to 64 Years | 55 (25.7%) | 19 (9.6%) |
| 65 to 74 Years | 0 (0.0%) | 3 (5.3%) |
| 75 Years and over | 0 (0.0%) | 11 (25.6%) |
Disability Class: Ambulatory Difficulty
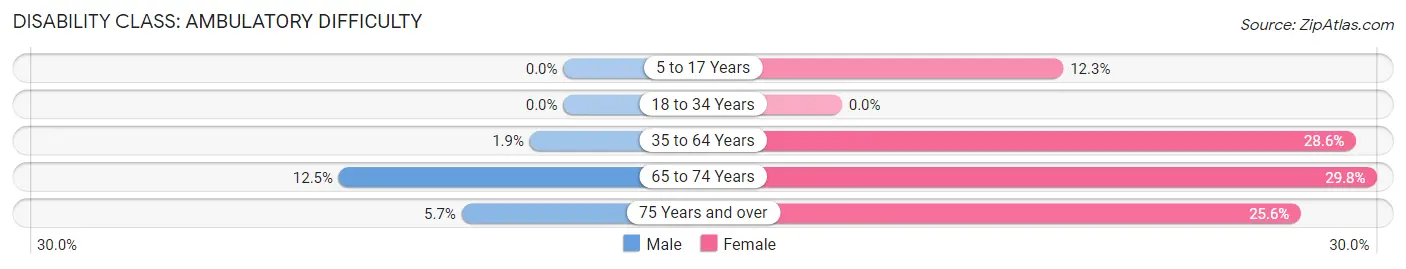
| Age Bracket | Male | Female |
| 5 to 17 Years | 0 (0.0%) | 9 (12.3%) |
| 18 to 34 Years | 0 (0.0%) | 0 (0.0%) |
| 35 to 64 Years | 4 (1.9%) | 57 (28.6%) |
| 65 to 74 Years | 4 (12.5%) | 17 (29.8%) |
| 75 Years and over | 3 (5.7%) | 11 (25.6%) |
Disability Class: Self-Care Difficulty
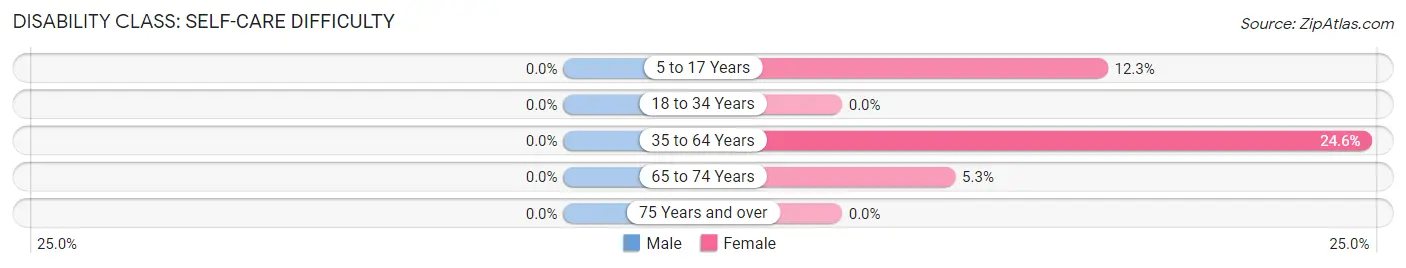
| Age Bracket | Male | Female |
| 5 to 17 Years | 0 (0.0%) | 9 (12.3%) |
| 18 to 34 Years | 0 (0.0%) | 0 (0.0%) |
| 35 to 64 Years | 0 (0.0%) | 49 (24.6%) |
| 65 to 74 Years | 0 (0.0%) | 3 (5.3%) |
| 75 Years and over | 0 (0.0%) | 0 (0.0%) |
Technology Access in Norman Park
Computing Device Access in Norman Park
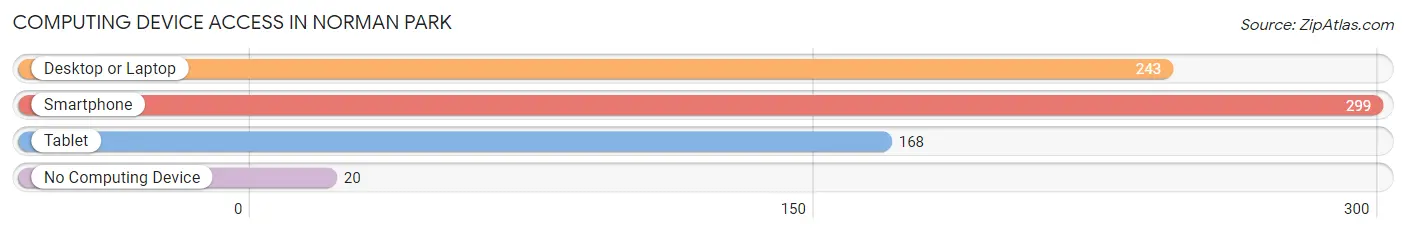
| Device Type | # Households | % Households |
| Desktop or Laptop | 243 | 60.5% |
| Smartphone | 299 | 74.4% |
| Tablet | 168 | 41.8% |
| No Computing Device | 20 | 5.0% |
| Total | 402 | 100.0% |
Internet Access in Norman Park
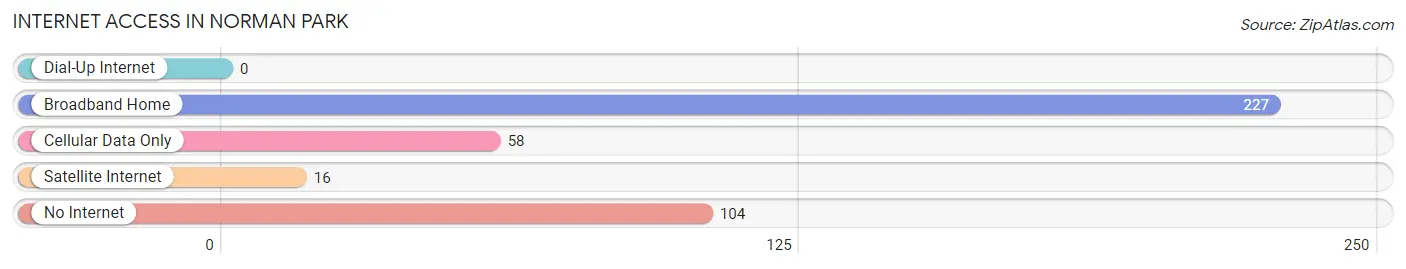
| Internet Type | # Households | % Households |
| Dial-Up Internet | 0 | 0.0% |
| Broadband Home | 227 | 56.5% |
| Cellular Data Only | 58 | 14.4% |
| Satellite Internet | 16 | 4.0% |
| No Internet | 104 | 25.9% |
| Total | 402 | 100.0% |
Norman Park Summary
Norman Park is a small town located in Colquitt County, Georgia, United States. It is situated in the southwestern part of the state, about 20 miles south of Albany and about 30 miles north of Valdosta. The population of Norman Park was estimated to be 1,072 in 2019.
Geography
Norman Park is located at 31°14'25" North, 84°17'45" West (31.240278, -84.295833). It is situated in the southwestern part of the state, about 20 miles south of Albany and about 30 miles north of Valdosta. The town is located in the flatwoods region of Georgia, with an elevation of approximately 200 feet above sea level. The town is surrounded by pine and hardwood forests, and is located near the Flint River.
History
Norman Park was founded in 1891 by a group of settlers from Alabama. The town was named after the first postmaster, William Norman. The town was incorporated in 1895, and the first mayor was elected in 1896.
The town grew slowly, but steadily, and by the early 1900s, it had become a thriving agricultural community. Cotton was the main crop grown in the area, and the town was home to several cotton gins and warehouses. The town also had a sawmill, a gristmill, and a brickyard.
In the 1920s, the town began to experience a decline in population as many of the residents moved away to larger cities in search of better job opportunities. The Great Depression of the 1930s further exacerbated the decline, and by 1940, the population had dropped to just over 500.
The town experienced a resurgence in the 1950s, as the economy began to improve and new businesses began to open. The town was also home to a number of small manufacturing plants, which provided jobs for many of the residents.
Economy
Norman Park’s economy is largely based on agriculture and manufacturing. The town is home to several cotton gins and warehouses, as well as a sawmill, a gristmill, and a brickyard. The town is also home to several small manufacturing plants, which provide jobs for many of the residents.
The town is also home to a number of small businesses, including restaurants, retail stores, and service providers. The town is also home to a number of churches, which provide spiritual guidance and support to the community.
Demographics
As of the 2010 census, the population of Norman Park was 1,072. The racial makeup of the town was 79.2% White, 17.7% African American, 0.3% Native American, 0.3% Asian, 0.1% Pacific Islander, 0.7% from other races, and 1.9% from two or more races. Hispanic or Latino of any race were 2.2% of the population.
The median income for a household in the town was $30,000, and the median income for a family was $35,000. The per capita income for the town was $14,000. About 18.2% of families and 21.2% of the population were below the poverty line, including 28.3% of those under age 18 and 16.7% of those age 65 or over.
Common Questions
What is Per Capita Income in Norman Park?
Per Capita income in Norman Park is $22,817.
What is the Median Family Income in Norman Park?
Median Family Income in Norman Park is $67,684.
What is the Median Household income in Norman Park?
Median Household Income in Norman Park is $53,833.
What is Income or Wage Gap in Norman Park?
Income or Wage Gap in Norman Park is 28.2%.
Women in Norman Park earn 71.8 cents for every dollar earned by a man.
What is Inequality or Gini Index in Norman Park?
Inequality or Gini Index in Norman Park is 0.37.
What is the Total Population of Norman Park?
Total Population of Norman Park is 1,121.
What is the Total Male Population of Norman Park?
Total Male Population of Norman Park is 585.
What is the Total Female Population of Norman Park?
Total Female Population of Norman Park is 536.
What is the Ratio of Males per 100 Females in Norman Park?
There are 109.14 Males per 100 Females in Norman Park.
What is the Ratio of Females per 100 Males in Norman Park?
There are 91.62 Females per 100 Males in Norman Park.
What is the Median Population Age in Norman Park?
Median Population Age in Norman Park is 36.9 Years.
What is the Average Family Size in Norman Park
Average Family Size in Norman Park is 3.4 People.
What is the Average Household Size in Norman Park
Average Household Size in Norman Park is 2.8 People.
How Large is the Labor Force in Norman Park?
There are 512 People in the Labor Forcein in Norman Park.
What is the Percentage of People in the Labor Force in Norman Park?
59.0% of People are in the Labor Force in Norman Park.
What is the Unemployment Rate in Norman Park?
Unemployment Rate in Norman Park is 6.3%.