Zip Codes with the Highest Percentage of Population Employed in Life, Physical & Social Science in Snellville, GA
RELATED REPORTS & OPTIONS
Life, Physical & Social Science
Snellville
Compare Zip Codes
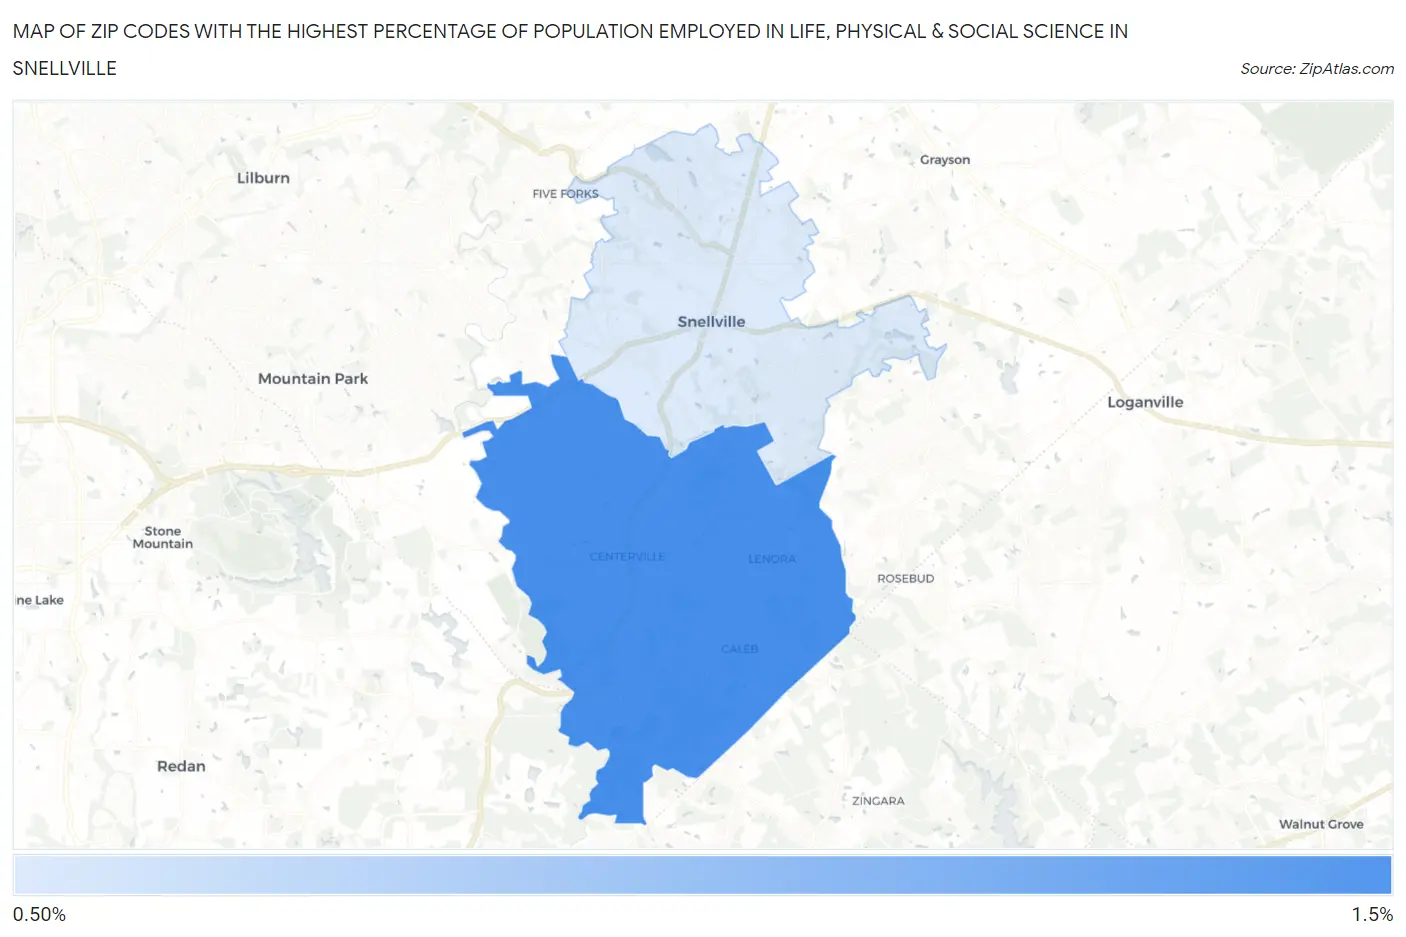
Map of Zip Codes with the Highest Percentage of Population Employed in Life, Physical & Social Science in Snellville
1.1%
1.2%
Zip Codes with the Highest Percentage of Population Employed in Life, Physical & Social Science in Snellville, GA
| Zip Code | % Employed | vs State | vs National | |
| 1. | 30039 | 1.2% | 0.91%(+0.275)#148 | 1.1%(+0.097)#7,576 |
| 2. | 30078 | 1.1% | 0.91%(+0.208)#161 | 1.1%(+0.029)#8,069 |
1
Common Questions
What are the Top Zip Codes with the Highest Percentage of Population Employed in Life, Physical & Social Science in Snellville, GA?
Top Zip Codes with the Highest Percentage of Population Employed in Life, Physical & Social Science in Snellville, GA are:
What zip code has the Highest Percentage of Population Employed in Life, Physical & Social Science in Snellville, GA?
30039 has the Highest Percentage of Population Employed in Life, Physical & Social Science in Snellville, GA with 1.2%.
What is the Percentage of Population Employed in Life, Physical & Social Science in Snellville, GA?
Percentage of Population Employed in Life, Physical & Social Science in Snellville is 1.8%.
What is the Percentage of Population Employed in Life, Physical & Social Science in Georgia?
Percentage of Population Employed in Life, Physical & Social Science in Georgia is 0.91%.
What is the Percentage of Population Employed in Life, Physical & Social Science in the United States?
Percentage of Population Employed in Life, Physical & Social Science in the United States is 1.1%.