Cowlitz County, WA Map & Demographics
Cowlitz County Map
Cowlitz County Overview
$35,526
PER CAPITA INCOME
$83,138
AVG FAMILY INCOME
$70,912
AVG HOUSEHOLD INCOME
38.4%
WAGE / INCOME GAP [ % ]
61.6¢/ $1
WAGE / INCOME GAP [ $ ]
$11,291
FAMILY INCOME DEFICIT
0.44
INEQUALITY / GINI INDEX
110,621
TOTAL POPULATION
55,417
MALE POPULATION
55,204
FEMALE POPULATION
100.39
MALES / 100 FEMALES
99.62
FEMALES / 100 MALES
40.8
MEDIAN AGE
3.1
AVG FAMILY SIZE
2.5
AVG HOUSEHOLD SIZE
49,717
LABOR FORCE [ PEOPLE ]
56.2%
PERCENT IN LABOR FORCE
5.5%
UNEMPLOYMENT RATE
Cowlitz County Area Codes
Income in Cowlitz County
Income Overview in Cowlitz County
Per Capita Income in Cowlitz County is $35,526, while median incomes of families and households are $83,138 and $70,912 respectively.
| Characteristic | Number | Measure |
| Per Capita Income | 110,621 | $35,526 |
| Median Family Income | 28,108 | $83,138 |
| Mean Family Income | 28,108 | $104,289 |
| Median Household Income | 43,167 | $70,912 |
| Mean Household Income | 43,167 | $89,300 |
| Income Deficit | 28,108 | $11,291 |
| Wage / Income Gap (%) | 110,621 | 38.39% |
| Wage / Income Gap ($) | 110,621 | 61.61¢ per $1 |
| Gini / Inequality Index | 110,621 | 0.44 |
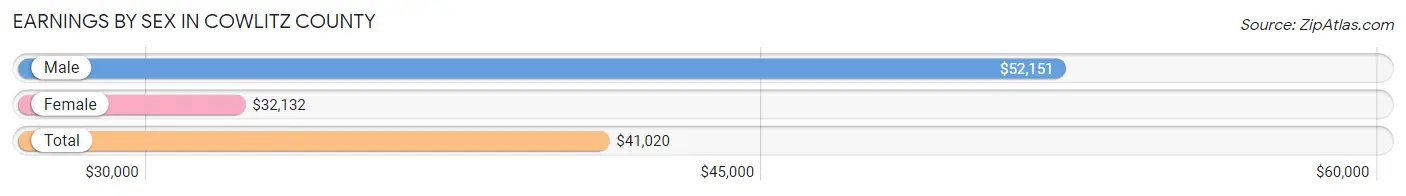
Earnings by Sex in Cowlitz County
Average Earnings in Cowlitz County are $41,020, $52,151 for men and $32,132 for women, a difference of 38.4%.
| Sex | Number | Average Earnings |
| Male | 27,847 (53.1%) | $52,151 |
| Female | 24,545 (46.9%) | $32,132 |
| Total | 52,392 (100.0%) | $41,020 |
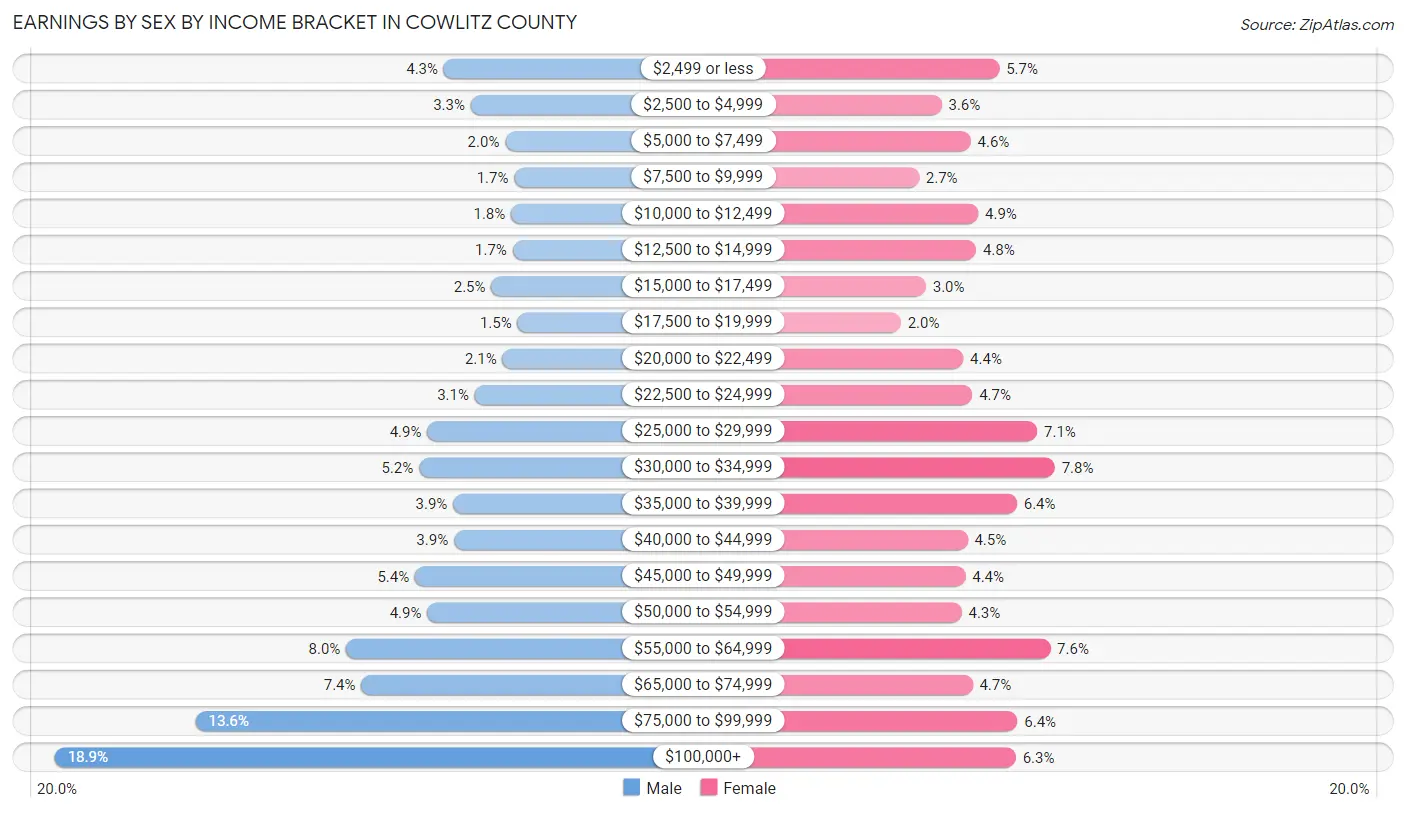
Earnings by Sex by Income Bracket in Cowlitz County
The most common earnings brackets in Cowlitz County are $100,000+ for men (5,255 | 18.9%) and $30,000 to $34,999 for women (1,911 | 7.8%).
| Income | Male | Female |
| $2,499 or less | 1,196 (4.3%) | 1,402 (5.7%) |
| $2,500 to $4,999 | 914 (3.3%) | 872 (3.5%) |
| $5,000 to $7,499 | 555 (2.0%) | 1,139 (4.6%) |
| $7,500 to $9,999 | 459 (1.7%) | 663 (2.7%) |
| $10,000 to $12,499 | 492 (1.8%) | 1,208 (4.9%) |
| $12,500 to $14,999 | 475 (1.7%) | 1,189 (4.8%) |
| $15,000 to $17,499 | 698 (2.5%) | 726 (3.0%) |
| $17,500 to $19,999 | 426 (1.5%) | 495 (2.0%) |
| $20,000 to $22,499 | 583 (2.1%) | 1,069 (4.4%) |
| $22,500 to $24,999 | 872 (3.1%) | 1,153 (4.7%) |
| $25,000 to $29,999 | 1,367 (4.9%) | 1,751 (7.1%) |
| $30,000 to $34,999 | 1,455 (5.2%) | 1,911 (7.8%) |
| $35,000 to $39,999 | 1,098 (3.9%) | 1,563 (6.4%) |
| $40,000 to $44,999 | 1,089 (3.9%) | 1,109 (4.5%) |
| $45,000 to $49,999 | 1,495 (5.4%) | 1,091 (4.4%) |
| $50,000 to $54,999 | 1,366 (4.9%) | 1,056 (4.3%) |
| $55,000 to $64,999 | 2,213 (8.0%) | 1,870 (7.6%) |
| $65,000 to $74,999 | 2,055 (7.4%) | 1,156 (4.7%) |
| $75,000 to $99,999 | 3,784 (13.6%) | 1,568 (6.4%) |
| $100,000+ | 5,255 (18.9%) | 1,554 (6.3%) |
| Total | 27,847 (100.0%) | 24,545 (100.0%) |
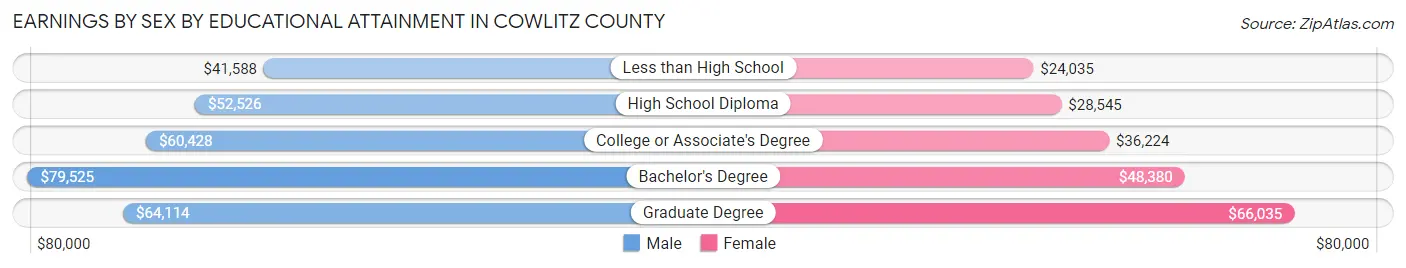
Earnings by Sex by Educational Attainment in Cowlitz County
Average earnings in Cowlitz County are $57,680 for men and $35,069 for women, a difference of 39.2%. Men with an educational attainment of bachelor's degree enjoy the highest average annual earnings of $79,525, while those with less than high school education earn the least with $41,588. Women with an educational attainment of graduate degree earn the most with the average annual earnings of $66,035, while those with less than high school education have the smallest earnings of $24,035.
| Educational Attainment | Male Income | Female Income |
| Less than High School | $41,588 | $24,035 |
| High School Diploma | $52,526 | $28,545 |
| College or Associate's Degree | $60,428 | $36,224 |
| Bachelor's Degree | $79,525 | $48,380 |
| Graduate Degree | $64,114 | $66,035 |
| Total | $57,680 | $35,069 |
Family Income in Cowlitz County
Family Income Brackets in Cowlitz County
According to the Cowlitz County family income data, there are 5,537 families falling into the $100,000 to $149,999 income range, which is the most common income bracket and makes up 19.7% of all families. Conversely, the $10,000 to $14,999 income bracket is the least frequent group with only 618 families (2.2%) belonging to this category.
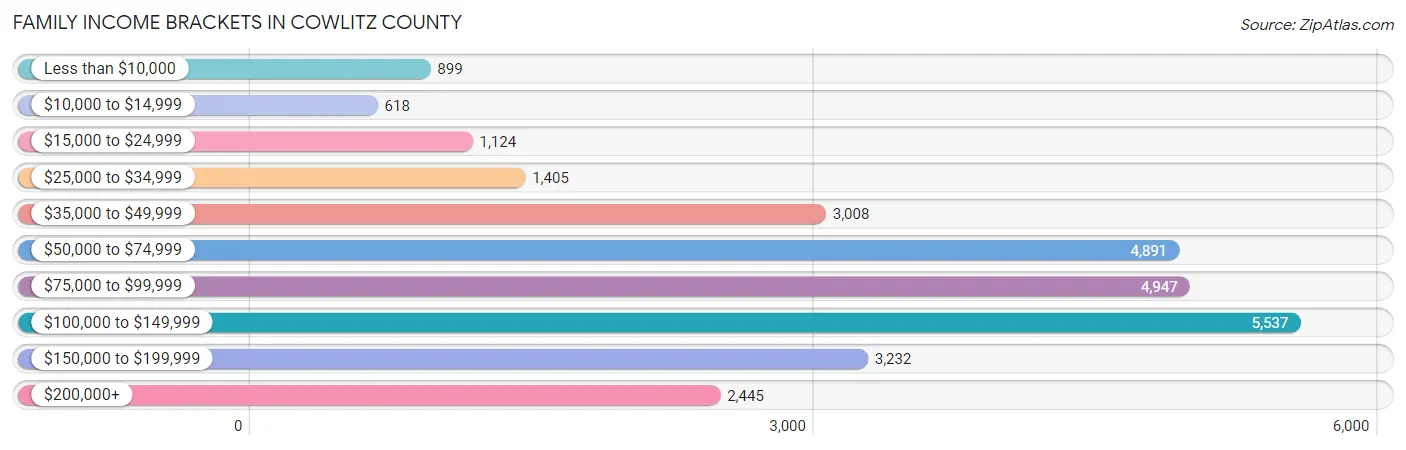
| Income Bracket | # Families | % Families |
| Less than $10,000 | 899 | 3.2% |
| $10,000 to $14,999 | 618 | 2.2% |
| $15,000 to $24,999 | 1,124 | 4.0% |
| $25,000 to $34,999 | 1,405 | 5.0% |
| $35,000 to $49,999 | 3,008 | 10.7% |
| $50,000 to $74,999 | 4,891 | 17.4% |
| $75,000 to $99,999 | 4,947 | 17.6% |
| $100,000 to $149,999 | 5,537 | 19.7% |
| $150,000 to $199,999 | 3,232 | 11.5% |
| $200,000+ | 2,445 | 8.7% |
Family Income by Famaliy Size in Cowlitz County
7+ person families (743 | 2.6%) account for the highest median family income in Cowlitz County with $155,815 per family, while 2-person families (14,144 | 50.3%) have the highest median income of $39,066 per family member.
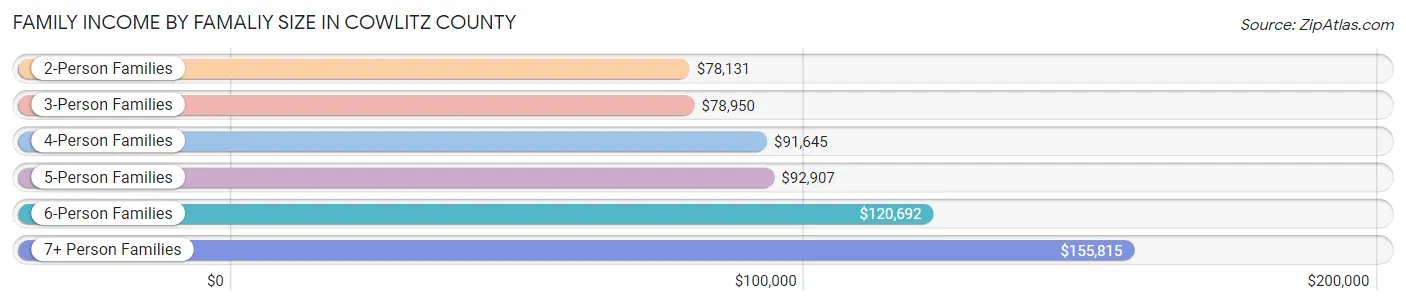
| Income Bracket | # Families | Median Income |
| 2-Person Families | 14,144 (50.3%) | $78,131 |
| 3-Person Families | 6,141 (21.8%) | $78,950 |
| 4-Person Families | 4,091 (14.5%) | $91,645 |
| 5-Person Families | 2,047 (7.3%) | $92,907 |
| 6-Person Families | 942 (3.4%) | $120,692 |
| 7+ Person Families | 743 (2.6%) | $155,815 |
| Total | 28,108 (100.0%) | $83,138 |
Family Income by Number of Earners in Cowlitz County
The median family income in Cowlitz County is $83,138, with families comprising 3+ earners (2,408) having the highest median family income of $155,577, while families with no earners (5,591) have the lowest median family income of $52,254, accounting for 8.6% and 19.9% of families, respectively.
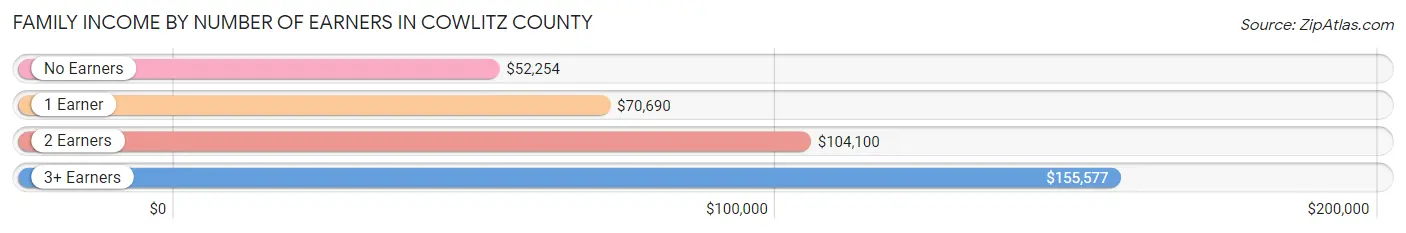
| Number of Earners | # Families | Median Income |
| No Earners | 5,591 (19.9%) | $52,254 |
| 1 Earner | 9,375 (33.4%) | $70,690 |
| 2 Earners | 10,734 (38.2%) | $104,100 |
| 3+ Earners | 2,408 (8.6%) | $155,577 |
| Total | 28,108 (100.0%) | $83,138 |
Household Income in Cowlitz County
Household Income Brackets in Cowlitz County
With 7,209 households falling in the category, the $100,000 to $149,999 income range is the most frequent in Cowlitz County, accounting for 16.7% of all households. In contrast, only 1,597 households (3.7%) fall into the $10,000 to $14,999 income bracket, making it the least populous group.
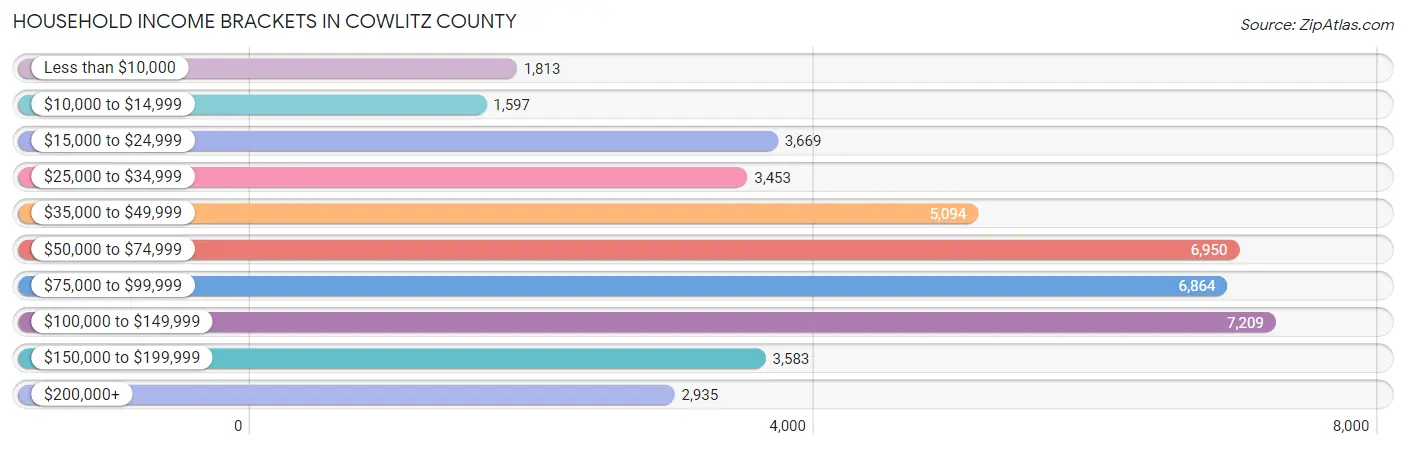
| Income Bracket | # Households | % Households |
| Less than $10,000 | 1,813 | 4.2% |
| $10,000 to $14,999 | 1,597 | 3.7% |
| $15,000 to $24,999 | 3,669 | 8.5% |
| $25,000 to $34,999 | 3,453 | 8.0% |
| $35,000 to $49,999 | 5,094 | 11.8% |
| $50,000 to $74,999 | 6,950 | 16.1% |
| $75,000 to $99,999 | 6,864 | 15.9% |
| $100,000 to $149,999 | 7,209 | 16.7% |
| $150,000 to $199,999 | 3,583 | 8.3% |
| $200,000+ | 2,935 | 6.8% |
Household Income by Householder Age in Cowlitz County
The median household income in Cowlitz County is $70,912, with the highest median household income of $83,598 found in the 45 to 64 years age bracket for the primary householder. A total of 15,504 households (35.9%) fall into this category. Meanwhile, the 65+ years age bracket for the primary householder has the lowest median household income of $50,486, with 13,507 households (31.3%) in this group.
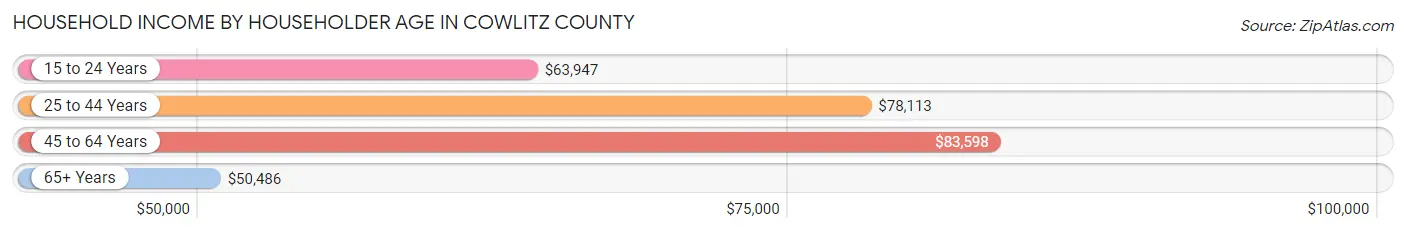
| Income Bracket | # Households | Median Income |
| 15 to 24 Years | 1,242 (2.9%) | $63,947 |
| 25 to 44 Years | 12,914 (29.9%) | $78,113 |
| 45 to 64 Years | 15,504 (35.9%) | $83,598 |
| 65+ Years | 13,507 (31.3%) | $50,486 |
| Total | 43,167 (100.0%) | $70,912 |
Poverty in Cowlitz County
Income Below Poverty by Sex and Age in Cowlitz County
With 11.2% poverty level for males and 13.1% for females among the residents of Cowlitz County, 15 year old males and under 5 year old females are the most vulnerable to poverty, with 200 males (23.6%) and 521 females (17.3%) in their respective age groups living below the poverty level.
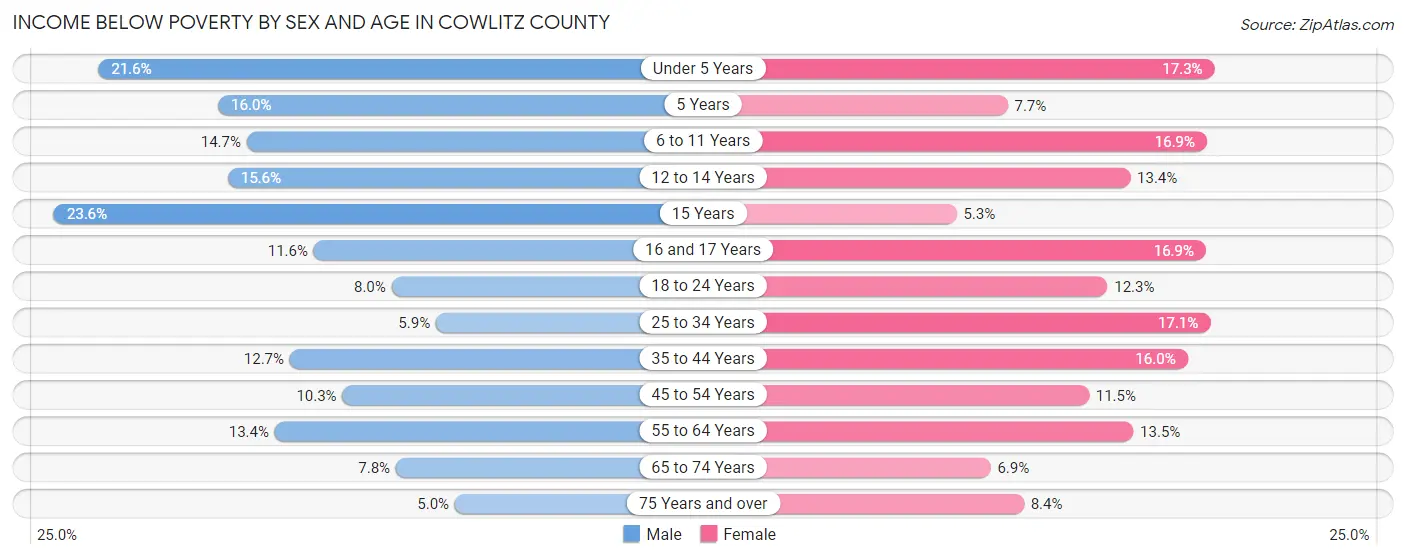
| Age Bracket | Male | Female |
| Under 5 Years | 715 (21.6%) | 521 (17.3%) |
| 5 Years | 91 (16.0%) | 45 (7.7%) |
| 6 to 11 Years | 631 (14.7%) | 641 (16.9%) |
| 12 to 14 Years | 355 (15.6%) | 284 (13.4%) |
| 15 Years | 200 (23.6%) | 36 (5.3%) |
| 16 and 17 Years | 153 (11.6%) | 255 (16.9%) |
| 18 to 24 Years | 355 (8.0%) | 503 (12.3%) |
| 25 to 34 Years | 401 (5.9%) | 1,186 (17.1%) |
| 35 to 44 Years | 850 (12.7%) | 1,044 (16.0%) |
| 45 to 54 Years | 679 (10.2%) | 760 (11.5%) |
| 55 to 64 Years | 1,020 (13.4%) | 1,036 (13.5%) |
| 65 to 74 Years | 488 (7.8%) | 445 (6.9%) |
| 75 Years and over | 183 (5.0%) | 376 (8.4%) |
| Total | 6,121 (11.2%) | 7,132 (13.1%) |
Income Above Poverty by Sex and Age in Cowlitz County
According to the poverty statistics in Cowlitz County, males aged 75 years and over and females aged 15 years are the age groups that are most secure financially, with 95.0% of males and 94.7% of females in these age groups living above the poverty line.
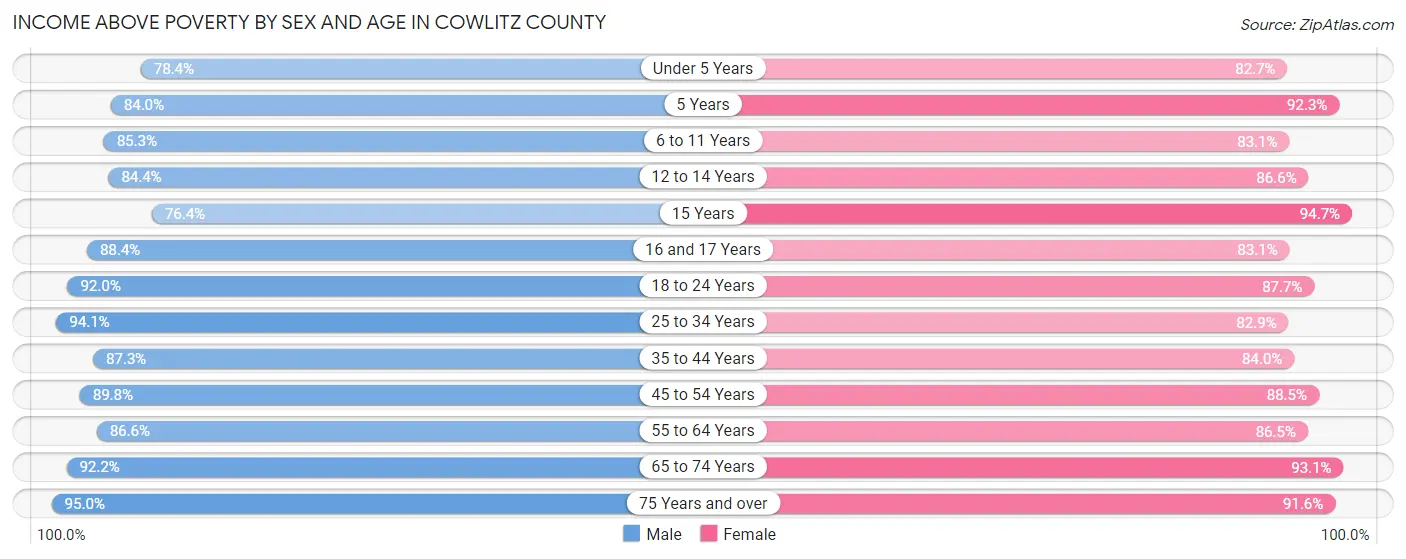
| Age Bracket | Male | Female |
| Under 5 Years | 2,599 (78.4%) | 2,493 (82.7%) |
| 5 Years | 477 (84.0%) | 540 (92.3%) |
| 6 to 11 Years | 3,665 (85.3%) | 3,142 (83.1%) |
| 12 to 14 Years | 1,925 (84.4%) | 1,839 (86.6%) |
| 15 Years | 646 (76.4%) | 641 (94.7%) |
| 16 and 17 Years | 1,168 (88.4%) | 1,255 (83.1%) |
| 18 to 24 Years | 4,097 (92.0%) | 3,581 (87.7%) |
| 25 to 34 Years | 6,382 (94.1%) | 5,754 (82.9%) |
| 35 to 44 Years | 5,847 (87.3%) | 5,466 (84.0%) |
| 45 to 54 Years | 5,948 (89.7%) | 5,872 (88.5%) |
| 55 to 64 Years | 6,598 (86.6%) | 6,627 (86.5%) |
| 65 to 74 Years | 5,792 (92.2%) | 6,002 (93.1%) |
| 75 Years and over | 3,457 (95.0%) | 4,078 (91.6%) |
| Total | 48,601 (88.8%) | 47,290 (86.9%) |
Income Below Poverty Among Married-Couple Families in Cowlitz County
The poverty statistics for married-couple families in Cowlitz County show that 3.7% or 776 of the total 20,848 families live below the poverty line. Families with 3 or 4 children have the highest poverty rate of 6.1%, comprising of 109 families. On the other hand, families with no children have the lowest poverty rate of 2.7%, which includes 364 families.
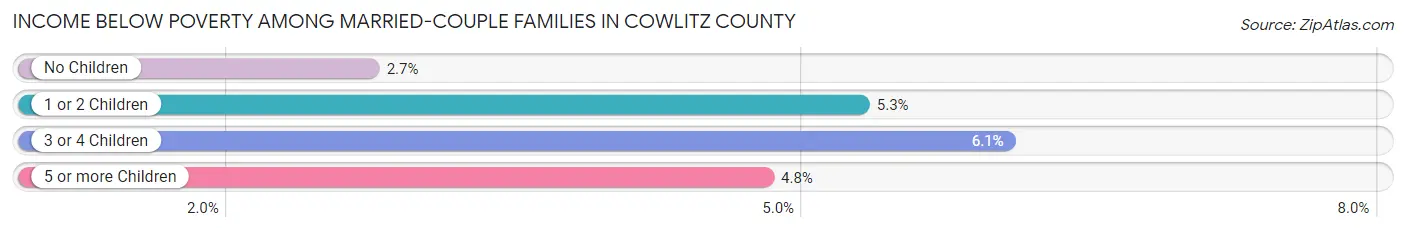
| Children | Above Poverty | Below Poverty |
| No Children | 12,939 (97.3%) | 364 (2.7%) |
| 1 or 2 Children | 5,204 (94.7%) | 291 (5.3%) |
| 3 or 4 Children | 1,691 (93.9%) | 109 (6.1%) |
| 5 or more Children | 238 (95.2%) | 12 (4.8%) |
| Total | 20,072 (96.3%) | 776 (3.7%) |
Income Below Poverty Among Single-Parent Households in Cowlitz County
According to the poverty data in Cowlitz County, 8.7% or 190 single-father households and 26.5% or 1,344 single-mother households are living below the poverty line. Among single-father households, those with 3 or 4 children have the highest poverty rate, with 16 households (15.7%) experiencing poverty. Likewise, among single-mother households, those with 3 or 4 children have the highest poverty rate, with 246 households (49.9%) falling below the poverty line.
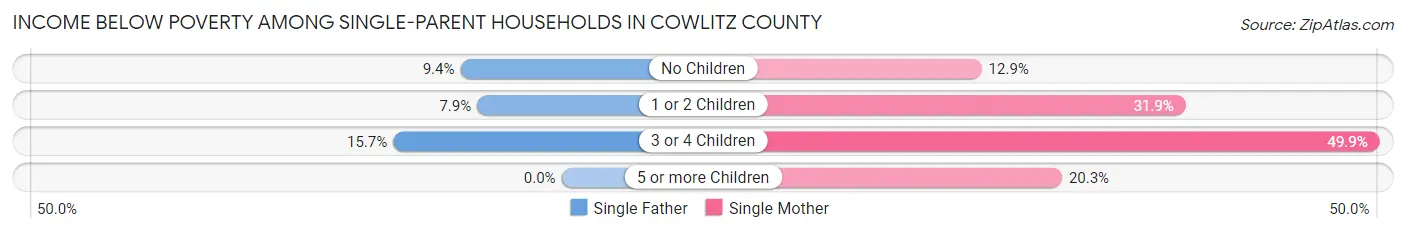
| Children | Single Father | Single Mother |
| No Children | 58 (9.4%) | 233 (12.9%) |
| 1 or 2 Children | 116 (7.9%) | 840 (31.9%) |
| 3 or 4 Children | 16 (15.7%) | 246 (49.9%) |
| 5 or more Children | 0 (0.0%) | 25 (20.3%) |
| Total | 190 (8.7%) | 1,344 (26.5%) |
Income Below Poverty Among Married-Couple vs Single-Parent Households in Cowlitz County
The poverty data for Cowlitz County shows that 776 of the married-couple family households (3.7%) and 1,534 of the single-parent households (21.1%) are living below the poverty level. Within the married-couple family households, those with 3 or 4 children have the highest poverty rate, with 109 households (6.1%) falling below the poverty line. Among the single-parent households, those with 3 or 4 children have the highest poverty rate, with 262 household (44.0%) living below poverty.
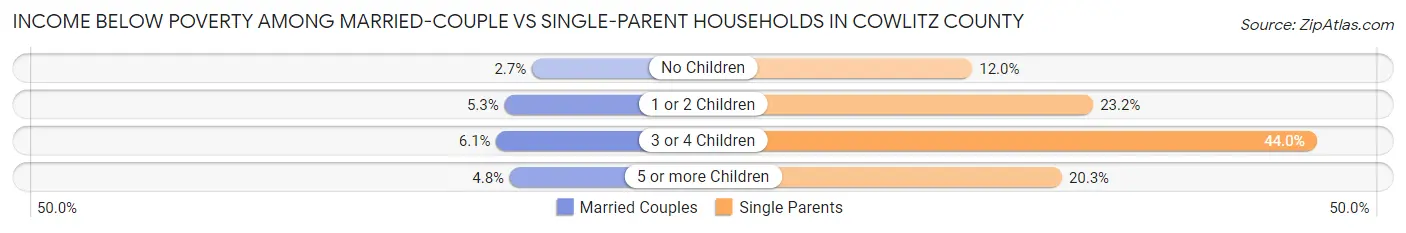
| Children | Married-Couple Families | Single-Parent Households |
| No Children | 364 (2.7%) | 291 (12.0%) |
| 1 or 2 Children | 291 (5.3%) | 956 (23.2%) |
| 3 or 4 Children | 109 (6.1%) | 262 (44.0%) |
| 5 or more Children | 12 (4.8%) | 25 (20.3%) |
| Total | 776 (3.7%) | 1,534 (21.1%) |
Race in Cowlitz County
The most populous races in Cowlitz County are White / Caucasian (95,070 | 85.9%), Hispanic or Latino (10,851 | 9.8%), and Two or more Races (8,916 | 8.1%).
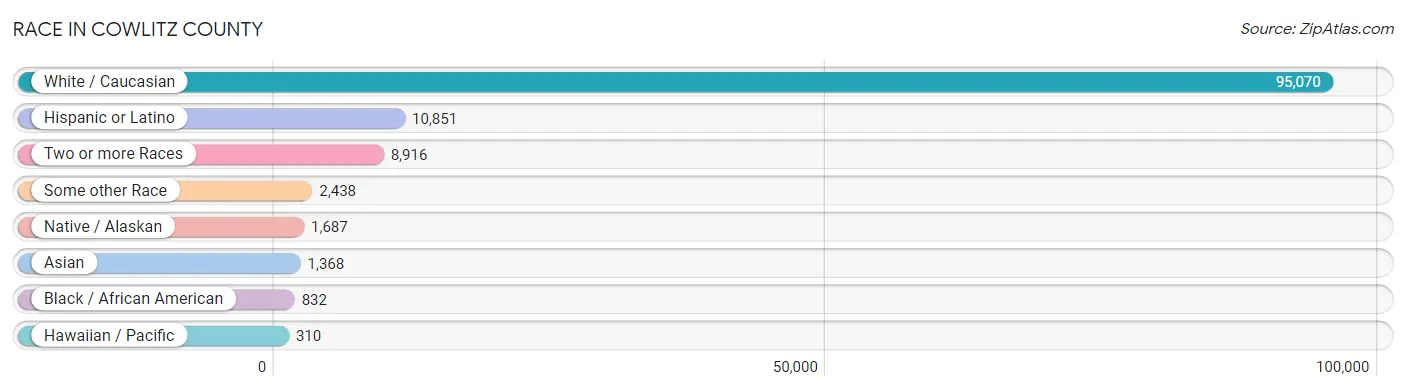
| Race | # Population | % Population |
| Asian | 1,368 | 1.2% |
| Black / African American | 832 | 0.7% |
| Hawaiian / Pacific | 310 | 0.3% |
| Hispanic or Latino | 10,851 | 9.8% |
| Native / Alaskan | 1,687 | 1.5% |
| White / Caucasian | 95,070 | 85.9% |
| Two or more Races | 8,916 | 8.1% |
| Some other Race | 2,438 | 2.2% |
| Total | 110,621 | 100.0% |
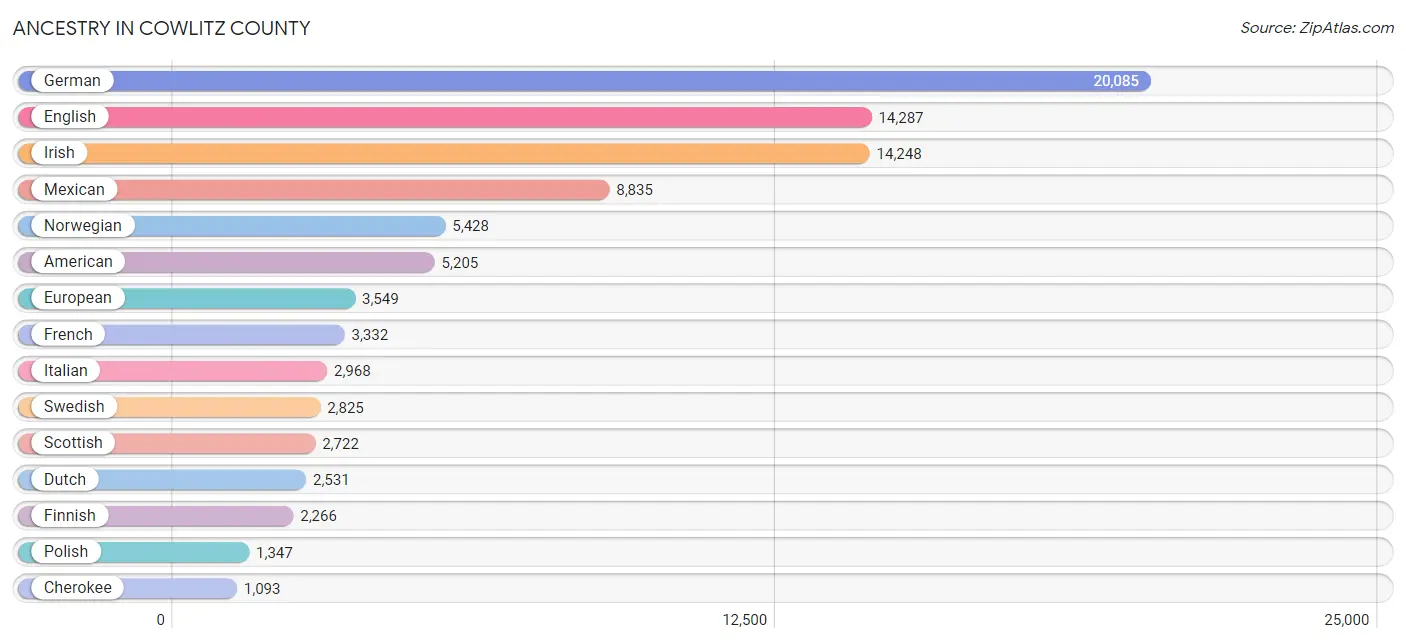
Ancestry in Cowlitz County
The most populous ancestries reported in Cowlitz County are German (20,085 | 18.2%), English (14,287 | 12.9%), Irish (14,248 | 12.9%), Mexican (8,835 | 8.0%), and Norwegian (5,428 | 4.9%), together accounting for 56.9% of all Cowlitz County residents.
| Ancestry | # Population | % Population |
| African | 100 | 0.1% |
| Alaska Native | 30 | 0.0% |
| Alaskan Athabascan | 76 | 0.1% |
| Albanian | 5 | 0.0% |
| Aleut | 1 | 0.0% |
| American | 5,205 | 4.7% |
| Apache | 72 | 0.1% |
| Arab | 124 | 0.1% |
| Argentinean | 11 | 0.0% |
| Armenian | 8 | 0.0% |
| Australian | 77 | 0.1% |
| Austrian | 416 | 0.4% |
| Basque | 43 | 0.0% |
| Belgian | 96 | 0.1% |
| Bhutanese | 410 | 0.4% |
| Blackfeet | 257 | 0.2% |
| British | 533 | 0.5% |
| British West Indian | 9 | 0.0% |
| Burmese | 206 | 0.2% |
| Cajun | 13 | 0.0% |
| Cambodian | 19 | 0.0% |
| Canadian | 287 | 0.3% |
| Celtic | 11 | 0.0% |
| Central American | 658 | 0.6% |
| Central American Indian | 129 | 0.1% |
| Cherokee | 1,093 | 1.0% |
| Chickasaw | 16 | 0.0% |
| Chippewa | 125 | 0.1% |
| Choctaw | 127 | 0.1% |
| Colombian | 205 | 0.2% |
| Comanche | 13 | 0.0% |
| Creek | 19 | 0.0% |
| Croatian | 227 | 0.2% |
| Crow | 79 | 0.1% |
| Cuban | 153 | 0.1% |
| Czech | 197 | 0.2% |
| Czechoslovakian | 32 | 0.0% |
| Danish | 914 | 0.8% |
| Delaware | 9 | 0.0% |
| Dominican | 72 | 0.1% |
| Dutch | 2,531 | 2.3% |
| Eastern European | 317 | 0.3% |
| English | 14,287 | 12.9% |
| Ethiopian | 109 | 0.1% |
| European | 3,549 | 3.2% |
| Finnish | 2,266 | 2.1% |
| French | 3,332 | 3.0% |
| French American Indian | 245 | 0.2% |
| French Canadian | 842 | 0.8% |
| German | 20,085 | 18.2% |
| German Russian | 4 | 0.0% |
| Greek | 93 | 0.1% |
| Guamanian / Chamorro | 81 | 0.1% |
| Guatemalan | 498 | 0.4% |
| Honduran | 42 | 0.0% |
| Hopi | 85 | 0.1% |
| Hungarian | 274 | 0.3% |
| Icelander | 106 | 0.1% |
| Indian (Asian) | 578 | 0.5% |
| Inupiat | 8 | 0.0% |
| Iranian | 51 | 0.1% |
| Irish | 14,248 | 12.9% |
| Italian | 2,968 | 2.7% |
| Jamaican | 251 | 0.2% |
| Japanese | 212 | 0.2% |
| Korean | 648 | 0.6% |
| Laotian | 11 | 0.0% |
| Latvian | 39 | 0.0% |
| Lebanese | 35 | 0.0% |
| Lithuanian | 103 | 0.1% |
| Luxembourger | 3 | 0.0% |
| Malaysian | 42 | 0.0% |
| Maltese | 7 | 0.0% |
| Menominee | 18 | 0.0% |
| Mexican | 8,835 | 8.0% |
| Mexican American Indian | 526 | 0.5% |
| Native Hawaiian | 257 | 0.2% |
| Nigerian | 36 | 0.0% |
| Northern European | 483 | 0.4% |
| Norwegian | 5,428 | 4.9% |
| Paiute | 27 | 0.0% |
| Panamanian | 23 | 0.0% |
| Pennsylvania German | 11 | 0.0% |
| Peruvian | 37 | 0.0% |
| Polish | 1,347 | 1.2% |
| Portuguese | 325 | 0.3% |
| Puerto Rican | 192 | 0.2% |
| Puget Sound Salish | 15 | 0.0% |
| Romanian | 171 | 0.2% |
| Russian | 442 | 0.4% |
| Salvadoran | 95 | 0.1% |
| Samoan | 177 | 0.2% |
| Scandinavian | 986 | 0.9% |
| Scotch-Irish | 1,023 | 0.9% |
| Scottish | 2,722 | 2.5% |
| Seminole | 13 | 0.0% |
| Serbian | 15 | 0.0% |
| Sioux | 235 | 0.2% |
| Slavic | 53 | 0.1% |
| Slovak | 26 | 0.0% |
| Slovene | 57 | 0.1% |
| South African | 22 | 0.0% |
| South American | 253 | 0.2% |
| Spaniard | 227 | 0.2% |
| Spanish | 299 | 0.3% |
| Spanish American Indian | 4 | 0.0% |
| Sri Lankan | 464 | 0.4% |
| Subsaharan African | 301 | 0.3% |
| Swedish | 2,825 | 2.5% |
| Swiss | 430 | 0.4% |
| Thai | 104 | 0.1% |
| Tlingit-Haida | 108 | 0.1% |
| Tongan | 48 | 0.0% |
| Tsimshian | 22 | 0.0% |
| Ukrainian | 92 | 0.1% |
| Ute | 16 | 0.0% |
| Welsh | 517 | 0.5% |
| West Indian | 27 | 0.0% |
| Yakama | 29 | 0.0% |
| Yugoslavian | 3 | 0.0% |
| Yuman | 8 | 0.0% |
| Yup'ik | 6 | 0.0% | View All 122 Rows |
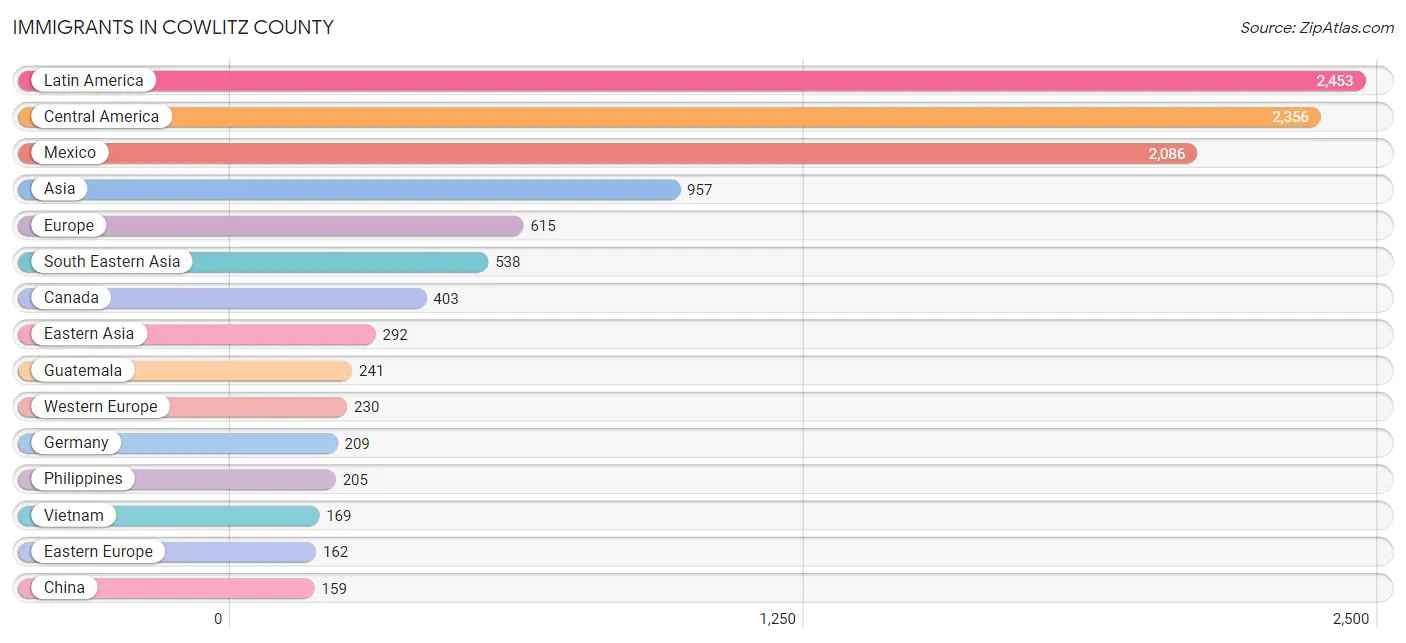
Immigrants in Cowlitz County
The most numerous immigrant groups reported in Cowlitz County came from Latin America (2,453 | 2.2%), Central America (2,356 | 2.1%), Mexico (2,086 | 1.9%), Asia (957 | 0.9%), and Europe (615 | 0.6%), together accounting for 7.7% of all Cowlitz County residents.
| Immigration Origin | # Population | % Population |
| Africa | 79 | 0.1% |
| Asia | 957 | 0.9% |
| Australia | 17 | 0.0% |
| Azores | 30 | 0.0% |
| Cambodia | 96 | 0.1% |
| Canada | 403 | 0.4% |
| Caribbean | 16 | 0.0% |
| Central America | 2,356 | 2.1% |
| China | 159 | 0.1% |
| Colombia | 61 | 0.1% |
| Cuba | 14 | 0.0% |
| Dominican Republic | 2 | 0.0% |
| Eastern Africa | 37 | 0.0% |
| Eastern Asia | 292 | 0.3% |
| Eastern Europe | 162 | 0.2% |
| El Salvador | 8 | 0.0% |
| England | 47 | 0.0% |
| Ethiopia | 37 | 0.0% |
| Europe | 615 | 0.6% |
| Fiji | 30 | 0.0% |
| Germany | 209 | 0.2% |
| Guatemala | 241 | 0.2% |
| Honduras | 21 | 0.0% |
| Hong Kong | 6 | 0.0% |
| India | 26 | 0.0% |
| Indonesia | 26 | 0.0% |
| Iran | 26 | 0.0% |
| Ireland | 17 | 0.0% |
| Japan | 64 | 0.1% |
| Kazakhstan | 54 | 0.1% |
| Korea | 50 | 0.1% |
| Laos | 42 | 0.0% |
| Latin America | 2,453 | 2.2% |
| Latvia | 25 | 0.0% |
| Lebanon | 21 | 0.0% |
| Mexico | 2,086 | 1.9% |
| Netherlands | 17 | 0.0% |
| Nigeria | 12 | 0.0% |
| Northern Europe | 98 | 0.1% |
| Norway | 10 | 0.0% |
| Oceania | 67 | 0.1% |
| Peru | 20 | 0.0% |
| Philippines | 205 | 0.2% |
| Portugal | 68 | 0.1% |
| Russia | 97 | 0.1% |
| Scotland | 4 | 0.0% |
| South Africa | 30 | 0.0% |
| South America | 81 | 0.1% |
| South Central Asia | 106 | 0.1% |
| South Eastern Asia | 538 | 0.5% |
| Southern Europe | 125 | 0.1% |
| Spain | 57 | 0.1% |
| Sweden | 11 | 0.0% |
| Switzerland | 4 | 0.0% |
| Taiwan | 13 | 0.0% |
| Ukraine | 24 | 0.0% |
| Vietnam | 169 | 0.2% |
| Western Africa | 12 | 0.0% |
| Western Asia | 21 | 0.0% |
| Western Europe | 230 | 0.2% | View All 60 Rows |
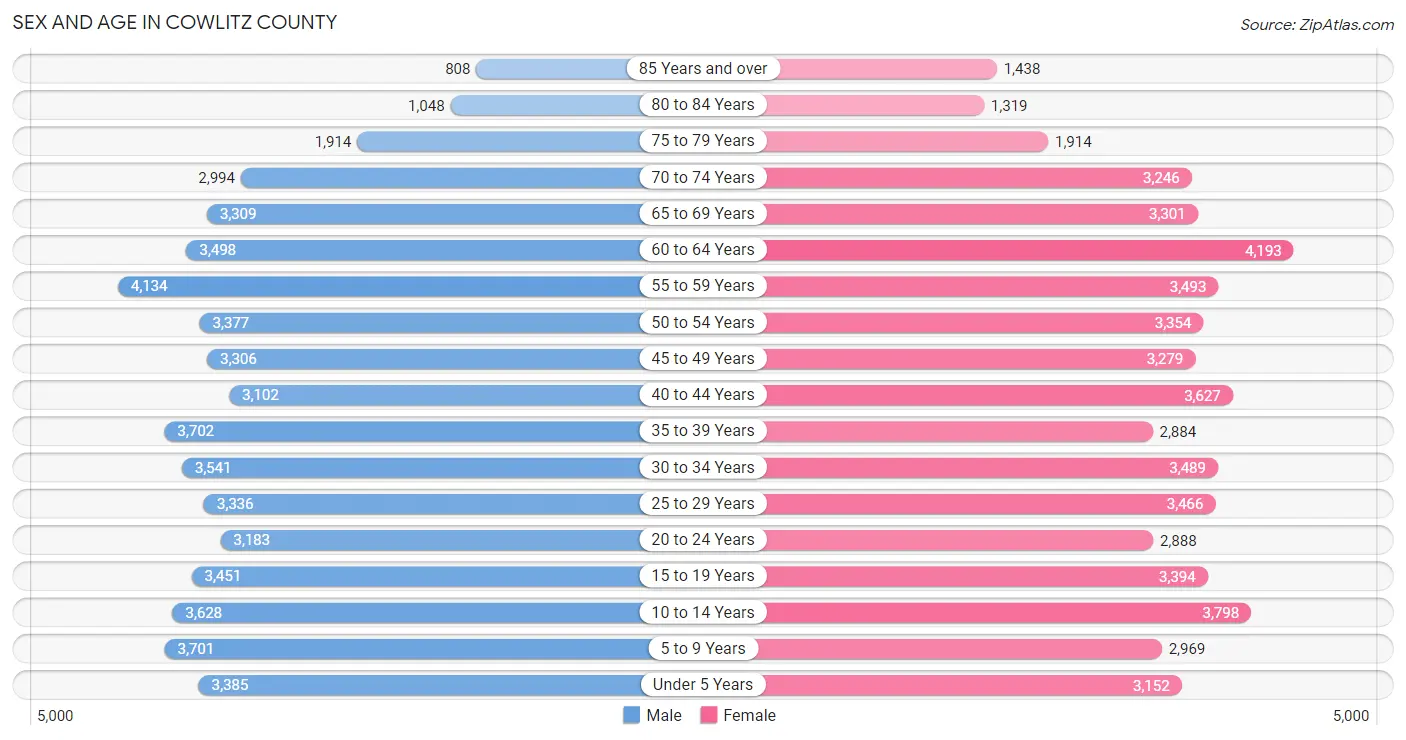
Sex and Age in Cowlitz County
Sex and Age in Cowlitz County
The most populous age groups in Cowlitz County are 55 to 59 Years (4,134 | 7.5%) for men and 60 to 64 Years (4,193 | 7.6%) for women.
| Age Bracket | Male | Female |
| Under 5 Years | 3,385 (6.1%) | 3,152 (5.7%) |
| 5 to 9 Years | 3,701 (6.7%) | 2,969 (5.4%) |
| 10 to 14 Years | 3,628 (6.6%) | 3,798 (6.9%) |
| 15 to 19 Years | 3,451 (6.2%) | 3,394 (6.1%) |
| 20 to 24 Years | 3,183 (5.7%) | 2,888 (5.2%) |
| 25 to 29 Years | 3,336 (6.0%) | 3,466 (6.3%) |
| 30 to 34 Years | 3,541 (6.4%) | 3,489 (6.3%) |
| 35 to 39 Years | 3,702 (6.7%) | 2,884 (5.2%) |
| 40 to 44 Years | 3,102 (5.6%) | 3,627 (6.6%) |
| 45 to 49 Years | 3,306 (6.0%) | 3,279 (5.9%) |
| 50 to 54 Years | 3,377 (6.1%) | 3,354 (6.1%) |
| 55 to 59 Years | 4,134 (7.5%) | 3,493 (6.3%) |
| 60 to 64 Years | 3,498 (6.3%) | 4,193 (7.6%) |
| 65 to 69 Years | 3,309 (6.0%) | 3,301 (6.0%) |
| 70 to 74 Years | 2,994 (5.4%) | 3,246 (5.9%) |
| 75 to 79 Years | 1,914 (3.5%) | 1,914 (3.5%) |
| 80 to 84 Years | 1,048 (1.9%) | 1,319 (2.4%) |
| 85 Years and over | 808 (1.5%) | 1,438 (2.6%) |
| Total | 55,417 (100.0%) | 55,204 (100.0%) |
Families and Households in Cowlitz County
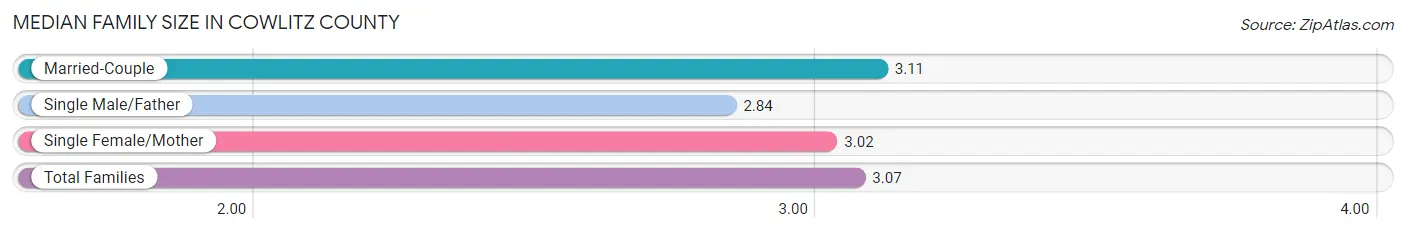
Median Family Size in Cowlitz County
The median family size in Cowlitz County is 3.07 persons per family, with married-couple families (20,848 | 74.2%) accounting for the largest median family size of 3.11 persons per family. On the other hand, single male/father families (2,194 | 7.8%) represent the smallest median family size with 2.84 persons per family.
| Family Type | # Families | Family Size |
| Married-Couple | 20,848 (74.2%) | 3.11 |
| Single Male/Father | 2,194 (7.8%) | 2.84 |
| Single Female/Mother | 5,066 (18.0%) | 3.02 |
| Total Families | 28,108 (100.0%) | 3.07 |
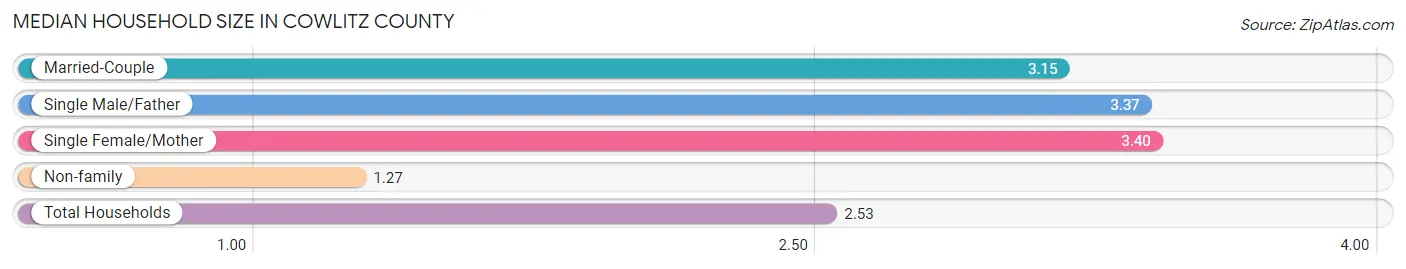
Median Household Size in Cowlitz County
The median household size in Cowlitz County is 2.53 persons per household, with single female/mother households (5,066 | 11.7%) accounting for the largest median household size of 3.4 persons per household. non-family households (15,059 | 34.9%) represent the smallest median household size with 1.27 persons per household.
| Household Type | # Households | Household Size |
| Married-Couple | 20,848 (48.3%) | 3.15 |
| Single Male/Father | 2,194 (5.1%) | 3.37 |
| Single Female/Mother | 5,066 (11.7%) | 3.40 |
| Non-family | 15,059 (34.9%) | 1.27 |
| Total Households | 43,167 (100.0%) | 2.53 |
Household Size by Marriage Status in Cowlitz County
Out of a total of 43,167 households in Cowlitz County, 28,108 (65.1%) are family households, while 15,059 (34.9%) are nonfamily households. The most numerous type of family households are 2-person households, comprising 12,868, and the most common type of nonfamily households are 1-person households, comprising 11,929.
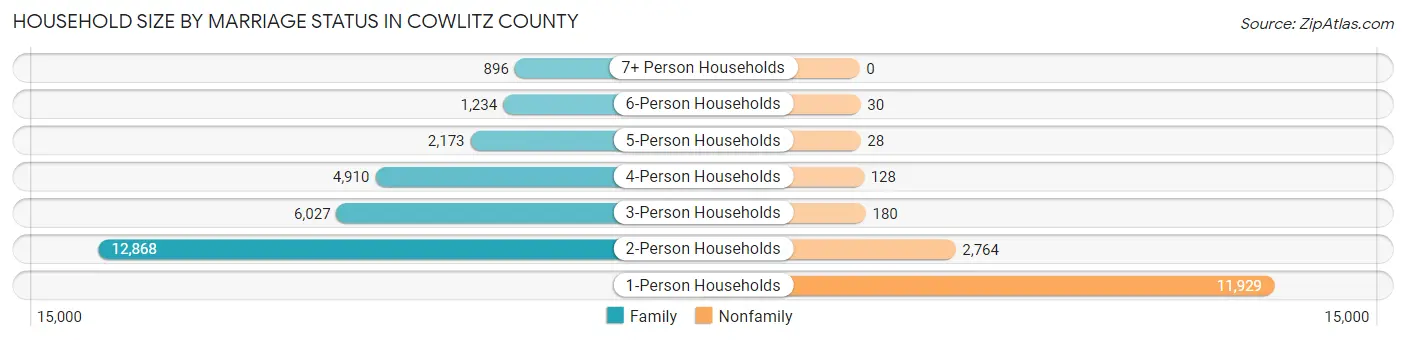
| Household Size | Family Households | Nonfamily Households |
| 1-Person Households | - | 11,929 (27.6%) |
| 2-Person Households | 12,868 (29.8%) | 2,764 (6.4%) |
| 3-Person Households | 6,027 (14.0%) | 180 (0.4%) |
| 4-Person Households | 4,910 (11.4%) | 128 (0.3%) |
| 5-Person Households | 2,173 (5.0%) | 28 (0.1%) |
| 6-Person Households | 1,234 (2.9%) | 30 (0.1%) |
| 7+ Person Households | 896 (2.1%) | 0 (0.0%) |
| Total | 28,108 (65.1%) | 15,059 (34.9%) |
Female Fertility in Cowlitz County
Fertility by Age in Cowlitz County
Average fertility rate in Cowlitz County is 47.0 births per 1,000 women. Women in the age bracket of 20 to 34 years have the highest fertility rate with 86.0 births per 1,000 women. Women in the age bracket of 20 to 34 years acount for 75.7% of all women with births.
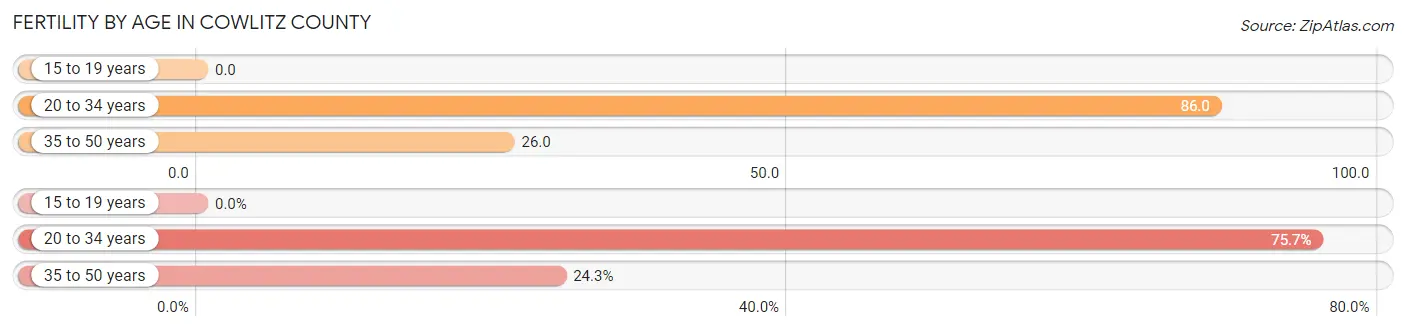
| Age Bracket | Women with Births | Births / 1,000 Women |
| 15 to 19 years | 0 (0.0%) | 0.0 |
| 20 to 34 years | 847 (75.7%) | 86.0 |
| 35 to 50 years | 272 (24.3%) | 26.0 |
| Total | 1,119 (100.0%) | 47.0 |
Fertility by Age by Marriage Status in Cowlitz County
68.6% of women with births (1,119) in Cowlitz County are married. The highest percentage of unmarried women with births falls into 35 to 50 years age bracket with 35.3% of them unmarried at the time of birth, while the lowest percentage of unmarried women with births belong to 20 to 34 years age bracket with 30.1% of them unmarried.
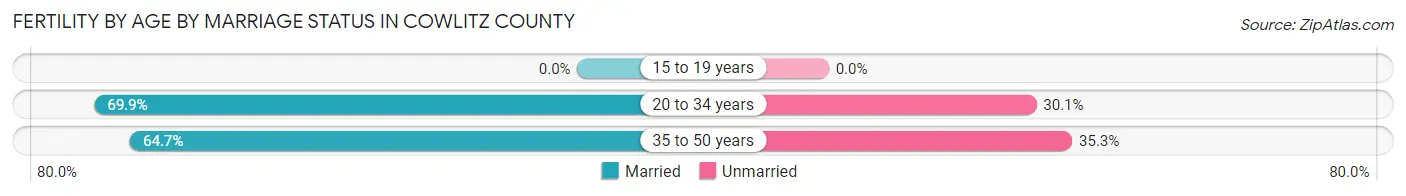
| Age Bracket | Married | Unmarried |
| 15 to 19 years | 0 (0.0%) | 0 (0.0%) |
| 20 to 34 years | 592 (69.9%) | 255 (30.1%) |
| 35 to 50 years | 176 (64.7%) | 96 (35.3%) |
| Total | 768 (68.6%) | 351 (31.4%) |
Fertility by Education in Cowlitz County
Average fertility rate in Cowlitz County is 47.0 births per 1,000 women. Women with the education attainment of bachelor's degree have the highest fertility rate of 80.0 births per 1,000 women, while women with the education attainment of less than high school have the lowest fertility at 18.0 births per 1,000 women. Women with the education attainment of college or associate's degree represent 46.2% of all women with births.
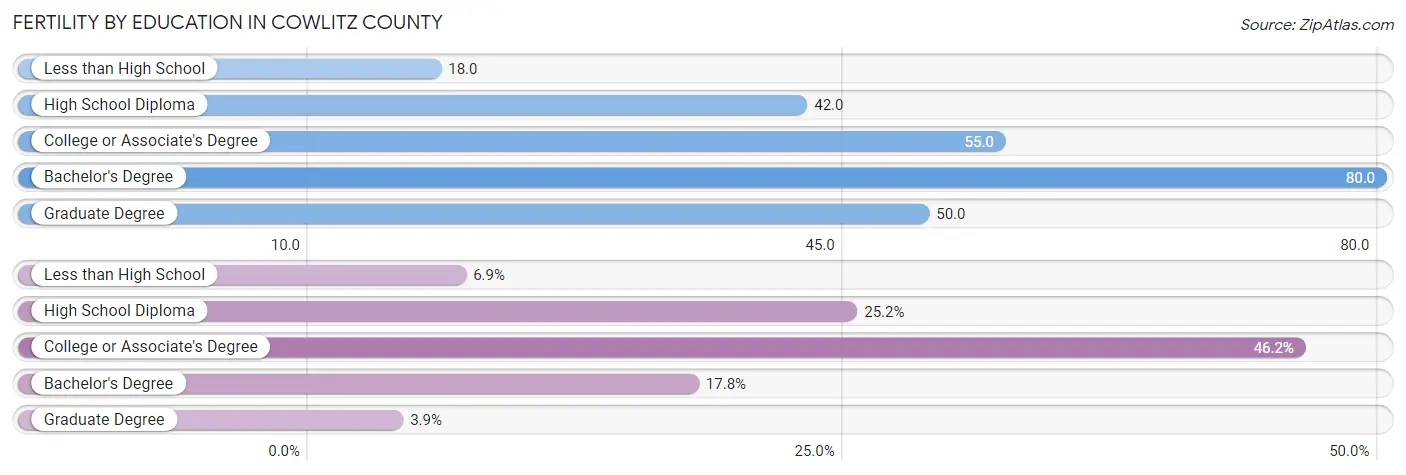
| Educational Attainment | Women with Births | Births / 1,000 Women |
| Less than High School | 77 (6.9%) | 18.0 |
| High School Diploma | 282 (25.2%) | 42.0 |
| College or Associate's Degree | 517 (46.2%) | 55.0 |
| Bachelor's Degree | 199 (17.8%) | 80.0 |
| Graduate Degree | 44 (3.9%) | 50.0 |
| Total | 1,119 (100.0%) | 47.0 |
Fertility by Education by Marriage Status in Cowlitz County
31.4% of women with births in Cowlitz County are unmarried. Women with the educational attainment of graduate degree are most likely to be married with 100.0% of them married at childbirth, while women with the educational attainment of college or associate's degree are least likely to be married with 43.1% of them unmarried at childbirth.
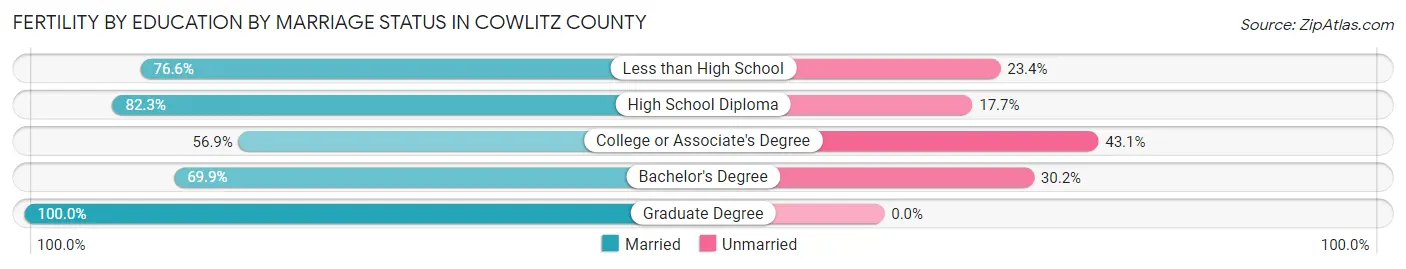
| Educational Attainment | Married | Unmarried |
| Less than High School | 59 (76.6%) | 18 (23.4%) |
| High School Diploma | 232 (82.3%) | 50 (17.7%) |
| College or Associate's Degree | 294 (56.9%) | 223 (43.1%) |
| Bachelor's Degree | 139 (69.9%) | 60 (30.1%) |
| Graduate Degree | 44 (100.0%) | 0 (0.0%) |
| Total | 768 (68.6%) | 351 (31.4%) |
Employment Characteristics in Cowlitz County
Employment by Class of Employer in Cowlitz County
Among the 45,906 employed individuals in Cowlitz County, private company employees (31,670 | 69.0%), not-for-profit organizations (3,451 | 7.5%), and local government employees (3,367 | 7.3%) make up the most common classes of employment.
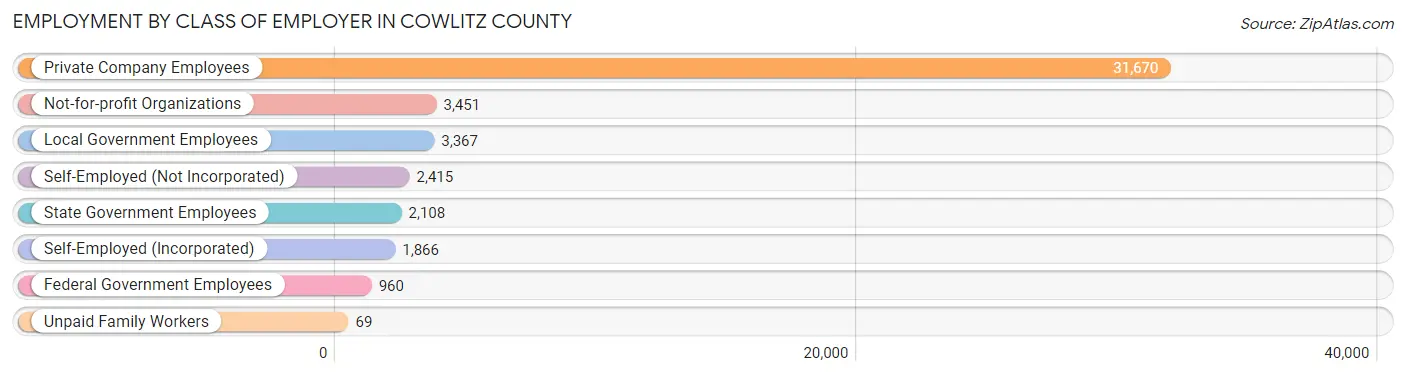
| Employer Class | # Employees | % Employees |
| Private Company Employees | 31,670 | 69.0% |
| Self-Employed (Incorporated) | 1,866 | 4.1% |
| Self-Employed (Not Incorporated) | 2,415 | 5.3% |
| Not-for-profit Organizations | 3,451 | 7.5% |
| Local Government Employees | 3,367 | 7.3% |
| State Government Employees | 2,108 | 4.6% |
| Federal Government Employees | 960 | 2.1% |
| Unpaid Family Workers | 69 | 0.2% |
| Total | 45,906 | 100.0% |
Employment Status by Age in Cowlitz County
According to the labor force statistics for Cowlitz County, out of the total population over 16 years of age (88,464), 56.2% or 49,717 individuals are in the labor force, with 5.5% or 2,734 of them unemployed. The age group with the highest labor force participation rate is 30 to 34 years, with 78.8% or 5,540 individuals in the labor force. Within the labor force, the 16 to 19 years age range has the highest percentage of unemployed individuals, with 15.5% or 359 of them being unemployed.
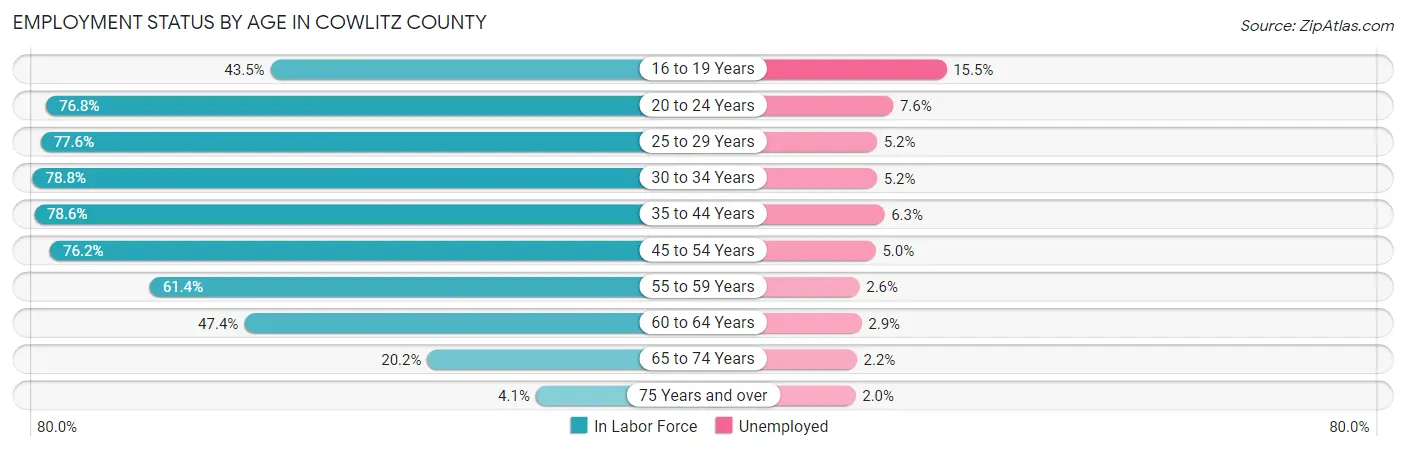
| Age Bracket | In Labor Force | Unemployed |
| 16 to 19 Years | 2,315 (43.5%) | 359 (15.5%) |
| 20 to 24 Years | 4,663 (76.8%) | 354 (7.6%) |
| 25 to 29 Years | 5,278 (77.6%) | 274 (5.2%) |
| 30 to 34 Years | 5,540 (78.8%) | 288 (5.2%) |
| 35 to 44 Years | 10,466 (78.6%) | 659 (6.3%) |
| 45 to 54 Years | 10,147 (76.2%) | 507 (5.0%) |
| 55 to 59 Years | 4,683 (61.4%) | 122 (2.6%) |
| 60 to 64 Years | 3,646 (47.4%) | 106 (2.9%) |
| 65 to 74 Years | 2,596 (20.2%) | 57 (2.2%) |
| 75 Years and over | 346 (4.1%) | 7 (2.0%) |
| Total | 49,717 (56.2%) | 2,734 (5.5%) |
Employment Status by Educational Attainment in Cowlitz County
According to labor force statistics for Cowlitz County, 71.3% of individuals (39,772) out of the total population between 25 and 64 years of age (55,781) are in the labor force, with 4.9% or 1,949 of them being unemployed. The group with the highest labor force participation rate are those with the educational attainment of bachelor's degree or higher, with 77.4% or 6,683 individuals in the labor force. Within the labor force, individuals with college / associate degree education have the highest percentage of unemployment, with 5.4% or 978 of them being unemployed.
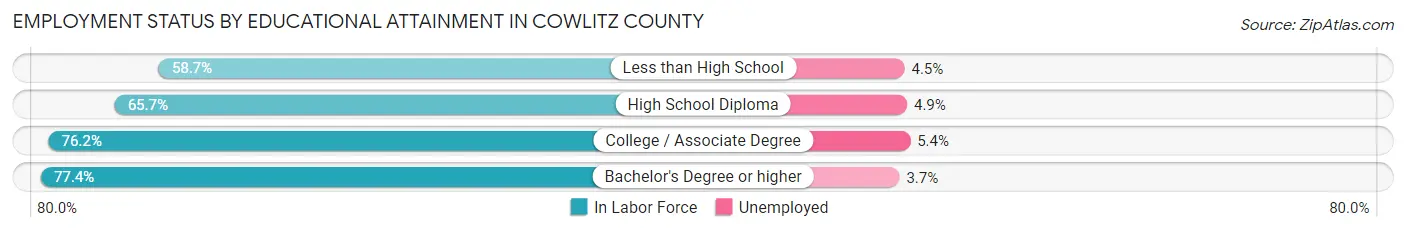
| Educational Attainment | In Labor Force | Unemployed |
| Less than High School | 3,336 (58.7%) | 256 (4.5%) |
| High School Diploma | 11,630 (65.7%) | 867 (4.9%) |
| College / Associate Degree | 18,107 (76.2%) | 1,283 (5.4%) |
| Bachelor's Degree or higher | 6,683 (77.4%) | 319 (3.7%) |
| Total | 39,772 (71.3%) | 2,733 (4.9%) |
Employment Occupations by Sex in Cowlitz County
Management, Business, Science and Arts Occupations
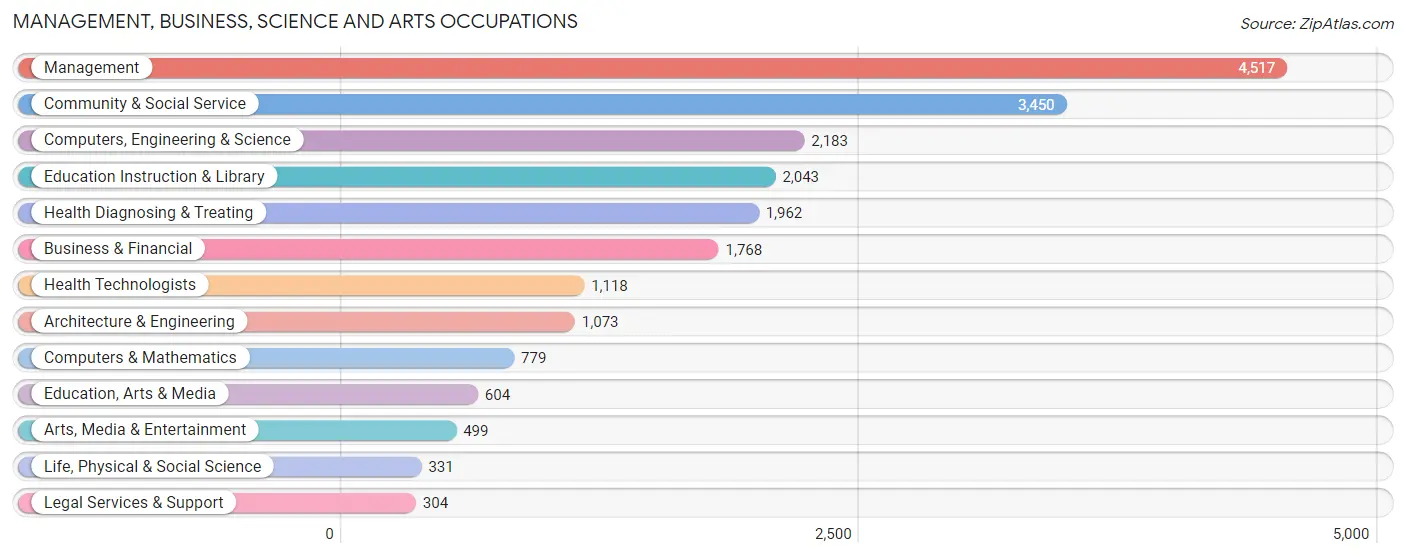
The most common Management, Business, Science and Arts occupations in Cowlitz County are Management (4,517 | 9.6%), Community & Social Service (3,450 | 7.3%), Computers, Engineering & Science (2,183 | 4.6%), Education Instruction & Library (2,043 | 4.3%), and Health Diagnosing & Treating (1,962 | 4.2%).
Management, Business, Science and Arts Occupations by Sex
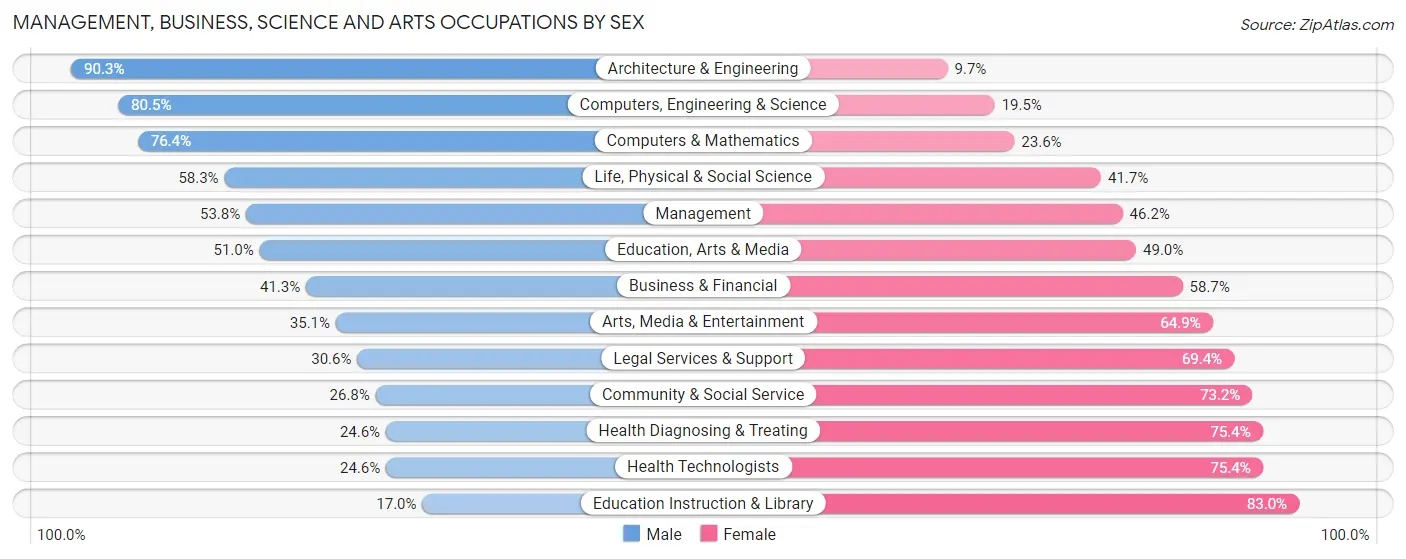
Within the Management, Business, Science and Arts occupations in Cowlitz County, the most male-oriented occupations are Architecture & Engineering (90.3%), Computers, Engineering & Science (80.5%), and Computers & Mathematics (76.4%), while the most female-oriented occupations are Education Instruction & Library (83.0%), Health Technologists (75.4%), and Health Diagnosing & Treating (75.4%).
| Occupation | Male | Female |
| Management | 2,430 (53.8%) | 2,087 (46.2%) |
| Business & Financial | 730 (41.3%) | 1,038 (58.7%) |
| Computers, Engineering & Science | 1,757 (80.5%) | 426 (19.5%) |
| Computers & Mathematics | 595 (76.4%) | 184 (23.6%) |
| Architecture & Engineering | 969 (90.3%) | 104 (9.7%) |
| Life, Physical & Social Science | 193 (58.3%) | 138 (41.7%) |
| Community & Social Service | 924 (26.8%) | 2,526 (73.2%) |
| Education, Arts & Media | 308 (51.0%) | 296 (49.0%) |
| Legal Services & Support | 93 (30.6%) | 211 (69.4%) |
| Education Instruction & Library | 348 (17.0%) | 1,695 (83.0%) |
| Arts, Media & Entertainment | 175 (35.1%) | 324 (64.9%) |
| Health Diagnosing & Treating | 483 (24.6%) | 1,479 (75.4%) |
| Health Technologists | 275 (24.6%) | 843 (75.4%) |
| Total (Category) | 6,324 (45.6%) | 7,556 (54.4%) |
| Total (Overall) | 25,146 (53.6%) | 21,770 (46.4%) |
Services Occupations
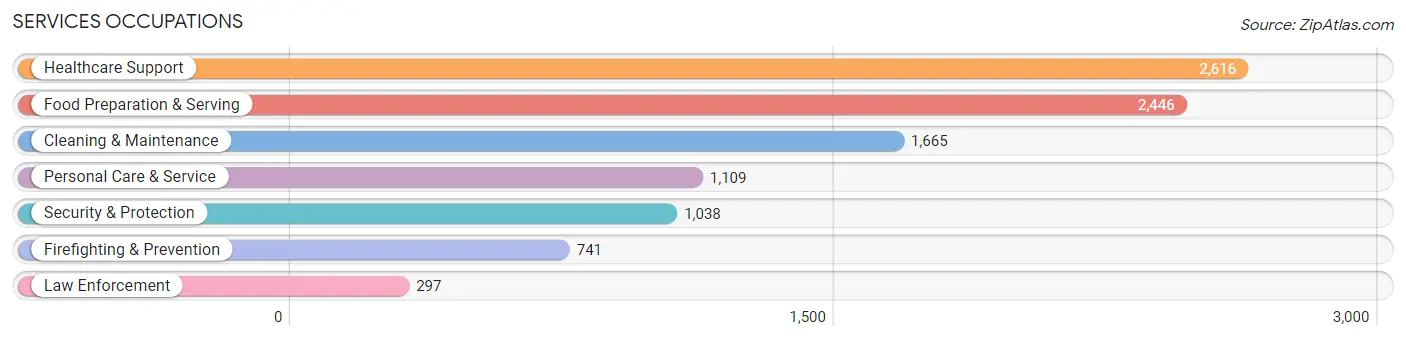
The most common Services occupations in Cowlitz County are Healthcare Support (2,616 | 5.6%), Food Preparation & Serving (2,446 | 5.2%), Cleaning & Maintenance (1,665 | 3.5%), Personal Care & Service (1,109 | 2.4%), and Security & Protection (1,038 | 2.2%).
Services Occupations by Sex
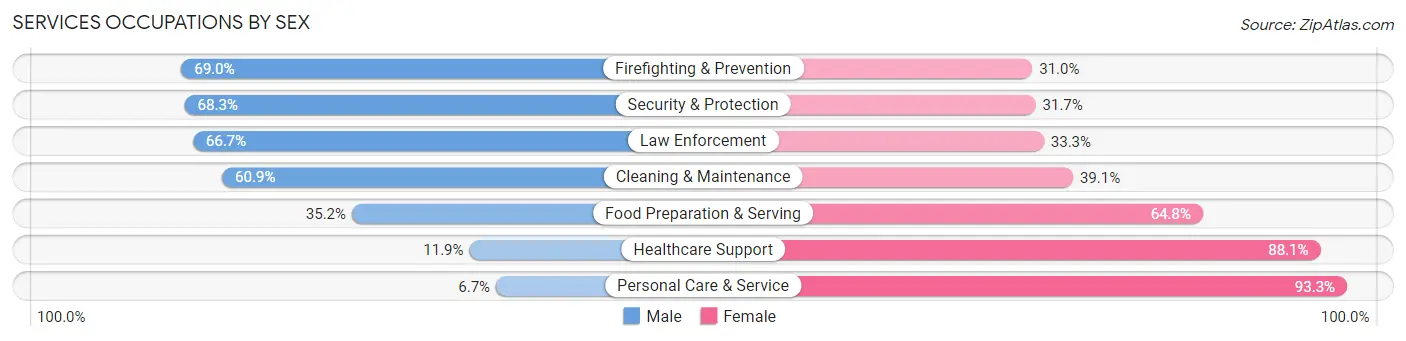
Within the Services occupations in Cowlitz County, the most male-oriented occupations are Firefighting & Prevention (69.0%), Security & Protection (68.3%), and Law Enforcement (66.7%), while the most female-oriented occupations are Personal Care & Service (93.3%), Healthcare Support (88.1%), and Food Preparation & Serving (64.8%).
| Occupation | Male | Female |
| Healthcare Support | 312 (11.9%) | 2,304 (88.1%) |
| Security & Protection | 709 (68.3%) | 329 (31.7%) |
| Firefighting & Prevention | 511 (69.0%) | 230 (31.0%) |
| Law Enforcement | 198 (66.7%) | 99 (33.3%) |
| Food Preparation & Serving | 861 (35.2%) | 1,585 (64.8%) |
| Cleaning & Maintenance | 1,014 (60.9%) | 651 (39.1%) |
| Personal Care & Service | 74 (6.7%) | 1,035 (93.3%) |
| Total (Category) | 2,970 (33.5%) | 5,904 (66.5%) |
| Total (Overall) | 25,146 (53.6%) | 21,770 (46.4%) |
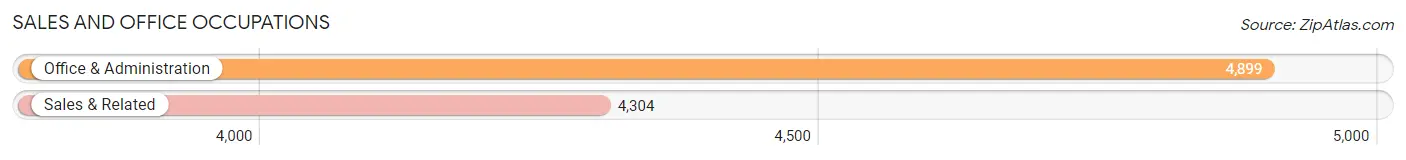
Sales and Office Occupations
The most common Sales and Office occupations in Cowlitz County are Office & Administration (4,899 | 10.4%), and Sales & Related (4,304 | 9.2%).
Sales and Office Occupations by Sex
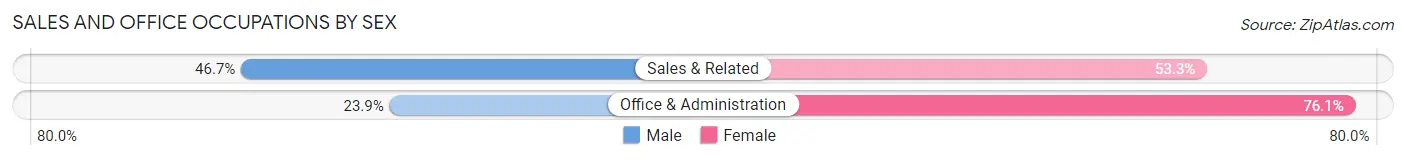
| Occupation | Male | Female |
| Sales & Related | 2,009 (46.7%) | 2,295 (53.3%) |
| Office & Administration | 1,169 (23.9%) | 3,730 (76.1%) |
| Total (Category) | 3,178 (34.5%) | 6,025 (65.5%) |
| Total (Overall) | 25,146 (53.6%) | 21,770 (46.4%) |
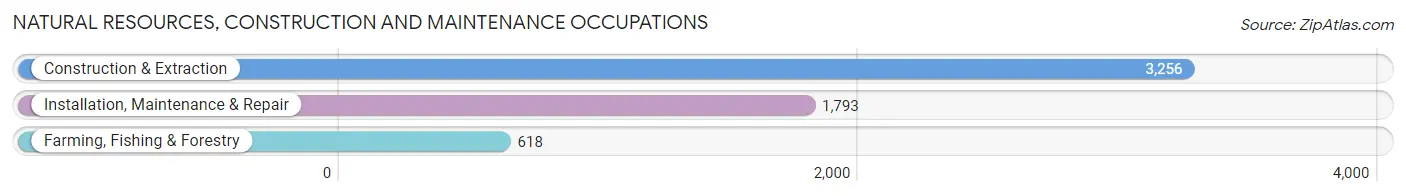
Natural Resources, Construction and Maintenance Occupations
The most common Natural Resources, Construction and Maintenance occupations in Cowlitz County are Construction & Extraction (3,256 | 6.9%), Installation, Maintenance & Repair (1,793 | 3.8%), and Farming, Fishing & Forestry (618 | 1.3%).
Natural Resources, Construction and Maintenance Occupations by Sex
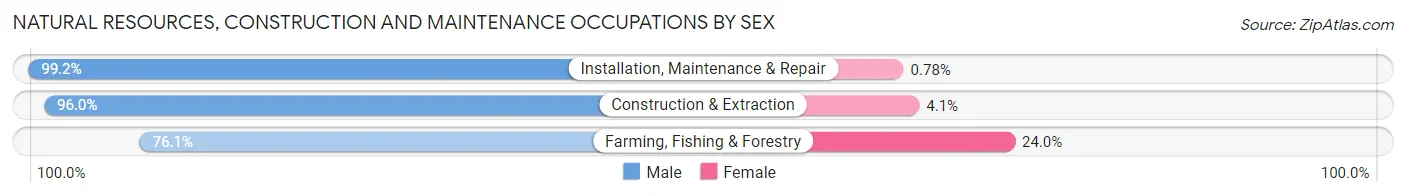
| Occupation | Male | Female |
| Farming, Fishing & Forestry | 470 (76.0%) | 148 (23.9%) |
| Construction & Extraction | 3,124 (96.0%) | 132 (4.1%) |
| Installation, Maintenance & Repair | 1,779 (99.2%) | 14 (0.8%) |
| Total (Category) | 5,373 (94.8%) | 294 (5.2%) |
| Total (Overall) | 25,146 (53.6%) | 21,770 (46.4%) |
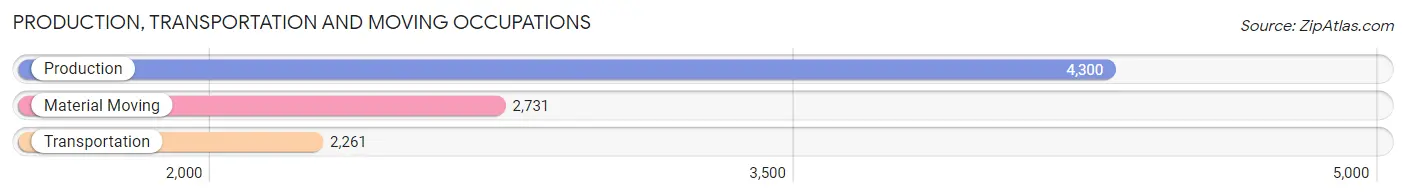
Production, Transportation and Moving Occupations
The most common Production, Transportation and Moving occupations in Cowlitz County are Production (4,300 | 9.2%), Material Moving (2,731 | 5.8%), and Transportation (2,261 | 4.8%).
Production, Transportation and Moving Occupations by Sex
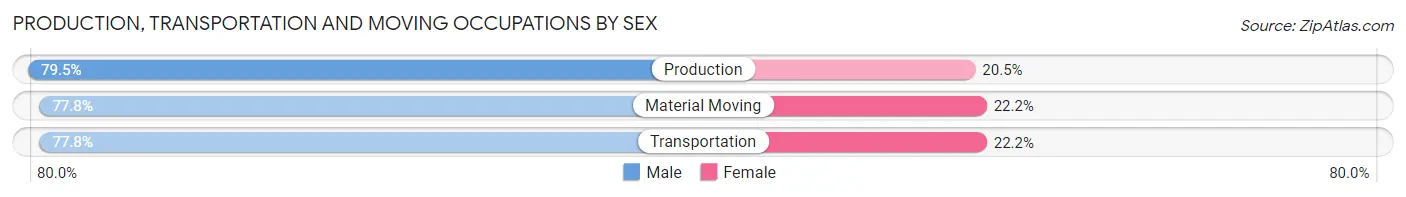
| Occupation | Male | Female |
| Production | 3,417 (79.5%) | 883 (20.5%) |
| Transportation | 1,759 (77.8%) | 502 (22.2%) |
| Material Moving | 2,125 (77.8%) | 606 (22.2%) |
| Total (Category) | 7,301 (78.6%) | 1,991 (21.4%) |
| Total (Overall) | 25,146 (53.6%) | 21,770 (46.4%) |
Employment Industries by Sex in Cowlitz County
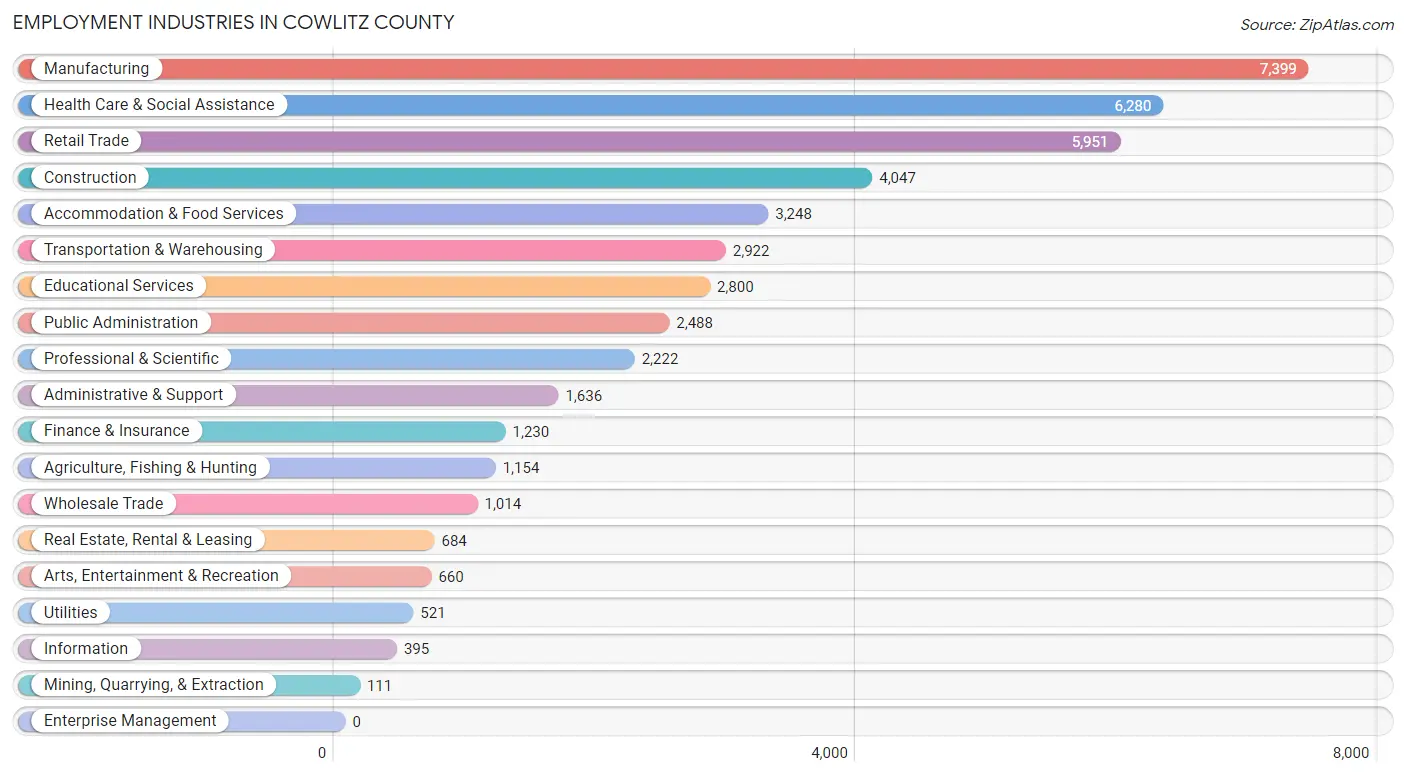
Employment Industries in Cowlitz County
The major employment industries in Cowlitz County include Manufacturing (7,399 | 15.8%), Health Care & Social Assistance (6,280 | 13.4%), Retail Trade (5,951 | 12.7%), Construction (4,047 | 8.6%), and Accommodation & Food Services (3,248 | 6.9%).
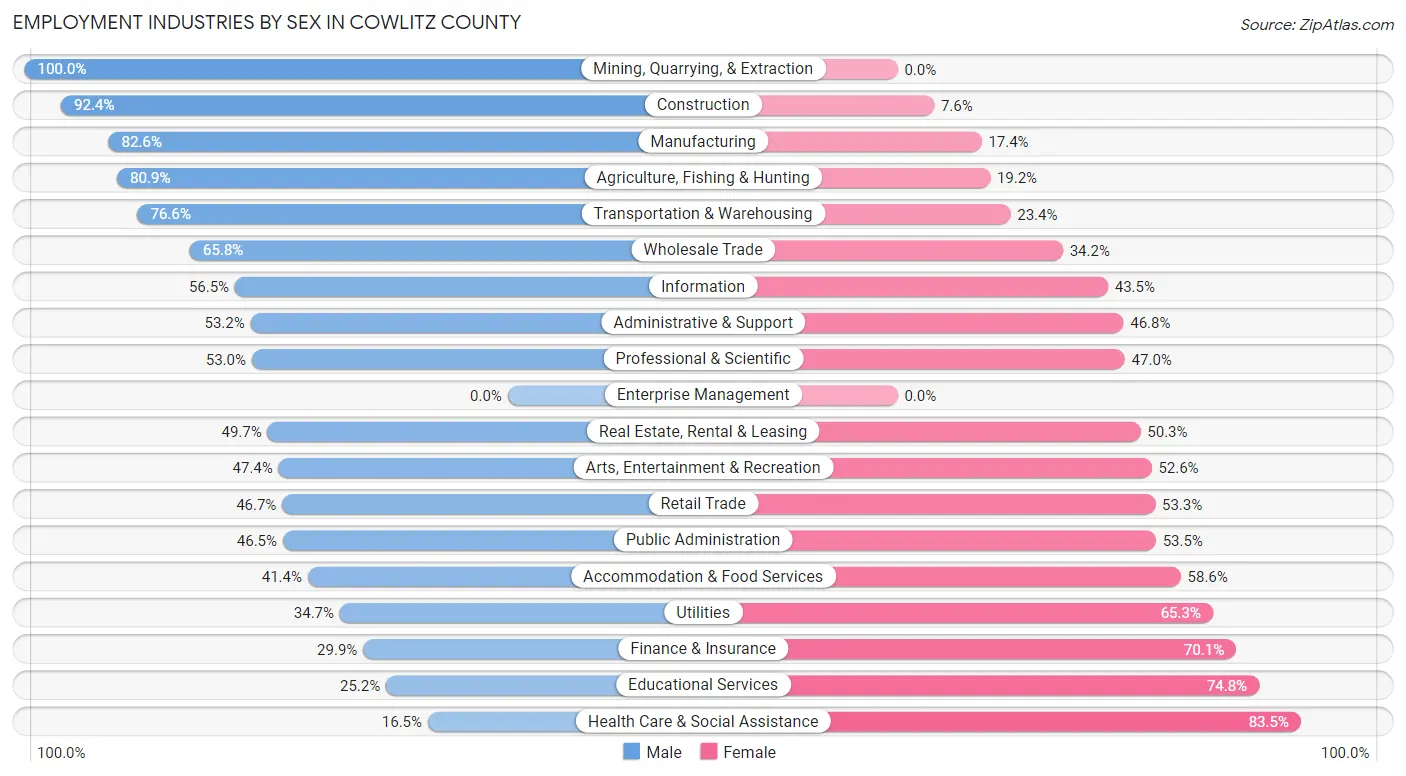
Employment Industries by Sex in Cowlitz County
The Cowlitz County industries that see more men than women are Mining, Quarrying, & Extraction (100.0%), Construction (92.4%), and Manufacturing (82.6%), whereas the industries that tend to have a higher number of women are Health Care & Social Assistance (83.5%), Educational Services (74.8%), and Finance & Insurance (70.1%).
| Industry | Male | Female |
| Agriculture, Fishing & Hunting | 933 (80.8%) | 221 (19.2%) |
| Mining, Quarrying, & Extraction | 111 (100.0%) | 0 (0.0%) |
| Construction | 3,741 (92.4%) | 306 (7.6%) |
| Manufacturing | 6,112 (82.6%) | 1,287 (17.4%) |
| Wholesale Trade | 667 (65.8%) | 347 (34.2%) |
| Retail Trade | 2,778 (46.7%) | 3,173 (53.3%) |
| Transportation & Warehousing | 2,239 (76.6%) | 683 (23.4%) |
| Utilities | 181 (34.7%) | 340 (65.3%) |
| Information | 223 (56.5%) | 172 (43.5%) |
| Finance & Insurance | 368 (29.9%) | 862 (70.1%) |
| Real Estate, Rental & Leasing | 340 (49.7%) | 344 (50.3%) |
| Professional & Scientific | 1,177 (53.0%) | 1,045 (47.0%) |
| Enterprise Management | 0 (0.0%) | 0 (0.0%) |
| Administrative & Support | 871 (53.2%) | 765 (46.8%) |
| Educational Services | 705 (25.2%) | 2,095 (74.8%) |
| Health Care & Social Assistance | 1,038 (16.5%) | 5,242 (83.5%) |
| Arts, Entertainment & Recreation | 313 (47.4%) | 347 (52.6%) |
| Accommodation & Food Services | 1,344 (41.4%) | 1,904 (58.6%) |
| Public Administration | 1,158 (46.5%) | 1,330 (53.5%) |
| Total | 25,146 (53.6%) | 21,770 (46.4%) |
Education in Cowlitz County
School Enrollment in Cowlitz County
The most common levels of schooling among the 23,538 students in Cowlitz County are middle school (5,696 | 24.2%), high school (5,106 | 21.7%), and elementary school (5,023 | 21.3%).
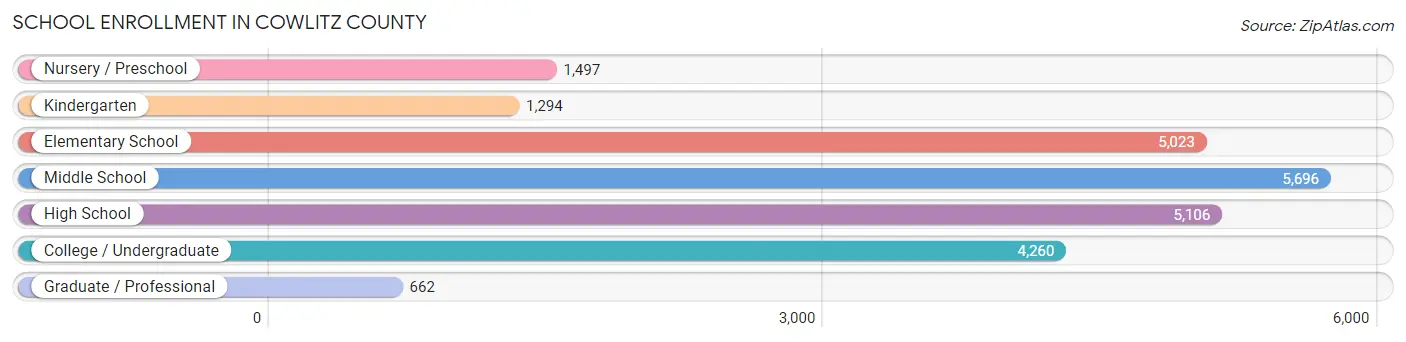
| School Level | # Students | % Students |
| Nursery / Preschool | 1,497 | 6.4% |
| Kindergarten | 1,294 | 5.5% |
| Elementary School | 5,023 | 21.3% |
| Middle School | 5,696 | 24.2% |
| High School | 5,106 | 21.7% |
| College / Undergraduate | 4,260 | 18.1% |
| Graduate / Professional | 662 | 2.8% |
| Total | 23,538 | 100.0% |
School Enrollment by Age by Funding Source in Cowlitz County
Out of a total of 23,538 students who are enrolled in schools in Cowlitz County, 2,848 (12.1%) attend a private institution, while the remaining 20,690 (87.9%) are enrolled in public schools. The age group of 3 to 4 year olds has the highest likelihood of being enrolled in private schools, with 577 (49.4% in the age bracket) enrolled. Conversely, the age group of 18 to 19 year olds has the lowest likelihood of being enrolled in a private school, with 1,175 (94.2% in the age bracket) attending a public institution.
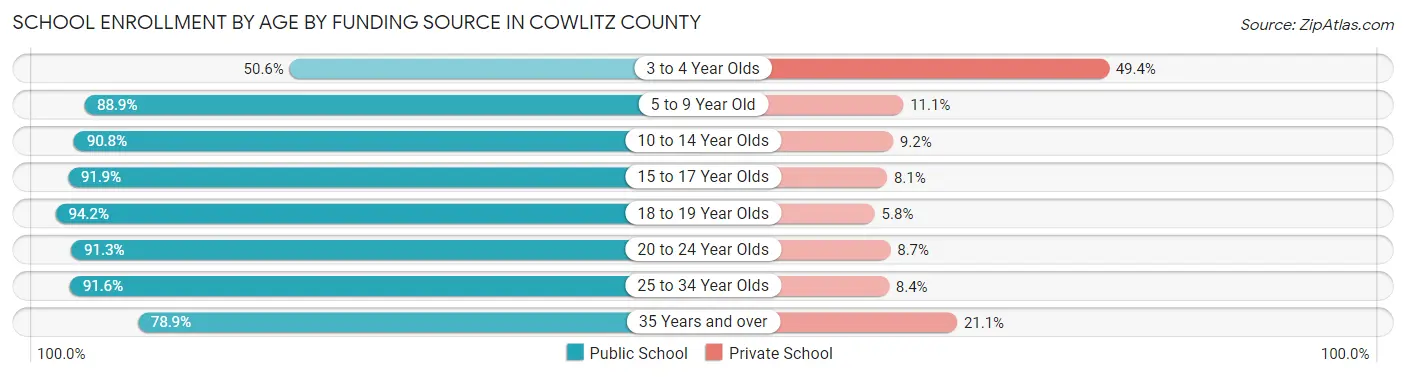
| Age Bracket | Public School | Private School |
| 3 to 4 Year Olds | 592 (50.6%) | 577 (49.4%) |
| 5 to 9 Year Old | 5,217 (88.9%) | 651 (11.1%) |
| 10 to 14 Year Olds | 6,269 (90.8%) | 633 (9.2%) |
| 15 to 17 Year Olds | 3,742 (91.9%) | 328 (8.1%) |
| 18 to 19 Year Olds | 1,175 (94.2%) | 72 (5.8%) |
| 20 to 24 Year Olds | 1,031 (91.3%) | 98 (8.7%) |
| 25 to 34 Year Olds | 1,208 (91.6%) | 111 (8.4%) |
| 35 Years and over | 1,447 (78.9%) | 387 (21.1%) |
| Total | 20,690 (87.9%) | 2,848 (12.1%) |
Educational Attainment by Field of Study in Cowlitz County
Business (2,656 | 18.9%), education (2,171 | 15.5%), science & technology (1,429 | 10.2%), arts & humanities (1,116 | 8.0%), and social sciences (864 | 6.2%) are the most common fields of study among 14,021 individuals in Cowlitz County who have obtained a bachelor's degree or higher.
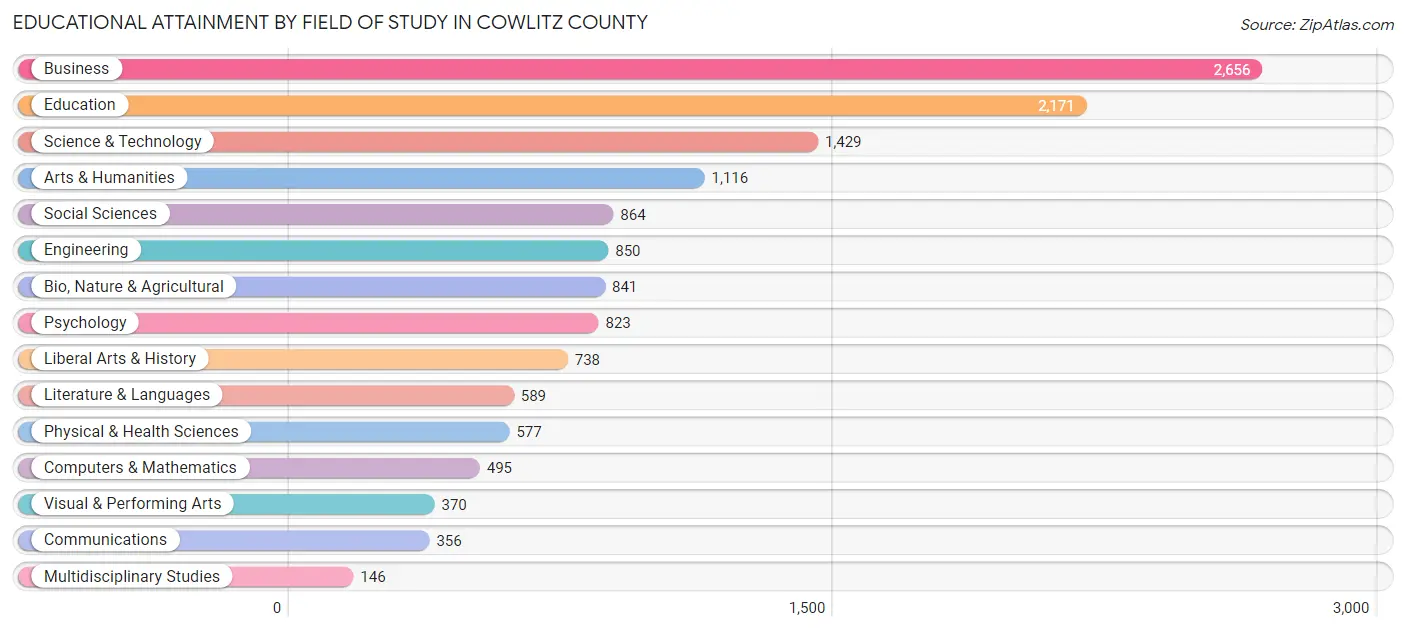
| Field of Study | # Graduates | % Graduates |
| Computers & Mathematics | 495 | 3.5% |
| Bio, Nature & Agricultural | 841 | 6.0% |
| Physical & Health Sciences | 577 | 4.1% |
| Psychology | 823 | 5.9% |
| Social Sciences | 864 | 6.2% |
| Engineering | 850 | 6.1% |
| Multidisciplinary Studies | 146 | 1.0% |
| Science & Technology | 1,429 | 10.2% |
| Business | 2,656 | 18.9% |
| Education | 2,171 | 15.5% |
| Literature & Languages | 589 | 4.2% |
| Liberal Arts & History | 738 | 5.3% |
| Visual & Performing Arts | 370 | 2.6% |
| Communications | 356 | 2.5% |
| Arts & Humanities | 1,116 | 8.0% |
| Total | 14,021 | 100.0% |
Transportation & Commute in Cowlitz County
Vehicle Availability by Sex in Cowlitz County
The most prevalent vehicle ownership categories in Cowlitz County are males with 2 vehicles (8,822, accounting for 36.1%) and females with 2 vehicles (7,689, making up 41.4%).
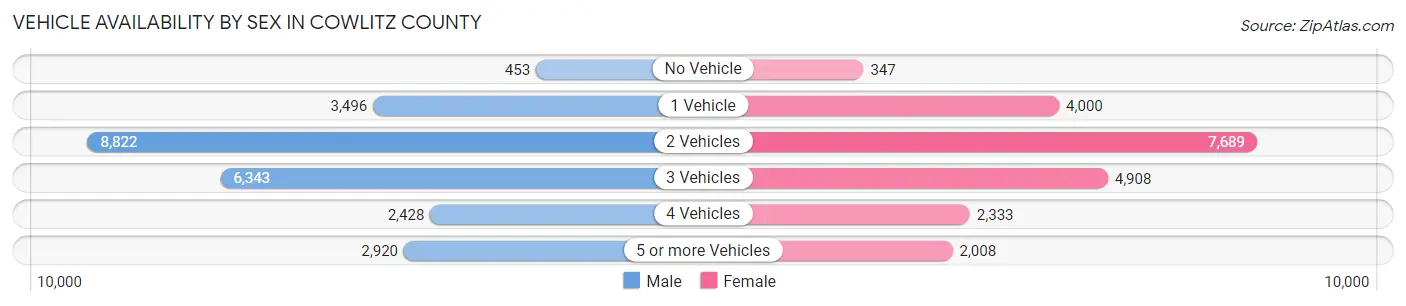
| Vehicles Available | Male | Female |
| No Vehicle | 453 (1.8%) | 347 (1.6%) |
| 1 Vehicle | 3,496 (14.3%) | 4,000 (18.8%) |
| 2 Vehicles | 8,822 (36.1%) | 7,689 (36.1%) |
| 3 Vehicles | 6,343 (25.9%) | 4,908 (23.1%) |
| 4 Vehicles | 2,428 (9.9%) | 2,333 (11.0%) |
| 5 or more Vehicles | 2,920 (11.9%) | 2,008 (9.4%) |
| Total | 24,462 (100.0%) | 21,285 (100.0%) |
Commute Time in Cowlitz County
The most frequently occuring commute durations in Cowlitz County are 15 to 19 minutes (7,690 commuters, 18.0%), 10 to 14 minutes (6,744 commuters, 15.8%), and 20 to 24 minutes (5,261 commuters, 12.3%).
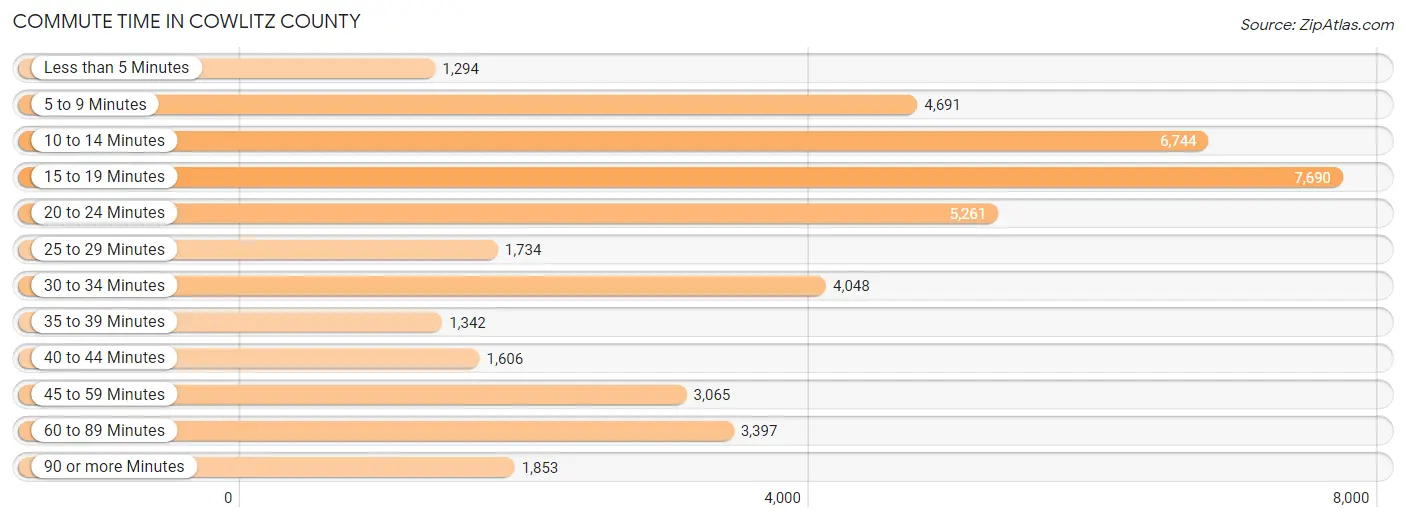
| Commute Time | # Commuters | % Commuters |
| Less than 5 Minutes | 1,294 | 3.0% |
| 5 to 9 Minutes | 4,691 | 11.0% |
| 10 to 14 Minutes | 6,744 | 15.8% |
| 15 to 19 Minutes | 7,690 | 18.0% |
| 20 to 24 Minutes | 5,261 | 12.3% |
| 25 to 29 Minutes | 1,734 | 4.1% |
| 30 to 34 Minutes | 4,048 | 9.5% |
| 35 to 39 Minutes | 1,342 | 3.1% |
| 40 to 44 Minutes | 1,606 | 3.8% |
| 45 to 59 Minutes | 3,065 | 7.2% |
| 60 to 89 Minutes | 3,397 | 8.0% |
| 90 or more Minutes | 1,853 | 4.3% |
Commute Time by Sex in Cowlitz County
The most common commute times in Cowlitz County are 15 to 19 minutes (3,862 commuters, 16.9%) for males and 15 to 19 minutes (3,828 commuters, 19.2%) for females.
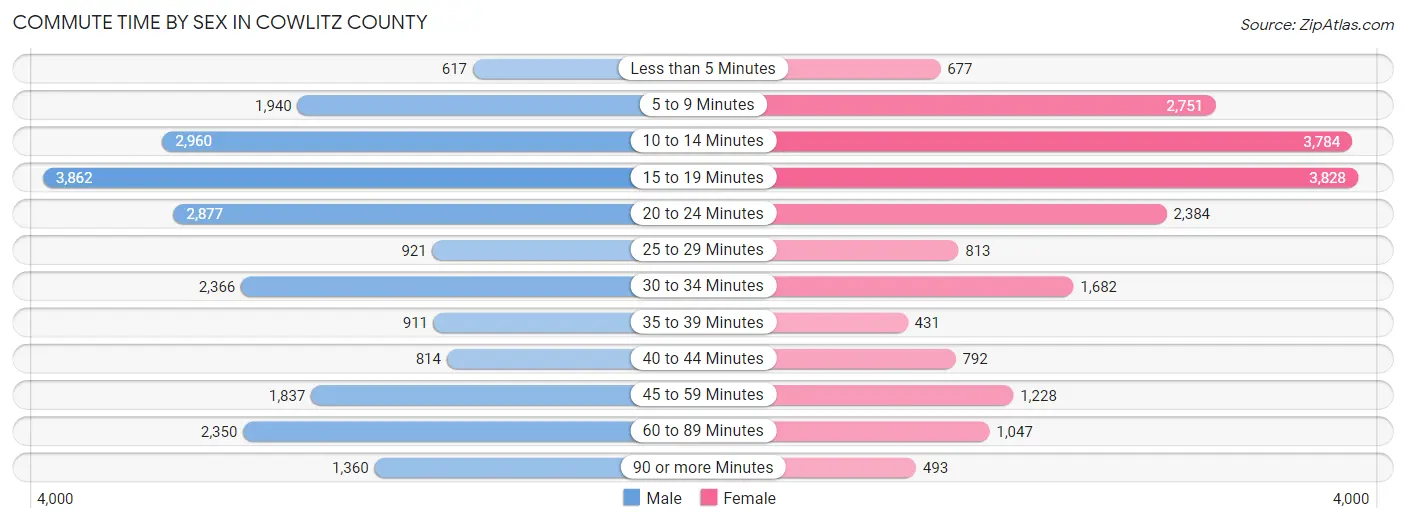
| Commute Time | Male | Female |
| Less than 5 Minutes | 617 (2.7%) | 677 (3.4%) |
| 5 to 9 Minutes | 1,940 (8.5%) | 2,751 (13.8%) |
| 10 to 14 Minutes | 2,960 (13.0%) | 3,784 (19.0%) |
| 15 to 19 Minutes | 3,862 (16.9%) | 3,828 (19.2%) |
| 20 to 24 Minutes | 2,877 (12.6%) | 2,384 (12.0%) |
| 25 to 29 Minutes | 921 (4.0%) | 813 (4.1%) |
| 30 to 34 Minutes | 2,366 (10.4%) | 1,682 (8.5%) |
| 35 to 39 Minutes | 911 (4.0%) | 431 (2.2%) |
| 40 to 44 Minutes | 814 (3.6%) | 792 (4.0%) |
| 45 to 59 Minutes | 1,837 (8.1%) | 1,228 (6.2%) |
| 60 to 89 Minutes | 2,350 (10.3%) | 1,047 (5.3%) |
| 90 or more Minutes | 1,360 (6.0%) | 493 (2.5%) |
Time of Departure to Work by Sex in Cowlitz County
The most frequent times of departure to work in Cowlitz County are 12:00 AM to 4:59 AM (3,277, 14.4%) for males and 7:30 AM to 7:59 AM (3,121, 15.7%) for females.
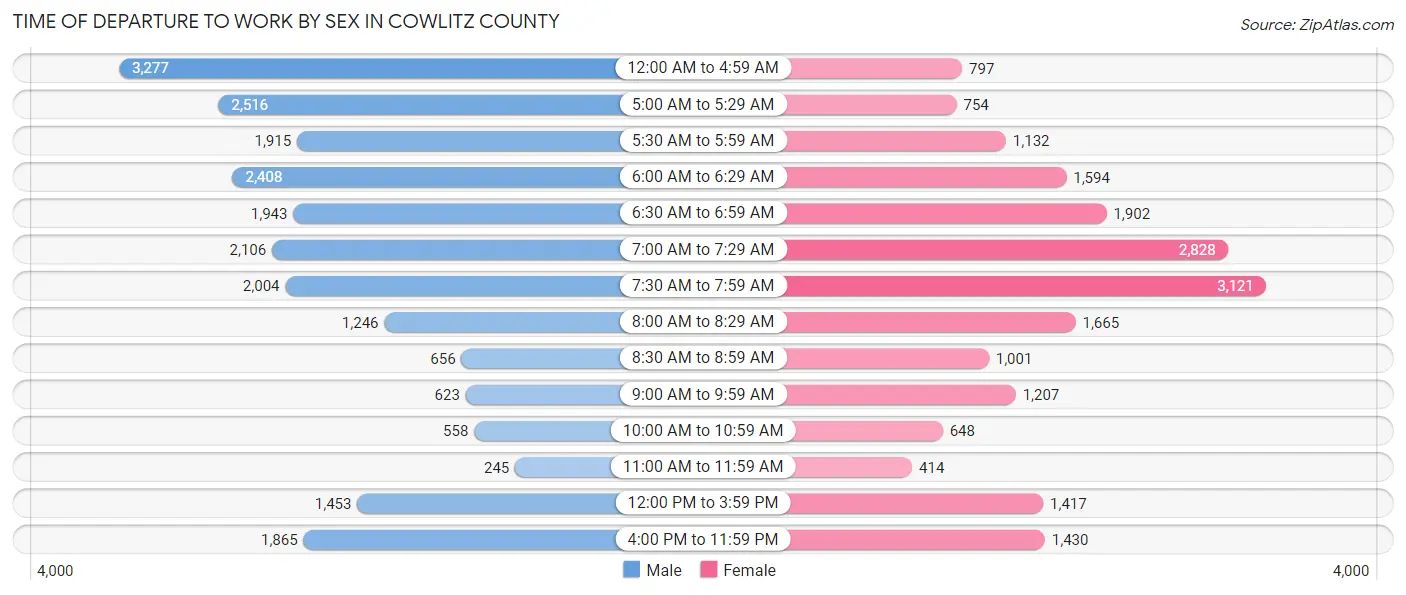
| Time of Departure | Male | Female |
| 12:00 AM to 4:59 AM | 3,277 (14.4%) | 797 (4.0%) |
| 5:00 AM to 5:29 AM | 2,516 (11.0%) | 754 (3.8%) |
| 5:30 AM to 5:59 AM | 1,915 (8.4%) | 1,132 (5.7%) |
| 6:00 AM to 6:29 AM | 2,408 (10.5%) | 1,594 (8.0%) |
| 6:30 AM to 6:59 AM | 1,943 (8.5%) | 1,902 (9.6%) |
| 7:00 AM to 7:29 AM | 2,106 (9.2%) | 2,828 (14.2%) |
| 7:30 AM to 7:59 AM | 2,004 (8.8%) | 3,121 (15.7%) |
| 8:00 AM to 8:29 AM | 1,246 (5.5%) | 1,665 (8.4%) |
| 8:30 AM to 8:59 AM | 656 (2.9%) | 1,001 (5.0%) |
| 9:00 AM to 9:59 AM | 623 (2.7%) | 1,207 (6.1%) |
| 10:00 AM to 10:59 AM | 558 (2.5%) | 648 (3.3%) |
| 11:00 AM to 11:59 AM | 245 (1.1%) | 414 (2.1%) |
| 12:00 PM to 3:59 PM | 1,453 (6.4%) | 1,417 (7.1%) |
| 4:00 PM to 11:59 PM | 1,865 (8.2%) | 1,430 (7.2%) |
| Total | 22,815 (100.0%) | 19,910 (100.0%) |
Housing Occupancy in Cowlitz County
Occupancy by Ownership in Cowlitz County
Of the total 43,167 dwellings in Cowlitz County, owner-occupied units account for 28,664 (66.4%), while renter-occupied units make up 14,503 (33.6%).
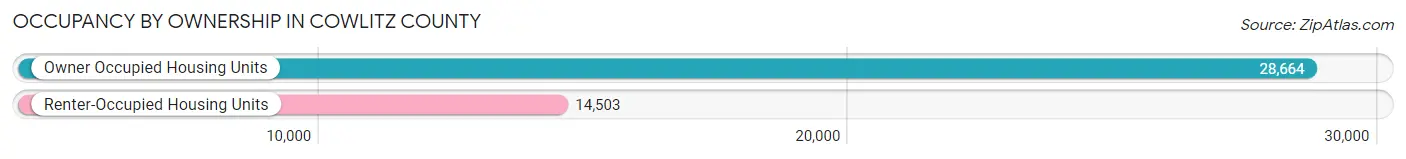
| Occupancy | # Housing Units | % Housing Units |
| Owner Occupied Housing Units | 28,664 | 66.4% |
| Renter-Occupied Housing Units | 14,503 | 33.6% |
| Total Occupied Housing Units | 43,167 | 100.0% |
Occupancy by Household Size in Cowlitz County
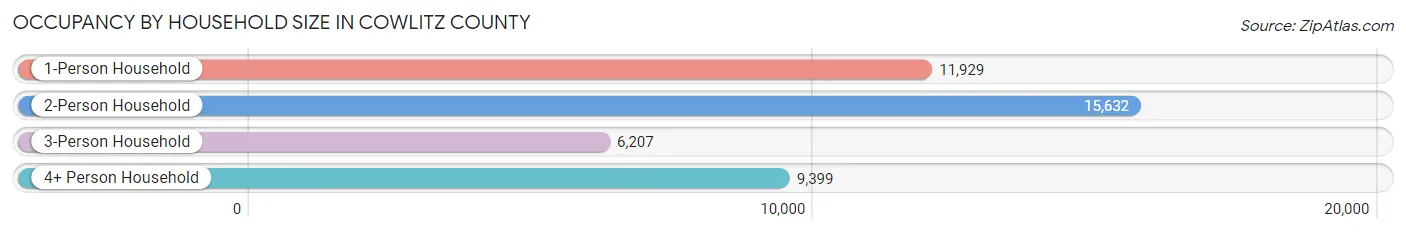
| Household Size | # Housing Units | % Housing Units |
| 1-Person Household | 11,929 | 27.6% |
| 2-Person Household | 15,632 | 36.2% |
| 3-Person Household | 6,207 | 14.4% |
| 4+ Person Household | 9,399 | 21.8% |
| Total Housing Units | 43,167 | 100.0% |
Occupancy by Ownership by Household Size in Cowlitz County
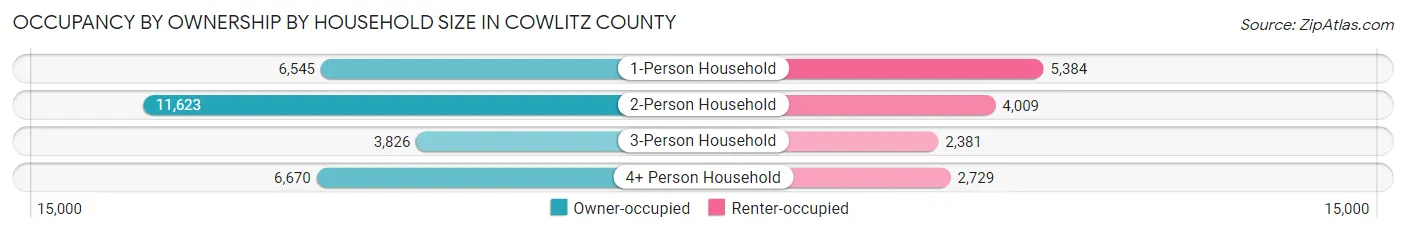
| Household Size | Owner-occupied | Renter-occupied |
| 1-Person Household | 6,545 (54.9%) | 5,384 (45.1%) |
| 2-Person Household | 11,623 (74.4%) | 4,009 (25.7%) |
| 3-Person Household | 3,826 (61.6%) | 2,381 (38.4%) |
| 4+ Person Household | 6,670 (71.0%) | 2,729 (29.0%) |
| Total Housing Units | 28,664 (66.4%) | 14,503 (33.6%) |
Occupancy by Educational Attainment in Cowlitz County
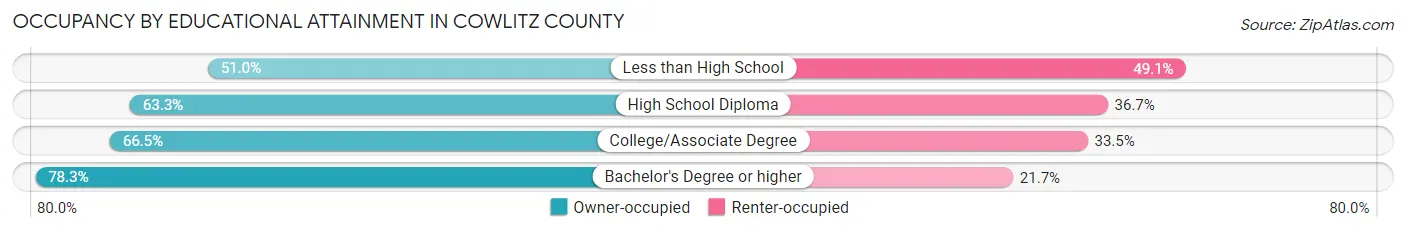
| Household Size | Owner-occupied | Renter-occupied |
| Less than High School | 1,817 (50.9%) | 1,749 (49.0%) |
| High School Diploma | 7,647 (63.3%) | 4,435 (36.7%) |
| College/Associate Degree | 13,207 (66.5%) | 6,659 (33.5%) |
| Bachelor's Degree or higher | 5,993 (78.3%) | 1,660 (21.7%) |
Occupancy by Age of Householder in Cowlitz County
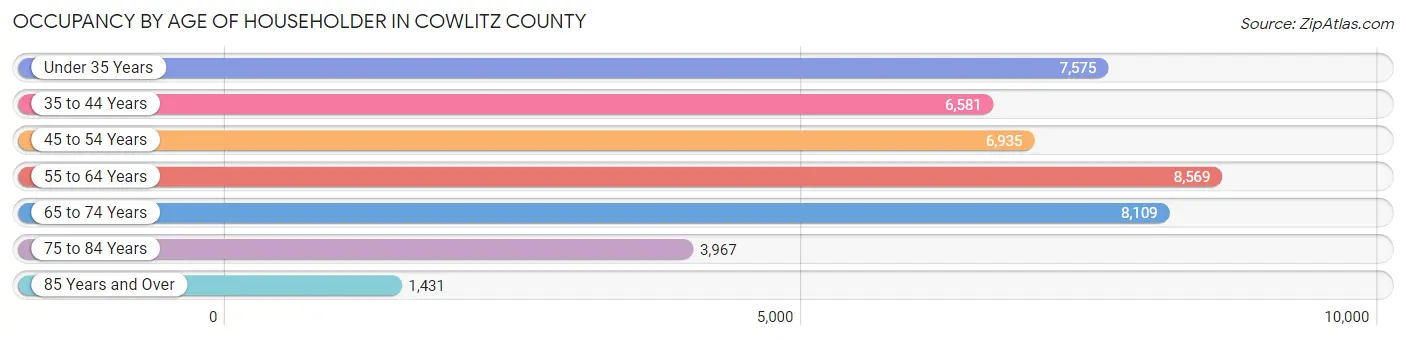
| Age Bracket | # Households | % Households |
| Under 35 Years | 7,575 | 17.5% |
| 35 to 44 Years | 6,581 | 15.2% |
| 45 to 54 Years | 6,935 | 16.1% |
| 55 to 64 Years | 8,569 | 19.9% |
| 65 to 74 Years | 8,109 | 18.8% |
| 75 to 84 Years | 3,967 | 9.2% |
| 85 Years and Over | 1,431 | 3.3% |
| Total | 43,167 | 100.0% |
Housing Finances in Cowlitz County
Median Income by Occupancy in Cowlitz County
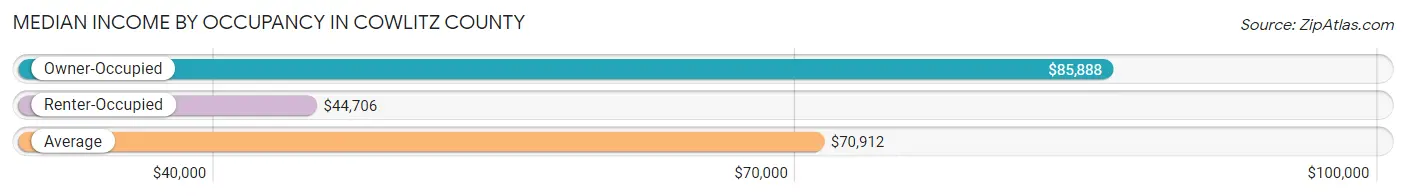
| Occupancy Type | # Households | Median Income |
| Owner-Occupied | 28,664 (66.4%) | $85,888 |
| Renter-Occupied | 14,503 (33.6%) | $44,706 |
| Average | 43,167 (100.0%) | $70,912 |
Occupancy by Householder Income Bracket in Cowlitz County
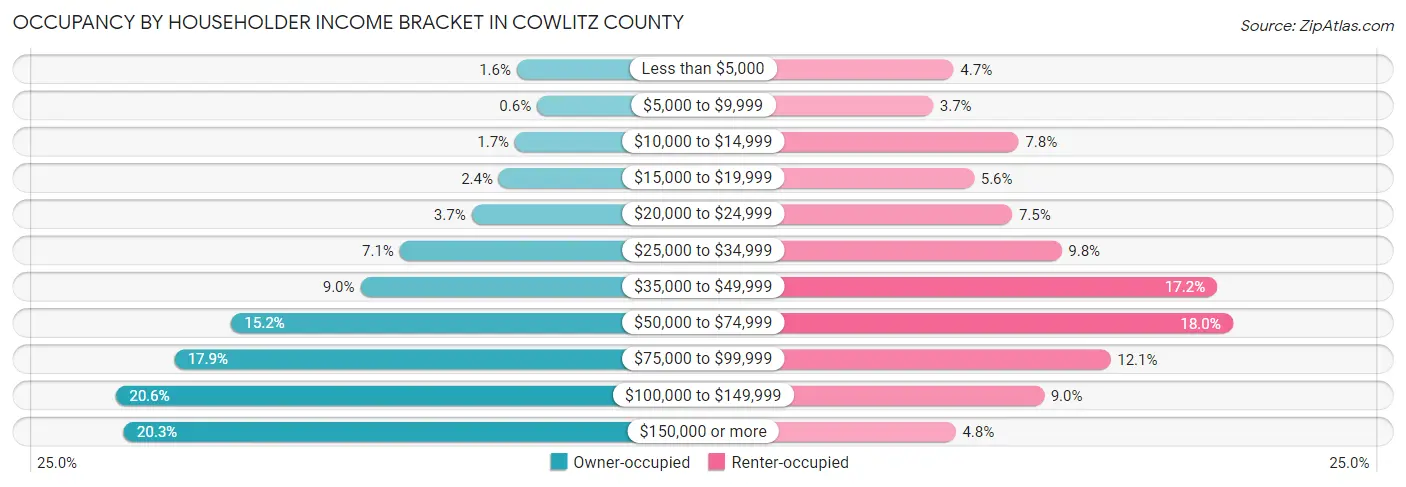
| Income Bracket | Owner-occupied | Renter-occupied |
| Less than $5,000 | 447 (1.6%) | 676 (4.7%) |
| $5,000 to $9,999 | 171 (0.6%) | 534 (3.7%) |
| $10,000 to $14,999 | 474 (1.7%) | 1,126 (7.8%) |
| $15,000 to $19,999 | 693 (2.4%) | 816 (5.6%) |
| $20,000 to $24,999 | 1,065 (3.7%) | 1,081 (7.4%) |
| $25,000 to $34,999 | 2,047 (7.1%) | 1,421 (9.8%) |
| $35,000 to $49,999 | 2,584 (9.0%) | 2,496 (17.2%) |
| $50,000 to $74,999 | 4,342 (15.1%) | 2,604 (17.9%) |
| $75,000 to $99,999 | 5,116 (17.8%) | 1,759 (12.1%) |
| $100,000 to $149,999 | 5,914 (20.6%) | 1,300 (9.0%) |
| $150,000 or more | 5,811 (20.3%) | 690 (4.8%) |
| Total | 28,664 (100.0%) | 14,503 (100.0%) |
Monthly Housing Cost Tiers in Cowlitz County
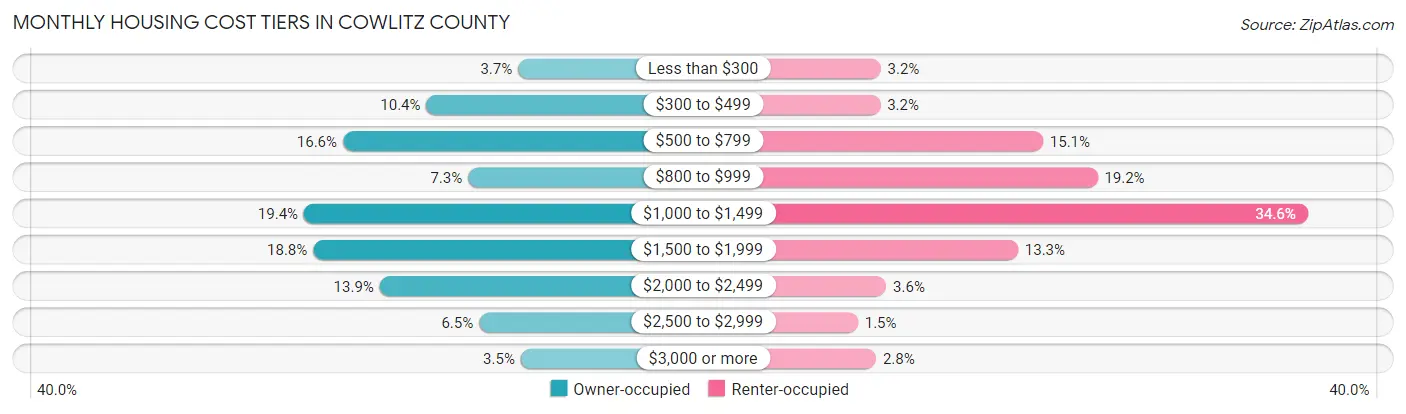
| Monthly Cost | Owner-occupied | Renter-occupied |
| Less than $300 | 1,048 (3.7%) | 461 (3.2%) |
| $300 to $499 | 2,984 (10.4%) | 457 (3.2%) |
| $500 to $799 | 4,748 (16.6%) | 2,194 (15.1%) |
| $800 to $999 | 2,105 (7.3%) | 2,778 (19.2%) |
| $1,000 to $1,499 | 5,570 (19.4%) | 5,022 (34.6%) |
| $1,500 to $1,999 | 5,375 (18.8%) | 1,928 (13.3%) |
| $2,000 to $2,499 | 3,969 (13.9%) | 520 (3.6%) |
| $2,500 to $2,999 | 1,872 (6.5%) | 217 (1.5%) |
| $3,000 or more | 993 (3.5%) | 412 (2.8%) |
| Total | 28,664 (100.0%) | 14,503 (100.0%) |
Physical Housing Characteristics in Cowlitz County
Housing Structures in Cowlitz County
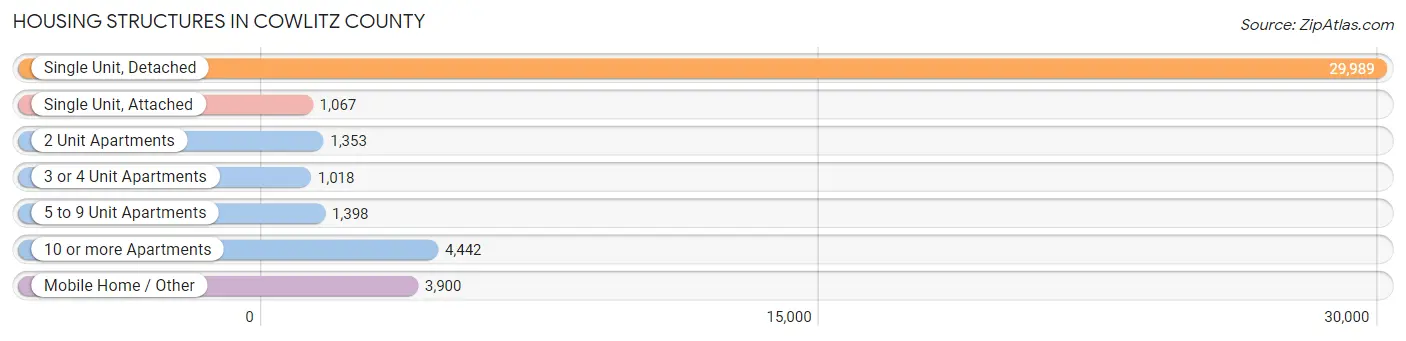
| Structure Type | # Housing Units | % Housing Units |
| Single Unit, Detached | 29,989 | 69.5% |
| Single Unit, Attached | 1,067 | 2.5% |
| 2 Unit Apartments | 1,353 | 3.1% |
| 3 or 4 Unit Apartments | 1,018 | 2.4% |
| 5 to 9 Unit Apartments | 1,398 | 3.2% |
| 10 or more Apartments | 4,442 | 10.3% |
| Mobile Home / Other | 3,900 | 9.0% |
| Total | 43,167 | 100.0% |
Housing Structures by Occupancy in Cowlitz County
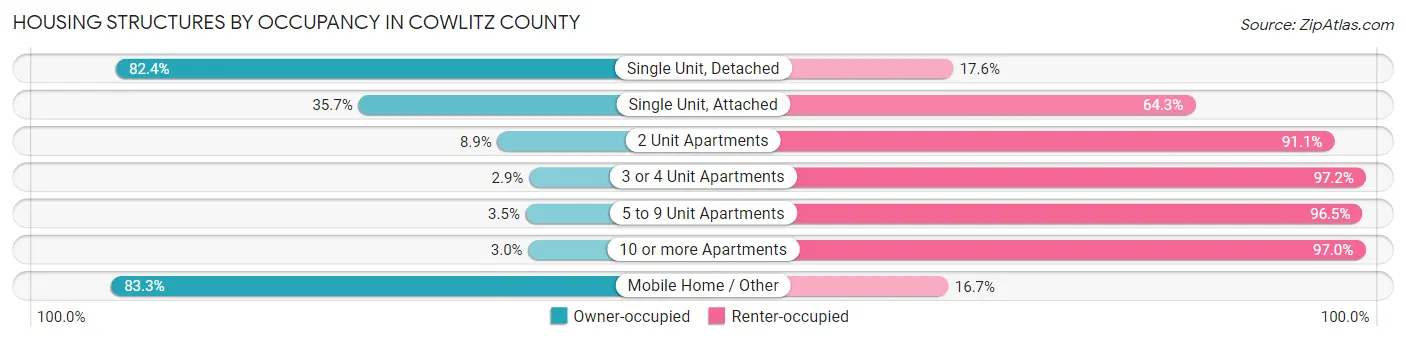
| Structure Type | Owner-occupied | Renter-occupied |
| Single Unit, Detached | 24,702 (82.4%) | 5,287 (17.6%) |
| Single Unit, Attached | 381 (35.7%) | 686 (64.3%) |
| 2 Unit Apartments | 121 (8.9%) | 1,232 (91.1%) |
| 3 or 4 Unit Apartments | 29 (2.9%) | 989 (97.2%) |
| 5 to 9 Unit Apartments | 49 (3.5%) | 1,349 (96.5%) |
| 10 or more Apartments | 133 (3.0%) | 4,309 (97.0%) |
| Mobile Home / Other | 3,249 (83.3%) | 651 (16.7%) |
| Total | 28,664 (66.4%) | 14,503 (33.6%) |
Housing Structures by Number of Rooms in Cowlitz County
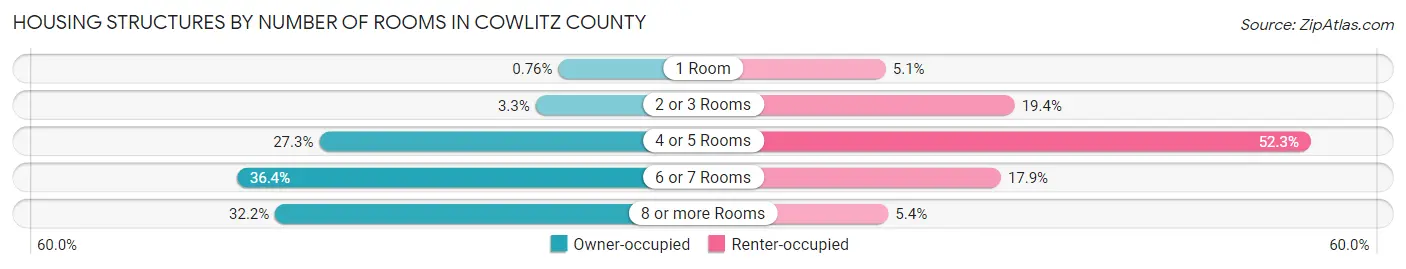
| Number of Rooms | Owner-occupied | Renter-occupied |
| 1 Room | 218 (0.8%) | 740 (5.1%) |
| 2 or 3 Rooms | 944 (3.3%) | 2,813 (19.4%) |
| 4 or 5 Rooms | 7,825 (27.3%) | 7,578 (52.2%) |
| 6 or 7 Rooms | 10,446 (36.4%) | 2,592 (17.9%) |
| 8 or more Rooms | 9,231 (32.2%) | 780 (5.4%) |
| Total | 28,664 (100.0%) | 14,503 (100.0%) |
Housing Structure by Heating Type in Cowlitz County
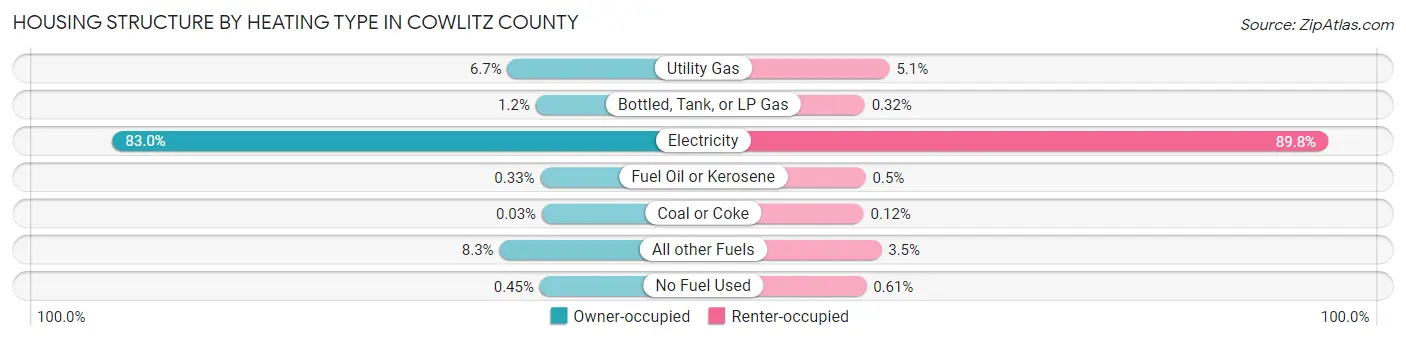
| Heating Type | Owner-occupied | Renter-occupied |
| Utility Gas | 1,915 (6.7%) | 739 (5.1%) |
| Bottled, Tank, or LP Gas | 352 (1.2%) | 47 (0.3%) |
| Electricity | 23,799 (83.0%) | 13,027 (89.8%) |
| Fuel Oil or Kerosene | 95 (0.3%) | 73 (0.5%) |
| Coal or Coke | 8 (0.0%) | 18 (0.1%) |
| All other Fuels | 2,366 (8.3%) | 511 (3.5%) |
| No Fuel Used | 129 (0.4%) | 88 (0.6%) |
| Total | 28,664 (100.0%) | 14,503 (100.0%) |
Household Vehicle Usage in Cowlitz County
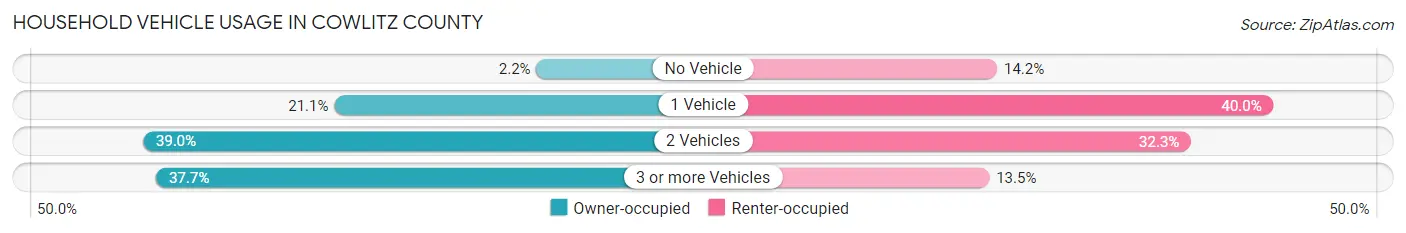
| Vehicles per Household | Owner-occupied | Renter-occupied |
| No Vehicle | 636 (2.2%) | 2,060 (14.2%) |
| 1 Vehicle | 6,044 (21.1%) | 5,803 (40.0%) |
| 2 Vehicles | 11,168 (39.0%) | 4,687 (32.3%) |
| 3 or more Vehicles | 10,816 (37.7%) | 1,953 (13.5%) |
| Total | 28,664 (100.0%) | 14,503 (100.0%) |
Real Estate & Mortgages in Cowlitz County
Real Estate and Mortgage Overview in Cowlitz County
| Characteristic | Without Mortgage | With Mortgage |
| Housing Units | 10,049 | 18,615 |
| Median Property Value | $296,300 | $348,100 |
| Median Household Income | $64,033 | $4,343 |
| Monthly Housing Costs | $564 | $993 |
| Real Estate Taxes | $2,618 | $200 |
Property Value by Mortgage Status in Cowlitz County
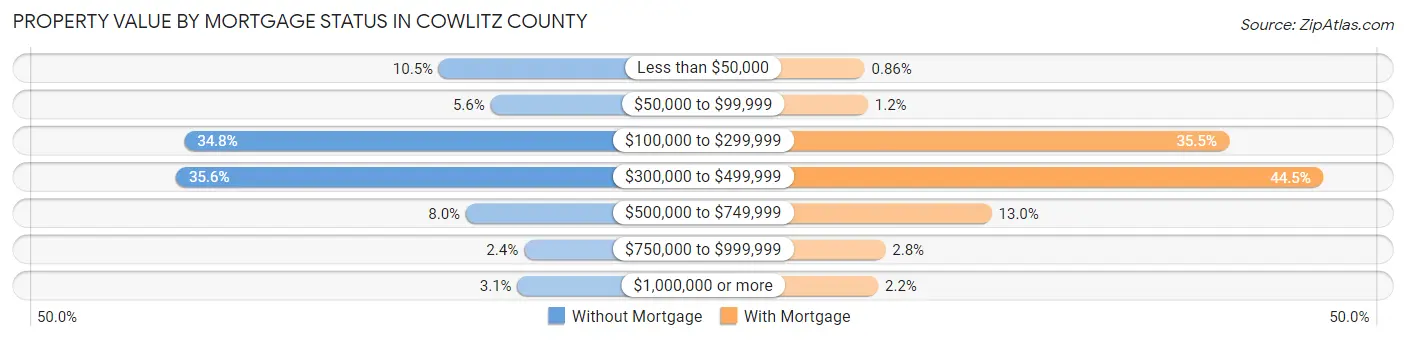
| Property Value | Without Mortgage | With Mortgage |
| Less than $50,000 | 1,059 (10.5%) | 161 (0.9%) |
| $50,000 to $99,999 | 565 (5.6%) | 218 (1.2%) |
| $100,000 to $299,999 | 3,496 (34.8%) | 6,615 (35.5%) |
| $300,000 to $499,999 | 3,575 (35.6%) | 8,280 (44.5%) |
| $500,000 to $749,999 | 801 (8.0%) | 2,412 (13.0%) |
| $750,000 to $999,999 | 245 (2.4%) | 529 (2.8%) |
| $1,000,000 or more | 308 (3.1%) | 400 (2.1%) |
| Total | 10,049 (100.0%) | 18,615 (100.0%) |
Household Income by Mortgage Status in Cowlitz County
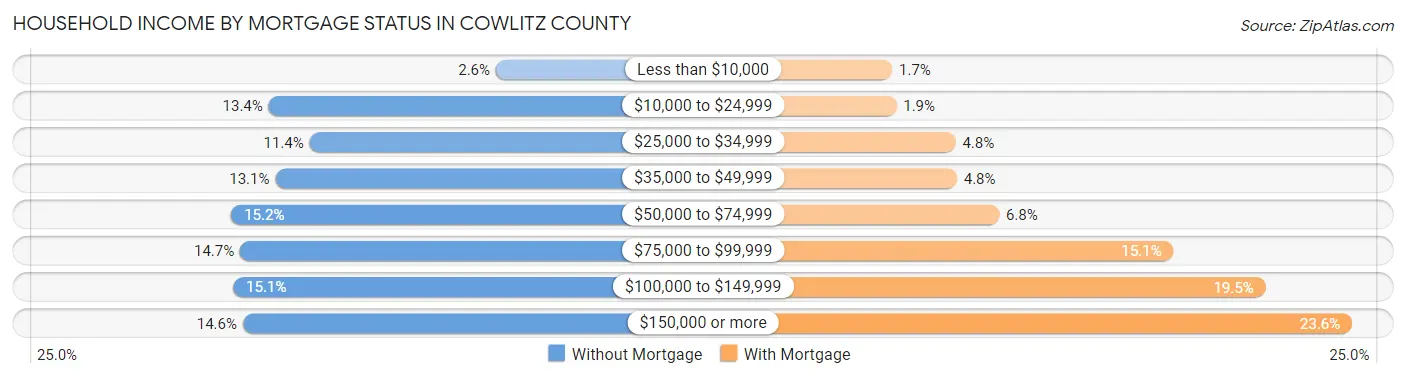
| Household Income | Without Mortgage | With Mortgage |
| Less than $10,000 | 257 (2.6%) | 323 (1.7%) |
| $10,000 to $24,999 | 1,345 (13.4%) | 361 (1.9%) |
| $25,000 to $34,999 | 1,149 (11.4%) | 887 (4.8%) |
| $35,000 to $49,999 | 1,312 (13.1%) | 898 (4.8%) |
| $50,000 to $74,999 | 1,523 (15.2%) | 1,272 (6.8%) |
| $75,000 to $99,999 | 1,481 (14.7%) | 2,819 (15.1%) |
| $100,000 to $149,999 | 1,514 (15.1%) | 3,635 (19.5%) |
| $150,000 or more | 1,468 (14.6%) | 4,400 (23.6%) |
| Total | 10,049 (100.0%) | 18,615 (100.0%) |
Property Value to Household Income Ratio in Cowlitz County
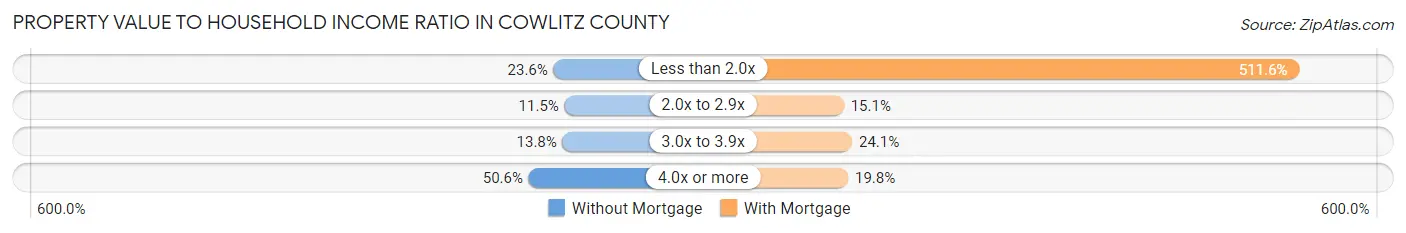
| Value-to-Income Ratio | Without Mortgage | With Mortgage |
| Less than 2.0x | 2,370 (23.6%) | 95,232 (511.6%) |
| 2.0x to 2.9x | 1,159 (11.5%) | 2,804 (15.1%) |
| 3.0x to 3.9x | 1,383 (13.8%) | 4,486 (24.1%) |
| 4.0x or more | 5,086 (50.6%) | 3,683 (19.8%) |
| Total | 10,049 (100.0%) | 18,615 (100.0%) |
Real Estate Taxes by Mortgage Status in Cowlitz County
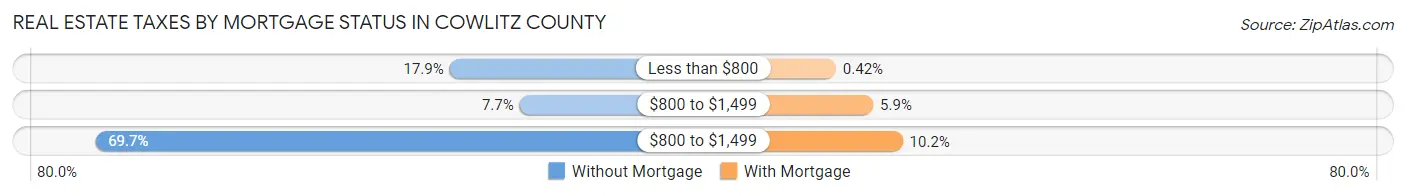
| Property Taxes | Without Mortgage | With Mortgage |
| Less than $800 | 1,800 (17.9%) | 78 (0.4%) |
| $800 to $1,499 | 772 (7.7%) | 1,090 (5.9%) |
| $800 to $1,499 | 7,002 (69.7%) | 1,894 (10.2%) |
| Total | 10,049 (100.0%) | 18,615 (100.0%) |
Health & Disability in Cowlitz County
Health Insurance Coverage by Age in Cowlitz County
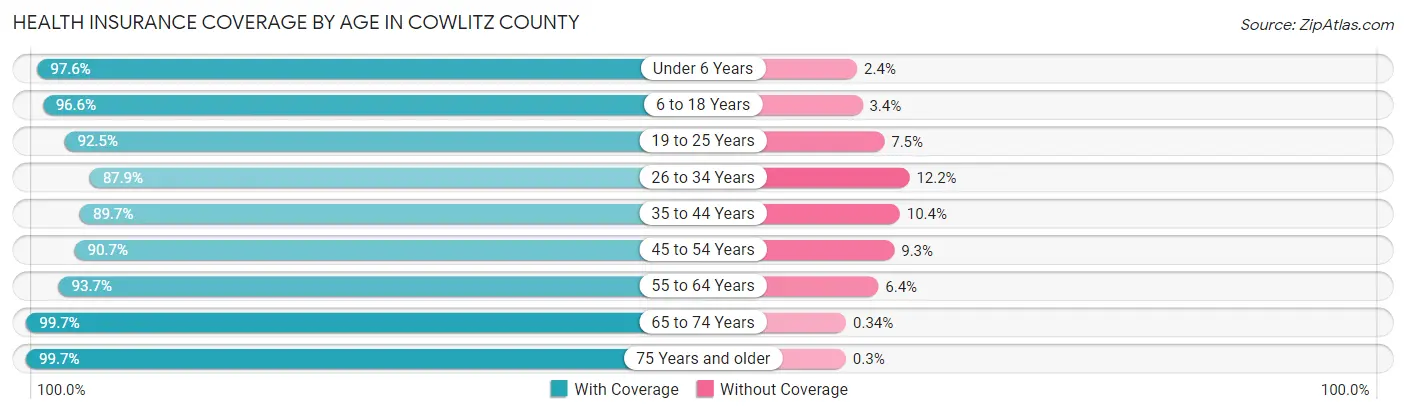
| Age Bracket | With Coverage | Without Coverage |
| Under 6 Years | 7,548 (97.6%) | 186 (2.4%) |
| 6 to 18 Years | 17,877 (96.6%) | 628 (3.4%) |
| 19 to 25 Years | 7,843 (92.5%) | 632 (7.5%) |
| 26 to 34 Years | 10,994 (87.8%) | 1,520 (12.1%) |
| 35 to 44 Years | 11,828 (89.6%) | 1,366 (10.3%) |
| 45 to 54 Years | 12,014 (90.7%) | 1,235 (9.3%) |
| 55 to 64 Years | 14,311 (93.6%) | 970 (6.4%) |
| 65 to 74 Years | 12,684 (99.7%) | 43 (0.3%) |
| 75 Years and older | 8,070 (99.7%) | 24 (0.3%) |
| Total | 103,169 (94.0%) | 6,604 (6.0%) |
Health Insurance Coverage by Citizenship Status in Cowlitz County
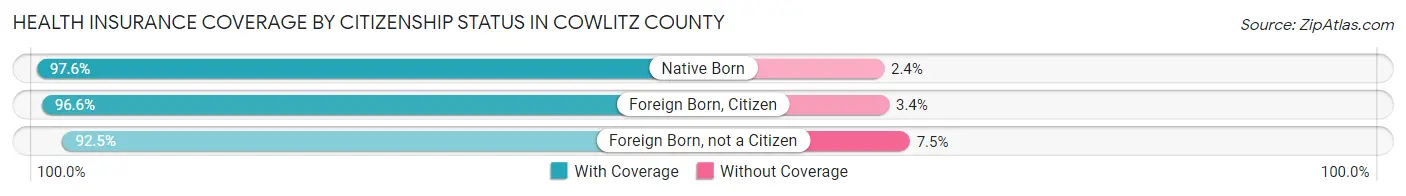
| Citizenship Status | With Coverage | Without Coverage |
| Native Born | 7,548 (97.6%) | 186 (2.4%) |
| Foreign Born, Citizen | 17,877 (96.6%) | 628 (3.4%) |
| Foreign Born, not a Citizen | 7,843 (92.5%) | 632 (7.5%) |
Health Insurance Coverage by Household Income in Cowlitz County
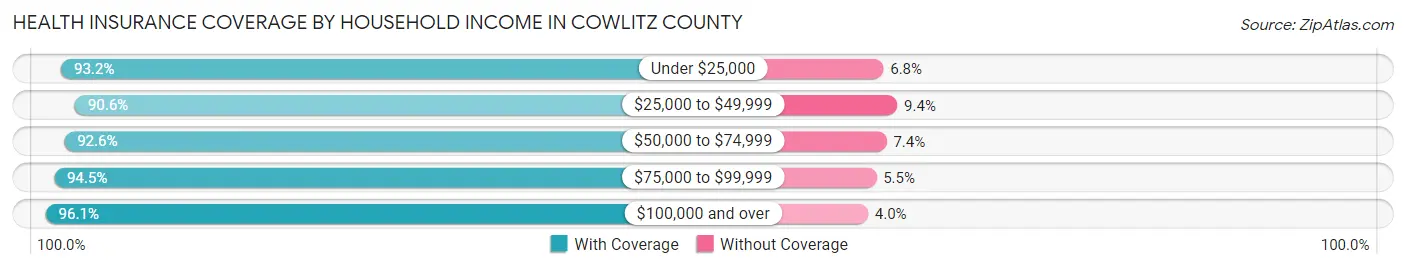
| Household Income | With Coverage | Without Coverage |
| Under $25,000 | 10,688 (93.2%) | 785 (6.8%) |
| $25,000 to $49,999 | 16,202 (90.6%) | 1,686 (9.4%) |
| $50,000 to $74,999 | 15,758 (92.6%) | 1,265 (7.4%) |
| $75,000 to $99,999 | 17,698 (94.5%) | 1,033 (5.5%) |
| $100,000 and over | 42,430 (96.1%) | 1,745 (4.0%) |
Public vs Private Health Insurance Coverage by Age in Cowlitz County
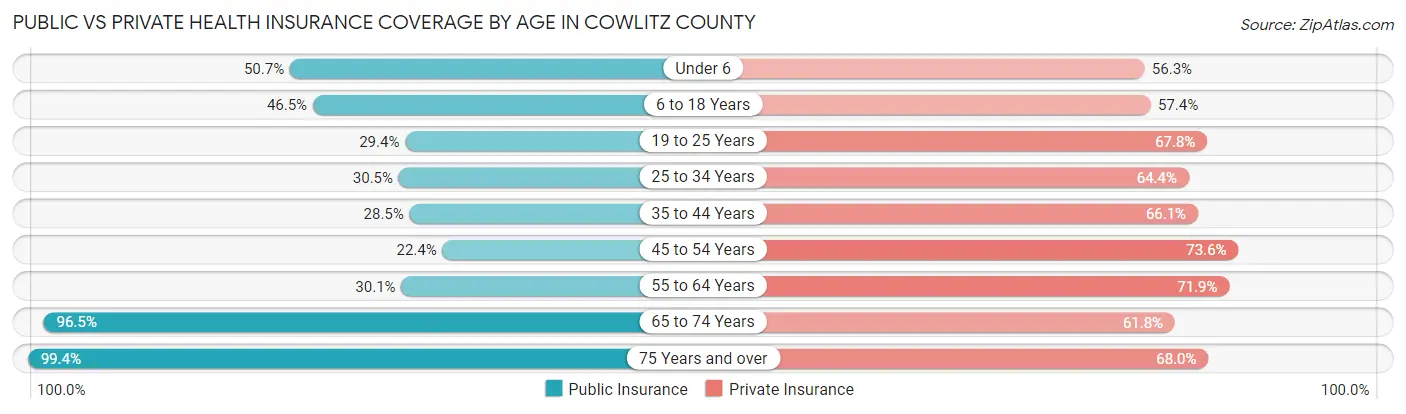
| Age Bracket | Public Insurance | Private Insurance |
| Under 6 | 3,924 (50.7%) | 4,351 (56.3%) |
| 6 to 18 Years | 8,602 (46.5%) | 10,623 (57.4%) |
| 19 to 25 Years | 2,487 (29.3%) | 5,748 (67.8%) |
| 25 to 34 Years | 3,820 (30.5%) | 8,059 (64.4%) |
| 35 to 44 Years | 3,765 (28.5%) | 8,721 (66.1%) |
| 45 to 54 Years | 2,970 (22.4%) | 9,753 (73.6%) |
| 55 to 64 Years | 4,594 (30.1%) | 10,992 (71.9%) |
| 65 to 74 Years | 12,278 (96.5%) | 7,869 (61.8%) |
| 75 Years and over | 8,046 (99.4%) | 5,506 (68.0%) |
| Total | 50,486 (46.0%) | 71,622 (65.2%) |
Disability Status by Sex by Age in Cowlitz County
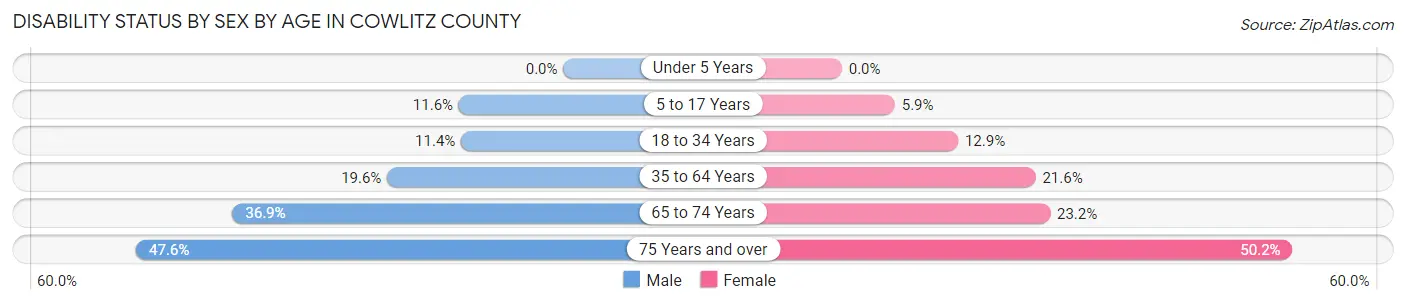
| Age Bracket | Male | Female |
| Under 5 Years | 0 (0.0%) | 0 (0.0%) |
| 5 to 17 Years | 1,104 (11.6%) | 528 (5.9%) |
| 18 to 34 Years | 1,278 (11.4%) | 1,427 (12.9%) |
| 35 to 64 Years | 4,105 (19.6%) | 4,487 (21.6%) |
| 65 to 74 Years | 2,315 (36.9%) | 1,495 (23.2%) |
| 75 Years and over | 1,732 (47.6%) | 2,235 (50.2%) |
Disability Class by Sex by Age in Cowlitz County
Disability Class: Hearing Difficulty
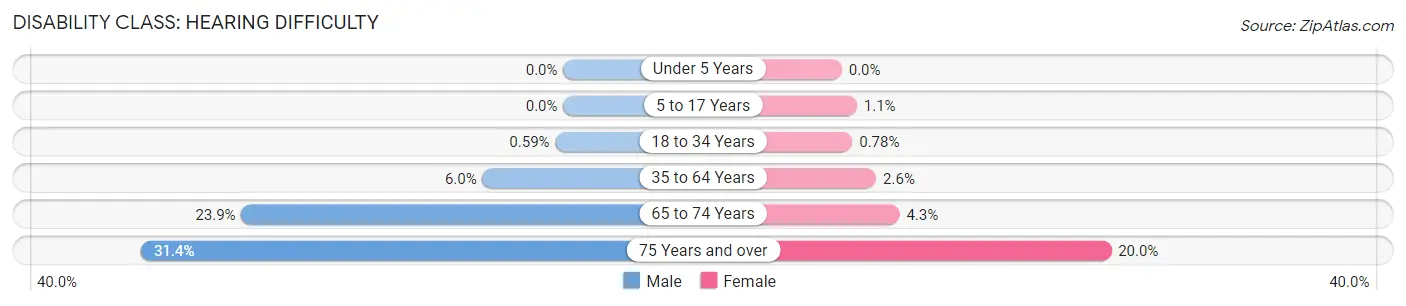
| Age Bracket | Male | Female |
| Under 5 Years | 0 (0.0%) | 0 (0.0%) |
| 5 to 17 Years | 0 (0.0%) | 100 (1.1%) |
| 18 to 34 Years | 66 (0.6%) | 86 (0.8%) |
| 35 to 64 Years | 1,255 (6.0%) | 531 (2.5%) |
| 65 to 74 Years | 1,501 (23.9%) | 276 (4.3%) |
| 75 Years and over | 1,141 (31.4%) | 891 (20.0%) |
Disability Class: Vision Difficulty
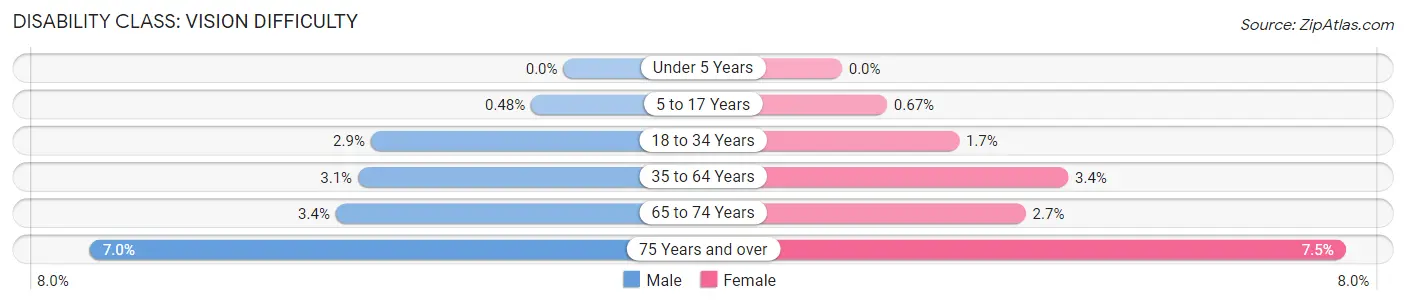
| Age Bracket | Male | Female |
| Under 5 Years | 0 (0.0%) | 0 (0.0%) |
| 5 to 17 Years | 46 (0.5%) | 60 (0.7%) |
| 18 to 34 Years | 321 (2.9%) | 192 (1.7%) |
| 35 to 64 Years | 637 (3.0%) | 699 (3.4%) |
| 65 to 74 Years | 212 (3.4%) | 176 (2.7%) |
| 75 Years and over | 256 (7.0%) | 333 (7.5%) |
Disability Class: Cognitive Difficulty
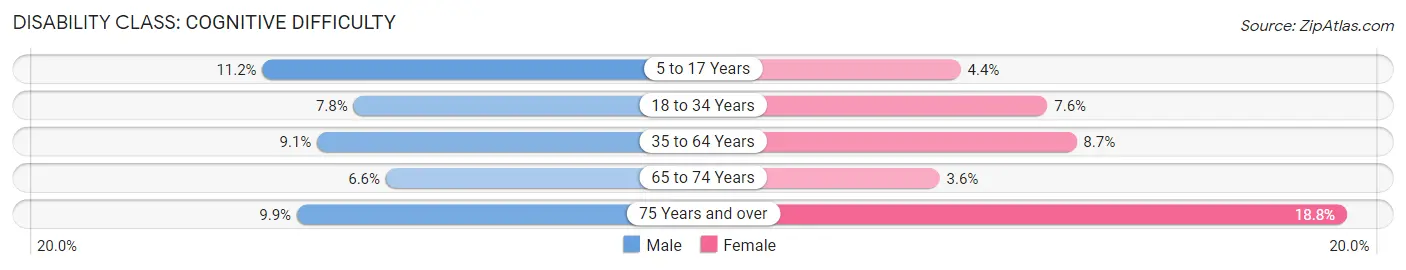
| Age Bracket | Male | Female |
| 5 to 17 Years | 1,060 (11.2%) | 395 (4.4%) |
| 18 to 34 Years | 875 (7.8%) | 841 (7.6%) |
| 35 to 64 Years | 1,912 (9.1%) | 1,813 (8.7%) |
| 65 to 74 Years | 414 (6.6%) | 234 (3.6%) |
| 75 Years and over | 360 (9.9%) | 835 (18.8%) |
Disability Class: Ambulatory Difficulty
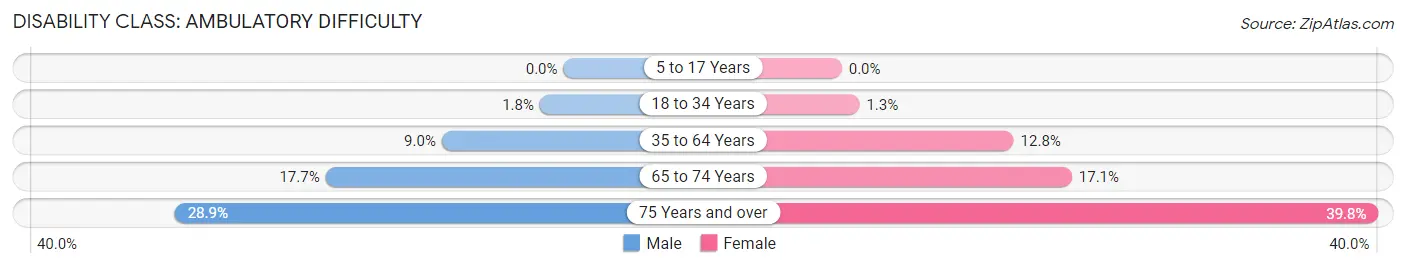
| Age Bracket | Male | Female |
| 5 to 17 Years | 0 (0.0%) | 0 (0.0%) |
| 18 to 34 Years | 197 (1.8%) | 144 (1.3%) |
| 35 to 64 Years | 1,888 (9.0%) | 2,655 (12.8%) |
| 65 to 74 Years | 1,109 (17.7%) | 1,101 (17.1%) |
| 75 Years and over | 1,050 (28.8%) | 1,774 (39.8%) |
Disability Class: Self-Care Difficulty
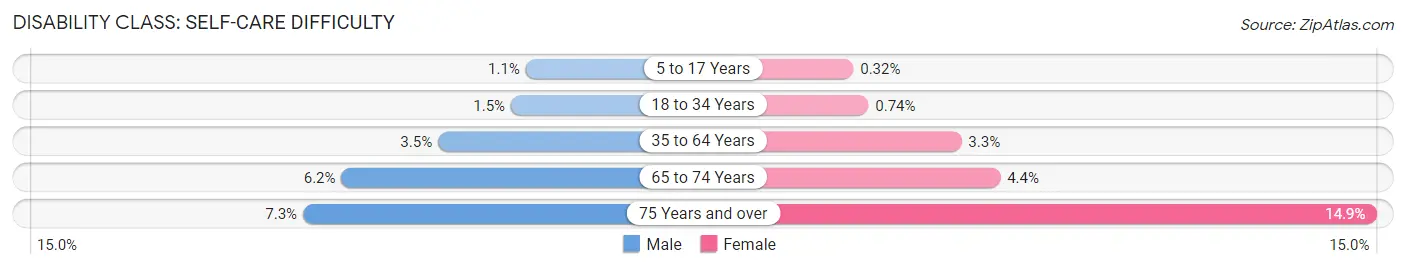
| Age Bracket | Male | Female |
| 5 to 17 Years | 100 (1.1%) | 29 (0.3%) |
| 18 to 34 Years | 164 (1.5%) | 82 (0.7%) |
| 35 to 64 Years | 731 (3.5%) | 692 (3.3%) |
| 65 to 74 Years | 388 (6.2%) | 284 (4.4%) |
| 75 Years and over | 264 (7.2%) | 664 (14.9%) |
Technology Access in Cowlitz County
Computing Device Access in Cowlitz County
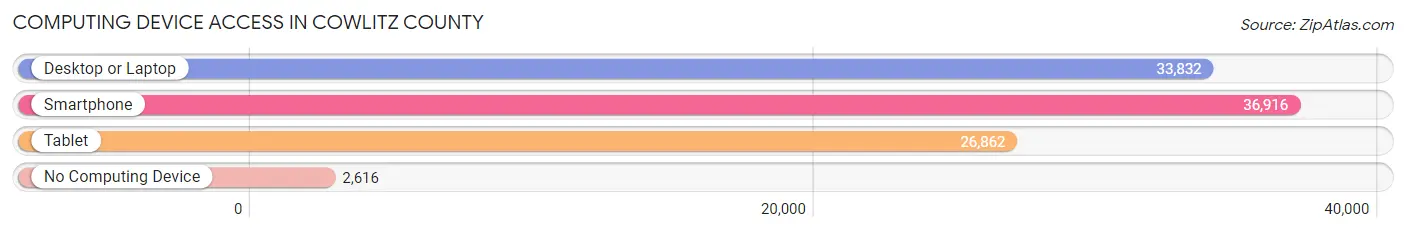
| Device Type | # Households | % Households |
| Desktop or Laptop | 33,832 | 78.4% |
| Smartphone | 36,916 | 85.5% |
| Tablet | 26,862 | 62.2% |
| No Computing Device | 2,616 | 6.1% |
| Total | 43,167 | 100.0% |
Internet Access in Cowlitz County
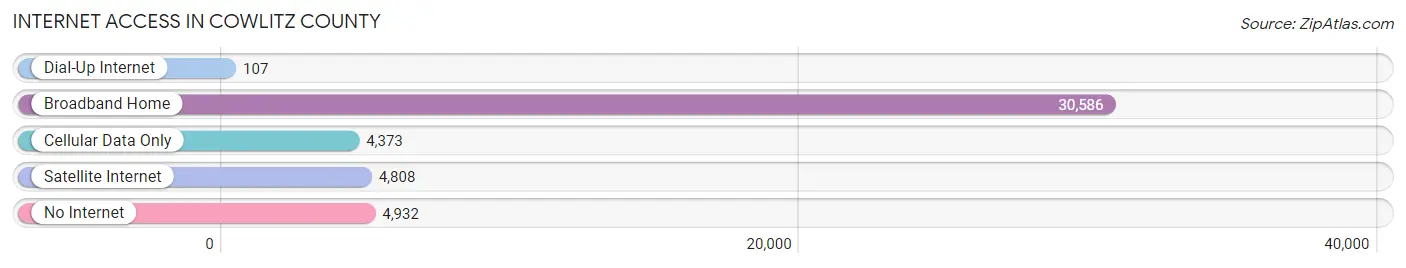
| Internet Type | # Households | % Households |
| Dial-Up Internet | 107 | 0.3% |
| Broadband Home | 30,586 | 70.9% |
| Cellular Data Only | 4,373 | 10.1% |
| Satellite Internet | 4,808 | 11.1% |
| No Internet | 4,932 | 11.4% |
| Total | 43,167 | 100.0% |
Cowlitz County Summary
Cowlitz County is located in the southwestern corner of Washington State, along the Columbia River. It is bordered by Lewis County to the north, Clark County to the east, and the Columbia River to the south and west. The county seat is located in the city of Kelso. Cowlitz County is home to a population of approximately 102,410 people, making it the fourth most populous county in the state.
History
The area that is now Cowlitz County was first inhabited by the Cowlitz tribe, a Native American tribe of the Salishan language family. The Cowlitz people lived in the area for thousands of years before the arrival of European settlers. The first Europeans to explore the area were members of the Lewis and Clark Expedition, who arrived in 1805. The area was officially established as Cowlitz County in 1854, and was named after the Cowlitz tribe.
The county was initially populated by settlers from the Oregon Territory, who were drawn to the area by the abundance of natural resources. The timber industry was the primary economic driver in the early years of the county, and the area quickly became known for its logging and lumber production. The county also became a major agricultural center, with dairy farming and fruit production becoming major industries.
In the late 19th century, the county began to develop its transportation infrastructure, with the construction of the Northern Pacific Railroad in 1873. This allowed for the development of the county’s cities and towns, and the population began to grow rapidly. The county’s economy continued to be driven by the timber industry until the mid-20th century, when the industry began to decline.
Geography
Cowlitz County covers an area of 1,890 square miles, making it the fifth largest county in the state. The county is located in the southwestern corner of Washington State, along the Columbia River. The county is bordered by Lewis County to the north, Clark County to the east, and the Columbia River to the south and west.
The county is divided into two distinct regions: the lowlands along the Columbia River, and the uplands to the east. The lowlands are characterized by flat terrain and are home to the majority of the county’s population. The uplands are more rugged and are home to the majority of the county’s forests. The highest point in the county is Mount St. Helens, which rises to an elevation of 8,365 feet.
Economy
Cowlitz County’s economy is largely driven by the timber industry, which is the county’s largest employer. The county is home to several large timber companies, including Weyerhaeuser and Longview Fibre. The county is also home to several manufacturing companies, including Georgia-Pacific and Kapstone.
The county is also home to several agricultural operations, including dairy farms and fruit orchards. The county is also home to several wineries, which produce a variety of wines from local grapes.
Demographics
As of the 2010 census, Cowlitz County had a population of 102,410 people. The population is spread out across the county, with the largest population centers being Kelso, Longview, and Castle Rock. The population is largely white (90.2%), with smaller percentages of African Americans (3.2%), Asians (2.2%), and Native Americans (1.2%). The median household income in the county is $48,845, and the median home value is $182,400.
Common Questions
What is Per Capita Income in Cowlitz County?
Per Capita income in Cowlitz County is $35,526.
What is the Median Family Income in Cowlitz County?
Median Family Income in Cowlitz County is $83,138.
What is the Median Household income in Cowlitz County?
Median Household Income in Cowlitz County is $70,912.
What is Income or Wage Gap in Cowlitz County?
Income or Wage Gap in Cowlitz County is 38.4%.
Women in Cowlitz County earn 61.6 cents for every dollar earned by a man.
What is Family Income Deficit in Cowlitz County?
Family Income Deficit in Cowlitz County is $11,291.
Families that are below poverty line in Cowlitz County earn $11,291 less on average than the poverty threshold level.
What is Inequality or Gini Index in Cowlitz County?
Inequality or Gini Index in Cowlitz County is 0.44.
What is the Total Population of Cowlitz County?
Total Population of Cowlitz County is 110,621.
What is the Total Male Population of Cowlitz County?
Total Male Population of Cowlitz County is 55,417.
What is the Total Female Population of Cowlitz County?
Total Female Population of Cowlitz County is 55,204.
What is the Ratio of Males per 100 Females in Cowlitz County?
There are 100.39 Males per 100 Females in Cowlitz County.
What is the Ratio of Females per 100 Males in Cowlitz County?
There are 99.62 Females per 100 Males in Cowlitz County.
What is the Median Population Age in Cowlitz County?
Median Population Age in Cowlitz County is 40.8 Years.
What is the Average Family Size in Cowlitz County
Average Family Size in Cowlitz County is 3.1 People.
What is the Average Household Size in Cowlitz County
Average Household Size in Cowlitz County is 2.5 People.
How Large is the Labor Force in Cowlitz County?
There are 49,717 People in the Labor Forcein in Cowlitz County.
What is the Percentage of People in the Labor Force in Cowlitz County?
56.2% of People are in the Labor Force in Cowlitz County.
What is the Unemployment Rate in Cowlitz County?
Unemployment Rate in Cowlitz County is 5.5%.