Whatcom County, WA Map & Demographics
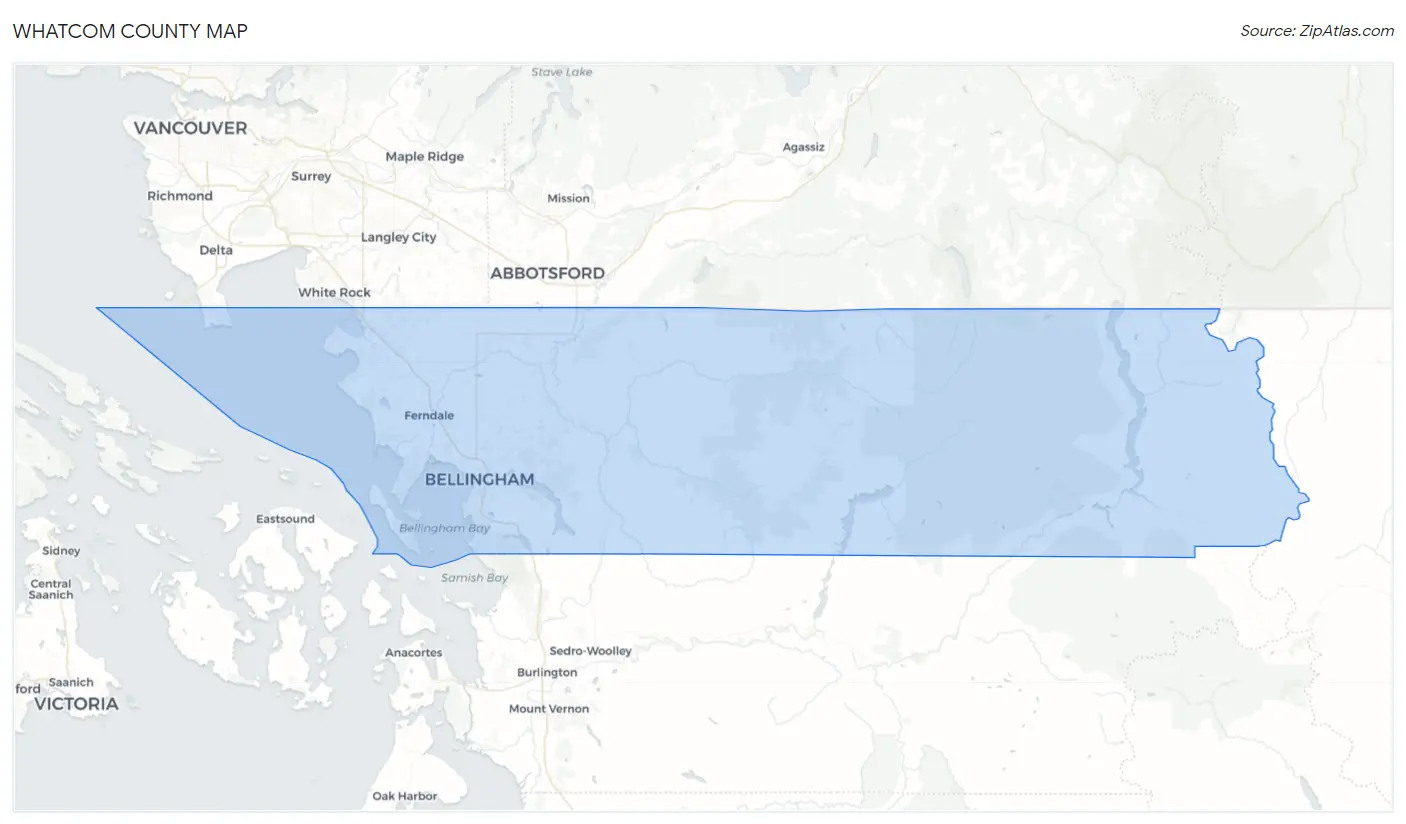
Whatcom County Map
Whatcom County Overview
$40,916
PER CAPITA INCOME
$96,874
AVG FAMILY INCOME
$77,581
AVG HOUSEHOLD INCOME
33.4%
WAGE / INCOME GAP [ % ]
66.6¢/ $1
WAGE / INCOME GAP [ $ ]
$9,242
FAMILY INCOME DEFICIT
0.45
INEQUALITY / GINI INDEX
226,523
TOTAL POPULATION
112,654
MALE POPULATION
113,869
FEMALE POPULATION
98.93
MALES / 100 FEMALES
101.08
FEMALES / 100 MALES
37.8
MEDIAN AGE
2.9
AVG FAMILY SIZE
2.4
AVG HOUSEHOLD SIZE
117,472
LABOR FORCE [ PEOPLE ]
62.4%
PERCENT IN LABOR FORCE
4.9%
UNEMPLOYMENT RATE
Whatcom County Area Codes
Income in Whatcom County
Income Overview in Whatcom County
Per Capita Income in Whatcom County is $40,916, while median incomes of families and households are $96,874 and $77,581 respectively.
| Characteristic | Number | Measure |
| Per Capita Income | 226,523 | $40,916 |
| Median Family Income | 54,640 | $96,874 |
| Mean Family Income | 54,640 | $120,182 |
| Median Household Income | 91,171 | $77,581 |
| Mean Household Income | 91,171 | $99,746 |
| Income Deficit | 54,640 | $9,242 |
| Wage / Income Gap (%) | 226,523 | 33.39% |
| Wage / Income Gap ($) | 226,523 | 66.61¢ per $1 |
| Gini / Inequality Index | 226,523 | 0.45 |
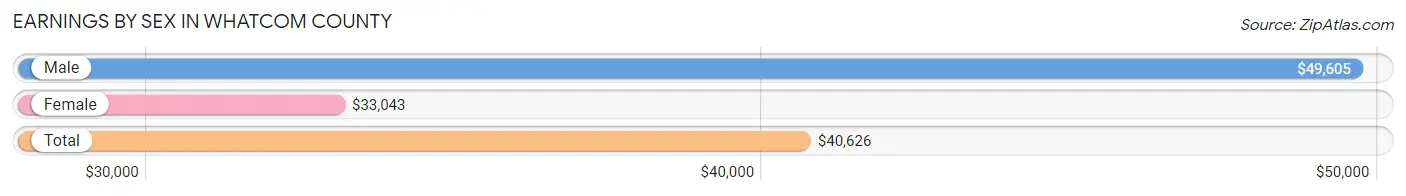
Earnings by Sex in Whatcom County
Average Earnings in Whatcom County are $40,626, $49,605 for men and $33,043 for women, a difference of 33.4%.
| Sex | Number | Average Earnings |
| Male | 66,302 (52.9%) | $49,605 |
| Female | 59,028 (47.1%) | $33,043 |
| Total | 125,330 (100.0%) | $40,626 |
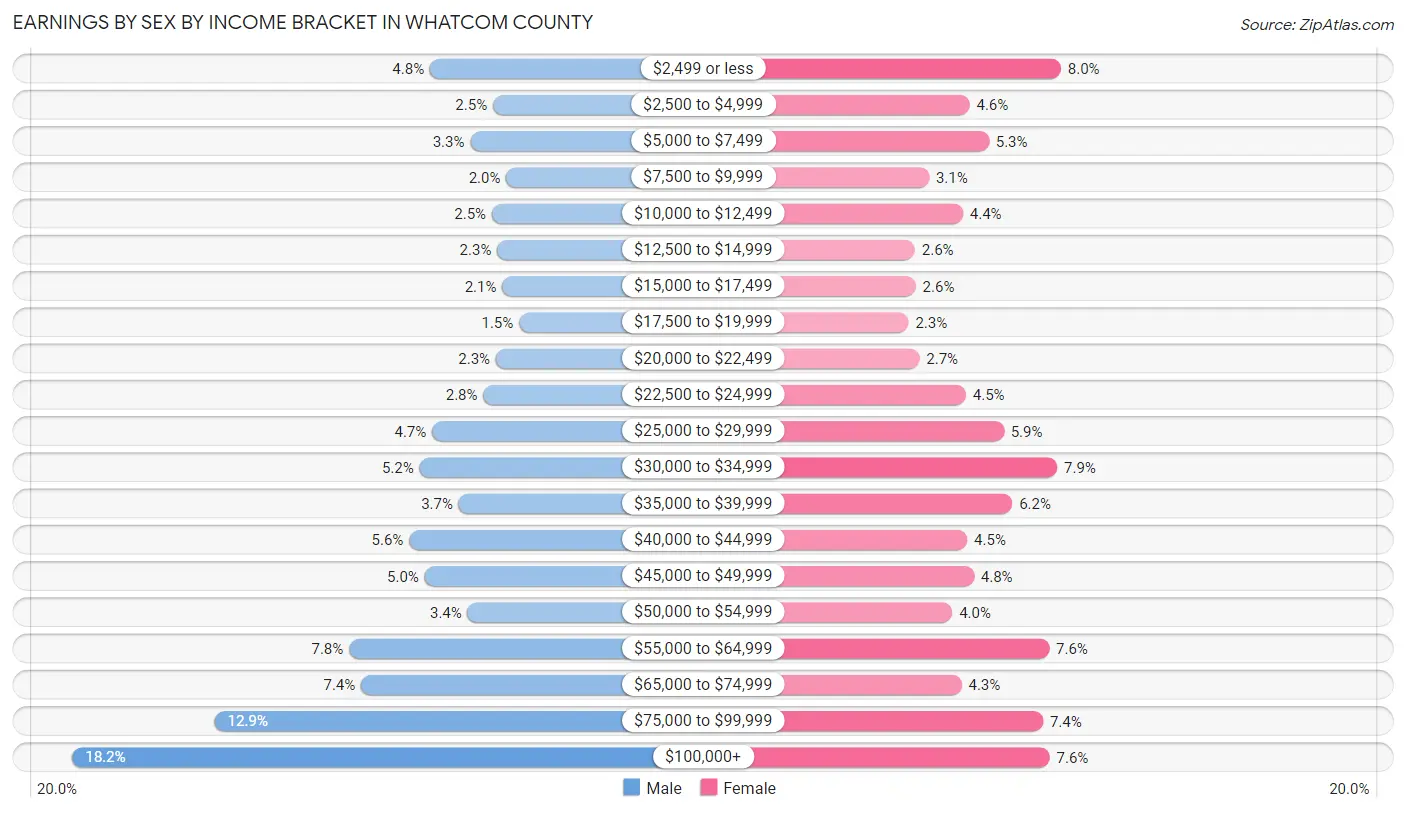
Earnings by Sex by Income Bracket in Whatcom County
The most common earnings brackets in Whatcom County are $100,000+ for men (12,076 | 18.2%) and $2,499 or less for women (4,734 | 8.0%).
| Income | Male | Female |
| $2,499 or less | 3,191 (4.8%) | 4,734 (8.0%) |
| $2,500 to $4,999 | 1,625 (2.5%) | 2,717 (4.6%) |
| $5,000 to $7,499 | 2,190 (3.3%) | 3,138 (5.3%) |
| $7,500 to $9,999 | 1,292 (1.9%) | 1,821 (3.1%) |
| $10,000 to $12,499 | 1,654 (2.5%) | 2,565 (4.3%) |
| $12,500 to $14,999 | 1,518 (2.3%) | 1,507 (2.5%) |
| $15,000 to $17,499 | 1,395 (2.1%) | 1,525 (2.6%) |
| $17,500 to $19,999 | 975 (1.5%) | 1,366 (2.3%) |
| $20,000 to $22,499 | 1,549 (2.3%) | 1,608 (2.7%) |
| $22,500 to $24,999 | 1,865 (2.8%) | 2,635 (4.5%) |
| $25,000 to $29,999 | 3,137 (4.7%) | 3,470 (5.9%) |
| $30,000 to $34,999 | 3,448 (5.2%) | 4,650 (7.9%) |
| $35,000 to $39,999 | 2,472 (3.7%) | 3,658 (6.2%) |
| $40,000 to $44,999 | 3,706 (5.6%) | 2,660 (4.5%) |
| $45,000 to $49,999 | 3,321 (5.0%) | 2,809 (4.8%) |
| $50,000 to $54,999 | 2,252 (3.4%) | 2,329 (4.0%) |
| $55,000 to $64,999 | 5,197 (7.8%) | 4,472 (7.6%) |
| $65,000 to $74,999 | 4,902 (7.4%) | 2,540 (4.3%) |
| $75,000 to $99,999 | 8,537 (12.9%) | 4,339 (7.3%) |
| $100,000+ | 12,076 (18.2%) | 4,485 (7.6%) |
| Total | 66,302 (100.0%) | 59,028 (100.0%) |
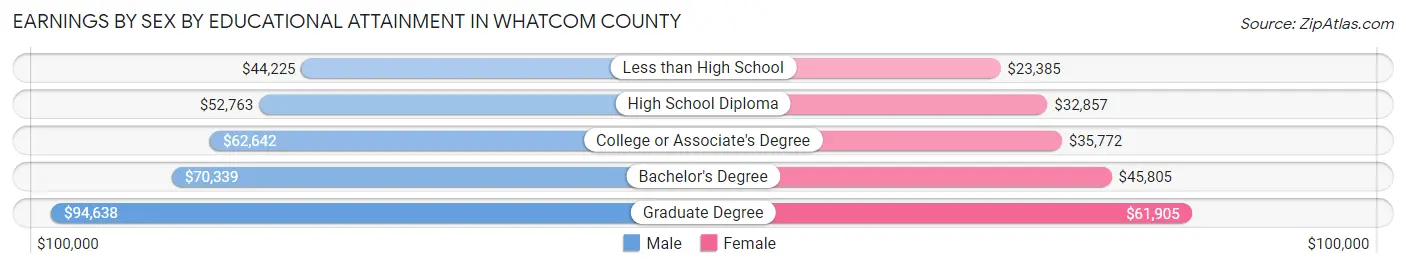
Earnings by Sex by Educational Attainment in Whatcom County
Average earnings in Whatcom County are $61,270 for men and $40,105 for women, a difference of 34.5%. Men with an educational attainment of graduate degree enjoy the highest average annual earnings of $94,638, while those with less than high school education earn the least with $44,225. Women with an educational attainment of graduate degree earn the most with the average annual earnings of $61,905, while those with less than high school education have the smallest earnings of $23,385.
| Educational Attainment | Male Income | Female Income |
| Less than High School | $44,225 | $23,385 |
| High School Diploma | $52,763 | $32,857 |
| College or Associate's Degree | $62,642 | $35,772 |
| Bachelor's Degree | $70,339 | $45,805 |
| Graduate Degree | $94,638 | $61,905 |
| Total | $61,270 | $40,105 |
Family Income in Whatcom County
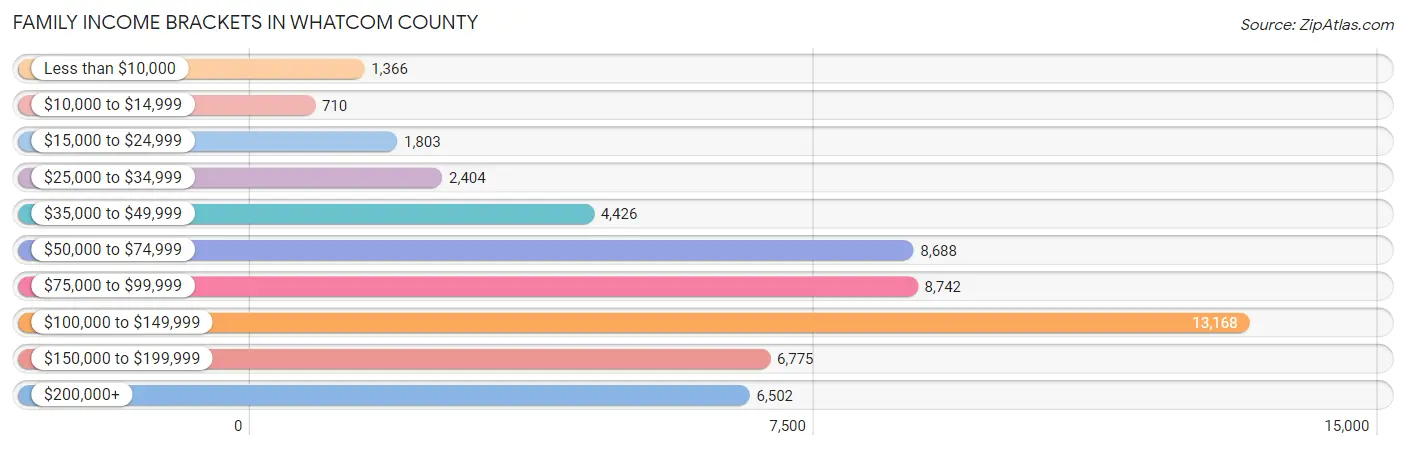
Family Income Brackets in Whatcom County
According to the Whatcom County family income data, there are 13,168 families falling into the $100,000 to $149,999 income range, which is the most common income bracket and makes up 24.1% of all families. Conversely, the $10,000 to $14,999 income bracket is the least frequent group with only 710 families (1.3%) belonging to this category.
| Income Bracket | # Families | % Families |
| Less than $10,000 | 1,366 | 2.5% |
| $10,000 to $14,999 | 710 | 1.3% |
| $15,000 to $24,999 | 1,803 | 3.3% |
| $25,000 to $34,999 | 2,404 | 4.4% |
| $35,000 to $49,999 | 4,426 | 8.1% |
| $50,000 to $74,999 | 8,688 | 15.9% |
| $75,000 to $99,999 | 8,742 | 16.0% |
| $100,000 to $149,999 | 13,168 | 24.1% |
| $150,000 to $199,999 | 6,775 | 12.4% |
| $200,000+ | 6,502 | 11.9% |
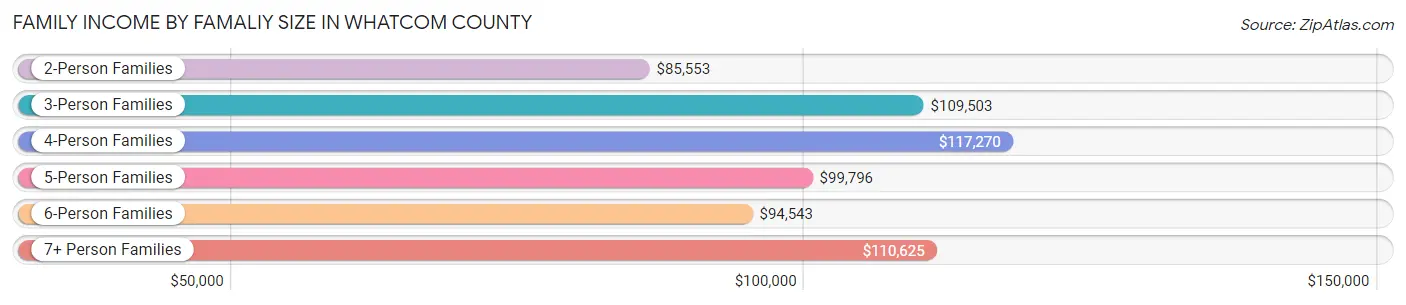
Family Income by Famaliy Size in Whatcom County
4-person families (9,539 | 17.5%) account for the highest median family income in Whatcom County with $117,270 per family, while 2-person families (28,523 | 52.2%) have the highest median income of $42,776 per family member.
| Income Bracket | # Families | Median Income |
| 2-Person Families | 28,523 (52.2%) | $85,553 |
| 3-Person Families | 10,821 (19.8%) | $109,503 |
| 4-Person Families | 9,539 (17.5%) | $117,270 |
| 5-Person Families | 3,545 (6.5%) | $99,796 |
| 6-Person Families | 1,646 (3.0%) | $94,543 |
| 7+ Person Families | 566 (1.0%) | $110,625 |
| Total | 54,640 (100.0%) | $96,874 |
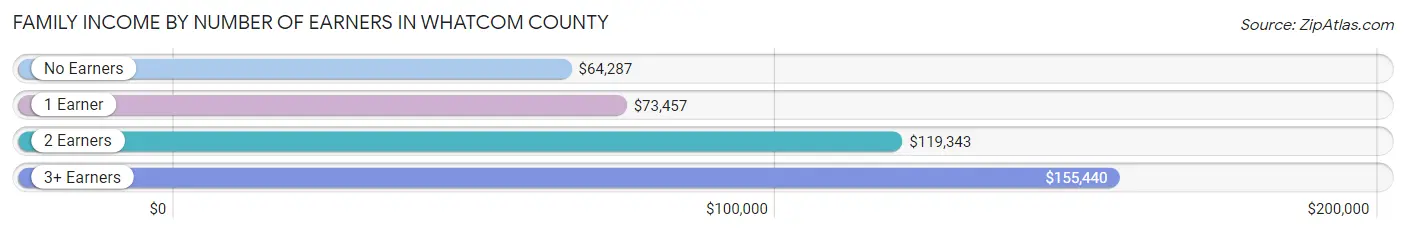
Family Income by Number of Earners in Whatcom County
The median family income in Whatcom County is $96,874, with families comprising 3+ earners (4,817) having the highest median family income of $155,440, while families with no earners (10,027) have the lowest median family income of $64,287, accounting for 8.8% and 18.3% of families, respectively.
| Number of Earners | # Families | Median Income |
| No Earners | 10,027 (18.3%) | $64,287 |
| 1 Earner | 16,765 (30.7%) | $73,457 |
| 2 Earners | 23,031 (42.1%) | $119,343 |
| 3+ Earners | 4,817 (8.8%) | $155,440 |
| Total | 54,640 (100.0%) | $96,874 |
Household Income in Whatcom County
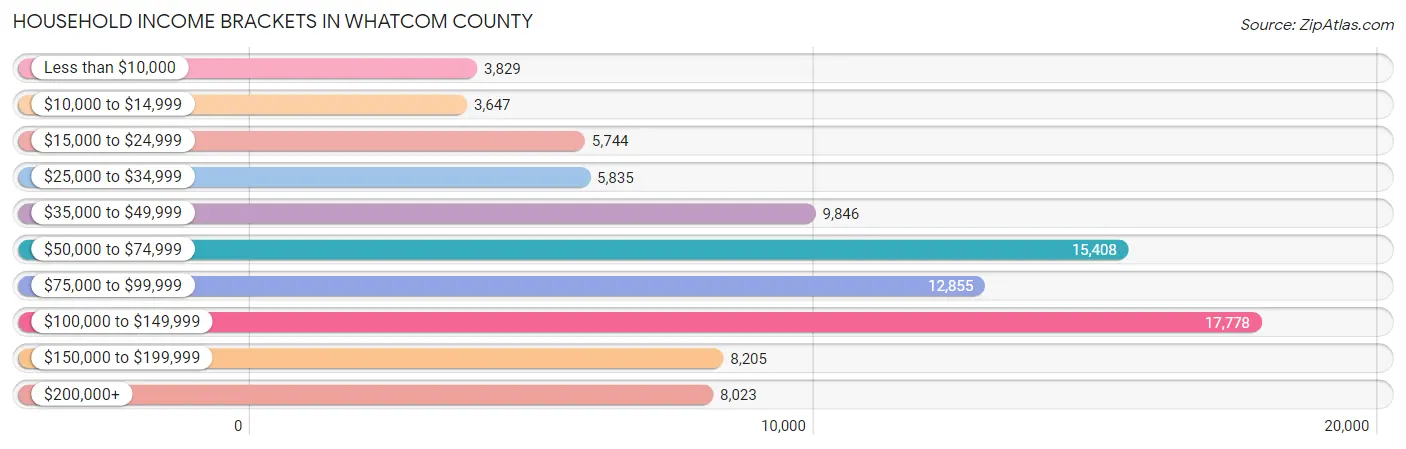
Household Income Brackets in Whatcom County
With 17,778 households falling in the category, the $100,000 to $149,999 income range is the most frequent in Whatcom County, accounting for 19.5% of all households. In contrast, only 3,647 households (4.0%) fall into the $10,000 to $14,999 income bracket, making it the least populous group.
| Income Bracket | # Households | % Households |
| Less than $10,000 | 3,829 | 4.2% |
| $10,000 to $14,999 | 3,647 | 4.0% |
| $15,000 to $24,999 | 5,744 | 6.3% |
| $25,000 to $34,999 | 5,835 | 6.4% |
| $35,000 to $49,999 | 9,846 | 10.8% |
| $50,000 to $74,999 | 15,408 | 16.9% |
| $75,000 to $99,999 | 12,855 | 14.1% |
| $100,000 to $149,999 | 17,778 | 19.5% |
| $150,000 to $199,999 | 8,205 | 9.0% |
| $200,000+ | 8,023 | 8.8% |
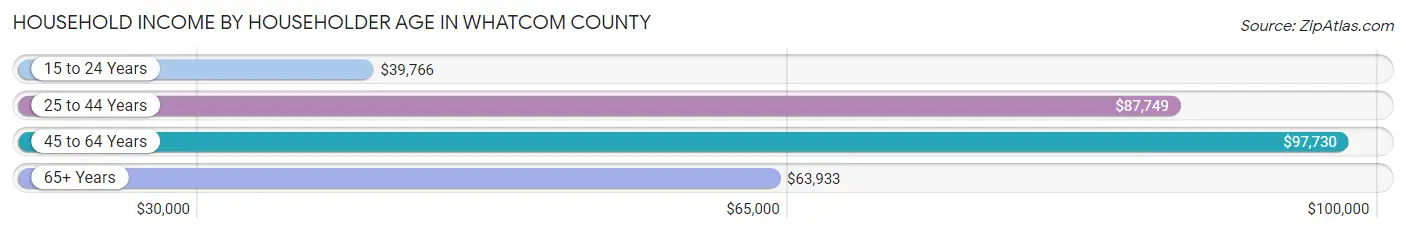
Household Income by Householder Age in Whatcom County
The median household income in Whatcom County is $77,581, with the highest median household income of $97,730 found in the 45 to 64 years age bracket for the primary householder. A total of 29,084 households (31.9%) fall into this category. Meanwhile, the 15 to 24 years age bracket for the primary householder has the lowest median household income of $39,766, with 7,611 households (8.4%) in this group.
| Income Bracket | # Households | Median Income |
| 15 to 24 Years | 7,611 (8.4%) | $39,766 |
| 25 to 44 Years | 28,793 (31.6%) | $87,749 |
| 45 to 64 Years | 29,084 (31.9%) | $97,730 |
| 65+ Years | 25,683 (28.2%) | $63,933 |
| Total | 91,171 (100.0%) | $77,581 |
Poverty in Whatcom County
Income Below Poverty by Sex and Age in Whatcom County
With 12.0% poverty level for males and 13.7% for females among the residents of Whatcom County, 18 to 24 year old males and 18 to 24 year old females are the most vulnerable to poverty, with 3,884 males (27.8%) and 4,760 females (33.2%) in their respective age groups living below the poverty level.
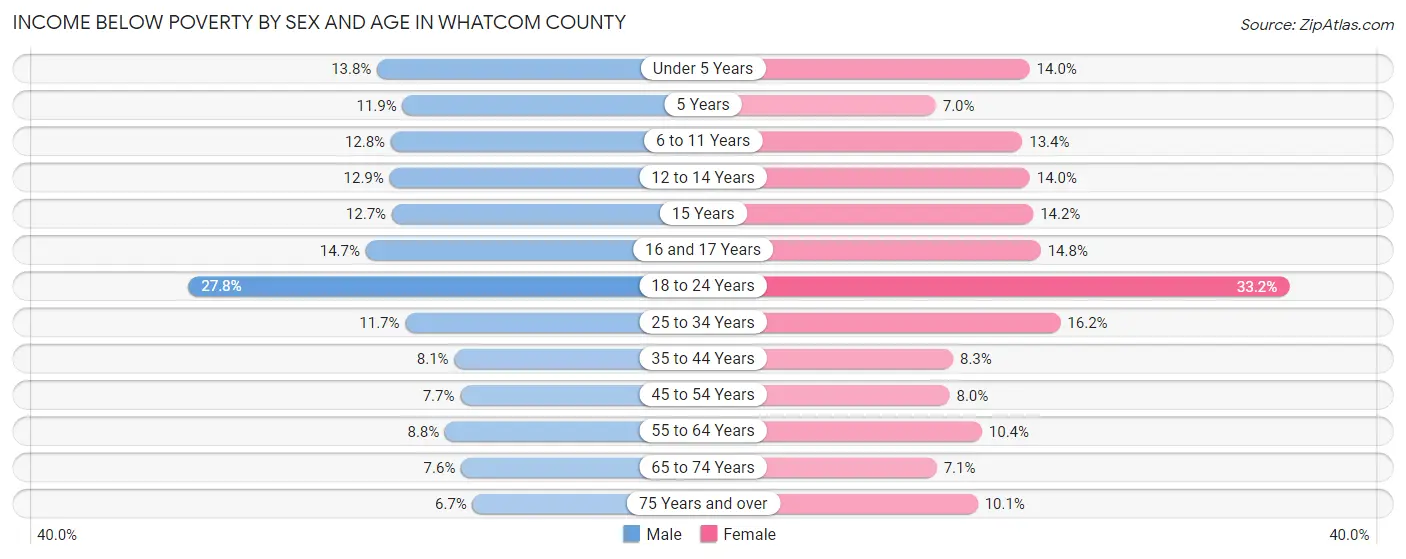
| Age Bracket | Male | Female |
| Under 5 Years | 755 (13.8%) | 735 (14.0%) |
| 5 Years | 126 (11.9%) | 92 (7.0%) |
| 6 to 11 Years | 991 (12.8%) | 829 (13.4%) |
| 12 to 14 Years | 470 (12.9%) | 505 (14.0%) |
| 15 Years | 160 (12.7%) | 210 (14.2%) |
| 16 and 17 Years | 374 (14.7%) | 308 (14.8%) |
| 18 to 24 Years | 3,884 (27.8%) | 4,760 (33.2%) |
| 25 to 34 Years | 1,862 (11.7%) | 2,403 (16.2%) |
| 35 to 44 Years | 1,149 (8.1%) | 1,146 (8.3%) |
| 45 to 54 Years | 985 (7.6%) | 991 (8.0%) |
| 55 to 64 Years | 1,150 (8.8%) | 1,449 (10.4%) |
| 65 to 74 Years | 903 (7.6%) | 927 (7.0%) |
| 75 Years and over | 455 (6.7%) | 850 (10.1%) |
| Total | 13,264 (12.0%) | 15,205 (13.7%) |
Income Above Poverty by Sex and Age in Whatcom County
According to the poverty statistics in Whatcom County, males aged 75 years and over and females aged 5 years are the age groups that are most secure financially, with 93.3% of males and 93.0% of females in these age groups living above the poverty line.
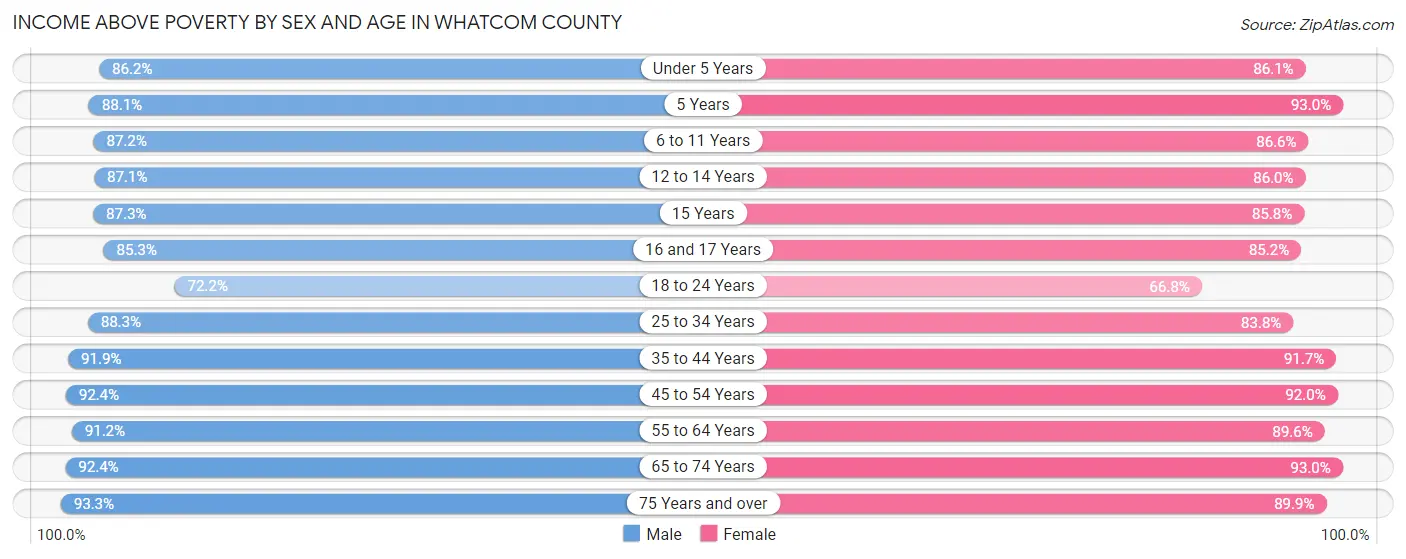
| Age Bracket | Male | Female |
| Under 5 Years | 4,708 (86.2%) | 4,534 (86.1%) |
| 5 Years | 929 (88.1%) | 1,226 (93.0%) |
| 6 to 11 Years | 6,752 (87.2%) | 5,359 (86.6%) |
| 12 to 14 Years | 3,174 (87.1%) | 3,113 (86.0%) |
| 15 Years | 1,097 (87.3%) | 1,268 (85.8%) |
| 16 and 17 Years | 2,176 (85.3%) | 1,778 (85.2%) |
| 18 to 24 Years | 10,069 (72.2%) | 9,575 (66.8%) |
| 25 to 34 Years | 14,007 (88.3%) | 12,404 (83.8%) |
| 35 to 44 Years | 13,053 (91.9%) | 12,720 (91.7%) |
| 45 to 54 Years | 11,885 (92.3%) | 11,403 (92.0%) |
| 55 to 64 Years | 11,947 (91.2%) | 12,481 (89.6%) |
| 65 to 74 Years | 11,009 (92.4%) | 12,213 (92.9%) |
| 75 Years and over | 6,302 (93.3%) | 7,575 (89.9%) |
| Total | 97,108 (88.0%) | 95,649 (86.3%) |
Income Below Poverty Among Married-Couple Families in Whatcom County
The poverty statistics for married-couple families in Whatcom County show that 3.4% or 1,493 of the total 43,780 families live below the poverty line. Families with 5 or more children have the highest poverty rate of 25.4%, comprising of 35 families. On the other hand, families with no children have the lowest poverty rate of 3.0%, which includes 791 families.
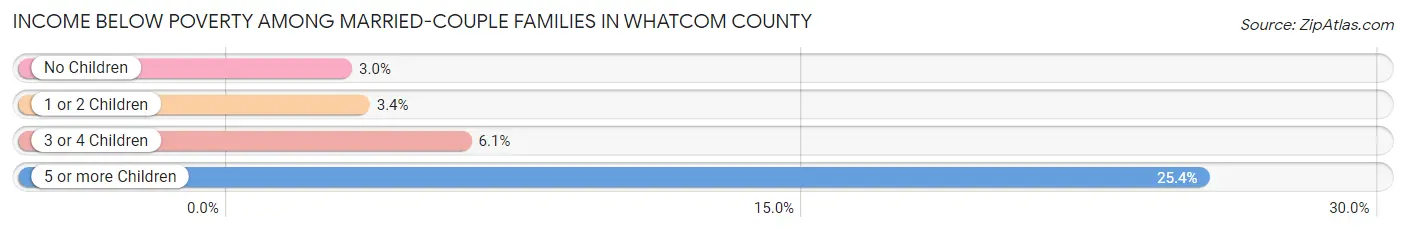
| Children | Above Poverty | Below Poverty |
| No Children | 25,781 (97.0%) | 791 (3.0%) |
| 1 or 2 Children | 13,587 (96.6%) | 484 (3.4%) |
| 3 or 4 Children | 2,816 (93.9%) | 183 (6.1%) |
| 5 or more Children | 103 (74.6%) | 35 (25.4%) |
| Total | 42,287 (96.6%) | 1,493 (3.4%) |
Income Below Poverty Among Single-Parent Households in Whatcom County
According to the poverty data in Whatcom County, 13.9% or 485 single-father households and 26.7% or 1,967 single-mother households are living below the poverty line. Among single-father households, those with 5 or more children have the highest poverty rate, with 97 households (100.0%) experiencing poverty. Likewise, among single-mother households, those with 3 or 4 children have the highest poverty rate, with 265 households (40.4%) falling below the poverty line.
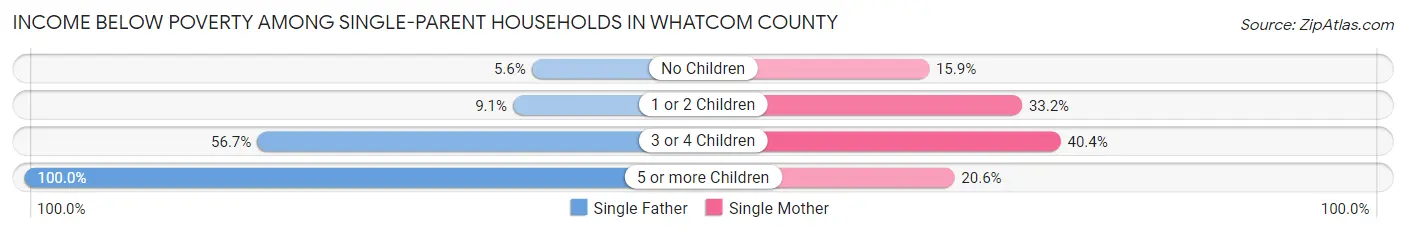
| Children | Single Father | Single Mother |
| No Children | 63 (5.6%) | 473 (15.9%) |
| 1 or 2 Children | 181 (9.1%) | 1,203 (33.2%) |
| 3 or 4 Children | 144 (56.7%) | 265 (40.4%) |
| 5 or more Children | 97 (100.0%) | 26 (20.6%) |
| Total | 485 (13.9%) | 1,967 (26.7%) |
Income Below Poverty Among Married-Couple vs Single-Parent Households in Whatcom County
The poverty data for Whatcom County shows that 1,493 of the married-couple family households (3.4%) and 2,452 of the single-parent households (22.6%) are living below the poverty level. Within the married-couple family households, those with 5 or more children have the highest poverty rate, with 35 households (25.4%) falling below the poverty line. Among the single-parent households, those with 5 or more children have the highest poverty rate, with 123 household (55.2%) living below poverty.
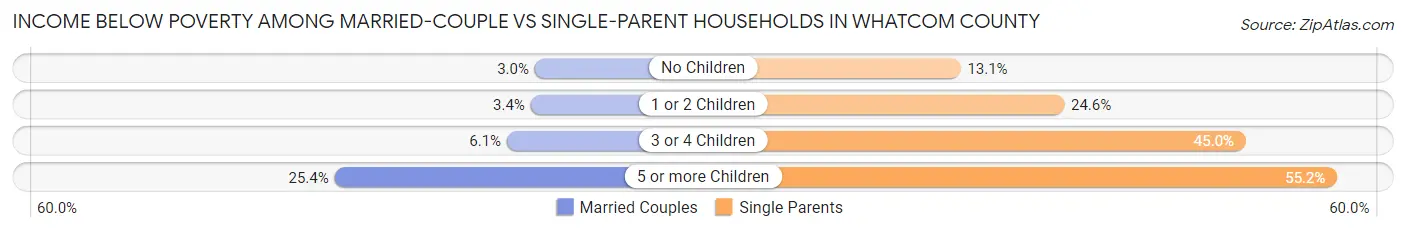
| Children | Married-Couple Families | Single-Parent Households |
| No Children | 791 (3.0%) | 536 (13.1%) |
| 1 or 2 Children | 484 (3.4%) | 1,384 (24.6%) |
| 3 or 4 Children | 183 (6.1%) | 409 (45.0%) |
| 5 or more Children | 35 (25.4%) | 123 (55.2%) |
| Total | 1,493 (3.4%) | 2,452 (22.6%) |
Race in Whatcom County
The most populous races in Whatcom County are White / Caucasian (181,059 | 79.9%), Hispanic or Latino (22,969 | 10.1%), and Two or more Races (18,840 | 8.3%).
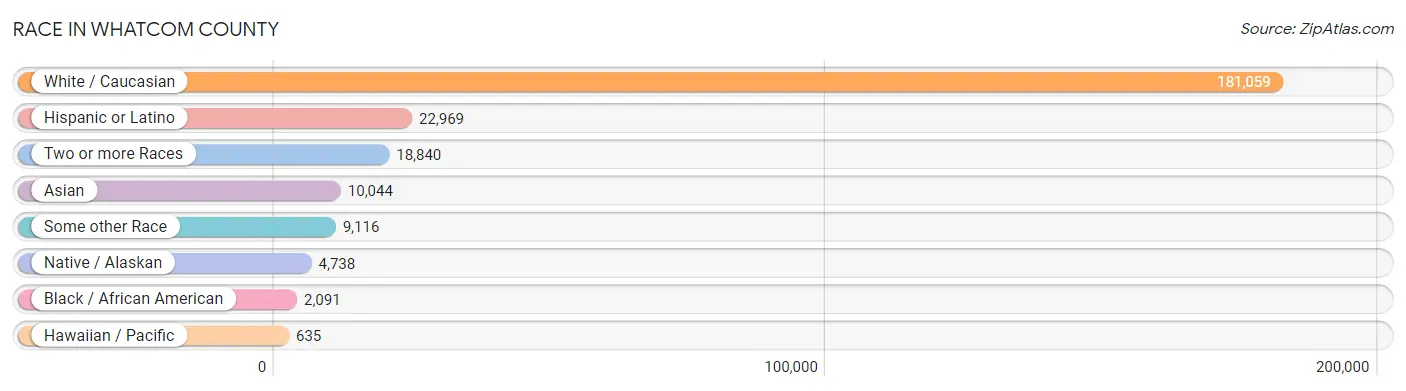
| Race | # Population | % Population |
| Asian | 10,044 | 4.4% |
| Black / African American | 2,091 | 0.9% |
| Hawaiian / Pacific | 635 | 0.3% |
| Hispanic or Latino | 22,969 | 10.1% |
| Native / Alaskan | 4,738 | 2.1% |
| White / Caucasian | 181,059 | 79.9% |
| Two or more Races | 18,840 | 8.3% |
| Some other Race | 9,116 | 4.0% |
| Total | 226,523 | 100.0% |
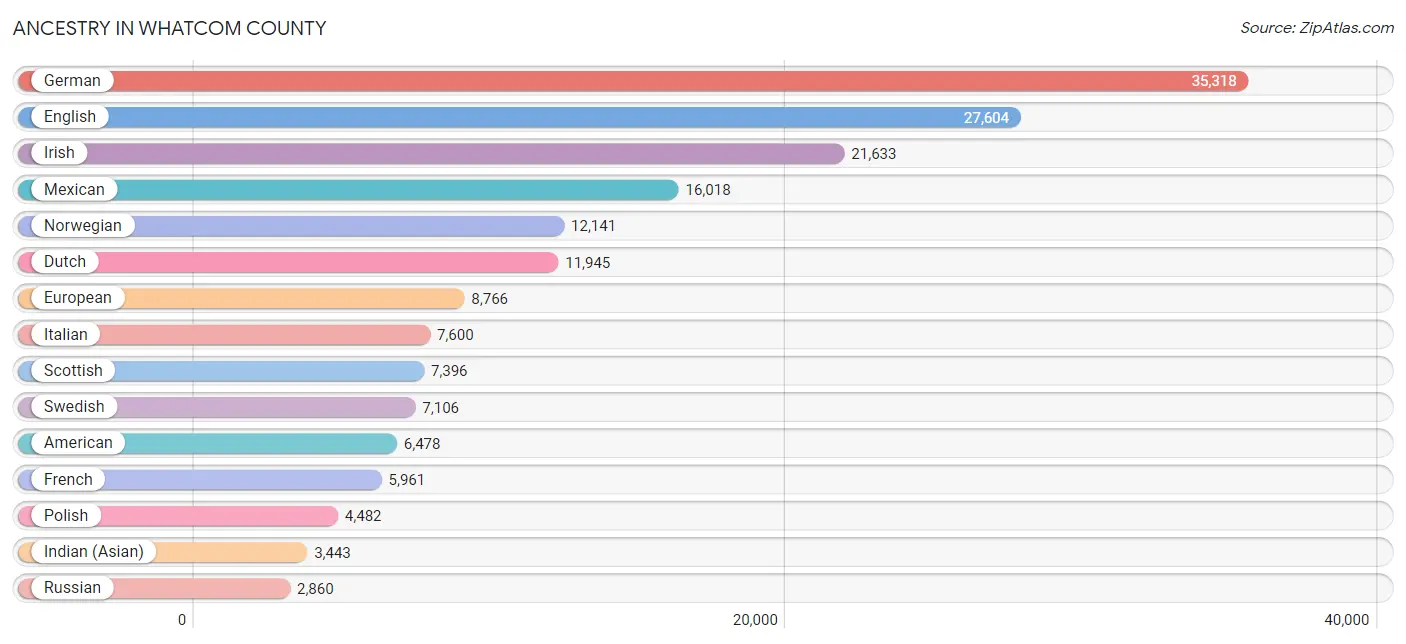
Ancestry in Whatcom County
The most populous ancestries reported in Whatcom County are German (35,318 | 15.6%), English (27,604 | 12.2%), Irish (21,633 | 9.6%), Mexican (16,018 | 7.1%), and Norwegian (12,141 | 5.4%), together accounting for 49.8% of all Whatcom County residents.
| Ancestry | # Population | % Population |
| Afghan | 152 | 0.1% |
| African | 257 | 0.1% |
| Alaska Native | 171 | 0.1% |
| Alaskan Athabascan | 120 | 0.1% |
| Albanian | 57 | 0.0% |
| Aleut | 136 | 0.1% |
| American | 6,478 | 2.9% |
| Apache | 18 | 0.0% |
| Arab | 972 | 0.4% |
| Argentinean | 121 | 0.1% |
| Armenian | 58 | 0.0% |
| Australian | 181 | 0.1% |
| Austrian | 626 | 0.3% |
| Bangladeshi | 18 | 0.0% |
| Basque | 51 | 0.0% |
| Belgian | 246 | 0.1% |
| Belizean | 41 | 0.0% |
| Bhutanese | 2,241 | 1.0% |
| Blackfeet | 156 | 0.1% |
| Bolivian | 74 | 0.0% |
| Brazilian | 75 | 0.0% |
| British | 2,666 | 1.2% |
| British West Indian | 14 | 0.0% |
| Bulgarian | 143 | 0.1% |
| Burmese | 1,100 | 0.5% |
| Cajun | 71 | 0.0% |
| Cambodian | 56 | 0.0% |
| Canadian | 2,020 | 0.9% |
| Carpatho Rusyn | 15 | 0.0% |
| Celtic | 163 | 0.1% |
| Central American | 1,926 | 0.9% |
| Central American Indian | 127 | 0.1% |
| Cherokee | 915 | 0.4% |
| Cheyenne | 86 | 0.0% |
| Chickasaw | 55 | 0.0% |
| Chilean | 69 | 0.0% |
| Chinese | 8 | 0.0% |
| Chippewa | 110 | 0.1% |
| Choctaw | 171 | 0.1% |
| Colombian | 139 | 0.1% |
| Colville | 14 | 0.0% |
| Comanche | 51 | 0.0% |
| Costa Rican | 244 | 0.1% |
| Cree | 7 | 0.0% |
| Creek | 75 | 0.0% |
| Croatian | 268 | 0.1% |
| Crow | 5 | 0.0% |
| Cuban | 281 | 0.1% |
| Czech | 620 | 0.3% |
| Czechoslovakian | 110 | 0.1% |
| Danish | 1,708 | 0.7% |
| Delaware | 12 | 0.0% |
| Dominican | 153 | 0.1% |
| Dutch | 11,945 | 5.3% |
| Eastern European | 428 | 0.2% |
| Ecuadorian | 61 | 0.0% |
| Egyptian | 178 | 0.1% |
| English | 27,604 | 12.2% |
| Estonian | 42 | 0.0% |
| Ethiopian | 64 | 0.0% |
| European | 8,766 | 3.9% |
| Fijian | 11 | 0.0% |
| Filipino | 145 | 0.1% |
| Finnish | 1,063 | 0.5% |
| French | 5,961 | 2.6% |
| French American Indian | 129 | 0.1% |
| French Canadian | 1,588 | 0.7% |
| German | 35,318 | 15.6% |
| German Russian | 35 | 0.0% |
| Ghanaian | 54 | 0.0% |
| Greek | 502 | 0.2% |
| Guamanian / Chamorro | 404 | 0.2% |
| Guatemalan | 739 | 0.3% |
| Haitian | 15 | 0.0% |
| Honduran | 263 | 0.1% |
| Hungarian | 1,016 | 0.4% |
| Icelander | 664 | 0.3% |
| Indian (Asian) | 3,443 | 1.5% |
| Indonesian | 25 | 0.0% |
| Inupiat | 48 | 0.0% |
| Iranian | 339 | 0.2% |
| Irish | 21,633 | 9.6% |
| Iroquois | 100 | 0.0% |
| Israeli | 38 | 0.0% |
| Italian | 7,600 | 3.4% |
| Jamaican | 258 | 0.1% |
| Japanese | 222 | 0.1% |
| Jordanian | 23 | 0.0% |
| Kiowa | 3 | 0.0% |
| Korean | 2,858 | 1.3% |
| Laotian | 6 | 0.0% |
| Latvian | 120 | 0.1% |
| Lebanese | 328 | 0.1% |
| Lithuanian | 836 | 0.4% |
| Luxembourger | 16 | 0.0% |
| Macedonian | 40 | 0.0% |
| Malaysian | 123 | 0.1% |
| Mexican | 16,018 | 7.1% |
| Mexican American Indian | 288 | 0.1% |
| Mongolian | 92 | 0.0% |
| Moroccan | 30 | 0.0% |
| Native Hawaiian | 883 | 0.4% |
| Navajo | 93 | 0.0% |
| New Zealander | 52 | 0.0% |
| Nicaraguan | 9 | 0.0% |
| Northern European | 1,342 | 0.6% |
| Norwegian | 12,141 | 5.4% |
| Paiute | 11 | 0.0% |
| Pakistani | 428 | 0.2% |
| Palestinian | 40 | 0.0% |
| Panamanian | 89 | 0.0% |
| Pennsylvania German | 115 | 0.1% |
| Peruvian | 317 | 0.1% |
| Polish | 4,482 | 2.0% |
| Portuguese | 910 | 0.4% |
| Potawatomi | 60 | 0.0% |
| Puerto Rican | 905 | 0.4% |
| Puget Sound Salish | 939 | 0.4% |
| Romanian | 205 | 0.1% |
| Russian | 2,860 | 1.3% |
| Salvadoran | 582 | 0.3% |
| Samoan | 176 | 0.1% |
| Scandinavian | 2,075 | 0.9% |
| Scotch-Irish | 2,465 | 1.1% |
| Scottish | 7,396 | 3.3% |
| Seminole | 12 | 0.0% |
| Serbian | 169 | 0.1% |
| Shoshone | 11 | 0.0% |
| Sioux | 216 | 0.1% |
| Slavic | 172 | 0.1% |
| Slovak | 164 | 0.1% |
| Slovene | 57 | 0.0% |
| Somali | 17 | 0.0% |
| South African | 30 | 0.0% |
| South American | 903 | 0.4% |
| Spaniard | 983 | 0.4% |
| Spanish | 363 | 0.2% |
| Sri Lankan | 1,827 | 0.8% |
| Subsaharan African | 610 | 0.3% |
| Swedish | 7,106 | 3.1% |
| Swiss | 1,068 | 0.5% |
| Syrian | 48 | 0.0% |
| Thai | 2,704 | 1.2% |
| Tlingit-Haida | 246 | 0.1% |
| Tongan | 38 | 0.0% |
| Trinidadian and Tobagonian | 31 | 0.0% |
| Turkish | 39 | 0.0% |
| Ukrainian | 802 | 0.4% |
| Venezuelan | 91 | 0.0% |
| Welsh | 2,185 | 1.0% |
| West Indian | 8 | 0.0% |
| Yakama | 40 | 0.0% |
| Yaqui | 59 | 0.0% |
| Yugoslavian | 127 | 0.1% |
| Yuman | 33 | 0.0% |
| Yup'ik | 178 | 0.1% |
| Zimbabwean | 59 | 0.0% | View All 157 Rows |
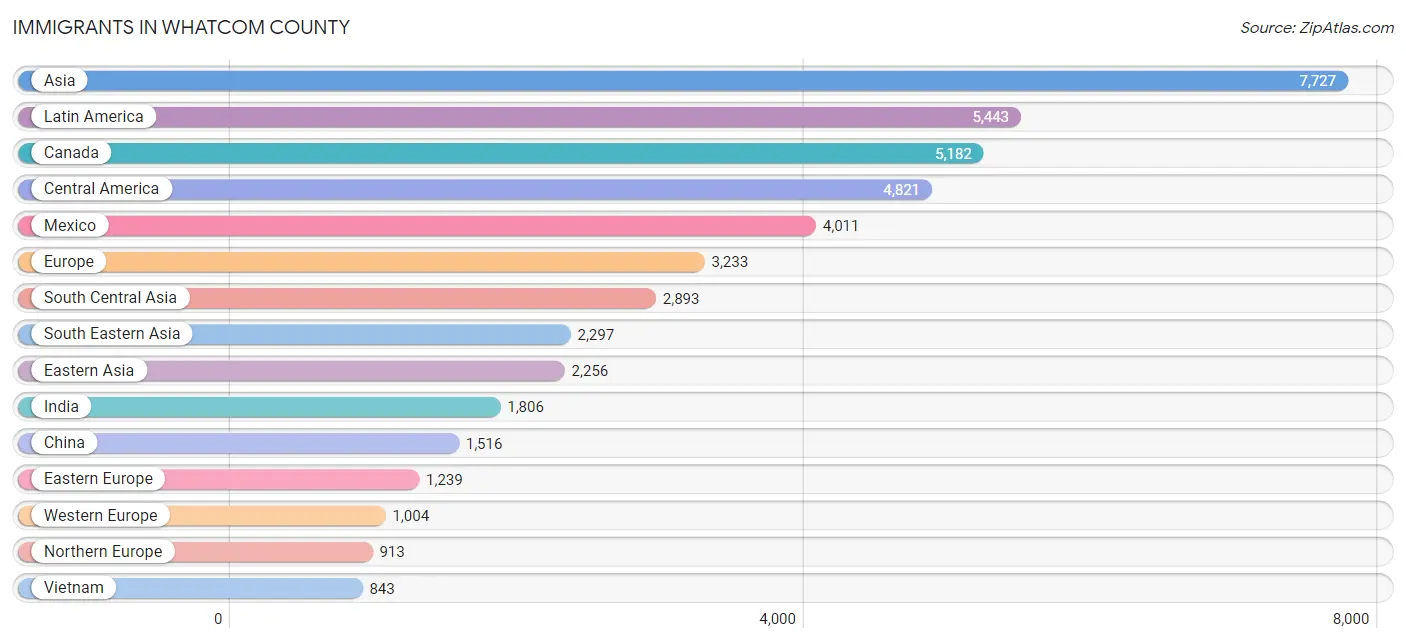
Immigrants in Whatcom County
The most numerous immigrant groups reported in Whatcom County came from Asia (7,727 | 3.4%), Latin America (5,443 | 2.4%), Canada (5,182 | 2.3%), Central America (4,821 | 2.1%), and Mexico (4,011 | 1.8%), together accounting for 12.0% of all Whatcom County residents.
| Immigration Origin | # Population | % Population |
| Afghanistan | 152 | 0.1% |
| Africa | 504 | 0.2% |
| Argentina | 77 | 0.0% |
| Asia | 7,727 | 3.4% |
| Australia | 58 | 0.0% |
| Austria | 14 | 0.0% |
| Belgium | 5 | 0.0% |
| Belize | 41 | 0.0% |
| Bolivia | 19 | 0.0% |
| Bosnia and Herzegovina | 16 | 0.0% |
| Brazil | 41 | 0.0% |
| Bulgaria | 93 | 0.0% |
| Cambodia | 92 | 0.0% |
| Canada | 5,182 | 2.3% |
| Caribbean | 98 | 0.0% |
| Central America | 4,821 | 2.1% |
| Chile | 10 | 0.0% |
| China | 1,516 | 0.7% |
| Colombia | 53 | 0.0% |
| Costa Rica | 92 | 0.0% |
| Croatia | 11 | 0.0% |
| Cuba | 21 | 0.0% |
| Czechoslovakia | 8 | 0.0% |
| Denmark | 46 | 0.0% |
| Eastern Africa | 164 | 0.1% |
| Eastern Asia | 2,256 | 1.0% |
| Eastern Europe | 1,239 | 0.5% |
| Ecuador | 17 | 0.0% |
| Egypt | 57 | 0.0% |
| El Salvador | 174 | 0.1% |
| England | 386 | 0.2% |
| Ethiopia | 65 | 0.0% |
| Europe | 3,233 | 1.4% |
| Fiji | 13 | 0.0% |
| France | 118 | 0.1% |
| Germany | 557 | 0.3% |
| Ghana | 49 | 0.0% |
| Greece | 10 | 0.0% |
| Guatemala | 288 | 0.1% |
| Honduras | 169 | 0.1% |
| Hong Kong | 110 | 0.1% |
| Hungary | 22 | 0.0% |
| India | 1,806 | 0.8% |
| Indonesia | 66 | 0.0% |
| Iran | 224 | 0.1% |
| Ireland | 51 | 0.0% |
| Israel | 46 | 0.0% |
| Italy | 27 | 0.0% |
| Jamaica | 62 | 0.0% |
| Japan | 363 | 0.2% |
| Kazakhstan | 265 | 0.1% |
| Kenya | 77 | 0.0% |
| Korea | 377 | 0.2% |
| Kuwait | 47 | 0.0% |
| Laos | 25 | 0.0% |
| Latin America | 5,443 | 2.4% |
| Latvia | 12 | 0.0% |
| Lebanon | 130 | 0.1% |
| Liberia | 38 | 0.0% |
| Lithuania | 93 | 0.0% |
| Malaysia | 180 | 0.1% |
| Mexico | 4,011 | 1.8% |
| Middle Africa | 6 | 0.0% |
| Nepal | 12 | 0.0% |
| Netherlands | 307 | 0.1% |
| Northern Africa | 107 | 0.1% |
| Northern Europe | 913 | 0.4% |
| Norway | 33 | 0.0% |
| Oceania | 280 | 0.1% |
| Pakistan | 179 | 0.1% |
| Panama | 46 | 0.0% |
| Peru | 179 | 0.1% |
| Philippines | 798 | 0.4% |
| Poland | 61 | 0.0% |
| Romania | 47 | 0.0% |
| Russia | 474 | 0.2% |
| Saudi Arabia | 10 | 0.0% |
| Scotland | 131 | 0.1% |
| Serbia | 61 | 0.0% |
| South Africa | 140 | 0.1% |
| South America | 524 | 0.2% |
| South Central Asia | 2,893 | 1.3% |
| South Eastern Asia | 2,297 | 1.0% |
| Southern Europe | 77 | 0.0% |
| Spain | 40 | 0.0% |
| Sri Lanka | 70 | 0.0% |
| Switzerland | 3 | 0.0% |
| Taiwan | 294 | 0.1% |
| Thailand | 241 | 0.1% |
| Trinidad and Tobago | 15 | 0.0% |
| Uganda | 10 | 0.0% |
| Ukraine | 256 | 0.1% |
| Uzbekistan | 99 | 0.0% |
| Venezuela | 72 | 0.0% |
| Vietnam | 843 | 0.4% |
| Western Africa | 87 | 0.0% |
| Western Asia | 240 | 0.1% |
| Western Europe | 1,004 | 0.4% |
| Zaire | 6 | 0.0% | View All 99 Rows |
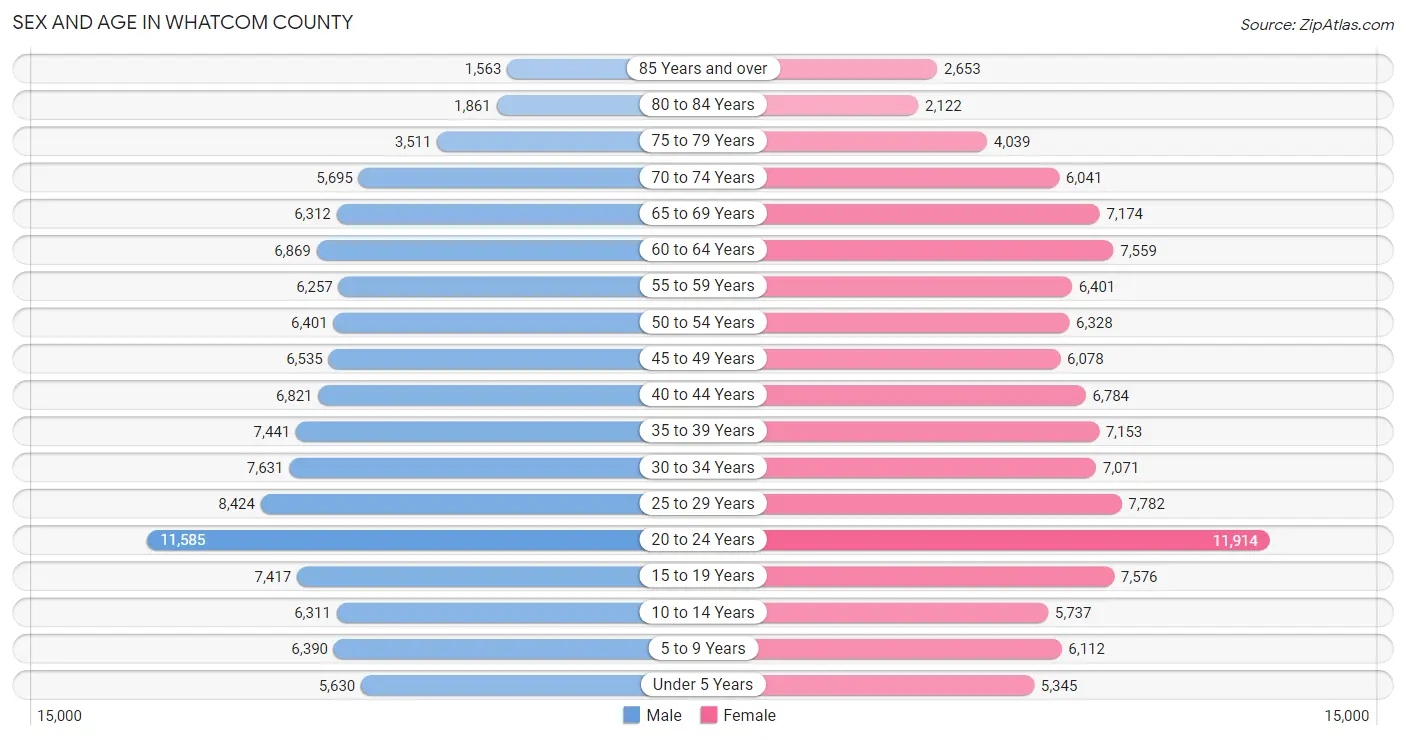
Sex and Age in Whatcom County
Sex and Age in Whatcom County
The most populous age groups in Whatcom County are 20 to 24 Years (11,585 | 10.3%) for men and 20 to 24 Years (11,914 | 10.5%) for women.
| Age Bracket | Male | Female |
| Under 5 Years | 5,630 (5.0%) | 5,345 (4.7%) |
| 5 to 9 Years | 6,390 (5.7%) | 6,112 (5.4%) |
| 10 to 14 Years | 6,311 (5.6%) | 5,737 (5.0%) |
| 15 to 19 Years | 7,417 (6.6%) | 7,576 (6.7%) |
| 20 to 24 Years | 11,585 (10.3%) | 11,914 (10.5%) |
| 25 to 29 Years | 8,424 (7.5%) | 7,782 (6.8%) |
| 30 to 34 Years | 7,631 (6.8%) | 7,071 (6.2%) |
| 35 to 39 Years | 7,441 (6.6%) | 7,153 (6.3%) |
| 40 to 44 Years | 6,821 (6.0%) | 6,784 (6.0%) |
| 45 to 49 Years | 6,535 (5.8%) | 6,078 (5.3%) |
| 50 to 54 Years | 6,401 (5.7%) | 6,328 (5.6%) |
| 55 to 59 Years | 6,257 (5.6%) | 6,401 (5.6%) |
| 60 to 64 Years | 6,869 (6.1%) | 7,559 (6.6%) |
| 65 to 69 Years | 6,312 (5.6%) | 7,174 (6.3%) |
| 70 to 74 Years | 5,695 (5.1%) | 6,041 (5.3%) |
| 75 to 79 Years | 3,511 (3.1%) | 4,039 (3.5%) |
| 80 to 84 Years | 1,861 (1.7%) | 2,122 (1.9%) |
| 85 Years and over | 1,563 (1.4%) | 2,653 (2.3%) |
| Total | 112,654 (100.0%) | 113,869 (100.0%) |
Families and Households in Whatcom County
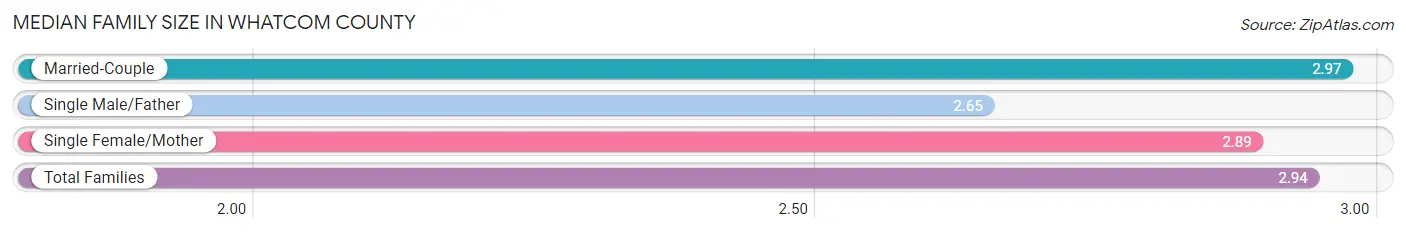
Median Family Size in Whatcom County
The median family size in Whatcom County is 2.94 persons per family, with married-couple families (43,780 | 80.1%) accounting for the largest median family size of 2.97 persons per family. On the other hand, single male/father families (3,479 | 6.4%) represent the smallest median family size with 2.65 persons per family.
| Family Type | # Families | Family Size |
| Married-Couple | 43,780 (80.1%) | 2.97 |
| Single Male/Father | 3,479 (6.4%) | 2.65 |
| Single Female/Mother | 7,381 (13.5%) | 2.89 |
| Total Families | 54,640 (100.0%) | 2.94 |
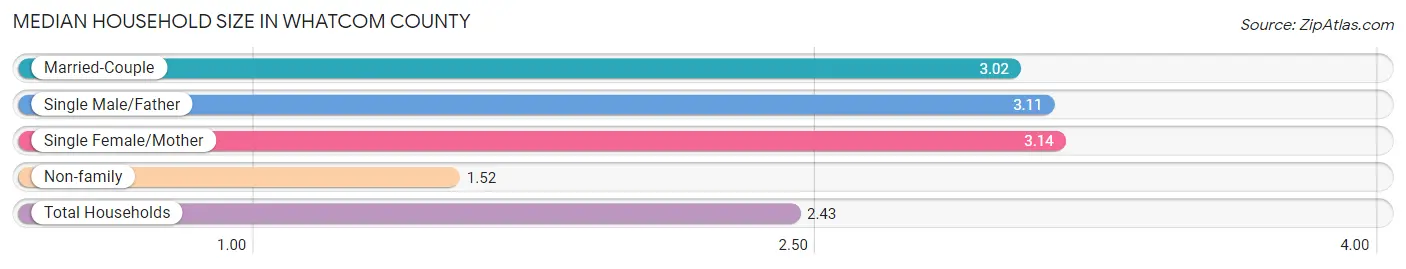
Median Household Size in Whatcom County
The median household size in Whatcom County is 2.43 persons per household, with single female/mother households (7,381 | 8.1%) accounting for the largest median household size of 3.14 persons per household. non-family households (36,531 | 40.1%) represent the smallest median household size with 1.52 persons per household.
| Household Type | # Households | Household Size |
| Married-Couple | 43,780 (48.0%) | 3.02 |
| Single Male/Father | 3,479 (3.8%) | 3.11 |
| Single Female/Mother | 7,381 (8.1%) | 3.14 |
| Non-family | 36,531 (40.1%) | 1.52 |
| Total Households | 91,171 (100.0%) | 2.43 |
Household Size by Marriage Status in Whatcom County
Out of a total of 91,171 households in Whatcom County, 54,640 (59.9%) are family households, while 36,531 (40.1%) are nonfamily households. The most numerous type of family households are 2-person households, comprising 26,292, and the most common type of nonfamily households are 1-person households, comprising 24,559.
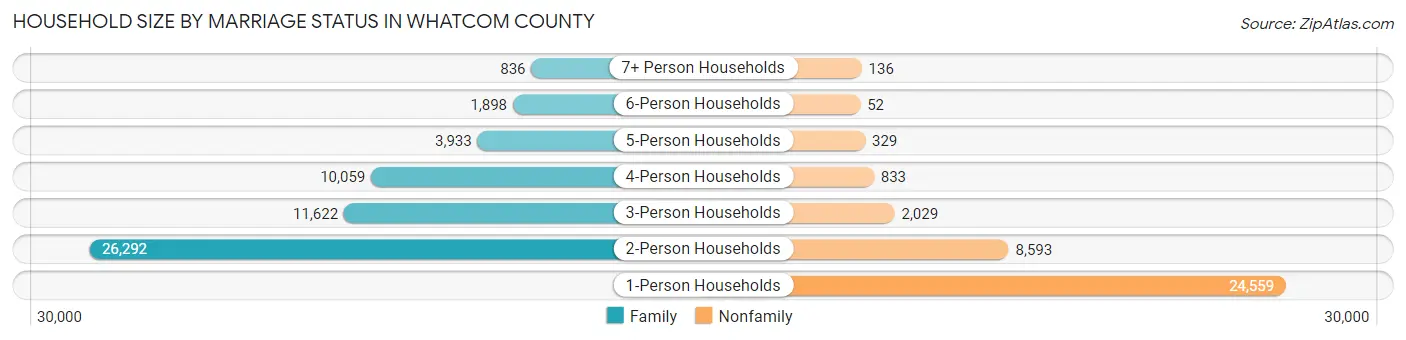
| Household Size | Family Households | Nonfamily Households |
| 1-Person Households | - | 24,559 (26.9%) |
| 2-Person Households | 26,292 (28.8%) | 8,593 (9.4%) |
| 3-Person Households | 11,622 (12.8%) | 2,029 (2.2%) |
| 4-Person Households | 10,059 (11.0%) | 833 (0.9%) |
| 5-Person Households | 3,933 (4.3%) | 329 (0.4%) |
| 6-Person Households | 1,898 (2.1%) | 52 (0.1%) |
| 7+ Person Households | 836 (0.9%) | 136 (0.2%) |
| Total | 54,640 (59.9%) | 36,531 (40.1%) |
Female Fertility in Whatcom County
Fertility by Age in Whatcom County
Average fertility rate in Whatcom County is 46.0 births per 1,000 women. Women in the age bracket of 20 to 34 years have the highest fertility rate with 71.0 births per 1,000 women. Women in the age bracket of 20 to 34 years acount for 74.2% of all women with births.
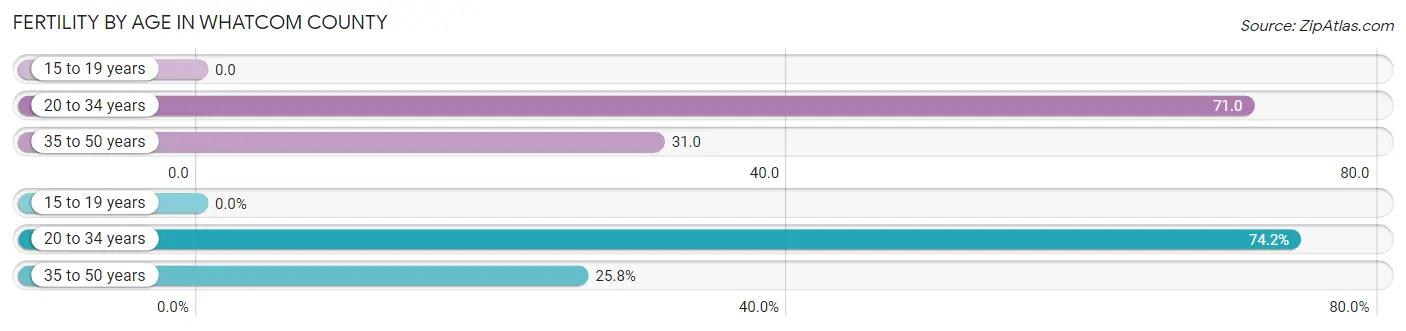
| Age Bracket | Women with Births | Births / 1,000 Women |
| 15 to 19 years | 0 (0.0%) | 0.0 |
| 20 to 34 years | 1,904 (74.2%) | 71.0 |
| 35 to 50 years | 663 (25.8%) | 31.0 |
| Total | 2,567 (100.0%) | 46.0 |
Fertility by Age by Marriage Status in Whatcom County
76.9% of women with births (2,567) in Whatcom County are married. The highest percentage of unmarried women with births falls into 20 to 34 years age bracket with 25.5% of them unmarried at the time of birth, while the lowest percentage of unmarried women with births belong to 35 to 50 years age bracket with 16.0% of them unmarried.
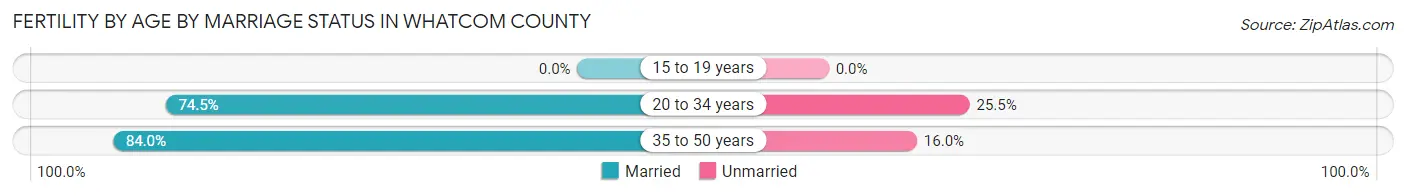
| Age Bracket | Married | Unmarried |
| 15 to 19 years | 0 (0.0%) | 0 (0.0%) |
| 20 to 34 years | 1,418 (74.5%) | 486 (25.5%) |
| 35 to 50 years | 557 (84.0%) | 106 (16.0%) |
| Total | 1,974 (76.9%) | 593 (23.1%) |
Fertility by Education in Whatcom County
Average fertility rate in Whatcom County is 46.0 births per 1,000 women. Women with the education attainment of bachelor's degree have the highest fertility rate of 70.0 births per 1,000 women, while women with the education attainment of less than high school have the lowest fertility at 5.0 births per 1,000 women. Women with the education attainment of college or associate's degree represent 43.4% of all women with births.
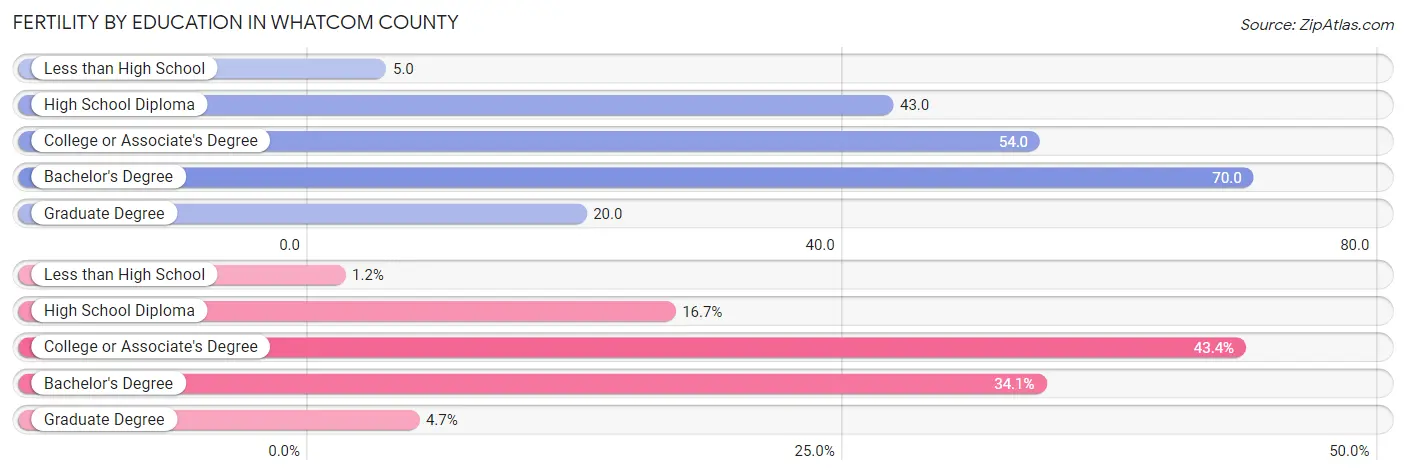
| Educational Attainment | Women with Births | Births / 1,000 Women |
| Less than High School | 31 (1.2%) | 5.0 |
| High School Diploma | 428 (16.7%) | 43.0 |
| College or Associate's Degree | 1,114 (43.4%) | 54.0 |
| Bachelor's Degree | 874 (34.1%) | 70.0 |
| Graduate Degree | 120 (4.7%) | 20.0 |
| Total | 2,567 (100.0%) | 46.0 |
Fertility by Education by Marriage Status in Whatcom County
23.1% of women with births in Whatcom County are unmarried. Women with the educational attainment of graduate degree are most likely to be married with 100.0% of them married at childbirth, while women with the educational attainment of less than high school are least likely to be married with 48.4% of them unmarried at childbirth.
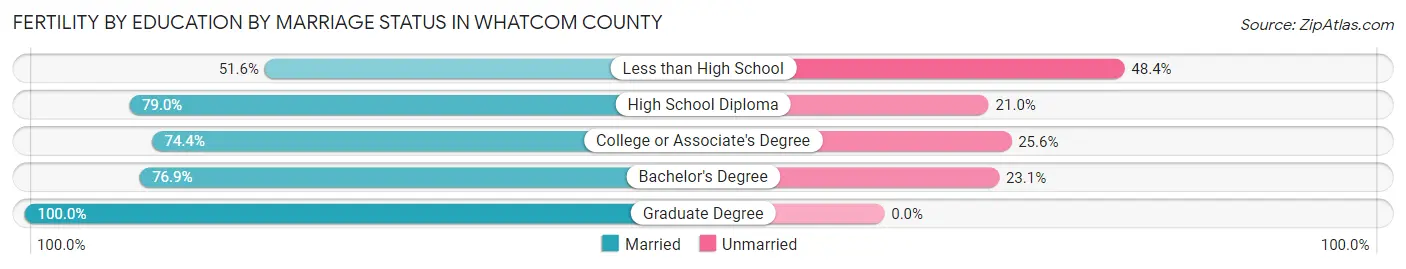
| Educational Attainment | Married | Unmarried |
| Less than High School | 16 (51.6%) | 15 (48.4%) |
| High School Diploma | 338 (79.0%) | 90 (21.0%) |
| College or Associate's Degree | 829 (74.4%) | 285 (25.6%) |
| Bachelor's Degree | 672 (76.9%) | 202 (23.1%) |
| Graduate Degree | 120 (100.0%) | 0 (0.0%) |
| Total | 1,974 (76.9%) | 593 (23.1%) |
Employment Characteristics in Whatcom County
Employment by Class of Employer in Whatcom County
Among the 109,391 employed individuals in Whatcom County, private company employees (67,929 | 62.1%), not-for-profit organizations (9,392 | 8.6%), and local government employees (8,375 | 7.7%) make up the most common classes of employment.
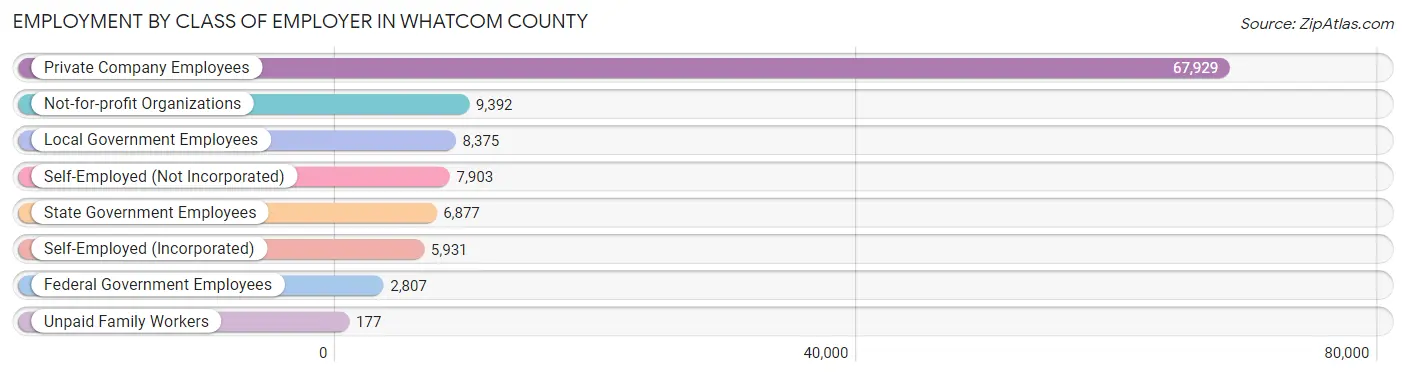
| Employer Class | # Employees | % Employees |
| Private Company Employees | 67,929 | 62.1% |
| Self-Employed (Incorporated) | 5,931 | 5.4% |
| Self-Employed (Not Incorporated) | 7,903 | 7.2% |
| Not-for-profit Organizations | 9,392 | 8.6% |
| Local Government Employees | 8,375 | 7.7% |
| State Government Employees | 6,877 | 6.3% |
| Federal Government Employees | 2,807 | 2.6% |
| Unpaid Family Workers | 177 | 0.2% |
| Total | 109,391 | 100.0% |
Employment Status by Age in Whatcom County
According to the labor force statistics for Whatcom County, out of the total population over 16 years of age (188,257), 62.4% or 117,472 individuals are in the labor force, with 4.9% or 5,756 of them unemployed. The age group with the highest labor force participation rate is 35 to 44 years, with 85.6% or 24,138 individuals in the labor force. Within the labor force, the 16 to 19 years age range has the highest percentage of unemployed individuals, with 19.8% or 1,094 of them being unemployed.
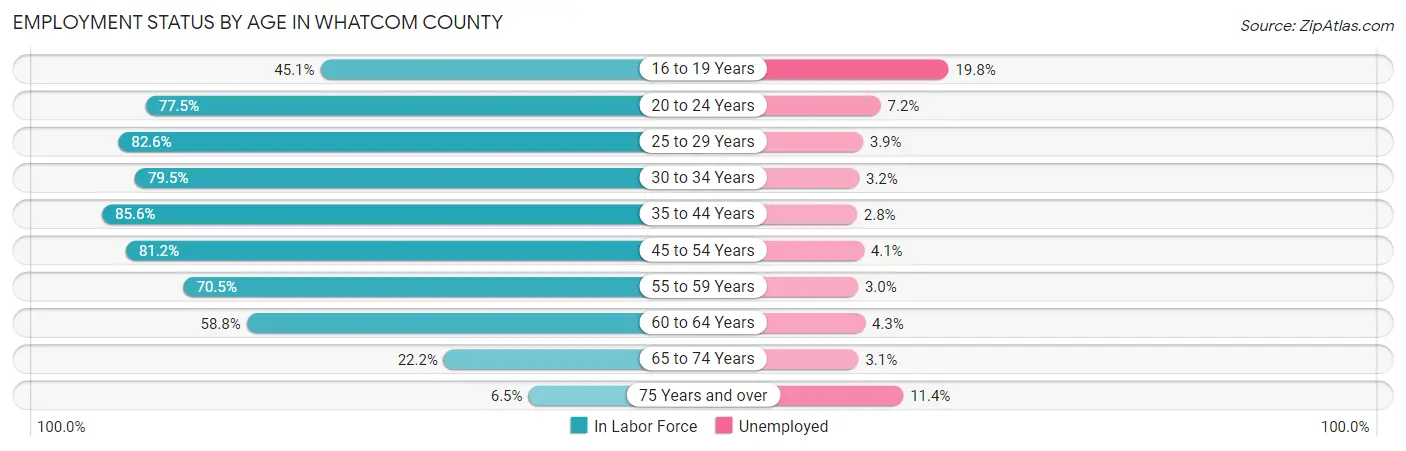
| Age Bracket | In Labor Force | Unemployed |
| 16 to 19 Years | 5,526 (45.1%) | 1,094 (19.8%) |
| 20 to 24 Years | 18,212 (77.5%) | 1,311 (7.2%) |
| 25 to 29 Years | 13,386 (82.6%) | 522 (3.9%) |
| 30 to 34 Years | 11,688 (79.5%) | 374 (3.2%) |
| 35 to 44 Years | 24,138 (85.6%) | 676 (2.8%) |
| 45 to 54 Years | 20,578 (81.2%) | 844 (4.1%) |
| 55 to 59 Years | 8,924 (70.5%) | 268 (3.0%) |
| 60 to 64 Years | 8,484 (58.8%) | 365 (4.3%) |
| 65 to 74 Years | 5,599 (22.2%) | 174 (3.1%) |
| 75 Years and over | 1,024 (6.5%) | 117 (11.4%) |
| Total | 117,472 (62.4%) | 5,756 (4.9%) |
Employment Status by Educational Attainment in Whatcom County
According to labor force statistics for Whatcom County, 78.2% of individuals (87,220) out of the total population between 25 and 64 years of age (111,535) are in the labor force, with 3.5% or 3,053 of them being unemployed. The group with the highest labor force participation rate are those with the educational attainment of bachelor's degree or higher, with 85.5% or 34,815 individuals in the labor force. Within the labor force, individuals with high school diploma education have the highest percentage of unemployment, with 4.4% or 781 of them being unemployed.
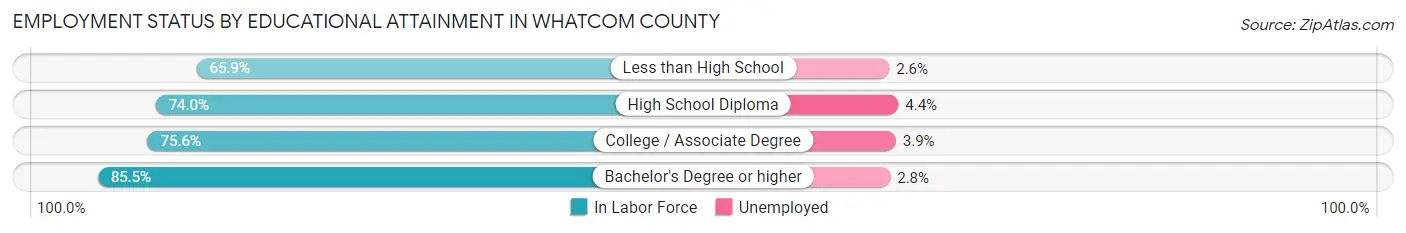
| Educational Attainment | In Labor Force | Unemployed |
| Less than High School | 5,286 (65.9%) | 209 (2.6%) |
| High School Diploma | 17,742 (74.0%) | 1,055 (4.4%) |
| College / Associate Degree | 29,348 (75.6%) | 1,514 (3.9%) |
| Bachelor's Degree or higher | 34,815 (85.5%) | 1,140 (2.8%) |
| Total | 87,220 (78.2%) | 3,904 (3.5%) |
Employment Occupations by Sex in Whatcom County
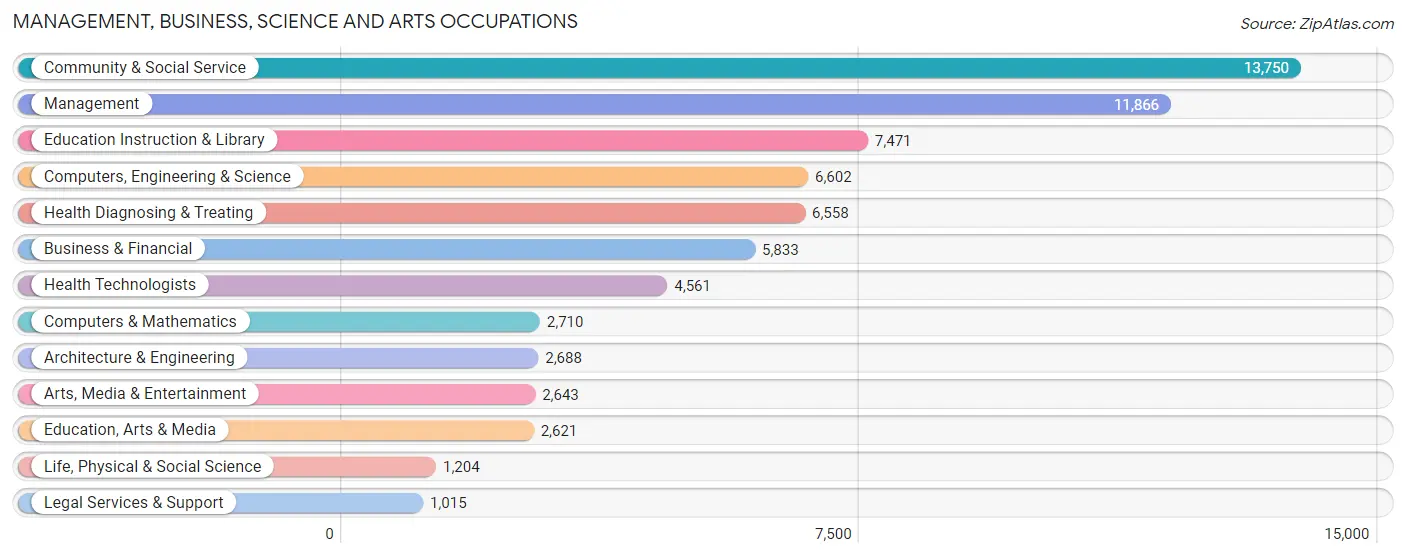
Management, Business, Science and Arts Occupations
The most common Management, Business, Science and Arts occupations in Whatcom County are Community & Social Service (13,750 | 12.3%), Management (11,866 | 10.6%), Education Instruction & Library (7,471 | 6.7%), Computers, Engineering & Science (6,602 | 5.9%), and Health Diagnosing & Treating (6,558 | 5.9%).
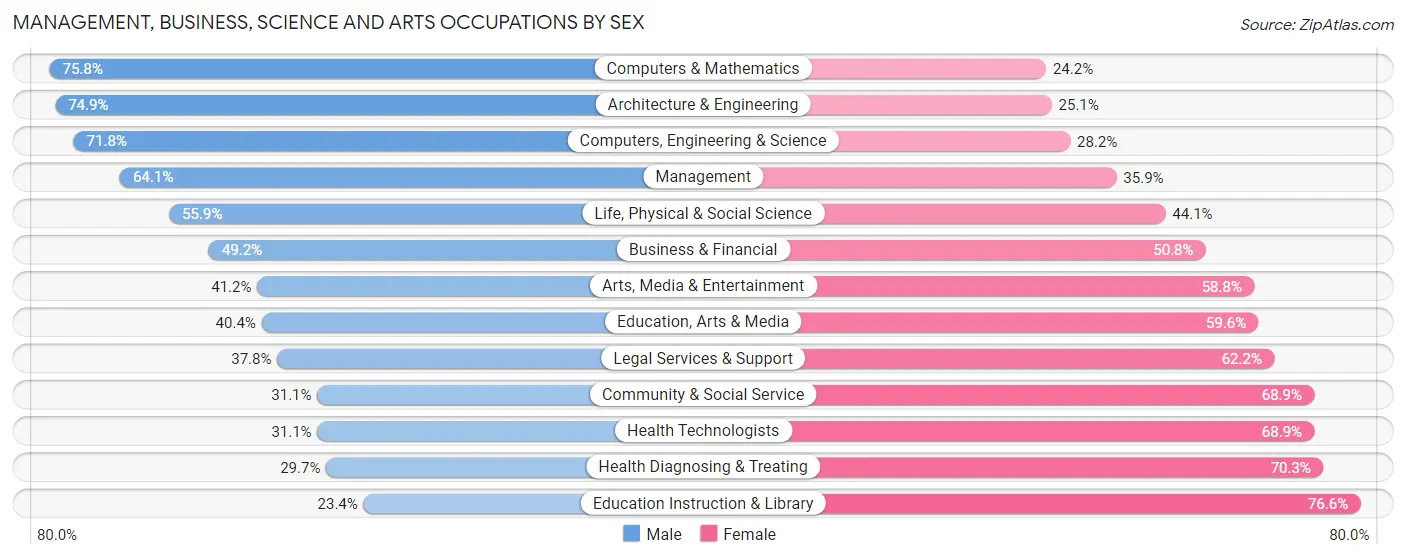
Management, Business, Science and Arts Occupations by Sex
Within the Management, Business, Science and Arts occupations in Whatcom County, the most male-oriented occupations are Computers & Mathematics (75.8%), Architecture & Engineering (74.9%), and Computers, Engineering & Science (71.8%), while the most female-oriented occupations are Education Instruction & Library (76.6%), Health Diagnosing & Treating (70.3%), and Health Technologists (68.9%).
| Occupation | Male | Female |
| Management | 7,604 (64.1%) | 4,262 (35.9%) |
| Business & Financial | 2,872 (49.2%) | 2,961 (50.8%) |
| Computers, Engineering & Science | 4,741 (71.8%) | 1,861 (28.2%) |
| Computers & Mathematics | 2,055 (75.8%) | 655 (24.2%) |
| Architecture & Engineering | 2,013 (74.9%) | 675 (25.1%) |
| Life, Physical & Social Science | 673 (55.9%) | 531 (44.1%) |
| Community & Social Service | 4,282 (31.1%) | 9,468 (68.9%) |
| Education, Arts & Media | 1,060 (40.4%) | 1,561 (59.6%) |
| Legal Services & Support | 384 (37.8%) | 631 (62.2%) |
| Education Instruction & Library | 1,750 (23.4%) | 5,721 (76.6%) |
| Arts, Media & Entertainment | 1,088 (41.2%) | 1,555 (58.8%) |
| Health Diagnosing & Treating | 1,945 (29.7%) | 4,613 (70.3%) |
| Health Technologists | 1,420 (31.1%) | 3,141 (68.9%) |
| Total (Category) | 21,444 (48.1%) | 23,165 (51.9%) |
| Total (Overall) | 59,170 (53.1%) | 52,287 (46.9%) |
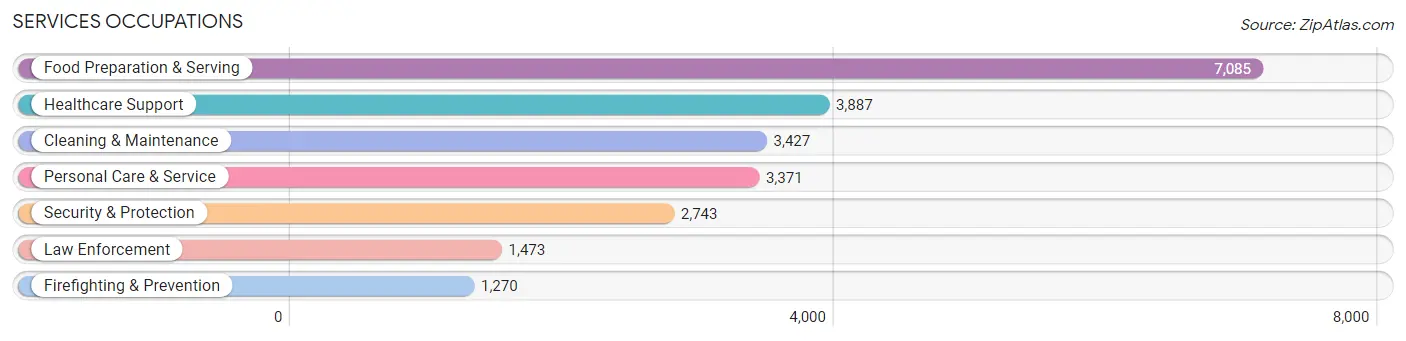
Services Occupations
The most common Services occupations in Whatcom County are Food Preparation & Serving (7,085 | 6.4%), Healthcare Support (3,887 | 3.5%), Cleaning & Maintenance (3,427 | 3.1%), Personal Care & Service (3,371 | 3.0%), and Security & Protection (2,743 | 2.5%).
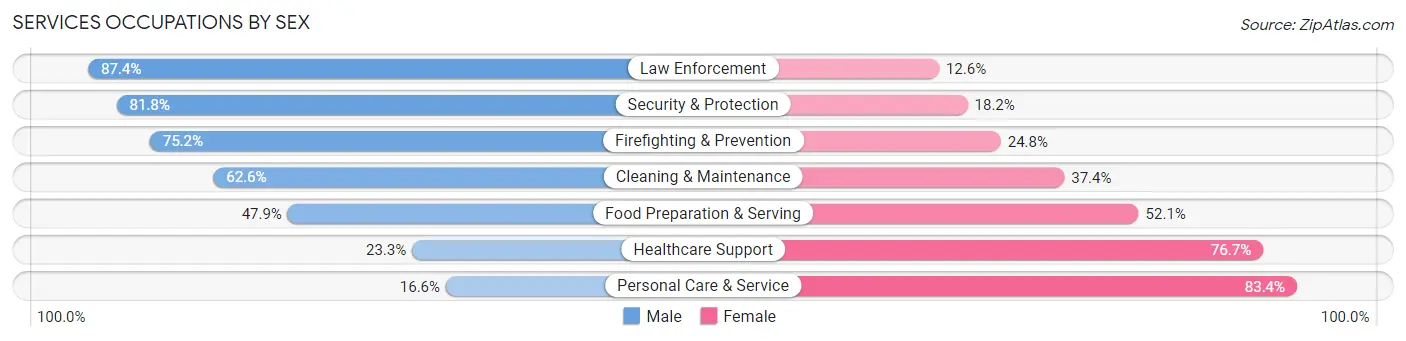
Services Occupations by Sex
Within the Services occupations in Whatcom County, the most male-oriented occupations are Law Enforcement (87.4%), Security & Protection (81.8%), and Firefighting & Prevention (75.2%), while the most female-oriented occupations are Personal Care & Service (83.4%), Healthcare Support (76.7%), and Food Preparation & Serving (52.1%).
| Occupation | Male | Female |
| Healthcare Support | 905 (23.3%) | 2,982 (76.7%) |
| Security & Protection | 2,243 (81.8%) | 500 (18.2%) |
| Firefighting & Prevention | 955 (75.2%) | 315 (24.8%) |
| Law Enforcement | 1,288 (87.4%) | 185 (12.6%) |
| Food Preparation & Serving | 3,394 (47.9%) | 3,691 (52.1%) |
| Cleaning & Maintenance | 2,146 (62.6%) | 1,281 (37.4%) |
| Personal Care & Service | 559 (16.6%) | 2,812 (83.4%) |
| Total (Category) | 9,247 (45.1%) | 11,266 (54.9%) |
| Total (Overall) | 59,170 (53.1%) | 52,287 (46.9%) |
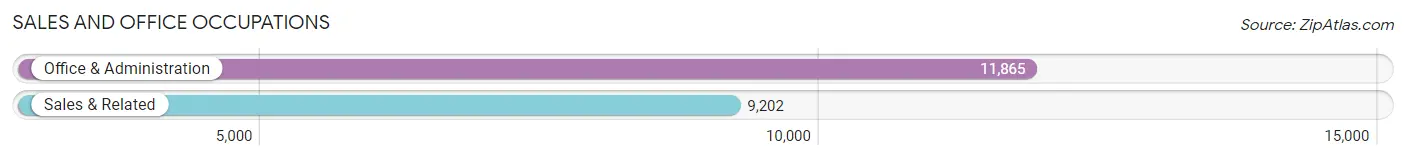
Sales and Office Occupations
The most common Sales and Office occupations in Whatcom County are Office & Administration (11,865 | 10.6%), and Sales & Related (9,202 | 8.3%).
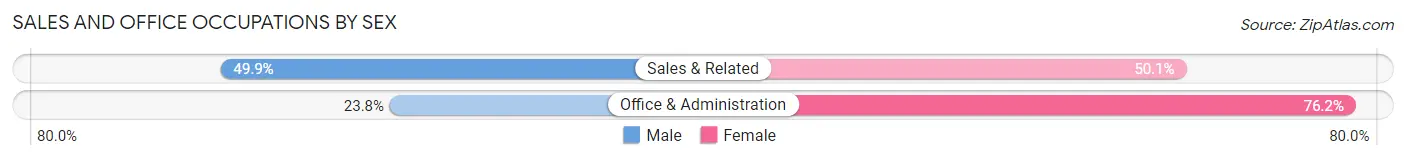
Sales and Office Occupations by Sex
| Occupation | Male | Female |
| Sales & Related | 4,589 (49.9%) | 4,613 (50.1%) |
| Office & Administration | 2,825 (23.8%) | 9,040 (76.2%) |
| Total (Category) | 7,414 (35.2%) | 13,653 (64.8%) |
| Total (Overall) | 59,170 (53.1%) | 52,287 (46.9%) |
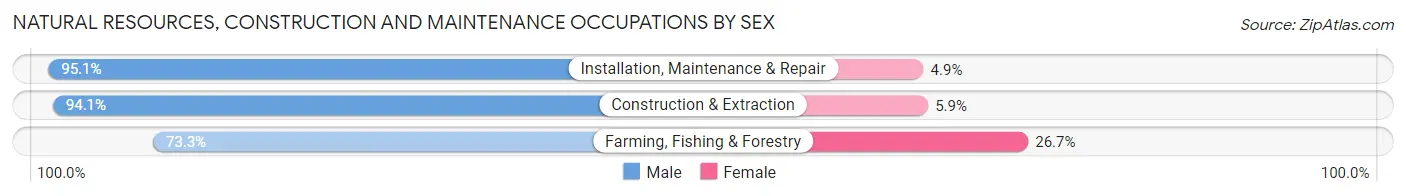
Natural Resources, Construction and Maintenance Occupations
The most common Natural Resources, Construction and Maintenance occupations in Whatcom County are Construction & Extraction (5,853 | 5.2%), Installation, Maintenance & Repair (3,220 | 2.9%), and Farming, Fishing & Forestry (1,737 | 1.6%).

Natural Resources, Construction and Maintenance Occupations by Sex
| Occupation | Male | Female |
| Farming, Fishing & Forestry | 1,273 (73.3%) | 464 (26.7%) |
| Construction & Extraction | 5,508 (94.1%) | 345 (5.9%) |
| Installation, Maintenance & Repair | 3,061 (95.1%) | 159 (4.9%) |
| Total (Category) | 9,842 (91.0%) | 968 (8.9%) |
| Total (Overall) | 59,170 (53.1%) | 52,287 (46.9%) |
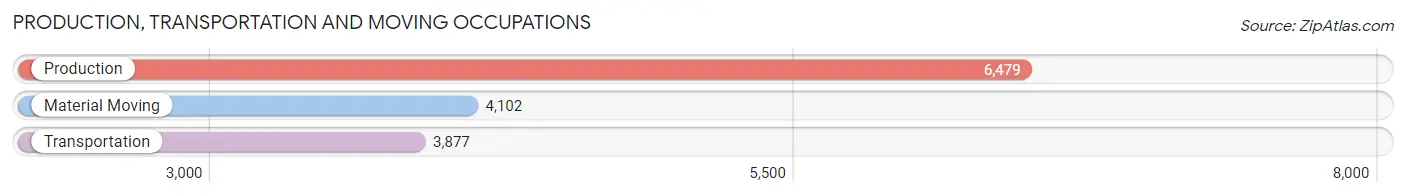
Production, Transportation and Moving Occupations
The most common Production, Transportation and Moving occupations in Whatcom County are Production (6,479 | 5.8%), Material Moving (4,102 | 3.7%), and Transportation (3,877 | 3.5%).
Production, Transportation and Moving Occupations by Sex
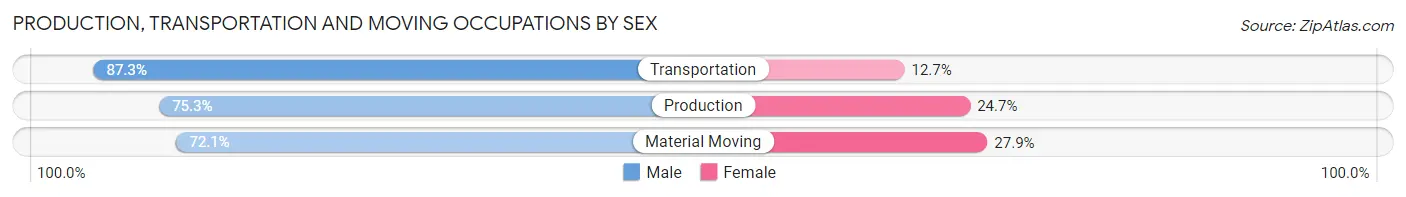
| Occupation | Male | Female |
| Production | 4,878 (75.3%) | 1,601 (24.7%) |
| Transportation | 3,386 (87.3%) | 491 (12.7%) |
| Material Moving | 2,959 (72.1%) | 1,143 (27.9%) |
| Total (Category) | 11,223 (77.6%) | 3,235 (22.4%) |
| Total (Overall) | 59,170 (53.1%) | 52,287 (46.9%) |
Employment Industries by Sex in Whatcom County
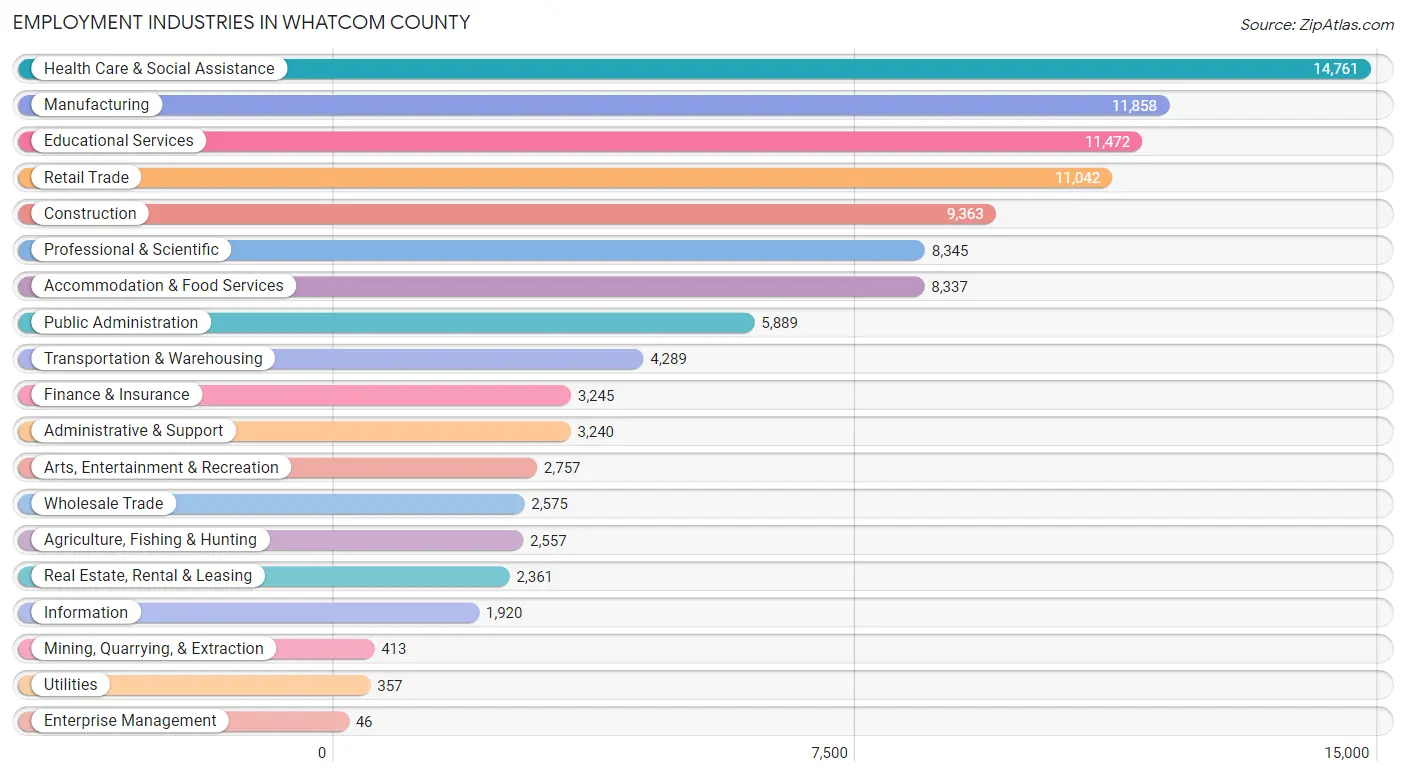
Employment Industries in Whatcom County
The major employment industries in Whatcom County include Health Care & Social Assistance (14,761 | 13.2%), Manufacturing (11,858 | 10.6%), Educational Services (11,472 | 10.3%), Retail Trade (11,042 | 9.9%), and Construction (9,363 | 8.4%).
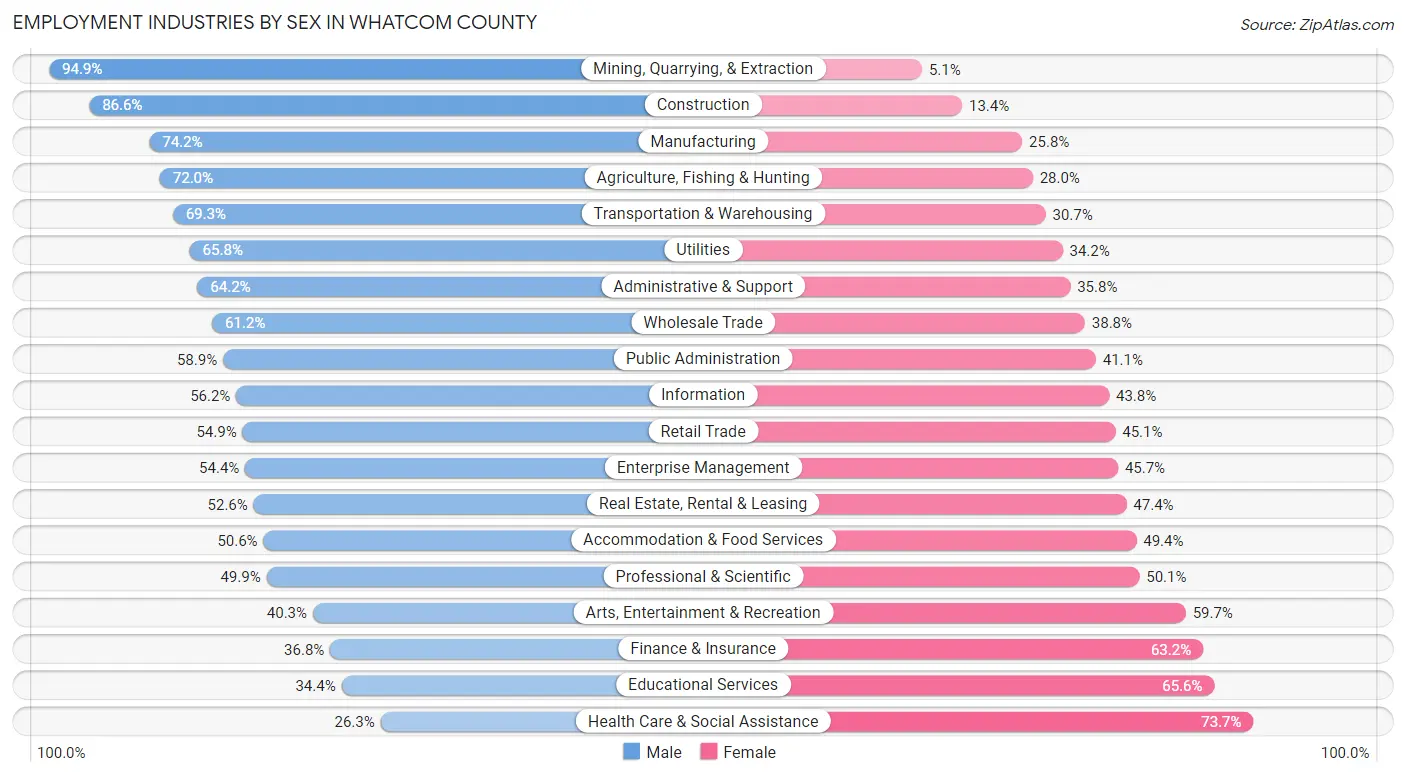
Employment Industries by Sex in Whatcom County
The Whatcom County industries that see more men than women are Mining, Quarrying, & Extraction (94.9%), Construction (86.6%), and Manufacturing (74.2%), whereas the industries that tend to have a higher number of women are Health Care & Social Assistance (73.7%), Educational Services (65.6%), and Finance & Insurance (63.2%).
| Industry | Male | Female |
| Agriculture, Fishing & Hunting | 1,841 (72.0%) | 716 (28.0%) |
| Mining, Quarrying, & Extraction | 392 (94.9%) | 21 (5.1%) |
| Construction | 8,110 (86.6%) | 1,253 (13.4%) |
| Manufacturing | 8,796 (74.2%) | 3,062 (25.8%) |
| Wholesale Trade | 1,576 (61.2%) | 999 (38.8%) |
| Retail Trade | 6,062 (54.9%) | 4,980 (45.1%) |
| Transportation & Warehousing | 2,974 (69.3%) | 1,315 (30.7%) |
| Utilities | 235 (65.8%) | 122 (34.2%) |
| Information | 1,079 (56.2%) | 841 (43.8%) |
| Finance & Insurance | 1,193 (36.8%) | 2,052 (63.2%) |
| Real Estate, Rental & Leasing | 1,242 (52.6%) | 1,119 (47.4%) |
| Professional & Scientific | 4,167 (49.9%) | 4,178 (50.1%) |
| Enterprise Management | 25 (54.3%) | 21 (45.7%) |
| Administrative & Support | 2,081 (64.2%) | 1,159 (35.8%) |
| Educational Services | 3,947 (34.4%) | 7,525 (65.6%) |
| Health Care & Social Assistance | 3,886 (26.3%) | 10,875 (73.7%) |
| Arts, Entertainment & Recreation | 1,112 (40.3%) | 1,645 (59.7%) |
| Accommodation & Food Services | 4,215 (50.6%) | 4,122 (49.4%) |
| Public Administration | 3,471 (58.9%) | 2,418 (41.1%) |
| Total | 59,170 (53.1%) | 52,287 (46.9%) |
Education in Whatcom County
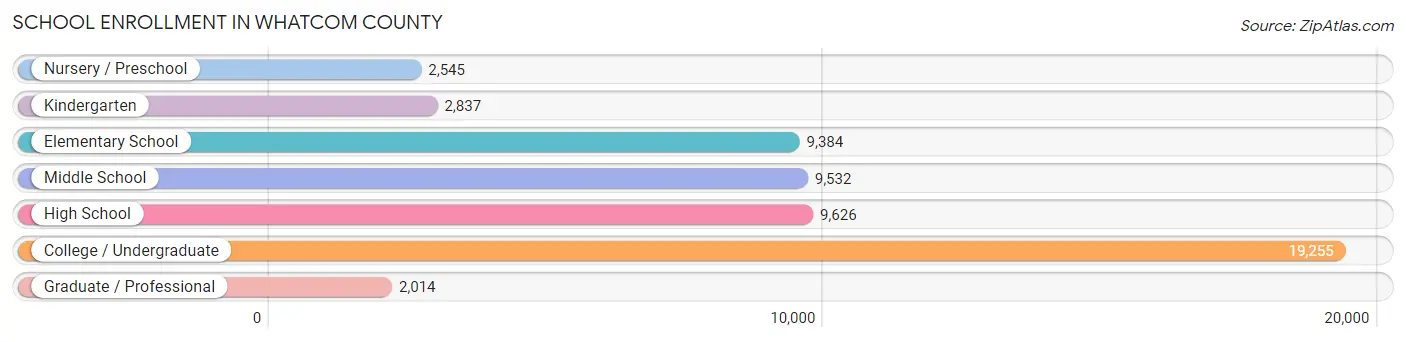
School Enrollment in Whatcom County
The most common levels of schooling among the 55,193 students in Whatcom County are college / undergraduate (19,255 | 34.9%), high school (9,626 | 17.4%), and middle school (9,532 | 17.3%).
| School Level | # Students | % Students |
| Nursery / Preschool | 2,545 | 4.6% |
| Kindergarten | 2,837 | 5.1% |
| Elementary School | 9,384 | 17.0% |
| Middle School | 9,532 | 17.3% |
| High School | 9,626 | 17.4% |
| College / Undergraduate | 19,255 | 34.9% |
| Graduate / Professional | 2,014 | 3.6% |
| Total | 55,193 | 100.0% |
School Enrollment by Age by Funding Source in Whatcom County
Out of a total of 55,193 students who are enrolled in schools in Whatcom County, 6,513 (11.8%) attend a private institution, while the remaining 48,680 (88.2%) are enrolled in public schools. The age group of 3 to 4 year olds has the highest likelihood of being enrolled in private schools, with 901 (50.9% in the age bracket) enrolled. Conversely, the age group of 18 to 19 year olds has the lowest likelihood of being enrolled in a private school, with 5,504 (95.2% in the age bracket) attending a public institution.
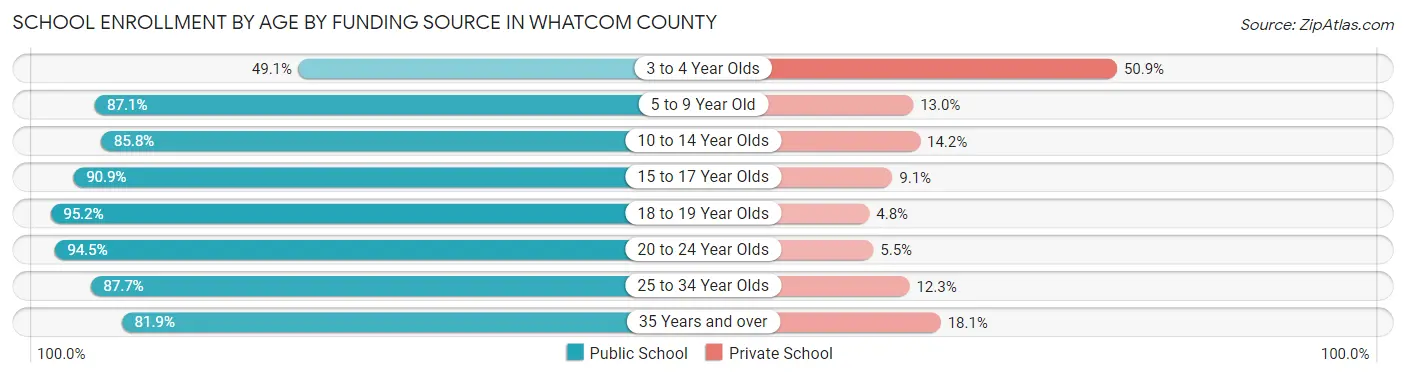
| Age Bracket | Public School | Private School |
| 3 to 4 Year Olds | 869 (49.1%) | 901 (50.9%) |
| 5 to 9 Year Old | 10,256 (87.1%) | 1,526 (13.0%) |
| 10 to 14 Year Olds | 10,038 (85.8%) | 1,664 (14.2%) |
| 15 to 17 Year Olds | 6,568 (90.9%) | 654 (9.1%) |
| 18 to 19 Year Olds | 5,504 (95.2%) | 277 (4.8%) |
| 20 to 24 Year Olds | 10,411 (94.5%) | 610 (5.5%) |
| 25 to 34 Year Olds | 3,126 (87.7%) | 437 (12.3%) |
| 35 Years and over | 1,927 (81.9%) | 425 (18.1%) |
| Total | 48,680 (88.2%) | 6,513 (11.8%) |
Educational Attainment by Field of Study in Whatcom County
Business (7,599 | 12.2%), education (7,089 | 11.4%), social sciences (6,443 | 10.3%), bio, nature & agricultural (5,770 | 9.2%), and science & technology (4,822 | 7.7%) are the most common fields of study among 62,452 individuals in Whatcom County who have obtained a bachelor's degree or higher.
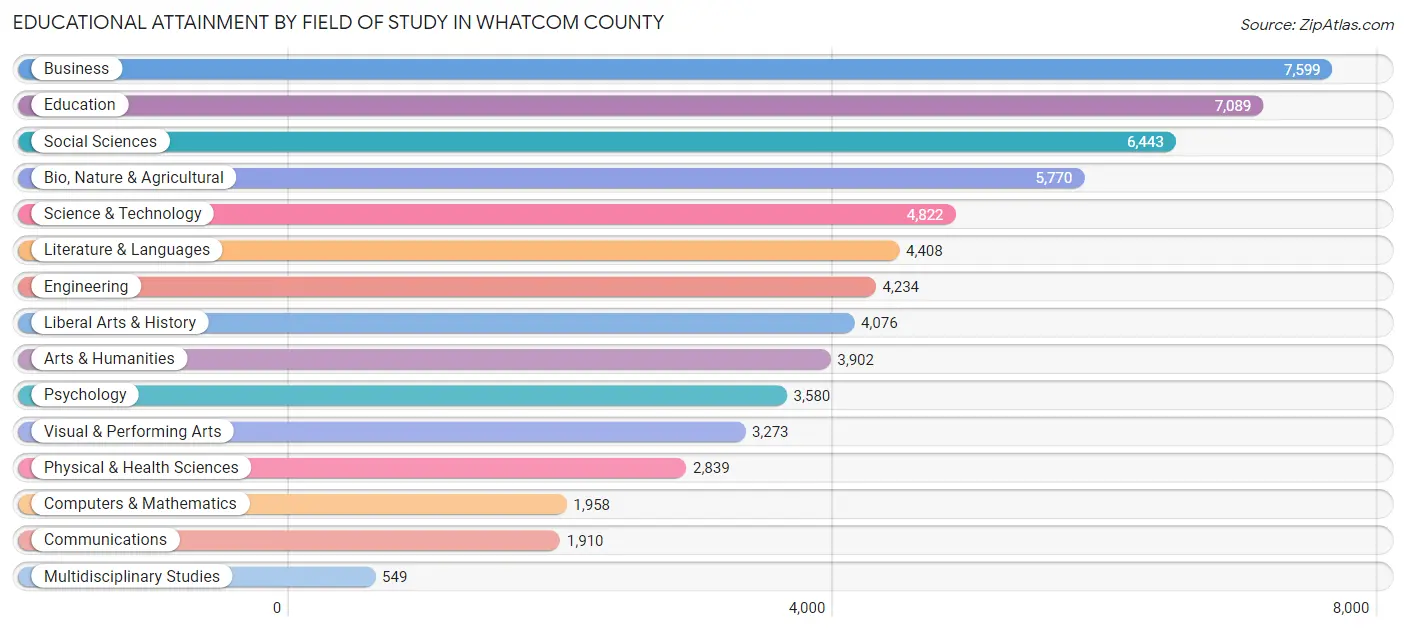
| Field of Study | # Graduates | % Graduates |
| Computers & Mathematics | 1,958 | 3.1% |
| Bio, Nature & Agricultural | 5,770 | 9.2% |
| Physical & Health Sciences | 2,839 | 4.5% |
| Psychology | 3,580 | 5.7% |
| Social Sciences | 6,443 | 10.3% |
| Engineering | 4,234 | 6.8% |
| Multidisciplinary Studies | 549 | 0.9% |
| Science & Technology | 4,822 | 7.7% |
| Business | 7,599 | 12.2% |
| Education | 7,089 | 11.4% |
| Literature & Languages | 4,408 | 7.1% |
| Liberal Arts & History | 4,076 | 6.5% |
| Visual & Performing Arts | 3,273 | 5.2% |
| Communications | 1,910 | 3.1% |
| Arts & Humanities | 3,902 | 6.2% |
| Total | 62,452 | 100.0% |
Transportation & Commute in Whatcom County
Vehicle Availability by Sex in Whatcom County
The most prevalent vehicle ownership categories in Whatcom County are males with 2 vehicles (22,426, accounting for 38.7%) and females with 2 vehicles (19,021, making up 44.4%).
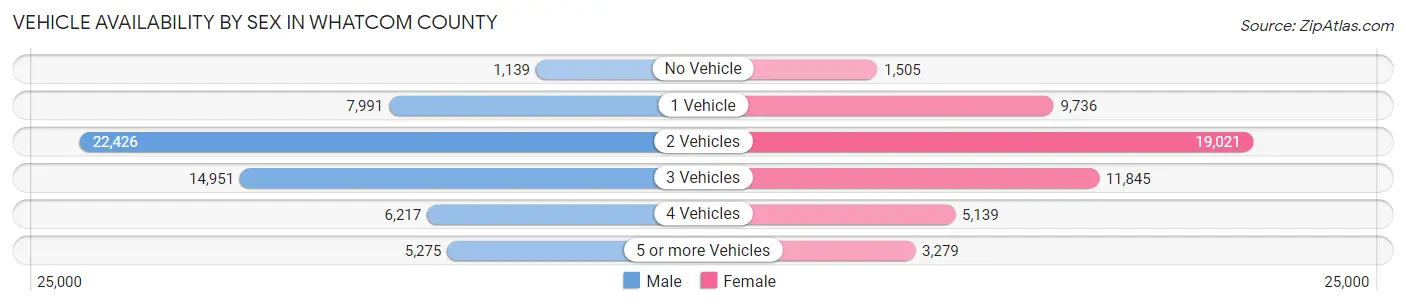
| Vehicles Available | Male | Female |
| No Vehicle | 1,139 (2.0%) | 1,505 (3.0%) |
| 1 Vehicle | 7,991 (13.8%) | 9,736 (19.3%) |
| 2 Vehicles | 22,426 (38.7%) | 19,021 (37.7%) |
| 3 Vehicles | 14,951 (25.8%) | 11,845 (23.4%) |
| 4 Vehicles | 6,217 (10.7%) | 5,139 (10.2%) |
| 5 or more Vehicles | 5,275 (9.1%) | 3,279 (6.5%) |
| Total | 57,999 (100.0%) | 50,525 (100.0%) |
Commute Time in Whatcom County
The most frequently occuring commute durations in Whatcom County are 15 to 19 minutes (18,511 commuters, 19.1%), 10 to 14 minutes (18,083 commuters, 18.6%), and 20 to 24 minutes (13,921 commuters, 14.3%).
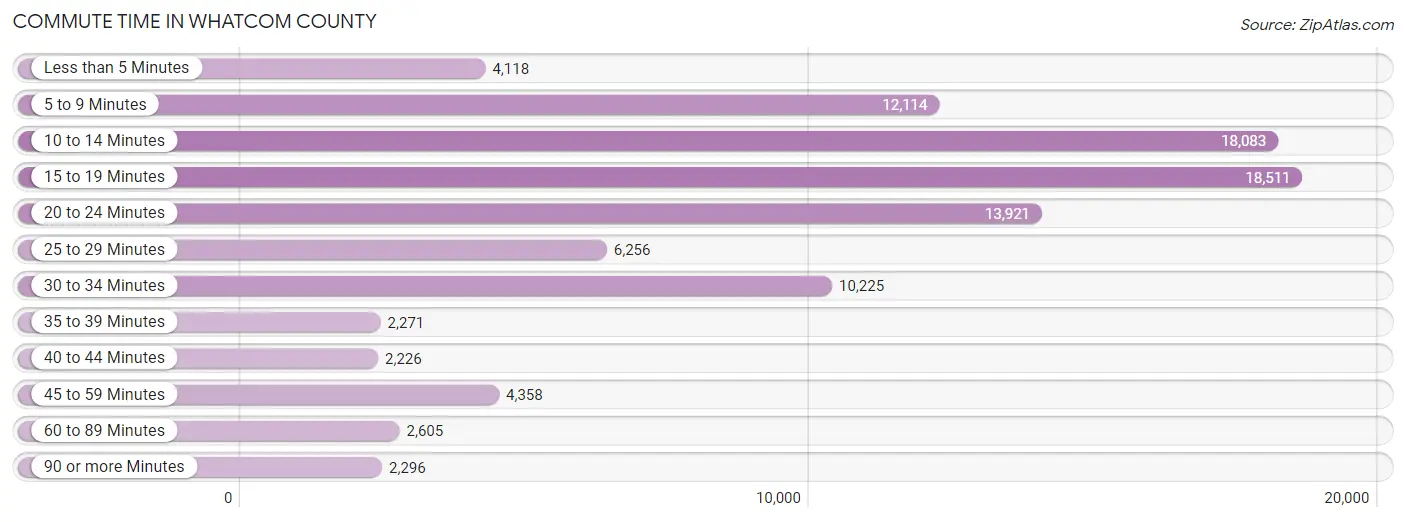
| Commute Time | # Commuters | % Commuters |
| Less than 5 Minutes | 4,118 | 4.3% |
| 5 to 9 Minutes | 12,114 | 12.5% |
| 10 to 14 Minutes | 18,083 | 18.6% |
| 15 to 19 Minutes | 18,511 | 19.1% |
| 20 to 24 Minutes | 13,921 | 14.3% |
| 25 to 29 Minutes | 6,256 | 6.5% |
| 30 to 34 Minutes | 10,225 | 10.5% |
| 35 to 39 Minutes | 2,271 | 2.3% |
| 40 to 44 Minutes | 2,226 | 2.3% |
| 45 to 59 Minutes | 4,358 | 4.5% |
| 60 to 89 Minutes | 2,605 | 2.7% |
| 90 or more Minutes | 2,296 | 2.4% |
Commute Time by Sex in Whatcom County
The most common commute times in Whatcom County are 10 to 14 minutes (9,685 commuters, 18.4%) for males and 15 to 19 minutes (8,995 commuters, 20.2%) for females.
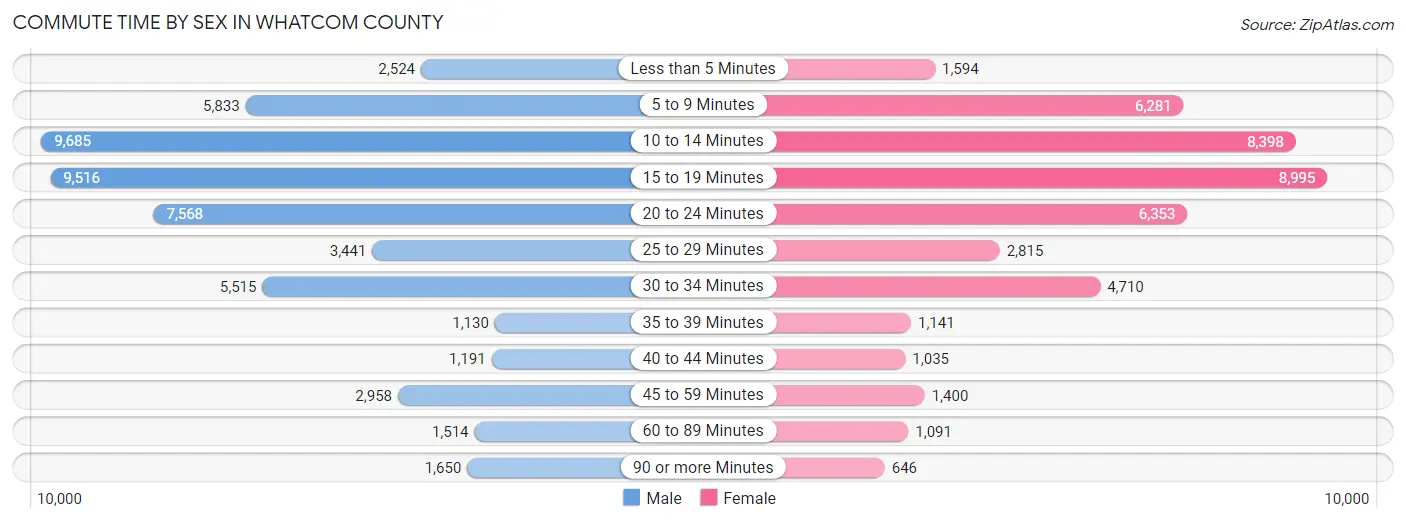
| Commute Time | Male | Female |
| Less than 5 Minutes | 2,524 (4.8%) | 1,594 (3.6%) |
| 5 to 9 Minutes | 5,833 (11.1%) | 6,281 (14.1%) |
| 10 to 14 Minutes | 9,685 (18.4%) | 8,398 (18.9%) |
| 15 to 19 Minutes | 9,516 (18.1%) | 8,995 (20.2%) |
| 20 to 24 Minutes | 7,568 (14.4%) | 6,353 (14.3%) |
| 25 to 29 Minutes | 3,441 (6.6%) | 2,815 (6.3%) |
| 30 to 34 Minutes | 5,515 (10.5%) | 4,710 (10.6%) |
| 35 to 39 Minutes | 1,130 (2.1%) | 1,141 (2.6%) |
| 40 to 44 Minutes | 1,191 (2.3%) | 1,035 (2.3%) |
| 45 to 59 Minutes | 2,958 (5.6%) | 1,400 (3.2%) |
| 60 to 89 Minutes | 1,514 (2.9%) | 1,091 (2.5%) |
| 90 or more Minutes | 1,650 (3.1%) | 646 (1.5%) |
Time of Departure to Work by Sex in Whatcom County
The most frequent times of departure to work in Whatcom County are 7:30 AM to 7:59 AM (8,118, 15.5%) for males and 7:30 AM to 7:59 AM (7,457, 16.8%) for females.
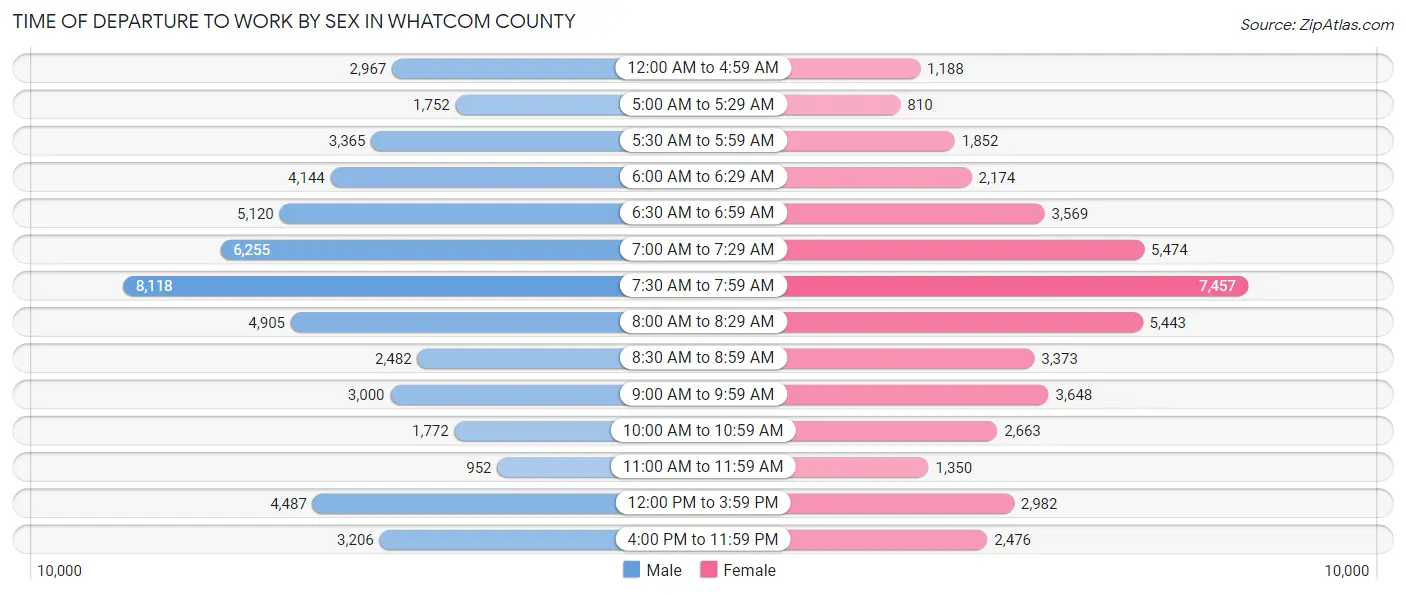
| Time of Departure | Male | Female |
| 12:00 AM to 4:59 AM | 2,967 (5.7%) | 1,188 (2.7%) |
| 5:00 AM to 5:29 AM | 1,752 (3.3%) | 810 (1.8%) |
| 5:30 AM to 5:59 AM | 3,365 (6.4%) | 1,852 (4.2%) |
| 6:00 AM to 6:29 AM | 4,144 (7.9%) | 2,174 (4.9%) |
| 6:30 AM to 6:59 AM | 5,120 (9.8%) | 3,569 (8.0%) |
| 7:00 AM to 7:29 AM | 6,255 (11.9%) | 5,474 (12.3%) |
| 7:30 AM to 7:59 AM | 8,118 (15.5%) | 7,457 (16.8%) |
| 8:00 AM to 8:29 AM | 4,905 (9.3%) | 5,443 (12.2%) |
| 8:30 AM to 8:59 AM | 2,482 (4.7%) | 3,373 (7.6%) |
| 9:00 AM to 9:59 AM | 3,000 (5.7%) | 3,648 (8.2%) |
| 10:00 AM to 10:59 AM | 1,772 (3.4%) | 2,663 (6.0%) |
| 11:00 AM to 11:59 AM | 952 (1.8%) | 1,350 (3.0%) |
| 12:00 PM to 3:59 PM | 4,487 (8.5%) | 2,982 (6.7%) |
| 4:00 PM to 11:59 PM | 3,206 (6.1%) | 2,476 (5.6%) |
| Total | 52,525 (100.0%) | 44,459 (100.0%) |
Housing Occupancy in Whatcom County
Occupancy by Ownership in Whatcom County
Of the total 91,171 dwellings in Whatcom County, owner-occupied units account for 57,442 (63.0%), while renter-occupied units make up 33,729 (37.0%).
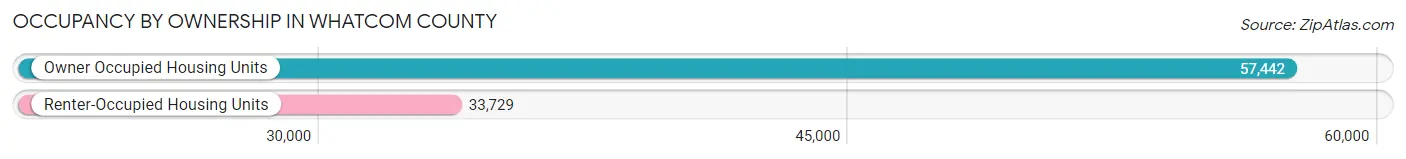
| Occupancy | # Housing Units | % Housing Units |
| Owner Occupied Housing Units | 57,442 | 63.0% |
| Renter-Occupied Housing Units | 33,729 | 37.0% |
| Total Occupied Housing Units | 91,171 | 100.0% |
Occupancy by Household Size in Whatcom County
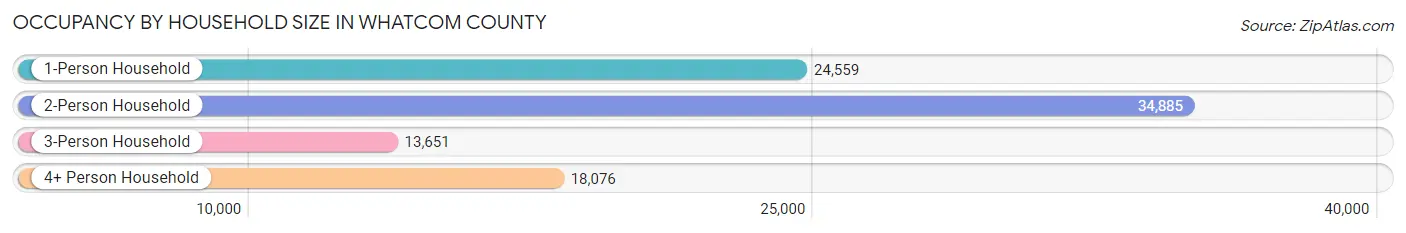
| Household Size | # Housing Units | % Housing Units |
| 1-Person Household | 24,559 | 26.9% |
| 2-Person Household | 34,885 | 38.3% |
| 3-Person Household | 13,651 | 15.0% |
| 4+ Person Household | 18,076 | 19.8% |
| Total Housing Units | 91,171 | 100.0% |
Occupancy by Ownership by Household Size in Whatcom County
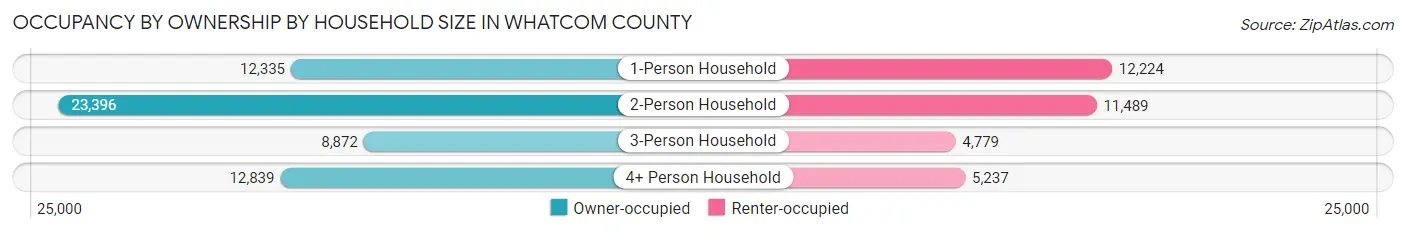
| Household Size | Owner-occupied | Renter-occupied |
| 1-Person Household | 12,335 (50.2%) | 12,224 (49.8%) |
| 2-Person Household | 23,396 (67.1%) | 11,489 (32.9%) |
| 3-Person Household | 8,872 (65.0%) | 4,779 (35.0%) |
| 4+ Person Household | 12,839 (71.0%) | 5,237 (29.0%) |
| Total Housing Units | 57,442 (63.0%) | 33,729 (37.0%) |
Occupancy by Educational Attainment in Whatcom County
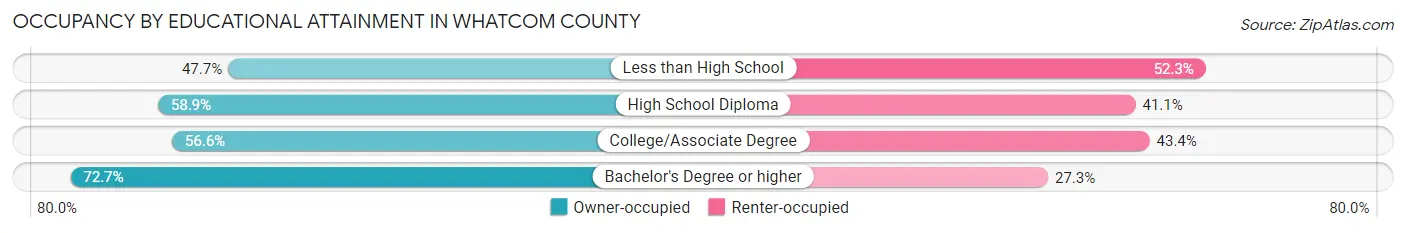
| Household Size | Owner-occupied | Renter-occupied |
| Less than High School | 2,120 (47.7%) | 2,321 (52.3%) |
| High School Diploma | 10,134 (58.9%) | 7,083 (41.1%) |
| College/Associate Degree | 18,888 (56.6%) | 14,467 (43.4%) |
| Bachelor's Degree or higher | 26,300 (72.7%) | 9,858 (27.3%) |
Occupancy by Age of Householder in Whatcom County
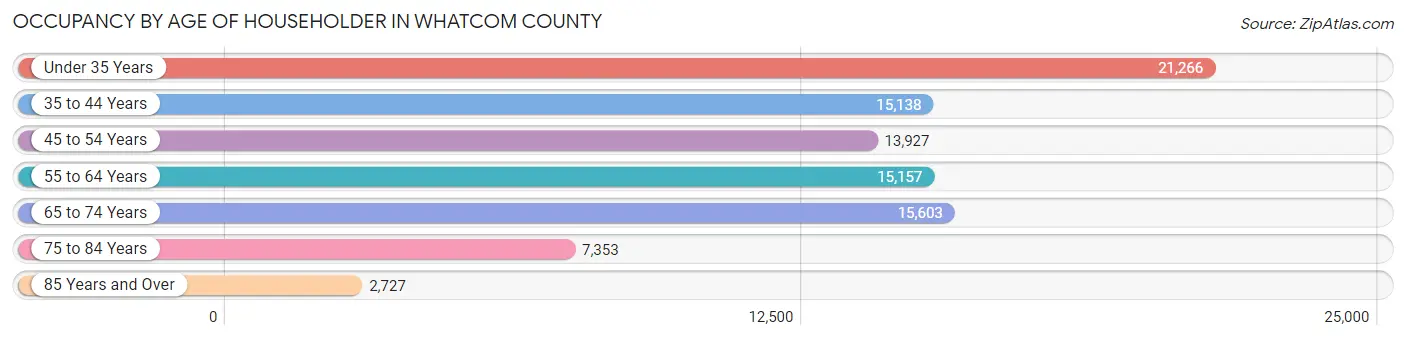
| Age Bracket | # Households | % Households |
| Under 35 Years | 21,266 | 23.3% |
| 35 to 44 Years | 15,138 | 16.6% |
| 45 to 54 Years | 13,927 | 15.3% |
| 55 to 64 Years | 15,157 | 16.6% |
| 65 to 74 Years | 15,603 | 17.1% |
| 75 to 84 Years | 7,353 | 8.1% |
| 85 Years and Over | 2,727 | 3.0% |
| Total | 91,171 | 100.0% |
Housing Finances in Whatcom County
Median Income by Occupancy in Whatcom County
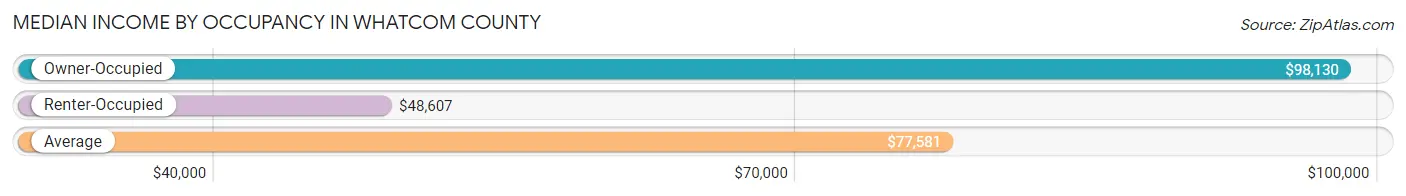
| Occupancy Type | # Households | Median Income |
| Owner-Occupied | 57,442 (63.0%) | $98,130 |
| Renter-Occupied | 33,729 (37.0%) | $48,607 |
| Average | 91,171 (100.0%) | $77,581 |
Occupancy by Householder Income Bracket in Whatcom County
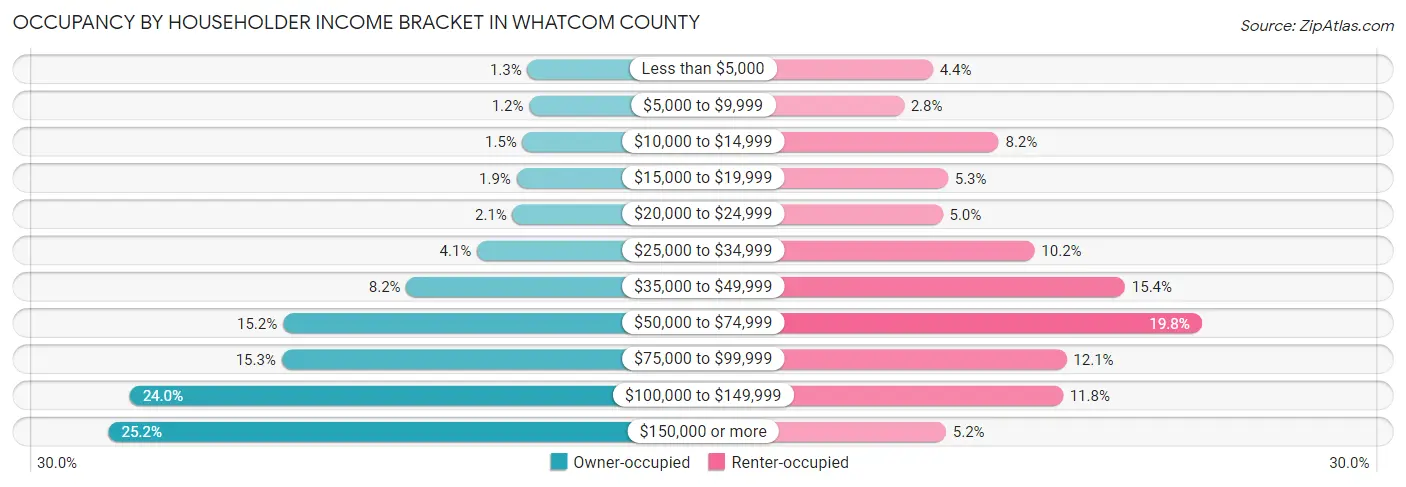
| Income Bracket | Owner-occupied | Renter-occupied |
| Less than $5,000 | 726 (1.3%) | 1,486 (4.4%) |
| $5,000 to $9,999 | 668 (1.2%) | 929 (2.8%) |
| $10,000 to $14,999 | 885 (1.5%) | 2,754 (8.2%) |
| $15,000 to $19,999 | 1,079 (1.9%) | 1,778 (5.3%) |
| $20,000 to $24,999 | 1,212 (2.1%) | 1,676 (5.0%) |
| $25,000 to $34,999 | 2,378 (4.1%) | 3,446 (10.2%) |
| $35,000 to $49,999 | 4,696 (8.2%) | 5,191 (15.4%) |
| $50,000 to $74,999 | 8,750 (15.2%) | 6,668 (19.8%) |
| $75,000 to $99,999 | 8,796 (15.3%) | 4,065 (12.0%) |
| $100,000 to $149,999 | 13,779 (24.0%) | 3,994 (11.8%) |
| $150,000 or more | 14,473 (25.2%) | 1,742 (5.2%) |
| Total | 57,442 (100.0%) | 33,729 (100.0%) |
Monthly Housing Cost Tiers in Whatcom County
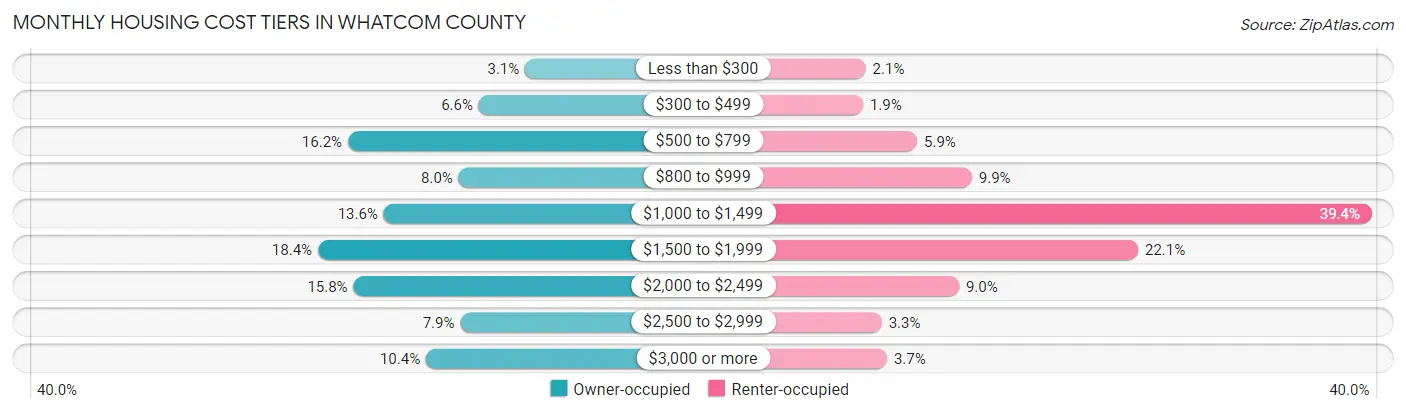
| Monthly Cost | Owner-occupied | Renter-occupied |
| Less than $300 | 1,805 (3.1%) | 702 (2.1%) |
| $300 to $499 | 3,765 (6.6%) | 633 (1.9%) |
| $500 to $799 | 9,298 (16.2%) | 1,980 (5.9%) |
| $800 to $999 | 4,613 (8.0%) | 3,339 (9.9%) |
| $1,000 to $1,499 | 7,783 (13.6%) | 13,273 (39.4%) |
| $1,500 to $1,999 | 10,570 (18.4%) | 7,468 (22.1%) |
| $2,000 to $2,499 | 9,067 (15.8%) | 3,019 (8.9%) |
| $2,500 to $2,999 | 4,544 (7.9%) | 1,098 (3.3%) |
| $3,000 or more | 5,997 (10.4%) | 1,230 (3.6%) |
| Total | 57,442 (100.0%) | 33,729 (100.0%) |
Physical Housing Characteristics in Whatcom County
Housing Structures in Whatcom County
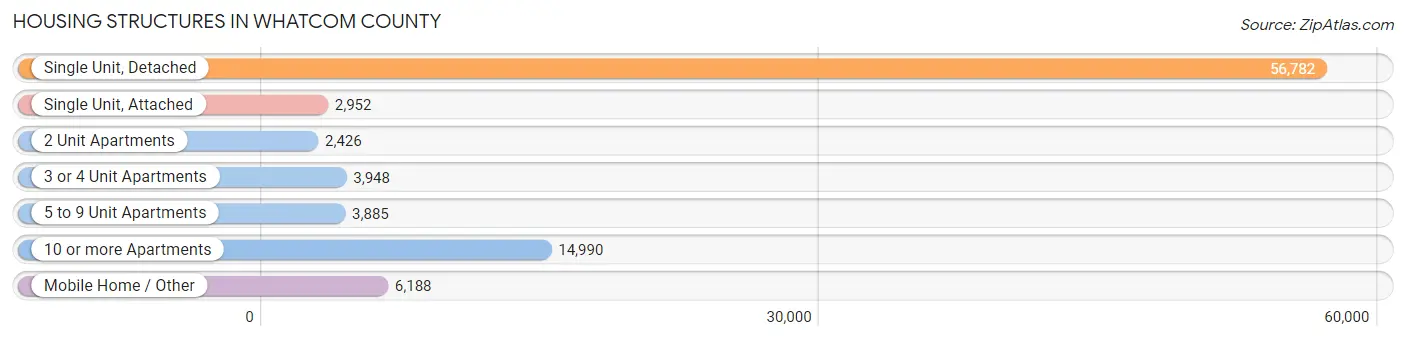
| Structure Type | # Housing Units | % Housing Units |
| Single Unit, Detached | 56,782 | 62.3% |
| Single Unit, Attached | 2,952 | 3.2% |
| 2 Unit Apartments | 2,426 | 2.7% |
| 3 or 4 Unit Apartments | 3,948 | 4.3% |
| 5 to 9 Unit Apartments | 3,885 | 4.3% |
| 10 or more Apartments | 14,990 | 16.4% |
| Mobile Home / Other | 6,188 | 6.8% |
| Total | 91,171 | 100.0% |
Housing Structures by Occupancy in Whatcom County
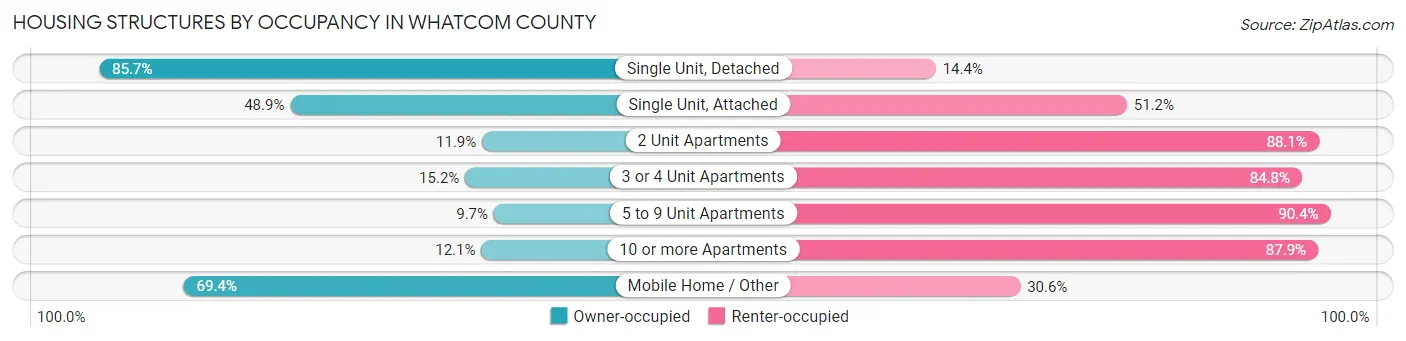
| Structure Type | Owner-occupied | Renter-occupied |
| Single Unit, Detached | 48,635 (85.7%) | 8,147 (14.3%) |
| Single Unit, Attached | 1,442 (48.8%) | 1,510 (51.1%) |
| 2 Unit Apartments | 289 (11.9%) | 2,137 (88.1%) |
| 3 or 4 Unit Apartments | 599 (15.2%) | 3,349 (84.8%) |
| 5 to 9 Unit Apartments | 375 (9.7%) | 3,510 (90.3%) |
| 10 or more Apartments | 1,809 (12.1%) | 13,181 (87.9%) |
| Mobile Home / Other | 4,293 (69.4%) | 1,895 (30.6%) |
| Total | 57,442 (63.0%) | 33,729 (37.0%) |
Housing Structures by Number of Rooms in Whatcom County
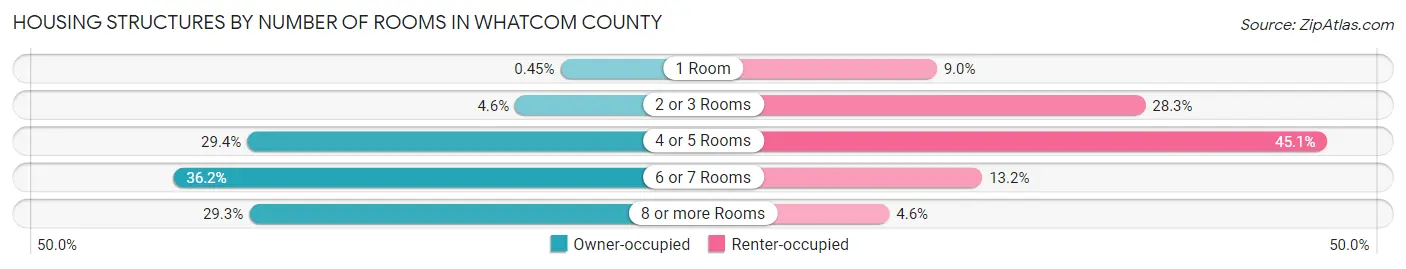
| Number of Rooms | Owner-occupied | Renter-occupied |
| 1 Room | 259 (0.4%) | 3,018 (8.9%) |
| 2 or 3 Rooms | 2,666 (4.6%) | 9,530 (28.2%) |
| 4 or 5 Rooms | 16,898 (29.4%) | 15,200 (45.1%) |
| 6 or 7 Rooms | 20,817 (36.2%) | 4,438 (13.2%) |
| 8 or more Rooms | 16,802 (29.2%) | 1,543 (4.6%) |
| Total | 57,442 (100.0%) | 33,729 (100.0%) |
Housing Structure by Heating Type in Whatcom County
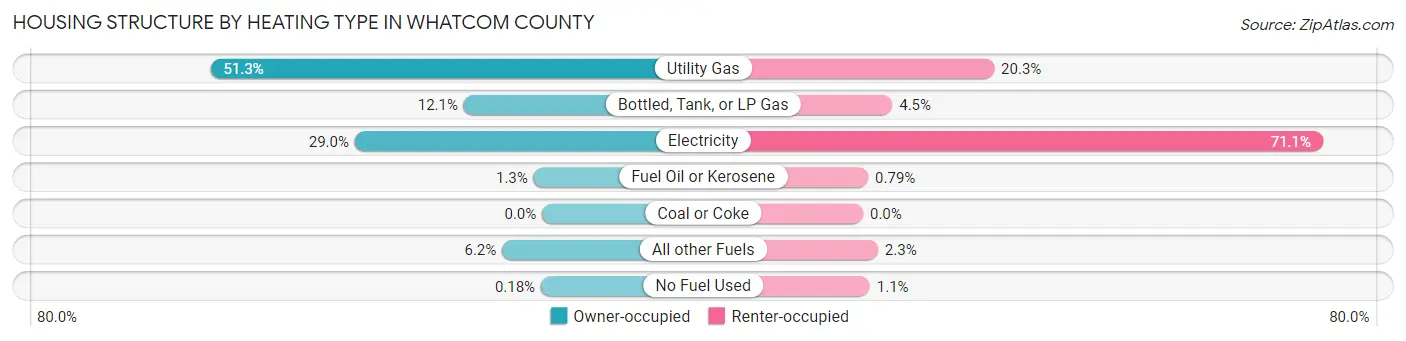
| Heating Type | Owner-occupied | Renter-occupied |
| Utility Gas | 29,451 (51.3%) | 6,838 (20.3%) |
| Bottled, Tank, or LP Gas | 6,954 (12.1%) | 1,523 (4.5%) |
| Electricity | 16,628 (28.9%) | 23,972 (71.1%) |
| Fuel Oil or Kerosene | 752 (1.3%) | 268 (0.8%) |
| Coal or Coke | 0 (0.0%) | 0 (0.0%) |
| All other Fuels | 3,552 (6.2%) | 775 (2.3%) |
| No Fuel Used | 105 (0.2%) | 353 (1.1%) |
| Total | 57,442 (100.0%) | 33,729 (100.0%) |
Household Vehicle Usage in Whatcom County
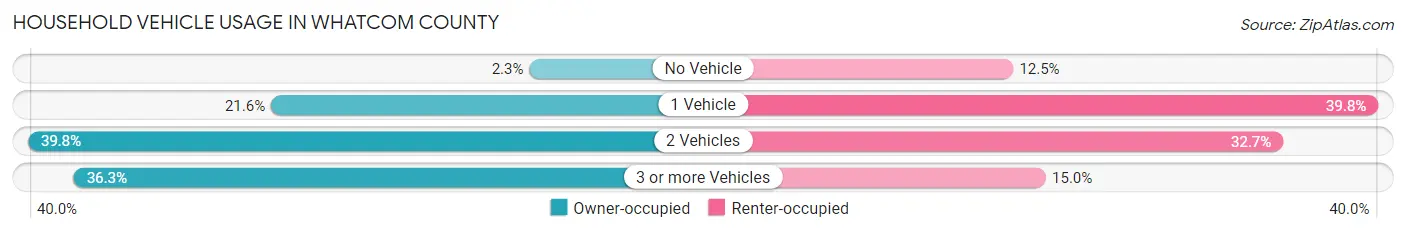
| Vehicles per Household | Owner-occupied | Renter-occupied |
| No Vehicle | 1,325 (2.3%) | 4,219 (12.5%) |
| 1 Vehicle | 12,406 (21.6%) | 13,431 (39.8%) |
| 2 Vehicles | 22,841 (39.8%) | 11,035 (32.7%) |
| 3 or more Vehicles | 20,870 (36.3%) | 5,044 (14.9%) |
| Total | 57,442 (100.0%) | 33,729 (100.0%) |
Real Estate & Mortgages in Whatcom County
Real Estate and Mortgage Overview in Whatcom County
| Characteristic | Without Mortgage | With Mortgage |
| Housing Units | 20,256 | 37,186 |
| Median Property Value | $461,400 | $481,600 |
| Median Household Income | $79,464 | $10,880 |
| Monthly Housing Costs | $664 | $5,932 |
| Real Estate Taxes | $3,572 | $690 |
Property Value by Mortgage Status in Whatcom County
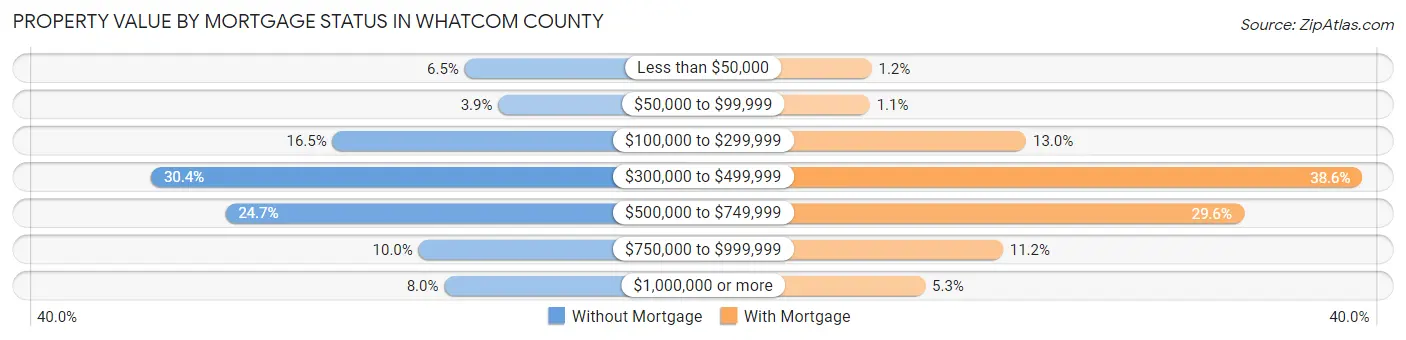
| Property Value | Without Mortgage | With Mortgage |
| Less than $50,000 | 1,310 (6.5%) | 452 (1.2%) |
| $50,000 to $99,999 | 793 (3.9%) | 400 (1.1%) |
| $100,000 to $299,999 | 3,350 (16.5%) | 4,829 (13.0%) |
| $300,000 to $499,999 | 6,152 (30.4%) | 14,358 (38.6%) |
| $500,000 to $749,999 | 5,006 (24.7%) | 11,001 (29.6%) |
| $750,000 to $999,999 | 2,021 (10.0%) | 4,174 (11.2%) |
| $1,000,000 or more | 1,624 (8.0%) | 1,972 (5.3%) |
| Total | 20,256 (100.0%) | 37,186 (100.0%) |
Household Income by Mortgage Status in Whatcom County
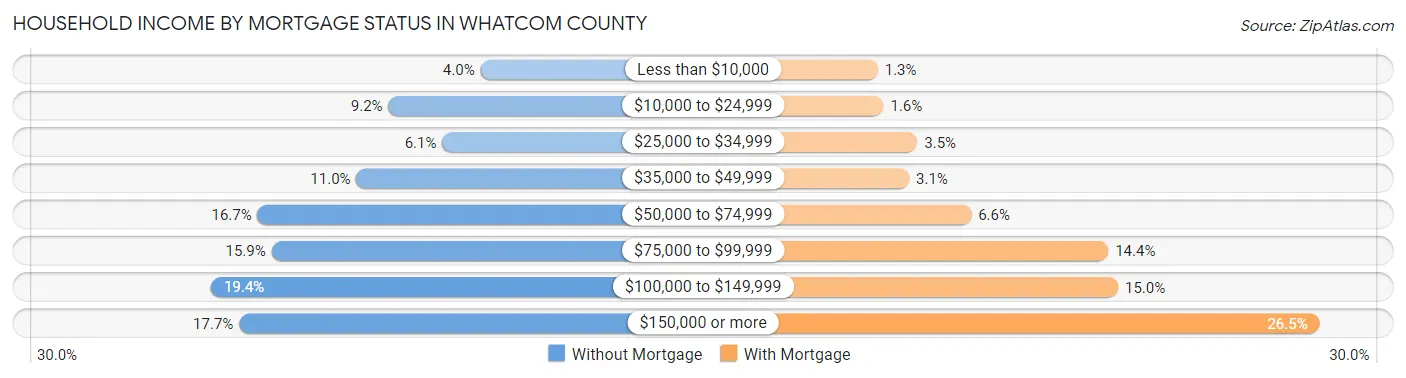
| Household Income | Without Mortgage | With Mortgage |
| Less than $10,000 | 800 (4.0%) | 472 (1.3%) |
| $10,000 to $24,999 | 1,865 (9.2%) | 594 (1.6%) |
| $25,000 to $34,999 | 1,241 (6.1%) | 1,311 (3.5%) |
| $35,000 to $49,999 | 2,237 (11.0%) | 1,137 (3.1%) |
| $50,000 to $74,999 | 3,381 (16.7%) | 2,459 (6.6%) |
| $75,000 to $99,999 | 3,219 (15.9%) | 5,369 (14.4%) |
| $100,000 to $149,999 | 3,920 (19.4%) | 5,577 (15.0%) |
| $150,000 or more | 3,593 (17.7%) | 9,859 (26.5%) |
| Total | 20,256 (100.0%) | 37,186 (100.0%) |
Property Value to Household Income Ratio in Whatcom County
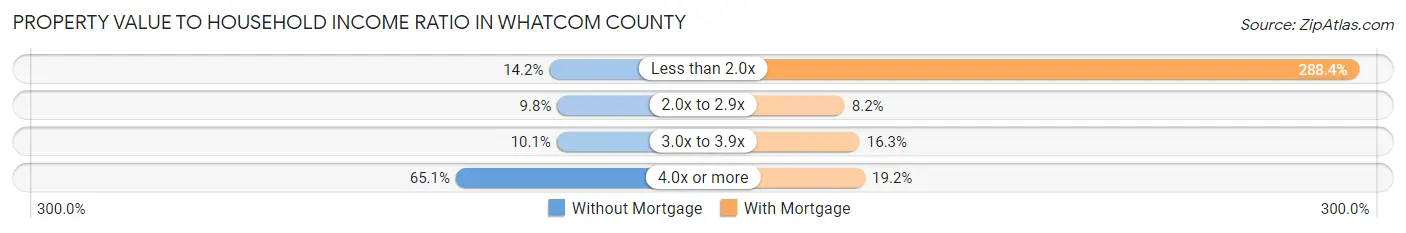
| Value-to-Income Ratio | Without Mortgage | With Mortgage |
| Less than 2.0x | 2,870 (14.2%) | 107,228 (288.4%) |
| 2.0x to 2.9x | 1,986 (9.8%) | 3,030 (8.2%) |
| 3.0x to 3.9x | 2,044 (10.1%) | 6,069 (16.3%) |
| 4.0x or more | 13,183 (65.1%) | 7,139 (19.2%) |
| Total | 20,256 (100.0%) | 37,186 (100.0%) |
Real Estate Taxes by Mortgage Status in Whatcom County
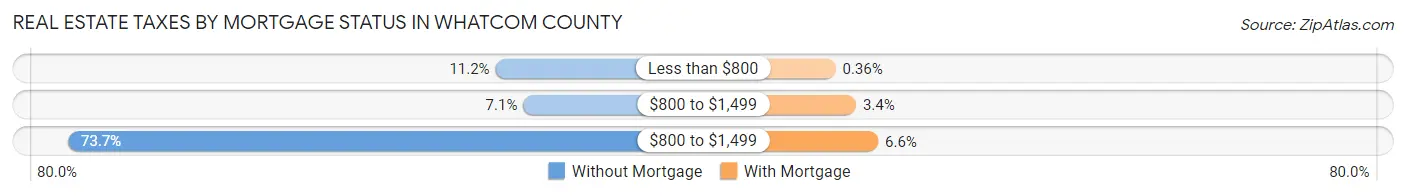
| Property Taxes | Without Mortgage | With Mortgage |
| Less than $800 | 2,269 (11.2%) | 135 (0.4%) |
| $800 to $1,499 | 1,447 (7.1%) | 1,245 (3.4%) |
| $800 to $1,499 | 14,922 (73.7%) | 2,448 (6.6%) |
| Total | 20,256 (100.0%) | 37,186 (100.0%) |
Health & Disability in Whatcom County
Health Insurance Coverage by Age in Whatcom County
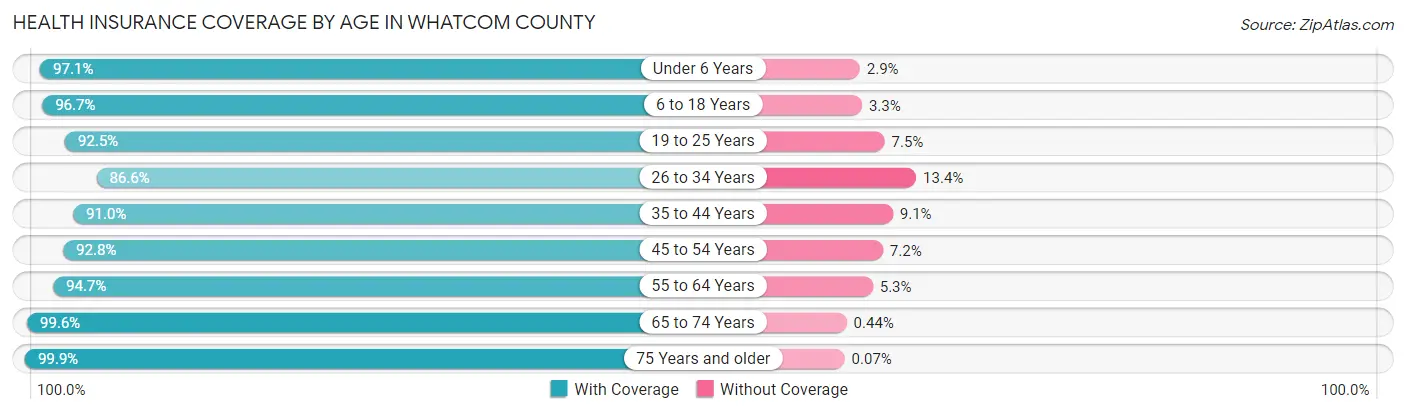
| Age Bracket | With Coverage | Without Coverage |
| Under 6 Years | 13,046 (97.1%) | 390 (2.9%) |
| 6 to 18 Years | 32,024 (96.7%) | 1,091 (3.3%) |
| 19 to 25 Years | 28,274 (92.5%) | 2,299 (7.5%) |
| 26 to 34 Years | 23,668 (86.6%) | 3,661 (13.4%) |
| 35 to 44 Years | 25,404 (90.9%) | 2,527 (9.0%) |
| 45 to 54 Years | 23,434 (92.8%) | 1,817 (7.2%) |
| 55 to 64 Years | 25,593 (94.7%) | 1,434 (5.3%) |
| 65 to 74 Years | 24,943 (99.6%) | 109 (0.4%) |
| 75 Years and older | 15,171 (99.9%) | 11 (0.1%) |
| Total | 211,557 (94.1%) | 13,339 (5.9%) |
Health Insurance Coverage by Citizenship Status in Whatcom County
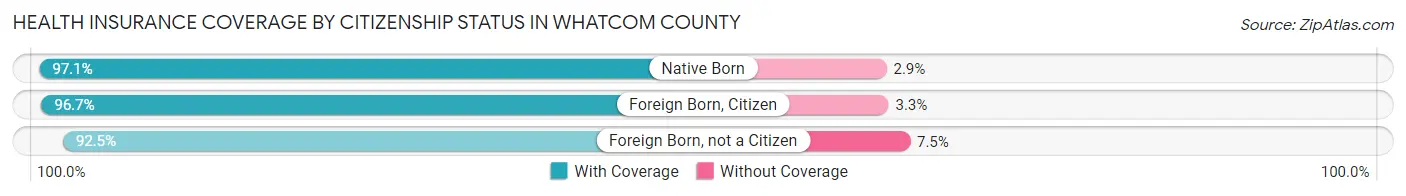
| Citizenship Status | With Coverage | Without Coverage |
| Native Born | 13,046 (97.1%) | 390 (2.9%) |
| Foreign Born, Citizen | 32,024 (96.7%) | 1,091 (3.3%) |
| Foreign Born, not a Citizen | 28,274 (92.5%) | 2,299 (7.5%) |
Health Insurance Coverage by Household Income in Whatcom County
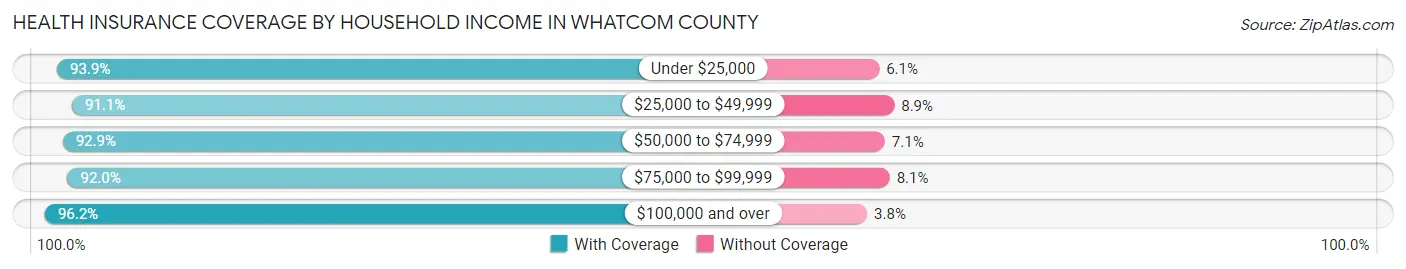
| Household Income | With Coverage | Without Coverage |
| Under $25,000 | 20,057 (93.9%) | 1,298 (6.1%) |
| $25,000 to $49,999 | 28,782 (91.1%) | 2,811 (8.9%) |
| $50,000 to $74,999 | 30,987 (92.9%) | 2,381 (7.1%) |
| $75,000 to $99,999 | 30,230 (91.9%) | 2,647 (8.1%) |
| $100,000 and over | 98,197 (96.2%) | 3,904 (3.8%) |
Public vs Private Health Insurance Coverage by Age in Whatcom County
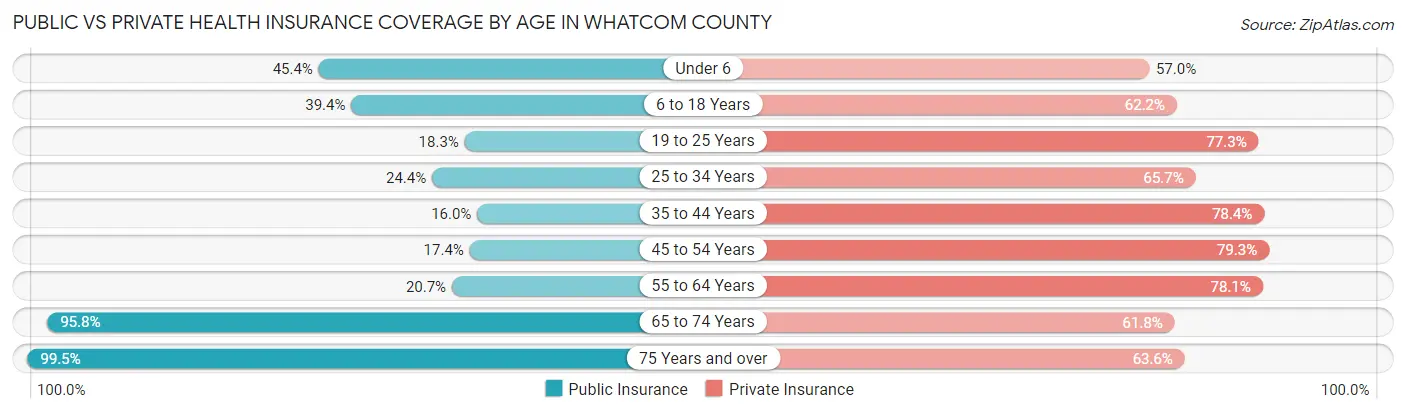
| Age Bracket | Public Insurance | Private Insurance |
| Under 6 | 6,101 (45.4%) | 7,661 (57.0%) |
| 6 to 18 Years | 13,035 (39.4%) | 20,594 (62.2%) |
| 19 to 25 Years | 5,602 (18.3%) | 23,644 (77.3%) |
| 25 to 34 Years | 6,663 (24.4%) | 17,944 (65.7%) |
| 35 to 44 Years | 4,467 (16.0%) | 21,897 (78.4%) |
| 45 to 54 Years | 4,390 (17.4%) | 20,023 (79.3%) |
| 55 to 64 Years | 5,589 (20.7%) | 21,111 (78.1%) |
| 65 to 74 Years | 23,998 (95.8%) | 15,477 (61.8%) |
| 75 Years and over | 15,103 (99.5%) | 9,662 (63.6%) |
| Total | 84,948 (37.8%) | 158,013 (70.3%) |
Disability Status by Sex by Age in Whatcom County
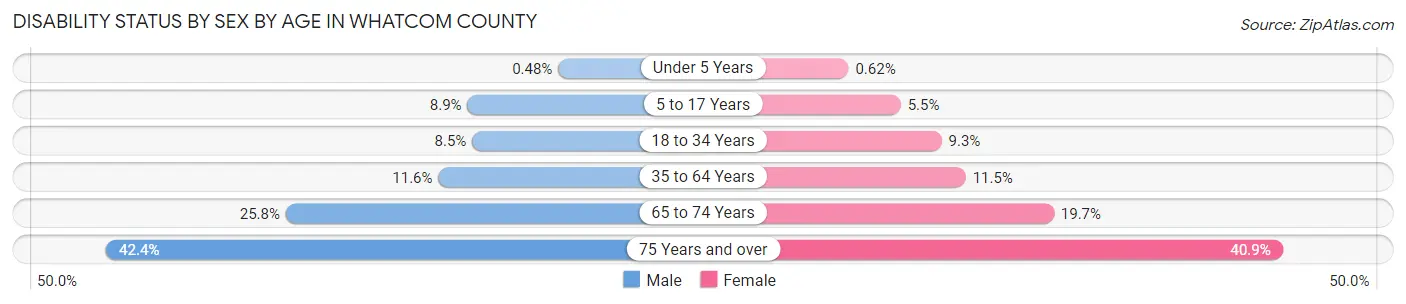
| Age Bracket | Male | Female |
| Under 5 Years | 27 (0.5%) | 33 (0.6%) |
| 5 to 17 Years | 1,470 (8.9%) | 843 (5.5%) |
| 18 to 34 Years | 2,618 (8.5%) | 2,836 (9.3%) |
| 35 to 64 Years | 4,642 (11.6%) | 4,619 (11.5%) |
| 65 to 74 Years | 3,069 (25.8%) | 2,586 (19.7%) |
| 75 Years and over | 2,867 (42.4%) | 3,446 (40.9%) |
Disability Class by Sex by Age in Whatcom County
Disability Class: Hearing Difficulty
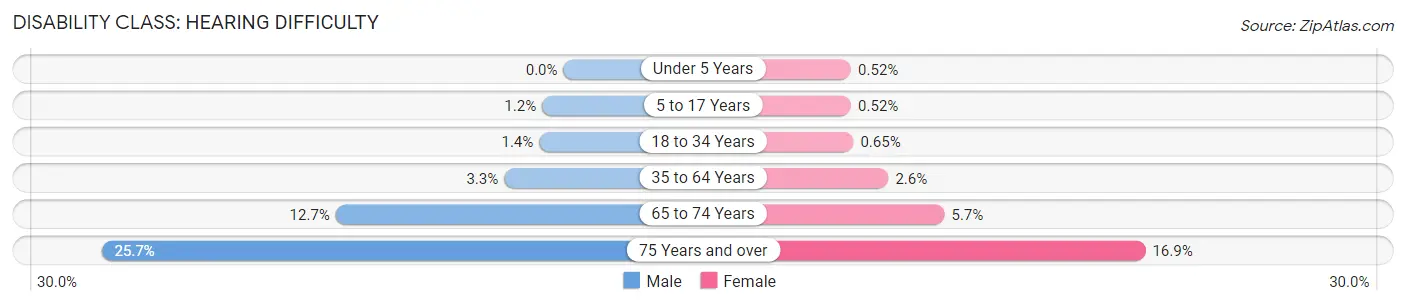
| Age Bracket | Male | Female |
| Under 5 Years | 0 (0.0%) | 28 (0.5%) |
| 5 to 17 Years | 196 (1.2%) | 80 (0.5%) |
| 18 to 34 Years | 417 (1.3%) | 199 (0.6%) |
| 35 to 64 Years | 1,320 (3.3%) | 1,044 (2.6%) |
| 65 to 74 Years | 1,510 (12.7%) | 752 (5.7%) |
| 75 Years and over | 1,738 (25.7%) | 1,425 (16.9%) |
Disability Class: Vision Difficulty
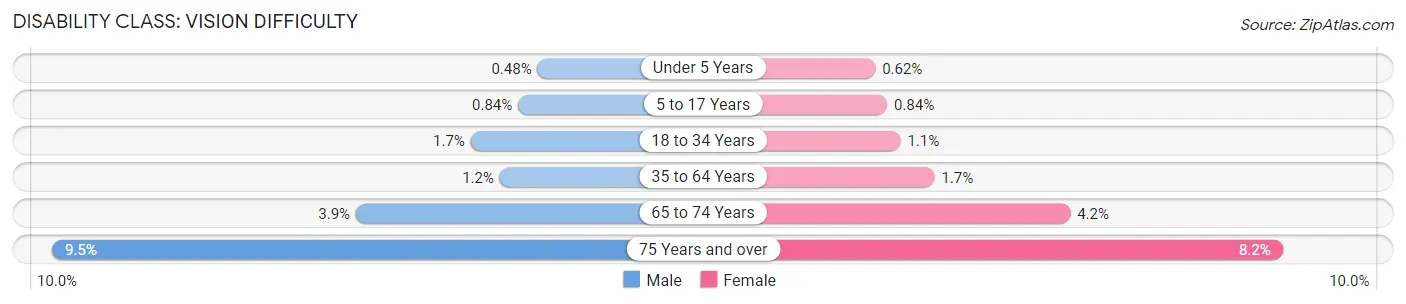
| Age Bracket | Male | Female |
| Under 5 Years | 27 (0.5%) | 33 (0.6%) |
| 5 to 17 Years | 139 (0.8%) | 129 (0.8%) |
| 18 to 34 Years | 531 (1.7%) | 335 (1.1%) |
| 35 to 64 Years | 474 (1.2%) | 693 (1.7%) |
| 65 to 74 Years | 459 (3.8%) | 557 (4.2%) |
| 75 Years and over | 641 (9.5%) | 689 (8.2%) |
Disability Class: Cognitive Difficulty
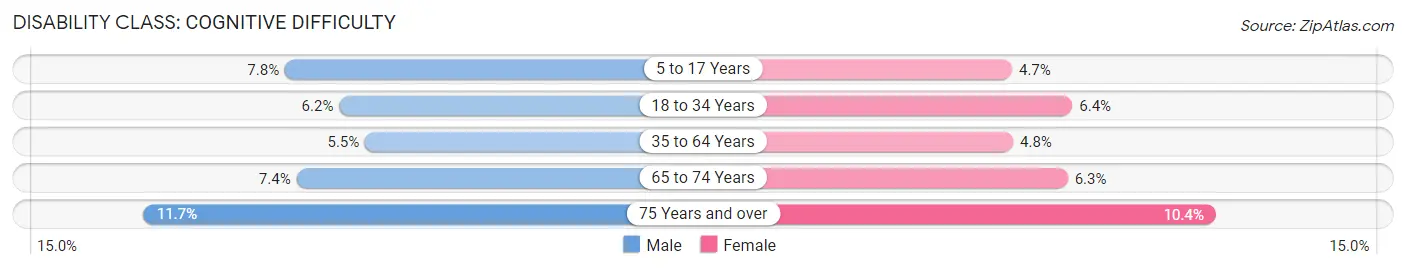
| Age Bracket | Male | Female |
| 5 to 17 Years | 1,280 (7.7%) | 731 (4.7%) |
| 18 to 34 Years | 1,930 (6.2%) | 1,965 (6.4%) |
| 35 to 64 Years | 2,210 (5.5%) | 1,917 (4.8%) |
| 65 to 74 Years | 885 (7.4%) | 826 (6.3%) |
| 75 Years and over | 789 (11.7%) | 877 (10.4%) |
Disability Class: Ambulatory Difficulty
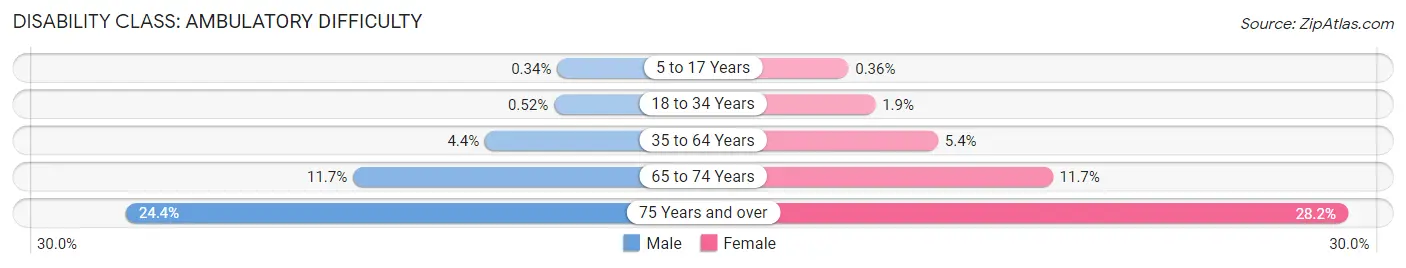
| Age Bracket | Male | Female |
| 5 to 17 Years | 56 (0.3%) | 56 (0.4%) |
| 18 to 34 Years | 160 (0.5%) | 571 (1.9%) |
| 35 to 64 Years | 1,747 (4.4%) | 2,151 (5.3%) |
| 65 to 74 Years | 1,395 (11.7%) | 1,543 (11.7%) |
| 75 Years and over | 1,646 (24.4%) | 2,373 (28.2%) |
Disability Class: Self-Care Difficulty
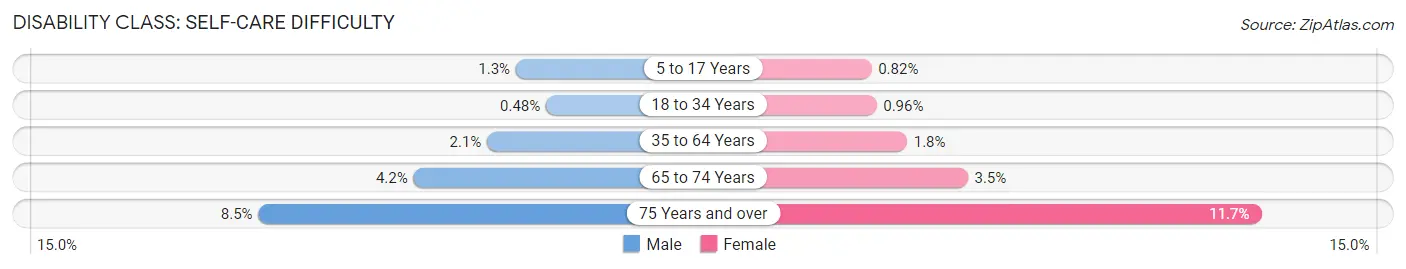
| Age Bracket | Male | Female |
| 5 to 17 Years | 218 (1.3%) | 127 (0.8%) |
| 18 to 34 Years | 150 (0.5%) | 293 (1.0%) |
| 35 to 64 Years | 850 (2.1%) | 727 (1.8%) |
| 65 to 74 Years | 497 (4.2%) | 460 (3.5%) |
| 75 Years and over | 574 (8.5%) | 984 (11.7%) |
Technology Access in Whatcom County
Computing Device Access in Whatcom County
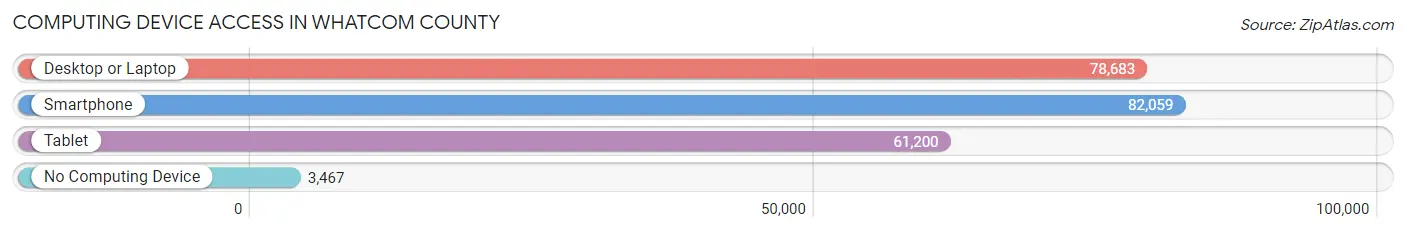
| Device Type | # Households | % Households |
| Desktop or Laptop | 78,683 | 86.3% |
| Smartphone | 82,059 | 90.0% |
| Tablet | 61,200 | 67.1% |
| No Computing Device | 3,467 | 3.8% |
| Total | 91,171 | 100.0% |
Internet Access in Whatcom County
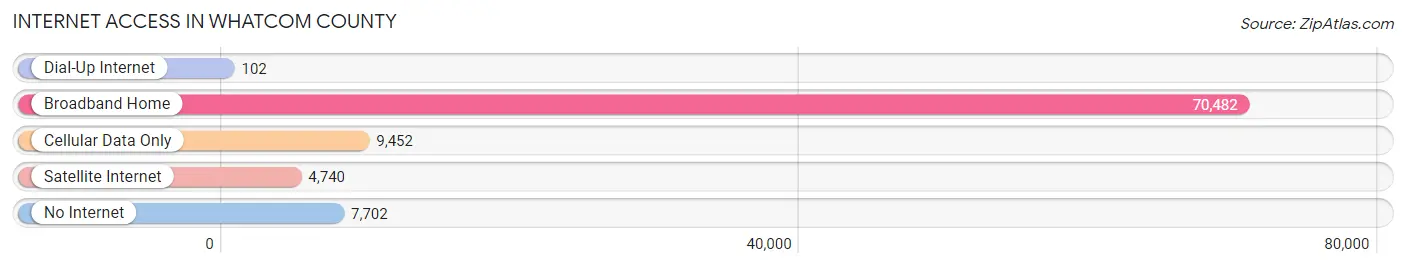
| Internet Type | # Households | % Households |
| Dial-Up Internet | 102 | 0.1% |
| Broadband Home | 70,482 | 77.3% |
| Cellular Data Only | 9,452 | 10.4% |
| Satellite Internet | 4,740 | 5.2% |
| No Internet | 7,702 | 8.5% |
| Total | 91,171 | 100.0% |
Whatcom County Summary
Whatcom County is located in the northwest corner of Washington State, and is bordered by the Canadian province of British Columbia to the north, Skagit County to the south, and the Strait of Georgia to the west. It is the northernmost county in the state, and is home to a population of approximately 220,000 people.
History
Whatcom County was first inhabited by the Lummi and Nooksack Native American tribes, who lived in the area for thousands of years before the arrival of European settlers. The first Europeans to explore the area were Spanish explorers, who arrived in the late 1700s. In 1827, the Hudson’s Bay Company established a trading post in the area, and in 1854, the United States and Great Britain signed the Treaty of Point Elliott, which opened the area to American settlement.
In 1854, the first American settlers arrived in the area, and the county was officially established in 1854. The county was named after the Lummi word for “noisy water”, which referred to the sound of the Nooksack River.
Geography
Whatcom County is located in the northwest corner of Washington State, and is bordered by the Canadian province of British Columbia to the north, Skagit County to the south, and the Strait of Georgia to the west. It is the northernmost county in the state, and is home to a population of approximately 220,000 people.
The county is divided into two distinct regions: the lowlands and the highlands. The lowlands are located in the western part of the county, and are characterized by flat terrain and low elevation. The highlands are located in the eastern part of the county, and are characterized by rolling hills and higher elevation.
The county is home to several rivers, including the Nooksack, Sumas, and Skagit Rivers. It is also home to several lakes, including Lake Whatcom, Lake Samish, and Lake Terrell.
Economy
Whatcom County’s economy is largely based on agriculture, forestry, and fishing. The county is home to several large agricultural operations, including dairy farms, berry farms, and vegetable farms. The county is also home to several large timber companies, which harvest timber from the county’s forests. Fishing is also an important part of the county’s economy, with several commercial fishing operations located in the county.
In addition to agriculture, forestry, and fishing, Whatcom County is also home to several manufacturing companies, including aluminum and steel manufacturers, and several technology companies. The county is also home to several retail stores, restaurants, and other businesses.
Demographics
As of the 2010 census, Whatcom County had a population of approximately 220,000 people. The population is largely white (86.3%), with smaller percentages of Hispanic (7.2%), Asian (3.2%), and African American (1.2%) residents. The median household income in the county is $54,000, and the median home value is $250,000.
Conclusion
Whatcom County is a unique and diverse county located in the northwest corner of Washington State. It is home to a population of approximately 220,000 people, and is largely based on agriculture, forestry, and fishing. The county is also home to several manufacturing companies, retail stores, restaurants, and other businesses. The population is largely white, with smaller percentages of Hispanic, Asian, and African American residents.
Common Questions
What is Per Capita Income in Whatcom County?
Per Capita income in Whatcom County is $40,916.
What is the Median Family Income in Whatcom County?
Median Family Income in Whatcom County is $96,874.
What is the Median Household income in Whatcom County?
Median Household Income in Whatcom County is $77,581.
What is Income or Wage Gap in Whatcom County?
Income or Wage Gap in Whatcom County is 33.4%.
Women in Whatcom County earn 66.6 cents for every dollar earned by a man.
What is Family Income Deficit in Whatcom County?
Family Income Deficit in Whatcom County is $9,242.
Families that are below poverty line in Whatcom County earn $9,242 less on average than the poverty threshold level.
What is Inequality or Gini Index in Whatcom County?
Inequality or Gini Index in Whatcom County is 0.45.
What is the Total Population of Whatcom County?
Total Population of Whatcom County is 226,523.
What is the Total Male Population of Whatcom County?
Total Male Population of Whatcom County is 112,654.
What is the Total Female Population of Whatcom County?
Total Female Population of Whatcom County is 113,869.
What is the Ratio of Males per 100 Females in Whatcom County?
There are 98.93 Males per 100 Females in Whatcom County.
What is the Ratio of Females per 100 Males in Whatcom County?
There are 101.08 Females per 100 Males in Whatcom County.
What is the Median Population Age in Whatcom County?
Median Population Age in Whatcom County is 37.8 Years.
What is the Average Family Size in Whatcom County
Average Family Size in Whatcom County is 2.9 People.
What is the Average Household Size in Whatcom County
Average Household Size in Whatcom County is 2.4 People.
How Large is the Labor Force in Whatcom County?
There are 117,472 People in the Labor Forcein in Whatcom County.
What is the Percentage of People in the Labor Force in Whatcom County?
62.4% of People are in the Labor Force in Whatcom County.
What is the Unemployment Rate in Whatcom County?
Unemployment Rate in Whatcom County is 4.9%.