Benton County, WA Map & Demographics
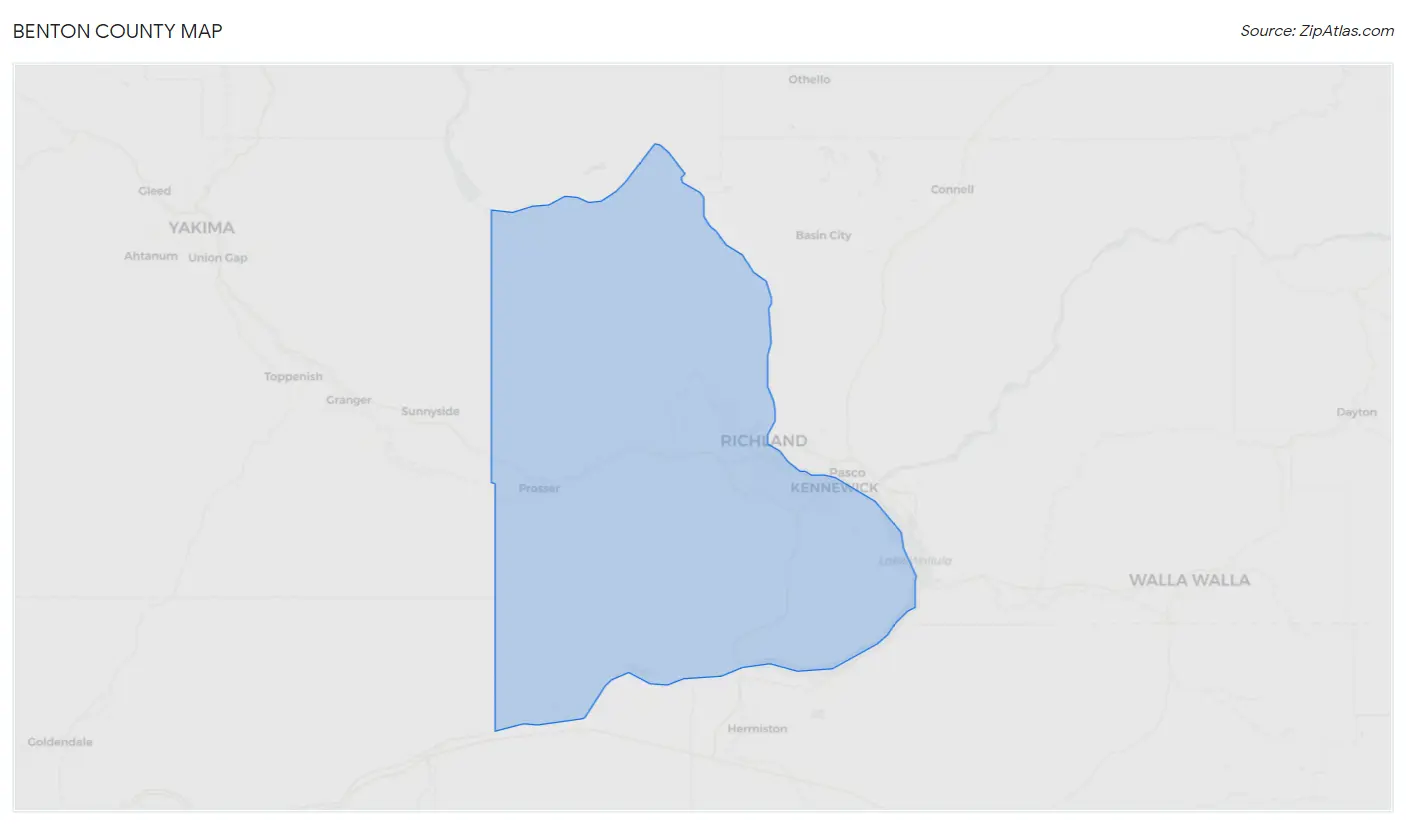
Benton County Map
Benton County Overview
$39,668
PER CAPITA INCOME
$98,476
AVG FAMILY INCOME
$83,778
AVG HOUSEHOLD INCOME
37.2%
WAGE / INCOME GAP [ % ]
62.8¢/ $1
WAGE / INCOME GAP [ $ ]
$9,617
FAMILY INCOME DEFICIT
0.43
INEQUALITY / GINI INDEX
207,560
TOTAL POPULATION
104,632
MALE POPULATION
102,928
FEMALE POPULATION
101.66
MALES / 100 FEMALES
98.37
FEMALES / 100 MALES
36.1
MEDIAN AGE
3.3
AVG FAMILY SIZE
2.7
AVG HOUSEHOLD SIZE
99,544
LABOR FORCE [ PEOPLE ]
62.5%
PERCENT IN LABOR FORCE
4.8%
UNEMPLOYMENT RATE
Benton County Area Codes
Income in Benton County
Income Overview in Benton County
Per Capita Income in Benton County is $39,668, while median incomes of families and households are $98,476 and $83,778 respectively.
| Characteristic | Number | Measure |
| Per Capita Income | 207,560 | $39,668 |
| Median Family Income | 51,974 | $98,476 |
| Mean Family Income | 51,974 | $121,059 |
| Median Household Income | 75,509 | $83,778 |
| Mean Household Income | 75,509 | $106,330 |
| Income Deficit | 51,974 | $9,617 |
| Wage / Income Gap (%) | 207,560 | 37.16% |
| Wage / Income Gap ($) | 207,560 | 62.84¢ per $1 |
| Gini / Inequality Index | 207,560 | 0.43 |
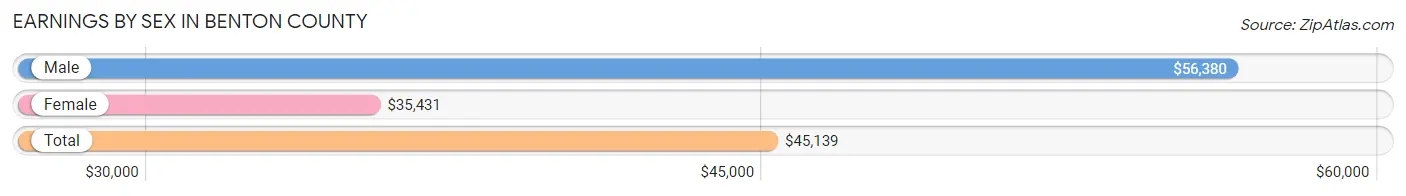
Earnings by Sex in Benton County
Average Earnings in Benton County are $45,139, $56,380 for men and $35,431 for women, a difference of 37.2%.
| Sex | Number | Average Earnings |
| Male | 56,705 (54.8%) | $56,380 |
| Female | 46,846 (45.2%) | $35,431 |
| Total | 103,551 (100.0%) | $45,139 |
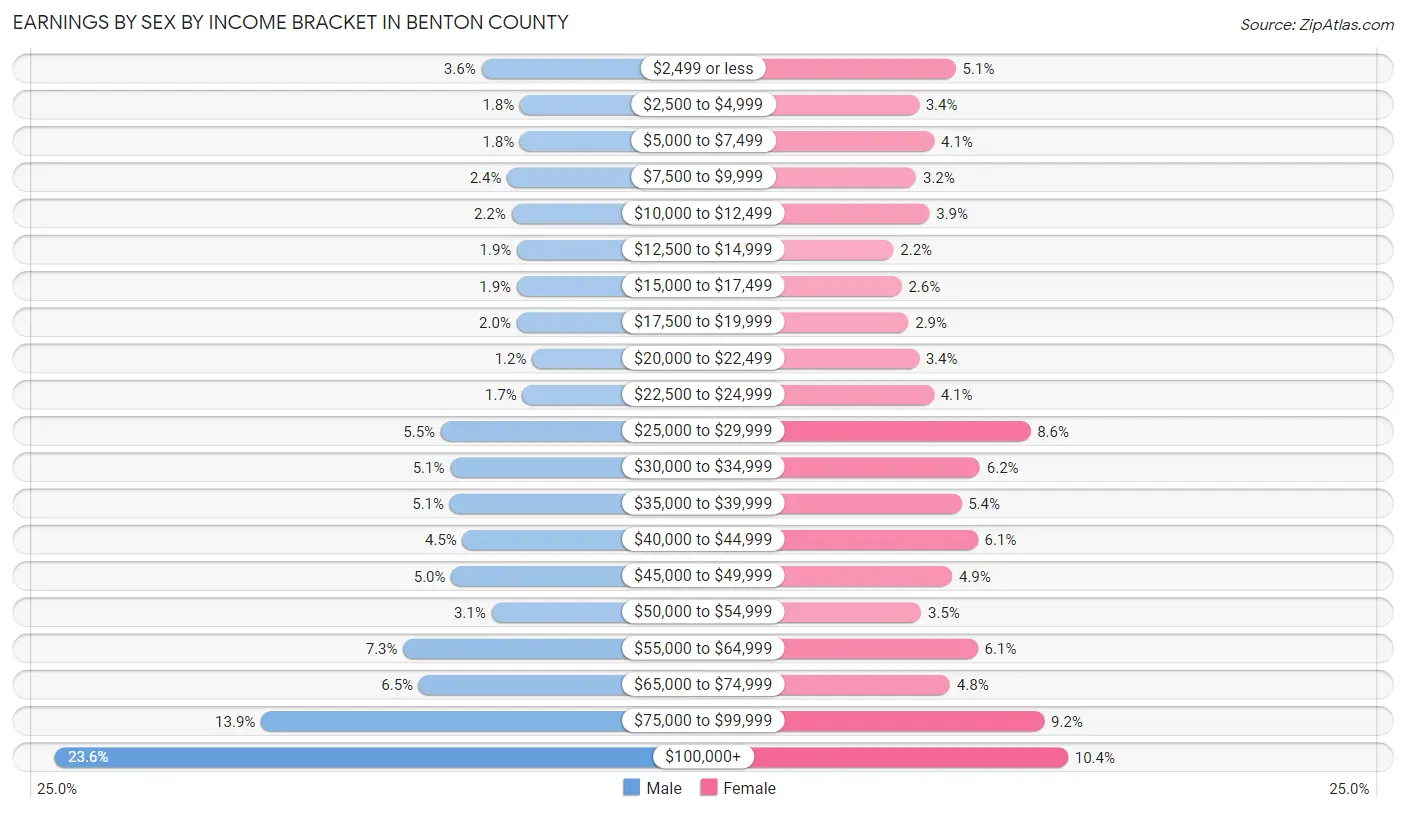
Earnings by Sex by Income Bracket in Benton County
The most common earnings brackets in Benton County are $100,000+ for men (13,364 | 23.6%) and $100,000+ for women (4,849 | 10.3%).
| Income | Male | Female |
| $2,499 or less | 2,043 (3.6%) | 2,389 (5.1%) |
| $2,500 to $4,999 | 1,014 (1.8%) | 1,578 (3.4%) |
| $5,000 to $7,499 | 1,016 (1.8%) | 1,915 (4.1%) |
| $7,500 to $9,999 | 1,356 (2.4%) | 1,519 (3.2%) |
| $10,000 to $12,499 | 1,244 (2.2%) | 1,806 (3.9%) |
| $12,500 to $14,999 | 1,094 (1.9%) | 1,019 (2.2%) |
| $15,000 to $17,499 | 1,098 (1.9%) | 1,201 (2.6%) |
| $17,500 to $19,999 | 1,103 (1.9%) | 1,351 (2.9%) |
| $20,000 to $22,499 | 692 (1.2%) | 1,580 (3.4%) |
| $22,500 to $24,999 | 948 (1.7%) | 1,908 (4.1%) |
| $25,000 to $29,999 | 3,119 (5.5%) | 4,026 (8.6%) |
| $30,000 to $34,999 | 2,867 (5.1%) | 2,918 (6.2%) |
| $35,000 to $39,999 | 2,878 (5.1%) | 2,511 (5.4%) |
| $40,000 to $44,999 | 2,540 (4.5%) | 2,873 (6.1%) |
| $45,000 to $49,999 | 2,841 (5.0%) | 2,310 (4.9%) |
| $50,000 to $54,999 | 1,777 (3.1%) | 1,631 (3.5%) |
| $55,000 to $64,999 | 4,114 (7.3%) | 2,871 (6.1%) |
| $65,000 to $74,999 | 3,704 (6.5%) | 2,264 (4.8%) |
| $75,000 to $99,999 | 7,893 (13.9%) | 4,327 (9.2%) |
| $100,000+ | 13,364 (23.6%) | 4,849 (10.3%) |
| Total | 56,705 (100.0%) | 46,846 (100.0%) |
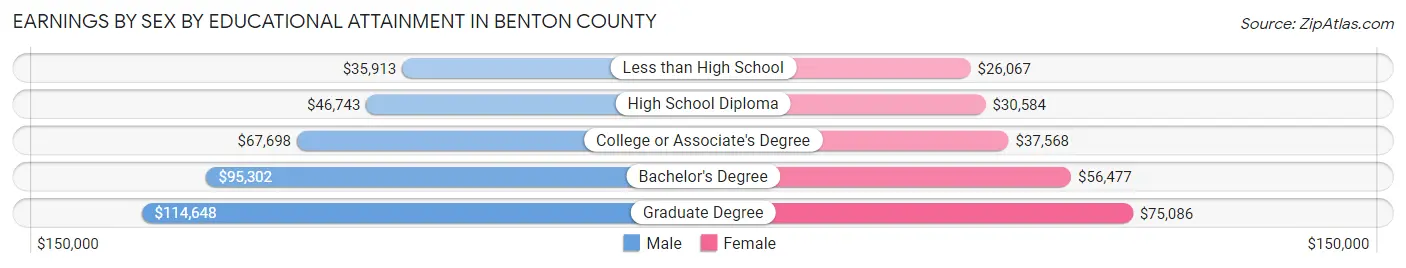
Earnings by Sex by Educational Attainment in Benton County
Average earnings in Benton County are $66,341 for men and $41,591 for women, a difference of 37.3%. Men with an educational attainment of graduate degree enjoy the highest average annual earnings of $114,648, while those with less than high school education earn the least with $35,913. Women with an educational attainment of graduate degree earn the most with the average annual earnings of $75,086, while those with less than high school education have the smallest earnings of $26,067.
| Educational Attainment | Male Income | Female Income |
| Less than High School | $35,913 | $26,067 |
| High School Diploma | $46,743 | $30,584 |
| College or Associate's Degree | $67,698 | $37,568 |
| Bachelor's Degree | $95,302 | $56,477 |
| Graduate Degree | $114,648 | $75,086 |
| Total | $66,341 | $41,591 |
Family Income in Benton County
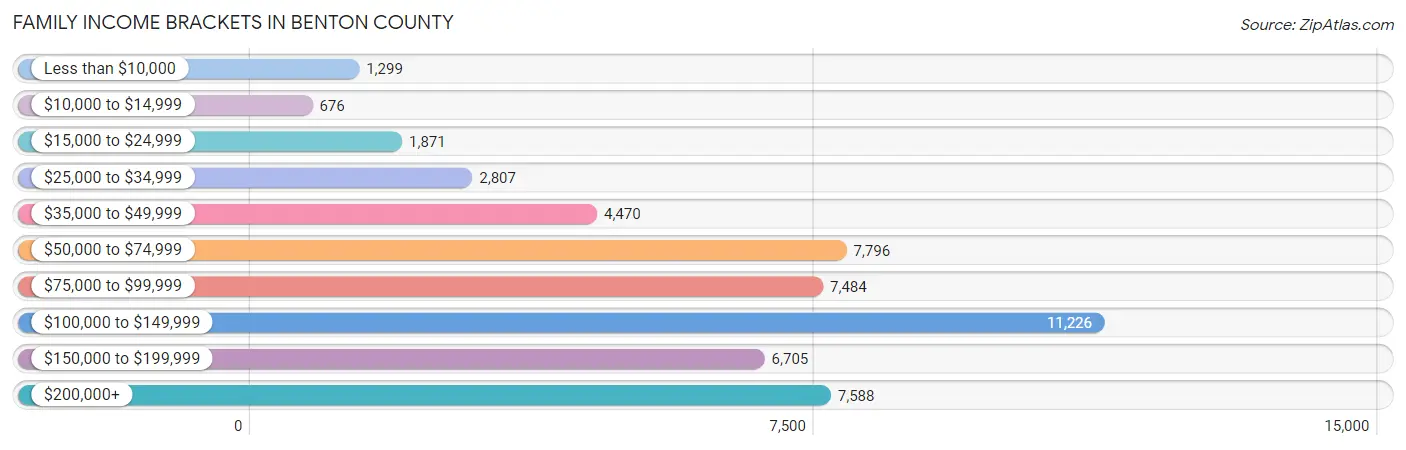
Family Income Brackets in Benton County
According to the Benton County family income data, there are 11,226 families falling into the $100,000 to $149,999 income range, which is the most common income bracket and makes up 21.6% of all families. Conversely, the $10,000 to $14,999 income bracket is the least frequent group with only 676 families (1.3%) belonging to this category.
| Income Bracket | # Families | % Families |
| Less than $10,000 | 1,299 | 2.5% |
| $10,000 to $14,999 | 676 | 1.3% |
| $15,000 to $24,999 | 1,871 | 3.6% |
| $25,000 to $34,999 | 2,807 | 5.4% |
| $35,000 to $49,999 | 4,470 | 8.6% |
| $50,000 to $74,999 | 7,796 | 15.0% |
| $75,000 to $99,999 | 7,484 | 14.4% |
| $100,000 to $149,999 | 11,226 | 21.6% |
| $150,000 to $199,999 | 6,705 | 12.9% |
| $200,000+ | 7,588 | 14.6% |
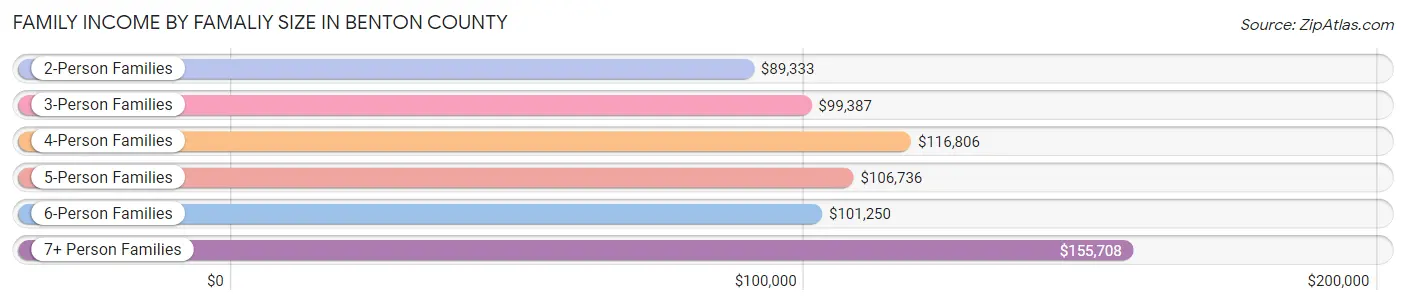
Family Income by Famaliy Size in Benton County
7+ person families (1,145 | 2.2%) account for the highest median family income in Benton County with $155,708 per family, while 2-person families (24,901 | 47.9%) have the highest median income of $44,666 per family member.
| Income Bracket | # Families | Median Income |
| 2-Person Families | 24,901 (47.9%) | $89,333 |
| 3-Person Families | 10,532 (20.3%) | $99,387 |
| 4-Person Families | 9,086 (17.5%) | $116,806 |
| 5-Person Families | 4,235 (8.2%) | $106,736 |
| 6-Person Families | 2,075 (4.0%) | $101,250 |
| 7+ Person Families | 1,145 (2.2%) | $155,708 |
| Total | 51,974 (100.0%) | $98,476 |
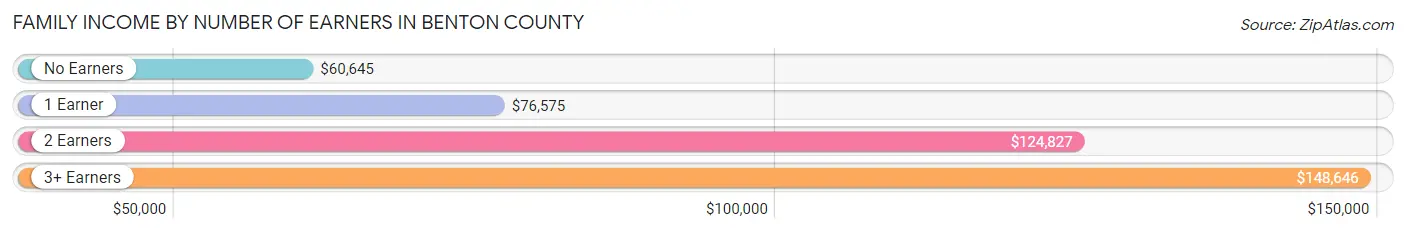
Family Income by Number of Earners in Benton County
The median family income in Benton County is $98,476, with families comprising 3+ earners (5,544) having the highest median family income of $148,646, while families with no earners (8,292) have the lowest median family income of $60,645, accounting for 10.7% and 16.0% of families, respectively.
| Number of Earners | # Families | Median Income |
| No Earners | 8,292 (16.0%) | $60,645 |
| 1 Earner | 18,133 (34.9%) | $76,575 |
| 2 Earners | 20,005 (38.5%) | $124,827 |
| 3+ Earners | 5,544 (10.7%) | $148,646 |
| Total | 51,974 (100.0%) | $98,476 |
Household Income in Benton County
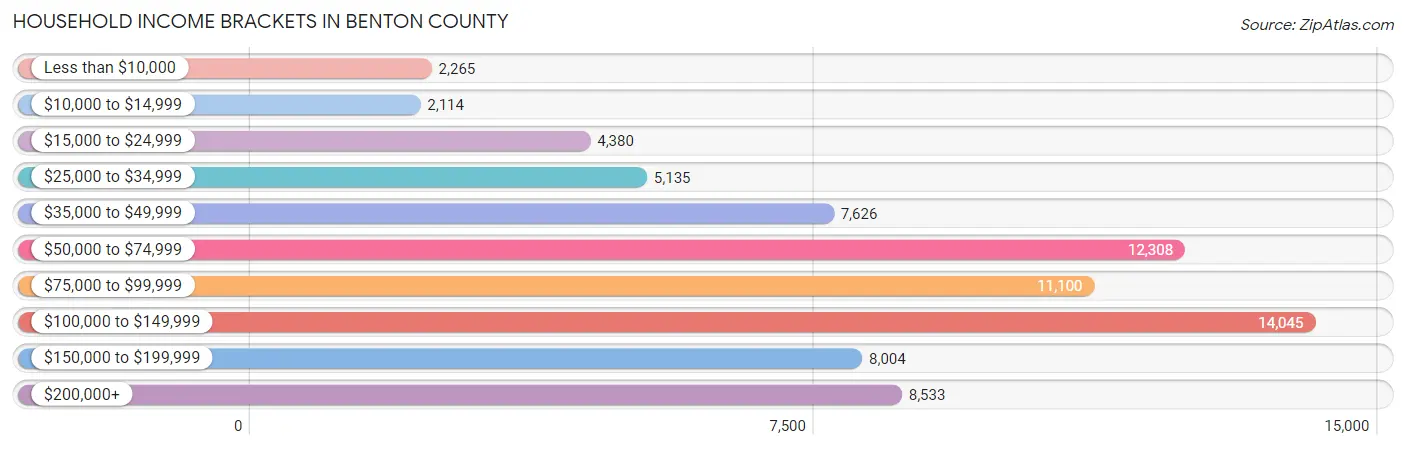
Household Income Brackets in Benton County
With 14,045 households falling in the category, the $100,000 to $149,999 income range is the most frequent in Benton County, accounting for 18.6% of all households. In contrast, only 2,114 households (2.8%) fall into the $10,000 to $14,999 income bracket, making it the least populous group.
| Income Bracket | # Households | % Households |
| Less than $10,000 | 2,265 | 3.0% |
| $10,000 to $14,999 | 2,114 | 2.8% |
| $15,000 to $24,999 | 4,380 | 5.8% |
| $25,000 to $34,999 | 5,135 | 6.8% |
| $35,000 to $49,999 | 7,626 | 10.1% |
| $50,000 to $74,999 | 12,308 | 16.3% |
| $75,000 to $99,999 | 11,100 | 14.7% |
| $100,000 to $149,999 | 14,045 | 18.6% |
| $150,000 to $199,999 | 8,004 | 10.6% |
| $200,000+ | 8,533 | 11.3% |
Household Income by Householder Age in Benton County
The median household income in Benton County is $83,778, with the highest median household income of $104,991 found in the 45 to 64 years age bracket for the primary householder. A total of 26,734 households (35.4%) fall into this category. Meanwhile, the 15 to 24 years age bracket for the primary householder has the lowest median household income of $57,526, with 2,642 households (3.5%) in this group.
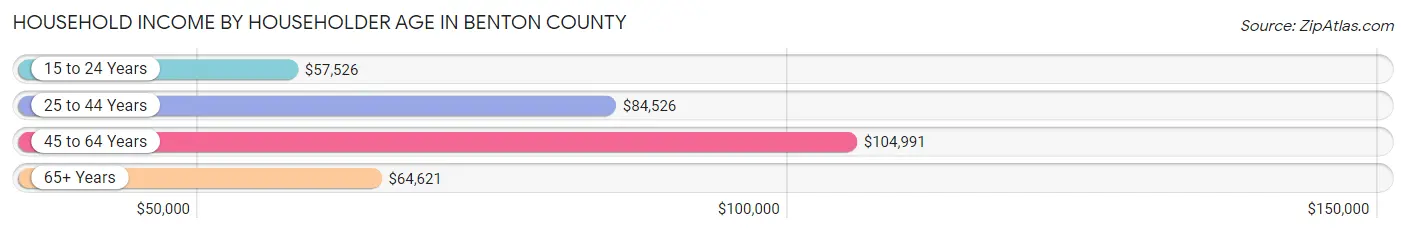
| Income Bracket | # Households | Median Income |
| 15 to 24 Years | 2,642 (3.5%) | $57,526 |
| 25 to 44 Years | 26,533 (35.1%) | $84,526 |
| 45 to 64 Years | 26,734 (35.4%) | $104,991 |
| 65+ Years | 19,600 (26.0%) | $64,621 |
| Total | 75,509 (100.0%) | $83,778 |
Poverty in Benton County
Income Below Poverty by Sex and Age in Benton County
With 9.7% poverty level for males and 11.4% for females among the residents of Benton County, 6 to 11 year old males and under 5 year old females are the most vulnerable to poverty, with 1,724 males (17.6%) and 1,100 females (16.9%) in their respective age groups living below the poverty level.
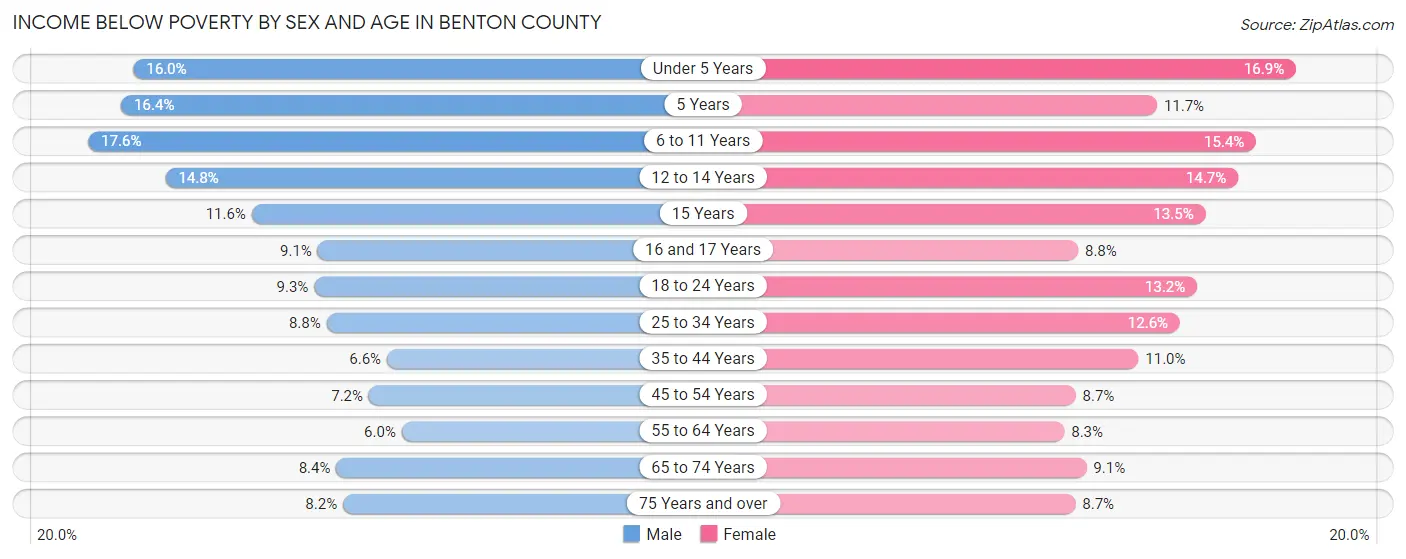
| Age Bracket | Male | Female |
| Under 5 Years | 1,092 (16.0%) | 1,100 (16.9%) |
| 5 Years | 277 (16.4%) | 184 (11.7%) |
| 6 to 11 Years | 1,724 (17.6%) | 1,406 (15.4%) |
| 12 to 14 Years | 683 (14.8%) | 598 (14.7%) |
| 15 Years | 164 (11.6%) | 223 (13.5%) |
| 16 and 17 Years | 306 (9.1%) | 255 (8.8%) |
| 18 to 24 Years | 867 (9.2%) | 1,128 (13.2%) |
| 25 to 34 Years | 1,235 (8.8%) | 1,722 (12.6%) |
| 35 to 44 Years | 895 (6.6%) | 1,473 (11.0%) |
| 45 to 54 Years | 846 (7.2%) | 974 (8.7%) |
| 55 to 64 Years | 732 (6.0%) | 1,032 (8.3%) |
| 65 to 74 Years | 808 (8.4%) | 893 (9.1%) |
| 75 Years and over | 432 (8.2%) | 598 (8.7%) |
| Total | 10,061 (9.7%) | 11,586 (11.4%) |
Income Above Poverty by Sex and Age in Benton County
According to the poverty statistics in Benton County, males aged 55 to 64 years and females aged 55 to 64 years are the age groups that are most secure financially, with 94.0% of males and 91.7% of females in these age groups living above the poverty line.
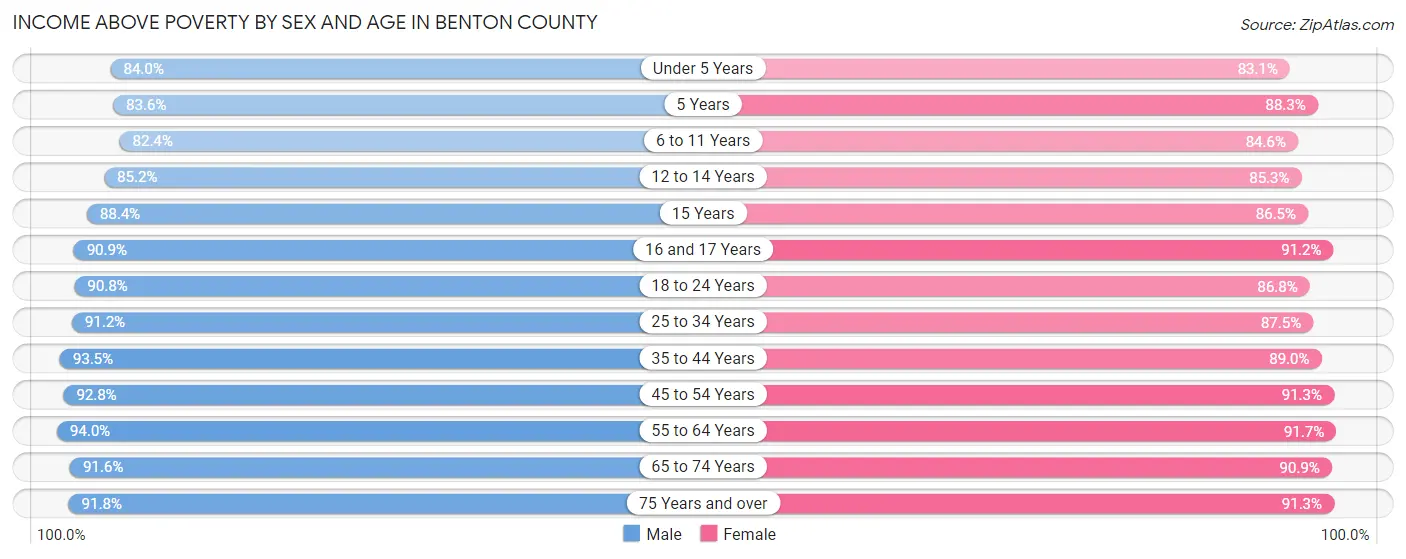
| Age Bracket | Male | Female |
| Under 5 Years | 5,752 (84.0%) | 5,426 (83.1%) |
| 5 Years | 1,410 (83.6%) | 1,389 (88.3%) |
| 6 to 11 Years | 8,048 (82.4%) | 7,734 (84.6%) |
| 12 to 14 Years | 3,942 (85.2%) | 3,468 (85.3%) |
| 15 Years | 1,253 (88.4%) | 1,429 (86.5%) |
| 16 and 17 Years | 3,049 (90.9%) | 2,654 (91.2%) |
| 18 to 24 Years | 8,509 (90.7%) | 7,425 (86.8%) |
| 25 to 34 Years | 12,813 (91.2%) | 12,003 (87.5%) |
| 35 to 44 Years | 12,762 (93.4%) | 11,907 (89.0%) |
| 45 to 54 Years | 10,875 (92.8%) | 10,251 (91.3%) |
| 55 to 64 Years | 11,469 (94.0%) | 11,468 (91.7%) |
| 65 to 74 Years | 8,776 (91.6%) | 8,941 (90.9%) |
| 75 Years and over | 4,849 (91.8%) | 6,299 (91.3%) |
| Total | 93,507 (90.3%) | 90,394 (88.6%) |
Income Below Poverty Among Married-Couple Families in Benton County
The poverty statistics for married-couple families in Benton County show that 4.4% or 1,696 of the total 38,742 families live below the poverty line. Families with 5 or more children have the highest poverty rate of 21.0%, comprising of 74 families. On the other hand, families with no children have the lowest poverty rate of 3.5%, which includes 786 families.
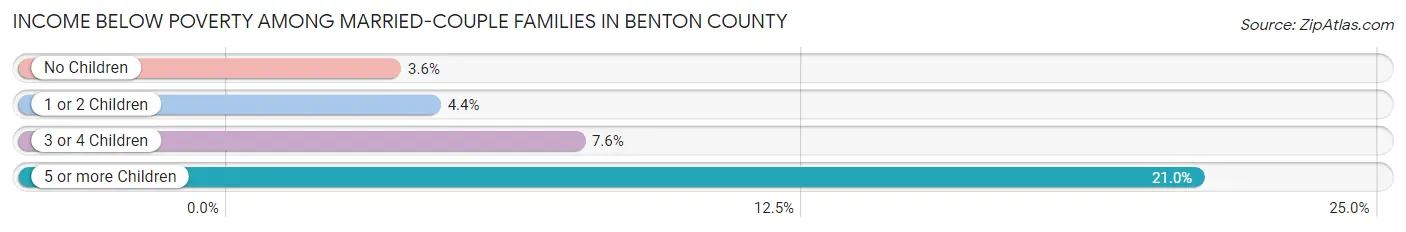
| Children | Above Poverty | Below Poverty |
| No Children | 21,334 (96.5%) | 786 (3.5%) |
| 1 or 2 Children | 11,946 (95.6%) | 551 (4.4%) |
| 3 or 4 Children | 3,488 (92.4%) | 285 (7.5%) |
| 5 or more Children | 278 (79.0%) | 74 (21.0%) |
| Total | 37,046 (95.6%) | 1,696 (4.4%) |
Income Below Poverty Among Single-Parent Households in Benton County
According to the poverty data in Benton County, 8.5% or 342 single-father households and 22.8% or 2,096 single-mother households are living below the poverty line. Among single-father households, those with 1 or 2 children have the highest poverty rate, with 279 households (11.4%) experiencing poverty. Likewise, among single-mother households, those with 5 or more children have the highest poverty rate, with 157 households (96.9%) falling below the poverty line.
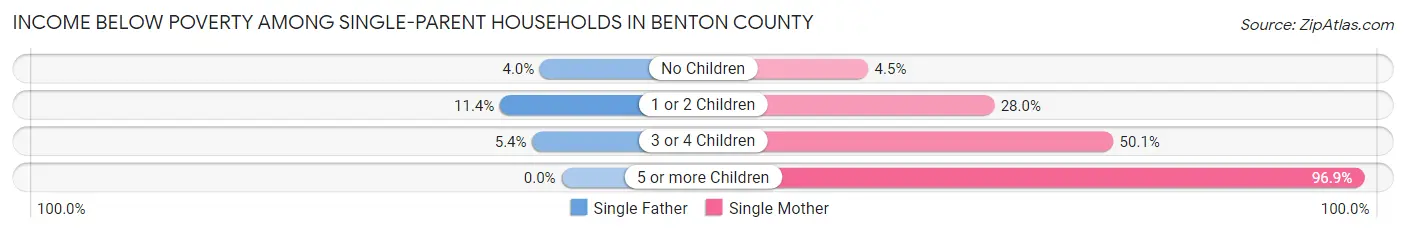
| Children | Single Father | Single Mother |
| No Children | 50 (4.0%) | 156 (4.5%) |
| 1 or 2 Children | 279 (11.4%) | 1,267 (28.0%) |
| 3 or 4 Children | 13 (5.4%) | 516 (50.1%) |
| 5 or more Children | 0 (0.0%) | 157 (96.9%) |
| Total | 342 (8.5%) | 2,096 (22.8%) |
Income Below Poverty Among Married-Couple vs Single-Parent Households in Benton County
The poverty data for Benton County shows that 1,696 of the married-couple family households (4.4%) and 2,438 of the single-parent households (18.4%) are living below the poverty level. Within the married-couple family households, those with 5 or more children have the highest poverty rate, with 74 households (21.0%) falling below the poverty line. Among the single-parent households, those with 5 or more children have the highest poverty rate, with 157 household (64.3%) living below poverty.
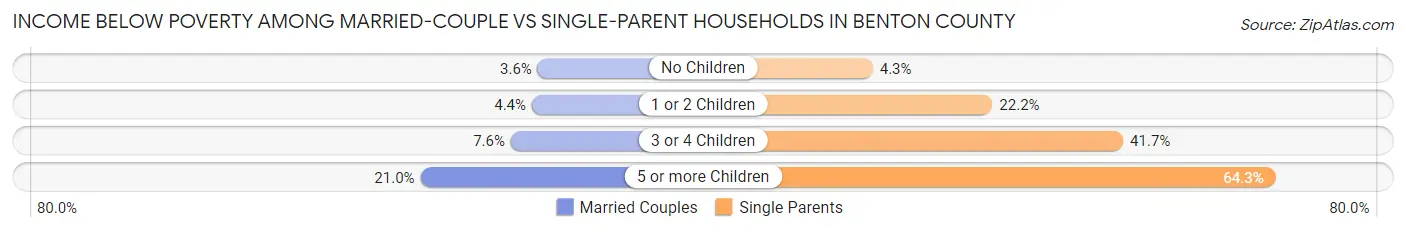
| Children | Married-Couple Families | Single-Parent Households |
| No Children | 786 (3.5%) | 206 (4.3%) |
| 1 or 2 Children | 551 (4.4%) | 1,546 (22.2%) |
| 3 or 4 Children | 285 (7.5%) | 529 (41.6%) |
| 5 or more Children | 74 (21.0%) | 157 (64.3%) |
| Total | 1,696 (4.4%) | 2,438 (18.4%) |
Race in Benton County
The most populous races in Benton County are White / Caucasian (157,190 | 75.7%), Hispanic or Latino (48,824 | 23.5%), and Two or more Races (20,256 | 9.8%).
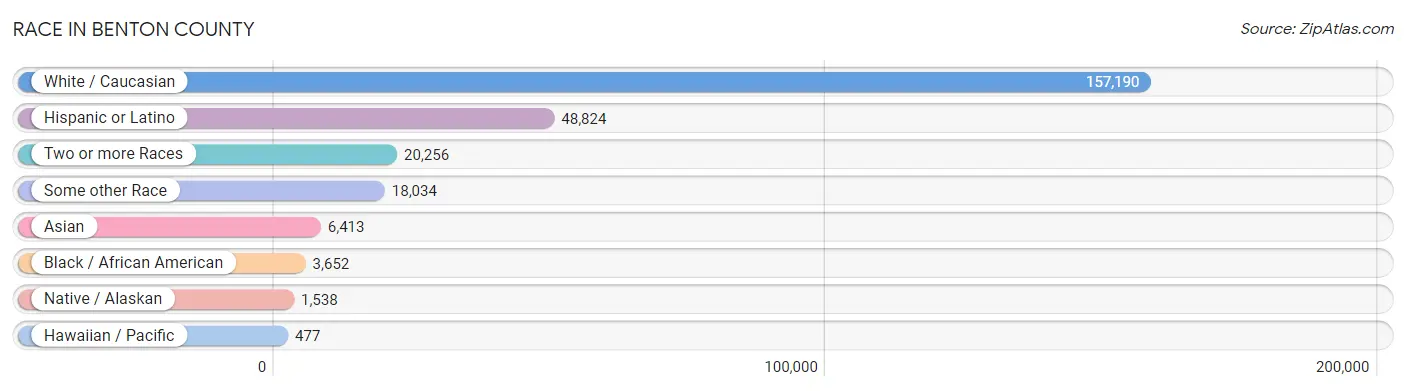
| Race | # Population | % Population |
| Asian | 6,413 | 3.1% |
| Black / African American | 3,652 | 1.8% |
| Hawaiian / Pacific | 477 | 0.2% |
| Hispanic or Latino | 48,824 | 23.5% |
| Native / Alaskan | 1,538 | 0.7% |
| White / Caucasian | 157,190 | 75.7% |
| Two or more Races | 20,256 | 9.8% |
| Some other Race | 18,034 | 8.7% |
| Total | 207,560 | 100.0% |
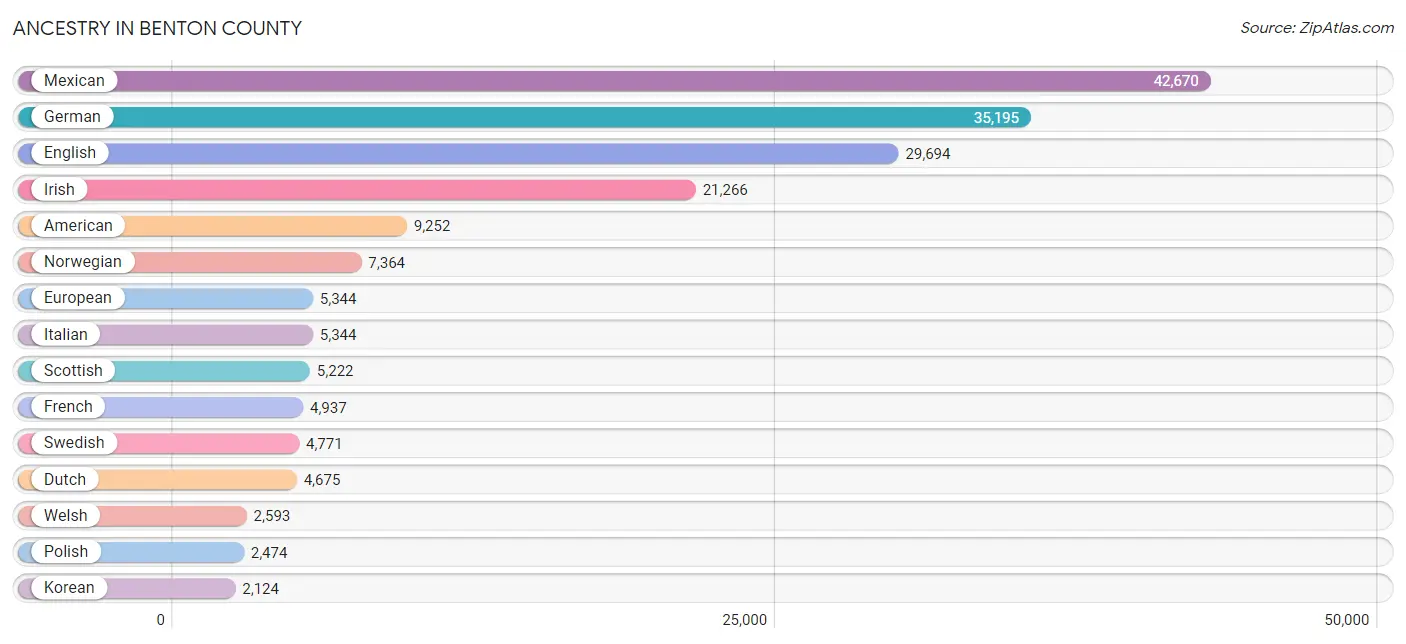
Ancestry in Benton County
The most populous ancestries reported in Benton County are Mexican (42,670 | 20.6%), German (35,195 | 17.0%), English (29,694 | 14.3%), Irish (21,266 | 10.2%), and American (9,252 | 4.5%), together accounting for 66.5% of all Benton County residents.
| Ancestry | # Population | % Population |
| Afghan | 85 | 0.0% |
| African | 1,079 | 0.5% |
| Alaska Native | 30 | 0.0% |
| Albanian | 86 | 0.0% |
| Aleut | 113 | 0.1% |
| American | 9,252 | 4.5% |
| Apache | 68 | 0.0% |
| Arab | 1,385 | 0.7% |
| Argentinean | 50 | 0.0% |
| Armenian | 244 | 0.1% |
| Australian | 121 | 0.1% |
| Austrian | 335 | 0.2% |
| Bangladeshi | 158 | 0.1% |
| Barbadian | 11 | 0.0% |
| Basque | 216 | 0.1% |
| Belgian | 213 | 0.1% |
| Belizean | 4 | 0.0% |
| Bhutanese | 774 | 0.4% |
| Blackfeet | 193 | 0.1% |
| Bolivian | 25 | 0.0% |
| Brazilian | 134 | 0.1% |
| British | 1,971 | 0.9% |
| Bulgarian | 240 | 0.1% |
| Burmese | 918 | 0.4% |
| Cambodian | 5 | 0.0% |
| Canadian | 487 | 0.2% |
| Celtic | 21 | 0.0% |
| Central American | 1,238 | 0.6% |
| Central American Indian | 282 | 0.1% |
| Cherokee | 421 | 0.2% |
| Chickasaw | 12 | 0.0% |
| Chilean | 57 | 0.0% |
| Chinese | 38 | 0.0% |
| Chippewa | 240 | 0.1% |
| Choctaw | 69 | 0.0% |
| Colombian | 401 | 0.2% |
| Colville | 200 | 0.1% |
| Comanche | 16 | 0.0% |
| Costa Rican | 32 | 0.0% |
| Cree | 70 | 0.0% |
| Creek | 44 | 0.0% |
| Croatian | 381 | 0.2% |
| Crow | 28 | 0.0% |
| Cuban | 1,039 | 0.5% |
| Czech | 737 | 0.4% |
| Czechoslovakian | 59 | 0.0% |
| Danish | 2,112 | 1.0% |
| Delaware | 13 | 0.0% |
| Dominican | 164 | 0.1% |
| Dutch | 4,675 | 2.2% |
| Dutch West Indian | 10 | 0.0% |
| Eastern European | 141 | 0.1% |
| Ecuadorian | 67 | 0.0% |
| Egyptian | 115 | 0.1% |
| English | 29,694 | 14.3% |
| Estonian | 20 | 0.0% |
| Ethiopian | 154 | 0.1% |
| European | 5,344 | 2.6% |
| Filipino | 94 | 0.1% |
| Finnish | 1,311 | 0.6% |
| French | 4,937 | 2.4% |
| French Canadian | 956 | 0.5% |
| German | 35,195 | 17.0% |
| German Russian | 8 | 0.0% |
| Ghanaian | 4 | 0.0% |
| Greek | 172 | 0.1% |
| Guamanian / Chamorro | 147 | 0.1% |
| Guatemalan | 735 | 0.4% |
| Guyanese | 45 | 0.0% |
| Honduran | 79 | 0.0% |
| Hopi | 7 | 0.0% |
| Hungarian | 981 | 0.5% |
| Icelander | 72 | 0.0% |
| Indian (Asian) | 1,470 | 0.7% |
| Indonesian | 144 | 0.1% |
| Inupiat | 5 | 0.0% |
| Iranian | 268 | 0.1% |
| Iraqi | 234 | 0.1% |
| Irish | 21,266 | 10.2% |
| Iroquois | 57 | 0.0% |
| Israeli | 35 | 0.0% |
| Italian | 5,344 | 2.6% |
| Jamaican | 85 | 0.0% |
| Japanese | 91 | 0.0% |
| Korean | 2,124 | 1.0% |
| Laotian | 38 | 0.0% |
| Latvian | 82 | 0.0% |
| Lebanese | 245 | 0.1% |
| Lithuanian | 9 | 0.0% |
| Malaysian | 106 | 0.1% |
| Mexican | 42,670 | 20.6% |
| Mexican American Indian | 336 | 0.2% |
| Moroccan | 81 | 0.0% |
| Native Hawaiian | 404 | 0.2% |
| Navajo | 47 | 0.0% |
| Nicaraguan | 105 | 0.1% |
| Nigerian | 63 | 0.0% |
| Northern European | 751 | 0.4% |
| Norwegian | 7,364 | 3.5% |
| Pakistani | 174 | 0.1% |
| Palestinian | 153 | 0.1% |
| Panamanian | 7 | 0.0% |
| Pennsylvania German | 47 | 0.0% |
| Peruvian | 135 | 0.1% |
| Polish | 2,474 | 1.2% |
| Portuguese | 386 | 0.2% |
| Puerto Rican | 573 | 0.3% |
| Puget Sound Salish | 52 | 0.0% |
| Romanian | 571 | 0.3% |
| Russian | 1,412 | 0.7% |
| Salvadoran | 260 | 0.1% |
| Samoan | 303 | 0.2% |
| Scandinavian | 1,315 | 0.6% |
| Scotch-Irish | 2,010 | 1.0% |
| Scottish | 5,222 | 2.5% |
| Serbian | 31 | 0.0% |
| Shoshone | 6 | 0.0% |
| Sioux | 29 | 0.0% |
| Slavic | 44 | 0.0% |
| Slovak | 247 | 0.1% |
| Slovene | 30 | 0.0% |
| South African | 7 | 0.0% |
| South American | 799 | 0.4% |
| South American Indian | 36 | 0.0% |
| Spaniard | 729 | 0.4% |
| Spanish | 499 | 0.2% |
| Sri Lankan | 1,119 | 0.5% |
| Subsaharan African | 1,638 | 0.8% |
| Sudanese | 267 | 0.1% |
| Swedish | 4,771 | 2.3% |
| Swiss | 605 | 0.3% |
| Syrian | 92 | 0.0% |
| Thai | 1,072 | 0.5% |
| Tlingit-Haida | 171 | 0.1% |
| Trinidadian and Tobagonian | 17 | 0.0% |
| Tsimshian | 25 | 0.0% |
| Turkish | 19 | 0.0% |
| Ugandan | 56 | 0.0% |
| Ukrainian | 724 | 0.4% |
| Venezuelan | 64 | 0.0% |
| Vietnamese | 112 | 0.1% |
| Welsh | 2,593 | 1.3% |
| Yakama | 120 | 0.1% |
| Yaqui | 33 | 0.0% |
| Yugoslavian | 882 | 0.4% | View All 145 Rows |
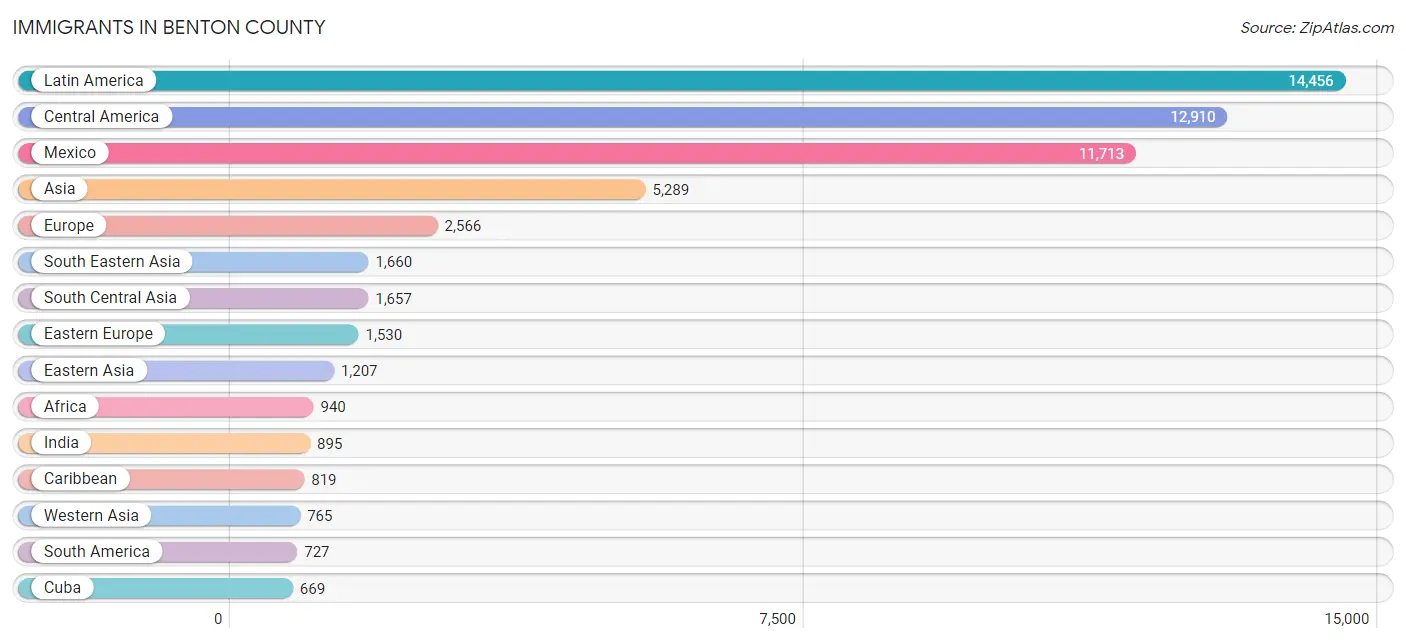
Immigrants in Benton County
The most numerous immigrant groups reported in Benton County came from Latin America (14,456 | 7.0%), Central America (12,910 | 6.2%), Mexico (11,713 | 5.6%), Asia (5,289 | 2.5%), and Europe (2,566 | 1.2%), together accounting for 22.6% of all Benton County residents.
| Immigration Origin | # Population | % Population |
| Afghanistan | 85 | 0.0% |
| Africa | 940 | 0.4% |
| Argentina | 34 | 0.0% |
| Asia | 5,289 | 2.5% |
| Australia | 72 | 0.0% |
| Bangladesh | 115 | 0.1% |
| Barbados | 11 | 0.0% |
| Belarus | 50 | 0.0% |
| Bolivia | 71 | 0.0% |
| Bosnia and Herzegovina | 463 | 0.2% |
| Brazil | 56 | 0.0% |
| Bulgaria | 164 | 0.1% |
| Cambodia | 71 | 0.0% |
| Canada | 643 | 0.3% |
| Caribbean | 819 | 0.4% |
| Central America | 12,910 | 6.2% |
| Chile | 52 | 0.0% |
| China | 630 | 0.3% |
| Colombia | 349 | 0.2% |
| Costa Rica | 11 | 0.0% |
| Cuba | 669 | 0.3% |
| Czechoslovakia | 8 | 0.0% |
| Denmark | 49 | 0.0% |
| Eastern Africa | 353 | 0.2% |
| Eastern Asia | 1,207 | 0.6% |
| Eastern Europe | 1,530 | 0.7% |
| Ecuador | 31 | 0.0% |
| Egypt | 50 | 0.0% |
| El Salvador | 244 | 0.1% |
| England | 131 | 0.1% |
| Ethiopia | 175 | 0.1% |
| Europe | 2,566 | 1.2% |
| France | 51 | 0.0% |
| Germany | 303 | 0.2% |
| Ghana | 69 | 0.0% |
| Guatemala | 646 | 0.3% |
| Guyana | 45 | 0.0% |
| Honduras | 95 | 0.1% |
| Hong Kong | 19 | 0.0% |
| India | 895 | 0.4% |
| Indonesia | 13 | 0.0% |
| Iran | 204 | 0.1% |
| Iraq | 232 | 0.1% |
| Ireland | 32 | 0.0% |
| Israel | 14 | 0.0% |
| Italy | 12 | 0.0% |
| Jamaica | 118 | 0.1% |
| Japan | 92 | 0.0% |
| Kazakhstan | 22 | 0.0% |
| Kenya | 34 | 0.0% |
| Korea | 485 | 0.2% |
| Kuwait | 135 | 0.1% |
| Laos | 99 | 0.1% |
| Latin America | 14,456 | 7.0% |
| Lebanon | 248 | 0.1% |
| Malaysia | 12 | 0.0% |
| Mexico | 11,713 | 5.6% |
| Middle Africa | 58 | 0.0% |
| Moldova | 159 | 0.1% |
| Morocco | 18 | 0.0% |
| Nepal | 39 | 0.0% |
| Netherlands | 23 | 0.0% |
| Nicaragua | 201 | 0.1% |
| Nigeria | 15 | 0.0% |
| Northern Africa | 401 | 0.2% |
| Northern Europe | 555 | 0.3% |
| Norway | 11 | 0.0% |
| Oceania | 105 | 0.1% |
| Pakistan | 244 | 0.1% |
| Peru | 65 | 0.0% |
| Philippines | 563 | 0.3% |
| Poland | 125 | 0.1% |
| Romania | 191 | 0.1% |
| Russia | 112 | 0.1% |
| South Africa | 19 | 0.0% |
| South America | 727 | 0.4% |
| South Central Asia | 1,657 | 0.8% |
| South Eastern Asia | 1,660 | 0.8% |
| Southern Europe | 41 | 0.0% |
| Spain | 29 | 0.0% |
| Sri Lanka | 41 | 0.0% |
| Sudan | 305 | 0.2% |
| Sweden | 45 | 0.0% |
| Switzerland | 63 | 0.0% |
| Syria | 66 | 0.0% |
| Taiwan | 78 | 0.0% |
| Thailand | 120 | 0.1% |
| Trinidad and Tobago | 21 | 0.0% |
| Turkey | 26 | 0.0% |
| Uganda | 62 | 0.0% |
| Ukraine | 158 | 0.1% |
| Uzbekistan | 12 | 0.0% |
| Venezuela | 24 | 0.0% |
| Vietnam | 658 | 0.3% |
| Western Africa | 84 | 0.0% |
| Western Asia | 765 | 0.4% |
| Western Europe | 440 | 0.2% |
| Zimbabwe | 21 | 0.0% | View All 98 Rows |
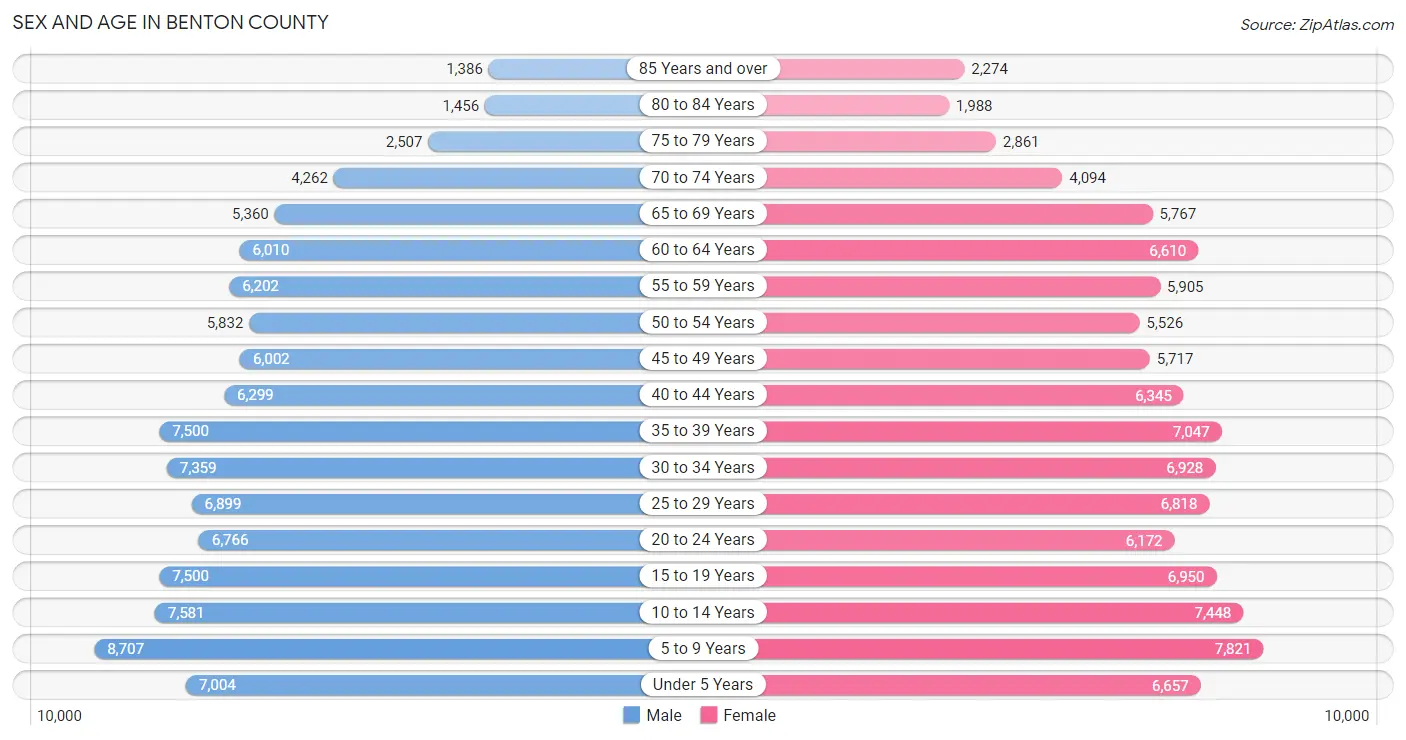
Sex and Age in Benton County
Sex and Age in Benton County
The most populous age groups in Benton County are 5 to 9 Years (8,707 | 8.3%) for men and 5 to 9 Years (7,821 | 7.6%) for women.
| Age Bracket | Male | Female |
| Under 5 Years | 7,004 (6.7%) | 6,657 (6.5%) |
| 5 to 9 Years | 8,707 (8.3%) | 7,821 (7.6%) |
| 10 to 14 Years | 7,581 (7.2%) | 7,448 (7.2%) |
| 15 to 19 Years | 7,500 (7.2%) | 6,950 (6.8%) |
| 20 to 24 Years | 6,766 (6.5%) | 6,172 (6.0%) |
| 25 to 29 Years | 6,899 (6.6%) | 6,818 (6.6%) |
| 30 to 34 Years | 7,359 (7.0%) | 6,928 (6.7%) |
| 35 to 39 Years | 7,500 (7.2%) | 7,047 (6.9%) |
| 40 to 44 Years | 6,299 (6.0%) | 6,345 (6.2%) |
| 45 to 49 Years | 6,002 (5.7%) | 5,717 (5.6%) |
| 50 to 54 Years | 5,832 (5.6%) | 5,526 (5.4%) |
| 55 to 59 Years | 6,202 (5.9%) | 5,905 (5.7%) |
| 60 to 64 Years | 6,010 (5.7%) | 6,610 (6.4%) |
| 65 to 69 Years | 5,360 (5.1%) | 5,767 (5.6%) |
| 70 to 74 Years | 4,262 (4.1%) | 4,094 (4.0%) |
| 75 to 79 Years | 2,507 (2.4%) | 2,861 (2.8%) |
| 80 to 84 Years | 1,456 (1.4%) | 1,988 (1.9%) |
| 85 Years and over | 1,386 (1.3%) | 2,274 (2.2%) |
| Total | 104,632 (100.0%) | 102,928 (100.0%) |
Families and Households in Benton County
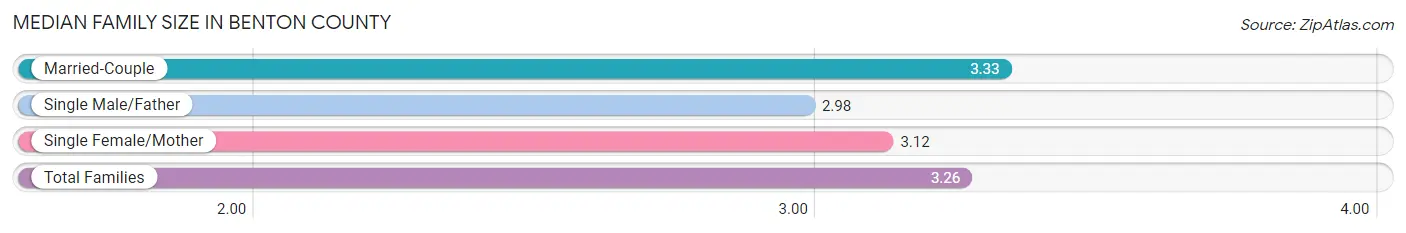
Median Family Size in Benton County
The median family size in Benton County is 3.26 persons per family, with married-couple families (38,742 | 74.5%) accounting for the largest median family size of 3.33 persons per family. On the other hand, single male/father families (4,019 | 7.7%) represent the smallest median family size with 2.98 persons per family.
| Family Type | # Families | Family Size |
| Married-Couple | 38,742 (74.5%) | 3.33 |
| Single Male/Father | 4,019 (7.7%) | 2.98 |
| Single Female/Mother | 9,213 (17.7%) | 3.12 |
| Total Families | 51,974 (100.0%) | 3.26 |
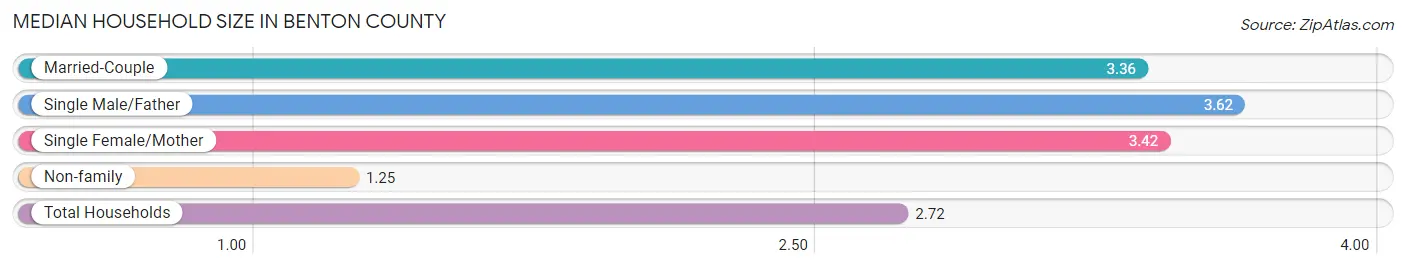
Median Household Size in Benton County
The median household size in Benton County is 2.72 persons per household, with single male/father households (4,019 | 5.3%) accounting for the largest median household size of 3.62 persons per household. non-family households (23,535 | 31.2%) represent the smallest median household size with 1.25 persons per household.
| Household Type | # Households | Household Size |
| Married-Couple | 38,742 (51.3%) | 3.36 |
| Single Male/Father | 4,019 (5.3%) | 3.62 |
| Single Female/Mother | 9,213 (12.2%) | 3.42 |
| Non-family | 23,535 (31.2%) | 1.25 |
| Total Households | 75,509 (100.0%) | 2.72 |
Household Size by Marriage Status in Benton County
Out of a total of 75,509 households in Benton County, 51,974 (68.8%) are family households, while 23,535 (31.2%) are nonfamily households. The most numerous type of family households are 2-person households, comprising 22,520, and the most common type of nonfamily households are 1-person households, comprising 19,194.
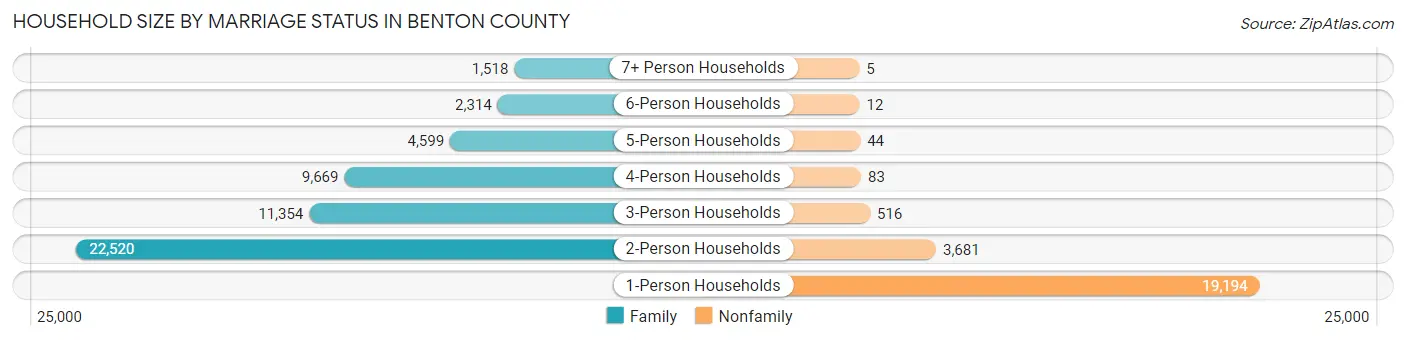
| Household Size | Family Households | Nonfamily Households |
| 1-Person Households | - | 19,194 (25.4%) |
| 2-Person Households | 22,520 (29.8%) | 3,681 (4.9%) |
| 3-Person Households | 11,354 (15.0%) | 516 (0.7%) |
| 4-Person Households | 9,669 (12.8%) | 83 (0.1%) |
| 5-Person Households | 4,599 (6.1%) | 44 (0.1%) |
| 6-Person Households | 2,314 (3.1%) | 12 (0.0%) |
| 7+ Person Households | 1,518 (2.0%) | 5 (0.0%) |
| Total | 51,974 (68.8%) | 23,535 (31.2%) |
Female Fertility in Benton County
Fertility by Age in Benton County
Average fertility rate in Benton County is 48.0 births per 1,000 women. Women in the age bracket of 20 to 34 years have the highest fertility rate with 82.0 births per 1,000 women. Women in the age bracket of 20 to 34 years acount for 71.6% of all women with births.
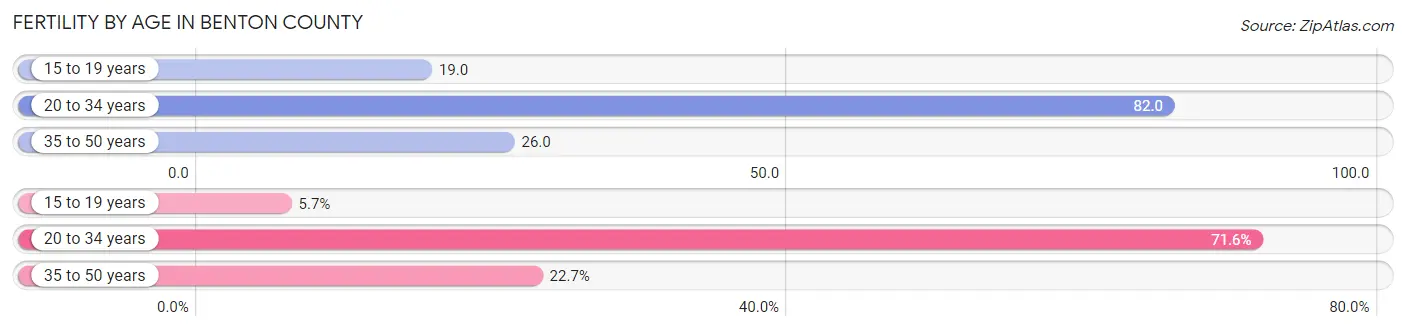
| Age Bracket | Women with Births | Births / 1,000 Women |
| 15 to 19 years | 130 (5.7%) | 19.0 |
| 20 to 34 years | 1,643 (71.6%) | 82.0 |
| 35 to 50 years | 521 (22.7%) | 26.0 |
| Total | 2,294 (100.0%) | 48.0 |
Fertility by Age by Marriage Status in Benton County
71.4% of women with births (2,294) in Benton County are married. The highest percentage of unmarried women with births falls into 15 to 19 years age bracket with 71.5% of them unmarried at the time of birth, while the lowest percentage of unmarried women with births belong to 35 to 50 years age bracket with 10.4% of them unmarried.
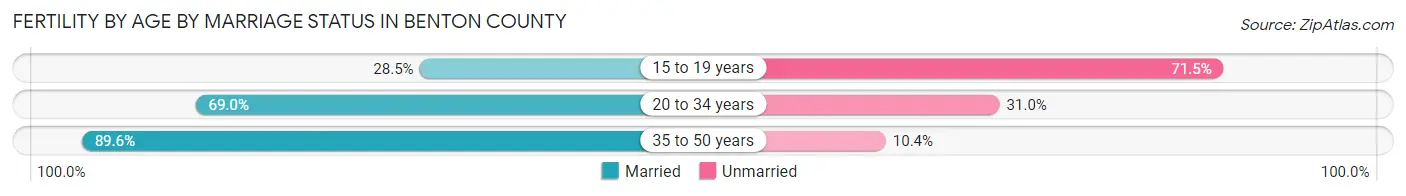
| Age Bracket | Married | Unmarried |
| 15 to 19 years | 37 (28.5%) | 93 (71.5%) |
| 20 to 34 years | 1,134 (69.0%) | 509 (31.0%) |
| 35 to 50 years | 467 (89.6%) | 54 (10.4%) |
| Total | 1,638 (71.4%) | 656 (28.6%) |
Fertility by Education in Benton County
Average fertility rate in Benton County is 48.0 births per 1,000 women. Women with the education attainment of high school diploma have the highest fertility rate of 60.0 births per 1,000 women, while women with the education attainment of less than high school have the lowest fertility at 24.0 births per 1,000 women. Women with the education attainment of college or associate's degree represent 37.1% of all women with births.
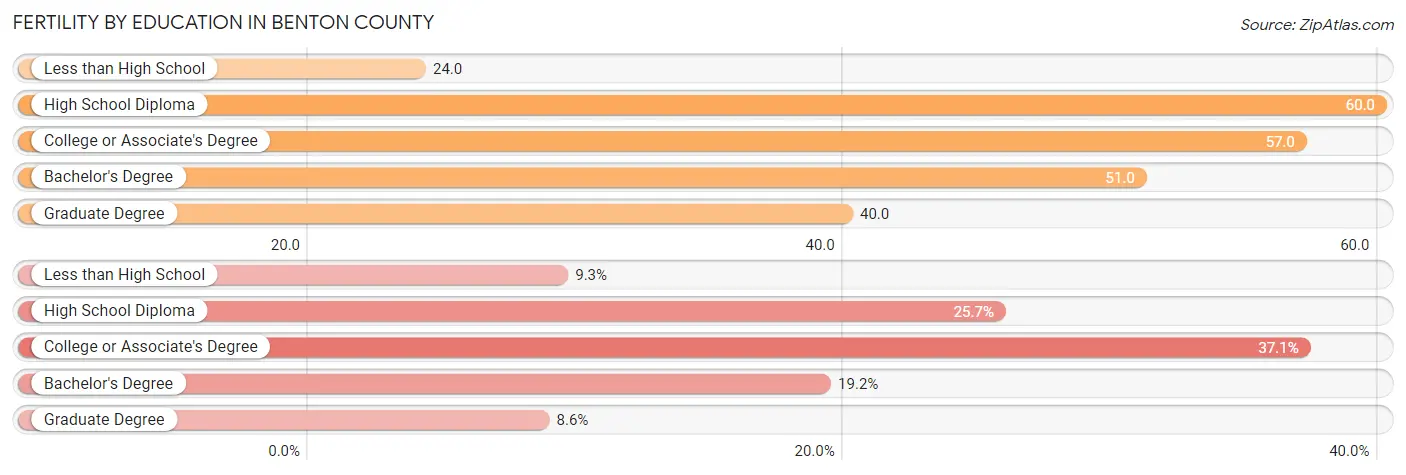
| Educational Attainment | Women with Births | Births / 1,000 Women |
| Less than High School | 214 (9.3%) | 24.0 |
| High School Diploma | 590 (25.7%) | 60.0 |
| College or Associate's Degree | 852 (37.1%) | 57.0 |
| Bachelor's Degree | 440 (19.2%) | 51.0 |
| Graduate Degree | 198 (8.6%) | 40.0 |
| Total | 2,294 (100.0%) | 48.0 |
Fertility by Education by Marriage Status in Benton County
28.6% of women with births in Benton County are unmarried. Women with the educational attainment of bachelor's degree are most likely to be married with 93.9% of them married at childbirth, while women with the educational attainment of less than high school are least likely to be married with 45.8% of them unmarried at childbirth.
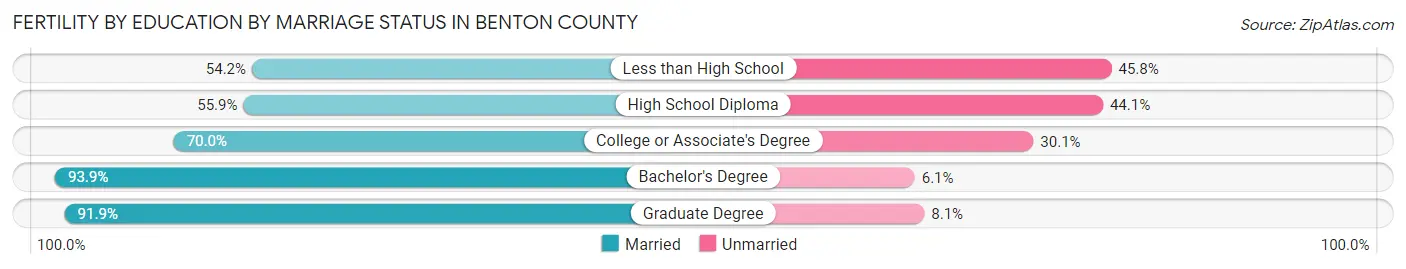
| Educational Attainment | Married | Unmarried |
| Less than High School | 116 (54.2%) | 98 (45.8%) |
| High School Diploma | 330 (55.9%) | 260 (44.1%) |
| College or Associate's Degree | 596 (70.0%) | 256 (30.0%) |
| Bachelor's Degree | 413 (93.9%) | 27 (6.1%) |
| Graduate Degree | 182 (91.9%) | 16 (8.1%) |
| Total | 1,638 (71.4%) | 656 (28.6%) |
Employment Characteristics in Benton County
Employment by Class of Employer in Benton County
Among the 92,769 employed individuals in Benton County, private company employees (59,918 | 64.6%), not-for-profit organizations (7,736 | 8.3%), and local government employees (6,830 | 7.4%) make up the most common classes of employment.
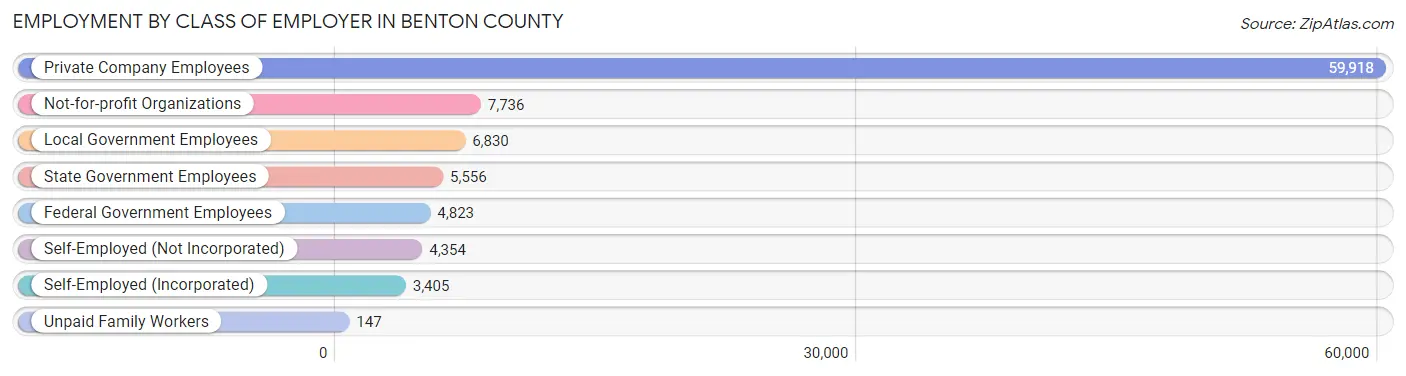
| Employer Class | # Employees | % Employees |
| Private Company Employees | 59,918 | 64.6% |
| Self-Employed (Incorporated) | 3,405 | 3.7% |
| Self-Employed (Not Incorporated) | 4,354 | 4.7% |
| Not-for-profit Organizations | 7,736 | 8.3% |
| Local Government Employees | 6,830 | 7.4% |
| State Government Employees | 5,556 | 6.0% |
| Federal Government Employees | 4,823 | 5.2% |
| Unpaid Family Workers | 147 | 0.2% |
| Total | 92,769 | 100.0% |
Employment Status by Age in Benton County
According to the labor force statistics for Benton County, out of the total population over 16 years of age (159,271), 62.5% or 99,544 individuals are in the labor force, with 4.8% or 4,778 of them unemployed. The age group with the highest labor force participation rate is 30 to 34 years, with 84.0% or 12,001 individuals in the labor force. Within the labor force, the 16 to 19 years age range has the highest percentage of unemployed individuals, with 12.9% or 593 of them being unemployed.
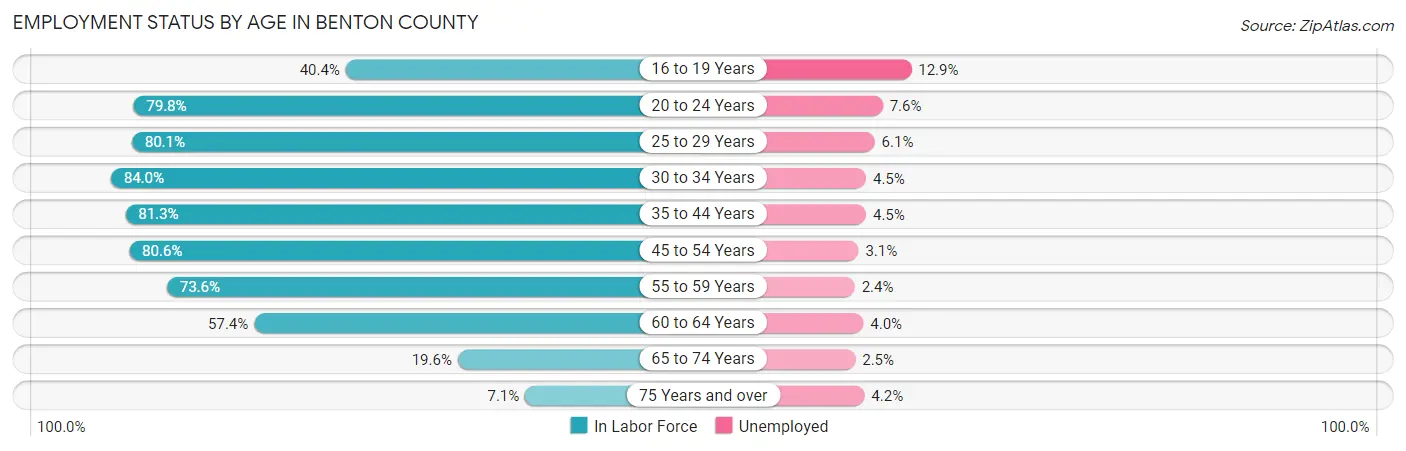
| Age Bracket | In Labor Force | Unemployed |
| 16 to 19 Years | 4,597 (40.4%) | 593 (12.9%) |
| 20 to 24 Years | 10,325 (79.8%) | 785 (7.6%) |
| 25 to 29 Years | 10,987 (80.1%) | 670 (6.1%) |
| 30 to 34 Years | 12,001 (84.0%) | 540 (4.5%) |
| 35 to 44 Years | 22,106 (81.3%) | 995 (4.5%) |
| 45 to 54 Years | 18,600 (80.6%) | 577 (3.1%) |
| 55 to 59 Years | 8,911 (73.6%) | 214 (2.4%) |
| 60 to 64 Years | 7,244 (57.4%) | 290 (4.0%) |
| 65 to 74 Years | 3,819 (19.6%) | 95 (2.5%) |
| 75 Years and over | 886 (7.1%) | 37 (4.2%) |
| Total | 99,544 (62.5%) | 4,778 (4.8%) |
Employment Status by Educational Attainment in Benton County
According to labor force statistics for Benton County, 77.5% of individuals (79,824) out of the total population between 25 and 64 years of age (102,999) are in the labor force, with 4.1% or 3,273 of them being unemployed. The group with the highest labor force participation rate are those with the educational attainment of bachelor's degree or higher, with 85.7% or 29,057 individuals in the labor force. Within the labor force, individuals with less than high school education have the highest percentage of unemployment, with 8.7% or 562 of them being unemployed.
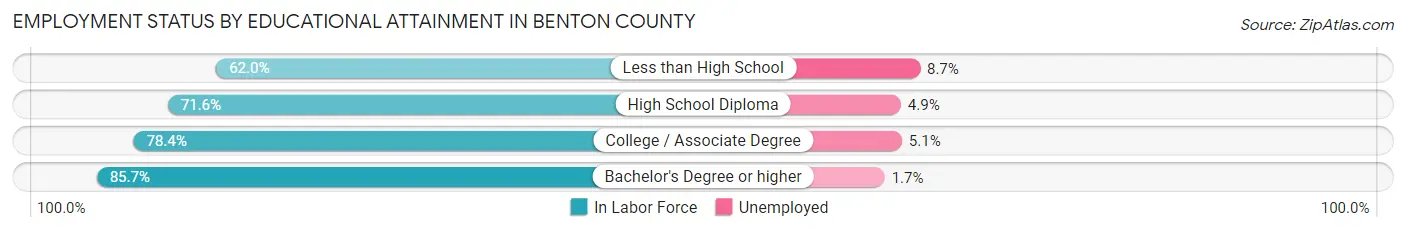
| Educational Attainment | In Labor Force | Unemployed |
| Less than High School | 6,460 (62.0%) | 906 (8.7%) |
| High School Diploma | 17,158 (71.6%) | 1,174 (4.9%) |
| College / Associate Degree | 27,214 (78.4%) | 1,770 (5.1%) |
| Bachelor's Degree or higher | 29,057 (85.7%) | 576 (1.7%) |
| Total | 79,824 (77.5%) | 4,223 (4.1%) |
Employment Occupations by Sex in Benton County
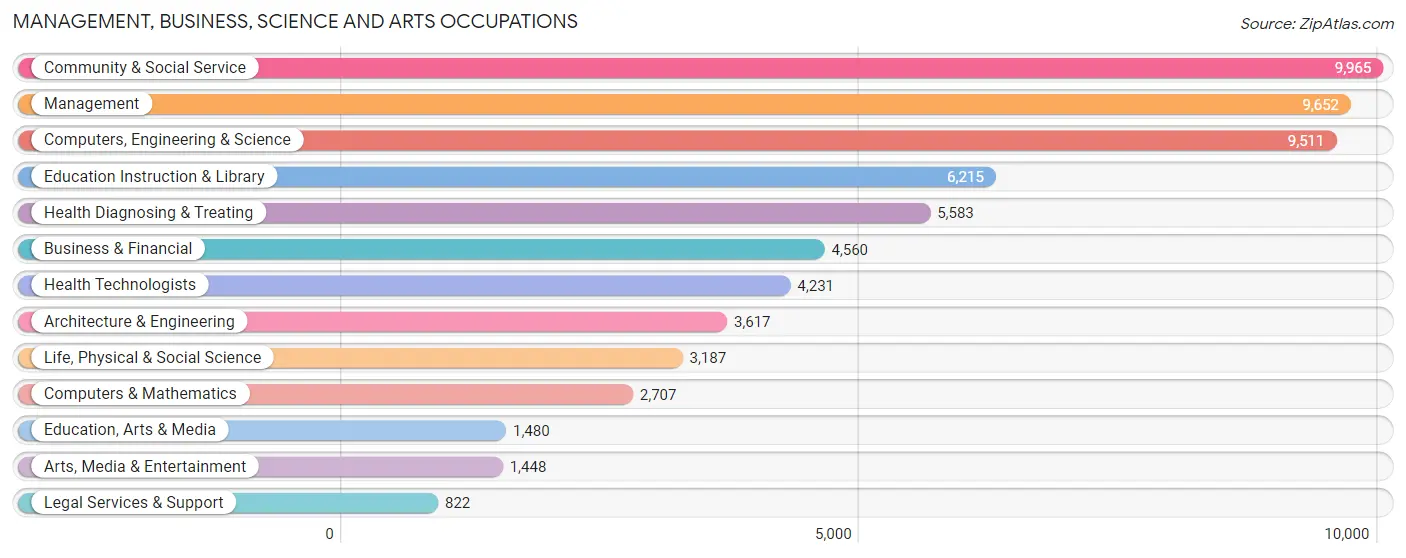
Management, Business, Science and Arts Occupations
The most common Management, Business, Science and Arts occupations in Benton County are Community & Social Service (9,965 | 10.5%), Management (9,652 | 10.2%), Computers, Engineering & Science (9,511 | 10.1%), Education Instruction & Library (6,215 | 6.6%), and Health Diagnosing & Treating (5,583 | 5.9%).
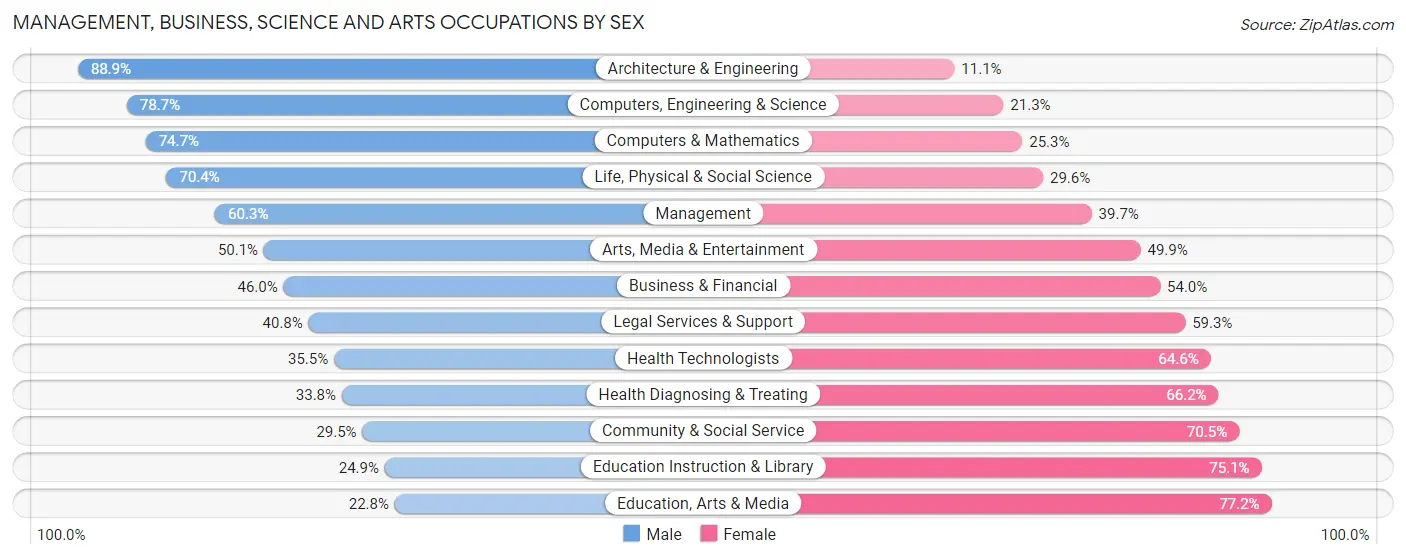
Management, Business, Science and Arts Occupations by Sex
Within the Management, Business, Science and Arts occupations in Benton County, the most male-oriented occupations are Architecture & Engineering (88.9%), Computers, Engineering & Science (78.7%), and Computers & Mathematics (74.7%), while the most female-oriented occupations are Education, Arts & Media (77.2%), Education Instruction & Library (75.1%), and Community & Social Service (70.5%).
| Occupation | Male | Female |
| Management | 5,816 (60.3%) | 3,836 (39.7%) |
| Business & Financial | 2,097 (46.0%) | 2,463 (54.0%) |
| Computers, Engineering & Science | 7,482 (78.7%) | 2,029 (21.3%) |
| Computers & Mathematics | 2,023 (74.7%) | 684 (25.3%) |
| Architecture & Engineering | 3,215 (88.9%) | 402 (11.1%) |
| Life, Physical & Social Science | 2,244 (70.4%) | 943 (29.6%) |
| Community & Social Service | 2,942 (29.5%) | 7,023 (70.5%) |
| Education, Arts & Media | 337 (22.8%) | 1,143 (77.2%) |
| Legal Services & Support | 335 (40.7%) | 487 (59.3%) |
| Education Instruction & Library | 1,545 (24.9%) | 4,670 (75.1%) |
| Arts, Media & Entertainment | 725 (50.1%) | 723 (49.9%) |
| Health Diagnosing & Treating | 1,888 (33.8%) | 3,695 (66.2%) |
| Health Technologists | 1,500 (35.4%) | 2,731 (64.5%) |
| Total (Category) | 20,225 (51.5%) | 19,046 (48.5%) |
| Total (Overall) | 51,826 (54.9%) | 42,598 (45.1%) |
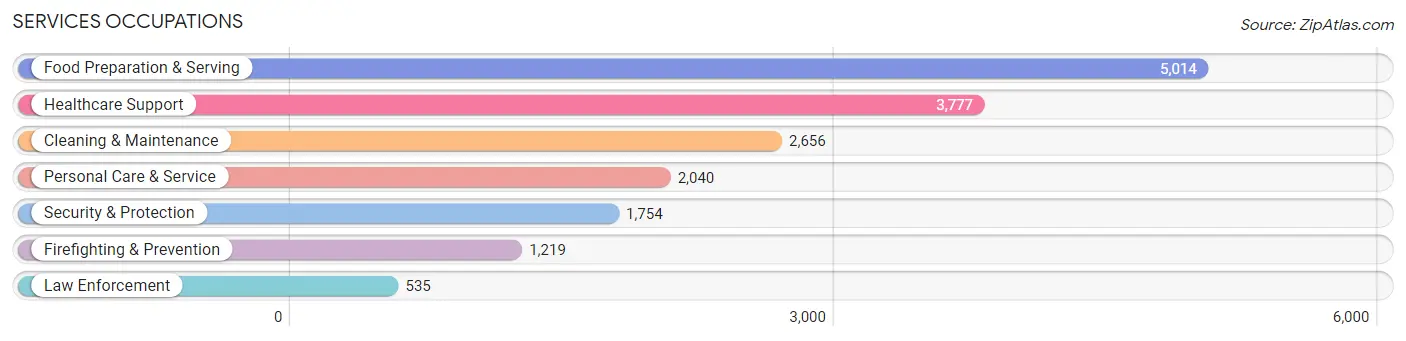
Services Occupations
The most common Services occupations in Benton County are Food Preparation & Serving (5,014 | 5.3%), Healthcare Support (3,777 | 4.0%), Cleaning & Maintenance (2,656 | 2.8%), Personal Care & Service (2,040 | 2.2%), and Security & Protection (1,754 | 1.9%).
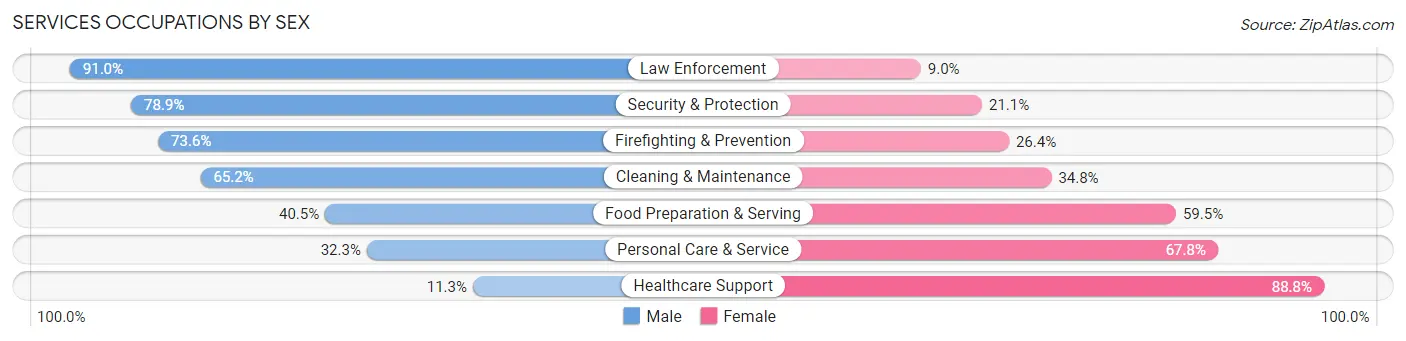
Services Occupations by Sex
Within the Services occupations in Benton County, the most male-oriented occupations are Law Enforcement (91.0%), Security & Protection (78.9%), and Firefighting & Prevention (73.6%), while the most female-oriented occupations are Healthcare Support (88.7%), Personal Care & Service (67.7%), and Food Preparation & Serving (59.5%).
| Occupation | Male | Female |
| Healthcare Support | 425 (11.3%) | 3,352 (88.7%) |
| Security & Protection | 1,384 (78.9%) | 370 (21.1%) |
| Firefighting & Prevention | 897 (73.6%) | 322 (26.4%) |
| Law Enforcement | 487 (91.0%) | 48 (9.0%) |
| Food Preparation & Serving | 2,031 (40.5%) | 2,983 (59.5%) |
| Cleaning & Maintenance | 1,731 (65.2%) | 925 (34.8%) |
| Personal Care & Service | 658 (32.3%) | 1,382 (67.7%) |
| Total (Category) | 6,229 (40.9%) | 9,012 (59.1%) |
| Total (Overall) | 51,826 (54.9%) | 42,598 (45.1%) |
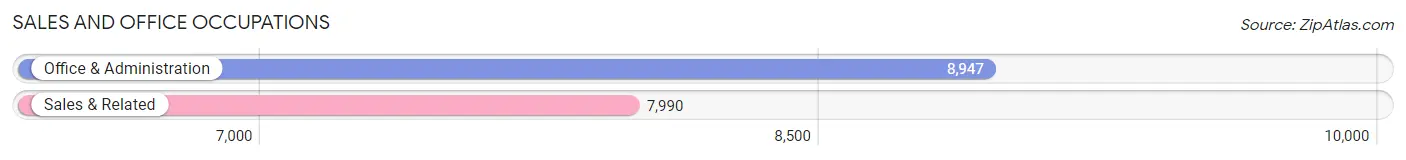
Sales and Office Occupations
The most common Sales and Office occupations in Benton County are Office & Administration (8,947 | 9.5%), and Sales & Related (7,990 | 8.5%).
Sales and Office Occupations by Sex
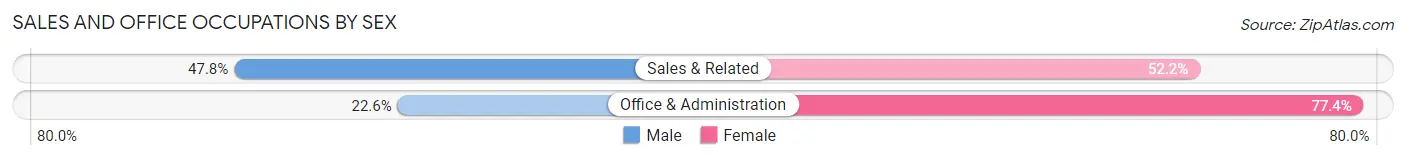
| Occupation | Male | Female |
| Sales & Related | 3,817 (47.8%) | 4,173 (52.2%) |
| Office & Administration | 2,024 (22.6%) | 6,923 (77.4%) |
| Total (Category) | 5,841 (34.5%) | 11,096 (65.5%) |
| Total (Overall) | 51,826 (54.9%) | 42,598 (45.1%) |
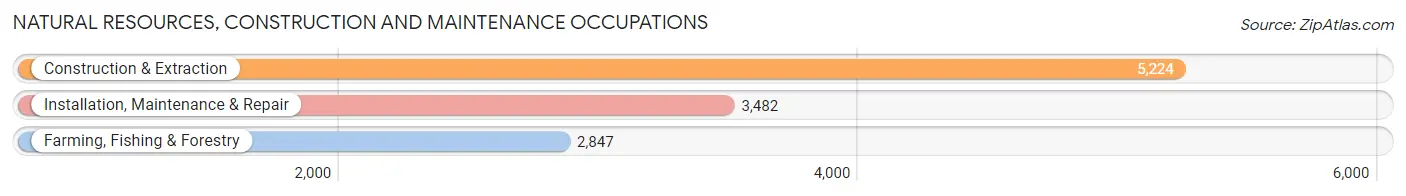
Natural Resources, Construction and Maintenance Occupations
The most common Natural Resources, Construction and Maintenance occupations in Benton County are Construction & Extraction (5,224 | 5.5%), Installation, Maintenance & Repair (3,482 | 3.7%), and Farming, Fishing & Forestry (2,847 | 3.0%).
Natural Resources, Construction and Maintenance Occupations by Sex
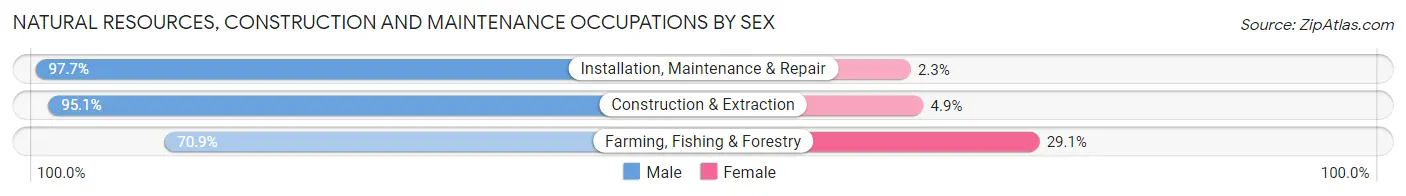
| Occupation | Male | Female |
| Farming, Fishing & Forestry | 2,019 (70.9%) | 828 (29.1%) |
| Construction & Extraction | 4,966 (95.1%) | 258 (4.9%) |
| Installation, Maintenance & Repair | 3,402 (97.7%) | 80 (2.3%) |
| Total (Category) | 10,387 (89.9%) | 1,166 (10.1%) |
| Total (Overall) | 51,826 (54.9%) | 42,598 (45.1%) |
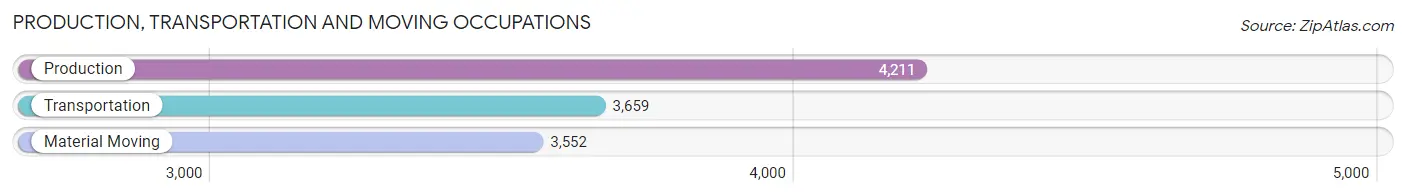
Production, Transportation and Moving Occupations
The most common Production, Transportation and Moving occupations in Benton County are Production (4,211 | 4.5%), Transportation (3,659 | 3.9%), and Material Moving (3,552 | 3.8%).
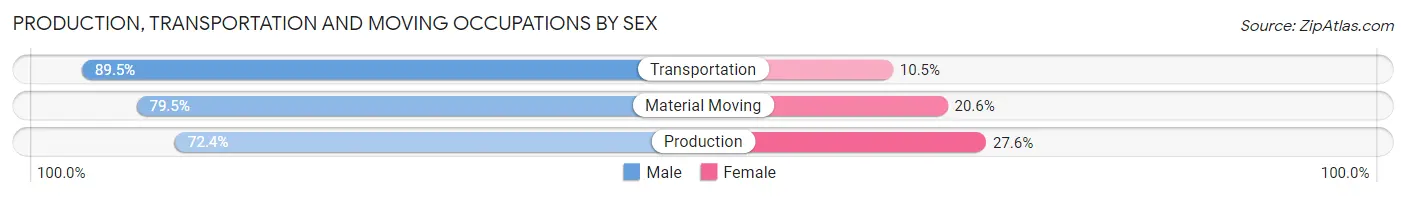
Production, Transportation and Moving Occupations by Sex
| Occupation | Male | Female |
| Production | 3,048 (72.4%) | 1,163 (27.6%) |
| Transportation | 3,274 (89.5%) | 385 (10.5%) |
| Material Moving | 2,822 (79.4%) | 730 (20.5%) |
| Total (Category) | 9,144 (80.1%) | 2,278 (19.9%) |
| Total (Overall) | 51,826 (54.9%) | 42,598 (45.1%) |
Employment Industries by Sex in Benton County
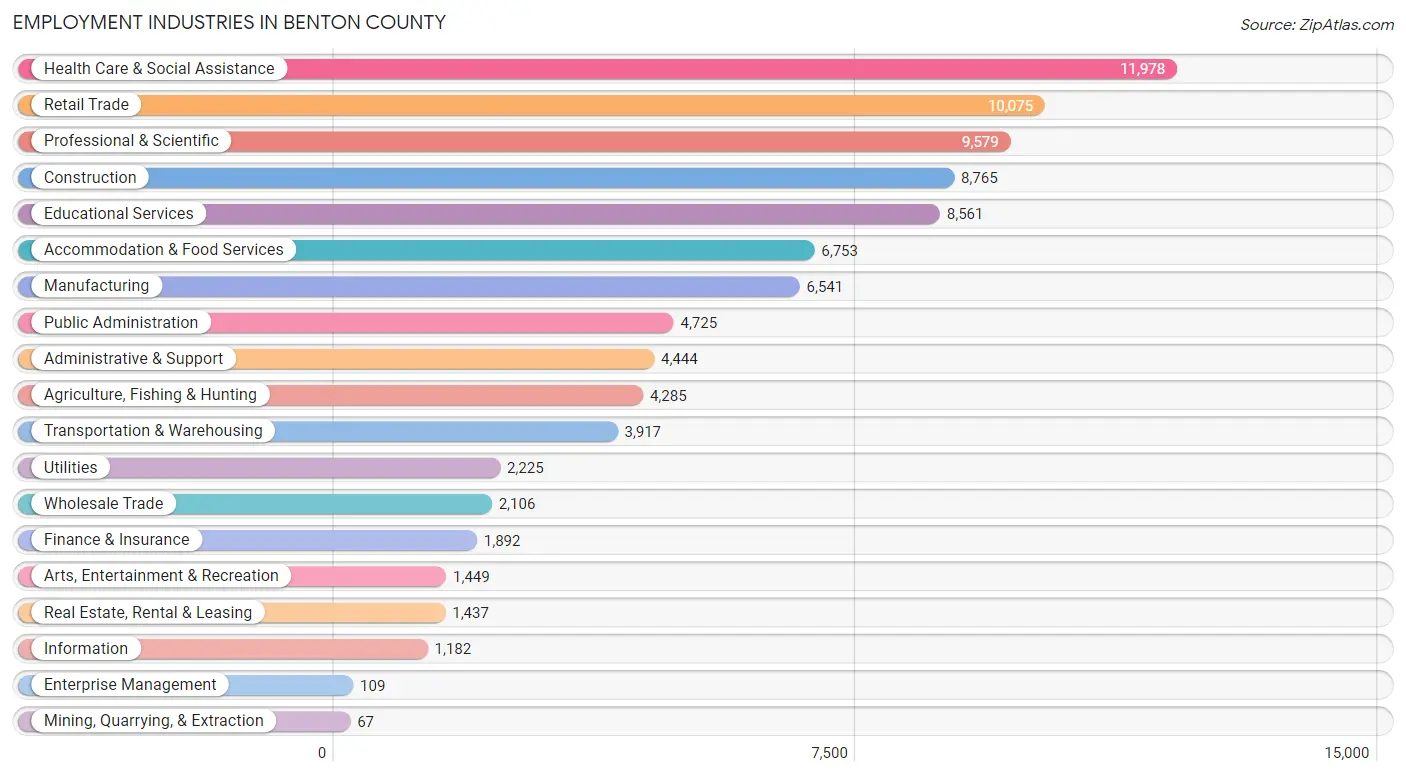
Employment Industries in Benton County
The major employment industries in Benton County include Health Care & Social Assistance (11,978 | 12.7%), Retail Trade (10,075 | 10.7%), Professional & Scientific (9,579 | 10.1%), Construction (8,765 | 9.3%), and Educational Services (8,561 | 9.1%).
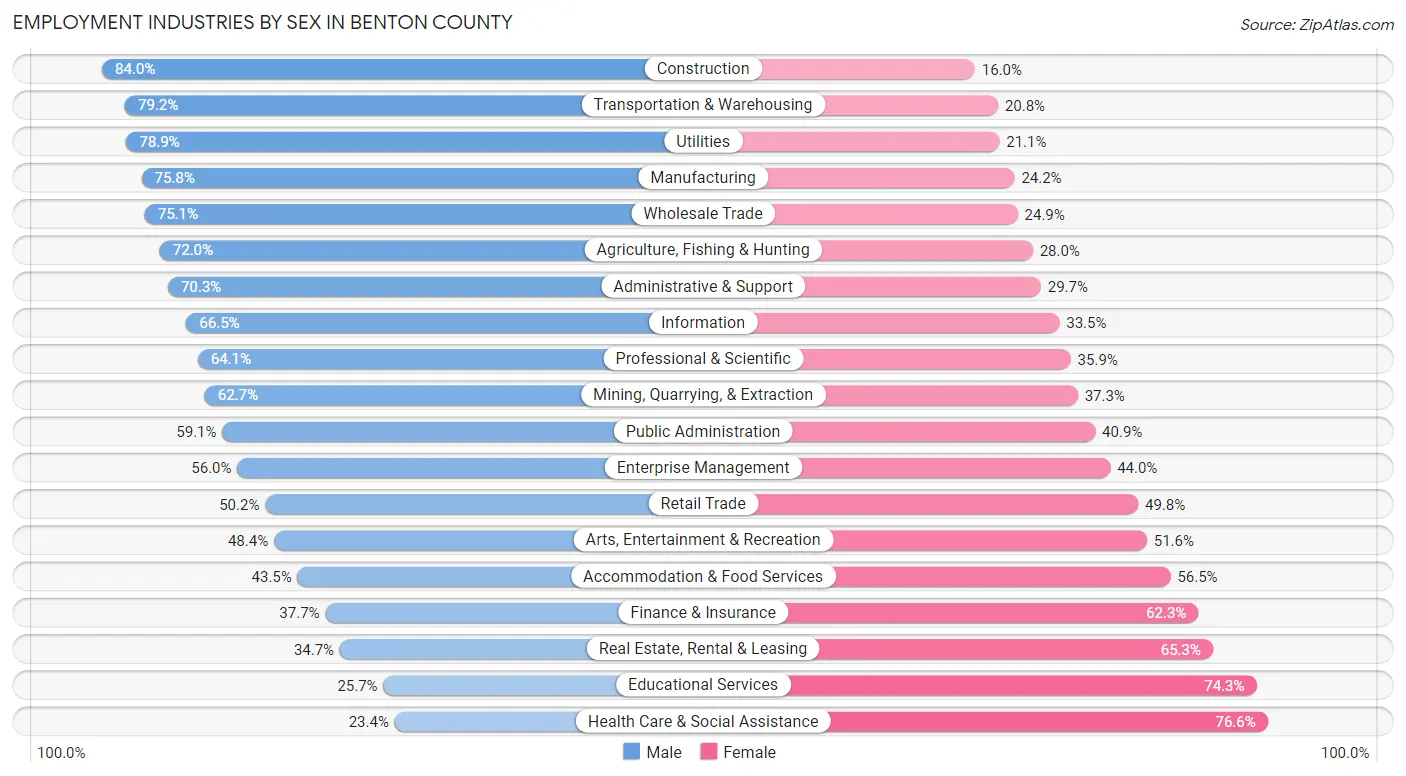
Employment Industries by Sex in Benton County
The Benton County industries that see more men than women are Construction (84.0%), Transportation & Warehousing (79.2%), and Utilities (78.9%), whereas the industries that tend to have a higher number of women are Health Care & Social Assistance (76.6%), Educational Services (74.3%), and Real Estate, Rental & Leasing (65.3%).
| Industry | Male | Female |
| Agriculture, Fishing & Hunting | 3,085 (72.0%) | 1,200 (28.0%) |
| Mining, Quarrying, & Extraction | 42 (62.7%) | 25 (37.3%) |
| Construction | 7,360 (84.0%) | 1,405 (16.0%) |
| Manufacturing | 4,957 (75.8%) | 1,584 (24.2%) |
| Wholesale Trade | 1,582 (75.1%) | 524 (24.9%) |
| Retail Trade | 5,057 (50.2%) | 5,018 (49.8%) |
| Transportation & Warehousing | 3,102 (79.2%) | 815 (20.8%) |
| Utilities | 1,756 (78.9%) | 469 (21.1%) |
| Information | 786 (66.5%) | 396 (33.5%) |
| Finance & Insurance | 714 (37.7%) | 1,178 (62.3%) |
| Real Estate, Rental & Leasing | 499 (34.7%) | 938 (65.3%) |
| Professional & Scientific | 6,144 (64.1%) | 3,435 (35.9%) |
| Enterprise Management | 61 (56.0%) | 48 (44.0%) |
| Administrative & Support | 3,125 (70.3%) | 1,319 (29.7%) |
| Educational Services | 2,202 (25.7%) | 6,359 (74.3%) |
| Health Care & Social Assistance | 2,802 (23.4%) | 9,176 (76.6%) |
| Arts, Entertainment & Recreation | 701 (48.4%) | 748 (51.6%) |
| Accommodation & Food Services | 2,937 (43.5%) | 3,816 (56.5%) |
| Public Administration | 2,791 (59.1%) | 1,934 (40.9%) |
| Total | 51,826 (54.9%) | 42,598 (45.1%) |
Education in Benton County
School Enrollment in Benton County
The most common levels of schooling among the 53,279 students in Benton County are high school (12,579 | 23.6%), elementary school (12,357 | 23.2%), and middle school (12,082 | 22.7%).
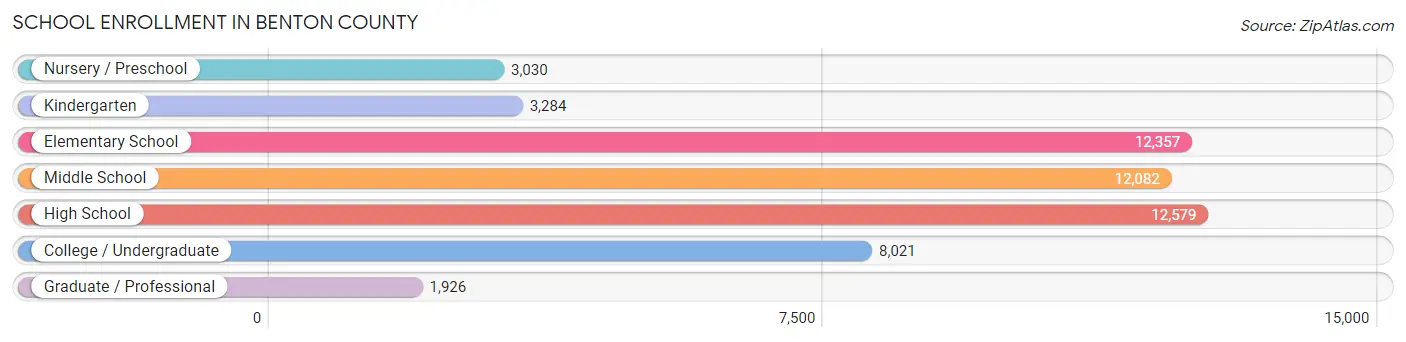
| School Level | # Students | % Students |
| Nursery / Preschool | 3,030 | 5.7% |
| Kindergarten | 3,284 | 6.2% |
| Elementary School | 12,357 | 23.2% |
| Middle School | 12,082 | 22.7% |
| High School | 12,579 | 23.6% |
| College / Undergraduate | 8,021 | 15.0% |
| Graduate / Professional | 1,926 | 3.6% |
| Total | 53,279 | 100.0% |
School Enrollment by Age by Funding Source in Benton County
Out of a total of 53,279 students who are enrolled in schools in Benton County, 6,660 (12.5%) attend a private institution, while the remaining 46,619 (87.5%) are enrolled in public schools. The age group of 3 to 4 year olds has the highest likelihood of being enrolled in private schools, with 1,017 (50.8% in the age bracket) enrolled. Conversely, the age group of 15 to 17 year olds has the lowest likelihood of being enrolled in a private school, with 8,593 (94.4% in the age bracket) attending a public institution.
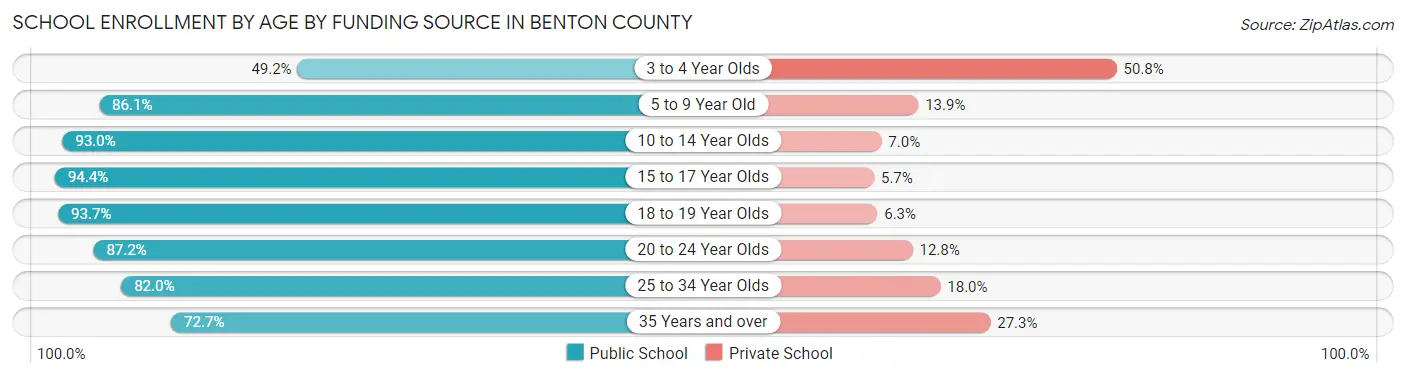
| Age Bracket | Public School | Private School |
| 3 to 4 Year Olds | 984 (49.2%) | 1,017 (50.8%) |
| 5 to 9 Year Old | 13,115 (86.1%) | 2,115 (13.9%) |
| 10 to 14 Year Olds | 13,676 (93.0%) | 1,034 (7.0%) |
| 15 to 17 Year Olds | 8,593 (94.4%) | 515 (5.7%) |
| 18 to 19 Year Olds | 2,649 (93.7%) | 177 (6.3%) |
| 20 to 24 Year Olds | 3,078 (87.2%) | 453 (12.8%) |
| 25 to 34 Year Olds | 2,450 (82.0%) | 538 (18.0%) |
| 35 Years and over | 2,097 (72.7%) | 788 (27.3%) |
| Total | 46,619 (87.5%) | 6,660 (12.5%) |
Educational Attainment by Field of Study in Benton County
Business (7,140 | 15.0%), engineering (5,779 | 12.2%), education (5,640 | 11.9%), science & technology (4,735 | 10.0%), and bio, nature & agricultural (4,218 | 8.9%) are the most common fields of study among 47,528 individuals in Benton County who have obtained a bachelor's degree or higher.
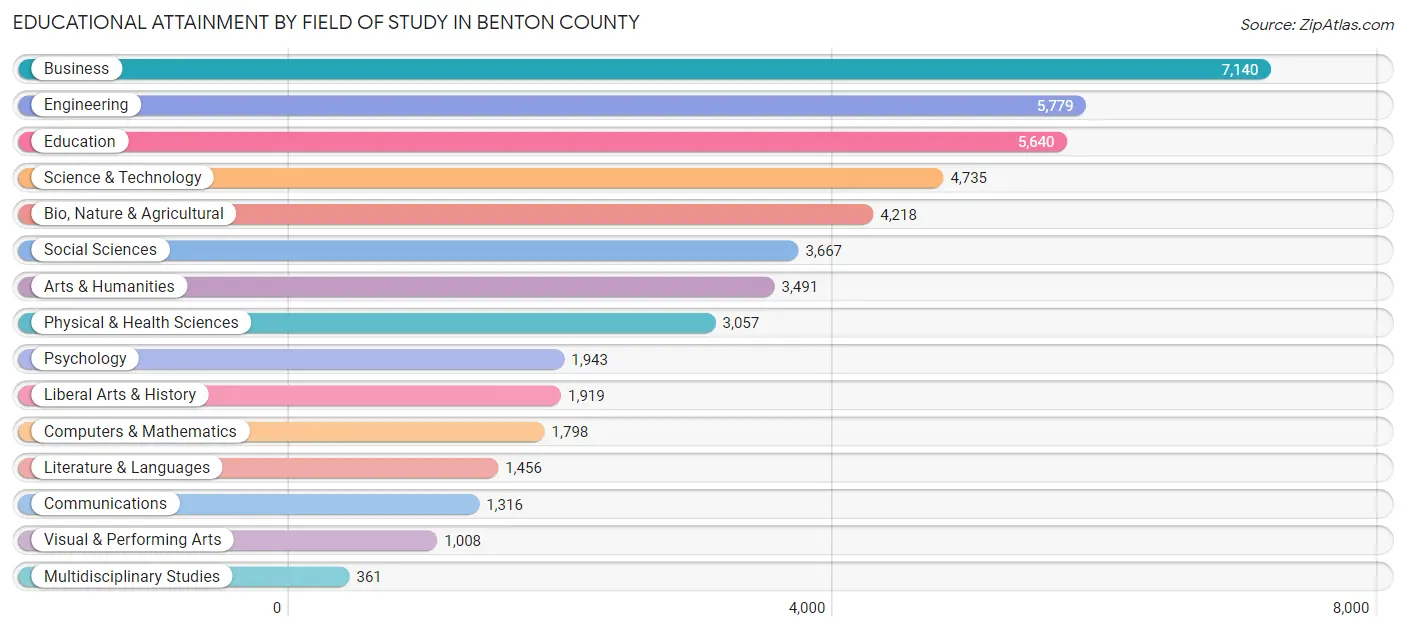
| Field of Study | # Graduates | % Graduates |
| Computers & Mathematics | 1,798 | 3.8% |
| Bio, Nature & Agricultural | 4,218 | 8.9% |
| Physical & Health Sciences | 3,057 | 6.4% |
| Psychology | 1,943 | 4.1% |
| Social Sciences | 3,667 | 7.7% |
| Engineering | 5,779 | 12.2% |
| Multidisciplinary Studies | 361 | 0.8% |
| Science & Technology | 4,735 | 10.0% |
| Business | 7,140 | 15.0% |
| Education | 5,640 | 11.9% |
| Literature & Languages | 1,456 | 3.1% |
| Liberal Arts & History | 1,919 | 4.0% |
| Visual & Performing Arts | 1,008 | 2.1% |
| Communications | 1,316 | 2.8% |
| Arts & Humanities | 3,491 | 7.3% |
| Total | 47,528 | 100.0% |
Transportation & Commute in Benton County
Vehicle Availability by Sex in Benton County
The most prevalent vehicle ownership categories in Benton County are males with 2 vehicles (19,137, accounting for 37.9%) and females with 2 vehicles (14,566, making up 45.7%).
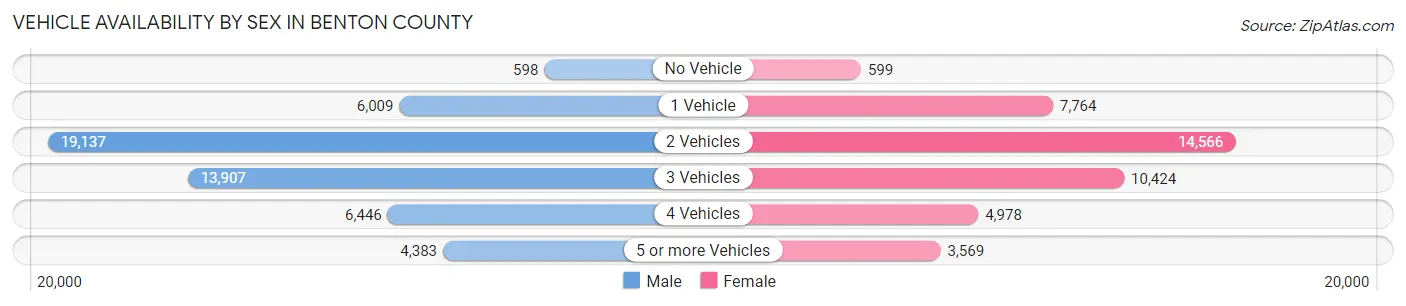
| Vehicles Available | Male | Female |
| No Vehicle | 598 (1.2%) | 599 (1.4%) |
| 1 Vehicle | 6,009 (11.9%) | 7,764 (18.5%) |
| 2 Vehicles | 19,137 (37.9%) | 14,566 (34.8%) |
| 3 Vehicles | 13,907 (27.6%) | 10,424 (24.9%) |
| 4 Vehicles | 6,446 (12.8%) | 4,978 (11.9%) |
| 5 or more Vehicles | 4,383 (8.7%) | 3,569 (8.5%) |
| Total | 50,480 (100.0%) | 41,900 (100.0%) |
Commute Time in Benton County
The most frequently occuring commute durations in Benton County are 15 to 19 minutes (16,177 commuters, 19.4%), 10 to 14 minutes (15,241 commuters, 18.2%), and 20 to 24 minutes (13,650 commuters, 16.4%).
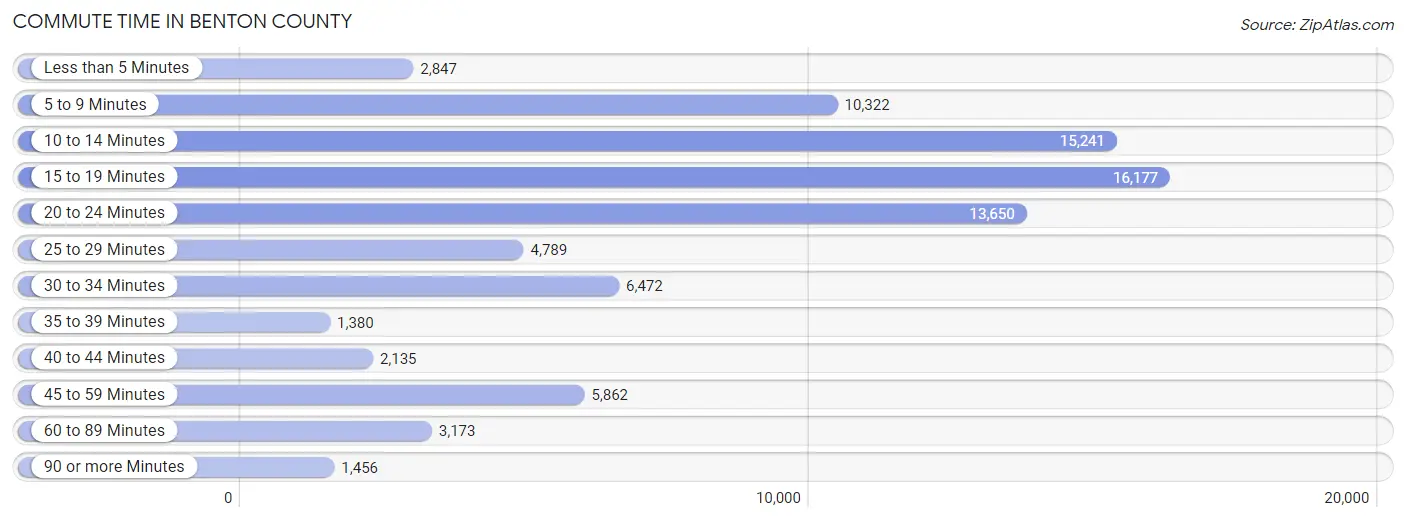
| Commute Time | # Commuters | % Commuters |
| Less than 5 Minutes | 2,847 | 3.4% |
| 5 to 9 Minutes | 10,322 | 12.4% |
| 10 to 14 Minutes | 15,241 | 18.2% |
| 15 to 19 Minutes | 16,177 | 19.4% |
| 20 to 24 Minutes | 13,650 | 16.4% |
| 25 to 29 Minutes | 4,789 | 5.7% |
| 30 to 34 Minutes | 6,472 | 7.7% |
| 35 to 39 Minutes | 1,380 | 1.7% |
| 40 to 44 Minutes | 2,135 | 2.6% |
| 45 to 59 Minutes | 5,862 | 7.0% |
| 60 to 89 Minutes | 3,173 | 3.8% |
| 90 or more Minutes | 1,456 | 1.7% |
Commute Time by Sex in Benton County
The most common commute times in Benton County are 15 to 19 minutes (8,162 commuters, 17.6%) for males and 15 to 19 minutes (8,015 commuters, 21.6%) for females.
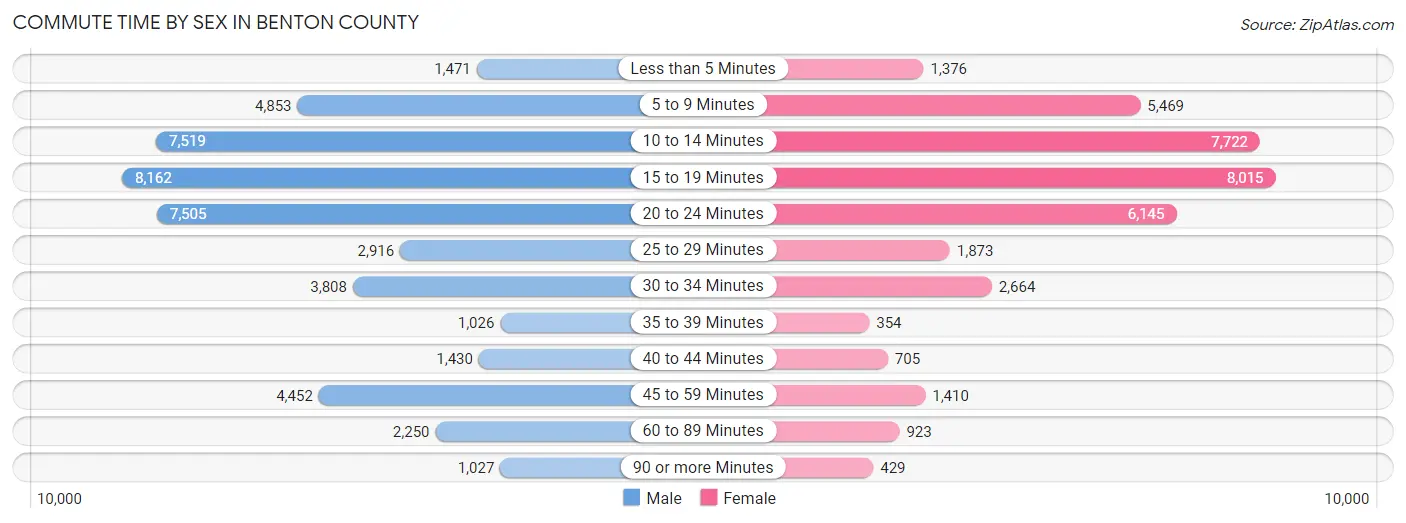
| Commute Time | Male | Female |
| Less than 5 Minutes | 1,471 (3.2%) | 1,376 (3.7%) |
| 5 to 9 Minutes | 4,853 (10.4%) | 5,469 (14.7%) |
| 10 to 14 Minutes | 7,519 (16.2%) | 7,722 (20.8%) |
| 15 to 19 Minutes | 8,162 (17.6%) | 8,015 (21.6%) |
| 20 to 24 Minutes | 7,505 (16.2%) | 6,145 (16.6%) |
| 25 to 29 Minutes | 2,916 (6.3%) | 1,873 (5.1%) |
| 30 to 34 Minutes | 3,808 (8.2%) | 2,664 (7.2%) |
| 35 to 39 Minutes | 1,026 (2.2%) | 354 (0.9%) |
| 40 to 44 Minutes | 1,430 (3.1%) | 705 (1.9%) |
| 45 to 59 Minutes | 4,452 (9.6%) | 1,410 (3.8%) |
| 60 to 89 Minutes | 2,250 (4.9%) | 923 (2.5%) |
| 90 or more Minutes | 1,027 (2.2%) | 429 (1.2%) |
Time of Departure to Work by Sex in Benton County
The most frequent times of departure to work in Benton County are 7:00 AM to 7:29 AM (5,933, 12.8%) for males and 7:30 AM to 7:59 AM (5,640, 15.2%) for females.
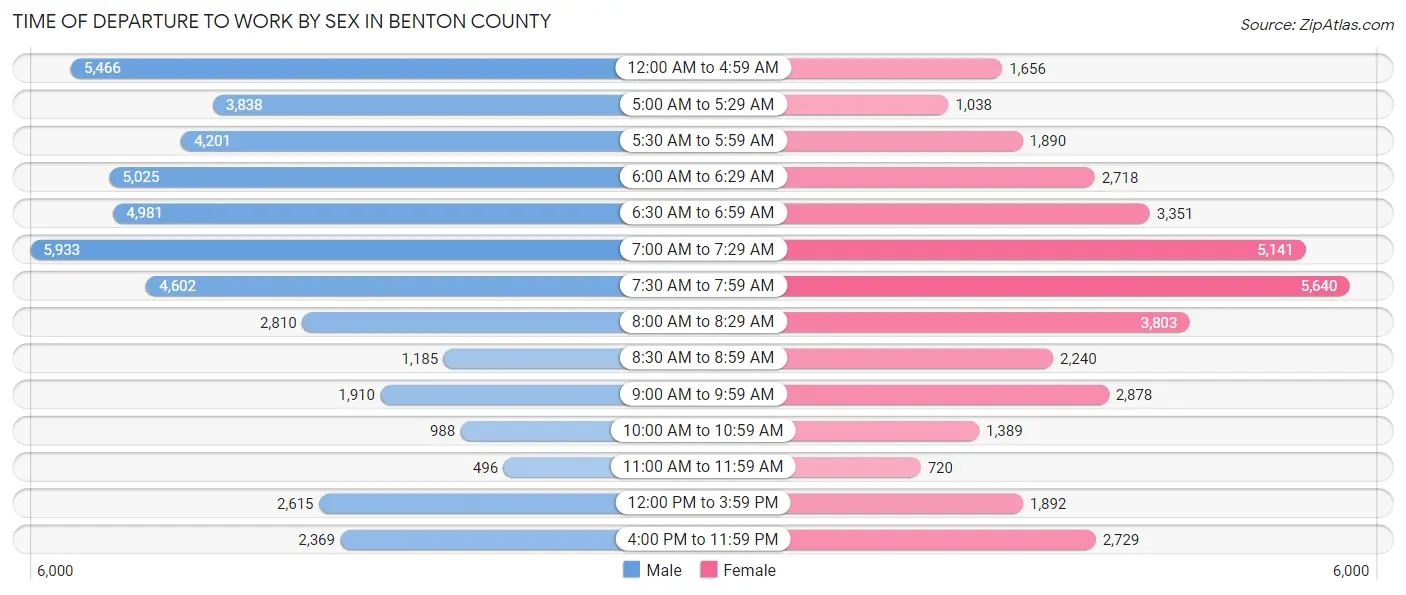
| Time of Departure | Male | Female |
| 12:00 AM to 4:59 AM | 5,466 (11.8%) | 1,656 (4.5%) |
| 5:00 AM to 5:29 AM | 3,838 (8.3%) | 1,038 (2.8%) |
| 5:30 AM to 5:59 AM | 4,201 (9.0%) | 1,890 (5.1%) |
| 6:00 AM to 6:29 AM | 5,025 (10.8%) | 2,718 (7.3%) |
| 6:30 AM to 6:59 AM | 4,981 (10.7%) | 3,351 (9.0%) |
| 7:00 AM to 7:29 AM | 5,933 (12.8%) | 5,141 (13.9%) |
| 7:30 AM to 7:59 AM | 4,602 (9.9%) | 5,640 (15.2%) |
| 8:00 AM to 8:29 AM | 2,810 (6.0%) | 3,803 (10.2%) |
| 8:30 AM to 8:59 AM | 1,185 (2.5%) | 2,240 (6.0%) |
| 9:00 AM to 9:59 AM | 1,910 (4.1%) | 2,878 (7.8%) |
| 10:00 AM to 10:59 AM | 988 (2.1%) | 1,389 (3.7%) |
| 11:00 AM to 11:59 AM | 496 (1.1%) | 720 (1.9%) |
| 12:00 PM to 3:59 PM | 2,615 (5.6%) | 1,892 (5.1%) |
| 4:00 PM to 11:59 PM | 2,369 (5.1%) | 2,729 (7.4%) |
| Total | 46,419 (100.0%) | 37,085 (100.0%) |
Housing Occupancy in Benton County
Occupancy by Ownership in Benton County
Of the total 75,509 dwellings in Benton County, owner-occupied units account for 51,384 (68.0%), while renter-occupied units make up 24,125 (32.0%).
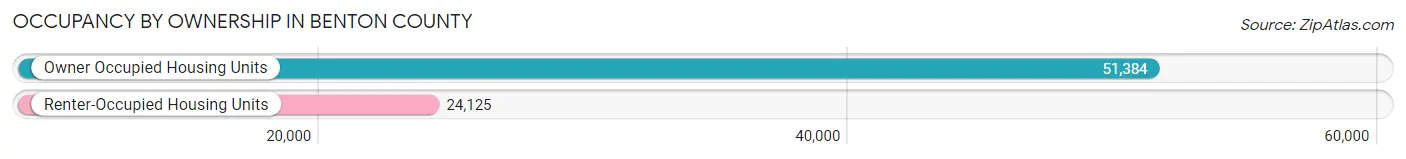
| Occupancy | # Housing Units | % Housing Units |
| Owner Occupied Housing Units | 51,384 | 68.0% |
| Renter-Occupied Housing Units | 24,125 | 32.0% |
| Total Occupied Housing Units | 75,509 | 100.0% |
Occupancy by Household Size in Benton County
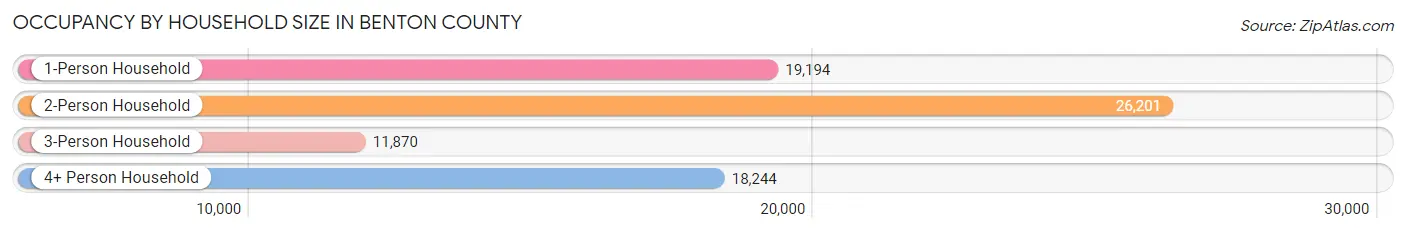
| Household Size | # Housing Units | % Housing Units |
| 1-Person Household | 19,194 | 25.4% |
| 2-Person Household | 26,201 | 34.7% |
| 3-Person Household | 11,870 | 15.7% |
| 4+ Person Household | 18,244 | 24.2% |
| Total Housing Units | 75,509 | 100.0% |
Occupancy by Ownership by Household Size in Benton County
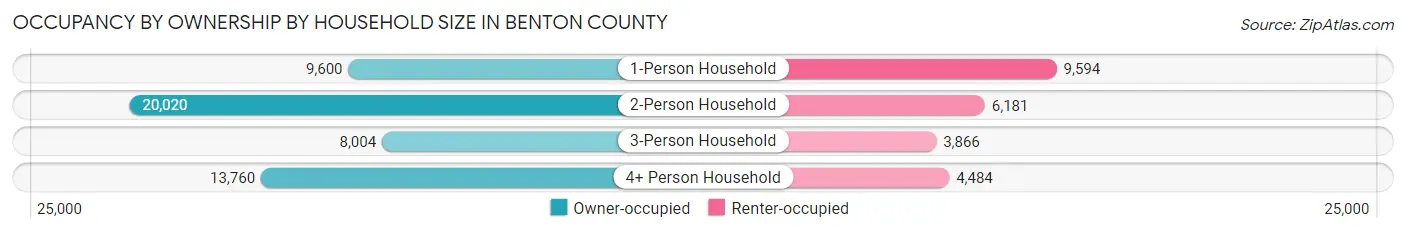
| Household Size | Owner-occupied | Renter-occupied |
| 1-Person Household | 9,600 (50.0%) | 9,594 (50.0%) |
| 2-Person Household | 20,020 (76.4%) | 6,181 (23.6%) |
| 3-Person Household | 8,004 (67.4%) | 3,866 (32.6%) |
| 4+ Person Household | 13,760 (75.4%) | 4,484 (24.6%) |
| Total Housing Units | 51,384 (68.0%) | 24,125 (32.0%) |
Occupancy by Educational Attainment in Benton County
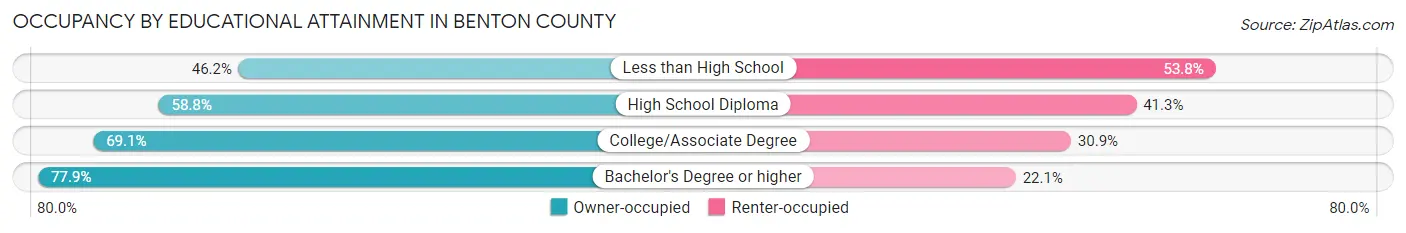
| Household Size | Owner-occupied | Renter-occupied |
| Less than High School | 3,125 (46.2%) | 3,642 (53.8%) |
| High School Diploma | 8,905 (58.8%) | 6,253 (41.2%) |
| College/Associate Degree | 18,703 (69.1%) | 8,361 (30.9%) |
| Bachelor's Degree or higher | 20,651 (77.9%) | 5,869 (22.1%) |
Occupancy by Age of Householder in Benton County
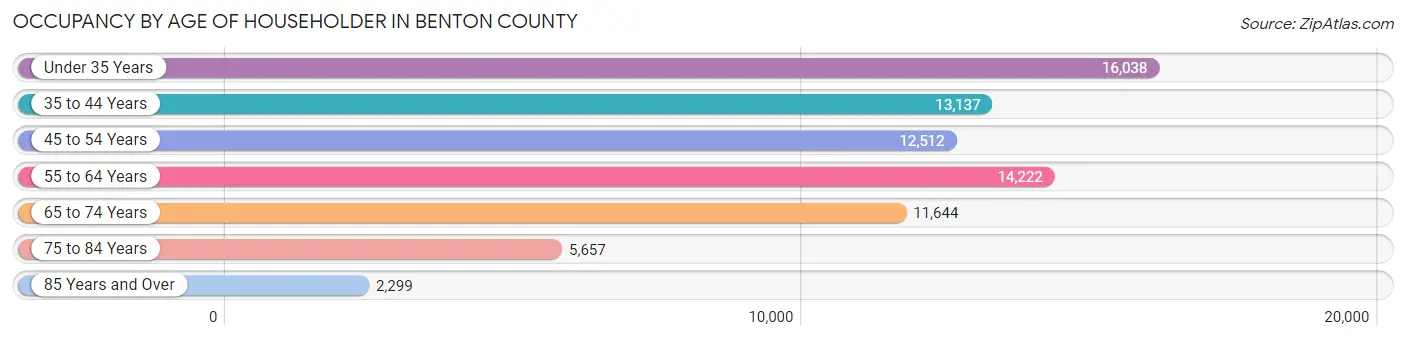
| Age Bracket | # Households | % Households |
| Under 35 Years | 16,038 | 21.2% |
| 35 to 44 Years | 13,137 | 17.4% |
| 45 to 54 Years | 12,512 | 16.6% |
| 55 to 64 Years | 14,222 | 18.8% |
| 65 to 74 Years | 11,644 | 15.4% |
| 75 to 84 Years | 5,657 | 7.5% |
| 85 Years and Over | 2,299 | 3.0% |
| Total | 75,509 | 100.0% |
Housing Finances in Benton County
Median Income by Occupancy in Benton County
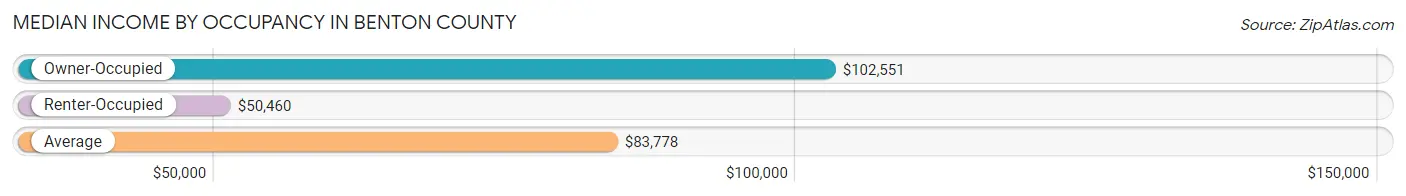
| Occupancy Type | # Households | Median Income |
| Owner-Occupied | 51,384 (68.0%) | $102,551 |
| Renter-Occupied | 24,125 (32.0%) | $50,460 |
| Average | 75,509 (100.0%) | $83,778 |
Occupancy by Householder Income Bracket in Benton County
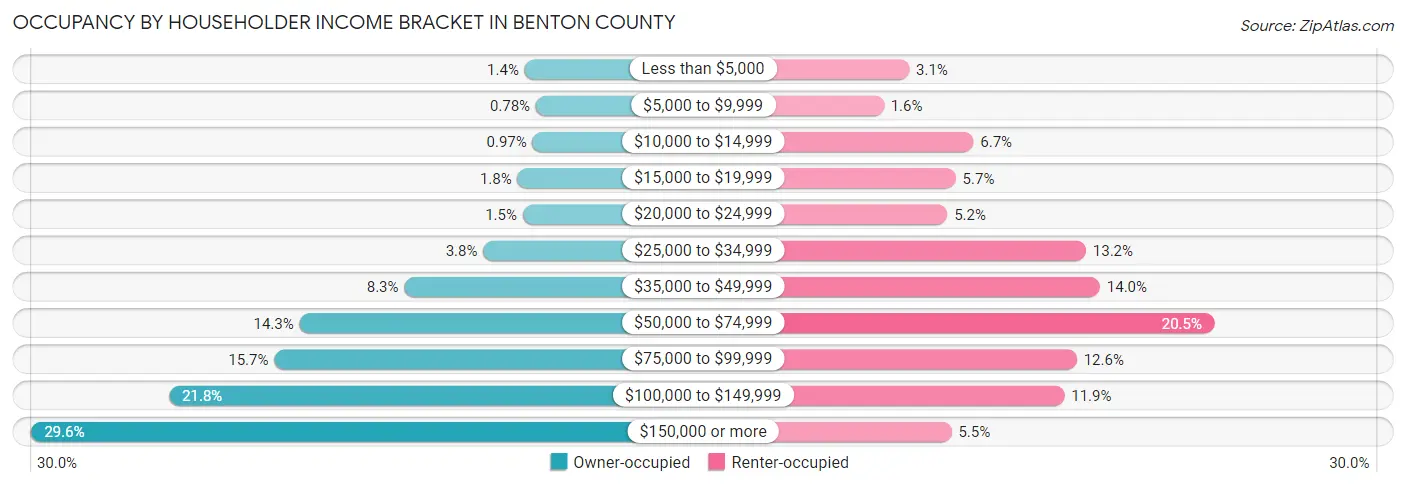
| Income Bracket | Owner-occupied | Renter-occupied |
| Less than $5,000 | 729 (1.4%) | 739 (3.1%) |
| $5,000 to $9,999 | 399 (0.8%) | 389 (1.6%) |
| $10,000 to $14,999 | 498 (1.0%) | 1,623 (6.7%) |
| $15,000 to $19,999 | 940 (1.8%) | 1,379 (5.7%) |
| $20,000 to $24,999 | 788 (1.5%) | 1,265 (5.2%) |
| $25,000 to $34,999 | 1,948 (3.8%) | 3,174 (13.2%) |
| $35,000 to $49,999 | 4,263 (8.3%) | 3,367 (14.0%) |
| $50,000 to $74,999 | 7,341 (14.3%) | 4,939 (20.5%) |
| $75,000 to $99,999 | 8,081 (15.7%) | 3,050 (12.6%) |
| $100,000 to $149,999 | 11,178 (21.7%) | 2,877 (11.9%) |
| $150,000 or more | 15,219 (29.6%) | 1,323 (5.5%) |
| Total | 51,384 (100.0%) | 24,125 (100.0%) |
Monthly Housing Cost Tiers in Benton County
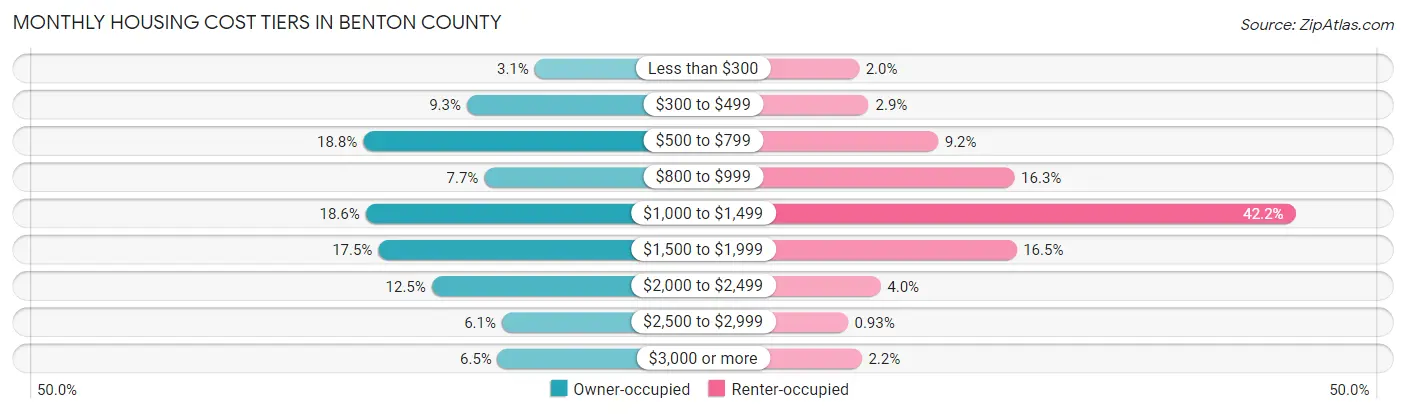
| Monthly Cost | Owner-occupied | Renter-occupied |
| Less than $300 | 1,569 (3.0%) | 472 (2.0%) |
| $300 to $499 | 4,776 (9.3%) | 693 (2.9%) |
| $500 to $799 | 9,681 (18.8%) | 2,229 (9.2%) |
| $800 to $999 | 3,953 (7.7%) | 3,926 (16.3%) |
| $1,000 to $1,499 | 9,565 (18.6%) | 10,172 (42.2%) |
| $1,500 to $1,999 | 8,968 (17.4%) | 3,970 (16.5%) |
| $2,000 to $2,499 | 6,436 (12.5%) | 954 (4.0%) |
| $2,500 to $2,999 | 3,120 (6.1%) | 224 (0.9%) |
| $3,000 or more | 3,316 (6.5%) | 534 (2.2%) |
| Total | 51,384 (100.0%) | 24,125 (100.0%) |
Physical Housing Characteristics in Benton County
Housing Structures in Benton County
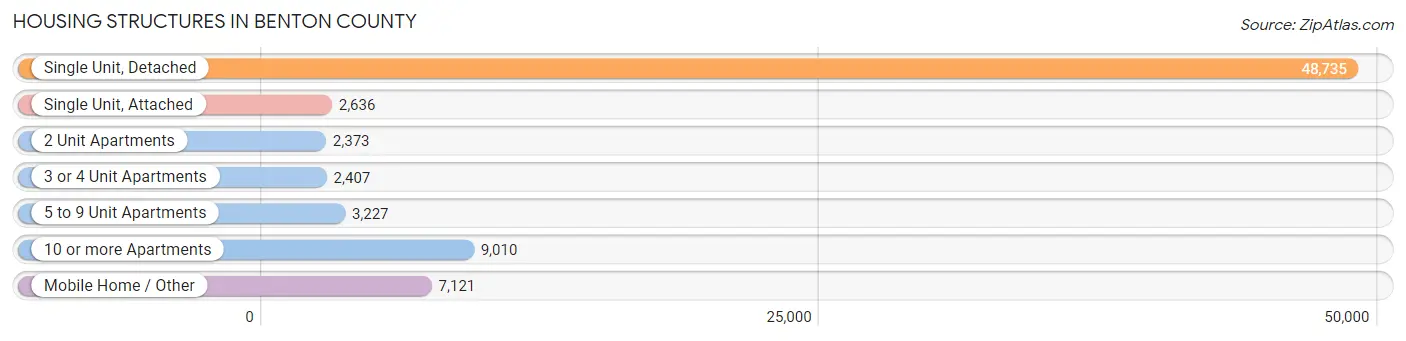
| Structure Type | # Housing Units | % Housing Units |
| Single Unit, Detached | 48,735 | 64.5% |
| Single Unit, Attached | 2,636 | 3.5% |
| 2 Unit Apartments | 2,373 | 3.1% |
| 3 or 4 Unit Apartments | 2,407 | 3.2% |
| 5 to 9 Unit Apartments | 3,227 | 4.3% |
| 10 or more Apartments | 9,010 | 11.9% |
| Mobile Home / Other | 7,121 | 9.4% |
| Total | 75,509 | 100.0% |
Housing Structures by Occupancy in Benton County
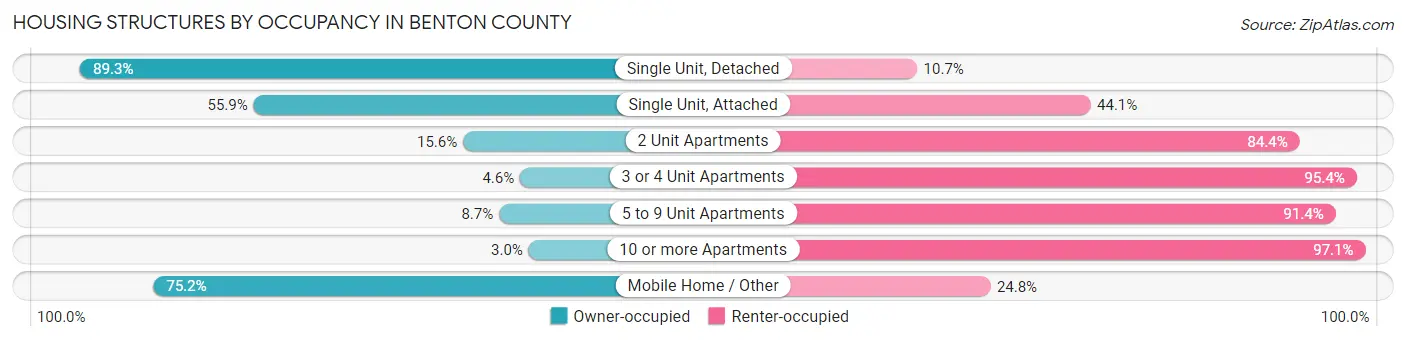
| Structure Type | Owner-occupied | Renter-occupied |
| Single Unit, Detached | 43,528 (89.3%) | 5,207 (10.7%) |
| Single Unit, Attached | 1,474 (55.9%) | 1,162 (44.1%) |
| 2 Unit Apartments | 370 (15.6%) | 2,003 (84.4%) |
| 3 or 4 Unit Apartments | 111 (4.6%) | 2,296 (95.4%) |
| 5 to 9 Unit Apartments | 279 (8.6%) | 2,948 (91.3%) |
| 10 or more Apartments | 266 (2.9%) | 8,744 (97.1%) |
| Mobile Home / Other | 5,356 (75.2%) | 1,765 (24.8%) |
| Total | 51,384 (68.0%) | 24,125 (32.0%) |
Housing Structures by Number of Rooms in Benton County
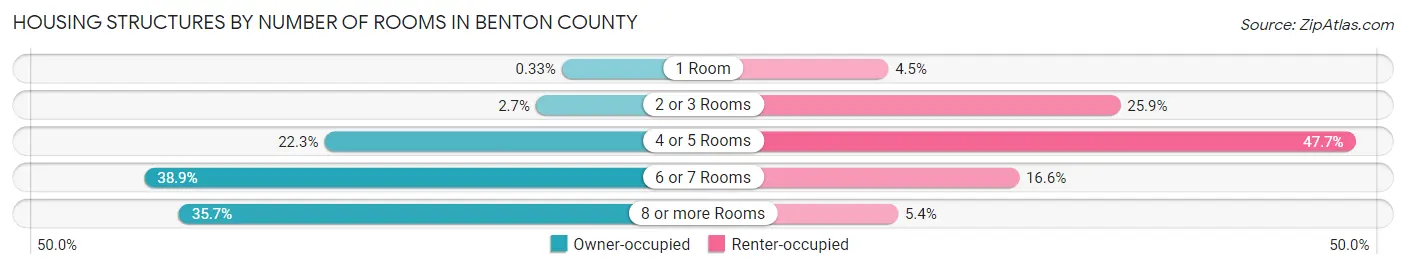
| Number of Rooms | Owner-occupied | Renter-occupied |
| 1 Room | 169 (0.3%) | 1,079 (4.5%) |
| 2 or 3 Rooms | 1,398 (2.7%) | 6,255 (25.9%) |
| 4 or 5 Rooms | 11,455 (22.3%) | 11,501 (47.7%) |
| 6 or 7 Rooms | 20,002 (38.9%) | 3,994 (16.6%) |
| 8 or more Rooms | 18,360 (35.7%) | 1,296 (5.4%) |
| Total | 51,384 (100.0%) | 24,125 (100.0%) |
Housing Structure by Heating Type in Benton County
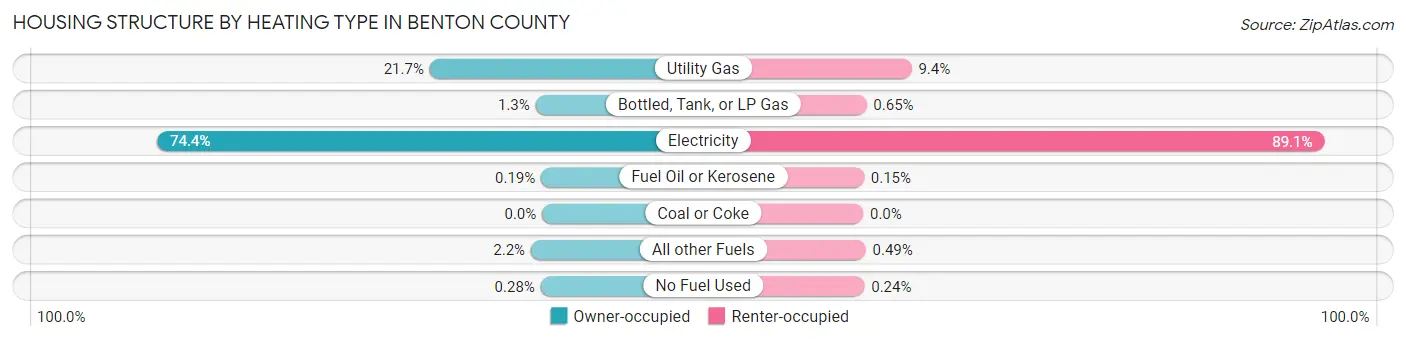
| Heating Type | Owner-occupied | Renter-occupied |
| Utility Gas | 11,155 (21.7%) | 2,256 (9.3%) |
| Bottled, Tank, or LP Gas | 652 (1.3%) | 157 (0.6%) |
| Electricity | 38,225 (74.4%) | 21,499 (89.1%) |
| Fuel Oil or Kerosene | 96 (0.2%) | 37 (0.2%) |
| Coal or Coke | 0 (0.0%) | 0 (0.0%) |
| All other Fuels | 1,111 (2.2%) | 118 (0.5%) |
| No Fuel Used | 145 (0.3%) | 58 (0.2%) |
| Total | 51,384 (100.0%) | 24,125 (100.0%) |
Household Vehicle Usage in Benton County
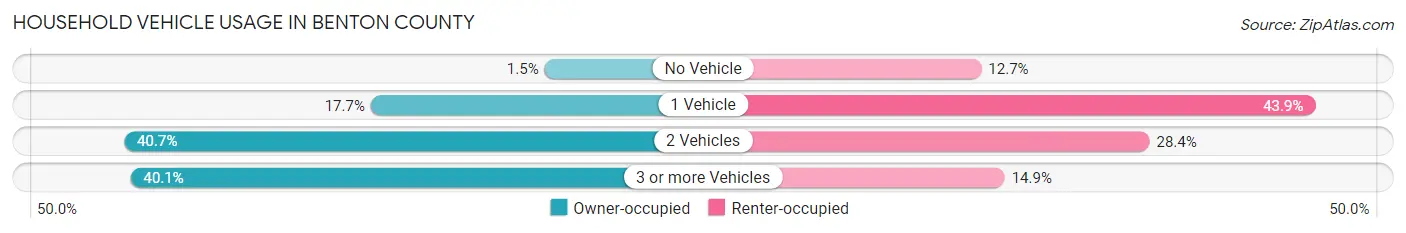
| Vehicles per Household | Owner-occupied | Renter-occupied |
| No Vehicle | 754 (1.5%) | 3,073 (12.7%) |
| 1 Vehicle | 9,092 (17.7%) | 10,591 (43.9%) |
| 2 Vehicles | 20,924 (40.7%) | 6,862 (28.4%) |
| 3 or more Vehicles | 20,614 (40.1%) | 3,599 (14.9%) |
| Total | 51,384 (100.0%) | 24,125 (100.0%) |
Real Estate & Mortgages in Benton County
Real Estate and Mortgage Overview in Benton County
| Characteristic | Without Mortgage | With Mortgage |
| Housing Units | 18,612 | 32,772 |
| Median Property Value | $309,100 | $351,800 |
| Median Household Income | $78,505 | $11,324 |
| Monthly Housing Costs | $601 | $3,293 |
| Real Estate Taxes | $2,736 | $807 |
Property Value by Mortgage Status in Benton County
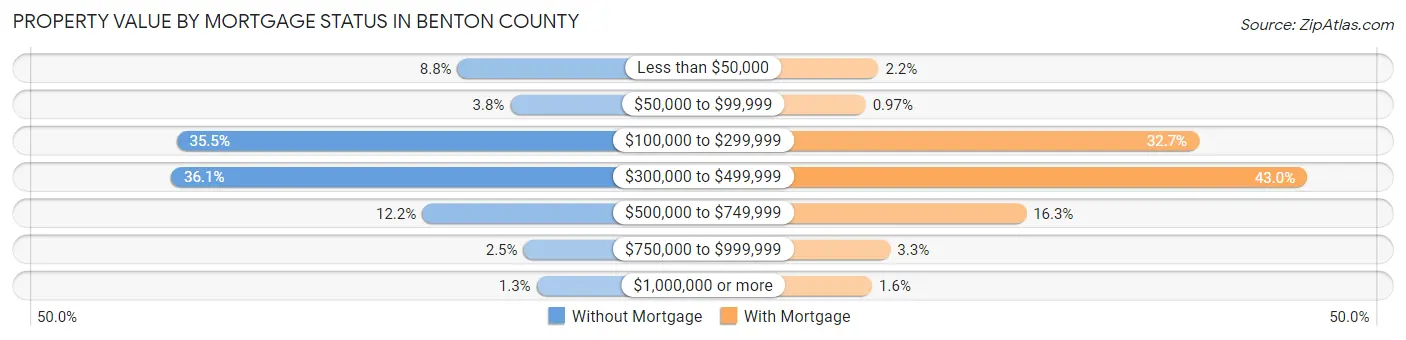
| Property Value | Without Mortgage | With Mortgage |
| Less than $50,000 | 1,634 (8.8%) | 718 (2.2%) |
| $50,000 to $99,999 | 698 (3.7%) | 319 (1.0%) |
| $100,000 to $299,999 | 6,613 (35.5%) | 10,715 (32.7%) |
| $300,000 to $499,999 | 6,709 (36.0%) | 14,090 (43.0%) |
| $500,000 to $749,999 | 2,261 (12.1%) | 5,324 (16.3%) |
| $750,000 to $999,999 | 465 (2.5%) | 1,087 (3.3%) |
| $1,000,000 or more | 232 (1.3%) | 519 (1.6%) |
| Total | 18,612 (100.0%) | 32,772 (100.0%) |
Household Income by Mortgage Status in Benton County
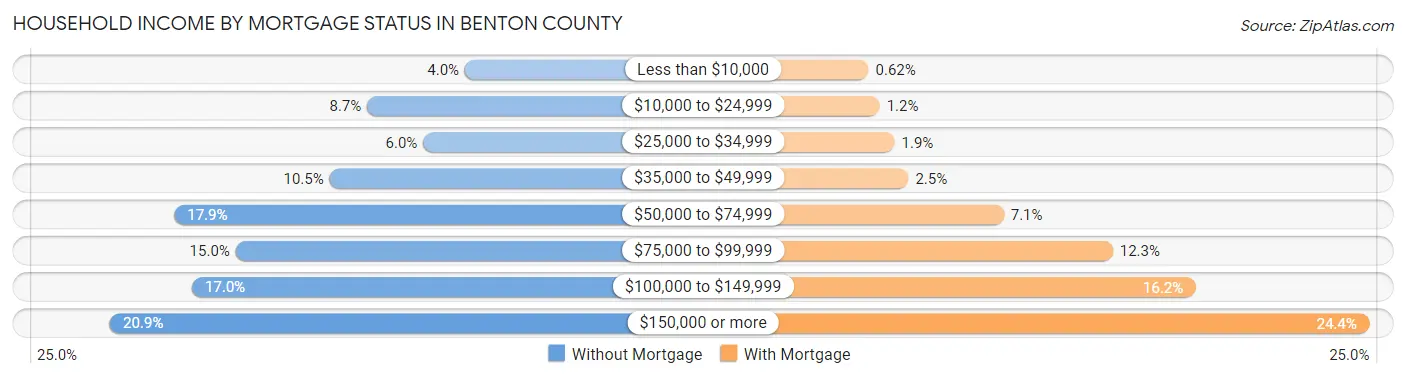
| Household Income | Without Mortgage | With Mortgage |
| Less than $10,000 | 750 (4.0%) | 204 (0.6%) |
| $10,000 to $24,999 | 1,618 (8.7%) | 378 (1.1%) |
| $25,000 to $34,999 | 1,121 (6.0%) | 608 (1.9%) |
| $35,000 to $49,999 | 1,950 (10.5%) | 827 (2.5%) |
| $50,000 to $74,999 | 3,326 (17.9%) | 2,313 (7.1%) |
| $75,000 to $99,999 | 2,782 (14.9%) | 4,015 (12.2%) |
| $100,000 to $149,999 | 3,170 (17.0%) | 5,299 (16.2%) |
| $150,000 or more | 3,895 (20.9%) | 8,008 (24.4%) |
| Total | 18,612 (100.0%) | 32,772 (100.0%) |
Property Value to Household Income Ratio in Benton County
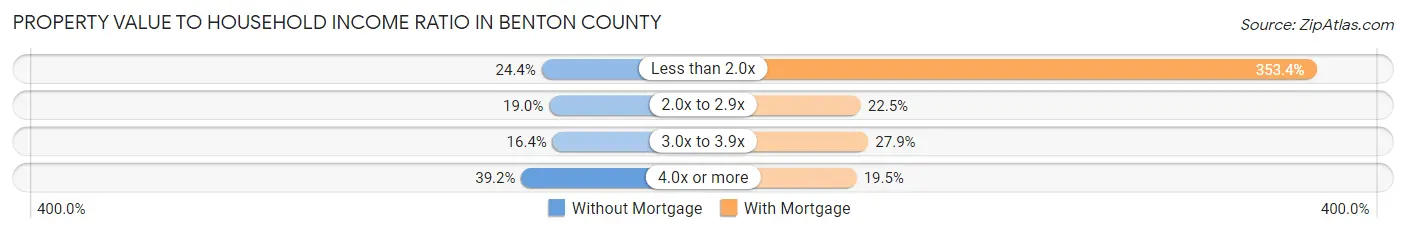
| Value-to-Income Ratio | Without Mortgage | With Mortgage |
| Less than 2.0x | 4,547 (24.4%) | 115,806 (353.4%) |
| 2.0x to 2.9x | 3,533 (19.0%) | 7,369 (22.5%) |
| 3.0x to 3.9x | 3,055 (16.4%) | 9,156 (27.9%) |
| 4.0x or more | 7,295 (39.2%) | 6,373 (19.5%) |
| Total | 18,612 (100.0%) | 32,772 (100.0%) |
Real Estate Taxes by Mortgage Status in Benton County
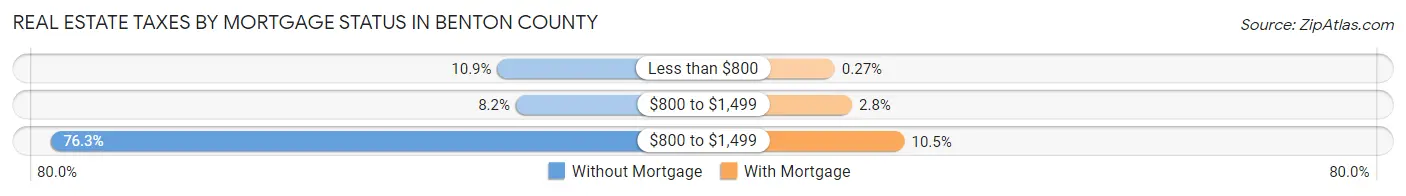
| Property Taxes | Without Mortgage | With Mortgage |
| Less than $800 | 2,033 (10.9%) | 89 (0.3%) |
| $800 to $1,499 | 1,531 (8.2%) | 910 (2.8%) |
| $800 to $1,499 | 14,191 (76.2%) | 3,425 (10.4%) |
| Total | 18,612 (100.0%) | 32,772 (100.0%) |
Health & Disability in Benton County
Health Insurance Coverage by Age in Benton County
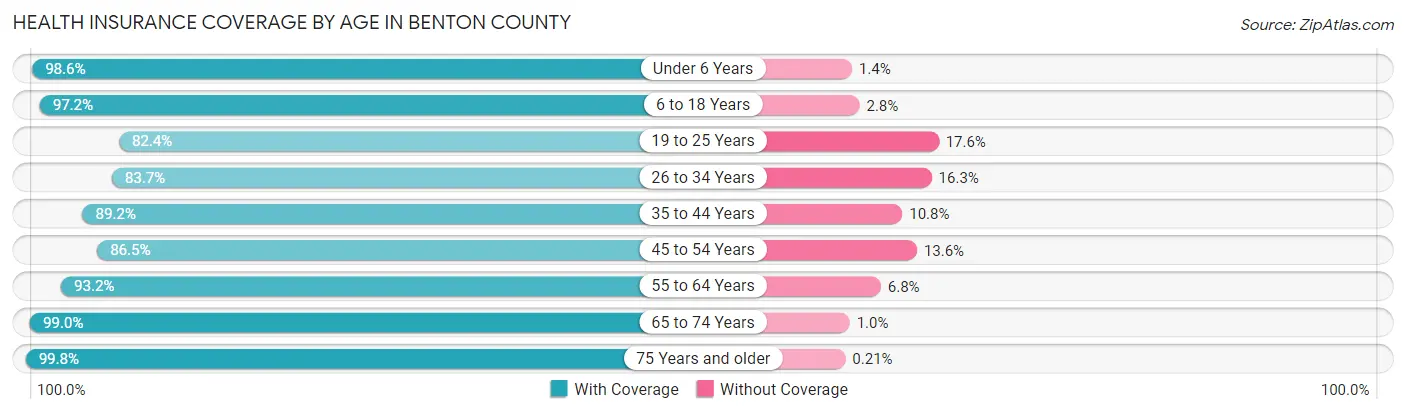
| Age Bracket | With Coverage | Without Coverage |
| Under 6 Years | 16,740 (98.6%) | 243 (1.4%) |
| 6 to 18 Years | 39,215 (97.2%) | 1,145 (2.8%) |
| 19 to 25 Years | 14,431 (82.4%) | 3,083 (17.6%) |
| 26 to 34 Years | 21,071 (83.7%) | 4,100 (16.3%) |
| 35 to 44 Years | 24,064 (89.2%) | 2,921 (10.8%) |
| 45 to 54 Years | 19,836 (86.5%) | 3,110 (13.6%) |
| 55 to 64 Years | 23,017 (93.2%) | 1,684 (6.8%) |
| 65 to 74 Years | 19,221 (99.0%) | 197 (1.0%) |
| 75 Years and older | 12,153 (99.8%) | 25 (0.2%) |
| Total | 189,748 (92.0%) | 16,508 (8.0%) |
Health Insurance Coverage by Citizenship Status in Benton County
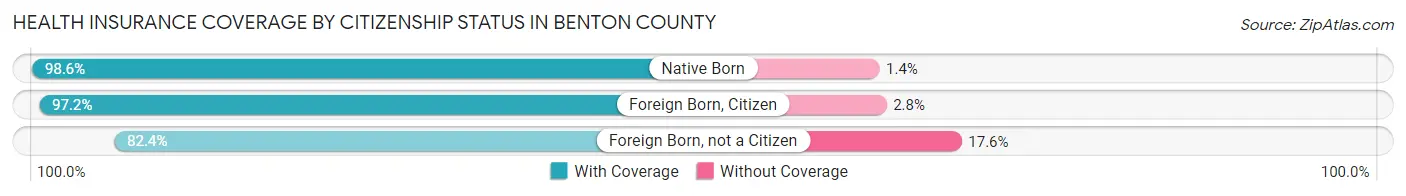
| Citizenship Status | With Coverage | Without Coverage |
| Native Born | 16,740 (98.6%) | 243 (1.4%) |
| Foreign Born, Citizen | 39,215 (97.2%) | 1,145 (2.8%) |
| Foreign Born, not a Citizen | 14,431 (82.4%) | 3,083 (17.6%) |
Health Insurance Coverage by Household Income in Benton County
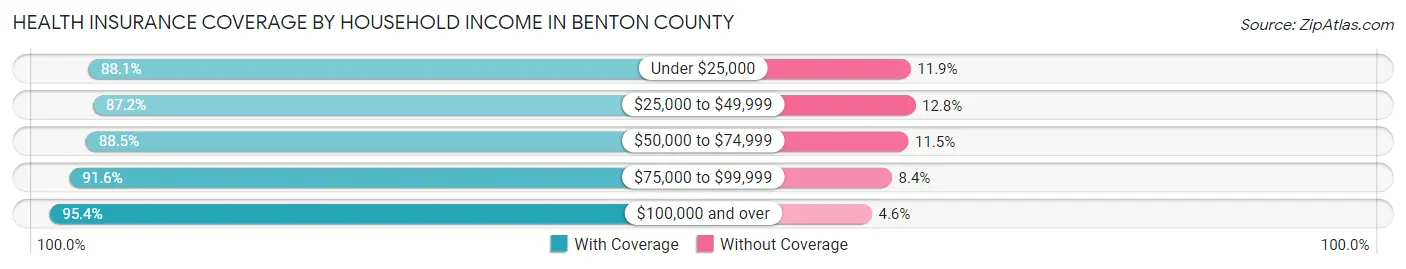
| Household Income | With Coverage | Without Coverage |
| Under $25,000 | 13,740 (88.1%) | 1,858 (11.9%) |
| $25,000 to $49,999 | 25,549 (87.2%) | 3,747 (12.8%) |
| $50,000 to $74,999 | 26,791 (88.5%) | 3,474 (11.5%) |
| $75,000 to $99,999 | 27,849 (91.6%) | 2,552 (8.4%) |
| $100,000 and over | 95,280 (95.4%) | 4,627 (4.6%) |
Public vs Private Health Insurance Coverage by Age in Benton County
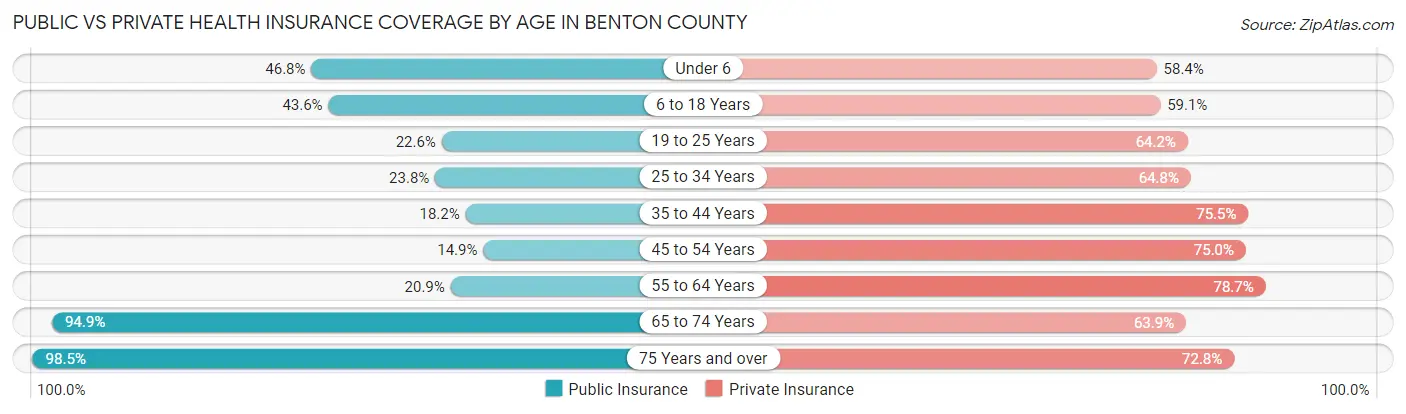
| Age Bracket | Public Insurance | Private Insurance |
| Under 6 | 7,943 (46.8%) | 9,923 (58.4%) |
| 6 to 18 Years | 17,597 (43.6%) | 23,853 (59.1%) |
| 19 to 25 Years | 3,955 (22.6%) | 11,244 (64.2%) |
| 25 to 34 Years | 5,987 (23.8%) | 16,303 (64.8%) |
| 35 to 44 Years | 4,897 (18.1%) | 20,361 (75.4%) |
| 45 to 54 Years | 3,410 (14.9%) | 17,207 (75.0%) |
| 55 to 64 Years | 5,169 (20.9%) | 19,427 (78.6%) |
| 65 to 74 Years | 18,429 (94.9%) | 12,404 (63.9%) |
| 75 Years and over | 11,995 (98.5%) | 8,867 (72.8%) |
| Total | 79,382 (38.5%) | 139,589 (67.7%) |
Disability Status by Sex by Age in Benton County
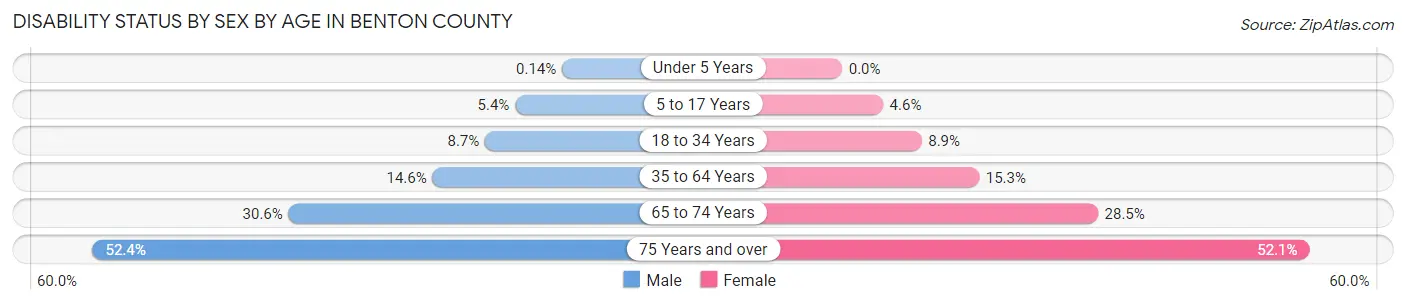
| Age Bracket | Male | Female |
| Under 5 Years | 10 (0.1%) | 0 (0.0%) |
| 5 to 17 Years | 1,129 (5.4%) | 902 (4.5%) |
| 18 to 34 Years | 2,030 (8.7%) | 1,964 (8.8%) |
| 35 to 64 Years | 5,475 (14.6%) | 5,656 (15.3%) |
| 65 to 74 Years | 2,933 (30.6%) | 2,802 (28.5%) |
| 75 Years and over | 2,769 (52.4%) | 3,591 (52.1%) |
Disability Class by Sex by Age in Benton County
Disability Class: Hearing Difficulty
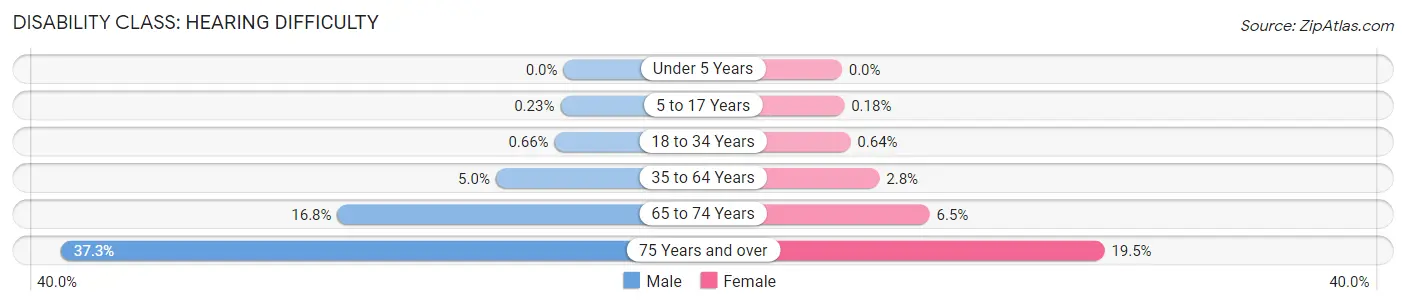
| Age Bracket | Male | Female |
| Under 5 Years | 0 (0.0%) | 0 (0.0%) |
| 5 to 17 Years | 48 (0.2%) | 36 (0.2%) |
| 18 to 34 Years | 154 (0.7%) | 143 (0.6%) |
| 35 to 64 Years | 1,888 (5.0%) | 1,034 (2.8%) |
| 65 to 74 Years | 1,608 (16.8%) | 641 (6.5%) |
| 75 Years and over | 1,970 (37.3%) | 1,345 (19.5%) |
Disability Class: Vision Difficulty
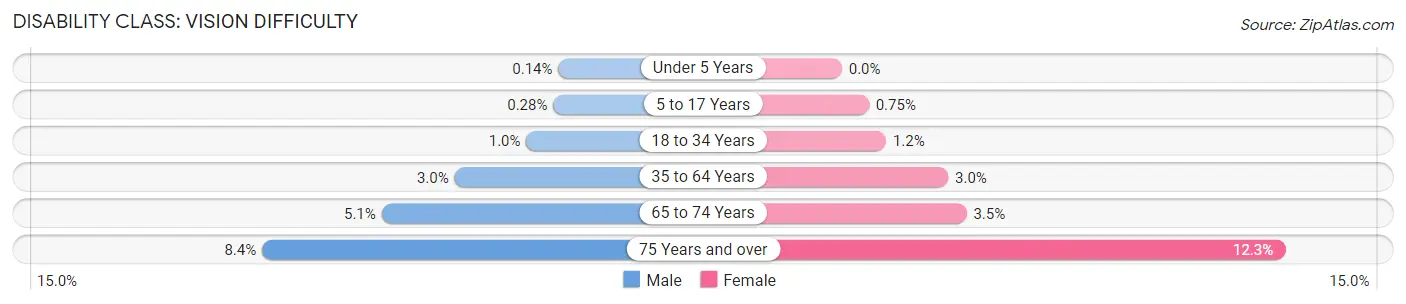
| Age Bracket | Male | Female |
| Under 5 Years | 10 (0.1%) | 0 (0.0%) |
| 5 to 17 Years | 58 (0.3%) | 148 (0.7%) |
| 18 to 34 Years | 240 (1.0%) | 273 (1.2%) |
| 35 to 64 Years | 1,139 (3.0%) | 1,097 (3.0%) |
| 65 to 74 Years | 485 (5.1%) | 341 (3.5%) |
| 75 Years and over | 443 (8.4%) | 851 (12.3%) |
Disability Class: Cognitive Difficulty
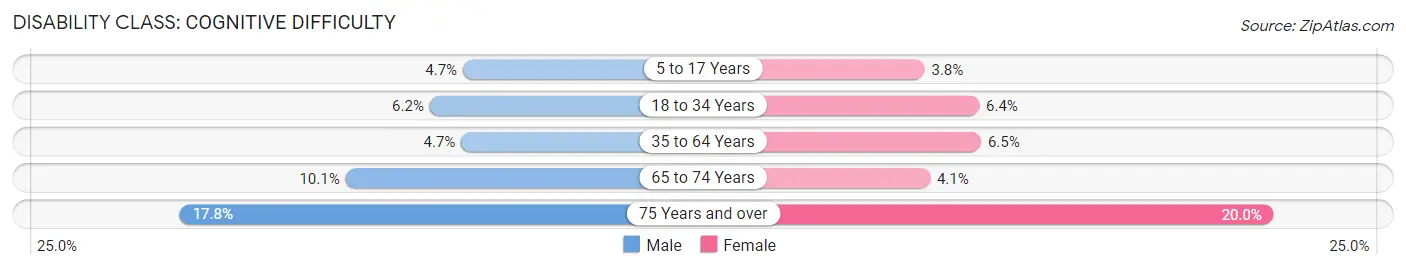
| Age Bracket | Male | Female |
| 5 to 17 Years | 981 (4.7%) | 761 (3.8%) |
| 18 to 34 Years | 1,445 (6.2%) | 1,414 (6.4%) |
| 35 to 64 Years | 1,781 (4.7%) | 2,392 (6.5%) |
| 65 to 74 Years | 969 (10.1%) | 402 (4.1%) |
| 75 Years and over | 940 (17.8%) | 1,382 (20.0%) |
Disability Class: Ambulatory Difficulty
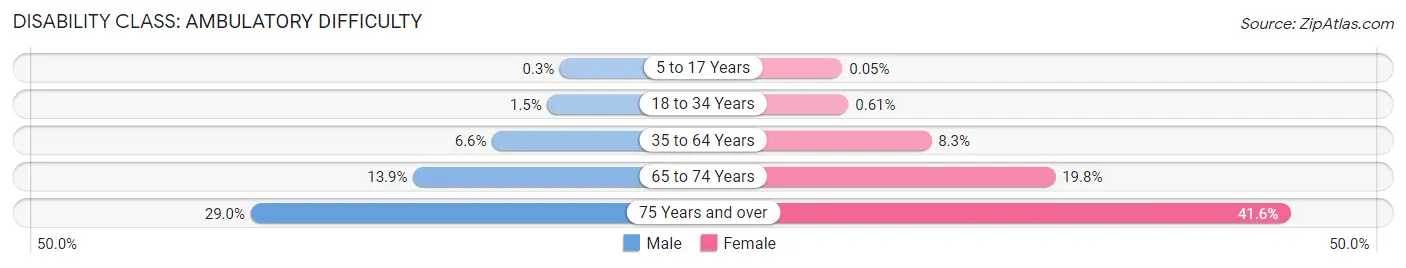
| Age Bracket | Male | Female |
| 5 to 17 Years | 64 (0.3%) | 9 (0.1%) |
| 18 to 34 Years | 339 (1.5%) | 135 (0.6%) |
| 35 to 64 Years | 2,477 (6.6%) | 3,077 (8.3%) |
| 65 to 74 Years | 1,335 (13.9%) | 1,948 (19.8%) |
| 75 Years and over | 1,532 (29.0%) | 2,869 (41.6%) |
Disability Class: Self-Care Difficulty
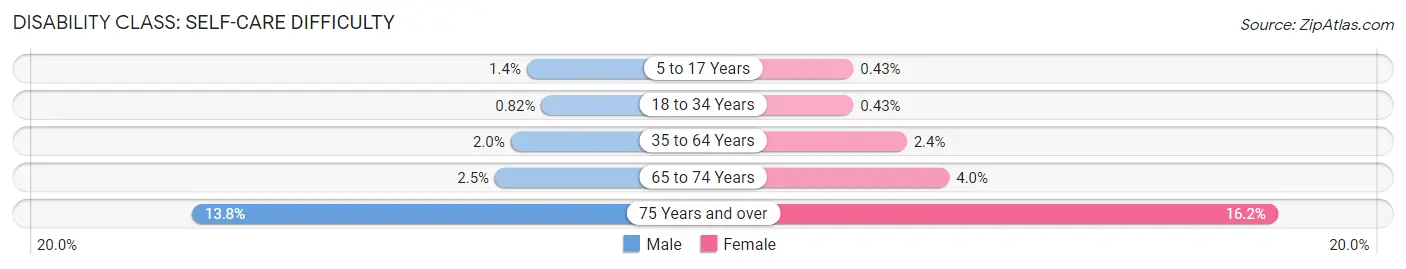
| Age Bracket | Male | Female |
| 5 to 17 Years | 286 (1.4%) | 86 (0.4%) |
| 18 to 34 Years | 190 (0.8%) | 95 (0.4%) |
| 35 to 64 Years | 737 (2.0%) | 892 (2.4%) |
| 65 to 74 Years | 243 (2.5%) | 392 (4.0%) |
| 75 Years and over | 728 (13.8%) | 1,116 (16.2%) |
Technology Access in Benton County
Computing Device Access in Benton County
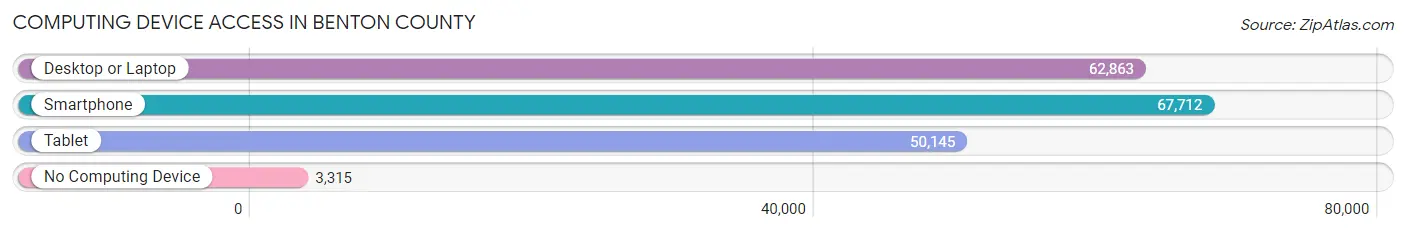
| Device Type | # Households | % Households |
| Desktop or Laptop | 62,863 | 83.3% |
| Smartphone | 67,712 | 89.7% |
| Tablet | 50,145 | 66.4% |
| No Computing Device | 3,315 | 4.4% |
| Total | 75,509 | 100.0% |
Internet Access in Benton County
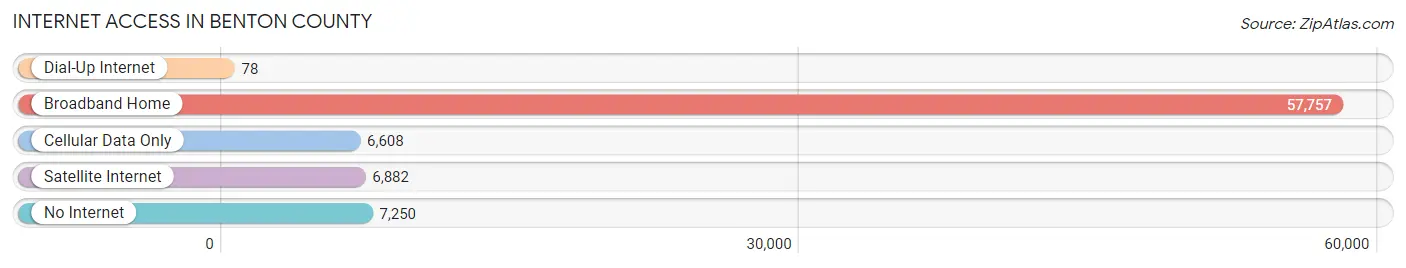
| Internet Type | # Households | % Households |
| Dial-Up Internet | 78 | 0.1% |
| Broadband Home | 57,757 | 76.5% |
| Cellular Data Only | 6,608 | 8.7% |
| Satellite Internet | 6,882 | 9.1% |
| No Internet | 7,250 | 9.6% |
| Total | 75,509 | 100.0% |
Benton County Summary
Benton County is located in the south-central region of Washington State, and is part of the Tri-Cities metropolitan area. The county is bordered by Franklin County to the north, Yakima County to the east, and Walla Walla County to the south. The county seat is Prosser, and the largest city is Kennewick. As of the 2010 census, the population of Benton County was 175,177.
History
Benton County was created in 1905 from parts of Yakima and Franklin Counties. It was named after Thomas Hart Benton, a U.S. Senator from Missouri. The county was originally inhabited by the Yakama, Palouse, and Wanapum Native American tribes. The first non-native settlers arrived in the area in the 1860s, and the county was officially organized in 1905.
Geography
Benton County covers an area of 1,760 square miles, making it the second-largest county in Washington State. The county is located in the Columbia Plateau region of the state, and is characterized by rolling hills and wide valleys. The Columbia River forms the county’s eastern border, and the Yakima River forms the western border. The county is home to several lakes, including Badger Lake, Clear Lake, and Lake Wallula.
Economy
Benton County’s economy is largely based on agriculture, with wheat, apples, and potatoes being the main crops. The county is also home to several wineries, and is a popular destination for wine tourism. Other industries in the county include manufacturing, retail, and healthcare. The county is home to several large employers, including the Hanford Nuclear Reservation, Pacific Northwest National Laboratory, and Kadlec Regional Medical Center.
Demographics
As of the 2010 census, the population of Benton County was 175,177. The racial makeup of the county was 79.2% White, 1.3% African American, 1.2% Native American, 1.7% Asian, 0.2% Pacific Islander, 13.2% from other races, and 3.2% from two or more races. Hispanic or Latino of any race were 20.2% of the population.
The median household income in Benton County was $50,945, and the median family income was $60,945. The per capita income was $25,945. About 11.2% of the population was below the poverty line.
Conclusion
Benton County is located in the south-central region of Washington State, and is part of the Tri-Cities metropolitan area. The county was created in 1905 and is named after Thomas Hart Benton, a U.S. Senator from Missouri. The county covers an area of 1,760 square miles, and is characterized by rolling hills and wide valleys. The economy of Benton County is largely based on agriculture, with wheat, apples, and potatoes being the main crops. As of the 2010 census, the population of Benton County was 175,177, with the median household income being $50,945.
Common Questions
What is Per Capita Income in Benton County?
Per Capita income in Benton County is $39,668.
What is the Median Family Income in Benton County?
Median Family Income in Benton County is $98,476.
What is the Median Household income in Benton County?
Median Household Income in Benton County is $83,778.
What is Income or Wage Gap in Benton County?
Income or Wage Gap in Benton County is 37.2%.
Women in Benton County earn 62.8 cents for every dollar earned by a man.
What is Family Income Deficit in Benton County?
Family Income Deficit in Benton County is $9,617.
Families that are below poverty line in Benton County earn $9,617 less on average than the poverty threshold level.
What is Inequality or Gini Index in Benton County?
Inequality or Gini Index in Benton County is 0.43.
What is the Total Population of Benton County?
Total Population of Benton County is 207,560.
What is the Total Male Population of Benton County?
Total Male Population of Benton County is 104,632.
What is the Total Female Population of Benton County?
Total Female Population of Benton County is 102,928.
What is the Ratio of Males per 100 Females in Benton County?
There are 101.66 Males per 100 Females in Benton County.
What is the Ratio of Females per 100 Males in Benton County?
There are 98.37 Females per 100 Males in Benton County.
What is the Median Population Age in Benton County?
Median Population Age in Benton County is 36.1 Years.
What is the Average Family Size in Benton County
Average Family Size in Benton County is 3.3 People.
What is the Average Household Size in Benton County
Average Household Size in Benton County is 2.7 People.
How Large is the Labor Force in Benton County?
There are 99,544 People in the Labor Forcein in Benton County.
What is the Percentage of People in the Labor Force in Benton County?
62.5% of People are in the Labor Force in Benton County.
What is the Unemployment Rate in Benton County?
Unemployment Rate in Benton County is 4.8%.