Lewis County, WA Map & Demographics
Lewis County Map
Lewis County Overview
$32,800
PER CAPITA INCOME
$83,359
AVG FAMILY INCOME
$67,247
AVG HOUSEHOLD INCOME
31.7%
WAGE / INCOME GAP [ % ]
68.3¢/ $1
WAGE / INCOME GAP [ $ ]
$9,394
FAMILY INCOME DEFICIT
0.42
INEQUALITY / GINI INDEX
82,663
TOTAL POPULATION
41,896
MALE POPULATION
40,767
FEMALE POPULATION
102.77
MALES / 100 FEMALES
97.31
FEMALES / 100 MALES
42.4
MEDIAN AGE
3.1
AVG FAMILY SIZE
2.6
AVG HOUSEHOLD SIZE
36,906
LABOR FORCE [ PEOPLE ]
55.0%
PERCENT IN LABOR FORCE
6.3%
UNEMPLOYMENT RATE
Lewis County Area Codes
Income in Lewis County
Income Overview in Lewis County
Per Capita Income in Lewis County is $32,800, while median incomes of families and households are $83,359 and $67,247 respectively.
| Characteristic | Number | Measure |
| Per Capita Income | 82,663 | $32,800 |
| Median Family Income | 20,935 | $83,359 |
| Mean Family Income | 20,935 | $97,900 |
| Median Household Income | 31,511 | $67,247 |
| Mean Household Income | 31,511 | $83,595 |
| Income Deficit | 20,935 | $9,394 |
| Wage / Income Gap (%) | 82,663 | 31.68% |
| Wage / Income Gap ($) | 82,663 | 68.32¢ per $1 |
| Gini / Inequality Index | 82,663 | 0.42 |
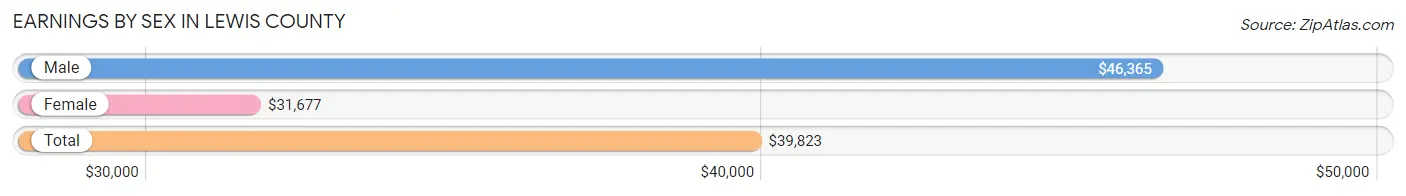
Earnings by Sex in Lewis County
Average Earnings in Lewis County are $39,823, $46,365 for men and $31,677 for women, a difference of 31.7%.
| Sex | Number | Average Earnings |
| Male | 21,330 (55.1%) | $46,365 |
| Female | 17,370 (44.9%) | $31,677 |
| Total | 38,700 (100.0%) | $39,823 |
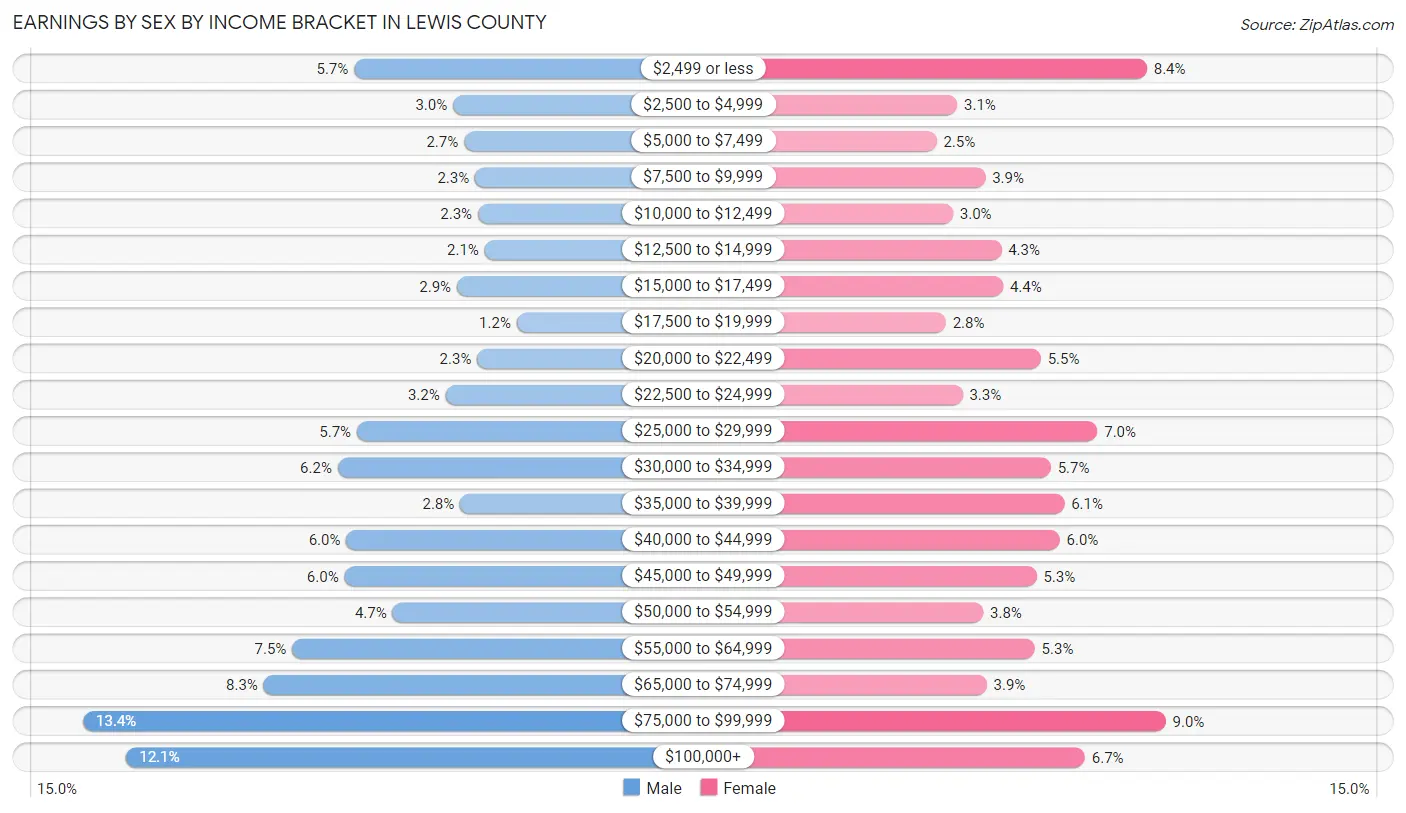
Earnings by Sex by Income Bracket in Lewis County
The most common earnings brackets in Lewis County are $75,000 to $99,999 for men (2,849 | 13.4%) and $75,000 to $99,999 for women (1,557 | 9.0%).
| Income | Male | Female |
| $2,499 or less | 1,225 (5.7%) | 1,464 (8.4%) |
| $2,500 to $4,999 | 632 (3.0%) | 538 (3.1%) |
| $5,000 to $7,499 | 566 (2.6%) | 438 (2.5%) |
| $7,500 to $9,999 | 499 (2.3%) | 675 (3.9%) |
| $10,000 to $12,499 | 483 (2.3%) | 517 (3.0%) |
| $12,500 to $14,999 | 441 (2.1%) | 754 (4.3%) |
| $15,000 to $17,499 | 608 (2.9%) | 763 (4.4%) |
| $17,500 to $19,999 | 249 (1.2%) | 483 (2.8%) |
| $20,000 to $22,499 | 486 (2.3%) | 946 (5.4%) |
| $22,500 to $24,999 | 676 (3.2%) | 564 (3.3%) |
| $25,000 to $29,999 | 1,208 (5.7%) | 1,223 (7.0%) |
| $30,000 to $34,999 | 1,322 (6.2%) | 995 (5.7%) |
| $35,000 to $39,999 | 588 (2.8%) | 1,061 (6.1%) |
| $40,000 to $44,999 | 1,272 (6.0%) | 1,038 (6.0%) |
| $45,000 to $49,999 | 1,281 (6.0%) | 925 (5.3%) |
| $50,000 to $54,999 | 994 (4.7%) | 666 (3.8%) |
| $55,000 to $64,999 | 1,595 (7.5%) | 918 (5.3%) |
| $65,000 to $74,999 | 1,767 (8.3%) | 683 (3.9%) |
| $75,000 to $99,999 | 2,849 (13.4%) | 1,557 (9.0%) |
| $100,000+ | 2,589 (12.1%) | 1,162 (6.7%) |
| Total | 21,330 (100.0%) | 17,370 (100.0%) |
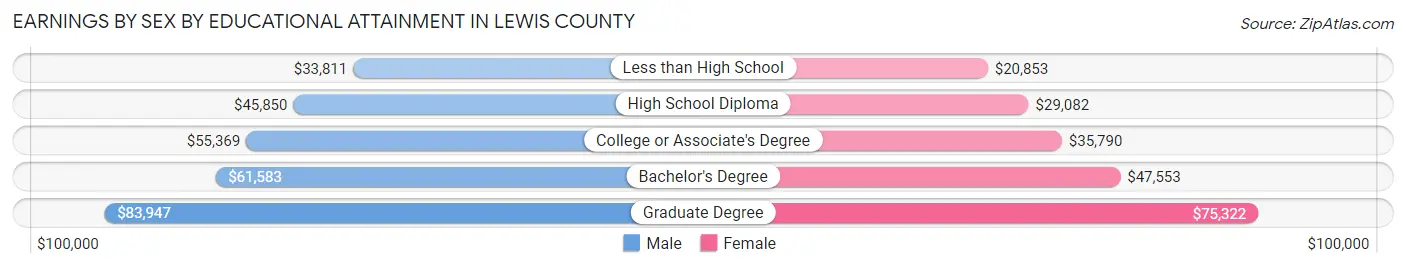
Earnings by Sex by Educational Attainment in Lewis County
Average earnings in Lewis County are $52,245 for men and $36,336 for women, a difference of 30.4%. Men with an educational attainment of graduate degree enjoy the highest average annual earnings of $83,947, while those with less than high school education earn the least with $33,811. Women with an educational attainment of graduate degree earn the most with the average annual earnings of $75,322, while those with less than high school education have the smallest earnings of $20,853.
| Educational Attainment | Male Income | Female Income |
| Less than High School | $33,811 | $20,853 |
| High School Diploma | $45,850 | $29,082 |
| College or Associate's Degree | $55,369 | $35,790 |
| Bachelor's Degree | $61,583 | $47,553 |
| Graduate Degree | $83,947 | $75,322 |
| Total | $52,245 | $36,336 |
Family Income in Lewis County
Family Income Brackets in Lewis County
According to the Lewis County family income data, there are 4,438 families falling into the $100,000 to $149,999 income range, which is the most common income bracket and makes up 21.2% of all families. Conversely, the less than $10,000 income bracket is the least frequent group with only 335 families (1.6%) belonging to this category.
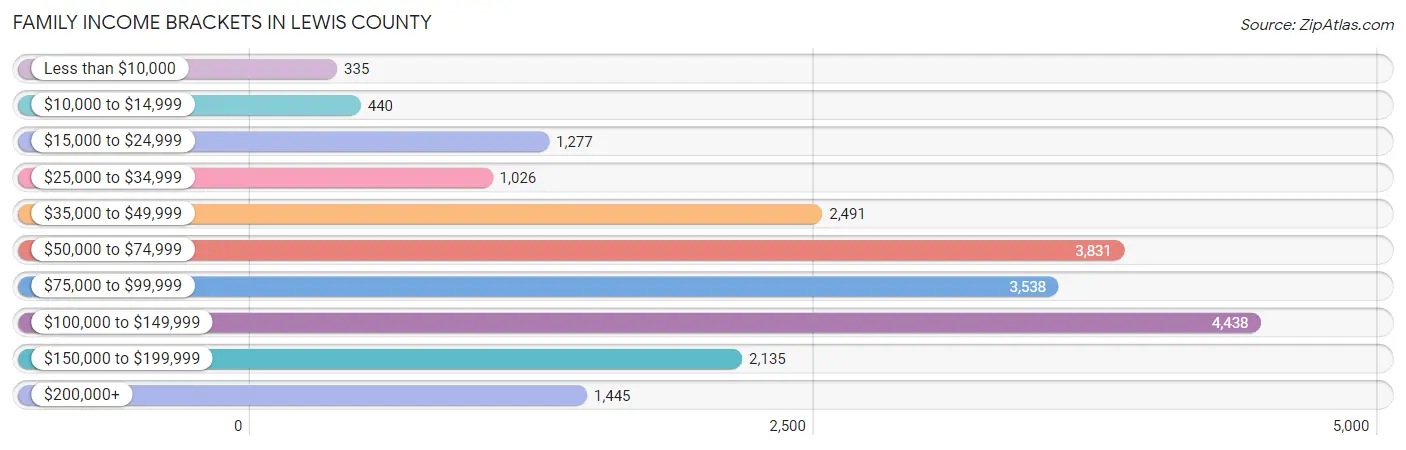
| Income Bracket | # Families | % Families |
| Less than $10,000 | 335 | 1.6% |
| $10,000 to $14,999 | 440 | 2.1% |
| $15,000 to $24,999 | 1,277 | 6.1% |
| $25,000 to $34,999 | 1,026 | 4.9% |
| $35,000 to $49,999 | 2,491 | 11.9% |
| $50,000 to $74,999 | 3,831 | 18.3% |
| $75,000 to $99,999 | 3,538 | 16.9% |
| $100,000 to $149,999 | 4,438 | 21.2% |
| $150,000 to $199,999 | 2,135 | 10.2% |
| $200,000+ | 1,445 | 6.9% |
Family Income by Famaliy Size in Lewis County
6-person families (660 | 3.2%) account for the highest median family income in Lewis County with $105,286 per family, while 2-person families (10,689 | 51.1%) have the highest median income of $35,286 per family member.
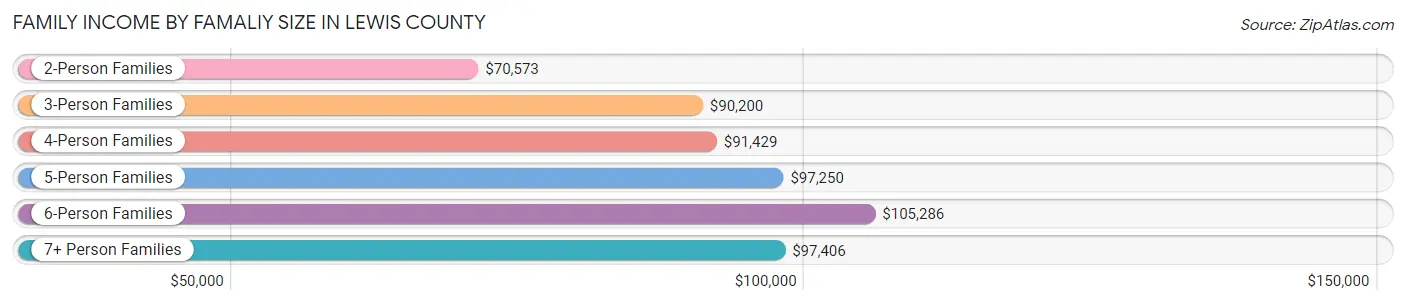
| Income Bracket | # Families | Median Income |
| 2-Person Families | 10,689 (51.1%) | $70,573 |
| 3-Person Families | 3,940 (18.8%) | $90,200 |
| 4-Person Families | 3,368 (16.1%) | $91,429 |
| 5-Person Families | 1,778 (8.5%) | $97,250 |
| 6-Person Families | 660 (3.2%) | $105,286 |
| 7+ Person Families | 500 (2.4%) | $97,406 |
| Total | 20,935 (100.0%) | $83,359 |
Family Income by Number of Earners in Lewis County
The median family income in Lewis County is $83,359, with families comprising 3+ earners (2,324) having the highest median family income of $141,792, while families with no earners (4,152) have the lowest median family income of $44,709, accounting for 11.1% and 19.8% of families, respectively.
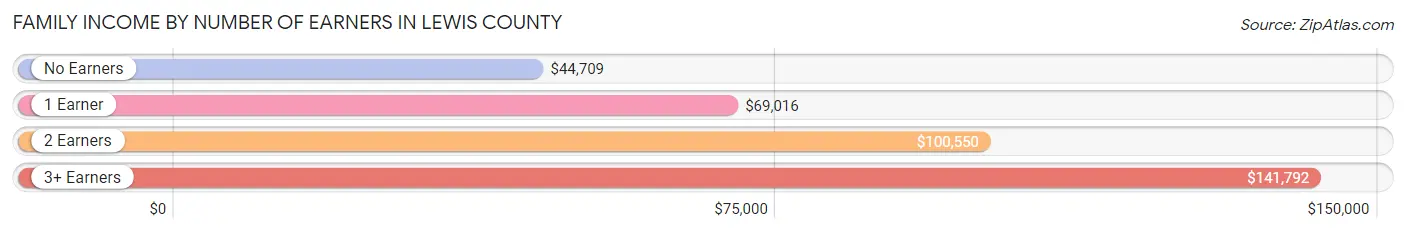
| Number of Earners | # Families | Median Income |
| No Earners | 4,152 (19.8%) | $44,709 |
| 1 Earner | 7,432 (35.5%) | $69,016 |
| 2 Earners | 7,027 (33.6%) | $100,550 |
| 3+ Earners | 2,324 (11.1%) | $141,792 |
| Total | 20,935 (100.0%) | $83,359 |
Household Income in Lewis County
Household Income Brackets in Lewis County
With 5,451 households falling in the category, the $100,000 to $149,999 income range is the most frequent in Lewis County, accounting for 17.3% of all households. In contrast, only 1,103 households (3.5%) fall into the less than $10,000 income bracket, making it the least populous group.
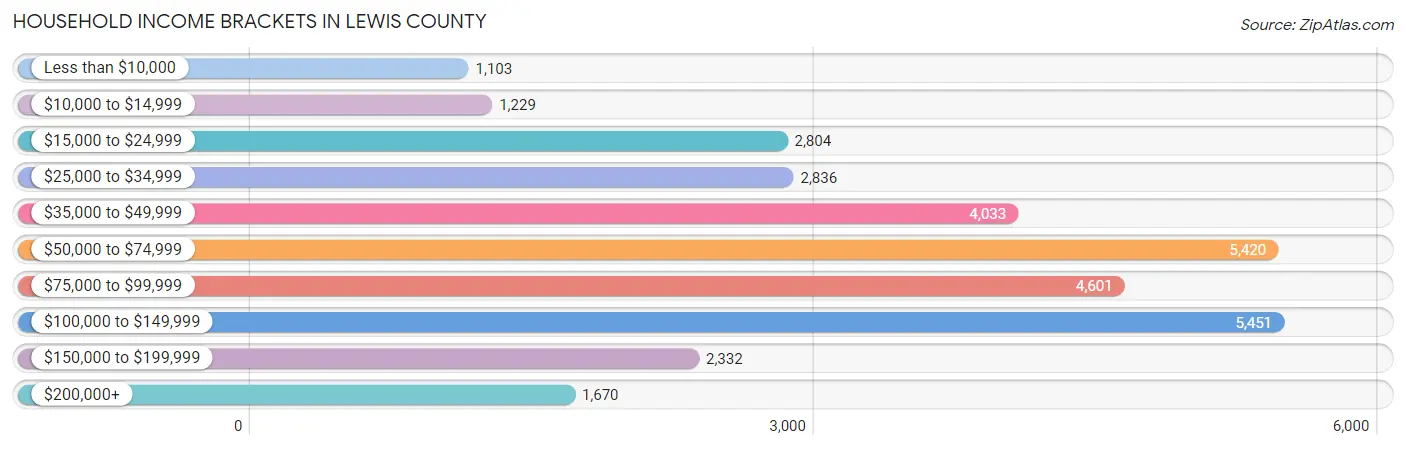
| Income Bracket | # Households | % Households |
| Less than $10,000 | 1,103 | 3.5% |
| $10,000 to $14,999 | 1,229 | 3.9% |
| $15,000 to $24,999 | 2,804 | 8.9% |
| $25,000 to $34,999 | 2,836 | 9.0% |
| $35,000 to $49,999 | 4,033 | 12.8% |
| $50,000 to $74,999 | 5,420 | 17.2% |
| $75,000 to $99,999 | 4,601 | 14.6% |
| $100,000 to $149,999 | 5,451 | 17.3% |
| $150,000 to $199,999 | 2,332 | 7.4% |
| $200,000+ | 1,670 | 5.3% |
Household Income by Householder Age in Lewis County
The median household income in Lewis County is $67,247, with the highest median household income of $81,974 found in the 45 to 64 years age bracket for the primary householder. A total of 11,360 households (36.0%) fall into this category. Meanwhile, the 65+ years age bracket for the primary householder has the lowest median household income of $46,250, with 11,271 households (35.8%) in this group.
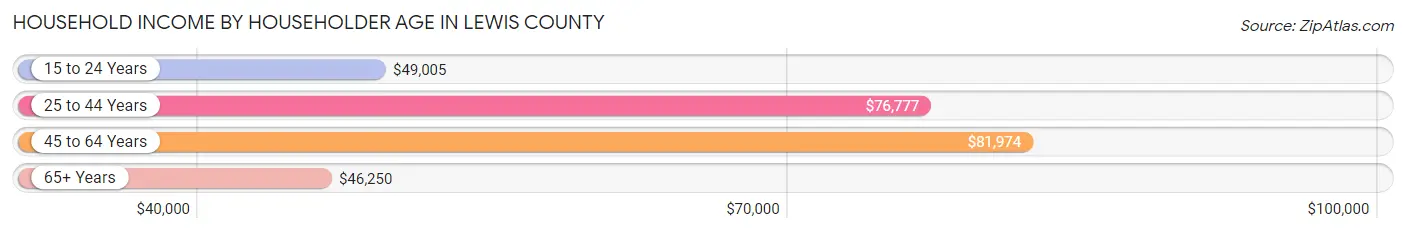
| Income Bracket | # Households | Median Income |
| 15 to 24 Years | 761 (2.4%) | $49,005 |
| 25 to 44 Years | 8,119 (25.8%) | $76,777 |
| 45 to 64 Years | 11,360 (36.0%) | $81,974 |
| 65+ Years | 11,271 (35.8%) | $46,250 |
| Total | 31,511 (100.0%) | $67,247 |
Poverty in Lewis County
Income Below Poverty by Sex and Age in Lewis County
With 11.0% poverty level for males and 13.6% for females among the residents of Lewis County, under 5 year old males and 15 year old females are the most vulnerable to poverty, with 617 males (26.0%) and 86 females (22.3%) in their respective age groups living below the poverty level.
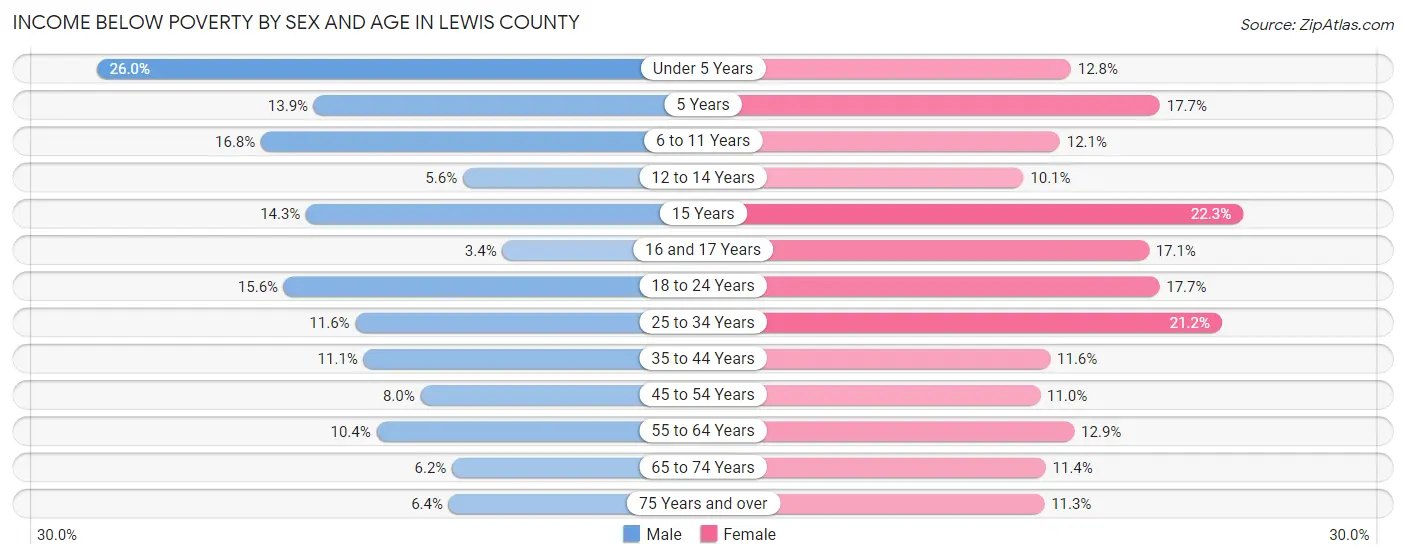
| Age Bracket | Male | Female |
| Under 5 Years | 617 (26.0%) | 284 (12.8%) |
| 5 Years | 71 (13.9%) | 79 (17.7%) |
| 6 to 11 Years | 484 (16.8%) | 341 (12.1%) |
| 12 to 14 Years | 87 (5.6%) | 146 (10.1%) |
| 15 Years | 62 (14.3%) | 86 (22.3%) |
| 16 and 17 Years | 37 (3.4%) | 182 (17.1%) |
| 18 to 24 Years | 507 (15.6%) | 498 (17.7%) |
| 25 to 34 Years | 591 (11.6%) | 1,024 (21.2%) |
| 35 to 44 Years | 551 (11.1%) | 561 (11.6%) |
| 45 to 54 Years | 388 (8.0%) | 514 (11.0%) |
| 55 to 64 Years | 613 (10.4%) | 780 (12.9%) |
| 65 to 74 Years | 325 (6.2%) | 592 (11.4%) |
| 75 Years and over | 194 (6.4%) | 404 (11.3%) |
| Total | 4,527 (11.0%) | 5,491 (13.6%) |
Income Above Poverty by Sex and Age in Lewis County
According to the poverty statistics in Lewis County, males aged 16 and 17 years and females aged 12 to 14 years are the age groups that are most secure financially, with 96.6% of males and 89.9% of females in these age groups living above the poverty line.
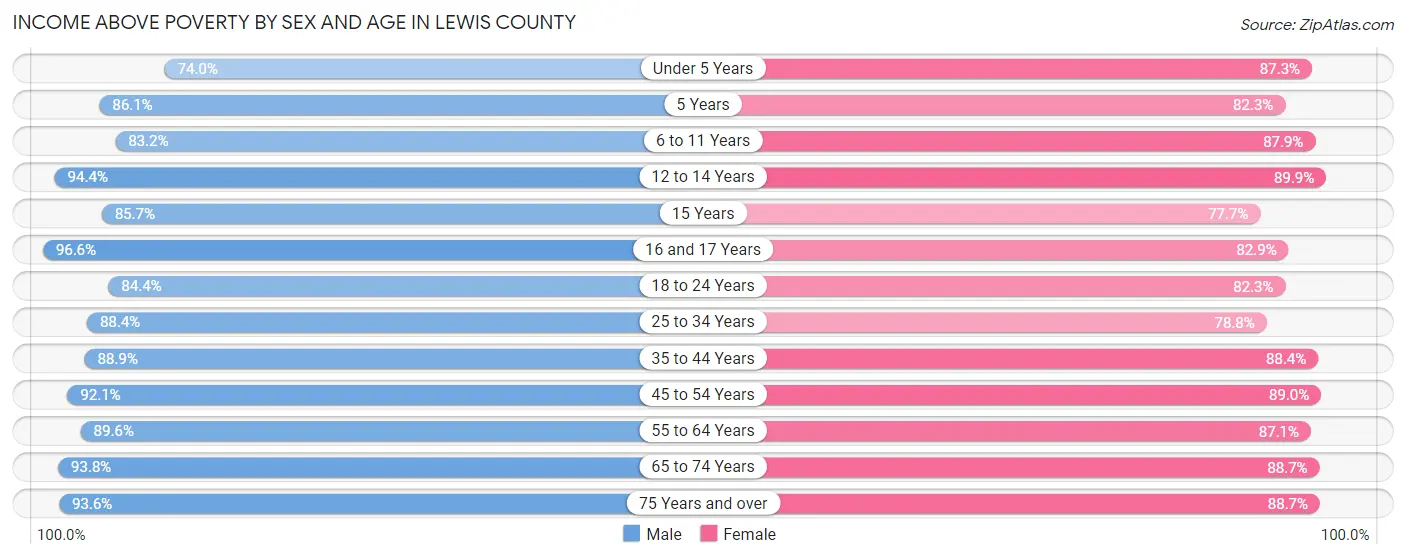
| Age Bracket | Male | Female |
| Under 5 Years | 1,757 (74.0%) | 1,944 (87.3%) |
| 5 Years | 440 (86.1%) | 367 (82.3%) |
| 6 to 11 Years | 2,391 (83.2%) | 2,469 (87.9%) |
| 12 to 14 Years | 1,470 (94.4%) | 1,298 (89.9%) |
| 15 Years | 371 (85.7%) | 299 (77.7%) |
| 16 and 17 Years | 1,056 (96.6%) | 883 (82.9%) |
| 18 to 24 Years | 2,751 (84.4%) | 2,319 (82.3%) |
| 25 to 34 Years | 4,514 (88.4%) | 3,815 (78.8%) |
| 35 to 44 Years | 4,404 (88.9%) | 4,274 (88.4%) |
| 45 to 54 Years | 4,495 (92.0%) | 4,142 (89.0%) |
| 55 to 64 Years | 5,279 (89.6%) | 5,250 (87.1%) |
| 65 to 74 Years | 4,928 (93.8%) | 4,622 (88.6%) |
| 75 Years and over | 2,848 (93.6%) | 3,182 (88.7%) |
| Total | 36,704 (89.0%) | 34,864 (86.4%) |
Income Below Poverty Among Married-Couple Families in Lewis County
The poverty statistics for married-couple families in Lewis County show that 4.3% or 674 of the total 15,568 families live below the poverty line. Families with 5 or more children have the highest poverty rate of 27.0%, comprising of 69 families. On the other hand, families with no children have the lowest poverty rate of 3.3%, which includes 324 families.
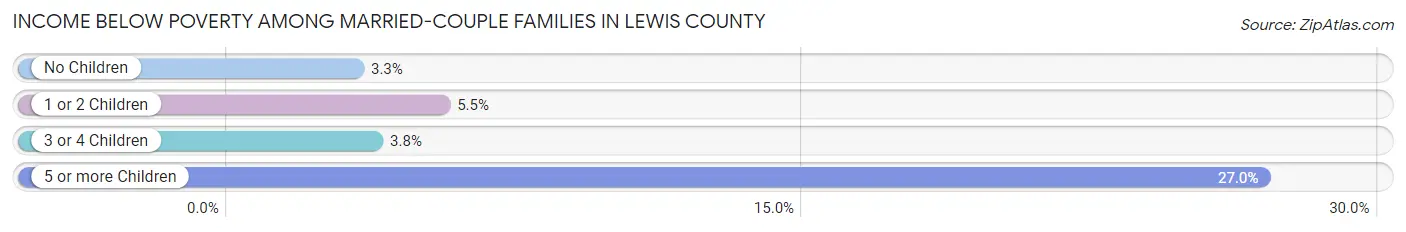
| Children | Above Poverty | Below Poverty |
| No Children | 9,522 (96.7%) | 324 (3.3%) |
| 1 or 2 Children | 3,993 (94.5%) | 234 (5.5%) |
| 3 or 4 Children | 1,192 (96.2%) | 47 (3.8%) |
| 5 or more Children | 187 (73.1%) | 69 (27.0%) |
| Total | 14,894 (95.7%) | 674 (4.3%) |
Income Below Poverty Among Single-Parent Households in Lewis County
According to the poverty data in Lewis County, 7.7% or 155 single-father households and 24.9% or 833 single-mother households are living below the poverty line. Among single-father households, those with 3 or 4 children have the highest poverty rate, with 53 households (22.2%) experiencing poverty. Likewise, among single-mother households, those with 5 or more children have the highest poverty rate, with 13 households (100.0%) falling below the poverty line.
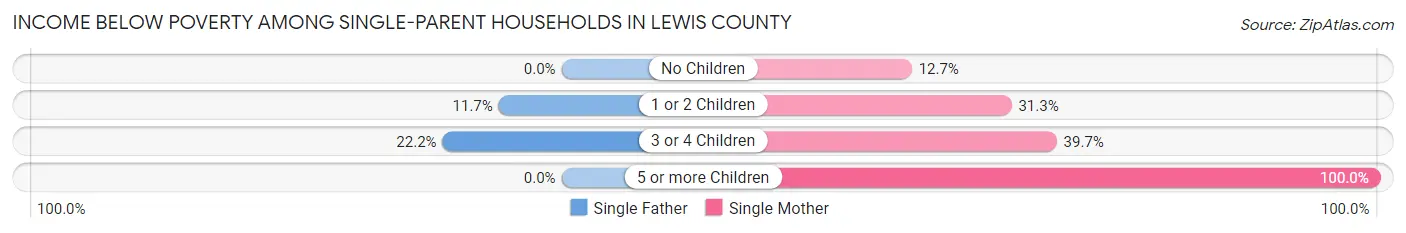
| Children | Single Father | Single Mother |
| No Children | 0 (0.0%) | 184 (12.7%) |
| 1 or 2 Children | 102 (11.7%) | 417 (31.3%) |
| 3 or 4 Children | 53 (22.2%) | 219 (39.7%) |
| 5 or more Children | 0 (0.0%) | 13 (100.0%) |
| Total | 155 (7.7%) | 833 (24.9%) |
Income Below Poverty Among Married-Couple vs Single-Parent Households in Lewis County
The poverty data for Lewis County shows that 674 of the married-couple family households (4.3%) and 988 of the single-parent households (18.4%) are living below the poverty level. Within the married-couple family households, those with 5 or more children have the highest poverty rate, with 69 households (27.0%) falling below the poverty line. Among the single-parent households, those with 5 or more children have the highest poverty rate, with 13 household (100.0%) living below poverty.
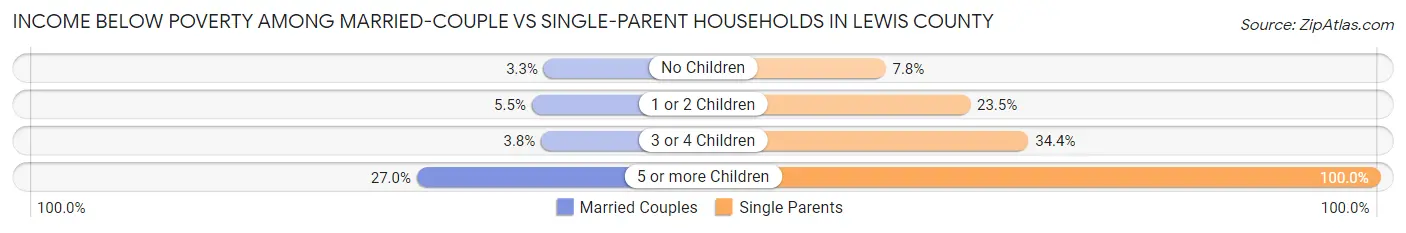
| Children | Married-Couple Families | Single-Parent Households |
| No Children | 324 (3.3%) | 184 (7.8%) |
| 1 or 2 Children | 234 (5.5%) | 519 (23.5%) |
| 3 or 4 Children | 47 (3.8%) | 272 (34.4%) |
| 5 or more Children | 69 (27.0%) | 13 (100.0%) |
| Total | 674 (4.3%) | 988 (18.4%) |
Race in Lewis County
The most populous races in Lewis County are White / Caucasian (70,154 | 84.9%), Hispanic or Latino (9,220 | 11.2%), and Two or more Races (7,905 | 9.6%).
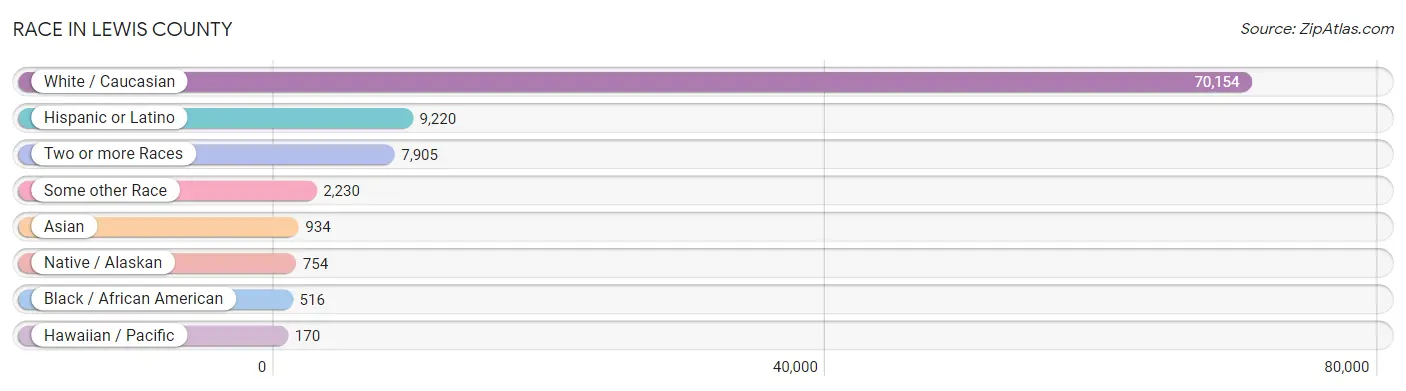
| Race | # Population | % Population |
| Asian | 934 | 1.1% |
| Black / African American | 516 | 0.6% |
| Hawaiian / Pacific | 170 | 0.2% |
| Hispanic or Latino | 9,220 | 11.2% |
| Native / Alaskan | 754 | 0.9% |
| White / Caucasian | 70,154 | 84.9% |
| Two or more Races | 7,905 | 9.6% |
| Some other Race | 2,230 | 2.7% |
| Total | 82,663 | 100.0% |
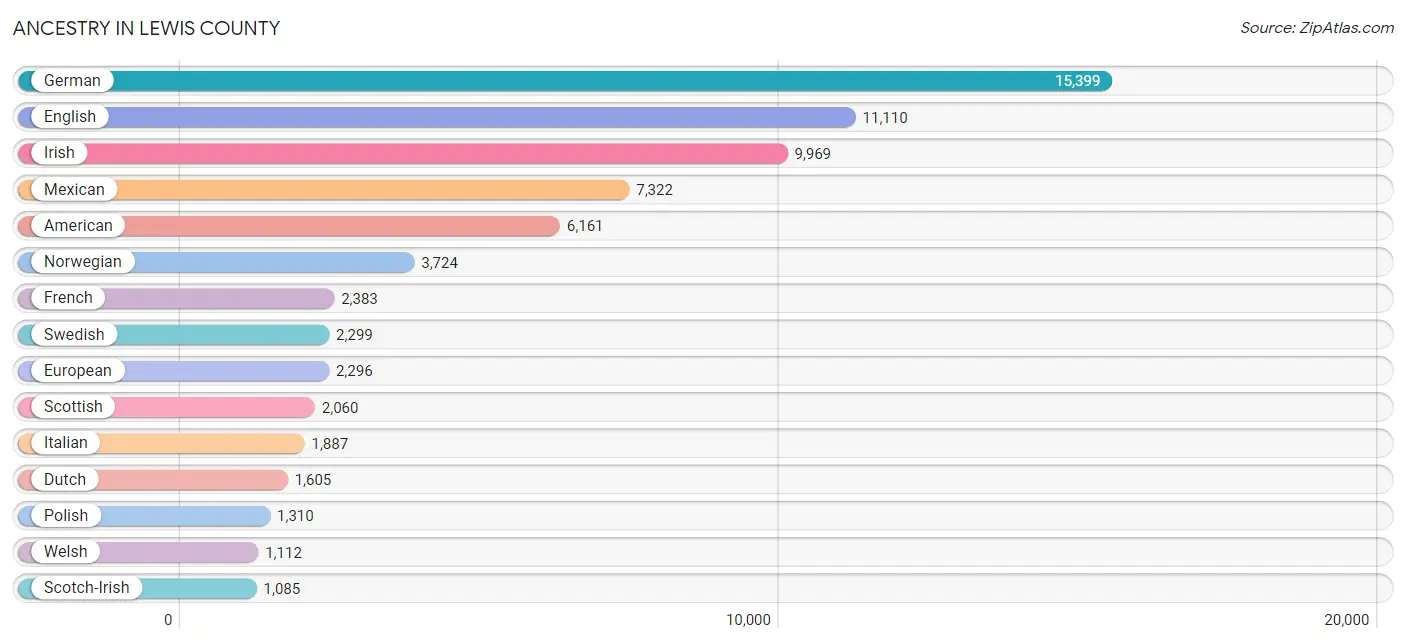
Ancestry in Lewis County
The most populous ancestries reported in Lewis County are German (15,399 | 18.6%), English (11,110 | 13.4%), Irish (9,969 | 12.1%), Mexican (7,322 | 8.9%), and American (6,161 | 7.4%), together accounting for 60.4% of all Lewis County residents.
| Ancestry | # Population | % Population |
| African | 123 | 0.2% |
| Alaska Native | 6 | 0.0% |
| Aleut | 7 | 0.0% |
| American | 6,161 | 7.4% |
| Apache | 33 | 0.0% |
| Arab | 99 | 0.1% |
| Armenian | 75 | 0.1% |
| Austrian | 180 | 0.2% |
| Belgian | 45 | 0.1% |
| Bhutanese | 193 | 0.2% |
| Blackfeet | 223 | 0.3% |
| Brazilian | 2 | 0.0% |
| British | 801 | 1.0% |
| Bulgarian | 22 | 0.0% |
| Burmese | 323 | 0.4% |
| Cambodian | 7 | 0.0% |
| Canadian | 347 | 0.4% |
| Central American | 329 | 0.4% |
| Central American Indian | 15 | 0.0% |
| Cherokee | 706 | 0.9% |
| Chickasaw | 10 | 0.0% |
| Chippewa | 88 | 0.1% |
| Choctaw | 132 | 0.2% |
| Colombian | 178 | 0.2% |
| Colville | 31 | 0.0% |
| Comanche | 9 | 0.0% |
| Costa Rican | 11 | 0.0% |
| Creek | 3 | 0.0% |
| Croatian | 27 | 0.0% |
| Cuban | 150 | 0.2% |
| Czech | 168 | 0.2% |
| Czechoslovakian | 316 | 0.4% |
| Danish | 535 | 0.6% |
| Delaware | 3 | 0.0% |
| Dutch | 1,605 | 1.9% |
| Dutch West Indian | 1 | 0.0% |
| Eastern European | 252 | 0.3% |
| Egyptian | 6 | 0.0% |
| English | 11,110 | 13.4% |
| Ethiopian | 6 | 0.0% |
| European | 2,296 | 2.8% |
| Fijian | 9 | 0.0% |
| Finnish | 850 | 1.0% |
| French | 2,383 | 2.9% |
| French American Indian | 9 | 0.0% |
| French Canadian | 335 | 0.4% |
| German | 15,399 | 18.6% |
| Greek | 183 | 0.2% |
| Guamanian / Chamorro | 176 | 0.2% |
| Guatemalan | 6 | 0.0% |
| Haitian | 20 | 0.0% |
| Honduran | 42 | 0.1% |
| Hungarian | 162 | 0.2% |
| Icelander | 8 | 0.0% |
| Indian (Asian) | 359 | 0.4% |
| Inupiat | 24 | 0.0% |
| Iranian | 40 | 0.1% |
| Irish | 9,969 | 12.1% |
| Iroquois | 53 | 0.1% |
| Italian | 1,887 | 2.3% |
| Jamaican | 9 | 0.0% |
| Kenyan | 12 | 0.0% |
| Kiowa | 38 | 0.1% |
| Korean | 536 | 0.6% |
| Laotian | 6 | 0.0% |
| Latvian | 33 | 0.0% |
| Lebanese | 74 | 0.1% |
| Lithuanian | 86 | 0.1% |
| Lumbee | 2 | 0.0% |
| Luxembourger | 12 | 0.0% |
| Menominee | 3 | 0.0% |
| Mexican | 7,322 | 8.9% |
| Mexican American Indian | 64 | 0.1% |
| Moroccan | 3 | 0.0% |
| Native Hawaiian | 209 | 0.3% |
| Navajo | 102 | 0.1% |
| New Zealander | 68 | 0.1% |
| Northern European | 143 | 0.2% |
| Norwegian | 3,724 | 4.5% |
| Osage | 5 | 0.0% |
| Paiute | 1 | 0.0% |
| Pakistani | 4 | 0.0% |
| Panamanian | 12 | 0.0% |
| Pennsylvania German | 28 | 0.0% |
| Peruvian | 75 | 0.1% |
| Polish | 1,310 | 1.6% |
| Portuguese | 201 | 0.2% |
| Potawatomi | 37 | 0.0% |
| Puerto Rican | 427 | 0.5% |
| Puget Sound Salish | 80 | 0.1% |
| Romanian | 79 | 0.1% |
| Russian | 534 | 0.6% |
| Salvadoran | 258 | 0.3% |
| Samoan | 21 | 0.0% |
| Scandinavian | 765 | 0.9% |
| Scotch-Irish | 1,085 | 1.3% |
| Scottish | 2,060 | 2.5% |
| Serbian | 9 | 0.0% |
| Shoshone | 40 | 0.1% |
| Sioux | 115 | 0.1% |
| Slavic | 48 | 0.1% |
| Slovak | 61 | 0.1% |
| Slovene | 27 | 0.0% |
| South African | 7 | 0.0% |
| South American | 253 | 0.3% |
| South American Indian | 5 | 0.0% |
| Spaniard | 310 | 0.4% |
| Spanish | 114 | 0.1% |
| Sri Lankan | 200 | 0.2% |
| Subsaharan African | 164 | 0.2% |
| Swedish | 2,299 | 2.8% |
| Swiss | 617 | 0.7% |
| Thai | 144 | 0.2% |
| Tlingit-Haida | 81 | 0.1% |
| Trinidadian and Tobagonian | 2 | 0.0% |
| Tsimshian | 31 | 0.0% |
| Ukrainian | 264 | 0.3% |
| Welsh | 1,112 | 1.3% |
| Yakama | 38 | 0.1% |
| Yugoslavian | 9 | 0.0% |
| Yup'ik | 61 | 0.1% | View All 121 Rows |
Immigrants in Lewis County
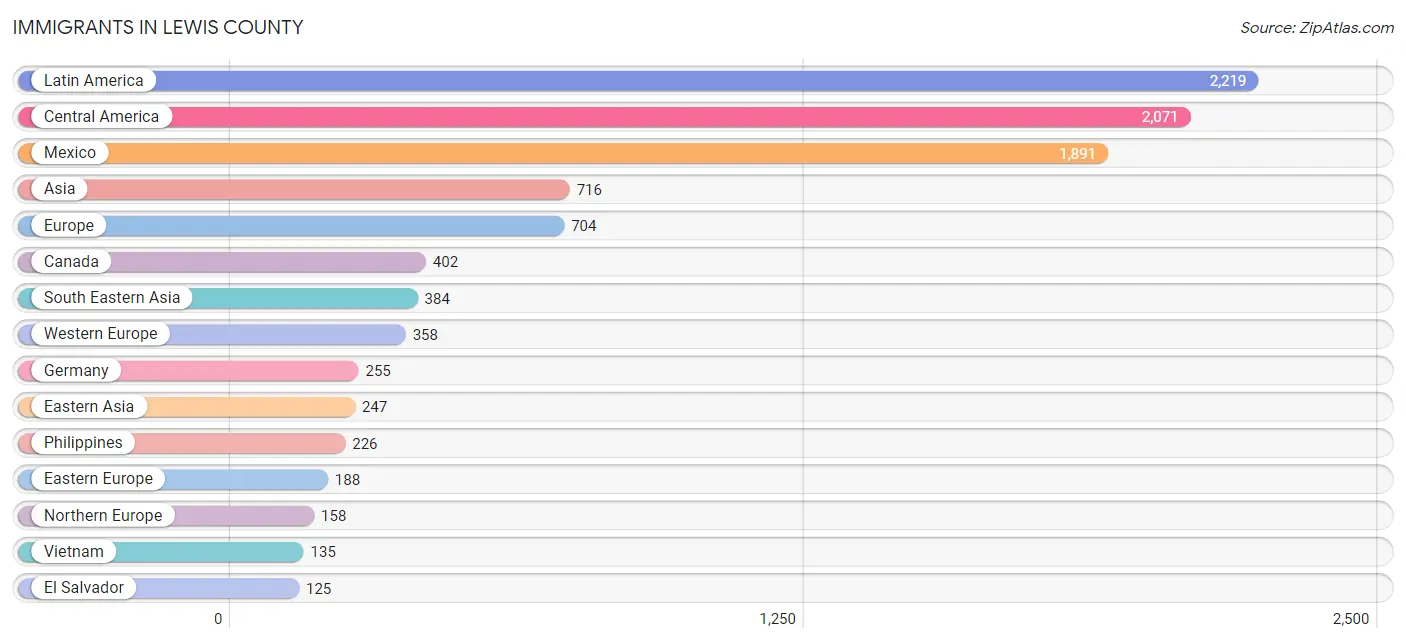
The most numerous immigrant groups reported in Lewis County came from Latin America (2,219 | 2.7%), Central America (2,071 | 2.5%), Mexico (1,891 | 2.3%), Asia (716 | 0.9%), and Europe (704 | 0.9%), together accounting for 9.2% of all Lewis County residents.
| Immigration Origin | # Population | % Population |
| Africa | 45 | 0.1% |
| Asia | 716 | 0.9% |
| Brazil | 1 | 0.0% |
| Bulgaria | 11 | 0.0% |
| Canada | 402 | 0.5% |
| Caribbean | 36 | 0.0% |
| Central America | 2,071 | 2.5% |
| China | 124 | 0.2% |
| Colombia | 52 | 0.1% |
| Cuba | 16 | 0.0% |
| Czechoslovakia | 12 | 0.0% |
| Eastern Africa | 18 | 0.0% |
| Eastern Asia | 247 | 0.3% |
| Eastern Europe | 188 | 0.2% |
| El Salvador | 125 | 0.2% |
| England | 104 | 0.1% |
| Ethiopia | 6 | 0.0% |
| Europe | 704 | 0.9% |
| France | 8 | 0.0% |
| Germany | 255 | 0.3% |
| Guatemala | 11 | 0.0% |
| Haiti | 20 | 0.0% |
| Hong Kong | 3 | 0.0% |
| India | 47 | 0.1% |
| Indonesia | 1 | 0.0% |
| Iran | 38 | 0.1% |
| Kenya | 12 | 0.0% |
| Korea | 123 | 0.2% |
| Latin America | 2,219 | 2.7% |
| Mexico | 1,891 | 2.3% |
| Netherlands | 95 | 0.1% |
| Northern Europe | 158 | 0.2% |
| Norway | 8 | 0.0% |
| Oceania | 52 | 0.1% |
| Panama | 44 | 0.1% |
| Peru | 59 | 0.1% |
| Philippines | 226 | 0.3% |
| Poland | 29 | 0.0% |
| Russia | 16 | 0.0% |
| Scotland | 3 | 0.0% |
| Serbia | 1 | 0.0% |
| South Africa | 7 | 0.0% |
| South America | 112 | 0.1% |
| South Central Asia | 85 | 0.1% |
| South Eastern Asia | 384 | 0.5% |
| Sweden | 4 | 0.0% |
| Thailand | 4 | 0.0% |
| Ukraine | 119 | 0.1% |
| Vietnam | 135 | 0.2% |
| Western Africa | 20 | 0.0% |
| Western Europe | 358 | 0.4% | View All 51 Rows |
Sex and Age in Lewis County
Sex and Age in Lewis County
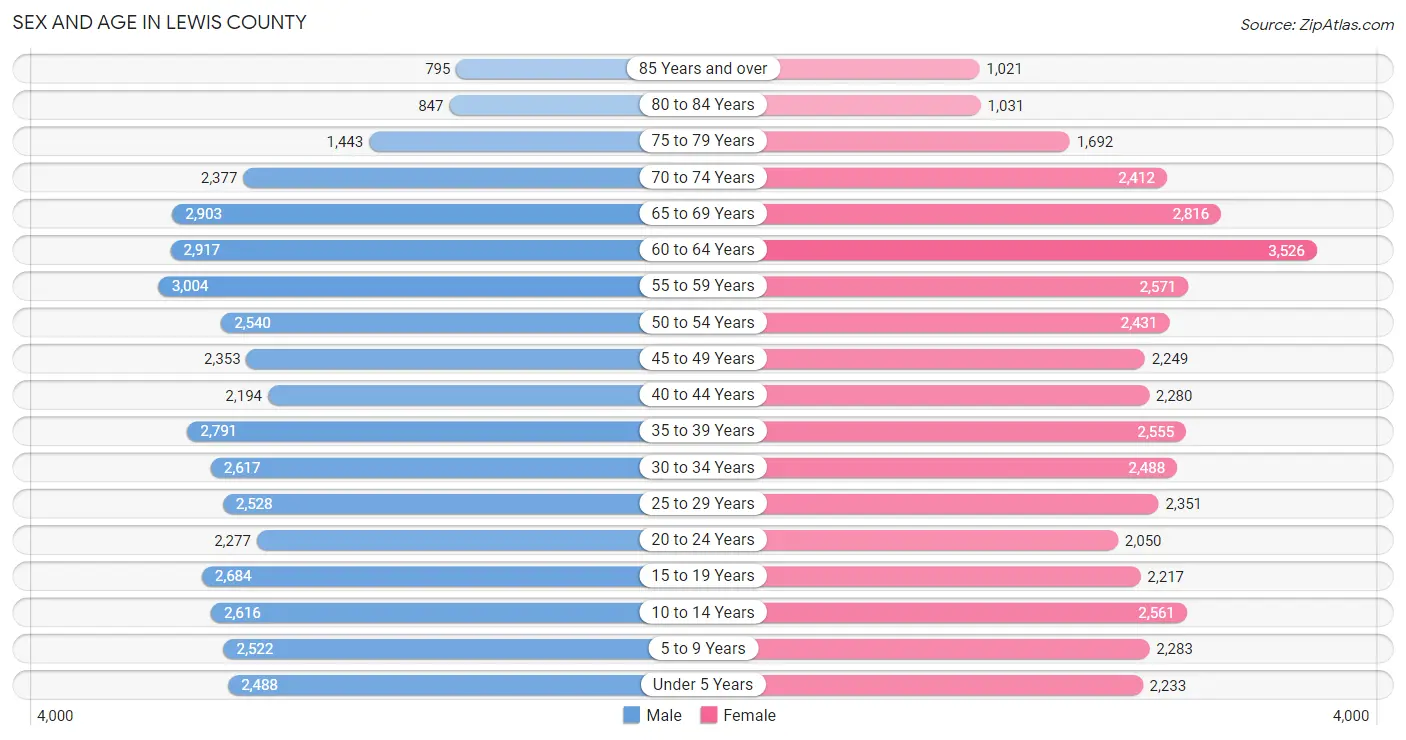
The most populous age groups in Lewis County are 55 to 59 Years (3,004 | 7.2%) for men and 60 to 64 Years (3,526 | 8.6%) for women.
| Age Bracket | Male | Female |
| Under 5 Years | 2,488 (5.9%) | 2,233 (5.5%) |
| 5 to 9 Years | 2,522 (6.0%) | 2,283 (5.6%) |
| 10 to 14 Years | 2,616 (6.2%) | 2,561 (6.3%) |
| 15 to 19 Years | 2,684 (6.4%) | 2,217 (5.4%) |
| 20 to 24 Years | 2,277 (5.4%) | 2,050 (5.0%) |
| 25 to 29 Years | 2,528 (6.0%) | 2,351 (5.8%) |
| 30 to 34 Years | 2,617 (6.2%) | 2,488 (6.1%) |
| 35 to 39 Years | 2,791 (6.7%) | 2,555 (6.3%) |
| 40 to 44 Years | 2,194 (5.2%) | 2,280 (5.6%) |
| 45 to 49 Years | 2,353 (5.6%) | 2,249 (5.5%) |
| 50 to 54 Years | 2,540 (6.1%) | 2,431 (6.0%) |
| 55 to 59 Years | 3,004 (7.2%) | 2,571 (6.3%) |
| 60 to 64 Years | 2,917 (7.0%) | 3,526 (8.6%) |
| 65 to 69 Years | 2,903 (6.9%) | 2,816 (6.9%) |
| 70 to 74 Years | 2,377 (5.7%) | 2,412 (5.9%) |
| 75 to 79 Years | 1,443 (3.4%) | 1,692 (4.2%) |
| 80 to 84 Years | 847 (2.0%) | 1,031 (2.5%) |
| 85 Years and over | 795 (1.9%) | 1,021 (2.5%) |
| Total | 41,896 (100.0%) | 40,767 (100.0%) |
Families and Households in Lewis County
Median Family Size in Lewis County
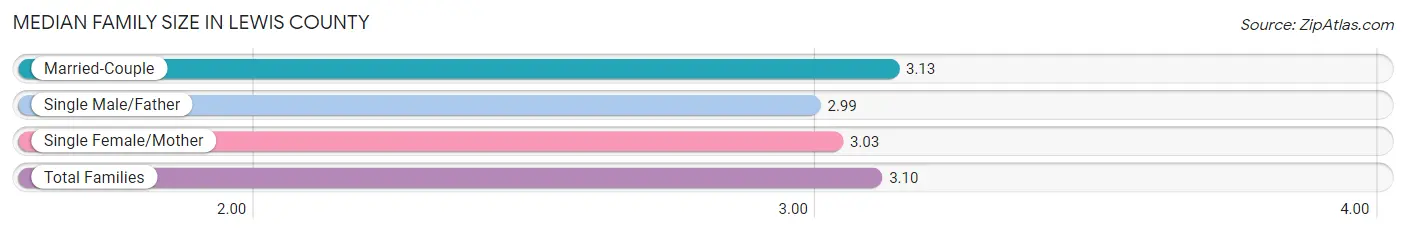
The median family size in Lewis County is 3.10 persons per family, with married-couple families (15,568 | 74.4%) accounting for the largest median family size of 3.13 persons per family. On the other hand, single male/father families (2,016 | 9.6%) represent the smallest median family size with 2.99 persons per family.
| Family Type | # Families | Family Size |
| Married-Couple | 15,568 (74.4%) | 3.13 |
| Single Male/Father | 2,016 (9.6%) | 2.99 |
| Single Female/Mother | 3,351 (16.0%) | 3.03 |
| Total Families | 20,935 (100.0%) | 3.10 |
Median Household Size in Lewis County
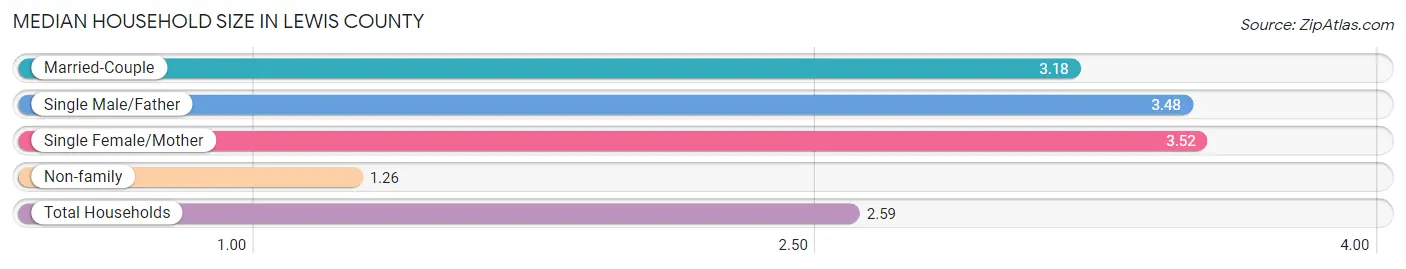
The median household size in Lewis County is 2.59 persons per household, with single female/mother households (3,351 | 10.6%) accounting for the largest median household size of 3.52 persons per household. non-family households (10,576 | 33.6%) represent the smallest median household size with 1.26 persons per household.
| Household Type | # Households | Household Size |
| Married-Couple | 15,568 (49.4%) | 3.18 |
| Single Male/Father | 2,016 (6.4%) | 3.48 |
| Single Female/Mother | 3,351 (10.6%) | 3.52 |
| Non-family | 10,576 (33.6%) | 1.26 |
| Total Households | 31,511 (100.0%) | 2.59 |
Household Size by Marriage Status in Lewis County
Out of a total of 31,511 households in Lewis County, 20,935 (66.4%) are family households, while 10,576 (33.6%) are nonfamily households. The most numerous type of family households are 2-person households, comprising 9,747, and the most common type of nonfamily households are 1-person households, comprising 8,277.
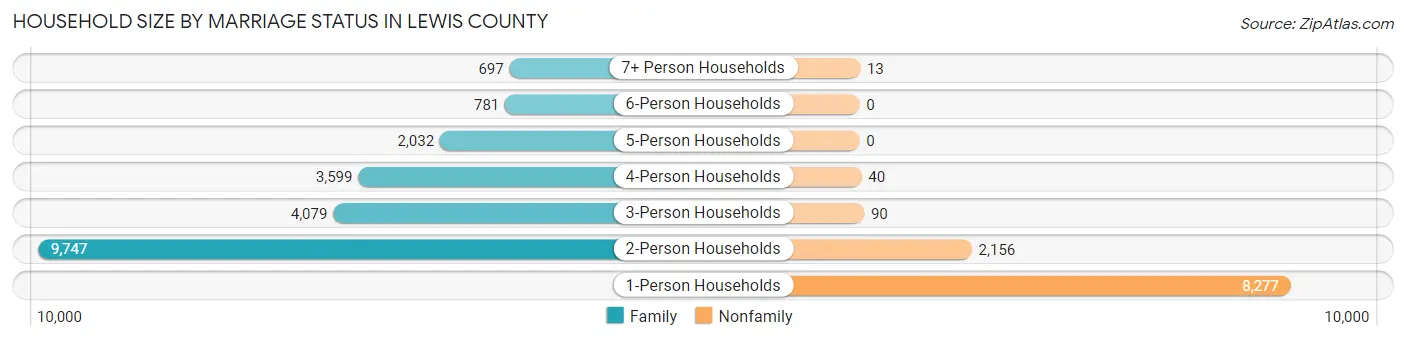
| Household Size | Family Households | Nonfamily Households |
| 1-Person Households | - | 8,277 (26.3%) |
| 2-Person Households | 9,747 (30.9%) | 2,156 (6.8%) |
| 3-Person Households | 4,079 (12.9%) | 90 (0.3%) |
| 4-Person Households | 3,599 (11.4%) | 40 (0.1%) |
| 5-Person Households | 2,032 (6.5%) | 0 (0.0%) |
| 6-Person Households | 781 (2.5%) | 0 (0.0%) |
| 7+ Person Households | 697 (2.2%) | 13 (0.0%) |
| Total | 20,935 (66.4%) | 10,576 (33.6%) |
Female Fertility in Lewis County
Fertility by Age in Lewis County
Average fertility rate in Lewis County is 75.0 births per 1,000 women. Women in the age bracket of 20 to 34 years have the highest fertility rate with 116.0 births per 1,000 women. Women in the age bracket of 20 to 34 years acount for 63.4% of all women with births.
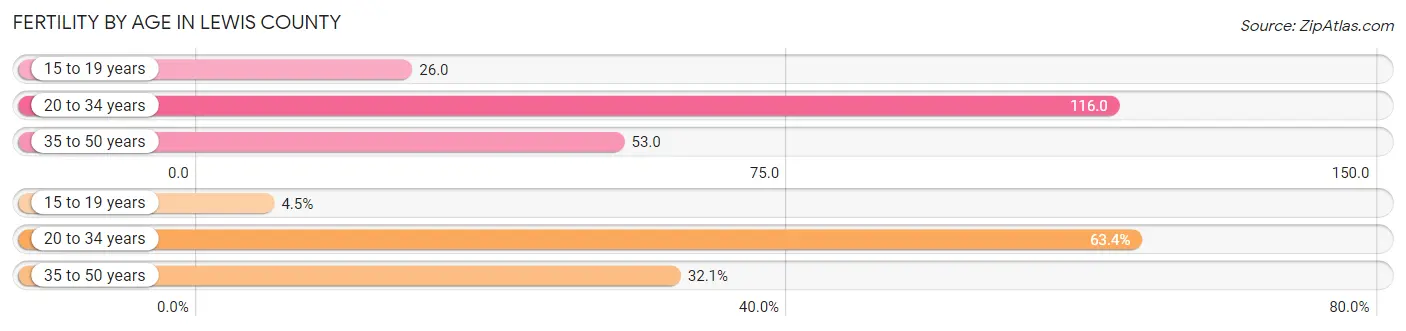
| Age Bracket | Women with Births | Births / 1,000 Women |
| 15 to 19 years | 57 (4.5%) | 26.0 |
| 20 to 34 years | 802 (63.4%) | 116.0 |
| 35 to 50 years | 406 (32.1%) | 53.0 |
| Total | 1,265 (100.0%) | 75.0 |
Fertility by Age by Marriage Status in Lewis County
68.9% of women with births (1,265) in Lewis County are married. The highest percentage of unmarried women with births falls into 15 to 19 years age bracket with 100.0% of them unmarried at the time of birth, while the lowest percentage of unmarried women with births belong to 35 to 50 years age bracket with 11.1% of them unmarried.
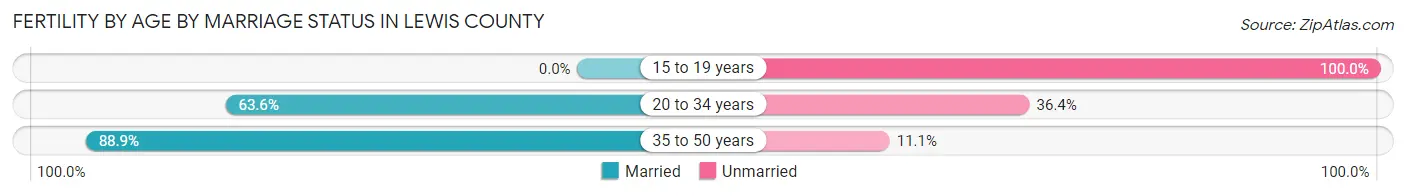
| Age Bracket | Married | Unmarried |
| 15 to 19 years | 0 (0.0%) | 57 (100.0%) |
| 20 to 34 years | 510 (63.6%) | 292 (36.4%) |
| 35 to 50 years | 361 (88.9%) | 45 (11.1%) |
| Total | 872 (68.9%) | 393 (31.1%) |
Fertility by Education in Lewis County
Average fertility rate in Lewis County is 75.0 births per 1,000 women. Women with the education attainment of bachelor's degree have the highest fertility rate of 102.0 births per 1,000 women, while women with the education attainment of graduate degree have the lowest fertility at 43.0 births per 1,000 women. Women with the education attainment of college or associate's degree represent 37.6% of all women with births.
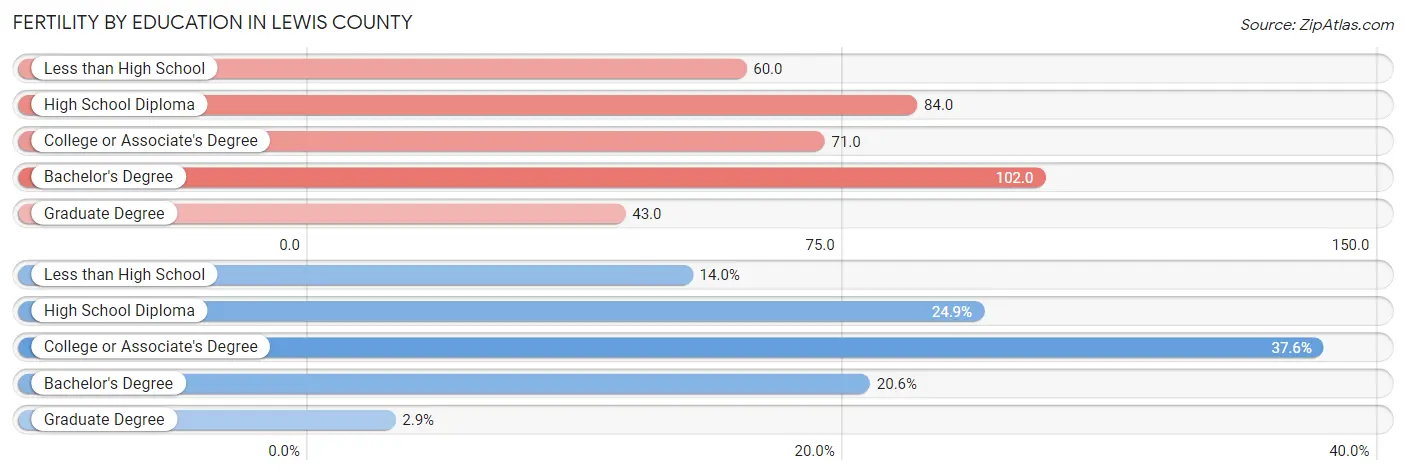
| Educational Attainment | Women with Births | Births / 1,000 Women |
| Less than High School | 177 (14.0%) | 60.0 |
| High School Diploma | 315 (24.9%) | 84.0 |
| College or Associate's Degree | 476 (37.6%) | 71.0 |
| Bachelor's Degree | 261 (20.6%) | 102.0 |
| Graduate Degree | 36 (2.9%) | 43.0 |
| Total | 1,265 (100.0%) | 75.0 |
Fertility by Education by Marriage Status in Lewis County
31.1% of women with births in Lewis County are unmarried. Women with the educational attainment of graduate degree are most likely to be married with 100.0% of them married at childbirth, while women with the educational attainment of less than high school are least likely to be married with 74.6% of them unmarried at childbirth.
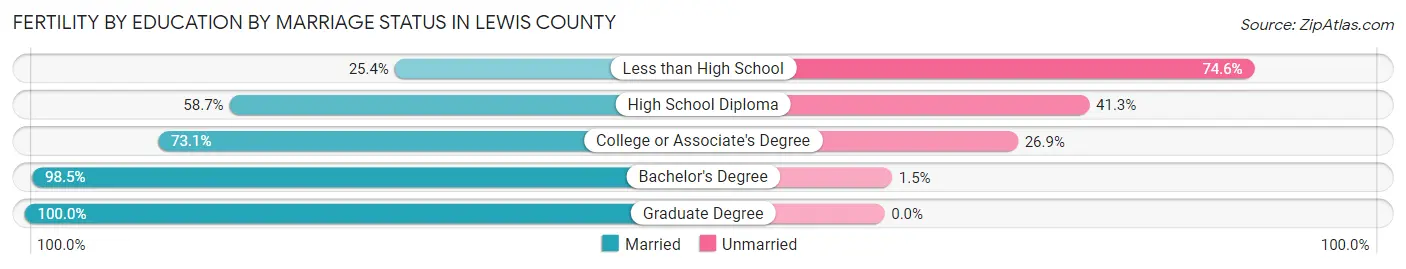
| Educational Attainment | Married | Unmarried |
| Less than High School | 45 (25.4%) | 132 (74.6%) |
| High School Diploma | 185 (58.7%) | 130 (41.3%) |
| College or Associate's Degree | 348 (73.1%) | 128 (26.9%) |
| Bachelor's Degree | 257 (98.5%) | 4 (1.5%) |
| Graduate Degree | 36 (100.0%) | 0 (0.0%) |
| Total | 872 (68.9%) | 393 (31.1%) |
Employment Characteristics in Lewis County
Employment by Class of Employer in Lewis County
Among the 33,406 employed individuals in Lewis County, private company employees (21,324 | 63.8%), state government employees (3,247 | 9.7%), and local government employees (2,652 | 7.9%) make up the most common classes of employment.
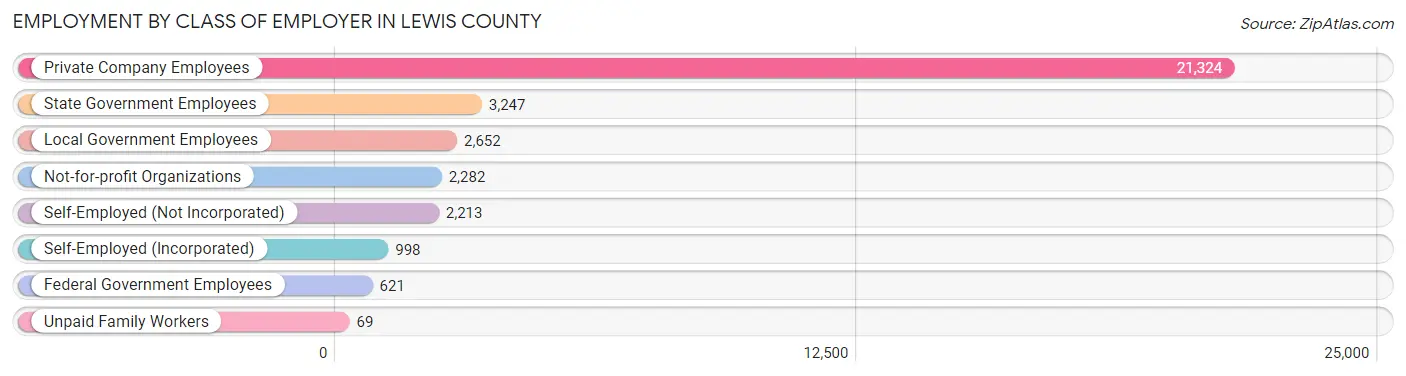
| Employer Class | # Employees | % Employees |
| Private Company Employees | 21,324 | 63.8% |
| Self-Employed (Incorporated) | 998 | 3.0% |
| Self-Employed (Not Incorporated) | 2,213 | 6.6% |
| Not-for-profit Organizations | 2,282 | 6.8% |
| Local Government Employees | 2,652 | 7.9% |
| State Government Employees | 3,247 | 9.7% |
| Federal Government Employees | 621 | 1.9% |
| Unpaid Family Workers | 69 | 0.2% |
| Total | 33,406 | 100.0% |
Employment Status by Age in Lewis County
According to the labor force statistics for Lewis County, out of the total population over 16 years of age (67,101), 55.0% or 36,906 individuals are in the labor force, with 6.3% or 2,325 of them unemployed. The age group with the highest labor force participation rate is 30 to 34 years, with 77.5% or 3,956 individuals in the labor force. Within the labor force, the 16 to 19 years age range has the highest percentage of unemployed individuals, with 18.7% or 307 of them being unemployed.
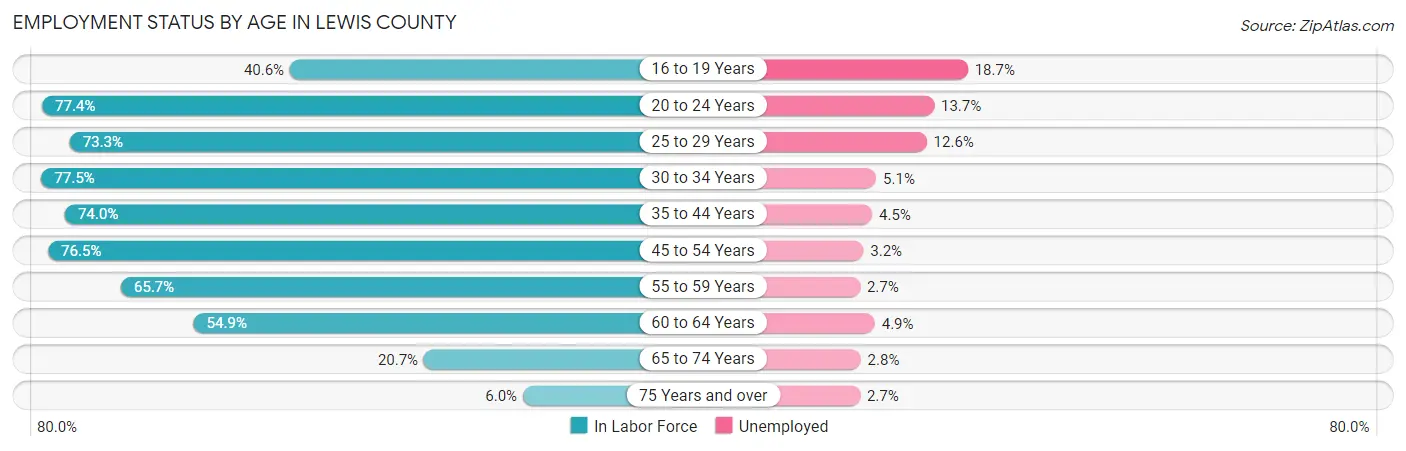
| Age Bracket | In Labor Force | Unemployed |
| 16 to 19 Years | 1,641 (40.6%) | 307 (18.7%) |
| 20 to 24 Years | 3,349 (77.4%) | 459 (13.7%) |
| 25 to 29 Years | 3,576 (73.3%) | 451 (12.6%) |
| 30 to 34 Years | 3,956 (77.5%) | 202 (5.1%) |
| 35 to 44 Years | 7,267 (74.0%) | 327 (4.5%) |
| 45 to 54 Years | 7,323 (76.5%) | 234 (3.2%) |
| 55 to 59 Years | 3,663 (65.7%) | 99 (2.7%) |
| 60 to 64 Years | 3,537 (54.9%) | 173 (4.9%) |
| 65 to 74 Years | 2,175 (20.7%) | 61 (2.8%) |
| 75 Years and over | 410 (6.0%) | 11 (2.7%) |
| Total | 36,906 (55.0%) | 2,325 (6.3%) |
Employment Status by Educational Attainment in Lewis County
According to labor force statistics for Lewis County, 70.8% of individuals (29,308) out of the total population between 25 and 64 years of age (41,395) are in the labor force, with 5.1% or 1,495 of them being unemployed. The group with the highest labor force participation rate are those with the educational attainment of bachelor's degree or higher, with 84.4% or 6,743 individuals in the labor force. Within the labor force, individuals with less than high school education have the highest percentage of unemployment, with 10.3% or 287 of them being unemployed.
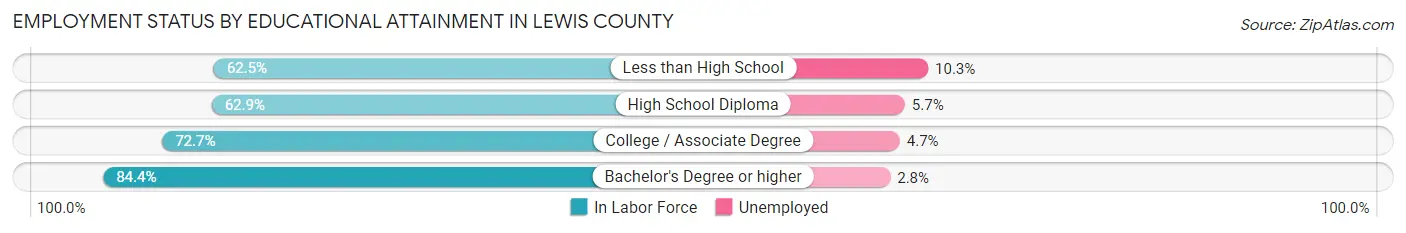
| Educational Attainment | In Labor Force | Unemployed |
| Less than High School | 2,782 (62.5%) | 459 (10.3%) |
| High School Diploma | 7,991 (62.9%) | 724 (5.7%) |
| College / Associate Degree | 11,813 (72.7%) | 764 (4.7%) |
| Bachelor's Degree or higher | 6,743 (84.4%) | 224 (2.8%) |
| Total | 29,308 (70.8%) | 2,111 (5.1%) |
Employment Occupations by Sex in Lewis County
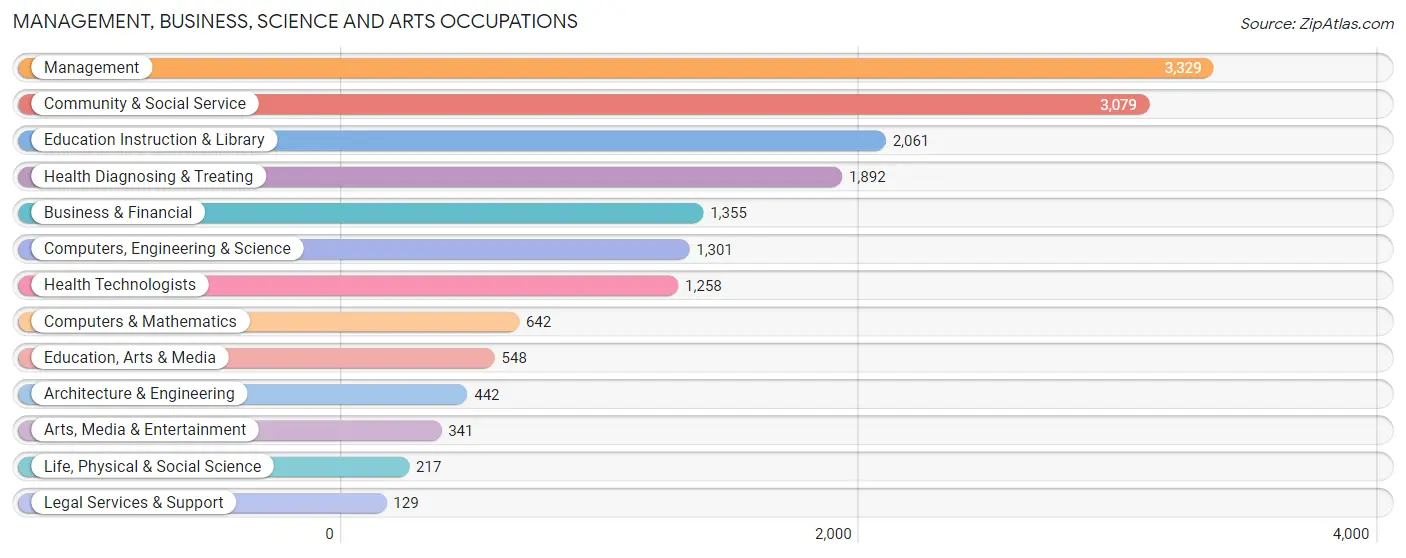
Management, Business, Science and Arts Occupations
The most common Management, Business, Science and Arts occupations in Lewis County are Management (3,329 | 9.7%), Community & Social Service (3,079 | 8.9%), Education Instruction & Library (2,061 | 6.0%), Health Diagnosing & Treating (1,892 | 5.5%), and Business & Financial (1,355 | 3.9%).
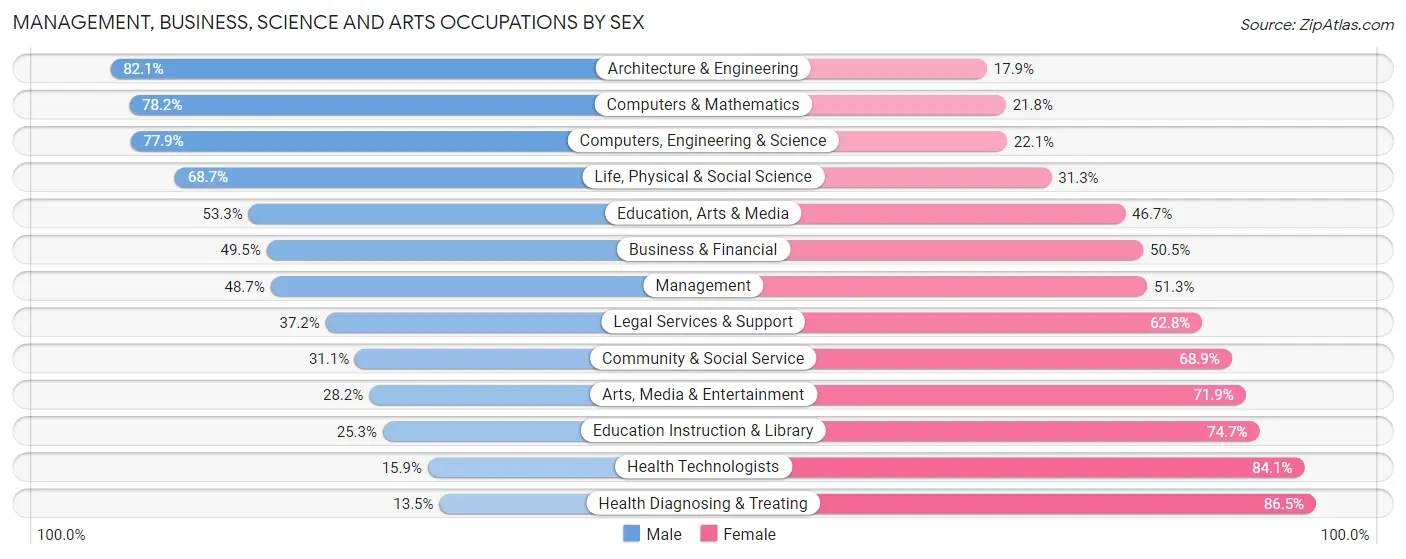
Management, Business, Science and Arts Occupations by Sex
Within the Management, Business, Science and Arts occupations in Lewis County, the most male-oriented occupations are Architecture & Engineering (82.1%), Computers & Mathematics (78.2%), and Computers, Engineering & Science (77.9%), while the most female-oriented occupations are Health Diagnosing & Treating (86.5%), Health Technologists (84.1%), and Education Instruction & Library (74.7%).
| Occupation | Male | Female |
| Management | 1,621 (48.7%) | 1,708 (51.3%) |
| Business & Financial | 671 (49.5%) | 684 (50.5%) |
| Computers, Engineering & Science | 1,014 (77.9%) | 287 (22.1%) |
| Computers & Mathematics | 502 (78.2%) | 140 (21.8%) |
| Architecture & Engineering | 363 (82.1%) | 79 (17.9%) |
| Life, Physical & Social Science | 149 (68.7%) | 68 (31.3%) |
| Community & Social Service | 957 (31.1%) | 2,122 (68.9%) |
| Education, Arts & Media | 292 (53.3%) | 256 (46.7%) |
| Legal Services & Support | 48 (37.2%) | 81 (62.8%) |
| Education Instruction & Library | 521 (25.3%) | 1,540 (74.7%) |
| Arts, Media & Entertainment | 96 (28.1%) | 245 (71.9%) |
| Health Diagnosing & Treating | 255 (13.5%) | 1,637 (86.5%) |
| Health Technologists | 200 (15.9%) | 1,058 (84.1%) |
| Total (Category) | 4,518 (41.2%) | 6,438 (58.8%) |
| Total (Overall) | 18,990 (55.1%) | 15,499 (44.9%) |
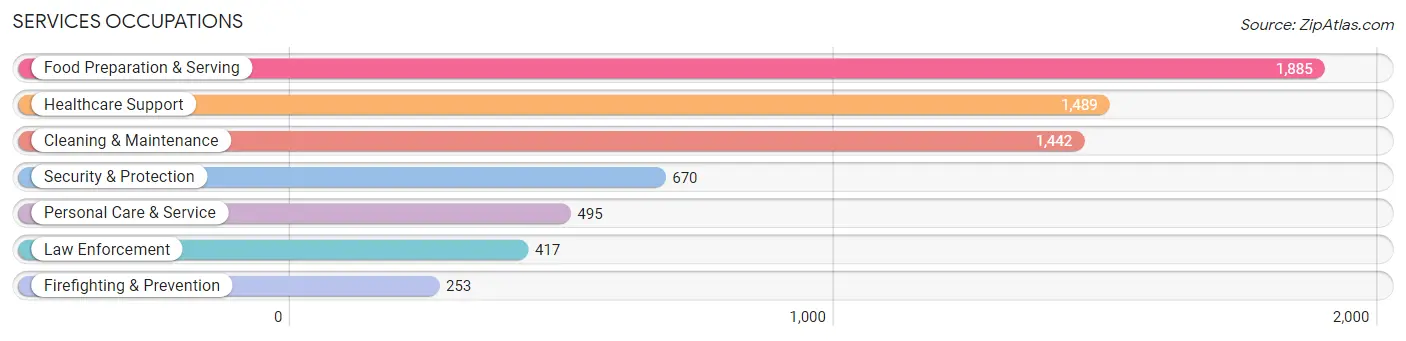
Services Occupations
The most common Services occupations in Lewis County are Food Preparation & Serving (1,885 | 5.5%), Healthcare Support (1,489 | 4.3%), Cleaning & Maintenance (1,442 | 4.2%), Security & Protection (670 | 1.9%), and Personal Care & Service (495 | 1.4%).
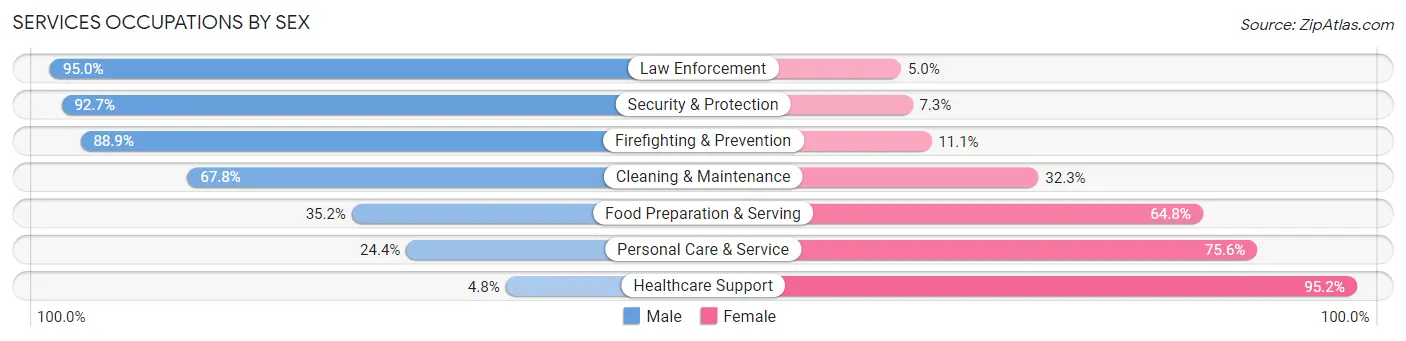
Services Occupations by Sex
Within the Services occupations in Lewis County, the most male-oriented occupations are Law Enforcement (95.0%), Security & Protection (92.7%), and Firefighting & Prevention (88.9%), while the most female-oriented occupations are Healthcare Support (95.2%), Personal Care & Service (75.6%), and Food Preparation & Serving (64.8%).
| Occupation | Male | Female |
| Healthcare Support | 71 (4.8%) | 1,418 (95.2%) |
| Security & Protection | 621 (92.7%) | 49 (7.3%) |
| Firefighting & Prevention | 225 (88.9%) | 28 (11.1%) |
| Law Enforcement | 396 (95.0%) | 21 (5.0%) |
| Food Preparation & Serving | 664 (35.2%) | 1,221 (64.8%) |
| Cleaning & Maintenance | 977 (67.7%) | 465 (32.3%) |
| Personal Care & Service | 121 (24.4%) | 374 (75.6%) |
| Total (Category) | 2,454 (41.0%) | 3,527 (59.0%) |
| Total (Overall) | 18,990 (55.1%) | 15,499 (44.9%) |
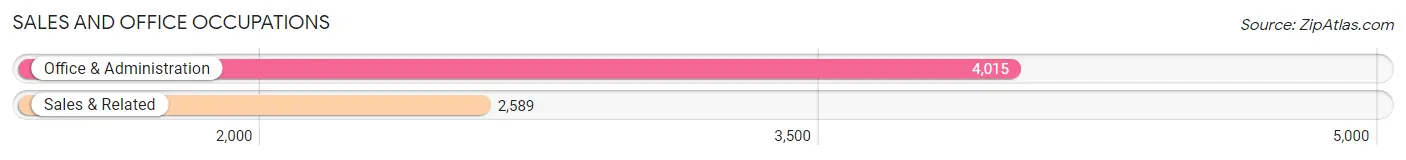
Sales and Office Occupations
The most common Sales and Office occupations in Lewis County are Office & Administration (4,015 | 11.6%), and Sales & Related (2,589 | 7.5%).
Sales and Office Occupations by Sex
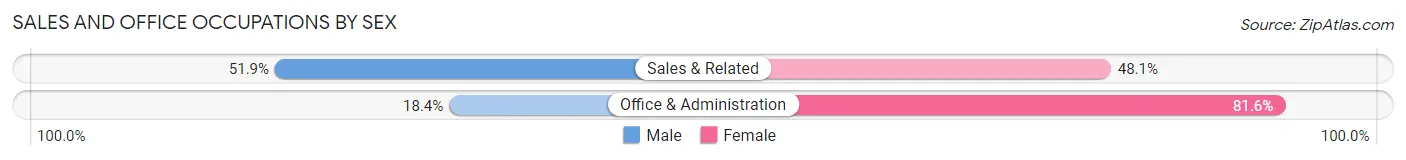
| Occupation | Male | Female |
| Sales & Related | 1,343 (51.9%) | 1,246 (48.1%) |
| Office & Administration | 737 (18.4%) | 3,278 (81.6%) |
| Total (Category) | 2,080 (31.5%) | 4,524 (68.5%) |
| Total (Overall) | 18,990 (55.1%) | 15,499 (44.9%) |
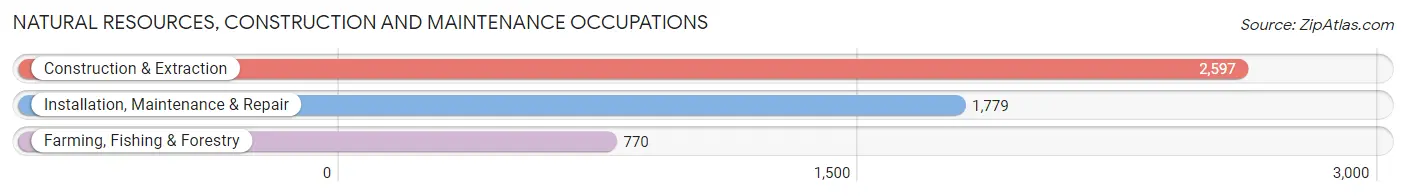
Natural Resources, Construction and Maintenance Occupations
The most common Natural Resources, Construction and Maintenance occupations in Lewis County are Construction & Extraction (2,597 | 7.5%), Installation, Maintenance & Repair (1,779 | 5.2%), and Farming, Fishing & Forestry (770 | 2.2%).
Natural Resources, Construction and Maintenance Occupations by Sex
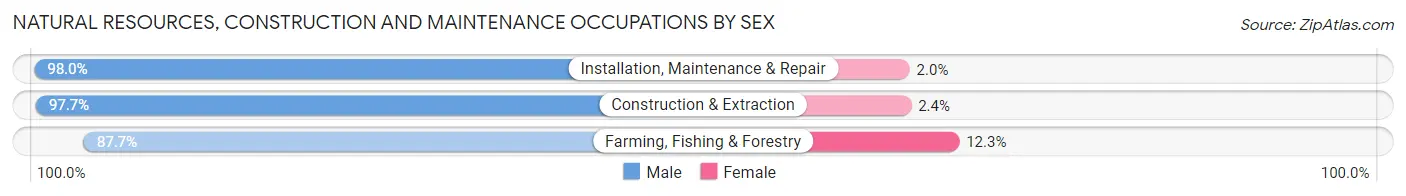
| Occupation | Male | Female |
| Farming, Fishing & Forestry | 675 (87.7%) | 95 (12.3%) |
| Construction & Extraction | 2,536 (97.7%) | 61 (2.4%) |
| Installation, Maintenance & Repair | 1,743 (98.0%) | 36 (2.0%) |
| Total (Category) | 4,954 (96.3%) | 192 (3.7%) |
| Total (Overall) | 18,990 (55.1%) | 15,499 (44.9%) |
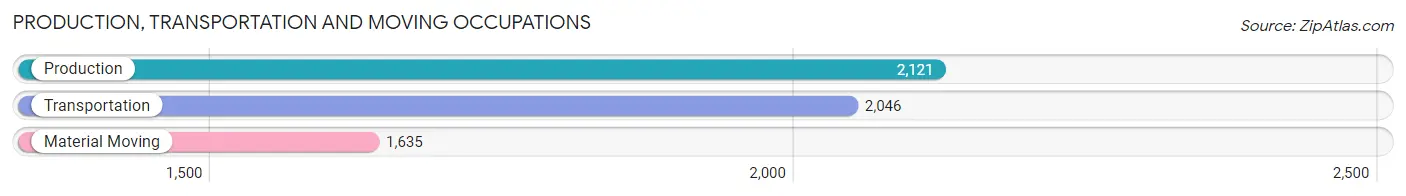
Production, Transportation and Moving Occupations
The most common Production, Transportation and Moving occupations in Lewis County are Production (2,121 | 6.1%), Transportation (2,046 | 5.9%), and Material Moving (1,635 | 4.7%).
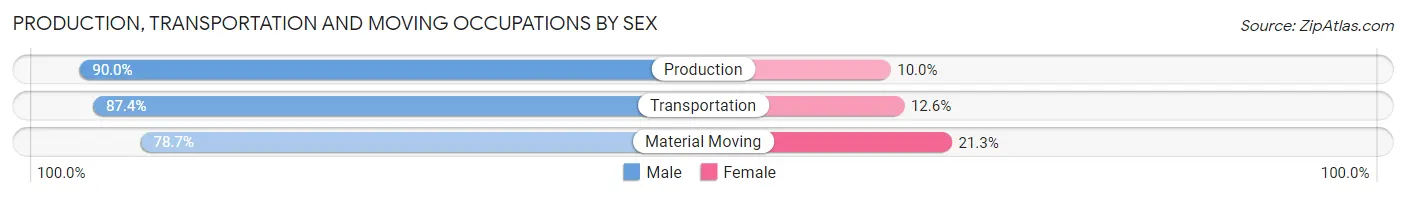
Production, Transportation and Moving Occupations by Sex
| Occupation | Male | Female |
| Production | 1,908 (90.0%) | 213 (10.0%) |
| Transportation | 1,789 (87.4%) | 257 (12.6%) |
| Material Moving | 1,287 (78.7%) | 348 (21.3%) |
| Total (Category) | 4,984 (85.9%) | 818 (14.1%) |
| Total (Overall) | 18,990 (55.1%) | 15,499 (44.9%) |
Employment Industries by Sex in Lewis County
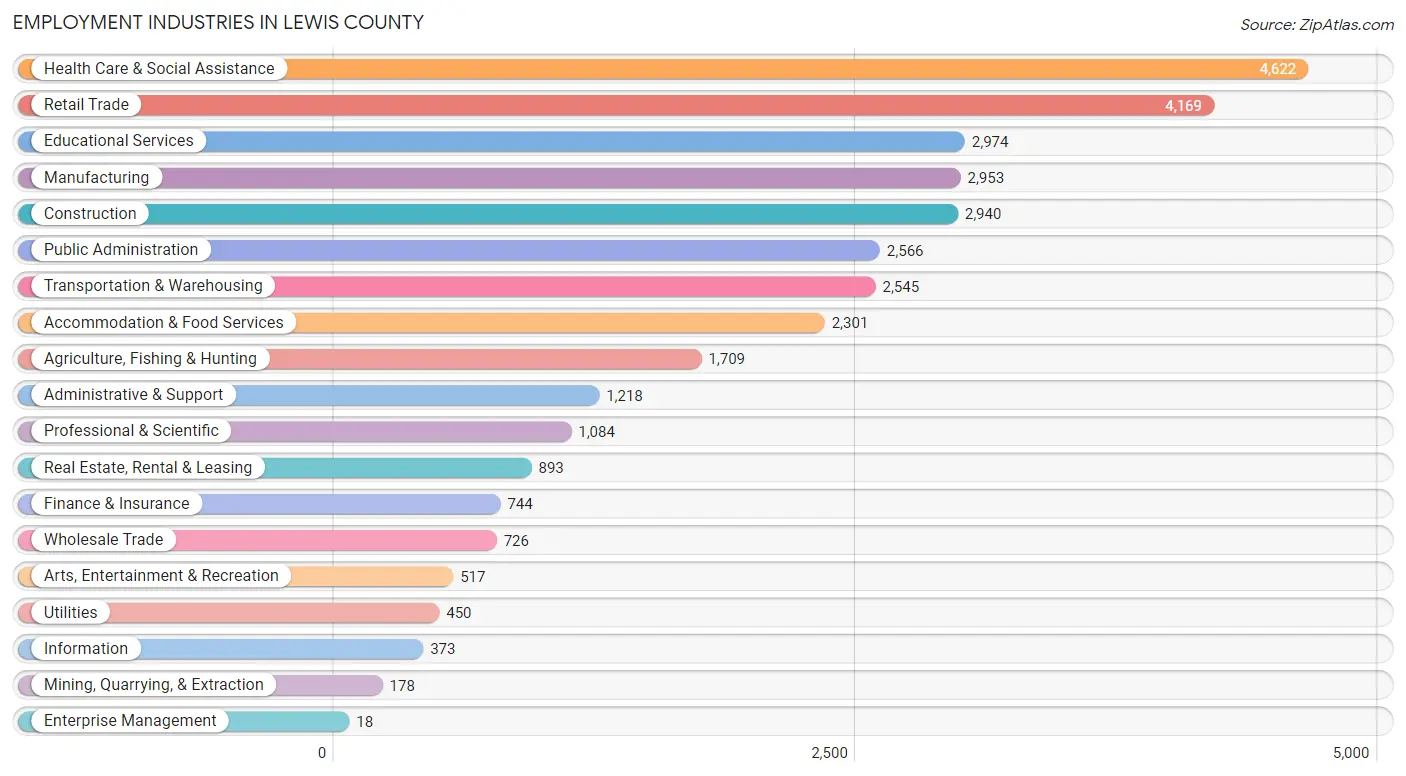
Employment Industries in Lewis County
The major employment industries in Lewis County include Health Care & Social Assistance (4,622 | 13.4%), Retail Trade (4,169 | 12.1%), Educational Services (2,974 | 8.6%), Manufacturing (2,953 | 8.6%), and Construction (2,940 | 8.5%).
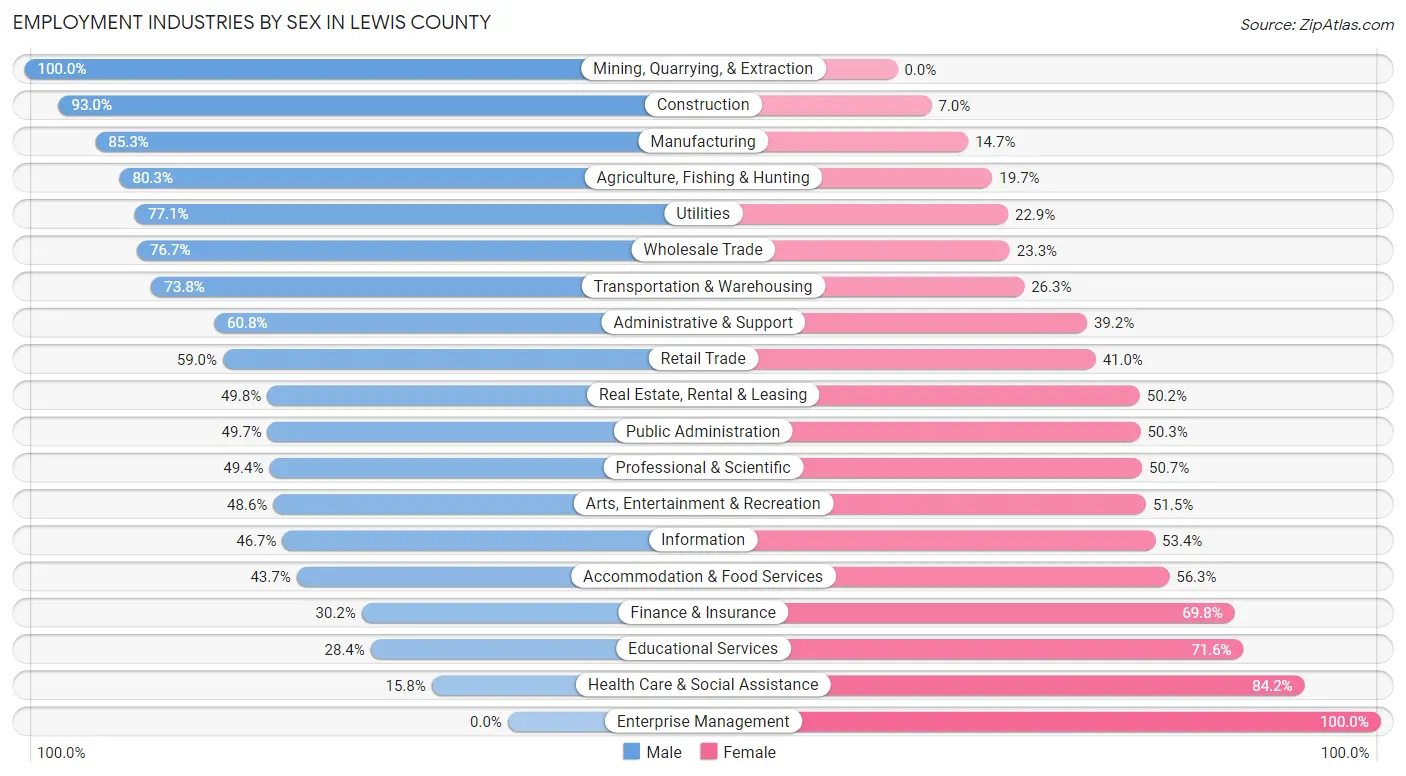
Employment Industries by Sex in Lewis County
The Lewis County industries that see more men than women are Mining, Quarrying, & Extraction (100.0%), Construction (93.0%), and Manufacturing (85.3%), whereas the industries that tend to have a higher number of women are Enterprise Management (100.0%), Health Care & Social Assistance (84.2%), and Educational Services (71.6%).
| Industry | Male | Female |
| Agriculture, Fishing & Hunting | 1,373 (80.3%) | 336 (19.7%) |
| Mining, Quarrying, & Extraction | 178 (100.0%) | 0 (0.0%) |
| Construction | 2,733 (93.0%) | 207 (7.0%) |
| Manufacturing | 2,520 (85.3%) | 433 (14.7%) |
| Wholesale Trade | 557 (76.7%) | 169 (23.3%) |
| Retail Trade | 2,458 (59.0%) | 1,711 (41.0%) |
| Transportation & Warehousing | 1,877 (73.8%) | 668 (26.3%) |
| Utilities | 347 (77.1%) | 103 (22.9%) |
| Information | 174 (46.7%) | 199 (53.3%) |
| Finance & Insurance | 225 (30.2%) | 519 (69.8%) |
| Real Estate, Rental & Leasing | 445 (49.8%) | 448 (50.2%) |
| Professional & Scientific | 535 (49.3%) | 549 (50.6%) |
| Enterprise Management | 0 (0.0%) | 18 (100.0%) |
| Administrative & Support | 740 (60.8%) | 478 (39.2%) |
| Educational Services | 844 (28.4%) | 2,130 (71.6%) |
| Health Care & Social Assistance | 729 (15.8%) | 3,893 (84.2%) |
| Arts, Entertainment & Recreation | 251 (48.5%) | 266 (51.4%) |
| Accommodation & Food Services | 1,006 (43.7%) | 1,295 (56.3%) |
| Public Administration | 1,275 (49.7%) | 1,291 (50.3%) |
| Total | 18,990 (55.1%) | 15,499 (44.9%) |
Education in Lewis County
School Enrollment in Lewis County
The most common levels of schooling among the 17,368 students in Lewis County are middle school (4,226 | 24.3%), high school (4,214 | 24.3%), and elementary school (3,562 | 20.5%).
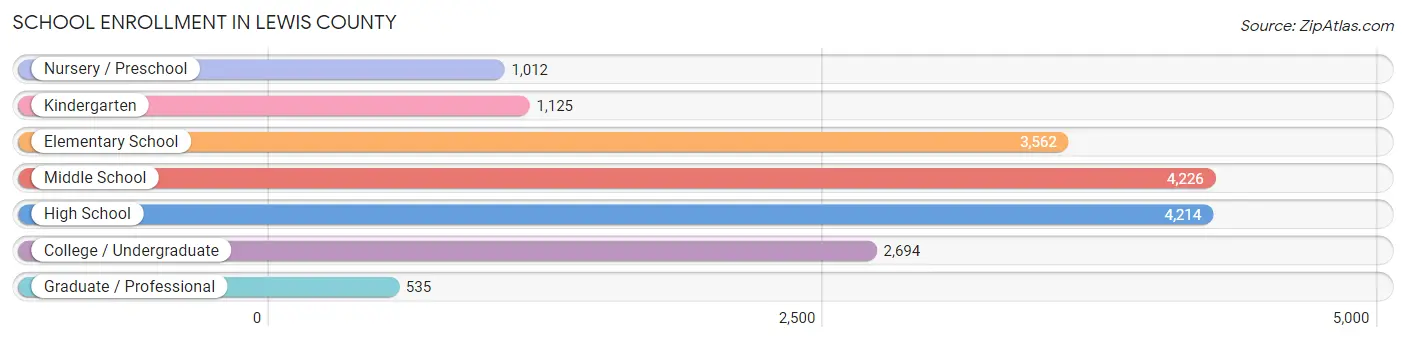
| School Level | # Students | % Students |
| Nursery / Preschool | 1,012 | 5.8% |
| Kindergarten | 1,125 | 6.5% |
| Elementary School | 3,562 | 20.5% |
| Middle School | 4,226 | 24.3% |
| High School | 4,214 | 24.3% |
| College / Undergraduate | 2,694 | 15.5% |
| Graduate / Professional | 535 | 3.1% |
| Total | 17,368 | 100.0% |
School Enrollment by Age by Funding Source in Lewis County
Out of a total of 17,368 students who are enrolled in schools in Lewis County, 2,240 (12.9%) attend a private institution, while the remaining 15,128 (87.1%) are enrolled in public schools. The age group of 3 to 4 year olds has the highest likelihood of being enrolled in private schools, with 241 (31.9% in the age bracket) enrolled. Conversely, the age group of 15 to 17 year olds has the lowest likelihood of being enrolled in a private school, with 2,824 (95.5% in the age bracket) attending a public institution.
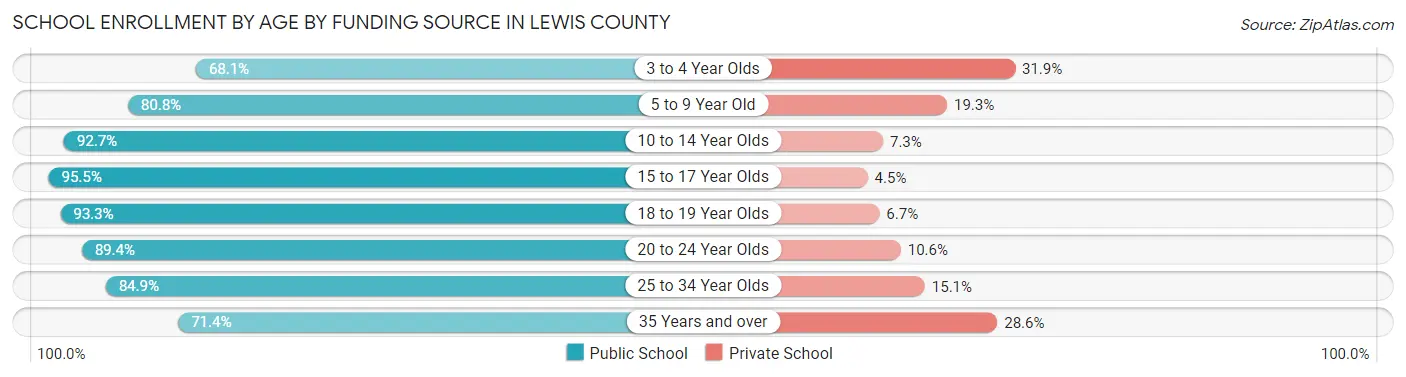
| Age Bracket | Public School | Private School |
| 3 to 4 Year Olds | 514 (68.1%) | 241 (31.9%) |
| 5 to 9 Year Old | 3,587 (80.7%) | 855 (19.3%) |
| 10 to 14 Year Olds | 4,742 (92.7%) | 375 (7.3%) |
| 15 to 17 Year Olds | 2,824 (95.5%) | 132 (4.5%) |
| 18 to 19 Year Olds | 1,094 (93.3%) | 78 (6.7%) |
| 20 to 24 Year Olds | 823 (89.4%) | 98 (10.6%) |
| 25 to 34 Year Olds | 741 (84.9%) | 132 (15.1%) |
| 35 Years and over | 808 (71.4%) | 324 (28.6%) |
| Total | 15,128 (87.1%) | 2,240 (12.9%) |
Educational Attainment by Field of Study in Lewis County
Education (2,211 | 17.7%), business (1,993 | 16.0%), science & technology (1,540 | 12.4%), arts & humanities (789 | 6.3%), and liberal arts & history (746 | 6.0%) are the most common fields of study among 12,455 individuals in Lewis County who have obtained a bachelor's degree or higher.
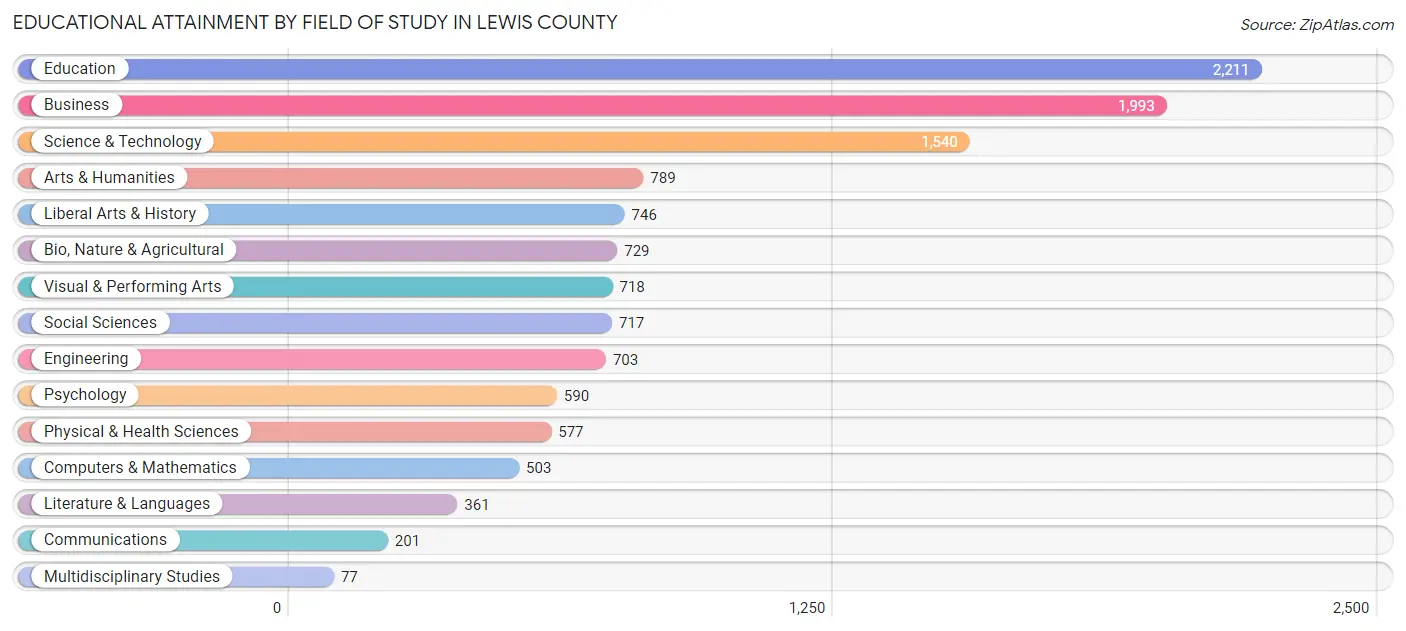
| Field of Study | # Graduates | % Graduates |
| Computers & Mathematics | 503 | 4.0% |
| Bio, Nature & Agricultural | 729 | 5.9% |
| Physical & Health Sciences | 577 | 4.6% |
| Psychology | 590 | 4.7% |
| Social Sciences | 717 | 5.8% |
| Engineering | 703 | 5.6% |
| Multidisciplinary Studies | 77 | 0.6% |
| Science & Technology | 1,540 | 12.4% |
| Business | 1,993 | 16.0% |
| Education | 2,211 | 17.7% |
| Literature & Languages | 361 | 2.9% |
| Liberal Arts & History | 746 | 6.0% |
| Visual & Performing Arts | 718 | 5.8% |
| Communications | 201 | 1.6% |
| Arts & Humanities | 789 | 6.3% |
| Total | 12,455 | 100.0% |
Transportation & Commute in Lewis County
Vehicle Availability by Sex in Lewis County
The most prevalent vehicle ownership categories in Lewis County are males with 2 vehicles (5,717, accounting for 31.3%) and females with 2 vehicles (4,652, making up 38.0%).
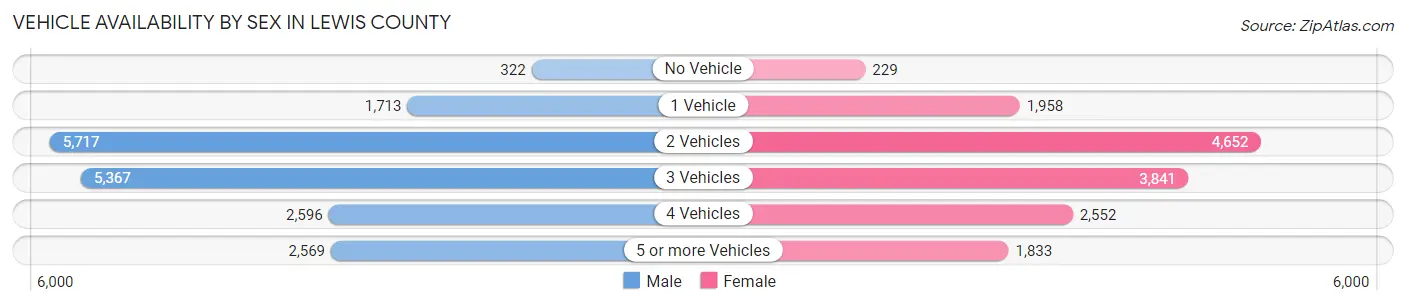
| Vehicles Available | Male | Female |
| No Vehicle | 322 (1.8%) | 229 (1.5%) |
| 1 Vehicle | 1,713 (9.4%) | 1,958 (13.0%) |
| 2 Vehicles | 5,717 (31.3%) | 4,652 (30.9%) |
| 3 Vehicles | 5,367 (29.3%) | 3,841 (25.5%) |
| 4 Vehicles | 2,596 (14.2%) | 2,552 (16.9%) |
| 5 or more Vehicles | 2,569 (14.1%) | 1,833 (12.2%) |
| Total | 18,284 (100.0%) | 15,065 (100.0%) |
Commute Time in Lewis County
The most frequently occuring commute durations in Lewis County are 15 to 19 minutes (5,389 commuters, 17.4%), 5 to 9 minutes (3,836 commuters, 12.4%), and 10 to 14 minutes (3,815 commuters, 12.3%).
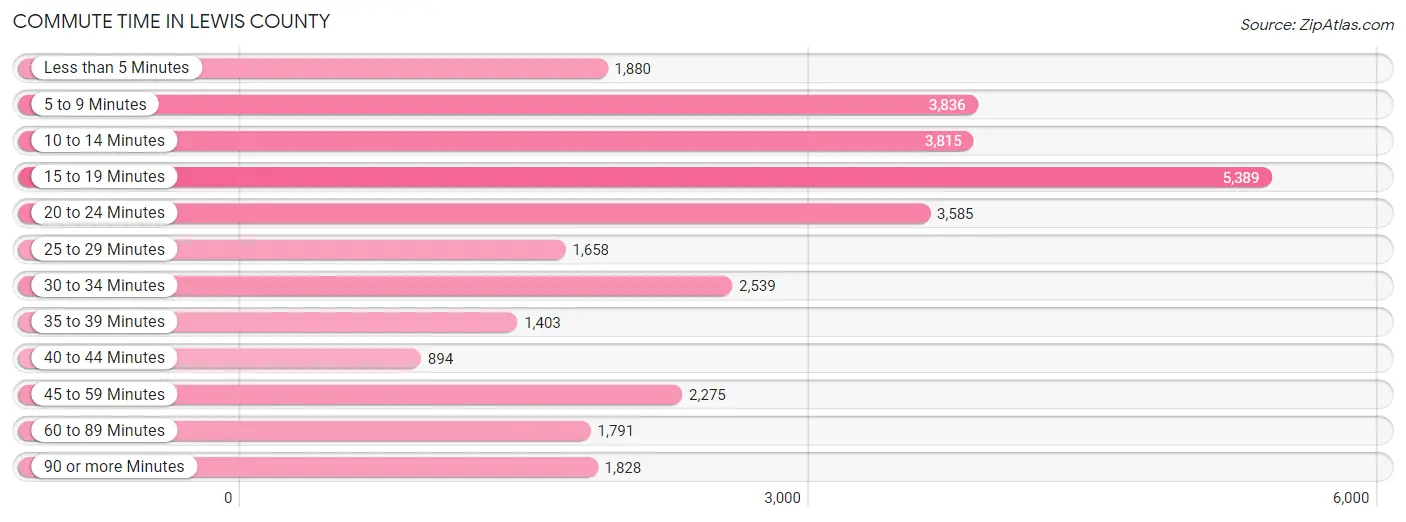
| Commute Time | # Commuters | % Commuters |
| Less than 5 Minutes | 1,880 | 6.1% |
| 5 to 9 Minutes | 3,836 | 12.4% |
| 10 to 14 Minutes | 3,815 | 12.3% |
| 15 to 19 Minutes | 5,389 | 17.4% |
| 20 to 24 Minutes | 3,585 | 11.6% |
| 25 to 29 Minutes | 1,658 | 5.4% |
| 30 to 34 Minutes | 2,539 | 8.2% |
| 35 to 39 Minutes | 1,403 | 4.5% |
| 40 to 44 Minutes | 894 | 2.9% |
| 45 to 59 Minutes | 2,275 | 7.4% |
| 60 to 89 Minutes | 1,791 | 5.8% |
| 90 or more Minutes | 1,828 | 5.9% |
Commute Time by Sex in Lewis County
The most common commute times in Lewis County are 15 to 19 minutes (2,950 commuters, 16.9%) for males and 15 to 19 minutes (2,439 commuters, 18.1%) for females.
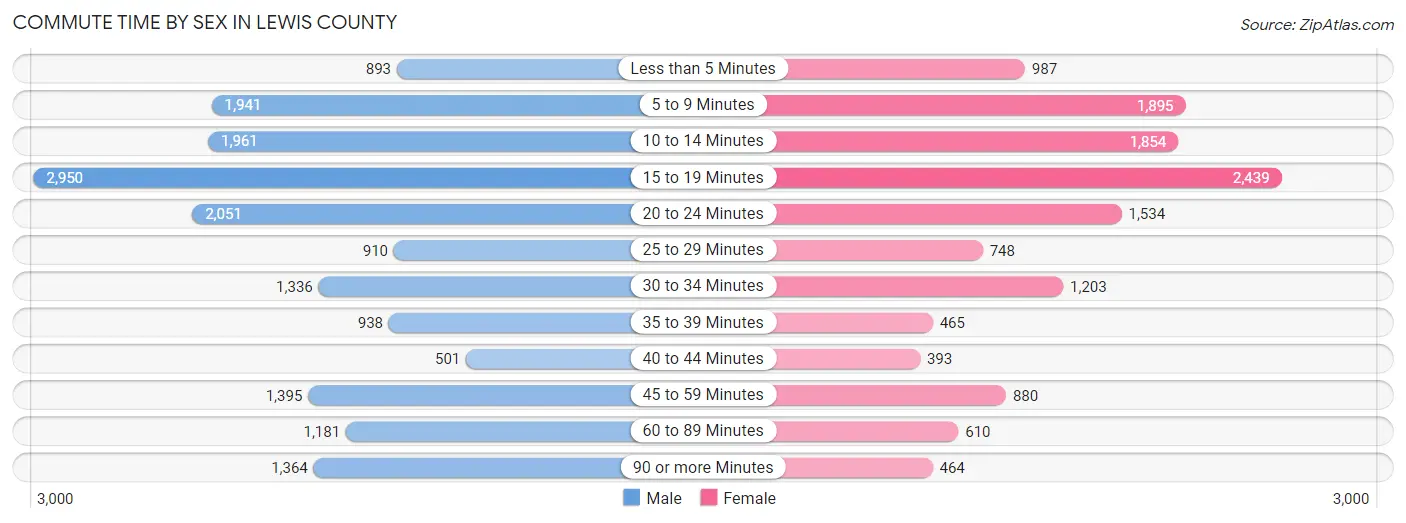
| Commute Time | Male | Female |
| Less than 5 Minutes | 893 (5.1%) | 987 (7.3%) |
| 5 to 9 Minutes | 1,941 (11.1%) | 1,895 (14.1%) |
| 10 to 14 Minutes | 1,961 (11.3%) | 1,854 (13.8%) |
| 15 to 19 Minutes | 2,950 (16.9%) | 2,439 (18.1%) |
| 20 to 24 Minutes | 2,051 (11.8%) | 1,534 (11.4%) |
| 25 to 29 Minutes | 910 (5.2%) | 748 (5.6%) |
| 30 to 34 Minutes | 1,336 (7.7%) | 1,203 (8.9%) |
| 35 to 39 Minutes | 938 (5.4%) | 465 (3.5%) |
| 40 to 44 Minutes | 501 (2.9%) | 393 (2.9%) |
| 45 to 59 Minutes | 1,395 (8.0%) | 880 (6.5%) |
| 60 to 89 Minutes | 1,181 (6.8%) | 610 (4.5%) |
| 90 or more Minutes | 1,364 (7.8%) | 464 (3.4%) |
Time of Departure to Work by Sex in Lewis County
The most frequent times of departure to work in Lewis County are 12:00 AM to 4:59 AM (2,787, 16.0%) for males and 7:30 AM to 7:59 AM (1,989, 14.8%) for females.
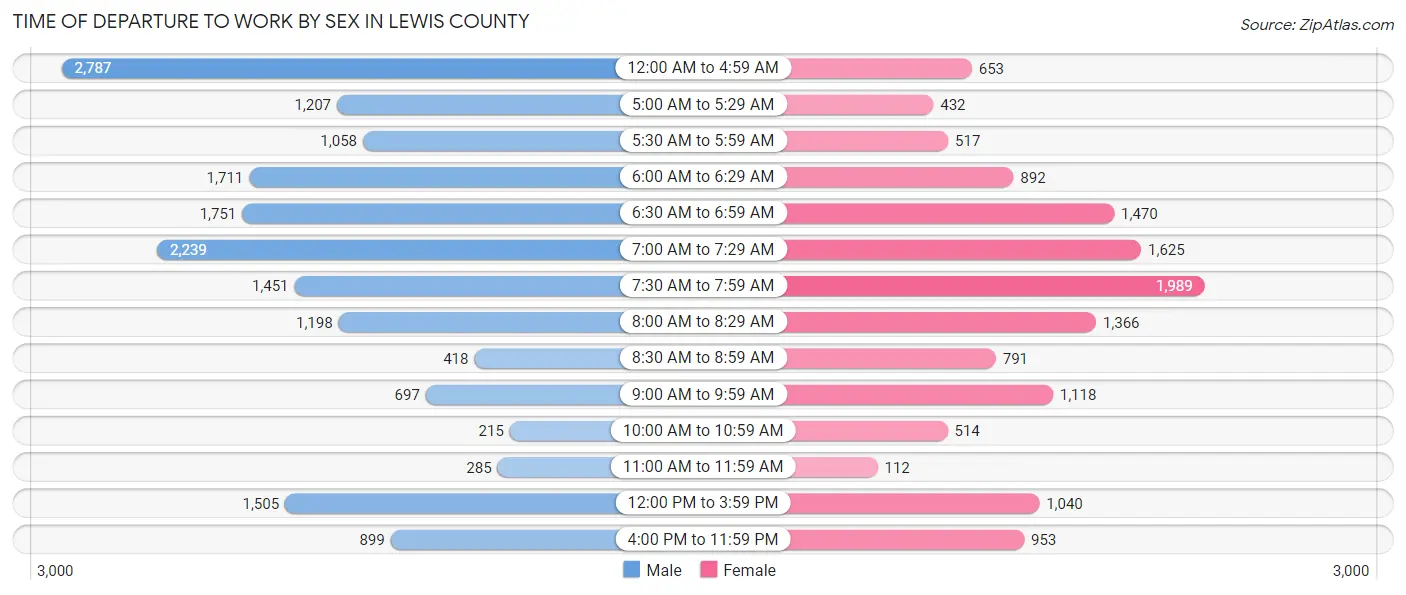
| Time of Departure | Male | Female |
| 12:00 AM to 4:59 AM | 2,787 (16.0%) | 653 (4.9%) |
| 5:00 AM to 5:29 AM | 1,207 (6.9%) | 432 (3.2%) |
| 5:30 AM to 5:59 AM | 1,058 (6.1%) | 517 (3.8%) |
| 6:00 AM to 6:29 AM | 1,711 (9.8%) | 892 (6.6%) |
| 6:30 AM to 6:59 AM | 1,751 (10.1%) | 1,470 (10.9%) |
| 7:00 AM to 7:29 AM | 2,239 (12.9%) | 1,625 (12.1%) |
| 7:30 AM to 7:59 AM | 1,451 (8.3%) | 1,989 (14.8%) |
| 8:00 AM to 8:29 AM | 1,198 (6.9%) | 1,366 (10.1%) |
| 8:30 AM to 8:59 AM | 418 (2.4%) | 791 (5.9%) |
| 9:00 AM to 9:59 AM | 697 (4.0%) | 1,118 (8.3%) |
| 10:00 AM to 10:59 AM | 215 (1.2%) | 514 (3.8%) |
| 11:00 AM to 11:59 AM | 285 (1.6%) | 112 (0.8%) |
| 12:00 PM to 3:59 PM | 1,505 (8.6%) | 1,040 (7.7%) |
| 4:00 PM to 11:59 PM | 899 (5.2%) | 953 (7.1%) |
| Total | 17,421 (100.0%) | 13,472 (100.0%) |
Housing Occupancy in Lewis County
Occupancy by Ownership in Lewis County
Of the total 31,511 dwellings in Lewis County, owner-occupied units account for 22,986 (73.0%), while renter-occupied units make up 8,525 (27.1%).
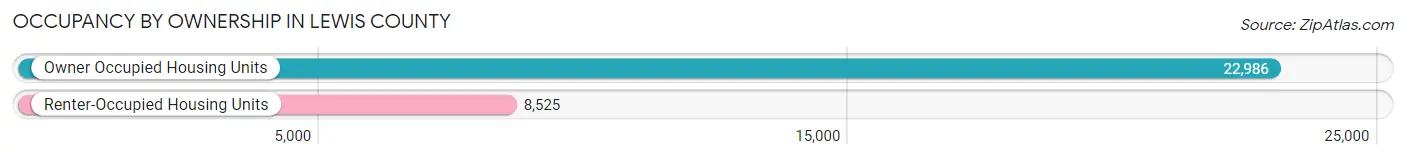
| Occupancy | # Housing Units | % Housing Units |
| Owner Occupied Housing Units | 22,986 | 73.0% |
| Renter-Occupied Housing Units | 8,525 | 27.1% |
| Total Occupied Housing Units | 31,511 | 100.0% |
Occupancy by Household Size in Lewis County
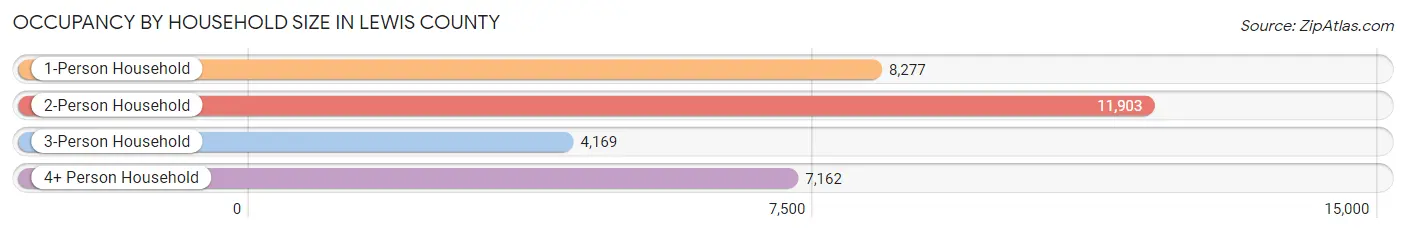
| Household Size | # Housing Units | % Housing Units |
| 1-Person Household | 8,277 | 26.3% |
| 2-Person Household | 11,903 | 37.8% |
| 3-Person Household | 4,169 | 13.2% |
| 4+ Person Household | 7,162 | 22.7% |
| Total Housing Units | 31,511 | 100.0% |
Occupancy by Ownership by Household Size in Lewis County
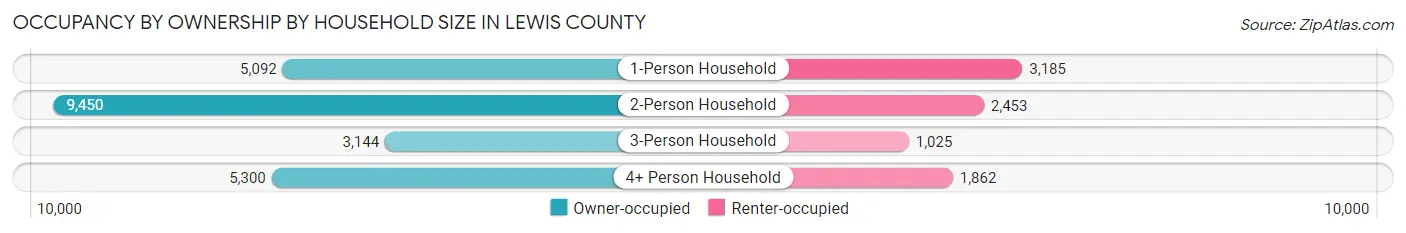
| Household Size | Owner-occupied | Renter-occupied |
| 1-Person Household | 5,092 (61.5%) | 3,185 (38.5%) |
| 2-Person Household | 9,450 (79.4%) | 2,453 (20.6%) |
| 3-Person Household | 3,144 (75.4%) | 1,025 (24.6%) |
| 4+ Person Household | 5,300 (74.0%) | 1,862 (26.0%) |
| Total Housing Units | 22,986 (73.0%) | 8,525 (27.1%) |
Occupancy by Educational Attainment in Lewis County
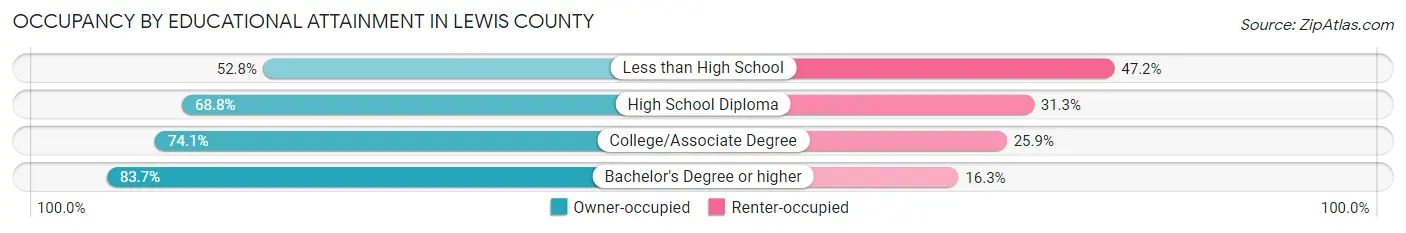
| Household Size | Owner-occupied | Renter-occupied |
| Less than High School | 1,432 (52.8%) | 1,281 (47.2%) |
| High School Diploma | 5,556 (68.8%) | 2,525 (31.2%) |
| College/Associate Degree | 10,363 (74.1%) | 3,621 (25.9%) |
| Bachelor's Degree or higher | 5,635 (83.7%) | 1,098 (16.3%) |
Occupancy by Age of Householder in Lewis County
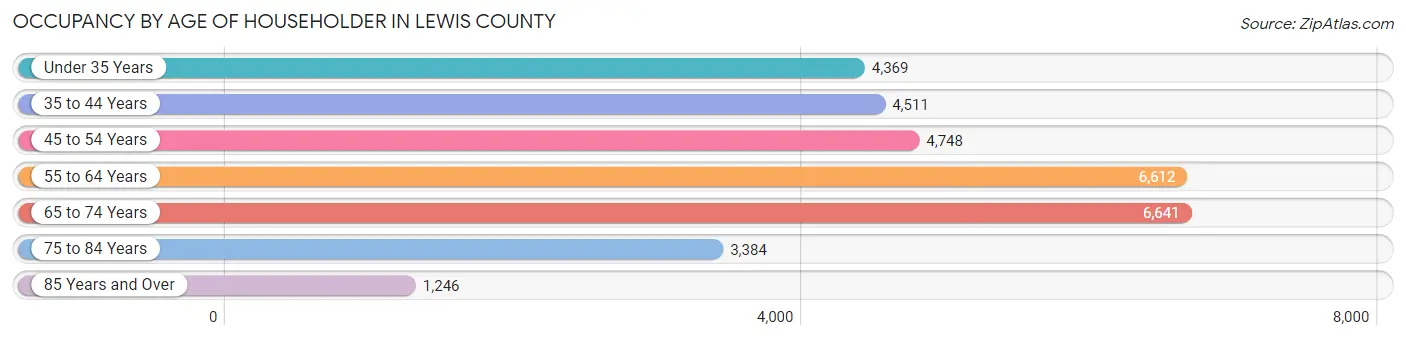
| Age Bracket | # Households | % Households |
| Under 35 Years | 4,369 | 13.9% |
| 35 to 44 Years | 4,511 | 14.3% |
| 45 to 54 Years | 4,748 | 15.1% |
| 55 to 64 Years | 6,612 | 21.0% |
| 65 to 74 Years | 6,641 | 21.1% |
| 75 to 84 Years | 3,384 | 10.7% |
| 85 Years and Over | 1,246 | 4.0% |
| Total | 31,511 | 100.0% |
Housing Finances in Lewis County
Median Income by Occupancy in Lewis County
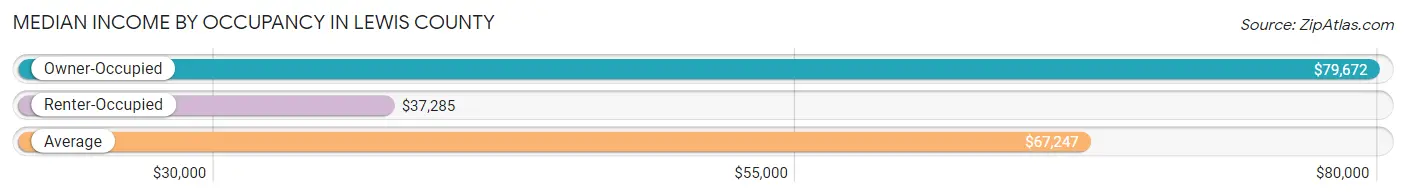
| Occupancy Type | # Households | Median Income |
| Owner-Occupied | 22,986 (73.0%) | $79,672 |
| Renter-Occupied | 8,525 (27.1%) | $37,285 |
| Average | 31,511 (100.0%) | $67,247 |
Occupancy by Householder Income Bracket in Lewis County
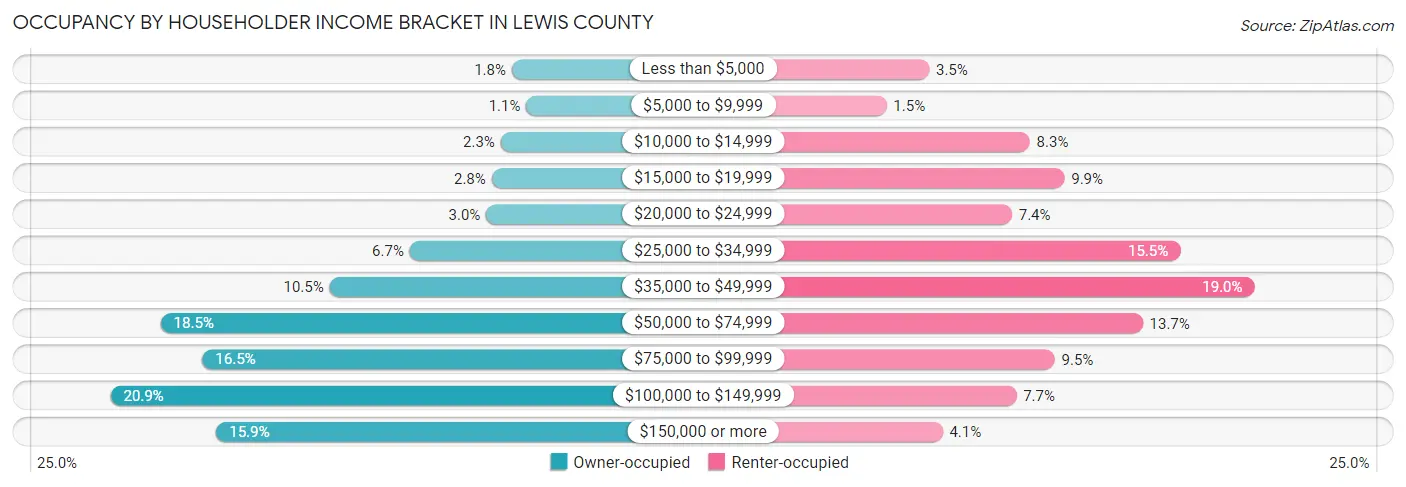
| Income Bracket | Owner-occupied | Renter-occupied |
| Less than $5,000 | 413 (1.8%) | 298 (3.5%) |
| $5,000 to $9,999 | 255 (1.1%) | 125 (1.5%) |
| $10,000 to $14,999 | 535 (2.3%) | 707 (8.3%) |
| $15,000 to $19,999 | 635 (2.8%) | 847 (9.9%) |
| $20,000 to $24,999 | 695 (3.0%) | 634 (7.4%) |
| $25,000 to $34,999 | 1,532 (6.7%) | 1,317 (15.4%) |
| $35,000 to $49,999 | 2,410 (10.5%) | 1,619 (19.0%) |
| $50,000 to $74,999 | 4,257 (18.5%) | 1,165 (13.7%) |
| $75,000 to $99,999 | 3,800 (16.5%) | 808 (9.5%) |
| $100,000 to $149,999 | 4,806 (20.9%) | 652 (7.6%) |
| $150,000 or more | 3,648 (15.9%) | 353 (4.1%) |
| Total | 22,986 (100.0%) | 8,525 (100.0%) |
Monthly Housing Cost Tiers in Lewis County
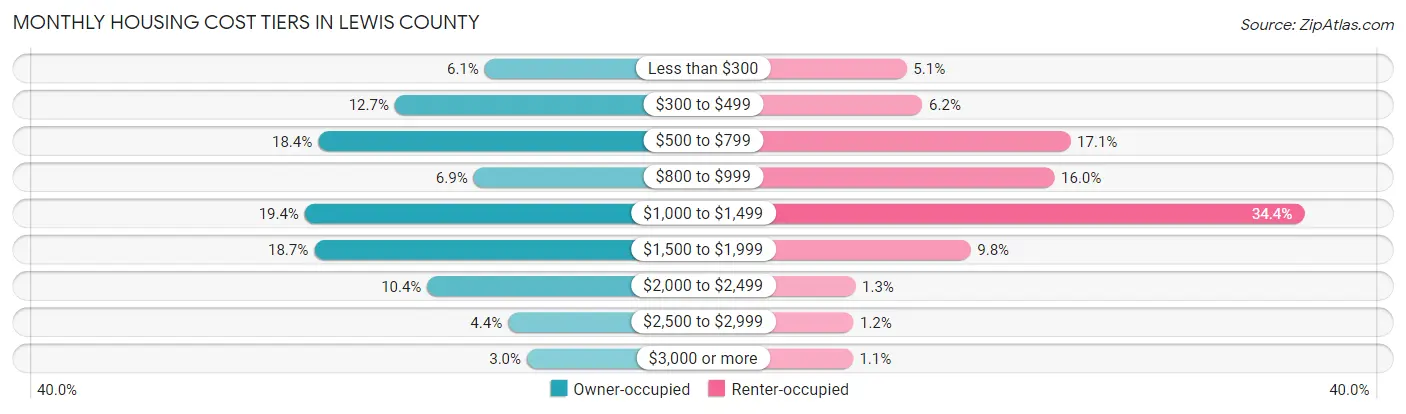
| Monthly Cost | Owner-occupied | Renter-occupied |
| Less than $300 | 1,407 (6.1%) | 433 (5.1%) |
| $300 to $499 | 2,929 (12.7%) | 532 (6.2%) |
| $500 to $799 | 4,228 (18.4%) | 1,461 (17.1%) |
| $800 to $999 | 1,595 (6.9%) | 1,361 (16.0%) |
| $1,000 to $1,499 | 4,452 (19.4%) | 2,929 (34.4%) |
| $1,500 to $1,999 | 4,294 (18.7%) | 835 (9.8%) |
| $2,000 to $2,499 | 2,379 (10.3%) | 111 (1.3%) |
| $2,500 to $2,999 | 1,011 (4.4%) | 98 (1.1%) |
| $3,000 or more | 691 (3.0%) | 95 (1.1%) |
| Total | 22,986 (100.0%) | 8,525 (100.0%) |
Physical Housing Characteristics in Lewis County
Housing Structures in Lewis County
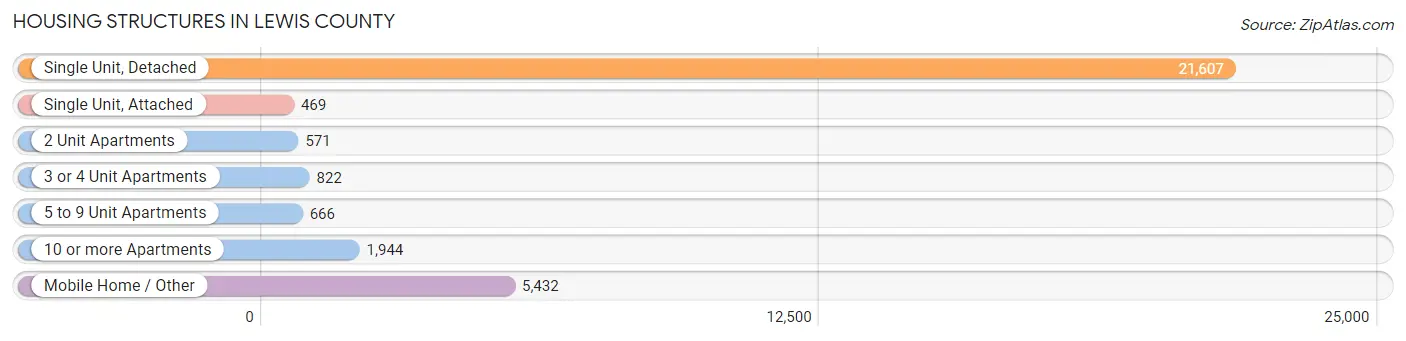
| Structure Type | # Housing Units | % Housing Units |
| Single Unit, Detached | 21,607 | 68.6% |
| Single Unit, Attached | 469 | 1.5% |
| 2 Unit Apartments | 571 | 1.8% |
| 3 or 4 Unit Apartments | 822 | 2.6% |
| 5 to 9 Unit Apartments | 666 | 2.1% |
| 10 or more Apartments | 1,944 | 6.2% |
| Mobile Home / Other | 5,432 | 17.2% |
| Total | 31,511 | 100.0% |
Housing Structures by Occupancy in Lewis County
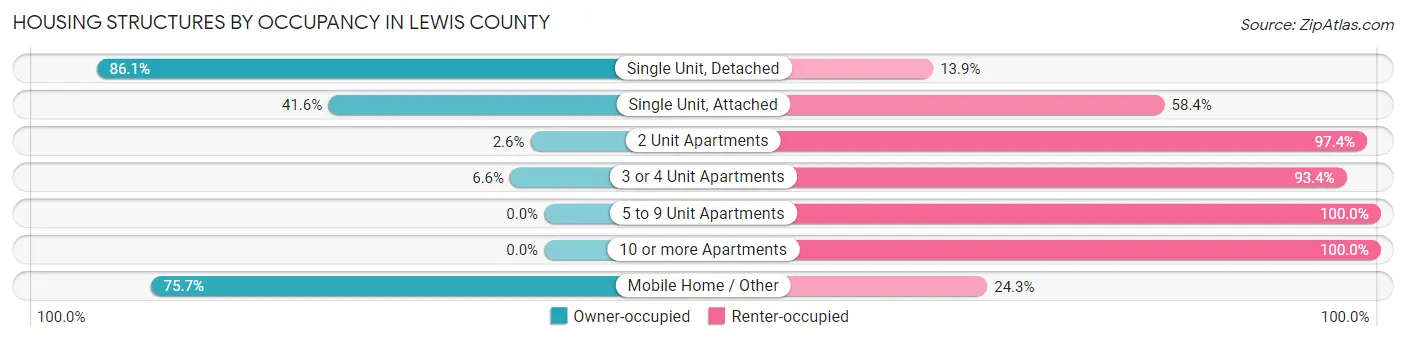
| Structure Type | Owner-occupied | Renter-occupied |
| Single Unit, Detached | 18,609 (86.1%) | 2,998 (13.9%) |
| Single Unit, Attached | 195 (41.6%) | 274 (58.4%) |
| 2 Unit Apartments | 15 (2.6%) | 556 (97.4%) |
| 3 or 4 Unit Apartments | 54 (6.6%) | 768 (93.4%) |
| 5 to 9 Unit Apartments | 0 (0.0%) | 666 (100.0%) |
| 10 or more Apartments | 0 (0.0%) | 1,944 (100.0%) |
| Mobile Home / Other | 4,113 (75.7%) | 1,319 (24.3%) |
| Total | 22,986 (73.0%) | 8,525 (27.1%) |
Housing Structures by Number of Rooms in Lewis County
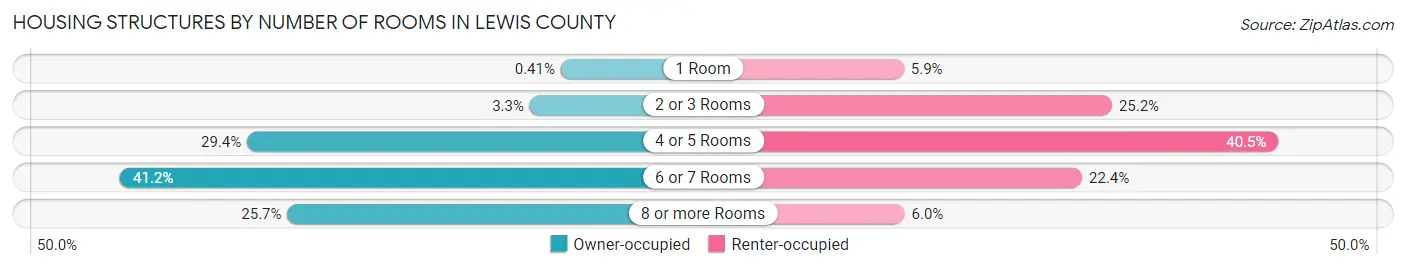
| Number of Rooms | Owner-occupied | Renter-occupied |
| 1 Room | 95 (0.4%) | 504 (5.9%) |
| 2 or 3 Rooms | 755 (3.3%) | 2,145 (25.2%) |
| 4 or 5 Rooms | 6,765 (29.4%) | 3,456 (40.5%) |
| 6 or 7 Rooms | 9,463 (41.2%) | 1,910 (22.4%) |
| 8 or more Rooms | 5,908 (25.7%) | 510 (6.0%) |
| Total | 22,986 (100.0%) | 8,525 (100.0%) |
Housing Structure by Heating Type in Lewis County
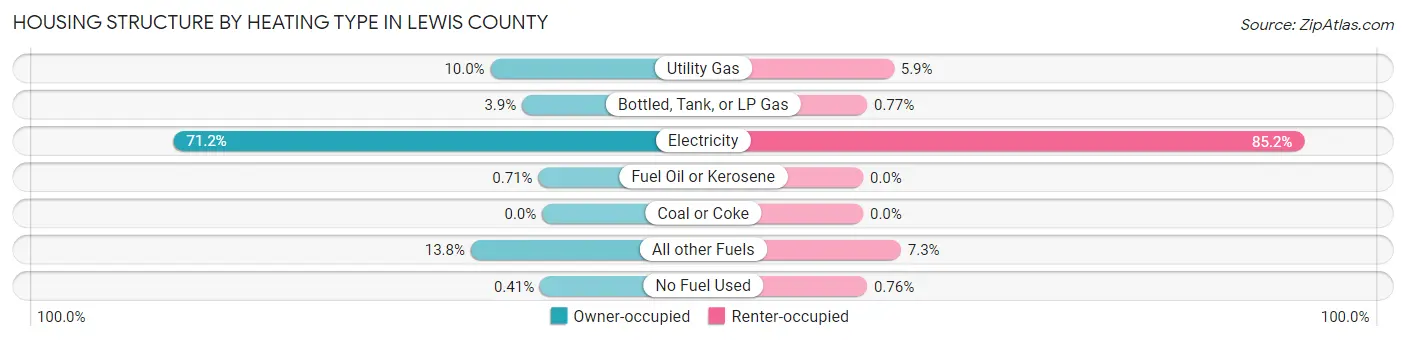
| Heating Type | Owner-occupied | Renter-occupied |
| Utility Gas | 2,294 (10.0%) | 506 (5.9%) |
| Bottled, Tank, or LP Gas | 890 (3.9%) | 66 (0.8%) |
| Electricity | 16,376 (71.2%) | 7,266 (85.2%) |
| Fuel Oil or Kerosene | 163 (0.7%) | 0 (0.0%) |
| Coal or Coke | 0 (0.0%) | 0 (0.0%) |
| All other Fuels | 3,168 (13.8%) | 622 (7.3%) |
| No Fuel Used | 95 (0.4%) | 65 (0.8%) |
| Total | 22,986 (100.0%) | 8,525 (100.0%) |
Household Vehicle Usage in Lewis County
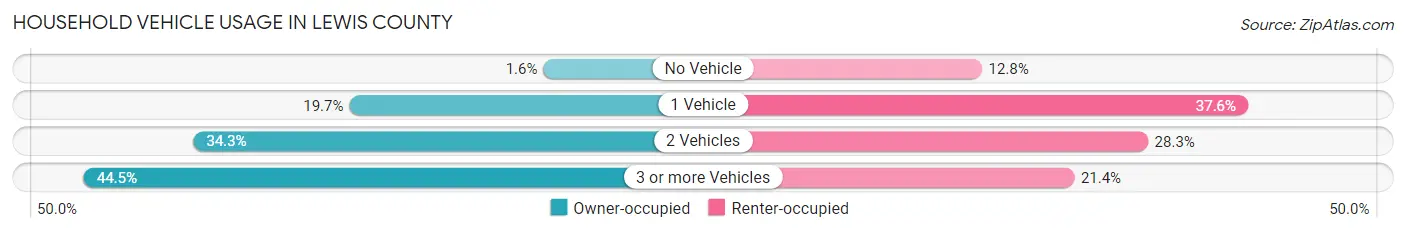
| Vehicles per Household | Owner-occupied | Renter-occupied |
| No Vehicle | 364 (1.6%) | 1,087 (12.8%) |
| 1 Vehicle | 4,526 (19.7%) | 3,206 (37.6%) |
| 2 Vehicles | 7,873 (34.3%) | 2,409 (28.3%) |
| 3 or more Vehicles | 10,223 (44.5%) | 1,823 (21.4%) |
| Total | 22,986 (100.0%) | 8,525 (100.0%) |
Real Estate & Mortgages in Lewis County
Real Estate and Mortgage Overview in Lewis County
| Characteristic | Without Mortgage | With Mortgage |
| Housing Units | 9,221 | 13,765 |
| Median Property Value | $282,300 | $323,300 |
| Median Household Income | $57,612 | $2,703 |
| Monthly Housing Costs | $533 | $680 |
| Real Estate Taxes | $2,296 | $344 |
Property Value by Mortgage Status in Lewis County
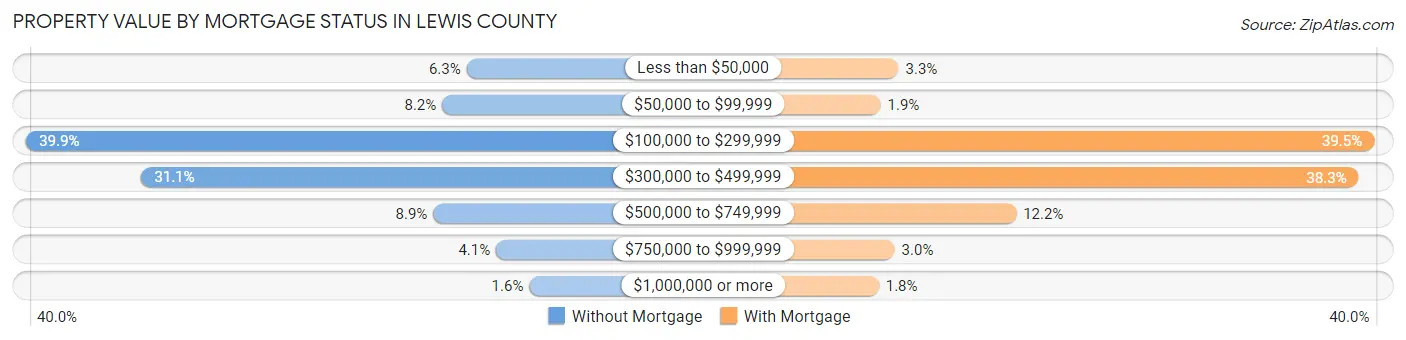
| Property Value | Without Mortgage | With Mortgage |
| Less than $50,000 | 584 (6.3%) | 452 (3.3%) |
| $50,000 to $99,999 | 755 (8.2%) | 263 (1.9%) |
| $100,000 to $299,999 | 3,677 (39.9%) | 5,437 (39.5%) |
| $300,000 to $499,999 | 2,868 (31.1%) | 5,275 (38.3%) |
| $500,000 to $749,999 | 818 (8.9%) | 1,685 (12.2%) |
| $750,000 to $999,999 | 376 (4.1%) | 410 (3.0%) |
| $1,000,000 or more | 143 (1.5%) | 243 (1.8%) |
| Total | 9,221 (100.0%) | 13,765 (100.0%) |
Household Income by Mortgage Status in Lewis County
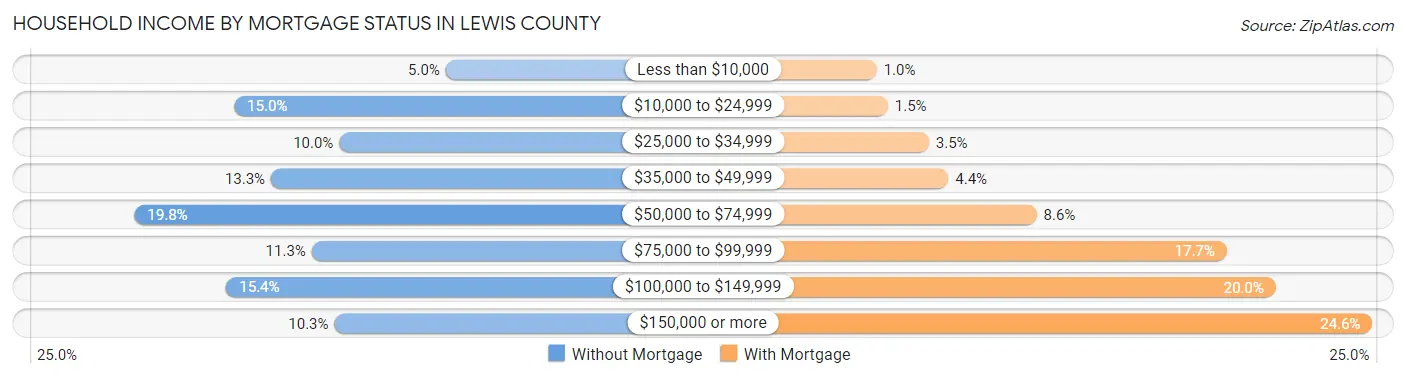
| Household Income | Without Mortgage | With Mortgage |
| Less than $10,000 | 456 (5.0%) | 139 (1.0%) |
| $10,000 to $24,999 | 1,385 (15.0%) | 212 (1.5%) |
| $25,000 to $34,999 | 924 (10.0%) | 480 (3.5%) |
| $35,000 to $49,999 | 1,224 (13.3%) | 608 (4.4%) |
| $50,000 to $74,999 | 1,823 (19.8%) | 1,186 (8.6%) |
| $75,000 to $99,999 | 1,045 (11.3%) | 2,434 (17.7%) |
| $100,000 to $149,999 | 1,419 (15.4%) | 2,755 (20.0%) |
| $150,000 or more | 945 (10.2%) | 3,387 (24.6%) |
| Total | 9,221 (100.0%) | 13,765 (100.0%) |
Property Value to Household Income Ratio in Lewis County
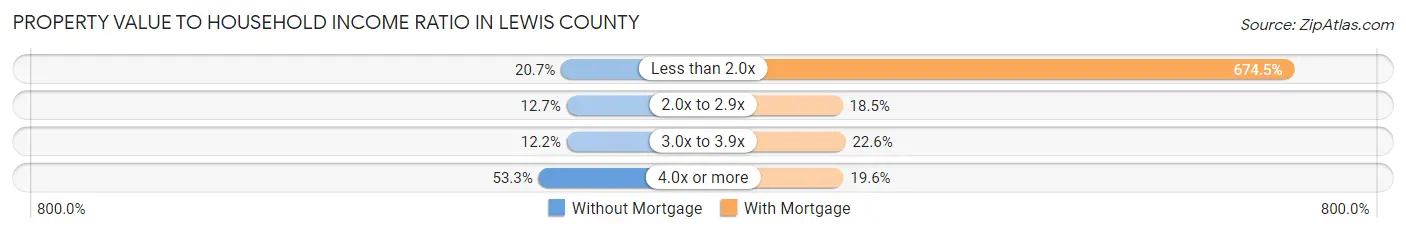
| Value-to-Income Ratio | Without Mortgage | With Mortgage |
| Less than 2.0x | 1,904 (20.6%) | 92,850 (674.5%) |
| 2.0x to 2.9x | 1,166 (12.7%) | 2,551 (18.5%) |
| 3.0x to 3.9x | 1,121 (12.2%) | 3,115 (22.6%) |
| 4.0x or more | 4,916 (53.3%) | 2,702 (19.6%) |
| Total | 9,221 (100.0%) | 13,765 (100.0%) |
Real Estate Taxes by Mortgage Status in Lewis County
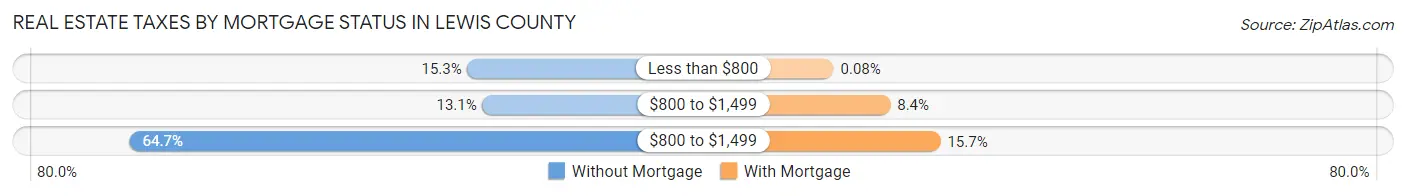
| Property Taxes | Without Mortgage | With Mortgage |
| Less than $800 | 1,409 (15.3%) | 11 (0.1%) |
| $800 to $1,499 | 1,207 (13.1%) | 1,151 (8.4%) |
| $800 to $1,499 | 5,961 (64.6%) | 2,161 (15.7%) |
| Total | 9,221 (100.0%) | 13,765 (100.0%) |
Health & Disability in Lewis County
Health Insurance Coverage by Age in Lewis County
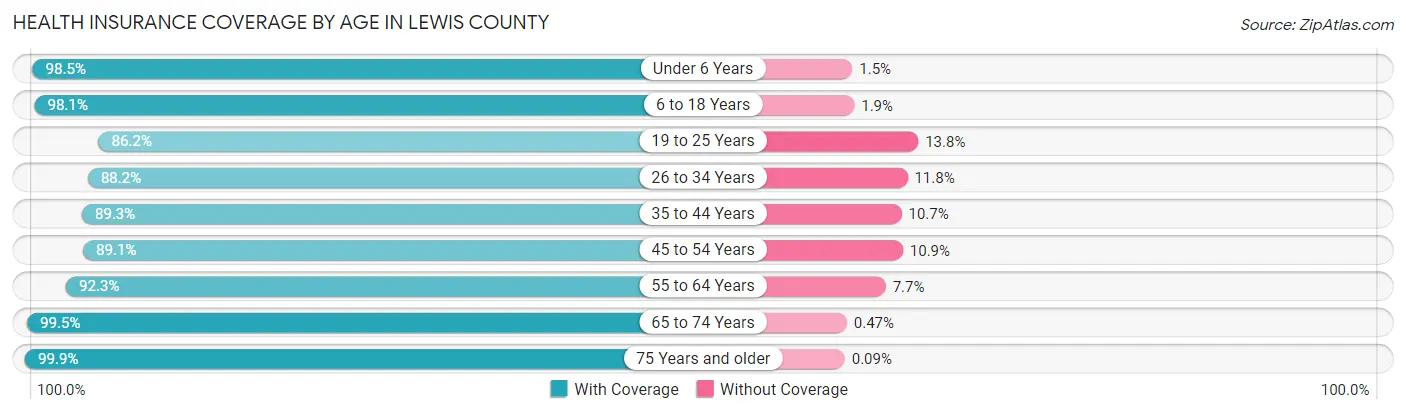
| Age Bracket | With Coverage | Without Coverage |
| Under 6 Years | 5,633 (98.5%) | 86 (1.5%) |
| 6 to 18 Years | 12,826 (98.1%) | 243 (1.9%) |
| 19 to 25 Years | 5,183 (86.2%) | 829 (13.8%) |
| 26 to 34 Years | 7,772 (88.2%) | 1,038 (11.8%) |
| 35 to 44 Years | 8,740 (89.3%) | 1,045 (10.7%) |
| 45 to 54 Years | 8,456 (89.1%) | 1,037 (10.9%) |
| 55 to 64 Years | 11,001 (92.3%) | 921 (7.7%) |
| 65 to 74 Years | 10,418 (99.5%) | 49 (0.5%) |
| 75 Years and older | 6,622 (99.9%) | 6 (0.1%) |
| Total | 76,651 (93.6%) | 5,254 (6.4%) |
Health Insurance Coverage by Citizenship Status in Lewis County
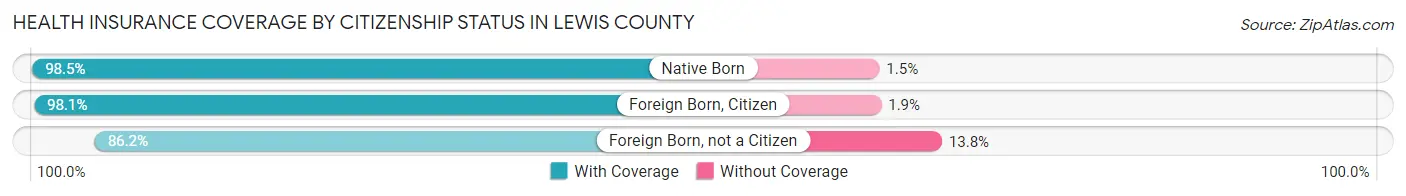
| Citizenship Status | With Coverage | Without Coverage |
| Native Born | 5,633 (98.5%) | 86 (1.5%) |
| Foreign Born, Citizen | 12,826 (98.1%) | 243 (1.9%) |
| Foreign Born, not a Citizen | 5,183 (86.2%) | 829 (13.8%) |
Health Insurance Coverage by Household Income in Lewis County
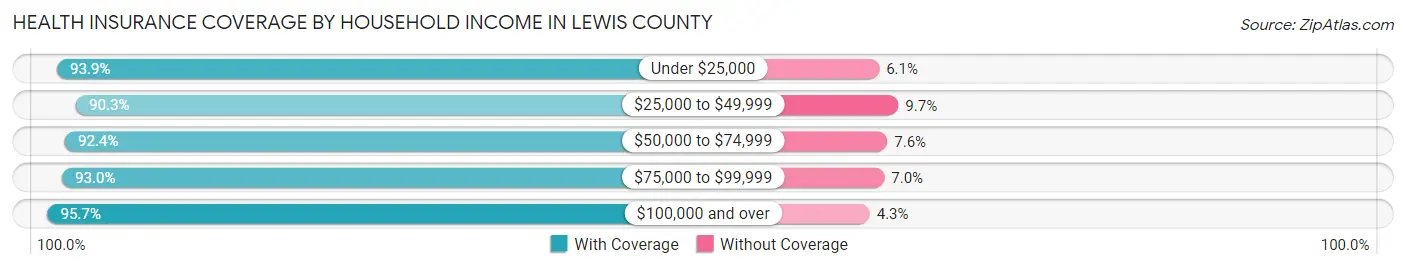
| Household Income | With Coverage | Without Coverage |
| Under $25,000 | 7,733 (93.9%) | 501 (6.1%) |
| $25,000 to $49,999 | 12,578 (90.3%) | 1,346 (9.7%) |
| $50,000 to $74,999 | 12,545 (92.4%) | 1,031 (7.6%) |
| $75,000 to $99,999 | 13,268 (93.0%) | 1,005 (7.0%) |
| $100,000 and over | 30,129 (95.7%) | 1,358 (4.3%) |
Public vs Private Health Insurance Coverage by Age in Lewis County
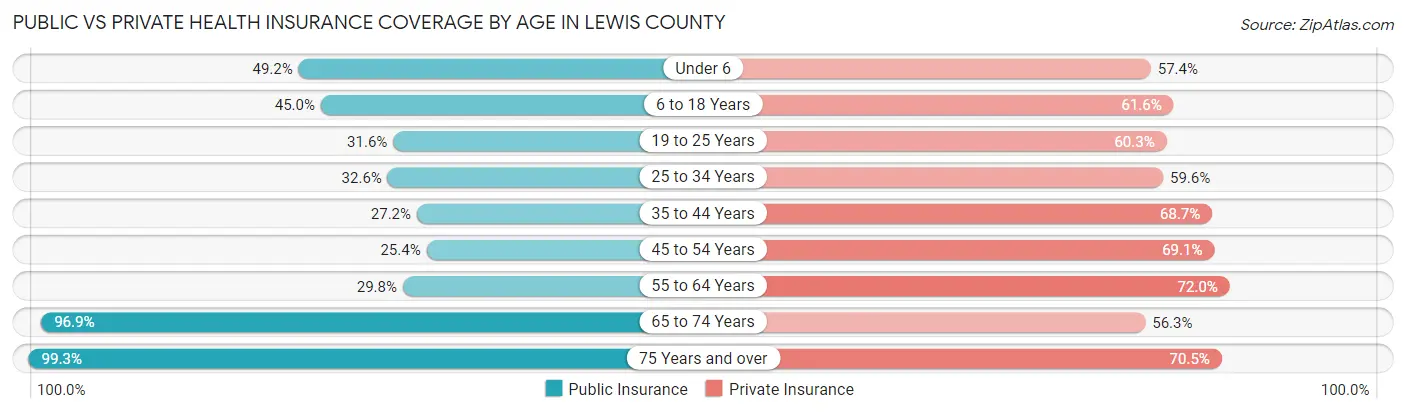
| Age Bracket | Public Insurance | Private Insurance |
| Under 6 | 2,811 (49.1%) | 3,280 (57.4%) |
| 6 to 18 Years | 5,884 (45.0%) | 8,046 (61.6%) |
| 19 to 25 Years | 1,899 (31.6%) | 3,623 (60.3%) |
| 25 to 34 Years | 2,873 (32.6%) | 5,253 (59.6%) |
| 35 to 44 Years | 2,661 (27.2%) | 6,725 (68.7%) |
| 45 to 54 Years | 2,411 (25.4%) | 6,562 (69.1%) |
| 55 to 64 Years | 3,553 (29.8%) | 8,583 (72.0%) |
| 65 to 74 Years | 10,144 (96.9%) | 5,897 (56.3%) |
| 75 Years and over | 6,578 (99.3%) | 4,673 (70.5%) |
| Total | 38,814 (47.4%) | 52,642 (64.3%) |
Disability Status by Sex by Age in Lewis County
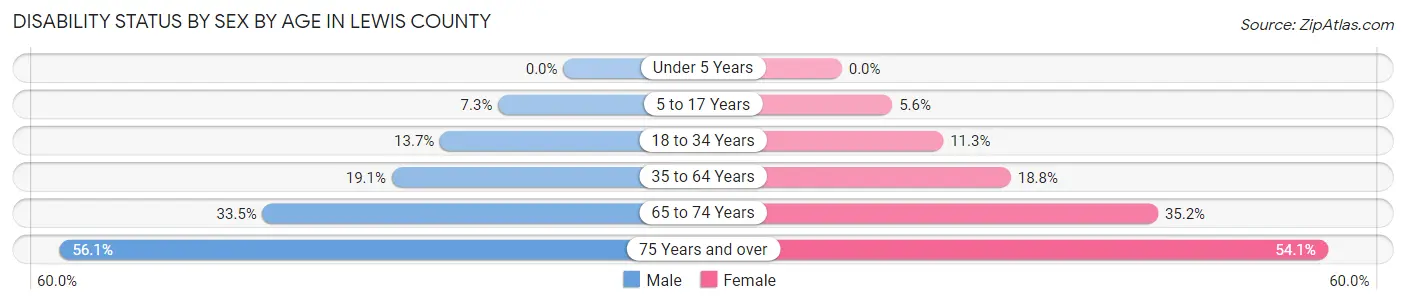
| Age Bracket | Male | Female |
| Under 5 Years | 0 (0.0%) | 0 (0.0%) |
| 5 to 17 Years | 480 (7.2%) | 354 (5.6%) |
| 18 to 34 Years | 1,142 (13.7%) | 864 (11.3%) |
| 35 to 64 Years | 2,997 (19.1%) | 2,921 (18.8%) |
| 65 to 74 Years | 1,759 (33.5%) | 1,836 (35.2%) |
| 75 Years and over | 1,707 (56.1%) | 1,940 (54.1%) |
Disability Class by Sex by Age in Lewis County
Disability Class: Hearing Difficulty
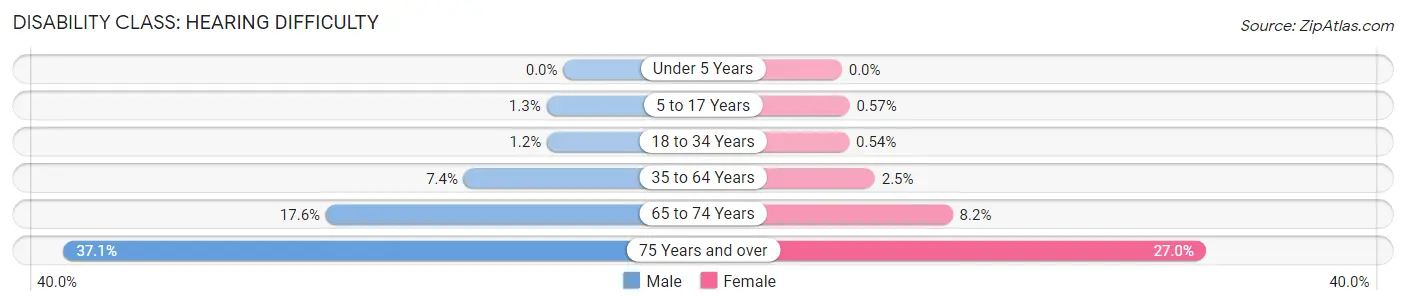
| Age Bracket | Male | Female |
| Under 5 Years | 0 (0.0%) | 0 (0.0%) |
| 5 to 17 Years | 83 (1.3%) | 36 (0.6%) |
| 18 to 34 Years | 101 (1.2%) | 41 (0.5%) |
| 35 to 64 Years | 1,158 (7.4%) | 380 (2.5%) |
| 65 to 74 Years | 926 (17.6%) | 429 (8.2%) |
| 75 Years and over | 1,129 (37.1%) | 969 (27.0%) |
Disability Class: Vision Difficulty
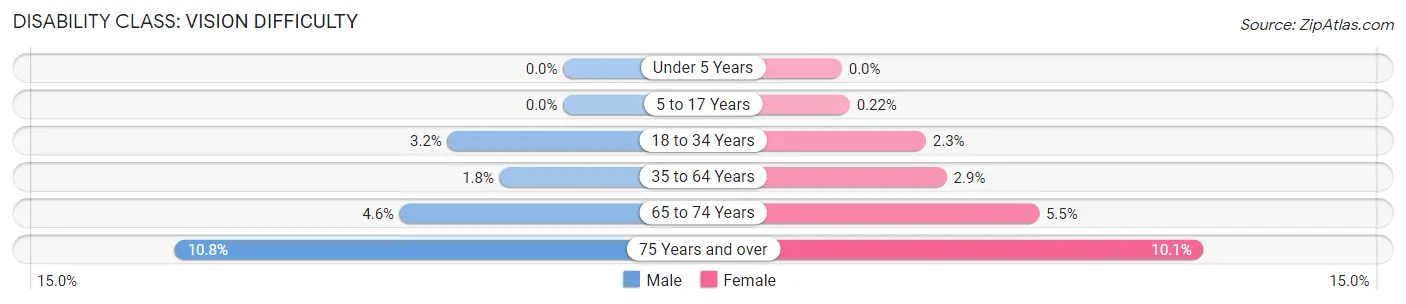
| Age Bracket | Male | Female |
| Under 5 Years | 0 (0.0%) | 0 (0.0%) |
| 5 to 17 Years | 0 (0.0%) | 14 (0.2%) |
| 18 to 34 Years | 268 (3.2%) | 179 (2.3%) |
| 35 to 64 Years | 278 (1.8%) | 453 (2.9%) |
| 65 to 74 Years | 239 (4.5%) | 286 (5.5%) |
| 75 Years and over | 329 (10.8%) | 361 (10.1%) |
Disability Class: Cognitive Difficulty
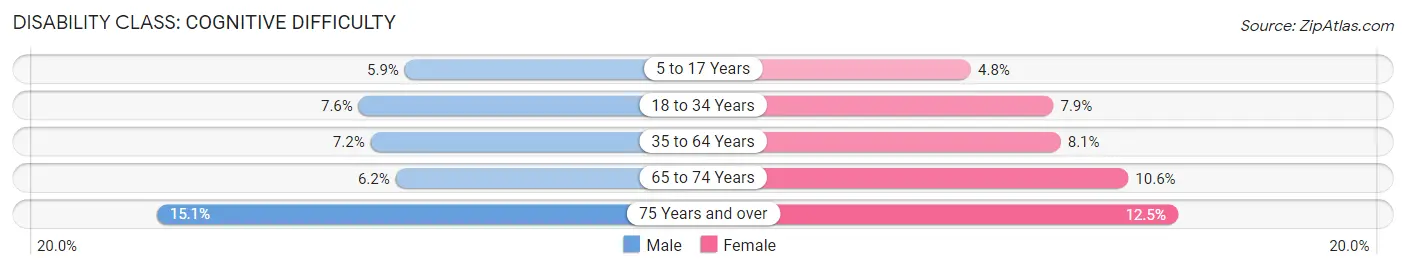
| Age Bracket | Male | Female |
| 5 to 17 Years | 390 (5.9%) | 302 (4.8%) |
| 18 to 34 Years | 633 (7.6%) | 601 (7.9%) |
| 35 to 64 Years | 1,122 (7.2%) | 1,262 (8.1%) |
| 65 to 74 Years | 327 (6.2%) | 555 (10.6%) |
| 75 Years and over | 459 (15.1%) | 447 (12.5%) |
Disability Class: Ambulatory Difficulty
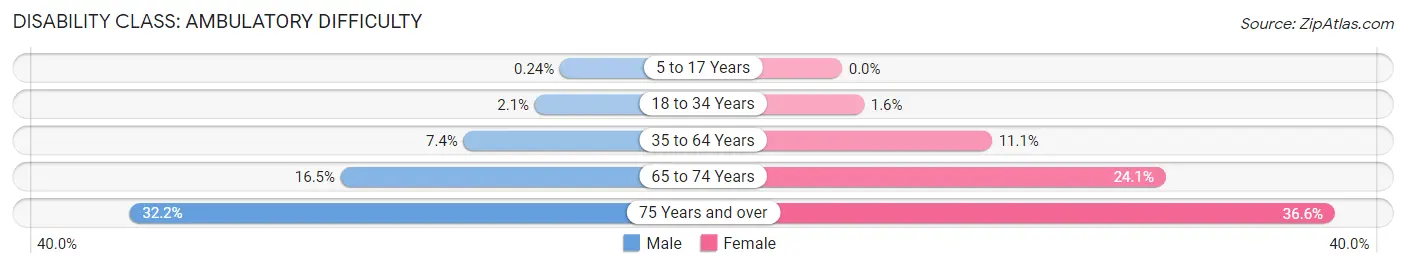
| Age Bracket | Male | Female |
| 5 to 17 Years | 16 (0.2%) | 0 (0.0%) |
| 18 to 34 Years | 176 (2.1%) | 125 (1.6%) |
| 35 to 64 Years | 1,160 (7.4%) | 1,727 (11.1%) |
| 65 to 74 Years | 868 (16.5%) | 1,254 (24.0%) |
| 75 Years and over | 980 (32.2%) | 1,313 (36.6%) |
Disability Class: Self-Care Difficulty
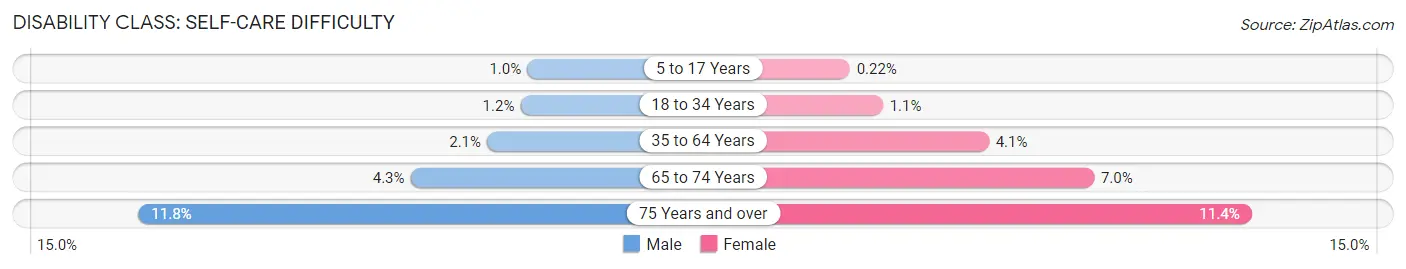
| Age Bracket | Male | Female |
| 5 to 17 Years | 67 (1.0%) | 14 (0.2%) |
| 18 to 34 Years | 100 (1.2%) | 87 (1.1%) |
| 35 to 64 Years | 334 (2.1%) | 635 (4.1%) |
| 65 to 74 Years | 224 (4.3%) | 366 (7.0%) |
| 75 Years and over | 360 (11.8%) | 409 (11.4%) |
Technology Access in Lewis County
Computing Device Access in Lewis County
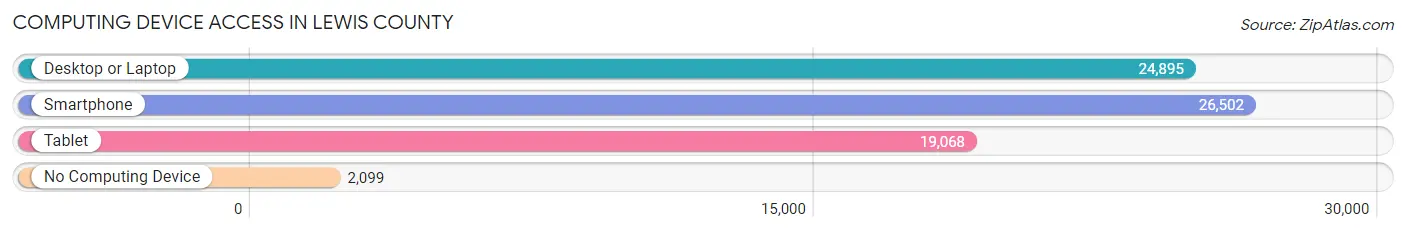
| Device Type | # Households | % Households |
| Desktop or Laptop | 24,895 | 79.0% |
| Smartphone | 26,502 | 84.1% |
| Tablet | 19,068 | 60.5% |
| No Computing Device | 2,099 | 6.7% |
| Total | 31,511 | 100.0% |
Internet Access in Lewis County
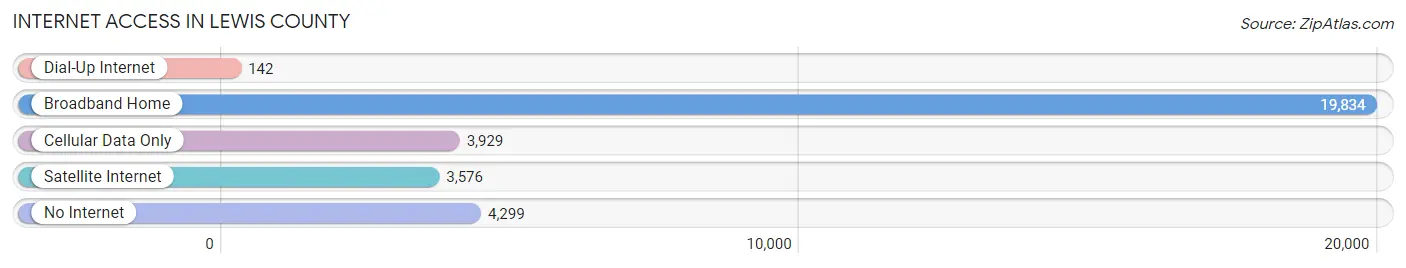
| Internet Type | # Households | % Households |
| Dial-Up Internet | 142 | 0.4% |
| Broadband Home | 19,834 | 62.9% |
| Cellular Data Only | 3,929 | 12.5% |
| Satellite Internet | 3,576 | 11.4% |
| No Internet | 4,299 | 13.6% |
| Total | 31,511 | 100.0% |
Lewis County Summary
Lewis County is a county located in the U.S. state of Washington. As of the 2010 census, the population was 75,455. The county seat is Chehalis. The county was created in 1845 and is named after Meriwether Lewis of the Lewis and Clark Expedition.
History
Lewis County was created in 1845 and is named after Meriwether Lewis of the Lewis and Clark Expedition. The county was originally part of Thurston County, but was split off in 1845. The county was further divided in 1854 when Pacific County was created.
The first settlers in Lewis County were the Cowlitz people, who lived in the area for thousands of years before the arrival of Europeans. The first European settlers arrived in the area in the early 1800s, and the county was officially established in 1845.
The county was largely rural until the late 19th century, when logging and mining began to take off. The county was also home to several Native American tribes, including the Cowlitz, Chehalis, and Quinault.
Geography
Lewis County is located in the southwestern corner of Washington, bordered by Pacific County to the west, Grays Harbor County to the north, and Cowlitz County to the east. The county covers an area of 2,541 square miles, making it the fifth-largest county in the state.
The county is largely mountainous, with the Cascade Mountains running through the center of the county. The highest point in the county is Mount Rainier, which stands at 14,411 feet. The county also contains several rivers, including the Cowlitz, Chehalis, and Skookumchuck.
Economy
Lewis County has a diverse economy, with a mix of industries including logging, mining, agriculture, and tourism. The county is home to several large timber companies, including Weyerhaeuser and Green Diamond. The county is also home to several large mining operations, including the Centralia Mine and the Centralia Coal Mine.
Agriculture is also an important part of the county's economy, with dairy, beef, and poultry production being the main agricultural activities. The county is also home to several wineries and breweries, as well as several tourist attractions, including the Mount St. Helens National Volcanic Monument.
Demographics
As of the 2010 census, the population of Lewis County was 75,455. The racial makeup of the county was 87.3% White, 0.7% African American, 1.3% Native American, 0.7% Asian, 0.2% Pacific Islander, 6.7% from other races, and 3.2% from two or more races. Hispanic or Latino of any race were 11.2% of the population.
The median income for a household in the county was $45,945, and the median income for a family was $54,945. The per capita income for the county was $22,945. About 11.2% of families and 15.2% of the population were below the poverty line, including 20.2% of those under age 18 and 8.2% of those age 65 or over.
Common Questions
What is Per Capita Income in Lewis County?
Per Capita income in Lewis County is $32,800.
What is the Median Family Income in Lewis County?
Median Family Income in Lewis County is $83,359.
What is the Median Household income in Lewis County?
Median Household Income in Lewis County is $67,247.
What is Income or Wage Gap in Lewis County?
Income or Wage Gap in Lewis County is 31.7%.
Women in Lewis County earn 68.3 cents for every dollar earned by a man.
What is Family Income Deficit in Lewis County?
Family Income Deficit in Lewis County is $9,394.
Families that are below poverty line in Lewis County earn $9,394 less on average than the poverty threshold level.
What is Inequality or Gini Index in Lewis County?
Inequality or Gini Index in Lewis County is 0.42.
What is the Total Population of Lewis County?
Total Population of Lewis County is 82,663.
What is the Total Male Population of Lewis County?
Total Male Population of Lewis County is 41,896.
What is the Total Female Population of Lewis County?
Total Female Population of Lewis County is 40,767.
What is the Ratio of Males per 100 Females in Lewis County?
There are 102.77 Males per 100 Females in Lewis County.
What is the Ratio of Females per 100 Males in Lewis County?
There are 97.31 Females per 100 Males in Lewis County.
What is the Median Population Age in Lewis County?
Median Population Age in Lewis County is 42.4 Years.
What is the Average Family Size in Lewis County
Average Family Size in Lewis County is 3.1 People.
What is the Average Household Size in Lewis County
Average Household Size in Lewis County is 2.6 People.
How Large is the Labor Force in Lewis County?
There are 36,906 People in the Labor Forcein in Lewis County.
What is the Percentage of People in the Labor Force in Lewis County?
55.0% of People are in the Labor Force in Lewis County.
What is the Unemployment Rate in Lewis County?
Unemployment Rate in Lewis County is 6.3%.