Chevy Chase Village, MD Map & Demographics
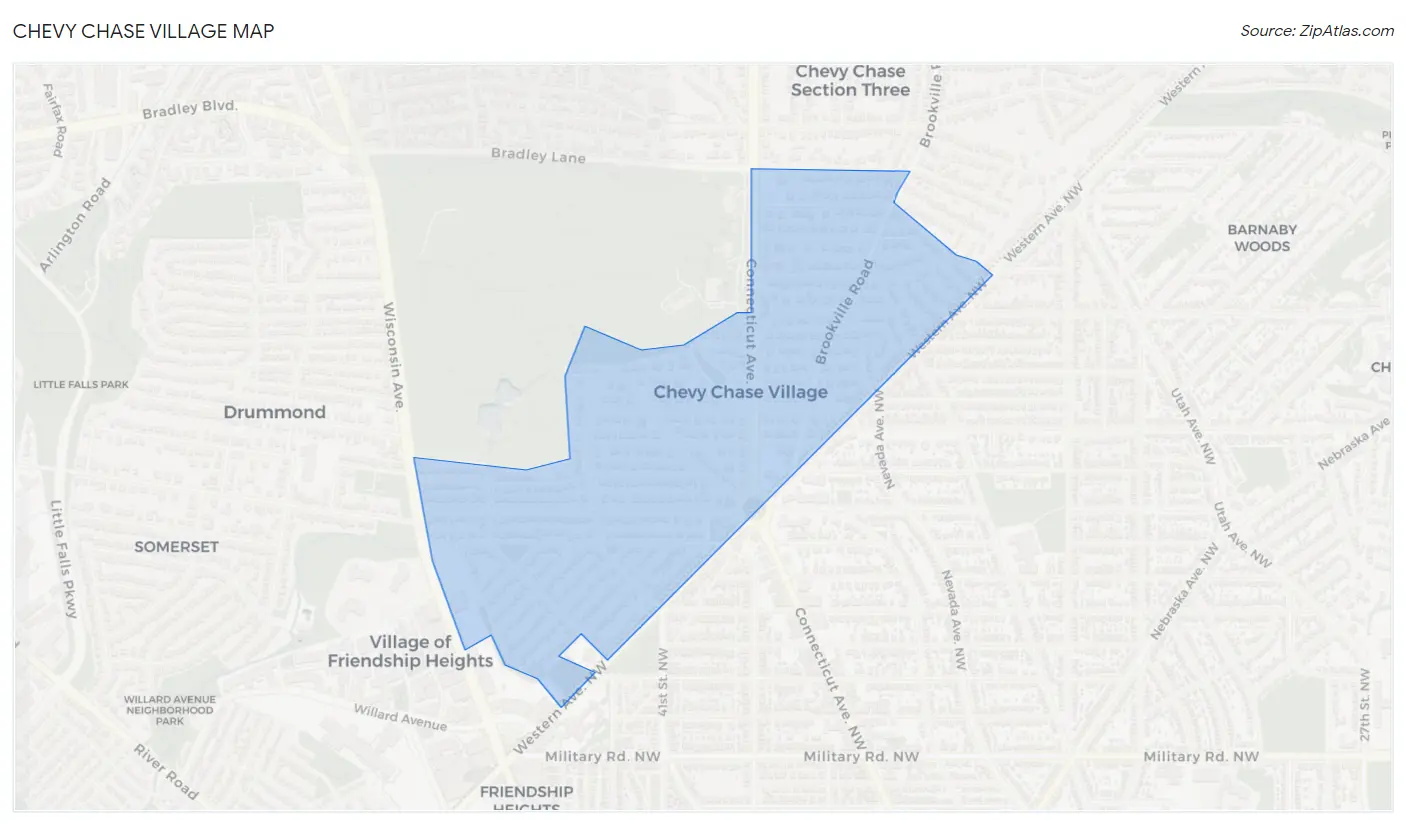
Chevy Chase Village Map
Chevy Chase Village Overview
$191,804
PER CAPITA INCOME
$250,001
AVG FAMILY INCOME
$250,001
AVG HOUSEHOLD INCOME
41.8%
WAGE / INCOME GAP [ % ]
58.2¢/ $1
WAGE / INCOME GAP [ $ ]
0.44
INEQUALITY / GINI INDEX
1,885
TOTAL POPULATION
969
MALE POPULATION
916
FEMALE POPULATION
105.79
MALES / 100 FEMALES
94.53
FEMALES / 100 MALES
51.0
MEDIAN AGE
3.0
AVG FAMILY SIZE
2.8
AVG HOUSEHOLD SIZE
895
LABOR FORCE [ PEOPLE ]
59.6%
PERCENT IN LABOR FORCE
2.5%
UNEMPLOYMENT RATE
Income in Chevy Chase Village
Income Overview in Chevy Chase Village
Per Capita Income in Chevy Chase Village is $191,804, while median incomes of families and households are $250,001 and $250,001 respectively.
| Characteristic | Number | Measure |
| Per Capita Income | 1,885 | $191,804 |
| Median Family Income | 595 | $250,001 |
| Mean Family Income | 595 | $577,528 |
| Median Household Income | 682 | $250,001 |
| Mean Household Income | 682 | $524,519 |
| Income Deficit | 595 | $0 |
| Wage / Income Gap (%) | 1,885 | 41.80% |
| Wage / Income Gap ($) | 1,885 | 58.20¢ per $1 |
| Gini / Inequality Index | 1,885 | 0.44 |
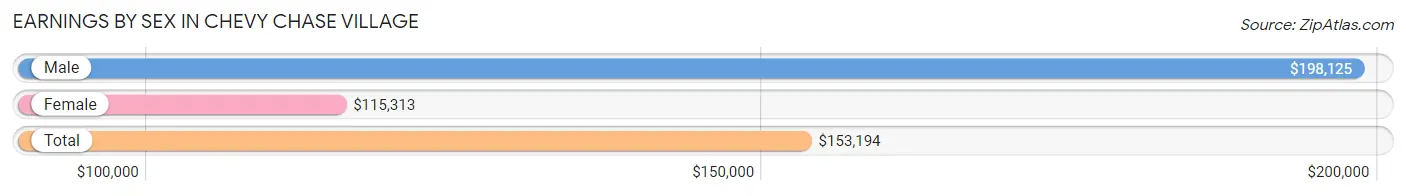
Earnings by Sex in Chevy Chase Village
Average Earnings in Chevy Chase Village are $153,194, $198,125 for men and $115,313 for women, a difference of 41.8%.
| Sex | Number | Average Earnings |
| Male | 567 (59.6%) | $198,125 |
| Female | 384 (40.4%) | $115,313 |
| Total | 951 (100.0%) | $153,194 |
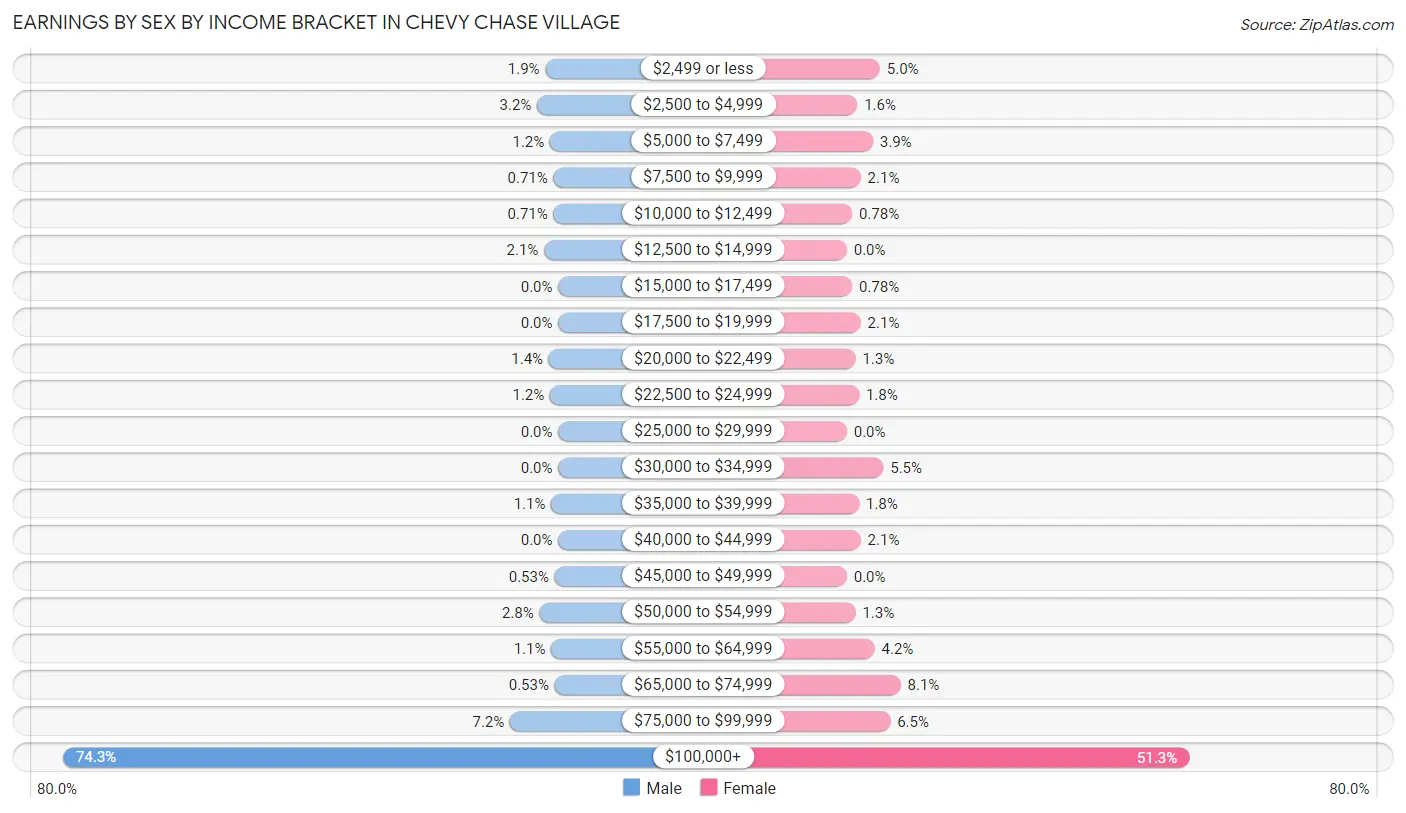
Earnings by Sex by Income Bracket in Chevy Chase Village
The most common earnings brackets in Chevy Chase Village are $100,000+ for men (421 | 74.3%) and $100,000+ for women (197 | 51.3%).
| Income | Male | Female |
| $2,499 or less | 11 (1.9%) | 19 (5.0%) |
| $2,500 to $4,999 | 18 (3.2%) | 6 (1.6%) |
| $5,000 to $7,499 | 7 (1.2%) | 15 (3.9%) |
| $7,500 to $9,999 | 4 (0.7%) | 8 (2.1%) |
| $10,000 to $12,499 | 4 (0.7%) | 3 (0.8%) |
| $12,500 to $14,999 | 12 (2.1%) | 0 (0.0%) |
| $15,000 to $17,499 | 0 (0.0%) | 3 (0.8%) |
| $17,500 to $19,999 | 0 (0.0%) | 8 (2.1%) |
| $20,000 to $22,499 | 8 (1.4%) | 5 (1.3%) |
| $22,500 to $24,999 | 7 (1.2%) | 7 (1.8%) |
| $25,000 to $29,999 | 0 (0.0%) | 0 (0.0%) |
| $30,000 to $34,999 | 0 (0.0%) | 21 (5.5%) |
| $35,000 to $39,999 | 6 (1.1%) | 7 (1.8%) |
| $40,000 to $44,999 | 0 (0.0%) | 8 (2.1%) |
| $45,000 to $49,999 | 3 (0.5%) | 0 (0.0%) |
| $50,000 to $54,999 | 16 (2.8%) | 5 (1.3%) |
| $55,000 to $64,999 | 6 (1.1%) | 16 (4.2%) |
| $65,000 to $74,999 | 3 (0.5%) | 31 (8.1%) |
| $75,000 to $99,999 | 41 (7.2%) | 25 (6.5%) |
| $100,000+ | 421 (74.3%) | 197 (51.3%) |
| Total | 567 (100.0%) | 384 (100.0%) |
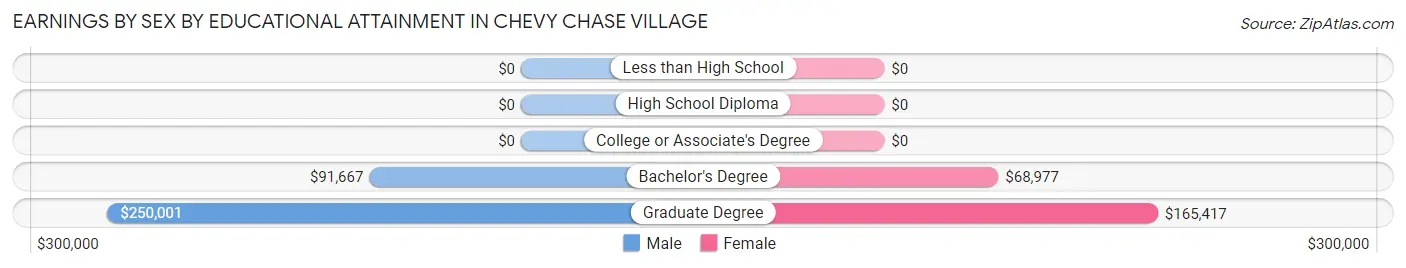
Earnings by Sex by Educational Attainment in Chevy Chase Village
Average earnings in Chevy Chase Village are $230,000 for men and $117,500 for women, a difference of 48.9%. Men with an educational attainment of graduate degree enjoy the highest average annual earnings of $250,001, while those with bachelor's degree education earn the least with $91,667. Women with an educational attainment of graduate degree earn the most with the average annual earnings of $165,417, while those with bachelor's degree education have the smallest earnings of $68,977.
| Educational Attainment | Male Income | Female Income |
| Less than High School | - | - |
| High School Diploma | - | - |
| College or Associate's Degree | - | - |
| Bachelor's Degree | $91,667 | $68,977 |
| Graduate Degree | $250,001 | $165,417 |
| Total | $230,000 | $117,500 |
Family Income in Chevy Chase Village
Family Income Brackets in Chevy Chase Village
According to the Chevy Chase Village family income data, there are 498 families falling into the $200,000+ income range, which is the most common income bracket and makes up 83.7% of all families.
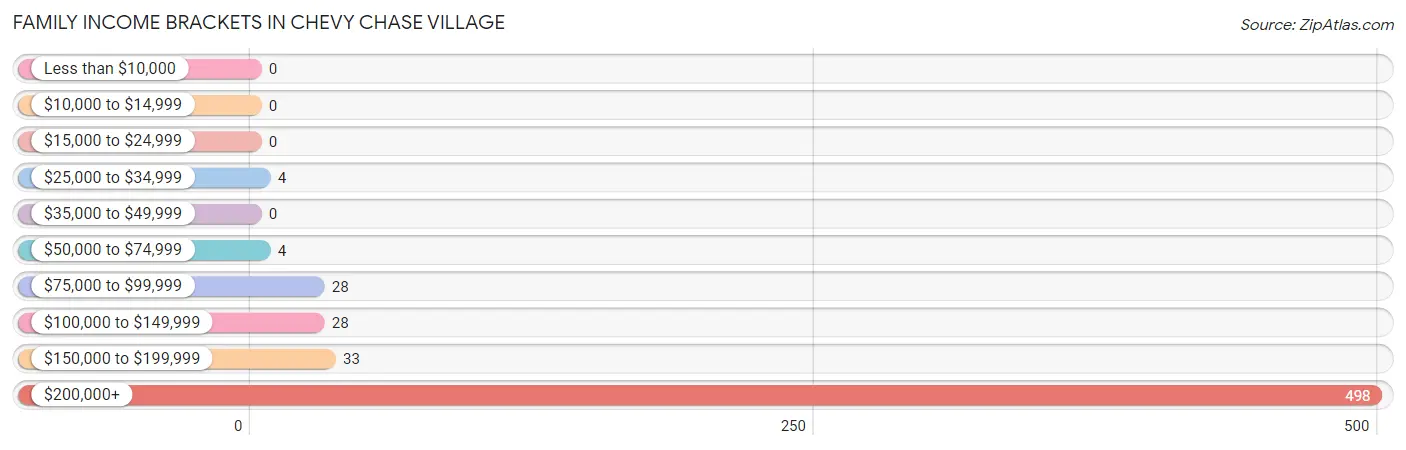
| Income Bracket | # Families | % Families |
| Less than $10,000 | 0 | 0.0% |
| $10,000 to $14,999 | 0 | 0.0% |
| $15,000 to $24,999 | 0 | 0.0% |
| $25,000 to $34,999 | 4 | 0.7% |
| $35,000 to $49,999 | 0 | 0.0% |
| $50,000 to $74,999 | 4 | 0.7% |
| $75,000 to $99,999 | 28 | 4.7% |
| $100,000 to $149,999 | 28 | 4.7% |
| $150,000 to $199,999 | 33 | 5.5% |
| $200,000+ | 498 | 83.7% |
Family Income by Famaliy Size in Chevy Chase Village
2-person families (316 | 53.1%) account for the highest median family income in Chevy Chase Village with $250,001 per family, while 2-person families (316 | 53.1%) have the highest median income of $125,000 per family member.
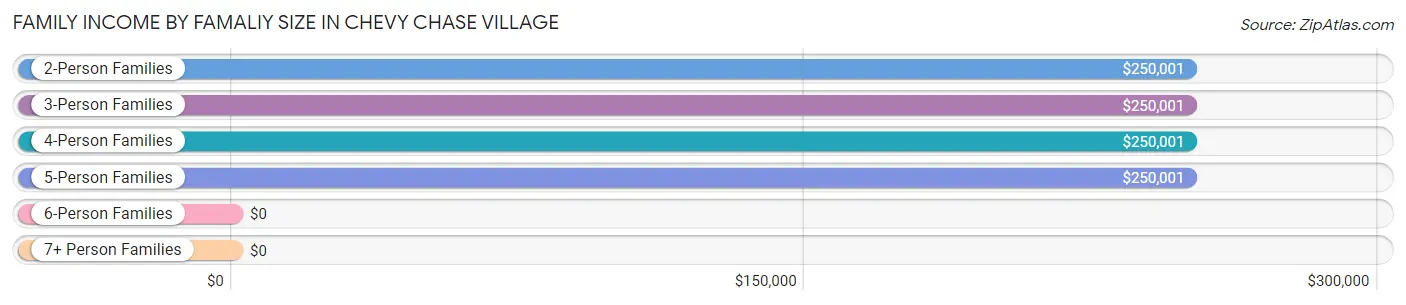
| Income Bracket | # Families | Median Income |
| 2-Person Families | 316 (53.1%) | $250,001 |
| 3-Person Families | 110 (18.5%) | $250,001 |
| 4-Person Families | 111 (18.7%) | $250,001 |
| 5-Person Families | 53 (8.9%) | $250,001 |
| 6-Person Families | 5 (0.8%) | $0 |
| 7+ Person Families | 0 (0.0%) | $0 |
| Total | 595 (100.0%) | $250,001 |
Family Income by Number of Earners in Chevy Chase Village
The median family income in Chevy Chase Village is $250,001, with families comprising 1 earner (249) having the highest median family income of $250,001, while families with no earners (64) have the lowest median family income of $221,875, accounting for 41.8% and 10.8% of families, respectively.
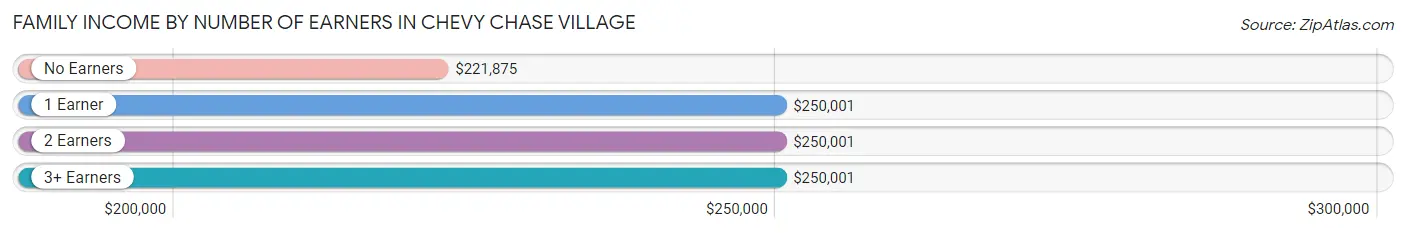
| Number of Earners | # Families | Median Income |
| No Earners | 64 (10.8%) | $221,875 |
| 1 Earner | 249 (41.8%) | $250,001 |
| 2 Earners | 249 (41.8%) | $250,001 |
| 3+ Earners | 33 (5.6%) | $250,001 |
| Total | 595 (100.0%) | $250,001 |
Household Income in Chevy Chase Village
Household Income Brackets in Chevy Chase Village
With 521 households falling in the category, the $200,000+ income range is the most frequent in Chevy Chase Village, accounting for 76.4% of all households.
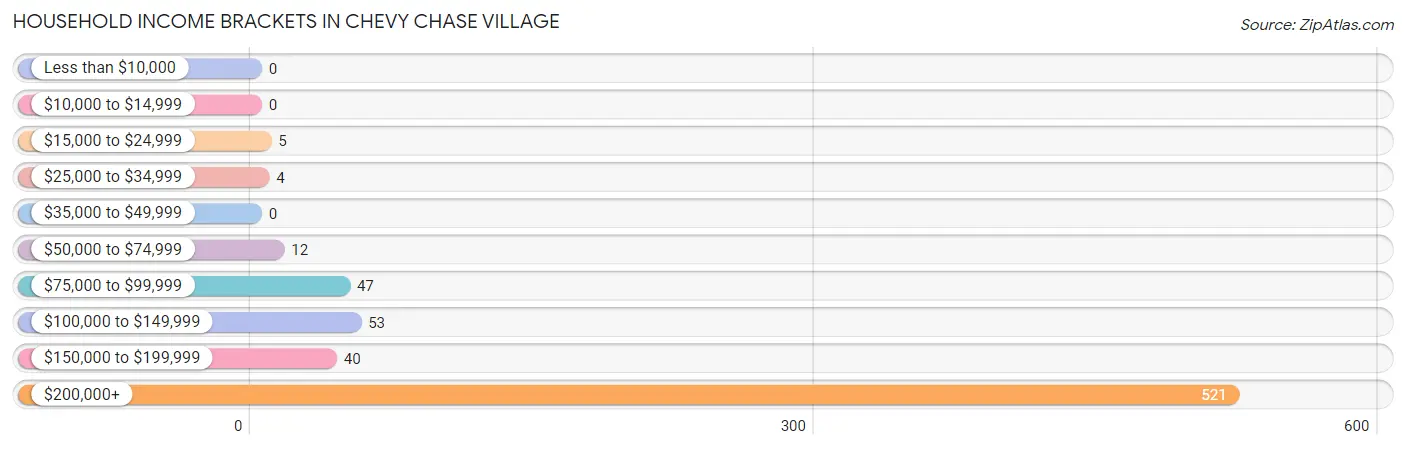
| Income Bracket | # Households | % Households |
| Less than $10,000 | 0 | 0.0% |
| $10,000 to $14,999 | 0 | 0.0% |
| $15,000 to $24,999 | 5 | 0.7% |
| $25,000 to $34,999 | 4 | 0.6% |
| $35,000 to $49,999 | 0 | 0.0% |
| $50,000 to $74,999 | 12 | 1.8% |
| $75,000 to $99,999 | 47 | 6.9% |
| $100,000 to $149,999 | 53 | 7.8% |
| $150,000 to $199,999 | 40 | 5.9% |
| $200,000+ | 521 | 76.4% |
Household Income by Householder Age in Chevy Chase Village
The median household income in Chevy Chase Village is $250,001, with the highest median household income of $250,001 found in the 25 to 44 years age bracket for the primary householder. A total of 68 households (10.0%) fall into this category.
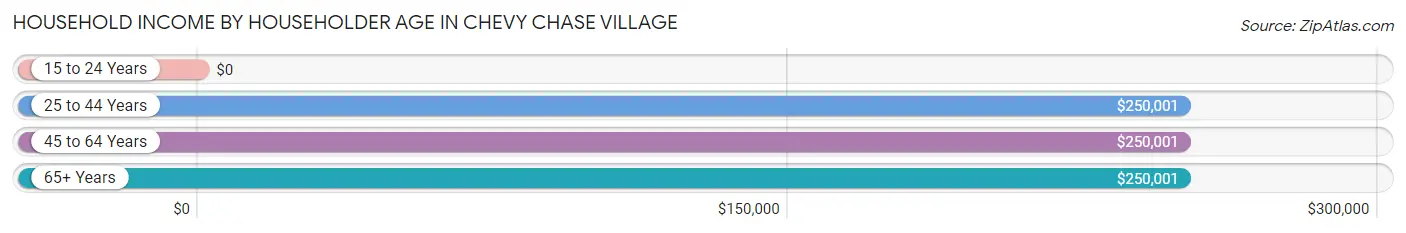
| Income Bracket | # Households | Median Income |
| 15 to 24 Years | 0 (0.0%) | $0 |
| 25 to 44 Years | 68 (10.0%) | $250,001 |
| 45 to 64 Years | 267 (39.2%) | $250,001 |
| 65+ Years | 347 (50.9%) | $250,001 |
| Total | 682 (100.0%) | $250,001 |
Poverty in Chevy Chase Village
Income Below Poverty by Sex and Age in Chevy Chase Village
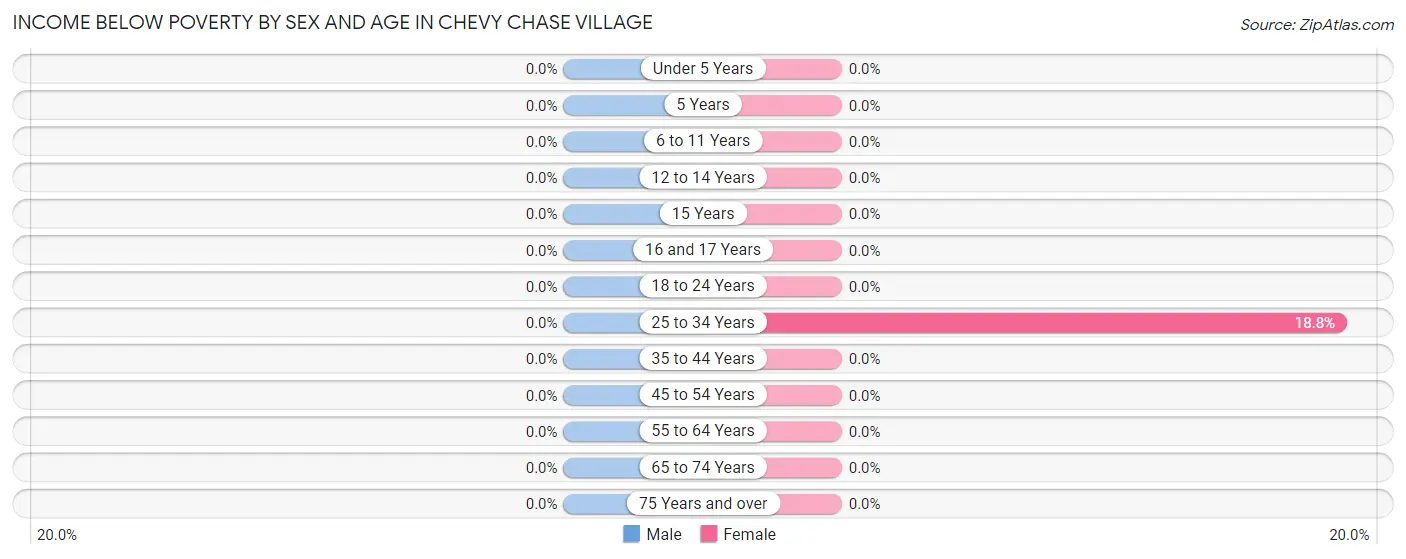
| Age Bracket | Male | Female |
| Under 5 Years | 0 (0.0%) | 0 (0.0%) |
| 5 Years | 0 (0.0%) | 0 (0.0%) |
| 6 to 11 Years | 0 (0.0%) | 0 (0.0%) |
| 12 to 14 Years | 0 (0.0%) | 0 (0.0%) |
| 15 Years | 0 (0.0%) | 0 (0.0%) |
| 16 and 17 Years | 0 (0.0%) | 0 (0.0%) |
| 18 to 24 Years | 0 (0.0%) | 0 (0.0%) |
| 25 to 34 Years | 0 (0.0%) | 3 (18.8%) |
| 35 to 44 Years | 0 (0.0%) | 0 (0.0%) |
| 45 to 54 Years | 0 (0.0%) | 0 (0.0%) |
| 55 to 64 Years | 0 (0.0%) | 0 (0.0%) |
| 65 to 74 Years | 0 (0.0%) | 0 (0.0%) |
| 75 Years and over | 0 (0.0%) | 0 (0.0%) |
| Total | 0 (0.0%) | 3 (0.3%) |
Income Above Poverty by Sex and Age in Chevy Chase Village
According to the poverty statistics in Chevy Chase Village, males aged under 5 years and females aged under 5 years are the age groups that are most secure financially, with 100.0% of males and 100.0% of females in these age groups living above the poverty line.
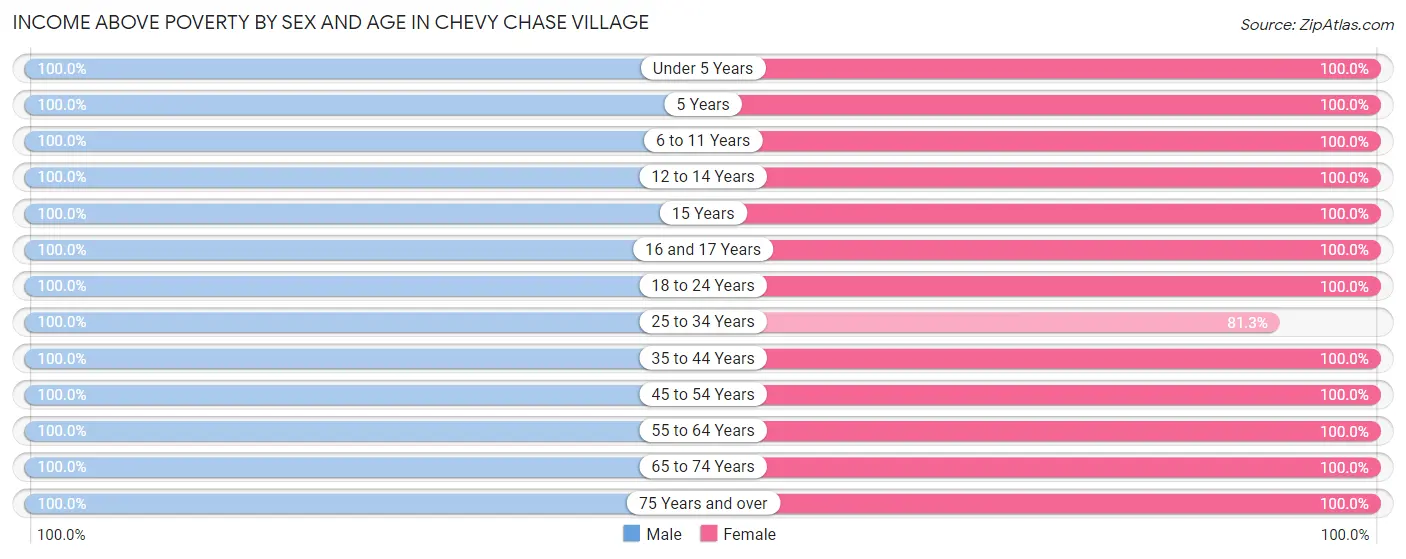
| Age Bracket | Male | Female |
| Under 5 Years | 61 (100.0%) | 36 (100.0%) |
| 5 Years | 11 (100.0%) | 13 (100.0%) |
| 6 to 11 Years | 52 (100.0%) | 62 (100.0%) |
| 12 to 14 Years | 34 (100.0%) | 61 (100.0%) |
| 15 Years | 28 (100.0%) | 26 (100.0%) |
| 16 and 17 Years | 38 (100.0%) | 22 (100.0%) |
| 18 to 24 Years | 69 (100.0%) | 17 (100.0%) |
| 25 to 34 Years | 39 (100.0%) | 13 (81.2%) |
| 35 to 44 Years | 62 (100.0%) | 103 (100.0%) |
| 45 to 54 Years | 150 (100.0%) | 161 (100.0%) |
| 55 to 64 Years | 132 (100.0%) | 95 (100.0%) |
| 65 to 74 Years | 138 (100.0%) | 211 (100.0%) |
| 75 Years and over | 155 (100.0%) | 93 (100.0%) |
| Total | 969 (100.0%) | 913 (99.7%) |
Income Below Poverty Among Married-Couple Families in Chevy Chase Village
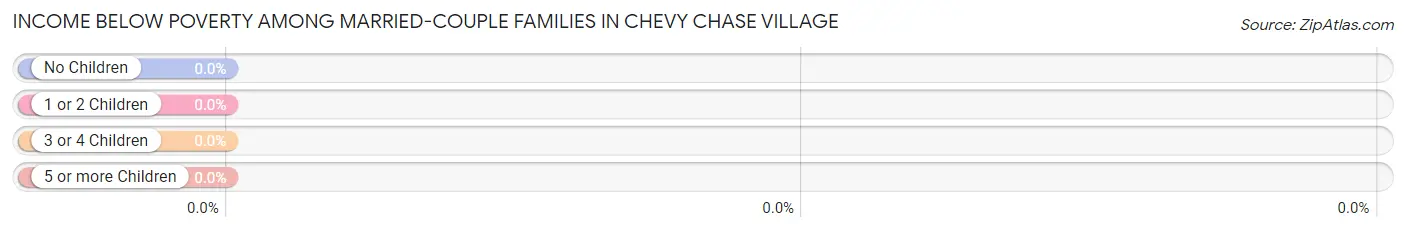
| Children | Above Poverty | Below Poverty |
| No Children | 364 (100.0%) | 0 (0.0%) |
| 1 or 2 Children | 169 (100.0%) | 0 (0.0%) |
| 3 or 4 Children | 48 (100.0%) | 0 (0.0%) |
| 5 or more Children | 0 (0.0%) | 0 (0.0%) |
| Total | 581 (100.0%) | 0 (0.0%) |
Income Below Poverty Among Single-Parent Households in Chevy Chase Village
| Children | Single Father | Single Mother |
| No Children | 0 (0.0%) | 0 (0.0%) |
| 1 or 2 Children | 0 (0.0%) | 0 (0.0%) |
| 3 or 4 Children | 0 (0.0%) | 0 (0.0%) |
| 5 or more Children | 0 (0.0%) | 0 (0.0%) |
| Total | 0 (0.0%) | 0 (0.0%) |
Income Below Poverty Among Married-Couple vs Single-Parent Households in Chevy Chase Village
| Children | Married-Couple Families | Single-Parent Households |
| No Children | 0 (0.0%) | 0 (0.0%) |
| 1 or 2 Children | 0 (0.0%) | 0 (0.0%) |
| 3 or 4 Children | 0 (0.0%) | 0 (0.0%) |
| 5 or more Children | 0 (0.0%) | 0 (0.0%) |
| Total | 0 (0.0%) | 0 (0.0%) |
Race in Chevy Chase Village
The most populous races in Chevy Chase Village are White / Caucasian (1,734 | 92.0%), Two or more Races (110 | 5.8%), and Hispanic or Latino (59 | 3.1%).
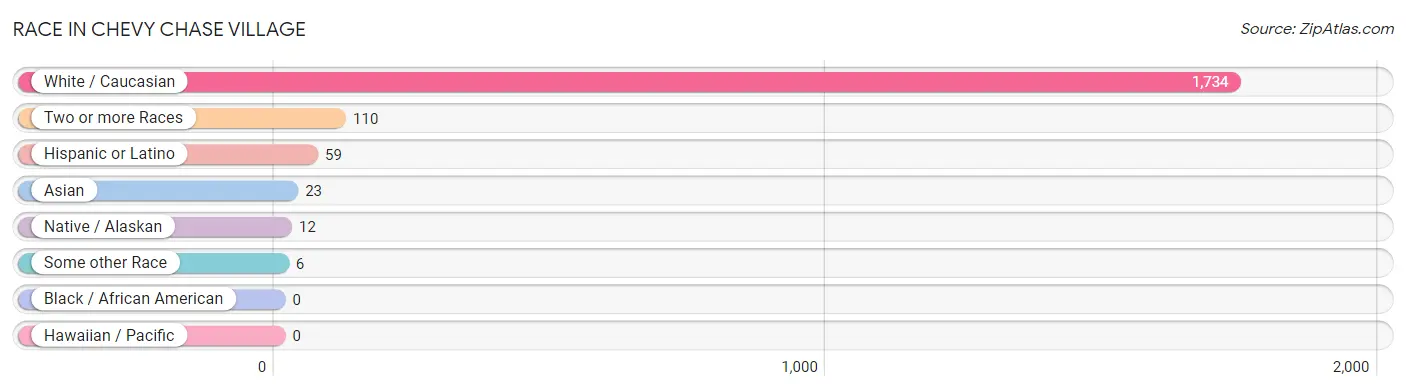
| Race | # Population | % Population |
| Asian | 23 | 1.2% |
| Black / African American | 0 | 0.0% |
| Hawaiian / Pacific | 0 | 0.0% |
| Hispanic or Latino | 59 | 3.1% |
| Native / Alaskan | 12 | 0.6% |
| White / Caucasian | 1,734 | 92.0% |
| Two or more Races | 110 | 5.8% |
| Some other Race | 6 | 0.3% |
| Total | 1,885 | 100.0% |
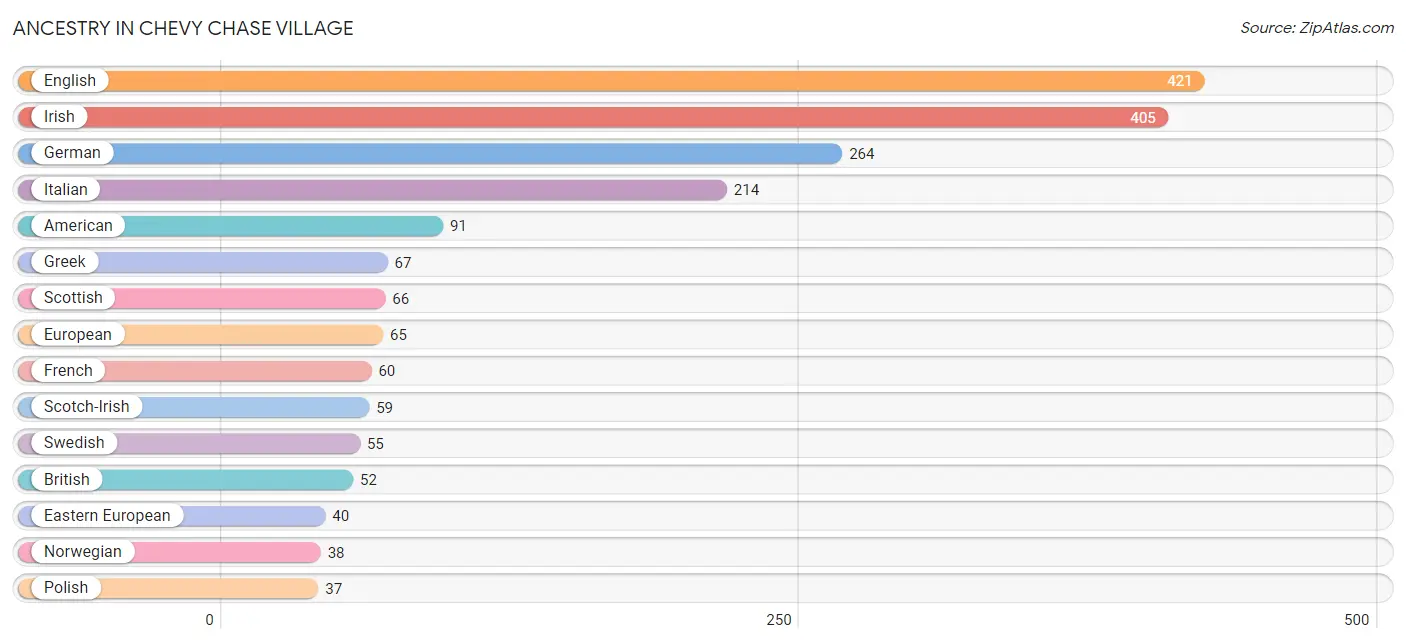
Ancestry in Chevy Chase Village
The most populous ancestries reported in Chevy Chase Village are English (421 | 22.3%), Irish (405 | 21.5%), German (264 | 14.0%), Italian (214 | 11.4%), and American (91 | 4.8%), together accounting for 74.0% of all Chevy Chase Village residents.
| Ancestry | # Population | % Population |
| American | 91 | 4.8% |
| Arab | 9 | 0.5% |
| Armenian | 12 | 0.6% |
| Assyrian / Chaldean / Syriac | 7 | 0.4% |
| Austrian | 22 | 1.2% |
| Bhutanese | 10 | 0.5% |
| Bolivian | 3 | 0.2% |
| Brazilian | 3 | 0.2% |
| British | 52 | 2.8% |
| Canadian | 5 | 0.3% |
| Central American | 6 | 0.3% |
| Colombian | 9 | 0.5% |
| Costa Rican | 6 | 0.3% |
| Cuban | 1 | 0.1% |
| Czech | 5 | 0.3% |
| Danish | 9 | 0.5% |
| Dutch | 10 | 0.5% |
| Eastern European | 40 | 2.1% |
| English | 421 | 22.3% |
| European | 65 | 3.5% |
| Finnish | 7 | 0.4% |
| French | 60 | 3.2% |
| German | 264 | 14.0% |
| Greek | 67 | 3.5% |
| Hungarian | 36 | 1.9% |
| Indian (Asian) | 28 | 1.5% |
| Iranian | 16 | 0.9% |
| Irish | 405 | 21.5% |
| Italian | 214 | 11.4% |
| Jamaican | 3 | 0.2% |
| Lebanese | 6 | 0.3% |
| Lithuanian | 3 | 0.2% |
| Luxembourger | 3 | 0.2% |
| Maltese | 3 | 0.2% |
| Mexican | 16 | 0.9% |
| Norwegian | 38 | 2.0% |
| Peruvian | 10 | 0.5% |
| Polish | 37 | 2.0% |
| Portuguese | 3 | 0.2% |
| Russian | 18 | 0.9% |
| Scotch-Irish | 59 | 3.1% |
| Scottish | 66 | 3.5% |
| Serbian | 7 | 0.4% |
| Slovak | 3 | 0.2% |
| South American | 22 | 1.2% |
| Spaniard | 6 | 0.3% |
| Spanish | 4 | 0.2% |
| Sri Lankan | 17 | 0.9% |
| Subsaharan African | 8 | 0.4% |
| Swedish | 55 | 2.9% |
| Thai | 10 | 0.5% |
| Turkish | 3 | 0.2% |
| Ukrainian | 5 | 0.3% |
| Welsh | 8 | 0.4% | View All 54 Rows |
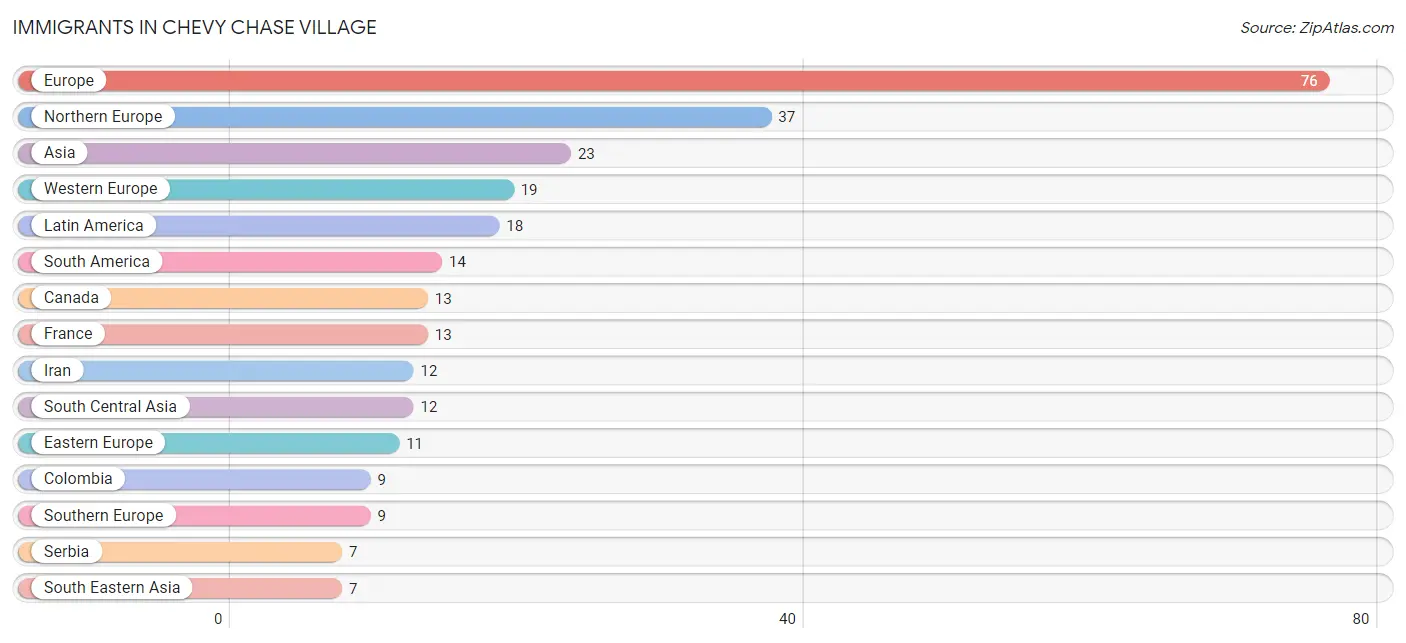
Immigrants in Chevy Chase Village
The most numerous immigrant groups reported in Chevy Chase Village came from Europe (76 | 4.0%), Northern Europe (37 | 2.0%), Asia (23 | 1.2%), Western Europe (19 | 1.0%), and Latin America (18 | 0.9%), together accounting for 9.2% of all Chevy Chase Village residents.
| Immigration Origin | # Population | % Population |
| Africa | 6 | 0.3% |
| Asia | 23 | 1.2% |
| Brazil | 3 | 0.2% |
| Canada | 13 | 0.7% |
| Caribbean | 4 | 0.2% |
| Colombia | 9 | 0.5% |
| Cuba | 1 | 0.1% |
| Eastern Asia | 4 | 0.2% |
| Eastern Europe | 11 | 0.6% |
| Egypt | 2 | 0.1% |
| England | 3 | 0.2% |
| Europe | 76 | 4.0% |
| France | 13 | 0.7% |
| Germany | 6 | 0.3% |
| Greece | 3 | 0.2% |
| Iran | 12 | 0.6% |
| Ireland | 3 | 0.2% |
| Italy | 3 | 0.2% |
| Jamaica | 3 | 0.2% |
| Korea | 4 | 0.2% |
| Latin America | 18 | 0.9% |
| Northern Africa | 2 | 0.1% |
| Northern Europe | 37 | 2.0% |
| Poland | 4 | 0.2% |
| Serbia | 7 | 0.4% |
| South Africa | 4 | 0.2% |
| South America | 14 | 0.7% |
| South Central Asia | 12 | 0.6% |
| South Eastern Asia | 7 | 0.4% |
| Southern Europe | 9 | 0.5% |
| Spain | 3 | 0.2% |
| Sweden | 4 | 0.2% |
| Venezuela | 2 | 0.1% |
| Vietnam | 7 | 0.4% |
| Western Europe | 19 | 1.0% | View All 35 Rows |
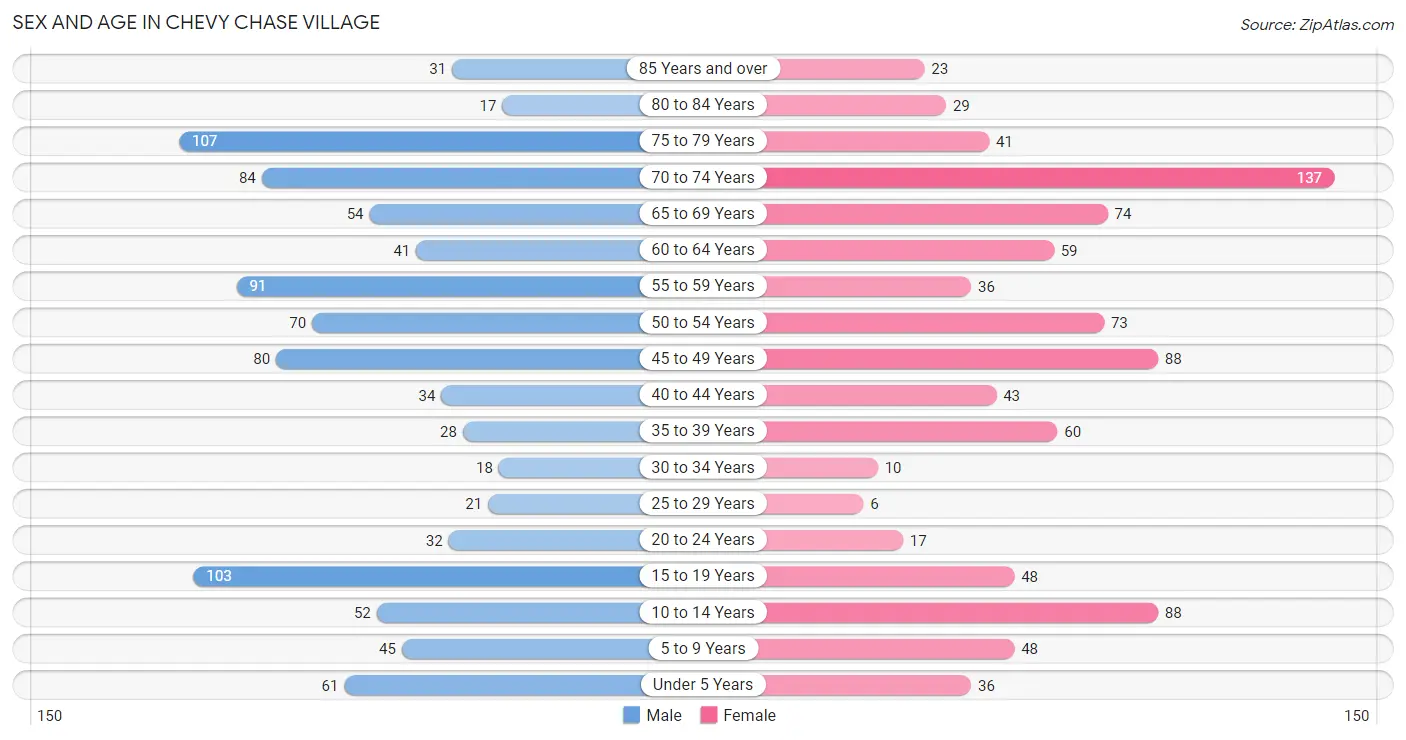
Sex and Age in Chevy Chase Village
Sex and Age in Chevy Chase Village
The most populous age groups in Chevy Chase Village are 75 to 79 Years (107 | 11.0%) for men and 70 to 74 Years (137 | 15.0%) for women.
| Age Bracket | Male | Female |
| Under 5 Years | 61 (6.3%) | 36 (3.9%) |
| 5 to 9 Years | 45 (4.6%) | 48 (5.2%) |
| 10 to 14 Years | 52 (5.4%) | 88 (9.6%) |
| 15 to 19 Years | 103 (10.6%) | 48 (5.2%) |
| 20 to 24 Years | 32 (3.3%) | 17 (1.9%) |
| 25 to 29 Years | 21 (2.2%) | 6 (0.7%) |
| 30 to 34 Years | 18 (1.9%) | 10 (1.1%) |
| 35 to 39 Years | 28 (2.9%) | 60 (6.6%) |
| 40 to 44 Years | 34 (3.5%) | 43 (4.7%) |
| 45 to 49 Years | 80 (8.3%) | 88 (9.6%) |
| 50 to 54 Years | 70 (7.2%) | 73 (8.0%) |
| 55 to 59 Years | 91 (9.4%) | 36 (3.9%) |
| 60 to 64 Years | 41 (4.2%) | 59 (6.4%) |
| 65 to 69 Years | 54 (5.6%) | 74 (8.1%) |
| 70 to 74 Years | 84 (8.7%) | 137 (15.0%) |
| 75 to 79 Years | 107 (11.0%) | 41 (4.5%) |
| 80 to 84 Years | 17 (1.8%) | 29 (3.2%) |
| 85 Years and over | 31 (3.2%) | 23 (2.5%) |
| Total | 969 (100.0%) | 916 (100.0%) |
Families and Households in Chevy Chase Village
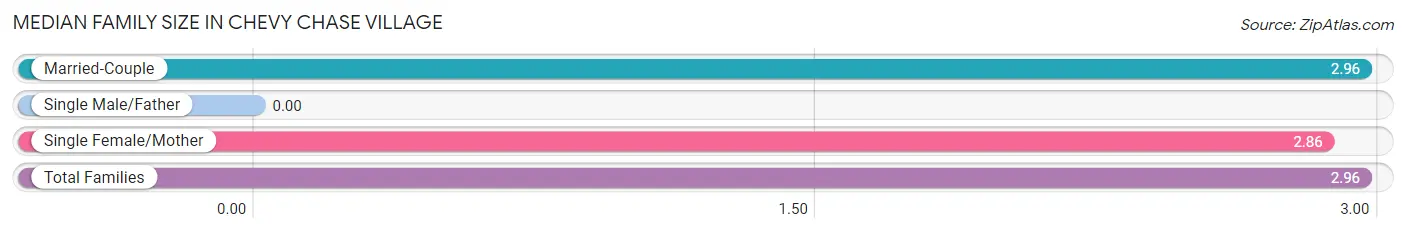
Median Family Size in Chevy Chase Village
| Family Type | # Families | Family Size |
| Married-Couple | 581 (97.7%) | 2.96 |
| Single Male/Father | 0 (0.0%) | - |
| Single Female/Mother | 14 (2.4%) | 2.86 |
| Total Families | 595 (100.0%) | 2.96 |
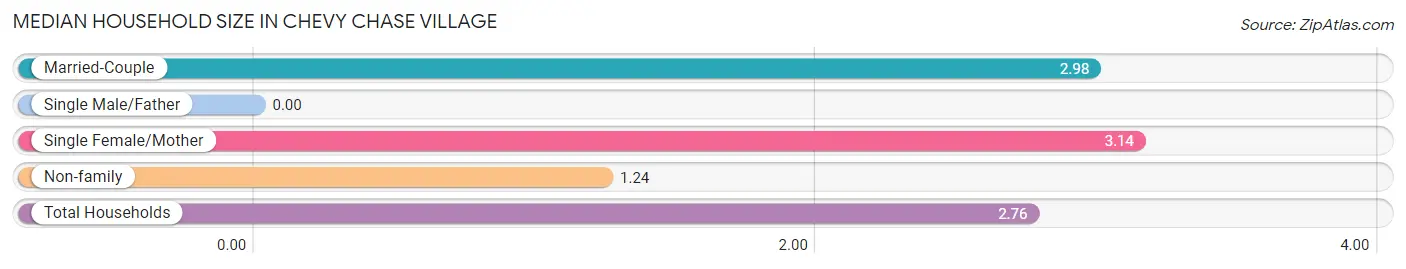
Median Household Size in Chevy Chase Village
| Household Type | # Households | Household Size |
| Married-Couple | 581 (85.2%) | 2.98 |
| Single Male/Father | 0 (0.0%) | - |
| Single Female/Mother | 14 (2.1%) | 3.14 |
| Non-family | 87 (12.8%) | 1.24 |
| Total Households | 682 (100.0%) | 2.76 |
Household Size by Marriage Status in Chevy Chase Village
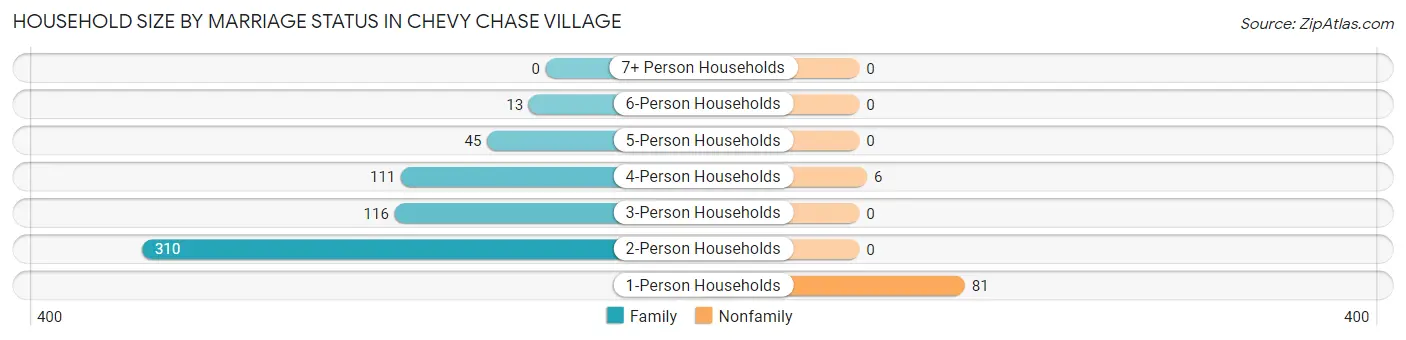
Out of a total of 682 households in Chevy Chase Village, 595 (87.2%) are family households, while 87 (12.8%) are nonfamily households. The most numerous type of family households are 2-person households, comprising 310, and the most common type of nonfamily households are 1-person households, comprising 81.
| Household Size | Family Households | Nonfamily Households |
| 1-Person Households | - | 81 (11.9%) |
| 2-Person Households | 310 (45.5%) | 0 (0.0%) |
| 3-Person Households | 116 (17.0%) | 0 (0.0%) |
| 4-Person Households | 111 (16.3%) | 6 (0.9%) |
| 5-Person Households | 45 (6.6%) | 0 (0.0%) |
| 6-Person Households | 13 (1.9%) | 0 (0.0%) |
| 7+ Person Households | 0 (0.0%) | 0 (0.0%) |
| Total | 595 (87.2%) | 87 (12.8%) |
Female Fertility in Chevy Chase Village
Fertility by Age in Chevy Chase Village
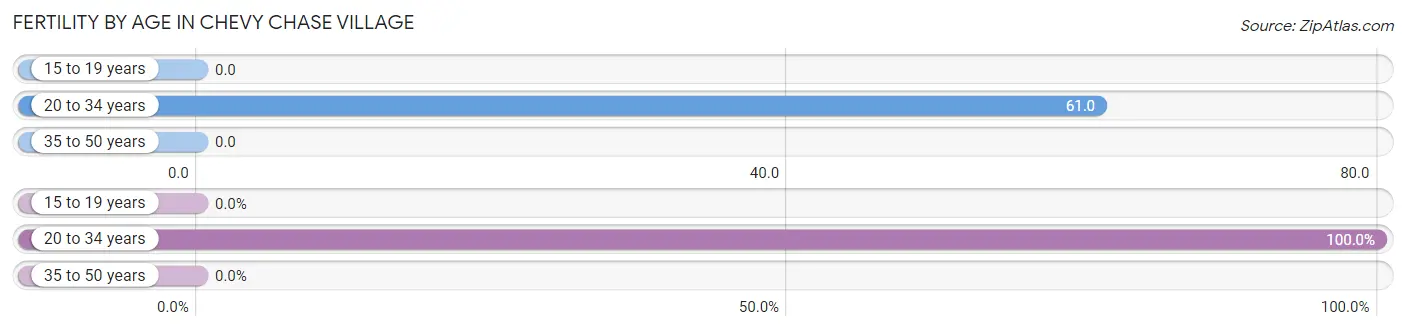
Average fertility rate in Chevy Chase Village is 7.0 births per 1,000 women. Women in the age bracket of 20 to 34 years have the highest fertility rate with 61.0 births per 1,000 women. Women in the age bracket of 20 to 34 years acount for 100.0% of all women with births.
| Age Bracket | Women with Births | Births / 1,000 Women |
| 15 to 19 years | 0 (0.0%) | 0.0 |
| 20 to 34 years | 2 (100.0%) | 61.0 |
| 35 to 50 years | 0 (0.0%) | 0.0 |
| Total | 2 (100.0%) | 7.0 |
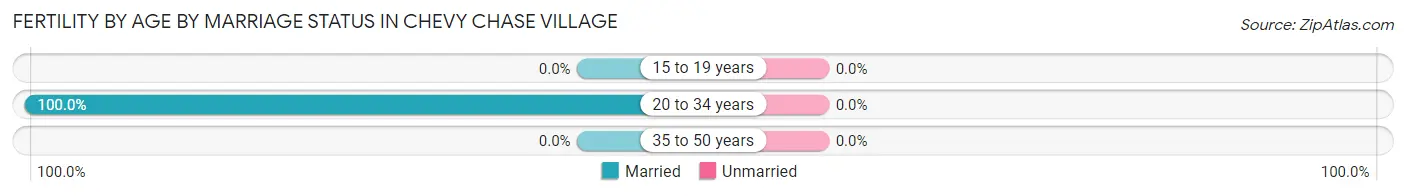
Fertility by Age by Marriage Status in Chevy Chase Village
| Age Bracket | Married | Unmarried |
| 15 to 19 years | 0 (0.0%) | 0 (0.0%) |
| 20 to 34 years | 2 (100.0%) | 0 (0.0%) |
| 35 to 50 years | 0 (0.0%) | 0 (0.0%) |
| Total | 2 (100.0%) | 0 (0.0%) |
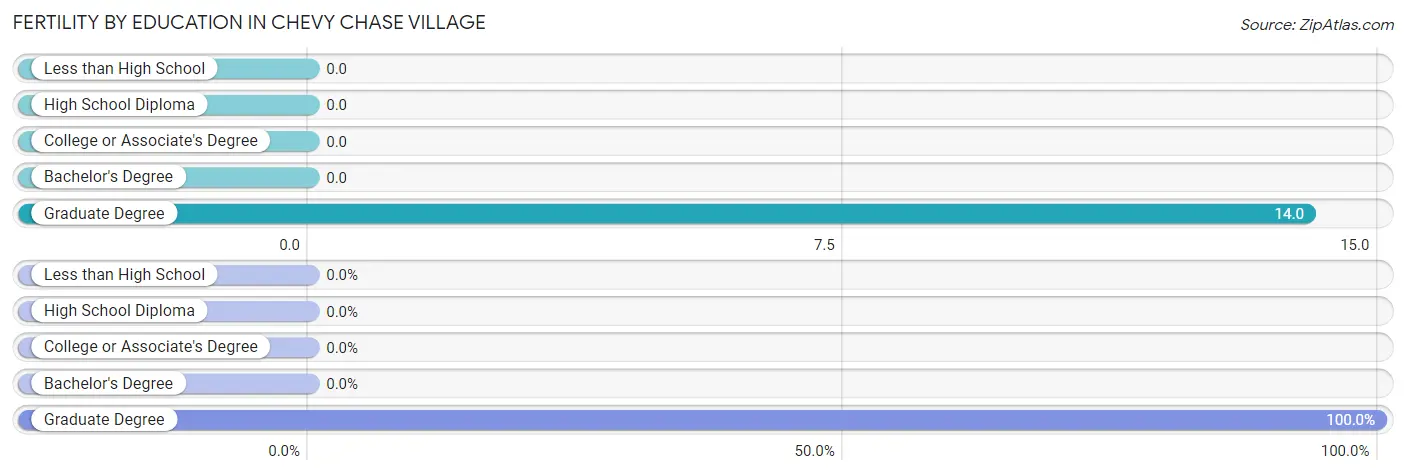
Fertility by Education in Chevy Chase Village
| Educational Attainment | Women with Births | Births / 1,000 Women |
| Less than High School | 0 (0.0%) | 0.0 |
| High School Diploma | 0 (0.0%) | 0.0 |
| College or Associate's Degree | 0 (0.0%) | 0.0 |
| Bachelor's Degree | 0 (0.0%) | 0.0 |
| Graduate Degree | 2 (100.0%) | 14.0 |
| Total | 2 (100.0%) | 7.0 |
Fertility by Education by Marriage Status in Chevy Chase Village
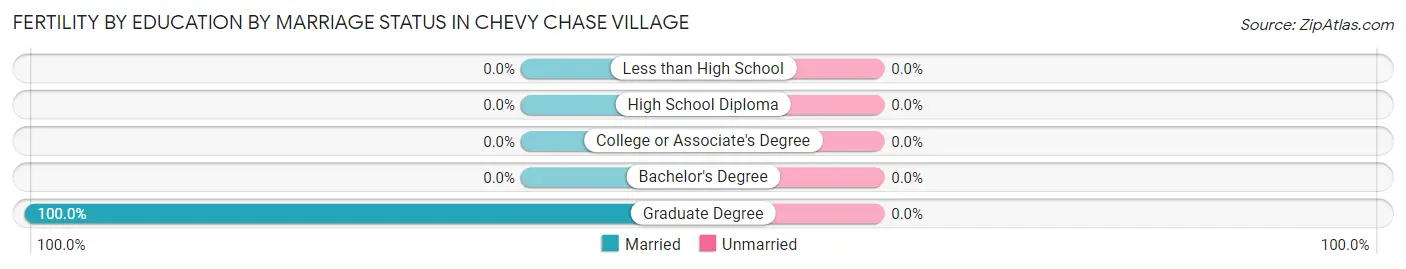
| Educational Attainment | Married | Unmarried |
| Less than High School | 0 (0.0%) | 0 (0.0%) |
| High School Diploma | 0 (0.0%) | 0 (0.0%) |
| College or Associate's Degree | 0 (0.0%) | 0 (0.0%) |
| Bachelor's Degree | 0 (0.0%) | 0 (0.0%) |
| Graduate Degree | 2 (100.0%) | 0 (0.0%) |
| Total | 2 (100.0%) | 0 (0.0%) |
Employment Characteristics in Chevy Chase Village
Employment by Class of Employer in Chevy Chase Village
Among the 864 employed individuals in Chevy Chase Village, private company employees (403 | 46.6%), federal government employees (146 | 16.9%), and not-for-profit organizations (130 | 15.0%) make up the most common classes of employment.
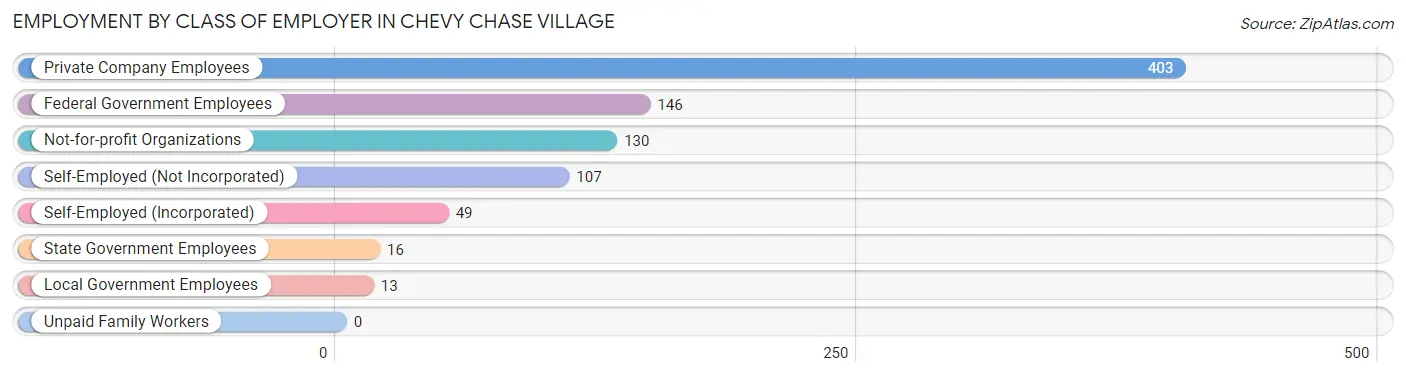
| Employer Class | # Employees | % Employees |
| Private Company Employees | 403 | 46.6% |
| Self-Employed (Incorporated) | 49 | 5.7% |
| Self-Employed (Not Incorporated) | 107 | 12.4% |
| Not-for-profit Organizations | 130 | 15.0% |
| Local Government Employees | 13 | 1.5% |
| State Government Employees | 16 | 1.8% |
| Federal Government Employees | 146 | 16.9% |
| Unpaid Family Workers | 0 | 0.0% |
| Total | 864 | 100.0% |
Employment Status by Age in Chevy Chase Village
According to the labor force statistics for Chevy Chase Village, out of the total population over 16 years of age (1,501), 59.6% or 895 individuals are in the labor force, with 2.5% or 22 of them unemployed. The age group with the highest labor force participation rate is 30 to 34 years, with 92.9% or 26 individuals in the labor force. Within the labor force, the 25 to 29 years age range has the highest percentage of unemployed individuals, with 30.4% or 7 of them being unemployed.
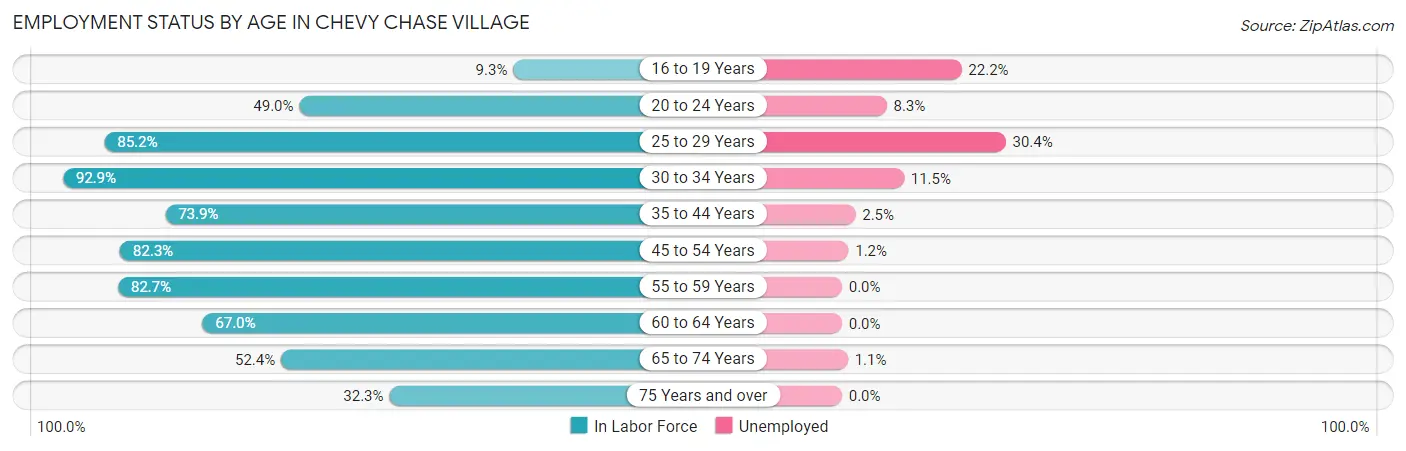
| Age Bracket | In Labor Force | Unemployed |
| 16 to 19 Years | 9 (9.3%) | 2 (22.2%) |
| 20 to 24 Years | 24 (49.0%) | 2 (8.3%) |
| 25 to 29 Years | 23 (85.2%) | 7 (30.4%) |
| 30 to 34 Years | 26 (92.9%) | 3 (11.5%) |
| 35 to 44 Years | 122 (73.9%) | 3 (2.5%) |
| 45 to 54 Years | 256 (82.3%) | 3 (1.2%) |
| 55 to 59 Years | 105 (82.7%) | 0 (0.0%) |
| 60 to 64 Years | 67 (67.0%) | 0 (0.0%) |
| 65 to 74 Years | 183 (52.4%) | 2 (1.1%) |
| 75 Years and over | 80 (32.3%) | 0 (0.0%) |
| Total | 895 (59.6%) | 22 (2.5%) |
Employment Status by Educational Attainment in Chevy Chase Village
According to labor force statistics for Chevy Chase Village, 79.0% of individuals (599) out of the total population between 25 and 64 years of age (758) are in the labor force, with 2.7% or 16 of them being unemployed. The group with the highest labor force participation rate are those with the educational attainment of college / associate degree, with 100.0% or 17 individuals in the labor force. Within the labor force, individuals with bachelor's degree or higher education have the highest percentage of unemployment, with 2.8% or 16 of them being unemployed.
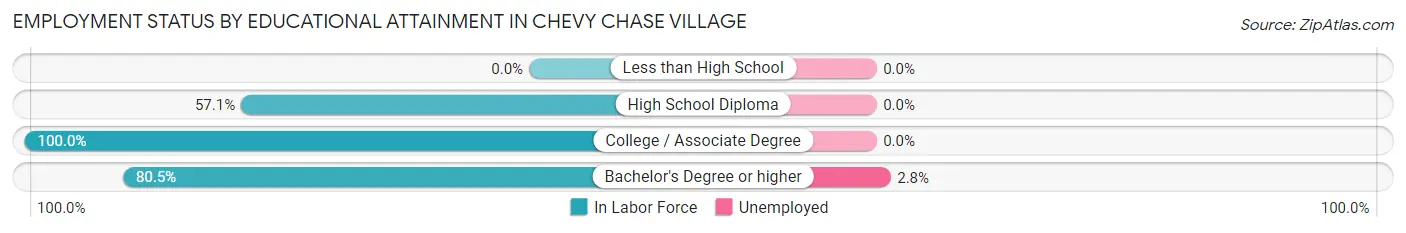
| Educational Attainment | In Labor Force | Unemployed |
| Less than High School | 0 (0.0%) | 0 (0.0%) |
| High School Diploma | 4 (57.1%) | 0 (0.0%) |
| College / Associate Degree | 17 (100.0%) | 0 (0.0%) |
| Bachelor's Degree or higher | 578 (80.5%) | 20 (2.8%) |
| Total | 599 (79.0%) | 20 (2.7%) |
Employment Occupations by Sex in Chevy Chase Village
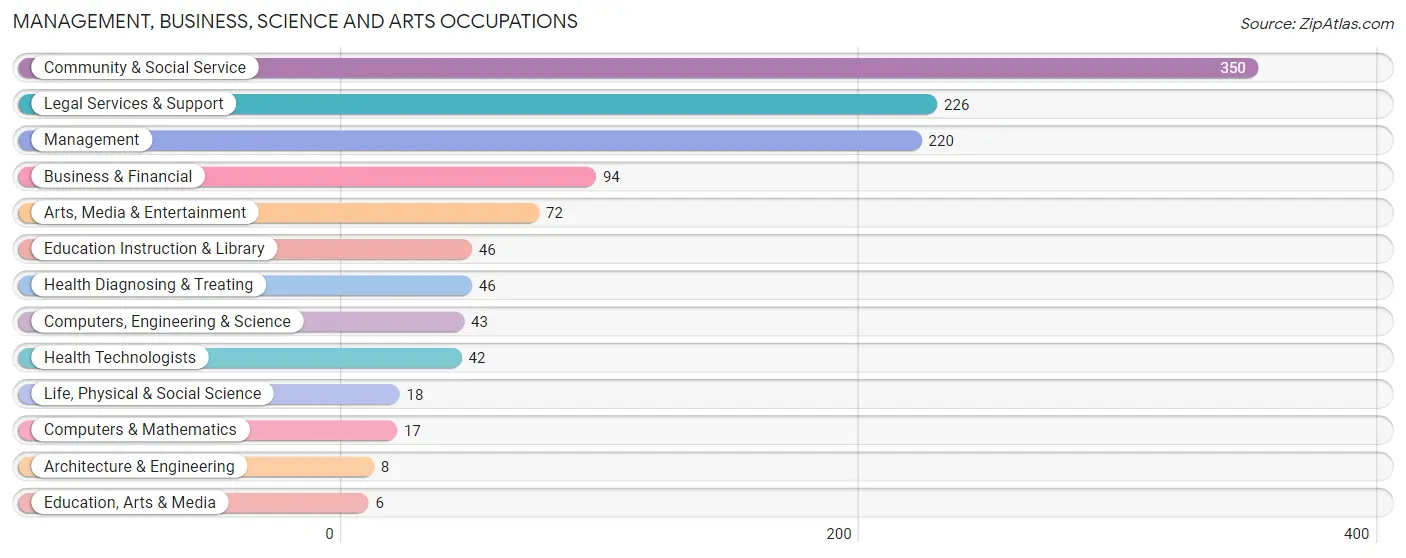
Management, Business, Science and Arts Occupations
The most common Management, Business, Science and Arts occupations in Chevy Chase Village are Community & Social Service (350 | 40.1%), Legal Services & Support (226 | 25.9%), Management (220 | 25.2%), Business & Financial (94 | 10.8%), and Arts, Media & Entertainment (72 | 8.3%).
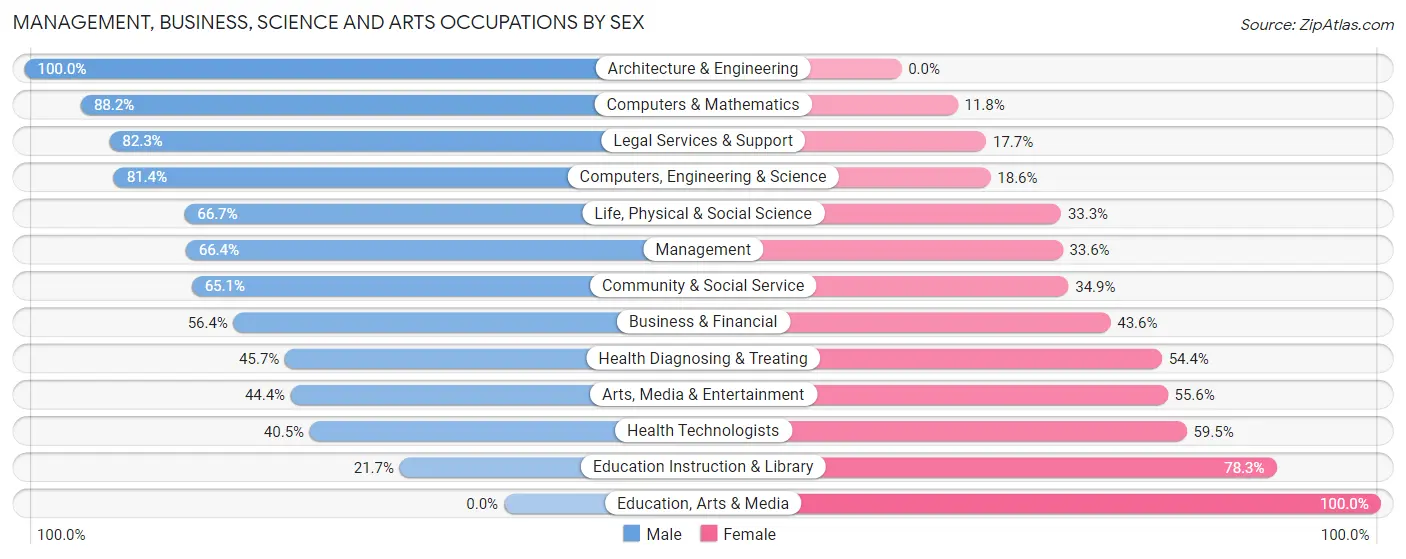
Management, Business, Science and Arts Occupations by Sex
Within the Management, Business, Science and Arts occupations in Chevy Chase Village, the most male-oriented occupations are Architecture & Engineering (100.0%), Computers & Mathematics (88.2%), and Legal Services & Support (82.3%), while the most female-oriented occupations are Education, Arts & Media (100.0%), Education Instruction & Library (78.3%), and Health Technologists (59.5%).
| Occupation | Male | Female |
| Management | 146 (66.4%) | 74 (33.6%) |
| Business & Financial | 53 (56.4%) | 41 (43.6%) |
| Computers, Engineering & Science | 35 (81.4%) | 8 (18.6%) |
| Computers & Mathematics | 15 (88.2%) | 2 (11.8%) |
| Architecture & Engineering | 8 (100.0%) | 0 (0.0%) |
| Life, Physical & Social Science | 12 (66.7%) | 6 (33.3%) |
| Community & Social Service | 228 (65.1%) | 122 (34.9%) |
| Education, Arts & Media | 0 (0.0%) | 6 (100.0%) |
| Legal Services & Support | 186 (82.3%) | 40 (17.7%) |
| Education Instruction & Library | 10 (21.7%) | 36 (78.3%) |
| Arts, Media & Entertainment | 32 (44.4%) | 40 (55.6%) |
| Health Diagnosing & Treating | 21 (45.7%) | 25 (54.3%) |
| Health Technologists | 17 (40.5%) | 25 (59.5%) |
| Total (Category) | 483 (64.1%) | 270 (35.9%) |
| Total (Overall) | 535 (61.3%) | 338 (38.7%) |
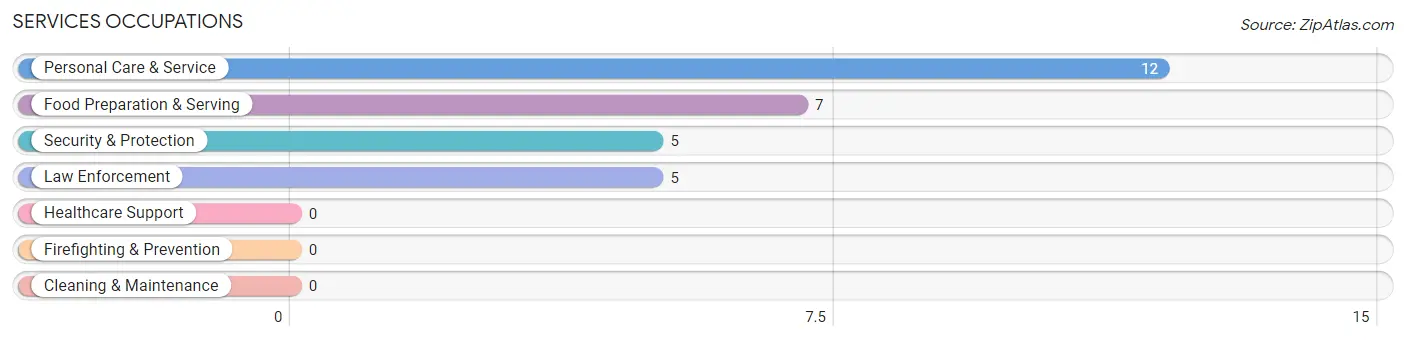
Services Occupations
The most common Services occupations in Chevy Chase Village are Personal Care & Service (12 | 1.4%), Food Preparation & Serving (7 | 0.8%), Security & Protection (5 | 0.6%), and Law Enforcement (5 | 0.6%).
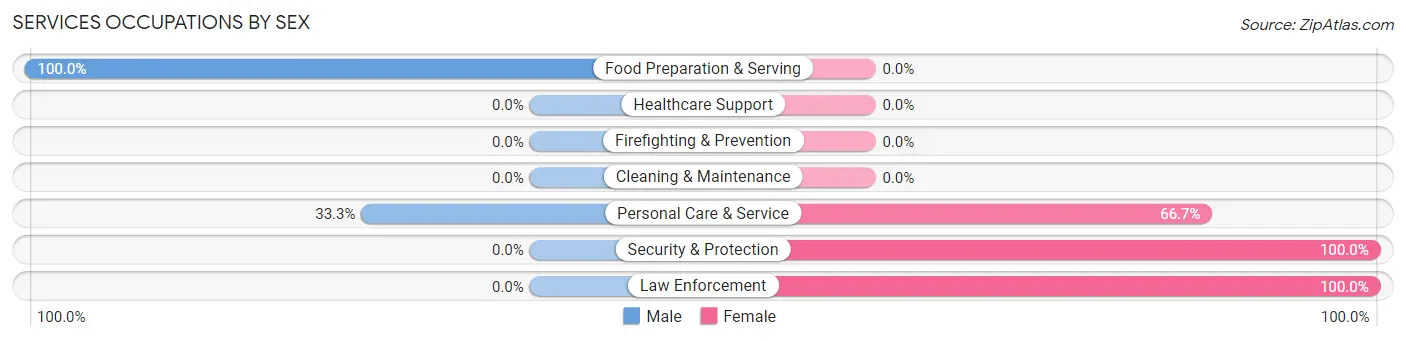
Services Occupations by Sex
Within the Services occupations in Chevy Chase Village, the most male-oriented occupations are Food Preparation & Serving (100.0%), and Personal Care & Service (33.3%), while the most female-oriented occupations are Security & Protection (100.0%), Law Enforcement (100.0%), and Personal Care & Service (66.7%).
| Occupation | Male | Female |
| Healthcare Support | 0 (0.0%) | 0 (0.0%) |
| Security & Protection | 0 (0.0%) | 5 (100.0%) |
| Firefighting & Prevention | 0 (0.0%) | 0 (0.0%) |
| Law Enforcement | 0 (0.0%) | 5 (100.0%) |
| Food Preparation & Serving | 7 (100.0%) | 0 (0.0%) |
| Cleaning & Maintenance | 0 (0.0%) | 0 (0.0%) |
| Personal Care & Service | 4 (33.3%) | 8 (66.7%) |
| Total (Category) | 11 (45.8%) | 13 (54.2%) |
| Total (Overall) | 535 (61.3%) | 338 (38.7%) |
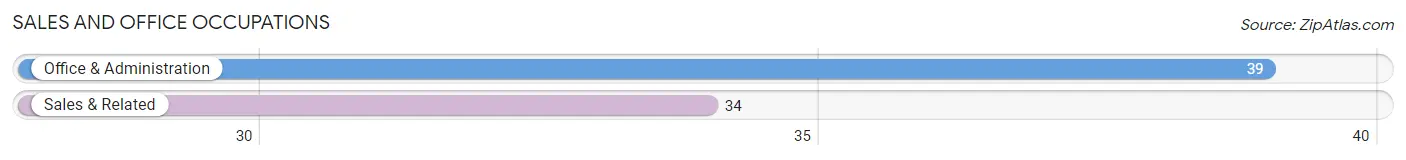
Sales and Office Occupations
The most common Sales and Office occupations in Chevy Chase Village are Office & Administration (39 | 4.5%), and Sales & Related (34 | 3.9%).
Sales and Office Occupations by Sex
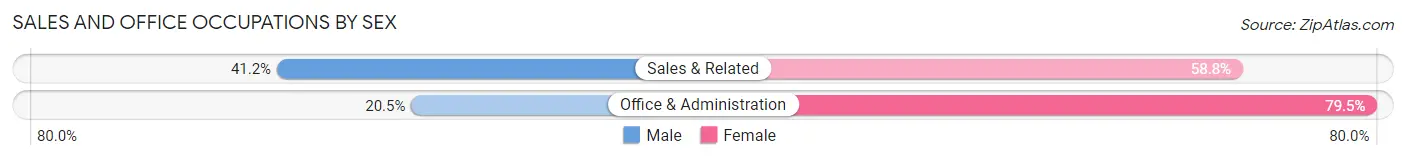
| Occupation | Male | Female |
| Sales & Related | 14 (41.2%) | 20 (58.8%) |
| Office & Administration | 8 (20.5%) | 31 (79.5%) |
| Total (Category) | 22 (30.1%) | 51 (69.9%) |
| Total (Overall) | 535 (61.3%) | 338 (38.7%) |
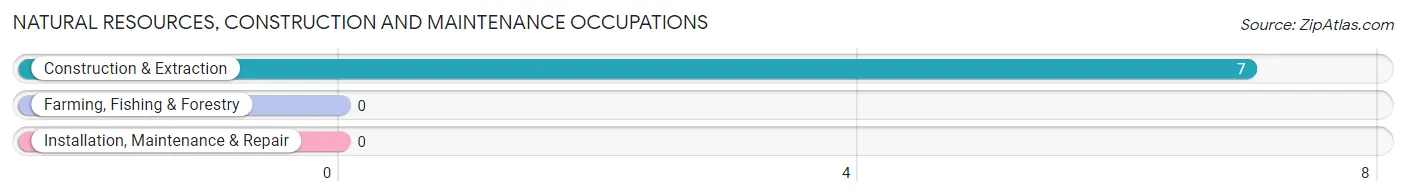
Natural Resources, Construction and Maintenance Occupations
The most common Natural Resources, Construction and Maintenance occupations in Chevy Chase Village are , and Construction & Extraction (7 | 0.8%).
Natural Resources, Construction and Maintenance Occupations by Sex
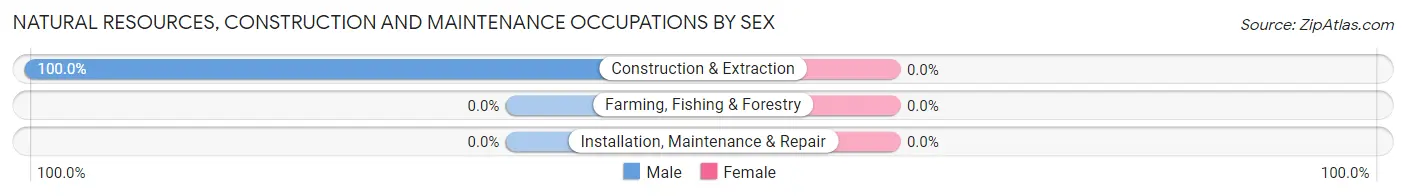
| Occupation | Male | Female |
| Farming, Fishing & Forestry | 0 (0.0%) | 0 (0.0%) |
| Construction & Extraction | 7 (100.0%) | 0 (0.0%) |
| Installation, Maintenance & Repair | 0 (0.0%) | 0 (0.0%) |
| Total (Category) | 7 (100.0%) | 0 (0.0%) |
| Total (Overall) | 535 (61.3%) | 338 (38.7%) |
Production, Transportation and Moving Occupations
The most common Production, Transportation and Moving occupations in Chevy Chase Village are Transportation (12 | 1.4%), and Material Moving (4 | 0.5%).
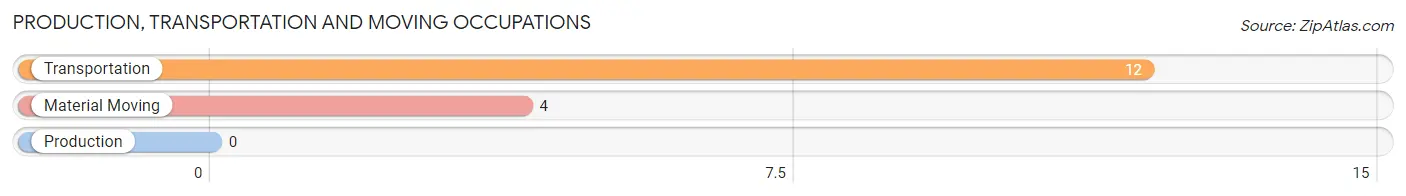
Production, Transportation and Moving Occupations by Sex
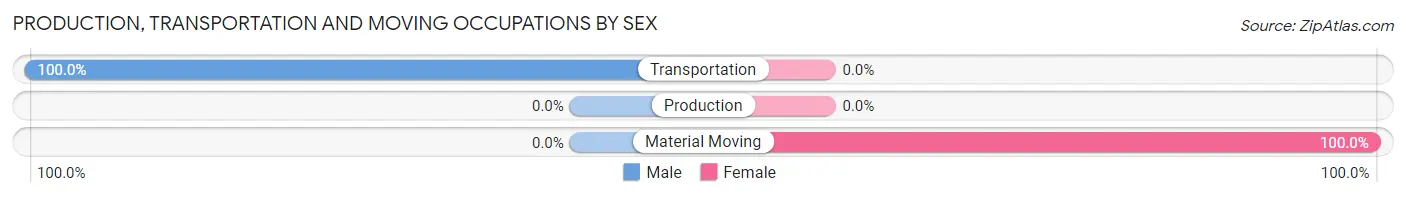
| Occupation | Male | Female |
| Production | 0 (0.0%) | 0 (0.0%) |
| Transportation | 12 (100.0%) | 0 (0.0%) |
| Material Moving | 0 (0.0%) | 4 (100.0%) |
| Total (Category) | 12 (75.0%) | 4 (25.0%) |
| Total (Overall) | 535 (61.3%) | 338 (38.7%) |
Employment Industries by Sex in Chevy Chase Village
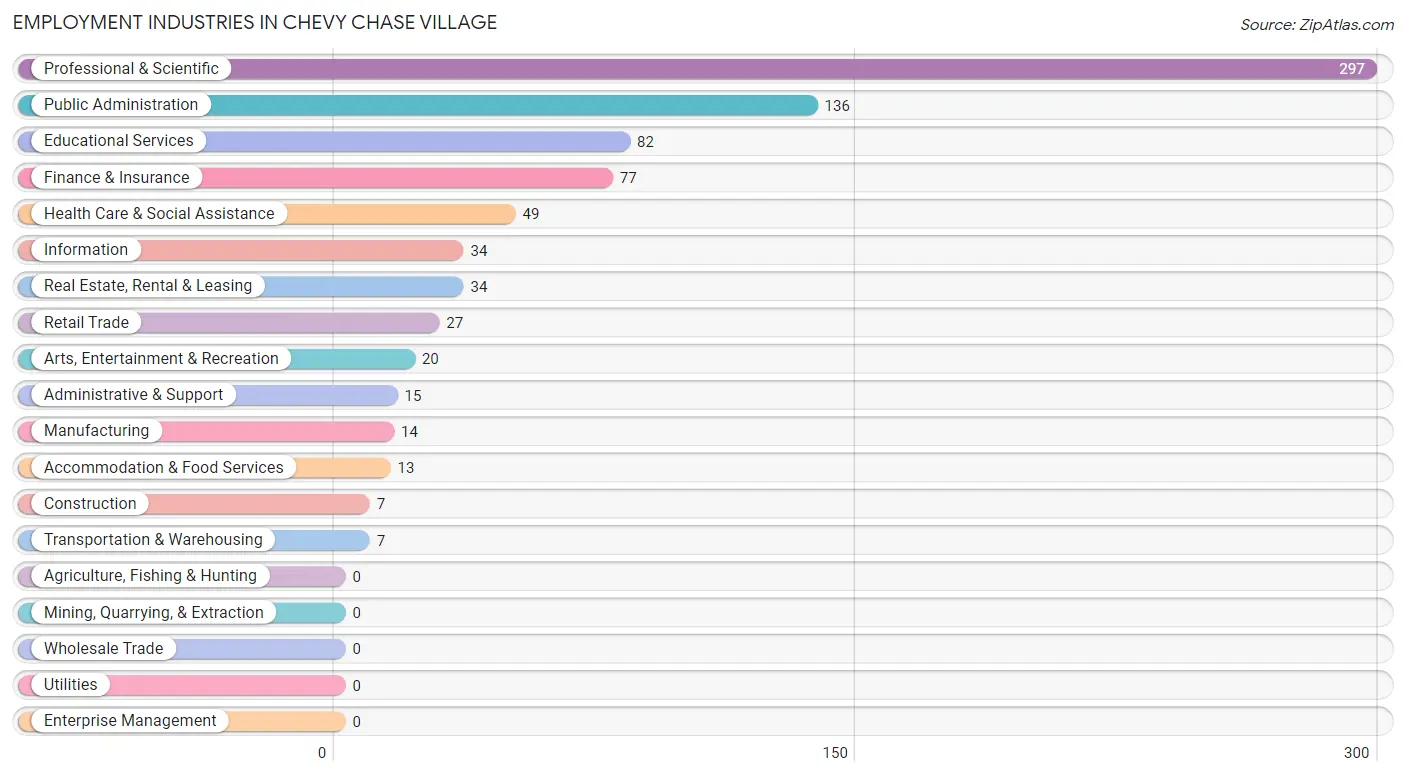
Employment Industries in Chevy Chase Village
The major employment industries in Chevy Chase Village include Professional & Scientific (297 | 34.0%), Public Administration (136 | 15.6%), Educational Services (82 | 9.4%), Finance & Insurance (77 | 8.8%), and Health Care & Social Assistance (49 | 5.6%).
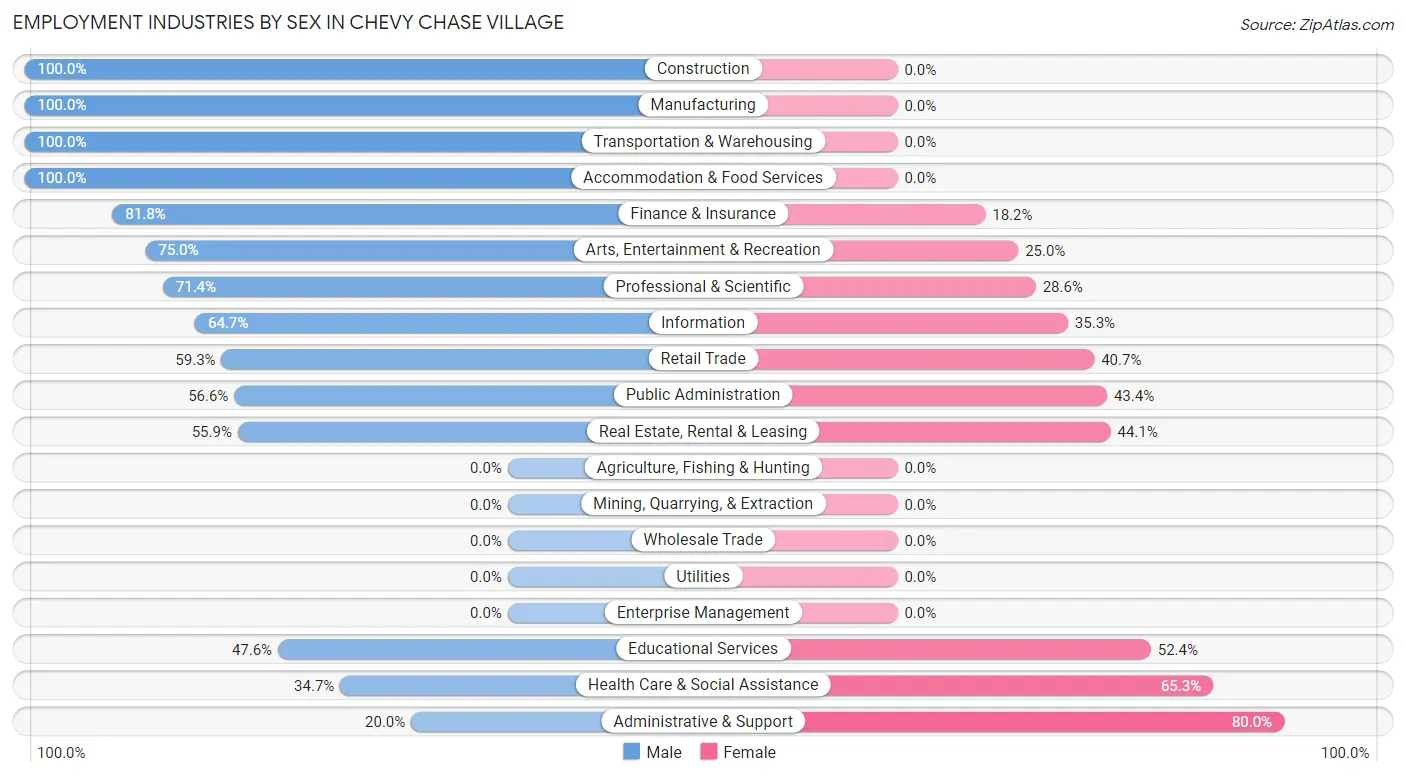
Employment Industries by Sex in Chevy Chase Village
The Chevy Chase Village industries that see more men than women are Construction (100.0%), Manufacturing (100.0%), and Transportation & Warehousing (100.0%), whereas the industries that tend to have a higher number of women are Administrative & Support (80.0%), Health Care & Social Assistance (65.3%), and Educational Services (52.4%).
| Industry | Male | Female |
| Agriculture, Fishing & Hunting | 0 (0.0%) | 0 (0.0%) |
| Mining, Quarrying, & Extraction | 0 (0.0%) | 0 (0.0%) |
| Construction | 7 (100.0%) | 0 (0.0%) |
| Manufacturing | 14 (100.0%) | 0 (0.0%) |
| Wholesale Trade | 0 (0.0%) | 0 (0.0%) |
| Retail Trade | 16 (59.3%) | 11 (40.7%) |
| Transportation & Warehousing | 7 (100.0%) | 0 (0.0%) |
| Utilities | 0 (0.0%) | 0 (0.0%) |
| Information | 22 (64.7%) | 12 (35.3%) |
| Finance & Insurance | 63 (81.8%) | 14 (18.2%) |
| Real Estate, Rental & Leasing | 19 (55.9%) | 15 (44.1%) |
| Professional & Scientific | 212 (71.4%) | 85 (28.6%) |
| Enterprise Management | 0 (0.0%) | 0 (0.0%) |
| Administrative & Support | 3 (20.0%) | 12 (80.0%) |
| Educational Services | 39 (47.6%) | 43 (52.4%) |
| Health Care & Social Assistance | 17 (34.7%) | 32 (65.3%) |
| Arts, Entertainment & Recreation | 15 (75.0%) | 5 (25.0%) |
| Accommodation & Food Services | 13 (100.0%) | 0 (0.0%) |
| Public Administration | 77 (56.6%) | 59 (43.4%) |
| Total | 535 (61.3%) | 338 (38.7%) |
Education in Chevy Chase Village
School Enrollment in Chevy Chase Village
The most common levels of schooling among the 467 students in Chevy Chase Village are high school (159 | 34.1%), middle school (107 | 22.9%), and elementary school (83 | 17.8%).
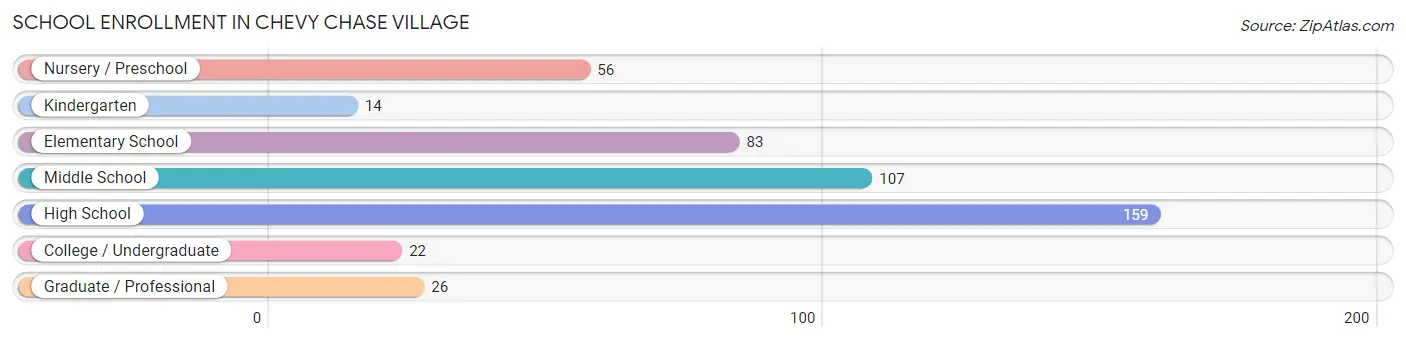
| School Level | # Students | % Students |
| Nursery / Preschool | 56 | 12.0% |
| Kindergarten | 14 | 3.0% |
| Elementary School | 83 | 17.8% |
| Middle School | 107 | 22.9% |
| High School | 159 | 34.1% |
| College / Undergraduate | 22 | 4.7% |
| Graduate / Professional | 26 | 5.6% |
| Total | 467 | 100.0% |
School Enrollment by Age by Funding Source in Chevy Chase Village
Out of a total of 467 students who are enrolled in schools in Chevy Chase Village, 326 (69.8%) attend a private institution, while the remaining 141 (30.2%) are enrolled in public schools. The age group of 3 to 4 year olds has the highest likelihood of being enrolled in private schools, with 45 (100.0% in the age bracket) enrolled. Conversely, the age group of 25 to 34 year olds has the lowest likelihood of being enrolled in a private school, with 11 (100.0% in the age bracket) attending a public institution.
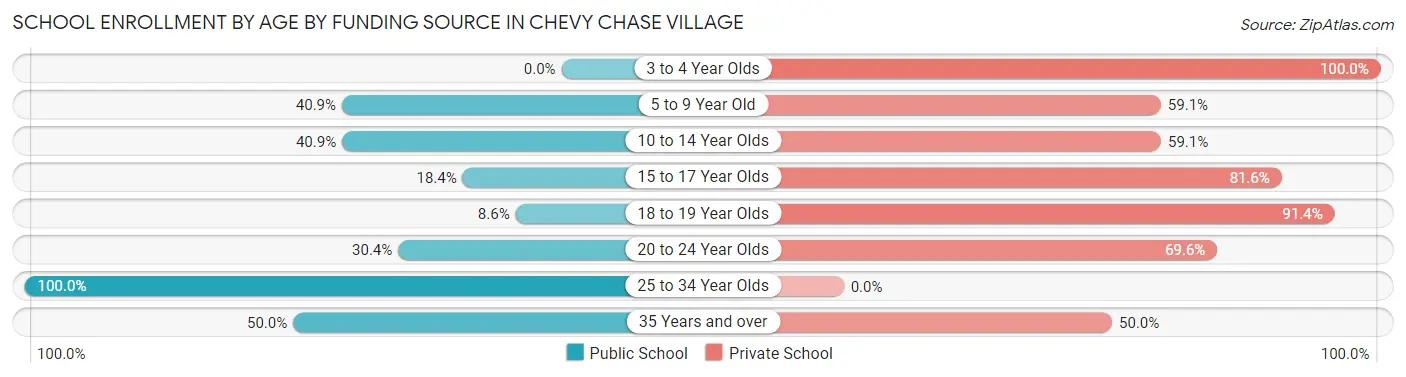
| Age Bracket | Public School | Private School |
| 3 to 4 Year Olds | 0 (0.0%) | 45 (100.0%) |
| 5 to 9 Year Old | 36 (40.9%) | 52 (59.1%) |
| 10 to 14 Year Olds | 56 (40.9%) | 81 (59.1%) |
| 15 to 17 Year Olds | 21 (18.4%) | 93 (81.6%) |
| 18 to 19 Year Olds | 3 (8.6%) | 32 (91.4%) |
| 20 to 24 Year Olds | 7 (30.4%) | 16 (69.6%) |
| 25 to 34 Year Olds | 11 (100.0%) | 0 (0.0%) |
| 35 Years and over | 7 (50.0%) | 7 (50.0%) |
| Total | 141 (30.2%) | 326 (69.8%) |
Educational Attainment by Field of Study in Chevy Chase Village
Social sciences (414 | 28.5%), liberal arts & history (212 | 14.6%), literature & languages (204 | 14.0%), business (170 | 11.7%), and visual & performing arts (65 | 4.5%) are the most common fields of study among 1,453 individuals in Chevy Chase Village who have obtained a bachelor's degree or higher.
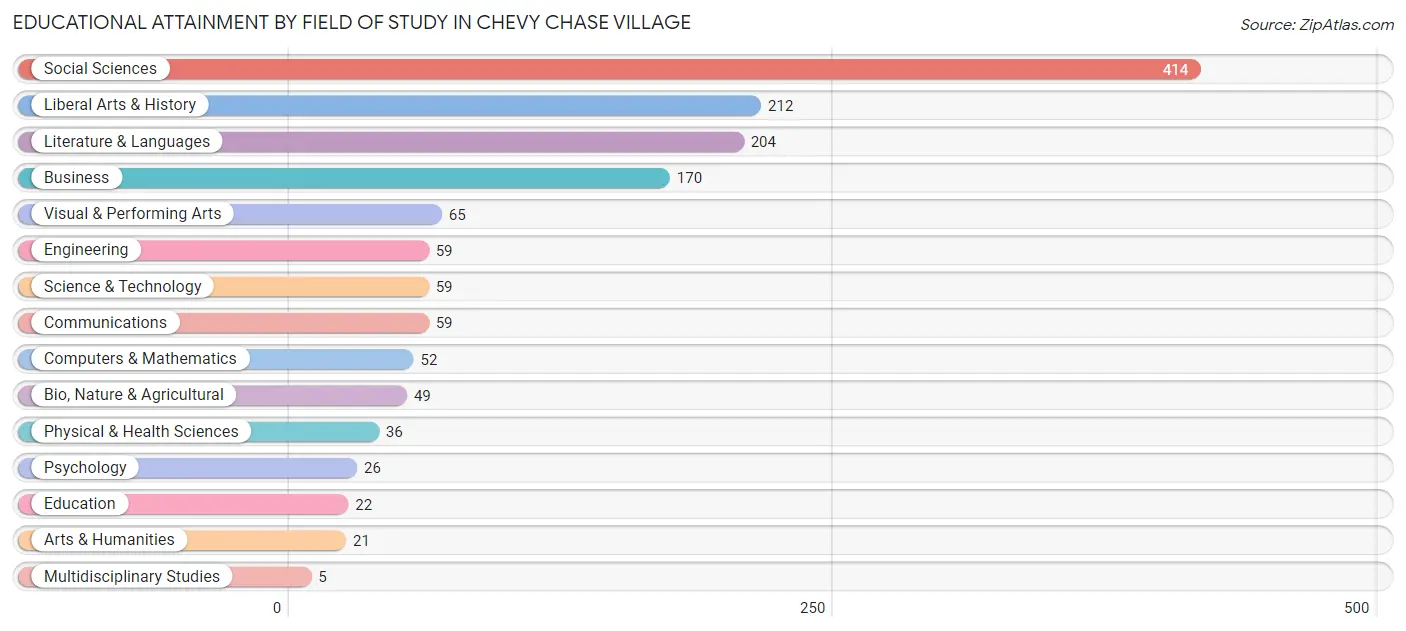
| Field of Study | # Graduates | % Graduates |
| Computers & Mathematics | 52 | 3.6% |
| Bio, Nature & Agricultural | 49 | 3.4% |
| Physical & Health Sciences | 36 | 2.5% |
| Psychology | 26 | 1.8% |
| Social Sciences | 414 | 28.5% |
| Engineering | 59 | 4.1% |
| Multidisciplinary Studies | 5 | 0.3% |
| Science & Technology | 59 | 4.1% |
| Business | 170 | 11.7% |
| Education | 22 | 1.5% |
| Literature & Languages | 204 | 14.0% |
| Liberal Arts & History | 212 | 14.6% |
| Visual & Performing Arts | 65 | 4.5% |
| Communications | 59 | 4.1% |
| Arts & Humanities | 21 | 1.5% |
| Total | 1,453 | 100.0% |
Transportation & Commute in Chevy Chase Village
Vehicle Availability by Sex in Chevy Chase Village
The most prevalent vehicle ownership categories in Chevy Chase Village are males with 2 vehicles (274, accounting for 51.7%) and females with 2 vehicles (155, making up 82.0%).
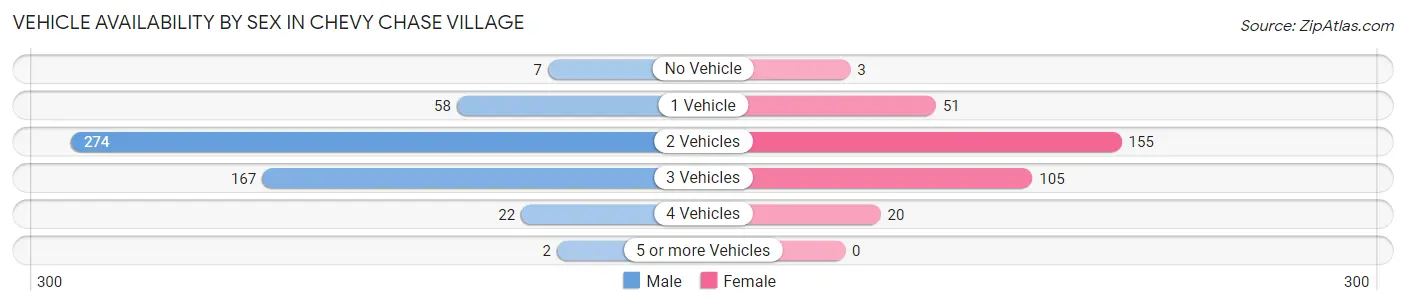
| Vehicles Available | Male | Female |
| No Vehicle | 7 (1.3%) | 3 (0.9%) |
| 1 Vehicle | 58 (10.9%) | 51 (15.3%) |
| 2 Vehicles | 274 (51.7%) | 155 (46.4%) |
| 3 Vehicles | 167 (31.5%) | 105 (31.4%) |
| 4 Vehicles | 22 (4.2%) | 20 (6.0%) |
| 5 or more Vehicles | 2 (0.4%) | 0 (0.0%) |
| Total | 530 (100.0%) | 334 (100.0%) |
Commute Time in Chevy Chase Village
The most frequently occuring commute durations in Chevy Chase Village are 30 to 34 minutes (140 commuters, 23.0%), 20 to 24 minutes (88 commuters, 14.5%), and 45 to 59 minutes (86 commuters, 14.1%).
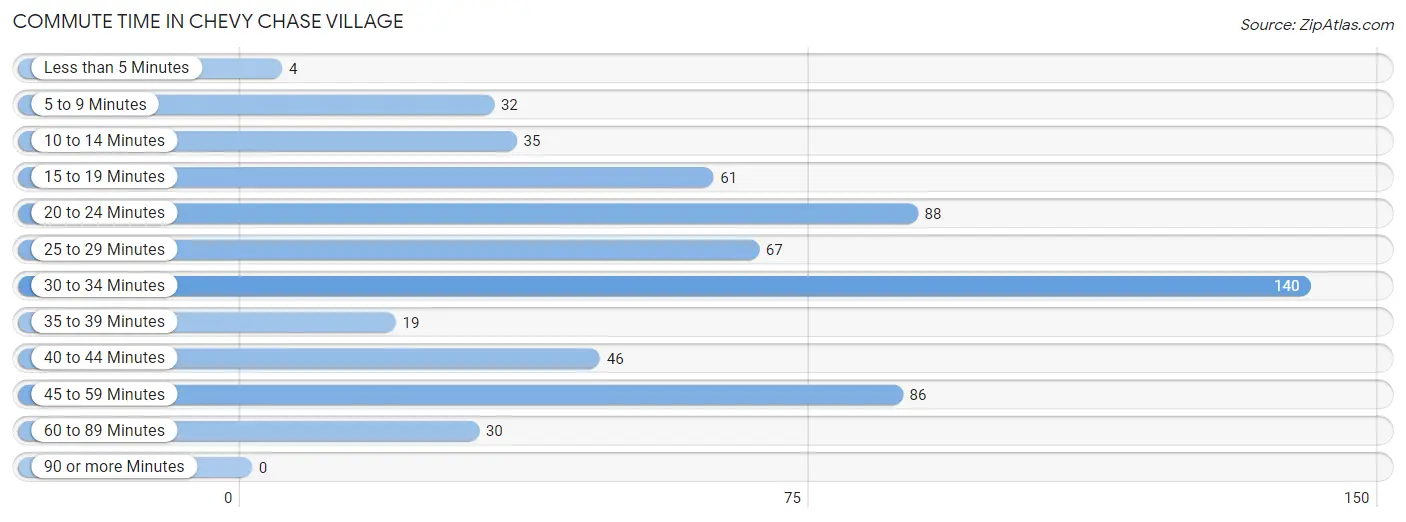
| Commute Time | # Commuters | % Commuters |
| Less than 5 Minutes | 4 | 0.7% |
| 5 to 9 Minutes | 32 | 5.3% |
| 10 to 14 Minutes | 35 | 5.8% |
| 15 to 19 Minutes | 61 | 10.0% |
| 20 to 24 Minutes | 88 | 14.5% |
| 25 to 29 Minutes | 67 | 11.0% |
| 30 to 34 Minutes | 140 | 23.0% |
| 35 to 39 Minutes | 19 | 3.1% |
| 40 to 44 Minutes | 46 | 7.6% |
| 45 to 59 Minutes | 86 | 14.1% |
| 60 to 89 Minutes | 30 | 4.9% |
| 90 or more Minutes | 0 | 0.0% |
Commute Time by Sex in Chevy Chase Village
The most common commute times in Chevy Chase Village are 30 to 34 minutes (95 commuters, 24.0%) for males and 30 to 34 minutes (45 commuters, 21.1%) for females.
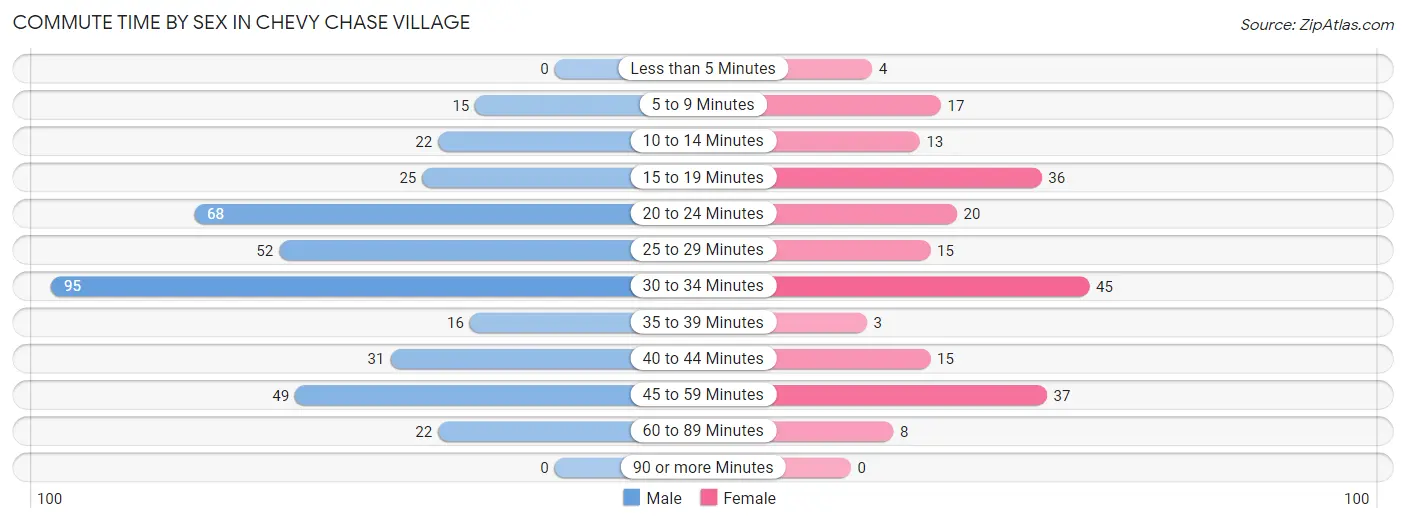
| Commute Time | Male | Female |
| Less than 5 Minutes | 0 (0.0%) | 4 (1.9%) |
| 5 to 9 Minutes | 15 (3.8%) | 17 (8.0%) |
| 10 to 14 Minutes | 22 (5.6%) | 13 (6.1%) |
| 15 to 19 Minutes | 25 (6.3%) | 36 (16.9%) |
| 20 to 24 Minutes | 68 (17.2%) | 20 (9.4%) |
| 25 to 29 Minutes | 52 (13.2%) | 15 (7.0%) |
| 30 to 34 Minutes | 95 (24.0%) | 45 (21.1%) |
| 35 to 39 Minutes | 16 (4.1%) | 3 (1.4%) |
| 40 to 44 Minutes | 31 (7.9%) | 15 (7.0%) |
| 45 to 59 Minutes | 49 (12.4%) | 37 (17.4%) |
| 60 to 89 Minutes | 22 (5.6%) | 8 (3.8%) |
| 90 or more Minutes | 0 (0.0%) | 0 (0.0%) |
Time of Departure to Work by Sex in Chevy Chase Village
The most frequent times of departure to work in Chevy Chase Village are 8:00 AM to 8:29 AM (108, 27.3%) for males and 7:30 AM to 7:59 AM (63, 29.6%) for females.
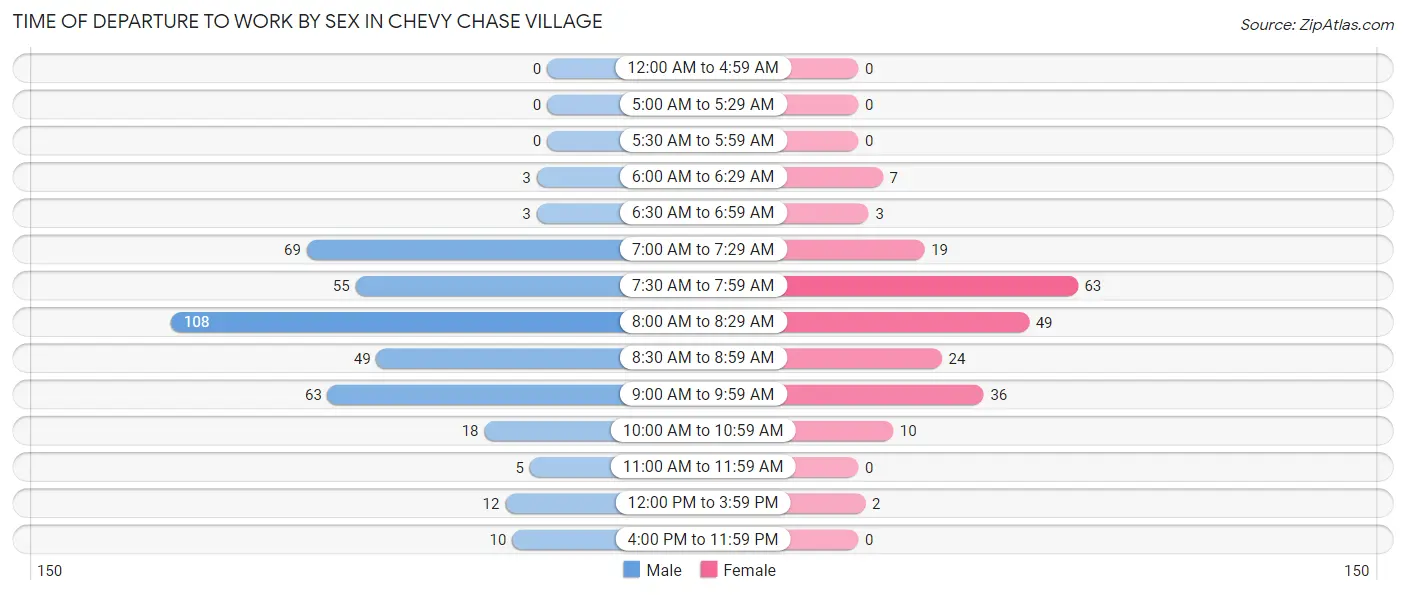
| Time of Departure | Male | Female |
| 12:00 AM to 4:59 AM | 0 (0.0%) | 0 (0.0%) |
| 5:00 AM to 5:29 AM | 0 (0.0%) | 0 (0.0%) |
| 5:30 AM to 5:59 AM | 0 (0.0%) | 0 (0.0%) |
| 6:00 AM to 6:29 AM | 3 (0.8%) | 7 (3.3%) |
| 6:30 AM to 6:59 AM | 3 (0.8%) | 3 (1.4%) |
| 7:00 AM to 7:29 AM | 69 (17.5%) | 19 (8.9%) |
| 7:30 AM to 7:59 AM | 55 (13.9%) | 63 (29.6%) |
| 8:00 AM to 8:29 AM | 108 (27.3%) | 49 (23.0%) |
| 8:30 AM to 8:59 AM | 49 (12.4%) | 24 (11.3%) |
| 9:00 AM to 9:59 AM | 63 (16.0%) | 36 (16.9%) |
| 10:00 AM to 10:59 AM | 18 (4.6%) | 10 (4.7%) |
| 11:00 AM to 11:59 AM | 5 (1.3%) | 0 (0.0%) |
| 12:00 PM to 3:59 PM | 12 (3.0%) | 2 (0.9%) |
| 4:00 PM to 11:59 PM | 10 (2.5%) | 0 (0.0%) |
| Total | 395 (100.0%) | 213 (100.0%) |
Housing Occupancy in Chevy Chase Village
Occupancy by Ownership in Chevy Chase Village
Of the total 682 dwellings in Chevy Chase Village, owner-occupied units account for 663 (97.2%), while renter-occupied units make up 19 (2.8%).
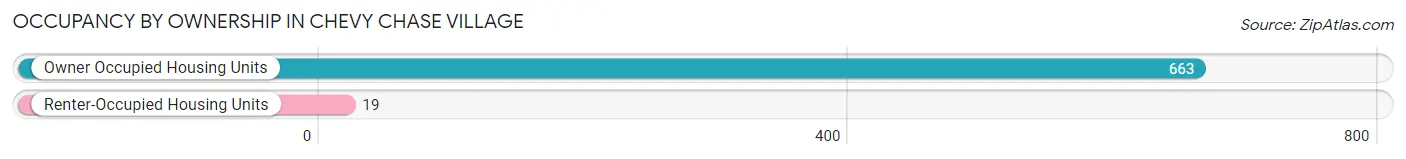
| Occupancy | # Housing Units | % Housing Units |
| Owner Occupied Housing Units | 663 | 97.2% |
| Renter-Occupied Housing Units | 19 | 2.8% |
| Total Occupied Housing Units | 682 | 100.0% |
Occupancy by Household Size in Chevy Chase Village
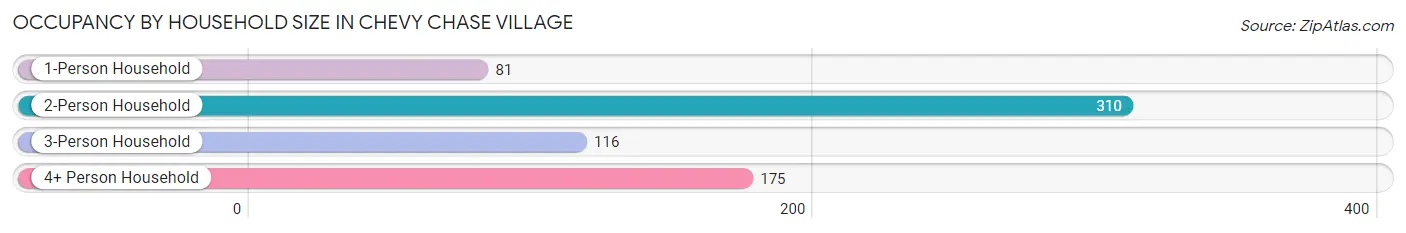
| Household Size | # Housing Units | % Housing Units |
| 1-Person Household | 81 | 11.9% |
| 2-Person Household | 310 | 45.5% |
| 3-Person Household | 116 | 17.0% |
| 4+ Person Household | 175 | 25.7% |
| Total Housing Units | 682 | 100.0% |
Occupancy by Ownership by Household Size in Chevy Chase Village
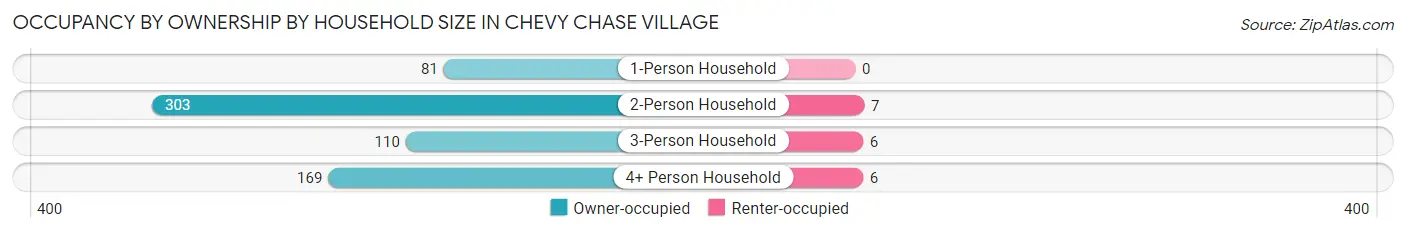
| Household Size | Owner-occupied | Renter-occupied |
| 1-Person Household | 81 (100.0%) | 0 (0.0%) |
| 2-Person Household | 303 (97.7%) | 7 (2.3%) |
| 3-Person Household | 110 (94.8%) | 6 (5.2%) |
| 4+ Person Household | 169 (96.6%) | 6 (3.4%) |
| Total Housing Units | 663 (97.2%) | 19 (2.8%) |
Occupancy by Educational Attainment in Chevy Chase Village
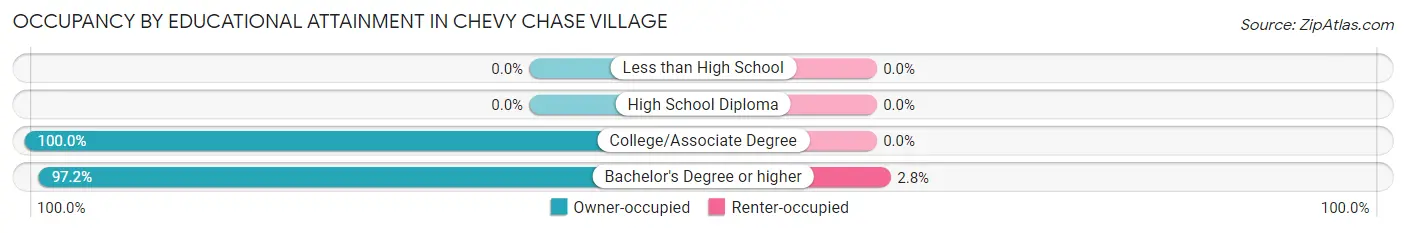
| Household Size | Owner-occupied | Renter-occupied |
| Less than High School | 0 (0.0%) | 0 (0.0%) |
| High School Diploma | 0 (0.0%) | 0 (0.0%) |
| College/Associate Degree | 5 (100.0%) | 0 (0.0%) |
| Bachelor's Degree or higher | 658 (97.2%) | 19 (2.8%) |
Occupancy by Age of Householder in Chevy Chase Village
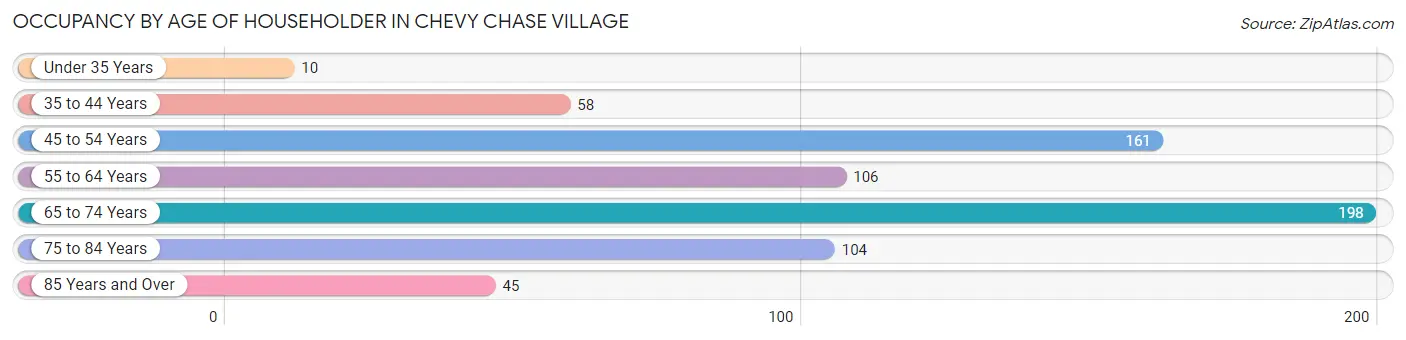
| Age Bracket | # Households | % Households |
| Under 35 Years | 10 | 1.5% |
| 35 to 44 Years | 58 | 8.5% |
| 45 to 54 Years | 161 | 23.6% |
| 55 to 64 Years | 106 | 15.5% |
| 65 to 74 Years | 198 | 29.0% |
| 75 to 84 Years | 104 | 15.2% |
| 85 Years and Over | 45 | 6.6% |
| Total | 682 | 100.0% |
Housing Finances in Chevy Chase Village
Median Income by Occupancy in Chevy Chase Village
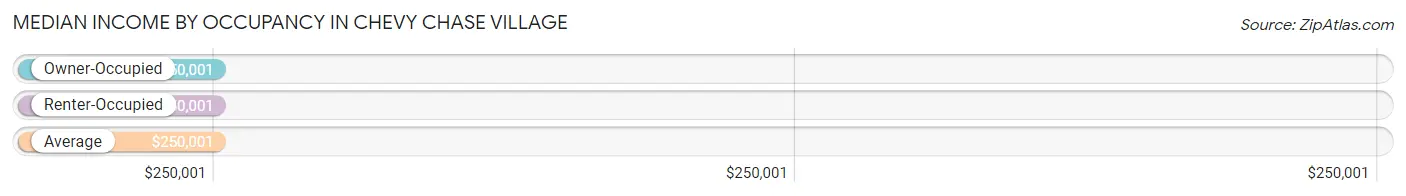
| Occupancy Type | # Households | Median Income |
| Owner-Occupied | 663 (97.2%) | $250,001 |
| Renter-Occupied | 19 (2.8%) | $250,001 |
| Average | 682 (100.0%) | $250,001 |
Occupancy by Householder Income Bracket in Chevy Chase Village
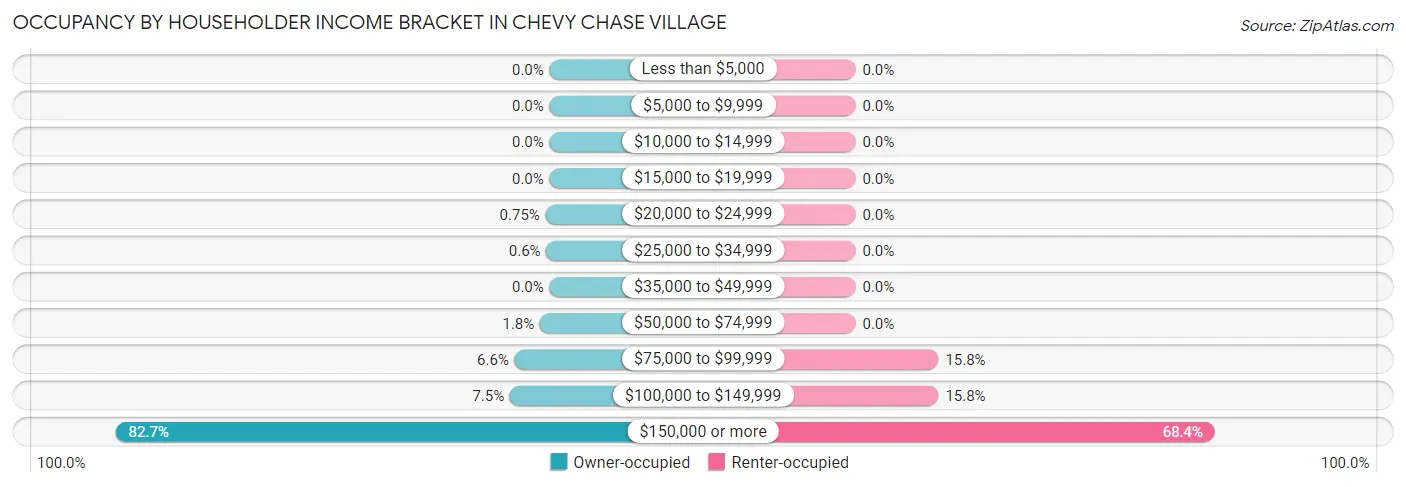
| Income Bracket | Owner-occupied | Renter-occupied |
| Less than $5,000 | 0 (0.0%) | 0 (0.0%) |
| $5,000 to $9,999 | 0 (0.0%) | 0 (0.0%) |
| $10,000 to $14,999 | 0 (0.0%) | 0 (0.0%) |
| $15,000 to $19,999 | 0 (0.0%) | 0 (0.0%) |
| $20,000 to $24,999 | 5 (0.7%) | 0 (0.0%) |
| $25,000 to $34,999 | 4 (0.6%) | 0 (0.0%) |
| $35,000 to $49,999 | 0 (0.0%) | 0 (0.0%) |
| $50,000 to $74,999 | 12 (1.8%) | 0 (0.0%) |
| $75,000 to $99,999 | 44 (6.6%) | 3 (15.8%) |
| $100,000 to $149,999 | 50 (7.5%) | 3 (15.8%) |
| $150,000 or more | 548 (82.7%) | 13 (68.4%) |
| Total | 663 (100.0%) | 19 (100.0%) |
Monthly Housing Cost Tiers in Chevy Chase Village
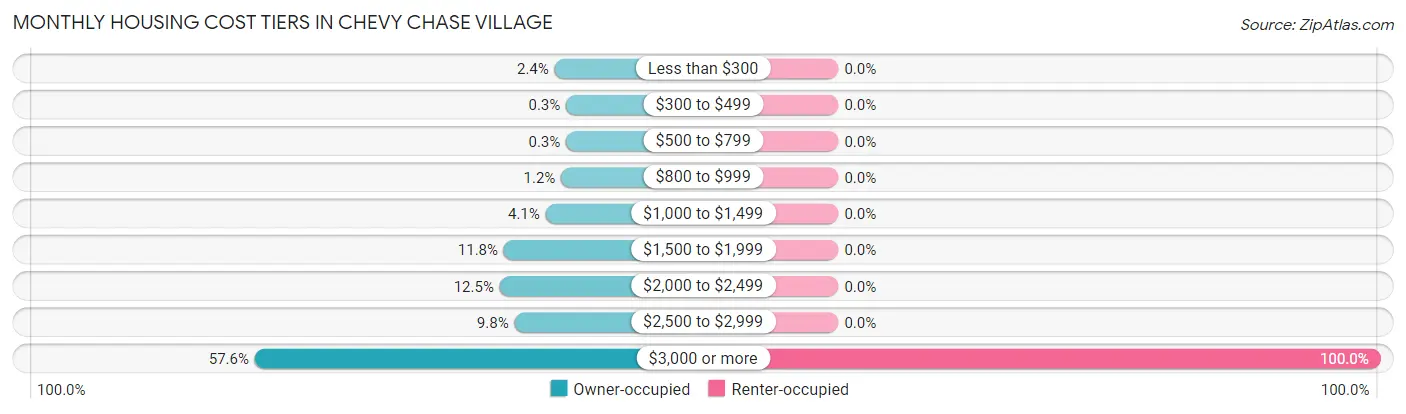
| Monthly Cost | Owner-occupied | Renter-occupied |
| Less than $300 | 16 (2.4%) | 0 (0.0%) |
| $300 to $499 | 2 (0.3%) | 0 (0.0%) |
| $500 to $799 | 2 (0.3%) | 0 (0.0%) |
| $800 to $999 | 8 (1.2%) | 0 (0.0%) |
| $1,000 to $1,499 | 27 (4.1%) | 0 (0.0%) |
| $1,500 to $1,999 | 78 (11.8%) | 0 (0.0%) |
| $2,000 to $2,499 | 83 (12.5%) | 0 (0.0%) |
| $2,500 to $2,999 | 65 (9.8%) | 0 (0.0%) |
| $3,000 or more | 382 (57.6%) | 19 (100.0%) |
| Total | 663 (100.0%) | 19 (100.0%) |
Physical Housing Characteristics in Chevy Chase Village
Housing Structures in Chevy Chase Village
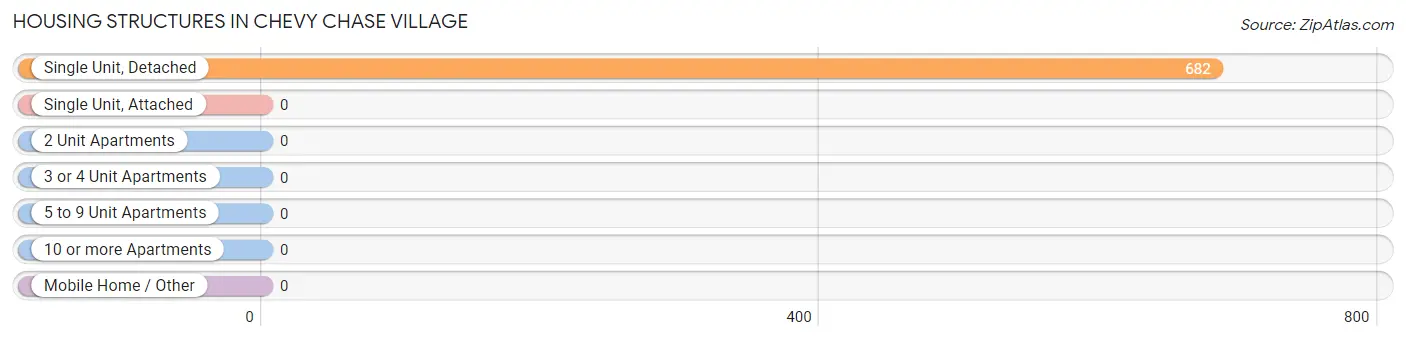
| Structure Type | # Housing Units | % Housing Units |
| Single Unit, Detached | 682 | 100.0% |
| Single Unit, Attached | 0 | 0.0% |
| 2 Unit Apartments | 0 | 0.0% |
| 3 or 4 Unit Apartments | 0 | 0.0% |
| 5 to 9 Unit Apartments | 0 | 0.0% |
| 10 or more Apartments | 0 | 0.0% |
| Mobile Home / Other | 0 | 0.0% |
| Total | 682 | 100.0% |
Housing Structures by Occupancy in Chevy Chase Village
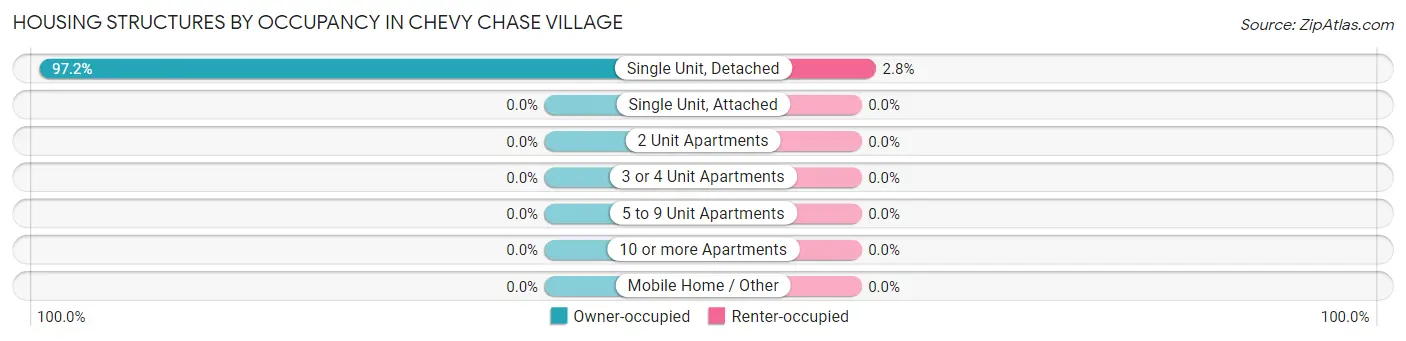
| Structure Type | Owner-occupied | Renter-occupied |
| Single Unit, Detached | 663 (97.2%) | 19 (2.8%) |
| Single Unit, Attached | 0 (0.0%) | 0 (0.0%) |
| 2 Unit Apartments | 0 (0.0%) | 0 (0.0%) |
| 3 or 4 Unit Apartments | 0 (0.0%) | 0 (0.0%) |
| 5 to 9 Unit Apartments | 0 (0.0%) | 0 (0.0%) |
| 10 or more Apartments | 0 (0.0%) | 0 (0.0%) |
| Mobile Home / Other | 0 (0.0%) | 0 (0.0%) |
| Total | 663 (97.2%) | 19 (2.8%) |
Housing Structures by Number of Rooms in Chevy Chase Village
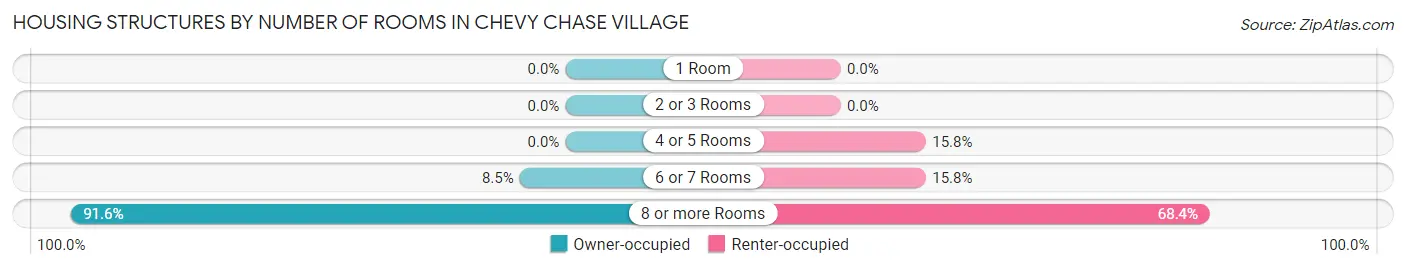
| Number of Rooms | Owner-occupied | Renter-occupied |
| 1 Room | 0 (0.0%) | 0 (0.0%) |
| 2 or 3 Rooms | 0 (0.0%) | 0 (0.0%) |
| 4 or 5 Rooms | 0 (0.0%) | 3 (15.8%) |
| 6 or 7 Rooms | 56 (8.5%) | 3 (15.8%) |
| 8 or more Rooms | 607 (91.5%) | 13 (68.4%) |
| Total | 663 (100.0%) | 19 (100.0%) |
Housing Structure by Heating Type in Chevy Chase Village
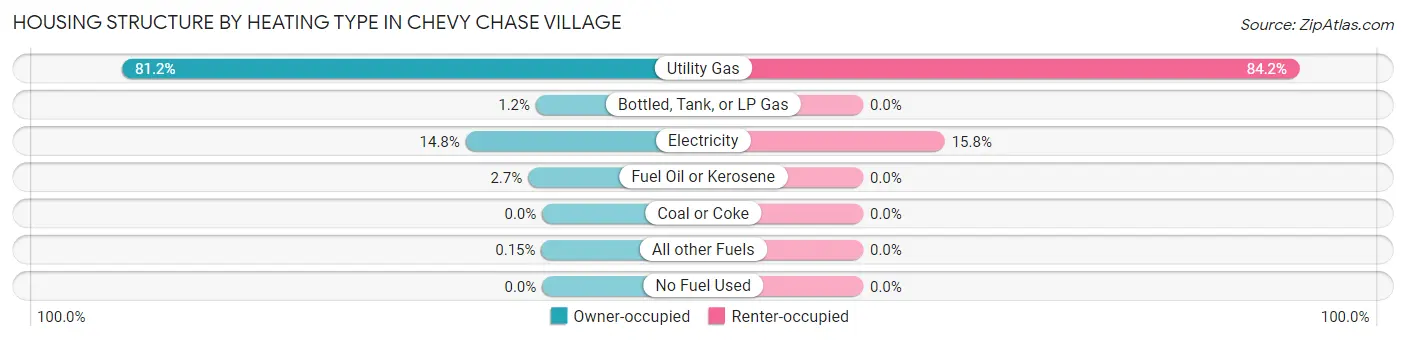
| Heating Type | Owner-occupied | Renter-occupied |
| Utility Gas | 538 (81.1%) | 16 (84.2%) |
| Bottled, Tank, or LP Gas | 8 (1.2%) | 0 (0.0%) |
| Electricity | 98 (14.8%) | 3 (15.8%) |
| Fuel Oil or Kerosene | 18 (2.7%) | 0 (0.0%) |
| Coal or Coke | 0 (0.0%) | 0 (0.0%) |
| All other Fuels | 1 (0.2%) | 0 (0.0%) |
| No Fuel Used | 0 (0.0%) | 0 (0.0%) |
| Total | 663 (100.0%) | 19 (100.0%) |
Household Vehicle Usage in Chevy Chase Village
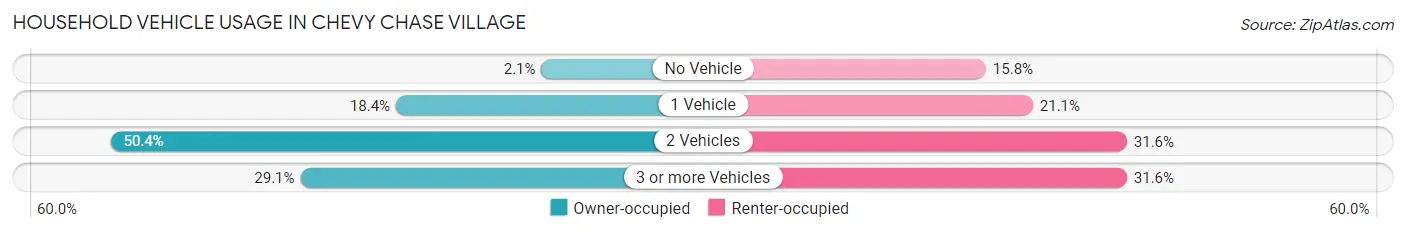
| Vehicles per Household | Owner-occupied | Renter-occupied |
| No Vehicle | 14 (2.1%) | 3 (15.8%) |
| 1 Vehicle | 122 (18.4%) | 4 (21.0%) |
| 2 Vehicles | 334 (50.4%) | 6 (31.6%) |
| 3 or more Vehicles | 193 (29.1%) | 6 (31.6%) |
| Total | 663 (100.0%) | 19 (100.0%) |
Real Estate & Mortgages in Chevy Chase Village
Real Estate and Mortgage Overview in Chevy Chase Village
| Characteristic | Without Mortgage | With Mortgage |
| Housing Units | 267 | 396 |
| Median Property Value | $1,851,600 | $2,000,001 |
| Median Household Income | $250,001 | $361 |
| Monthly Housing Costs | $1,501 | $354 |
| Real Estate Taxes | $10,001 | $1 |
Property Value by Mortgage Status in Chevy Chase Village
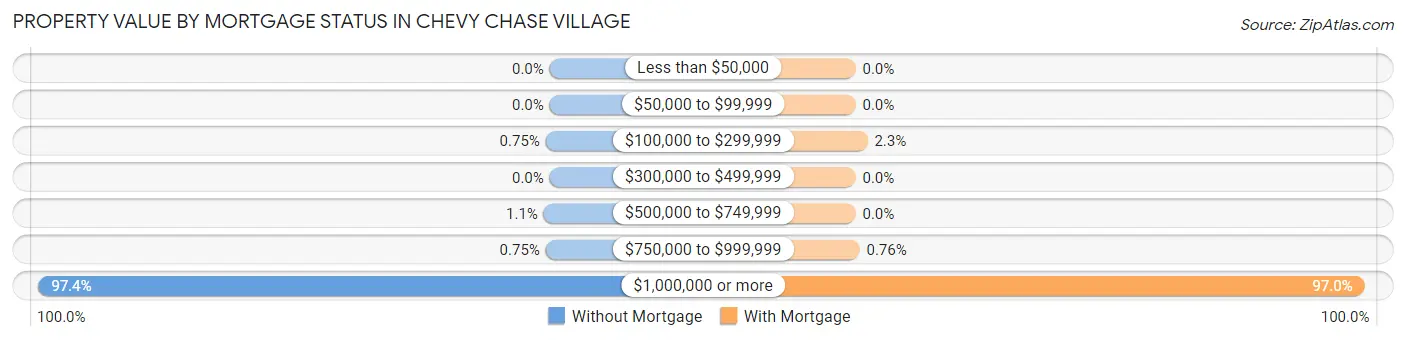
| Property Value | Without Mortgage | With Mortgage |
| Less than $50,000 | 0 (0.0%) | 0 (0.0%) |
| $50,000 to $99,999 | 0 (0.0%) | 0 (0.0%) |
| $100,000 to $299,999 | 2 (0.7%) | 9 (2.3%) |
| $300,000 to $499,999 | 0 (0.0%) | 0 (0.0%) |
| $500,000 to $749,999 | 3 (1.1%) | 0 (0.0%) |
| $750,000 to $999,999 | 2 (0.7%) | 3 (0.8%) |
| $1,000,000 or more | 260 (97.4%) | 384 (97.0%) |
| Total | 267 (100.0%) | 396 (100.0%) |
Household Income by Mortgage Status in Chevy Chase Village
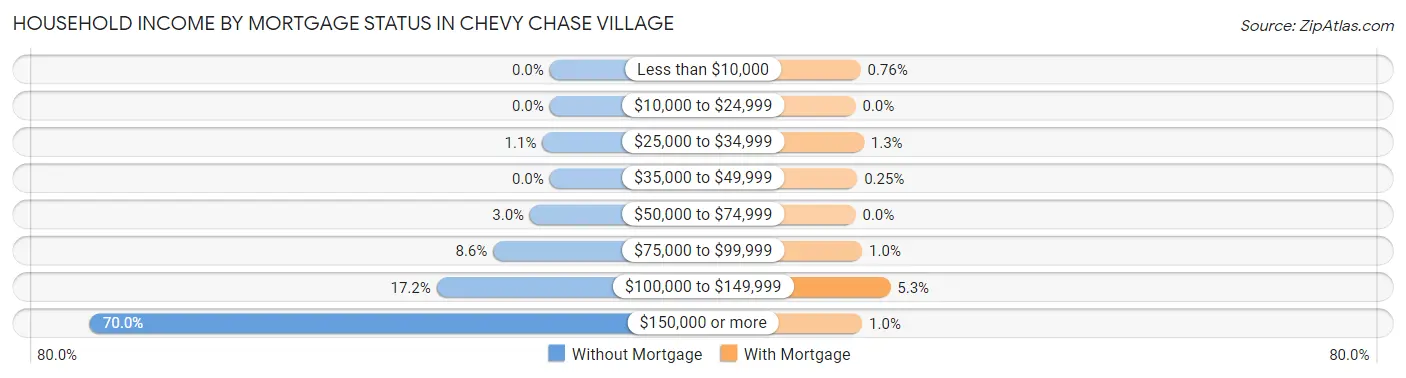
| Household Income | Without Mortgage | With Mortgage |
| Less than $10,000 | 0 (0.0%) | 3 (0.8%) |
| $10,000 to $24,999 | 0 (0.0%) | 0 (0.0%) |
| $25,000 to $34,999 | 3 (1.1%) | 5 (1.3%) |
| $35,000 to $49,999 | 0 (0.0%) | 1 (0.3%) |
| $50,000 to $74,999 | 8 (3.0%) | 0 (0.0%) |
| $75,000 to $99,999 | 23 (8.6%) | 4 (1.0%) |
| $100,000 to $149,999 | 46 (17.2%) | 21 (5.3%) |
| $150,000 or more | 187 (70.0%) | 4 (1.0%) |
| Total | 267 (100.0%) | 396 (100.0%) |
Property Value to Household Income Ratio in Chevy Chase Village
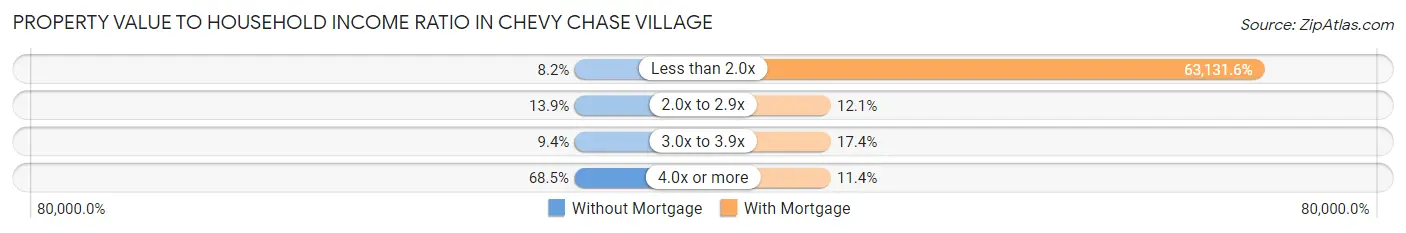
| Value-to-Income Ratio | Without Mortgage | With Mortgage |
| Less than 2.0x | 22 (8.2%) | 250,001 (63,131.6%) |
| 2.0x to 2.9x | 37 (13.9%) | 48 (12.1%) |
| 3.0x to 3.9x | 25 (9.4%) | 69 (17.4%) |
| 4.0x or more | 183 (68.5%) | 45 (11.4%) |
| Total | 267 (100.0%) | 396 (100.0%) |
Real Estate Taxes by Mortgage Status in Chevy Chase Village
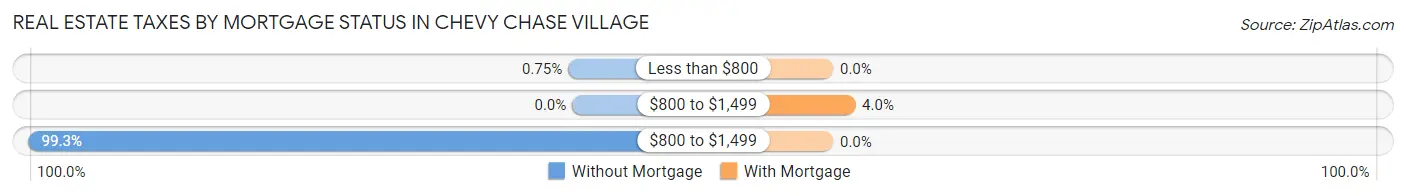
| Property Taxes | Without Mortgage | With Mortgage |
| Less than $800 | 2 (0.7%) | 0 (0.0%) |
| $800 to $1,499 | 0 (0.0%) | 16 (4.0%) |
| $800 to $1,499 | 265 (99.3%) | 0 (0.0%) |
| Total | 267 (100.0%) | 396 (100.0%) |
Health & Disability in Chevy Chase Village
Health Insurance Coverage by Age in Chevy Chase Village
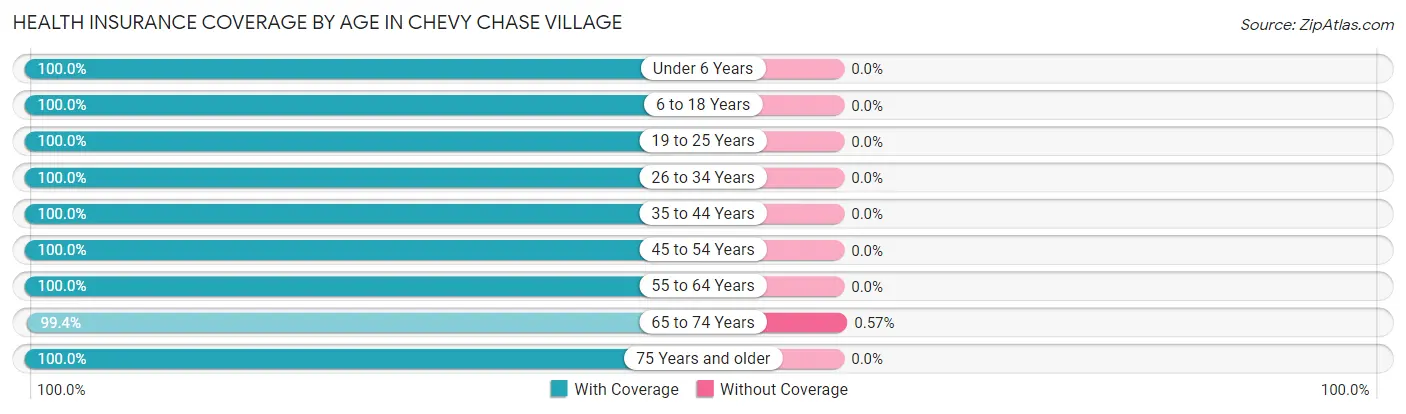
| Age Bracket | With Coverage | Without Coverage |
| Under 6 Years | 121 (100.0%) | 0 (0.0%) |
| 6 to 18 Years | 358 (100.0%) | 0 (0.0%) |
| 19 to 25 Years | 64 (100.0%) | 0 (0.0%) |
| 26 to 34 Years | 42 (100.0%) | 0 (0.0%) |
| 35 to 44 Years | 165 (100.0%) | 0 (0.0%) |
| 45 to 54 Years | 311 (100.0%) | 0 (0.0%) |
| 55 to 64 Years | 227 (100.0%) | 0 (0.0%) |
| 65 to 74 Years | 347 (99.4%) | 2 (0.6%) |
| 75 Years and older | 248 (100.0%) | 0 (0.0%) |
| Total | 1,883 (99.9%) | 2 (0.1%) |
Health Insurance Coverage by Citizenship Status in Chevy Chase Village
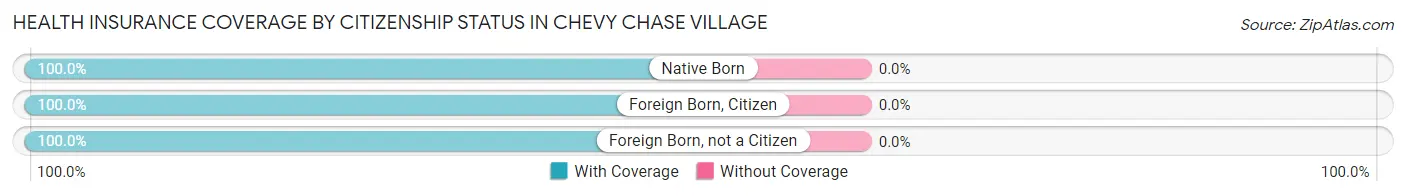
| Citizenship Status | With Coverage | Without Coverage |
| Native Born | 121 (100.0%) | 0 (0.0%) |
| Foreign Born, Citizen | 358 (100.0%) | 0 (0.0%) |
| Foreign Born, not a Citizen | 64 (100.0%) | 0 (0.0%) |
Health Insurance Coverage by Household Income in Chevy Chase Village
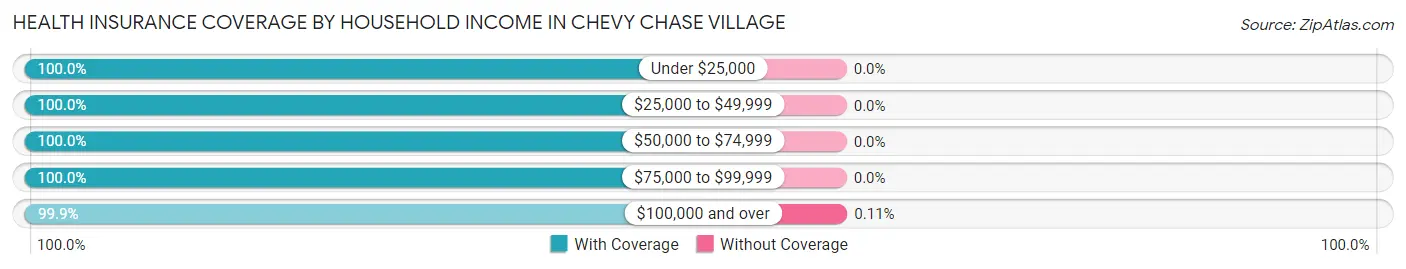
| Household Income | With Coverage | Without Coverage |
| Under $25,000 | 5 (100.0%) | 0 (0.0%) |
| $25,000 to $49,999 | 8 (100.0%) | 0 (0.0%) |
| $50,000 to $74,999 | 20 (100.0%) | 0 (0.0%) |
| $75,000 to $99,999 | 110 (100.0%) | 0 (0.0%) |
| $100,000 and over | 1,740 (99.9%) | 2 (0.1%) |
Public vs Private Health Insurance Coverage by Age in Chevy Chase Village
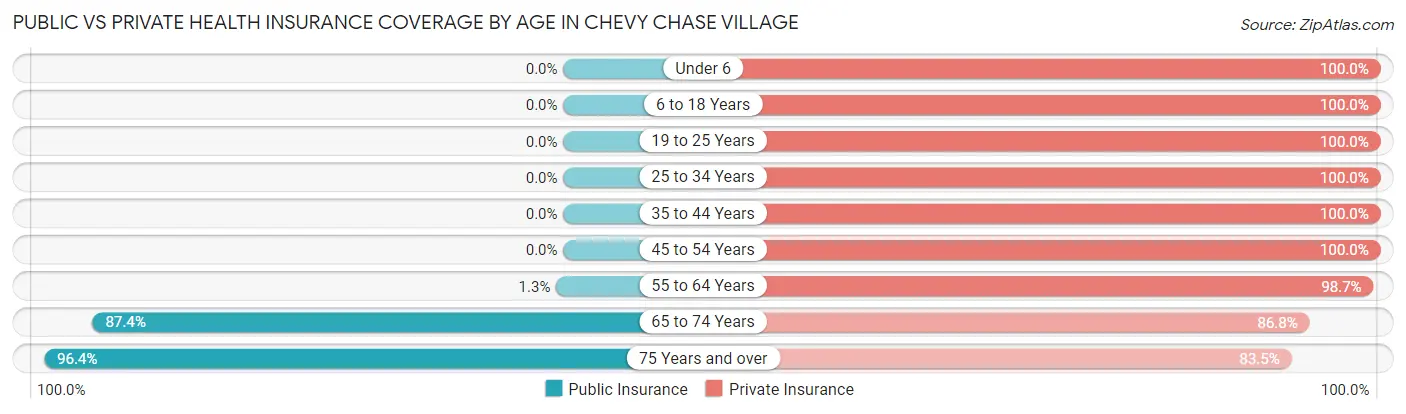
| Age Bracket | Public Insurance | Private Insurance |
| Under 6 | 0 (0.0%) | 121 (100.0%) |
| 6 to 18 Years | 0 (0.0%) | 358 (100.0%) |
| 19 to 25 Years | 0 (0.0%) | 64 (100.0%) |
| 25 to 34 Years | 0 (0.0%) | 42 (100.0%) |
| 35 to 44 Years | 0 (0.0%) | 165 (100.0%) |
| 45 to 54 Years | 0 (0.0%) | 311 (100.0%) |
| 55 to 64 Years | 3 (1.3%) | 224 (98.7%) |
| 65 to 74 Years | 305 (87.4%) | 303 (86.8%) |
| 75 Years and over | 239 (96.4%) | 207 (83.5%) |
| Total | 547 (29.0%) | 1,795 (95.2%) |
Disability Status by Sex by Age in Chevy Chase Village
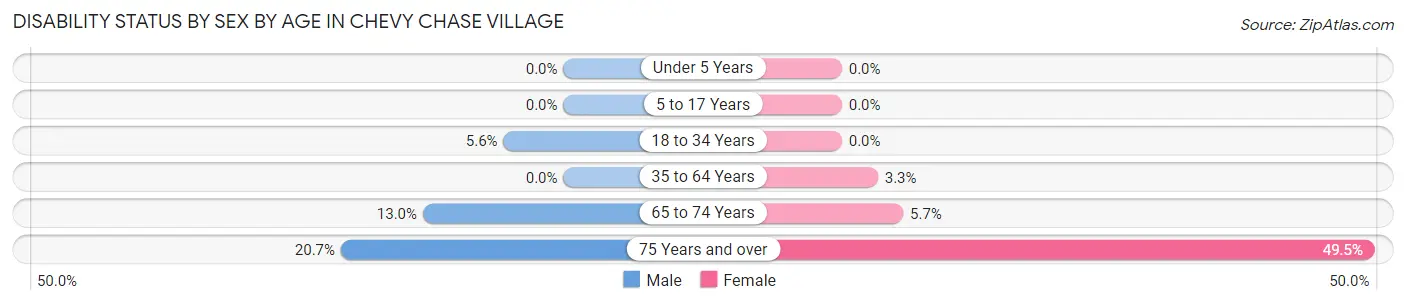
| Age Bracket | Male | Female |
| Under 5 Years | 0 (0.0%) | 0 (0.0%) |
| 5 to 17 Years | 0 (0.0%) | 0 (0.0%) |
| 18 to 34 Years | 6 (5.6%) | 0 (0.0%) |
| 35 to 64 Years | 0 (0.0%) | 12 (3.3%) |
| 65 to 74 Years | 18 (13.0%) | 12 (5.7%) |
| 75 Years and over | 32 (20.6%) | 46 (49.5%) |
Disability Class by Sex by Age in Chevy Chase Village
Disability Class: Hearing Difficulty
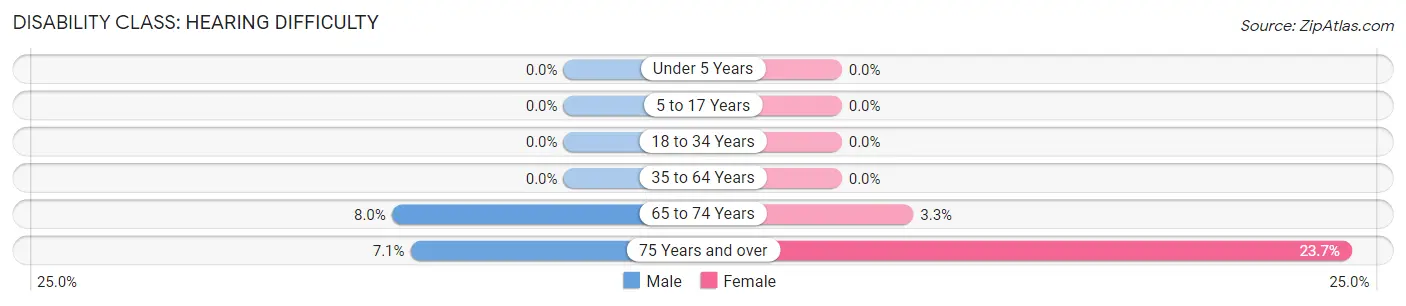
| Age Bracket | Male | Female |
| Under 5 Years | 0 (0.0%) | 0 (0.0%) |
| 5 to 17 Years | 0 (0.0%) | 0 (0.0%) |
| 18 to 34 Years | 0 (0.0%) | 0 (0.0%) |
| 35 to 64 Years | 0 (0.0%) | 0 (0.0%) |
| 65 to 74 Years | 11 (8.0%) | 7 (3.3%) |
| 75 Years and over | 11 (7.1%) | 22 (23.7%) |
Disability Class: Vision Difficulty
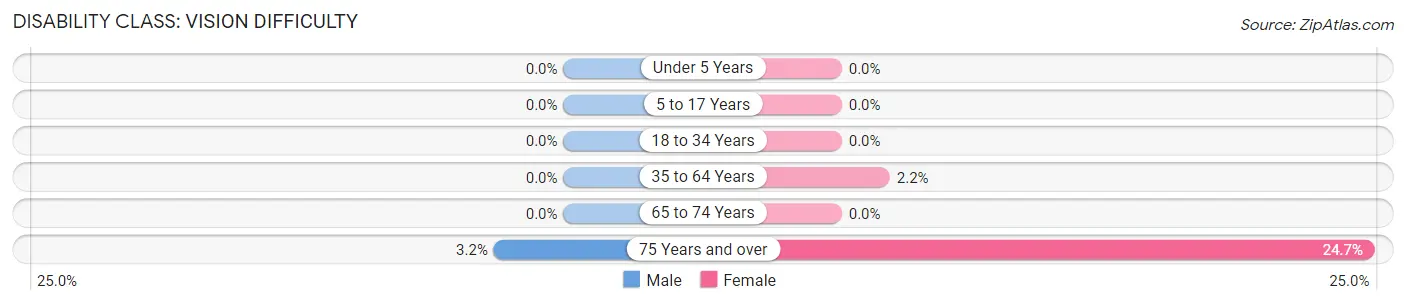
| Age Bracket | Male | Female |
| Under 5 Years | 0 (0.0%) | 0 (0.0%) |
| 5 to 17 Years | 0 (0.0%) | 0 (0.0%) |
| 18 to 34 Years | 0 (0.0%) | 0 (0.0%) |
| 35 to 64 Years | 0 (0.0%) | 8 (2.2%) |
| 65 to 74 Years | 0 (0.0%) | 0 (0.0%) |
| 75 Years and over | 5 (3.2%) | 23 (24.7%) |
Disability Class: Cognitive Difficulty
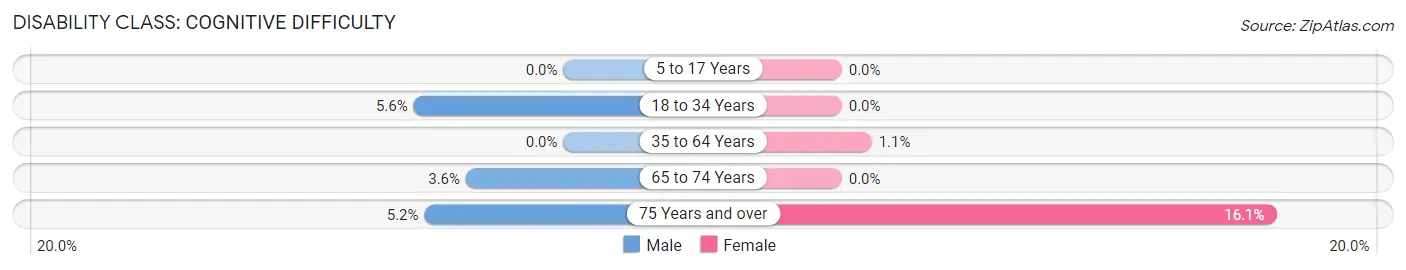
| Age Bracket | Male | Female |
| 5 to 17 Years | 0 (0.0%) | 0 (0.0%) |
| 18 to 34 Years | 6 (5.6%) | 0 (0.0%) |
| 35 to 64 Years | 0 (0.0%) | 4 (1.1%) |
| 65 to 74 Years | 5 (3.6%) | 0 (0.0%) |
| 75 Years and over | 8 (5.2%) | 15 (16.1%) |
Disability Class: Ambulatory Difficulty
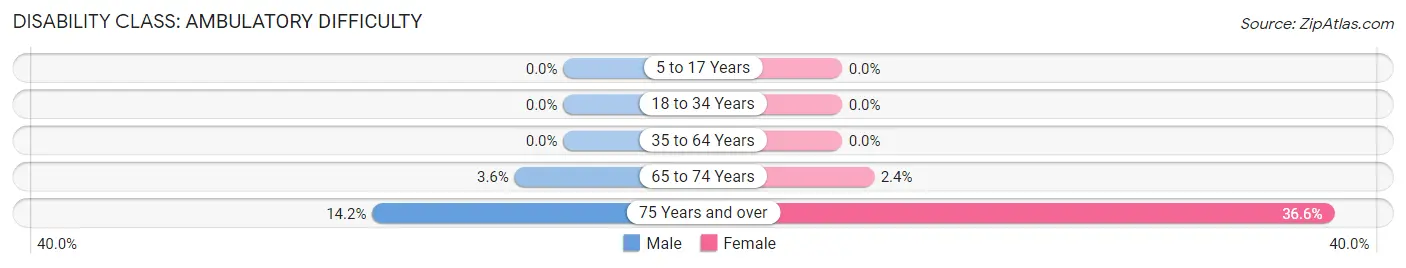
| Age Bracket | Male | Female |
| 5 to 17 Years | 0 (0.0%) | 0 (0.0%) |
| 18 to 34 Years | 0 (0.0%) | 0 (0.0%) |
| 35 to 64 Years | 0 (0.0%) | 0 (0.0%) |
| 65 to 74 Years | 5 (3.6%) | 5 (2.4%) |
| 75 Years and over | 22 (14.2%) | 34 (36.6%) |
Disability Class: Self-Care Difficulty
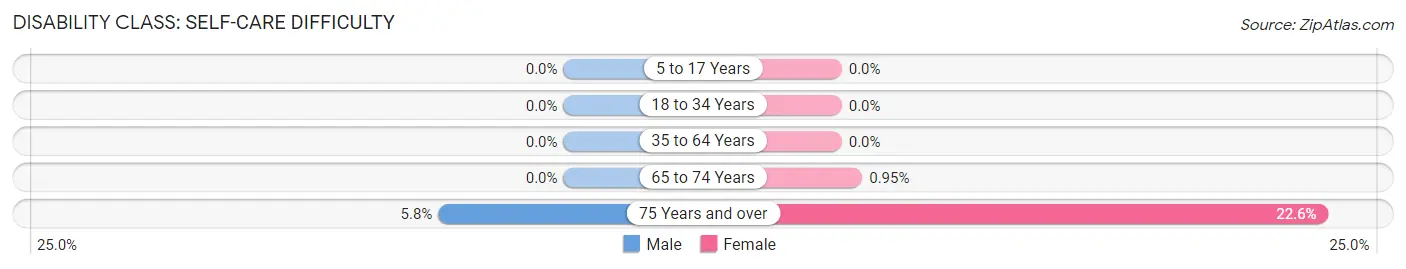
| Age Bracket | Male | Female |
| 5 to 17 Years | 0 (0.0%) | 0 (0.0%) |
| 18 to 34 Years | 0 (0.0%) | 0 (0.0%) |
| 35 to 64 Years | 0 (0.0%) | 0 (0.0%) |
| 65 to 74 Years | 0 (0.0%) | 2 (0.9%) |
| 75 Years and over | 9 (5.8%) | 21 (22.6%) |
Technology Access in Chevy Chase Village
Computing Device Access in Chevy Chase Village
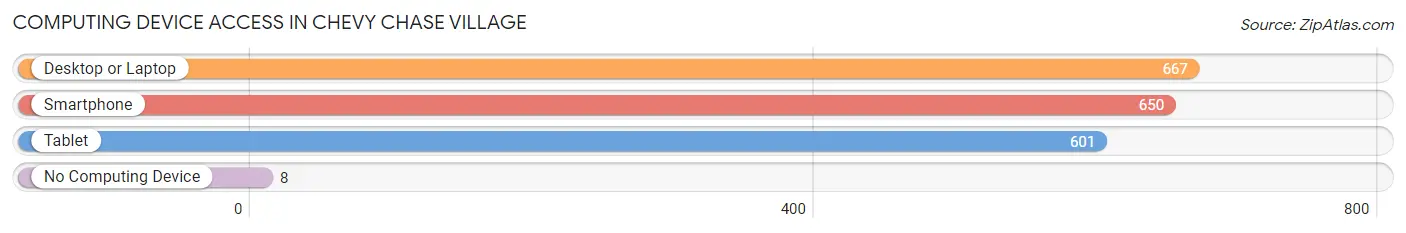
| Device Type | # Households | % Households |
| Desktop or Laptop | 667 | 97.8% |
| Smartphone | 650 | 95.3% |
| Tablet | 601 | 88.1% |
| No Computing Device | 8 | 1.2% |
| Total | 682 | 100.0% |
Internet Access in Chevy Chase Village
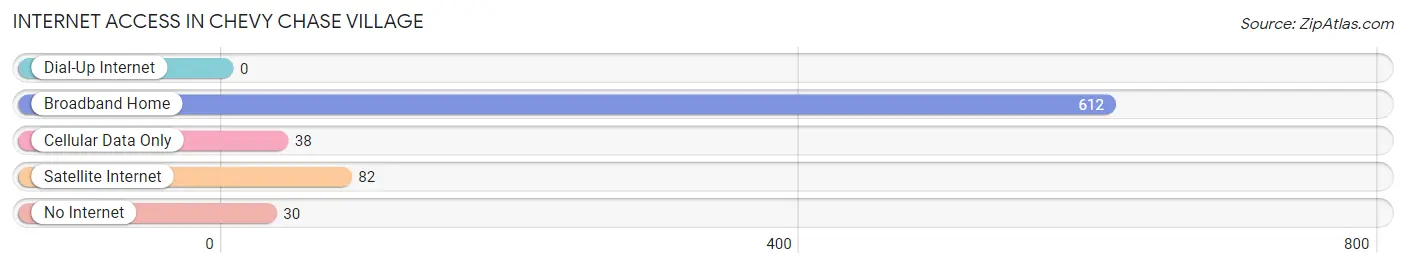
| Internet Type | # Households | % Households |
| Dial-Up Internet | 0 | 0.0% |
| Broadband Home | 612 | 89.7% |
| Cellular Data Only | 38 | 5.6% |
| Satellite Internet | 82 | 12.0% |
| No Internet | 30 | 4.4% |
| Total | 682 | 100.0% |
Chevy Chase Village Summary
Chevy Chase Village is a small, affluent village located in Montgomery County, Maryland, just outside of Washington, D.C. It is bordered by the city of Bethesda to the north, the city of Rockville to the east, and the city of Silver Spring to the south. The village is home to approximately 2,000 people and is one of the most affluent communities in the Washington, D.C. metropolitan area.
History
Chevy Chase Village was founded in 1890 by a group of wealthy Washingtonians who wanted to create a suburban community outside of the city. The village was named after the nearby Chevy Chase Country Club, which was founded in 1892. The village was incorporated in 1918 and was the first municipality in Montgomery County to be incorporated.
The village was originally designed to be a residential community, and it was home to many prominent Washingtonians, including Supreme Court Justice Louis Brandeis and President Woodrow Wilson. The village was also home to the first shopping center in Montgomery County, the Chevy Chase Shopping Center, which opened in 1938.
Geography
Chevy Chase Village is located in Montgomery County, Maryland, just outside of Washington, D.C. It is bordered by the city of Bethesda to the north, the city of Rockville to the east, and the city of Silver Spring to the south. The village is situated on a plateau, and its elevation ranges from about 400 to 600 feet above sea level.
The village is located in the Piedmont region of Maryland, and its climate is characterized by hot, humid summers and cold, wet winters. The average annual temperature is around 54 degrees Fahrenheit, and the average annual precipitation is around 40 inches.
Economy
Chevy Chase Village is a wealthy community, and its economy is largely based on the service industry. The village is home to many upscale restaurants, shops, and other businesses. The village is also home to several corporate offices, including the headquarters of Marriott International and the National Institutes of Health.
The village is also home to several educational institutions, including the National Cathedral School, the National Presbyterian School, and the Washington International School.
Demographics
As of the 2010 census, the population of Chevy Chase Village was 2,009. The racial makeup of the village was 87.3% White, 5.2% African American, 0.2% Native American, 4.2% Asian, 0.1% Pacific Islander, and 2.2% from other races. The median household income was $150,000, and the median family income was $170,000.
Chevy Chase Village is a highly educated community, and the majority of its residents have at least a bachelor’s degree. The village is also home to many professionals, including lawyers, doctors, and business executives.
Conclusion
Chevy Chase Village is a small, affluent village located in Montgomery County, Maryland, just outside of Washington, D.C. It is bordered by the city of Bethesda to the north, the city of Rockville to the east, and the city of Silver Spring to the south. The village was founded in 1890 and was incorporated in 1918. It is home to approximately 2,000 people and is one of the most affluent communities in the Washington, D.C. metropolitan area. The village’s economy is largely based on the service industry, and its residents are highly educated and have high incomes.
Common Questions
What is Per Capita Income in Chevy Chase Village?
Per Capita income in Chevy Chase Village is $191,804.
What is the Median Family Income in Chevy Chase Village?
Median Family Income in Chevy Chase Village is $250,001.
What is the Median Household income in Chevy Chase Village?
Median Household Income in Chevy Chase Village is $250,001.
What is Income or Wage Gap in Chevy Chase Village?
Income or Wage Gap in Chevy Chase Village is 41.8%.
Women in Chevy Chase Village earn 58.2 cents for every dollar earned by a man.
What is Inequality or Gini Index in Chevy Chase Village?
Inequality or Gini Index in Chevy Chase Village is 0.44.
What is the Total Population of Chevy Chase Village?
Total Population of Chevy Chase Village is 1,885.
What is the Total Male Population of Chevy Chase Village?
Total Male Population of Chevy Chase Village is 969.
What is the Total Female Population of Chevy Chase Village?
Total Female Population of Chevy Chase Village is 916.
What is the Ratio of Males per 100 Females in Chevy Chase Village?
There are 105.79 Males per 100 Females in Chevy Chase Village.
What is the Ratio of Females per 100 Males in Chevy Chase Village?
There are 94.53 Females per 100 Males in Chevy Chase Village.
What is the Median Population Age in Chevy Chase Village?
Median Population Age in Chevy Chase Village is 51.0 Years.
What is the Average Family Size in Chevy Chase Village
Average Family Size in Chevy Chase Village is 3.0 People.
What is the Average Household Size in Chevy Chase Village
Average Household Size in Chevy Chase Village is 2.8 People.
How Large is the Labor Force in Chevy Chase Village?
There are 895 People in the Labor Forcein in Chevy Chase Village.
What is the Percentage of People in the Labor Force in Chevy Chase Village?
59.6% of People are in the Labor Force in Chevy Chase Village.
What is the Unemployment Rate in Chevy Chase Village?
Unemployment Rate in Chevy Chase Village is 2.5%.