Bedford, NY Map & Demographics
Bedford Map
Bedford Overview
$107,283
PER CAPITA INCOME
$250,001
AVG FAMILY INCOME
$250,001
AVG HOUSEHOLD INCOME
0.44
INEQUALITY / GINI INDEX
2,052
TOTAL POPULATION
881
MALE POPULATION
1,171
FEMALE POPULATION
75.23
MALES / 100 FEMALES
132.92
FEMALES / 100 MALES
43.5
MEDIAN AGE
3.4
AVG FAMILY SIZE
2.9
AVG HOUSEHOLD SIZE
1,006
LABOR FORCE [ PEOPLE ]
59.3%
PERCENT IN LABOR FORCE
3.4%
UNEMPLOYMENT RATE
Bedford Zip Codes
Bedford Area Codes
Income in Bedford
Income Overview in Bedford
Per Capita Income in Bedford is $107,283, while median incomes of families and households are $250,001 and $250,001 respectively.
| Characteristic | Number | Measure |
| Per Capita Income | 2,052 | $107,283 |
| Median Family Income | 517 | $250,001 |
| Mean Family Income | 517 | $324,218 |
| Median Household Income | 692 | $250,001 |
| Mean Household Income | 692 | $321,203 |
| Income Deficit | 517 | $0 |
| Wage / Income Gap (%) | 2,052 | 0.00% |
| Wage / Income Gap ($) | 2,052 | 100.00¢ per $1 |
| Gini / Inequality Index | 2,052 | 0.44 |
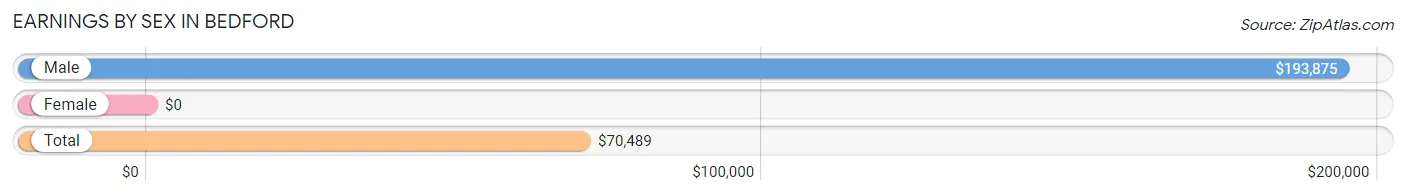
Earnings by Sex in Bedford
| Sex | Number | Average Earnings |
| Male | 515 (45.9%) | $193,875 |
| Female | 608 (54.1%) | $0 |
| Total | 1,123 (100.0%) | $70,489 |
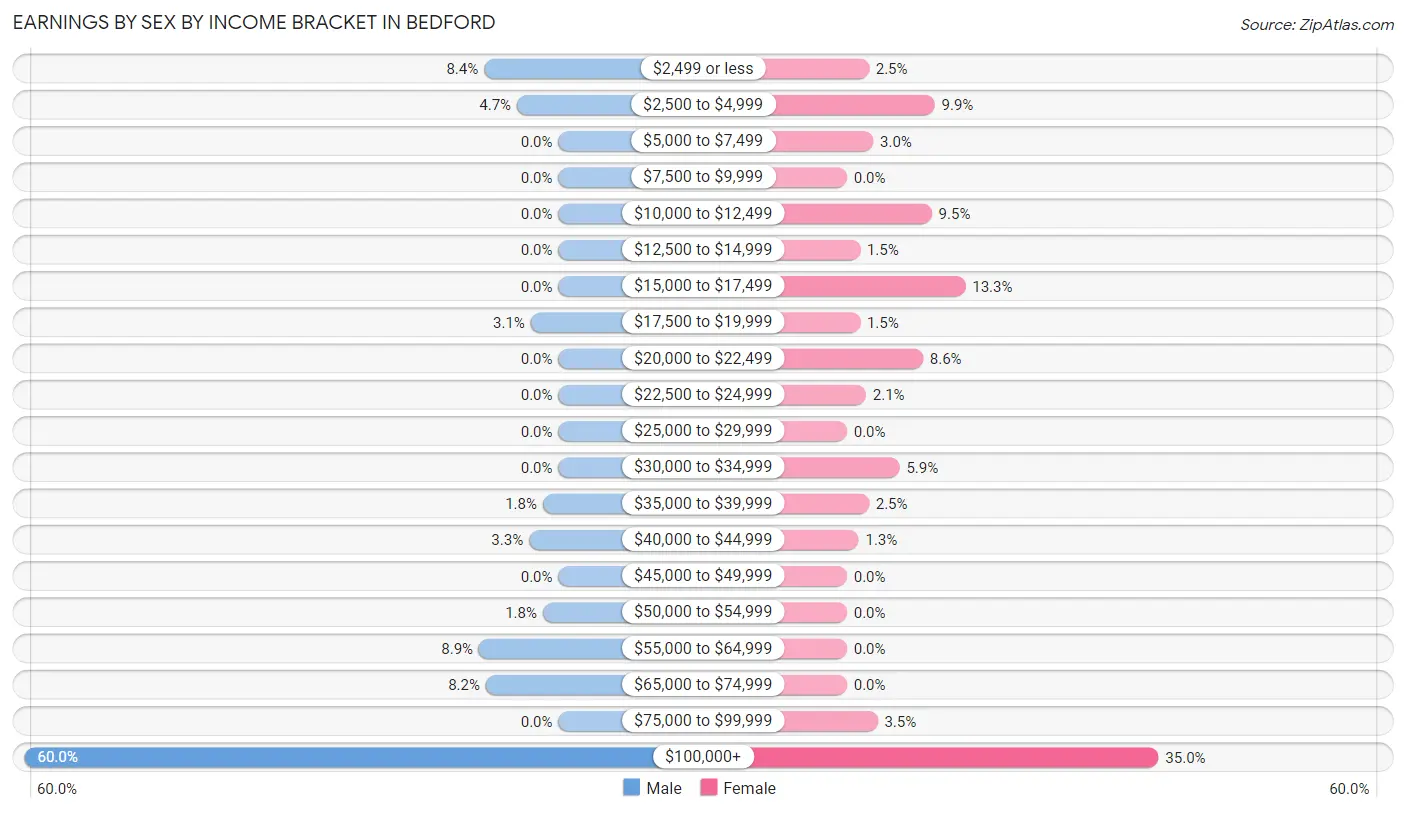
Earnings by Sex by Income Bracket in Bedford
The most common earnings brackets in Bedford are $100,000+ for men (309 | 60.0%) and $100,000+ for women (213 | 35.0%).
| Income | Male | Female |
| $2,499 or less | 43 (8.4%) | 15 (2.5%) |
| $2,500 to $4,999 | 24 (4.7%) | 60 (9.9%) |
| $5,000 to $7,499 | 0 (0.0%) | 18 (3.0%) |
| $7,500 to $9,999 | 0 (0.0%) | 0 (0.0%) |
| $10,000 to $12,499 | 0 (0.0%) | 58 (9.5%) |
| $12,500 to $14,999 | 0 (0.0%) | 9 (1.5%) |
| $15,000 to $17,499 | 0 (0.0%) | 81 (13.3%) |
| $17,500 to $19,999 | 16 (3.1%) | 9 (1.5%) |
| $20,000 to $22,499 | 0 (0.0%) | 52 (8.6%) |
| $22,500 to $24,999 | 0 (0.0%) | 13 (2.1%) |
| $25,000 to $29,999 | 0 (0.0%) | 0 (0.0%) |
| $30,000 to $34,999 | 0 (0.0%) | 36 (5.9%) |
| $35,000 to $39,999 | 9 (1.8%) | 15 (2.5%) |
| $40,000 to $44,999 | 17 (3.3%) | 8 (1.3%) |
| $45,000 to $49,999 | 0 (0.0%) | 0 (0.0%) |
| $50,000 to $54,999 | 9 (1.8%) | 0 (0.0%) |
| $55,000 to $64,999 | 46 (8.9%) | 0 (0.0%) |
| $65,000 to $74,999 | 42 (8.2%) | 0 (0.0%) |
| $75,000 to $99,999 | 0 (0.0%) | 21 (3.5%) |
| $100,000+ | 309 (60.0%) | 213 (35.0%) |
| Total | 515 (100.0%) | 608 (100.0%) |
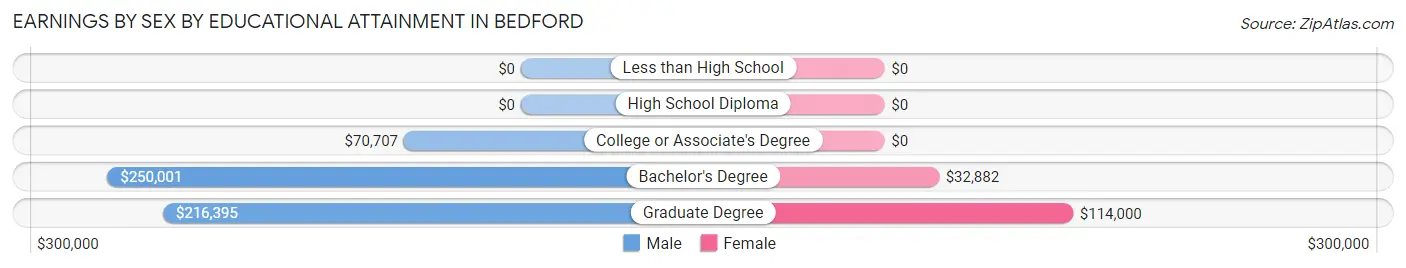
Earnings by Sex by Educational Attainment in Bedford
| Educational Attainment | Male Income | Female Income |
| Less than High School | - | - |
| High School Diploma | - | - |
| College or Associate's Degree | $70,707 | $0 |
| Bachelor's Degree | $250,001 | $32,882 |
| Graduate Degree | $216,395 | $114,000 |
| Total | $216,483 | $0 |
Family Income in Bedford
Family Income Brackets in Bedford
According to the Bedford family income data, there are 332 families falling into the $200,000+ income range, which is the most common income bracket and makes up 64.2% of all families.
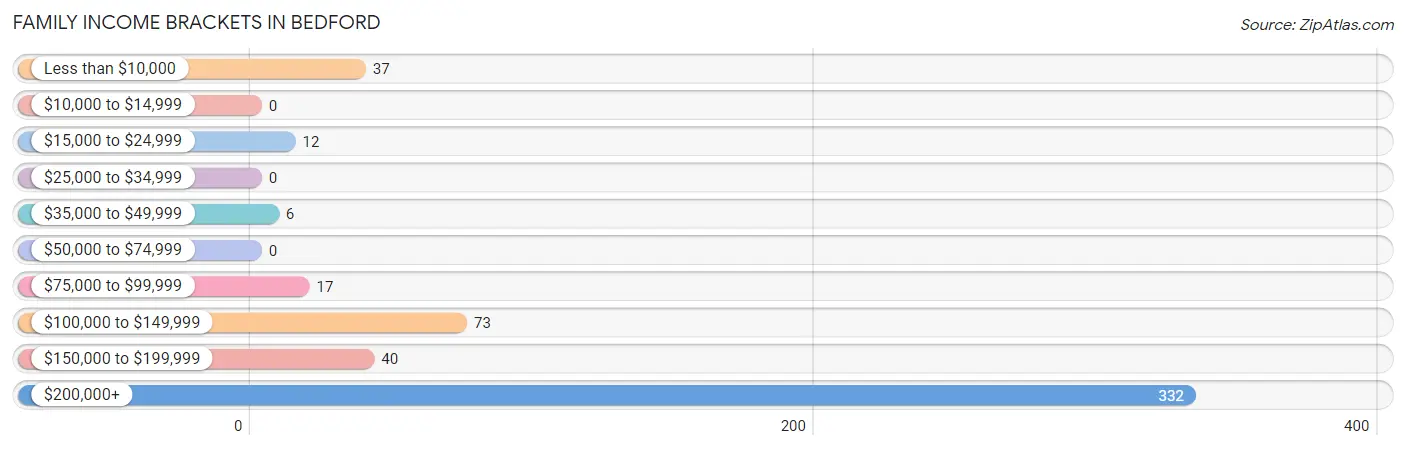
| Income Bracket | # Families | % Families |
| Less than $10,000 | 37 | 7.2% |
| $10,000 to $14,999 | 0 | 0.0% |
| $15,000 to $24,999 | 12 | 2.3% |
| $25,000 to $34,999 | 0 | 0.0% |
| $35,000 to $49,999 | 6 | 1.2% |
| $50,000 to $74,999 | 0 | 0.0% |
| $75,000 to $99,999 | 17 | 3.3% |
| $100,000 to $149,999 | 73 | 14.1% |
| $150,000 to $199,999 | 40 | 7.7% |
| $200,000+ | 332 | 64.2% |
Family Income by Famaliy Size in Bedford
3-person families (153 | 29.6%) account for the highest median family income in Bedford with $250,001 per family, while 3-person families (153 | 29.6%) have the highest median income of $83,334 per family member.
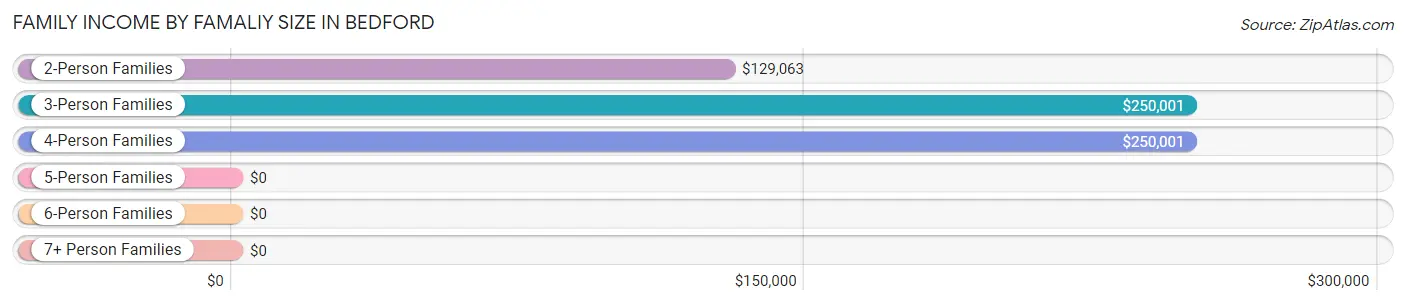
| Income Bracket | # Families | Median Income |
| 2-Person Families | 128 (24.8%) | $129,063 |
| 3-Person Families | 153 (29.6%) | $250,001 |
| 4-Person Families | 218 (42.2%) | $250,001 |
| 5-Person Families | 18 (3.5%) | $0 |
| 6-Person Families | 0 (0.0%) | $0 |
| 7+ Person Families | 0 (0.0%) | $0 |
| Total | 517 (100.0%) | $250,001 |
Family Income by Number of Earners in Bedford
The median family income in Bedford is $250,001, with families comprising 1 earner (94) having the highest median family income of $250,001, while families with no earners (57) have the lowest median family income of $158,281, accounting for 18.2% and 11.0% of families, respectively.
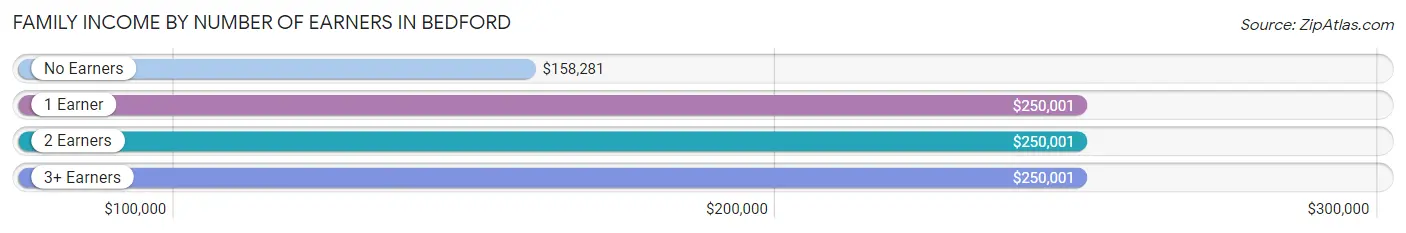
| Number of Earners | # Families | Median Income |
| No Earners | 57 (11.0%) | $158,281 |
| 1 Earner | 94 (18.2%) | $250,001 |
| 2 Earners | 244 (47.2%) | $250,001 |
| 3+ Earners | 122 (23.6%) | $250,001 |
| Total | 517 (100.0%) | $250,001 |
Household Income in Bedford
Household Income Brackets in Bedford
With 415 households falling in the category, the $200,000+ income range is the most frequent in Bedford, accounting for 60.0% of all households.
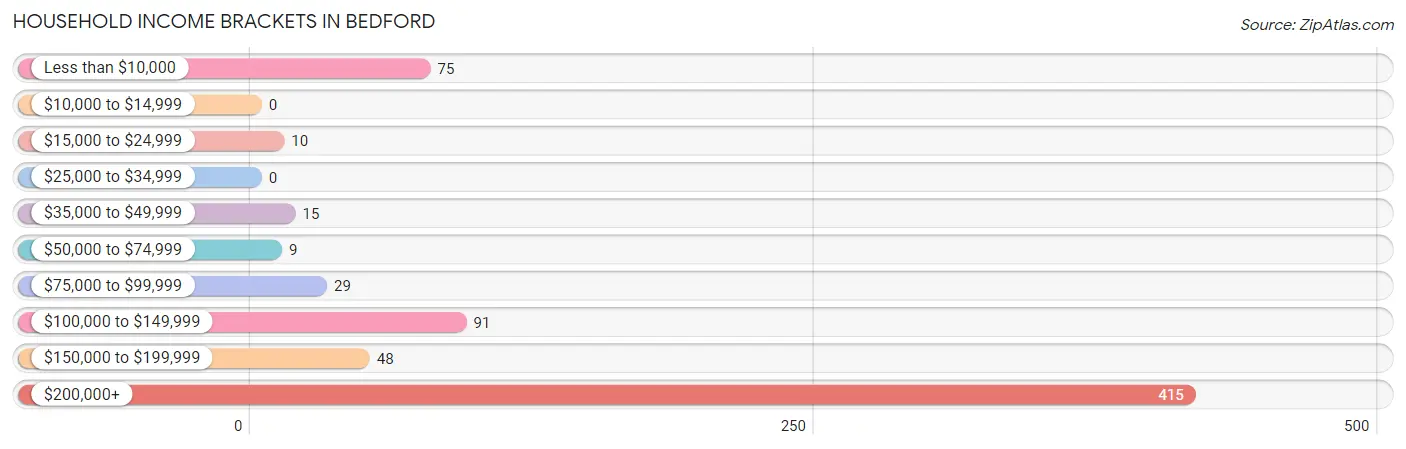
| Income Bracket | # Households | % Households |
| Less than $10,000 | 75 | 10.8% |
| $10,000 to $14,999 | 0 | 0.0% |
| $15,000 to $24,999 | 10 | 1.4% |
| $25,000 to $34,999 | 0 | 0.0% |
| $35,000 to $49,999 | 15 | 2.2% |
| $50,000 to $74,999 | 9 | 1.3% |
| $75,000 to $99,999 | 29 | 4.2% |
| $100,000 to $149,999 | 91 | 13.2% |
| $150,000 to $199,999 | 48 | 6.9% |
| $200,000+ | 415 | 60.0% |
Household Income by Householder Age in Bedford
The median household income in Bedford is $250,001, with the highest median household income of $250,001 found in the 25 to 44 years age bracket for the primary householder. A total of 148 households (21.4%) fall into this category.
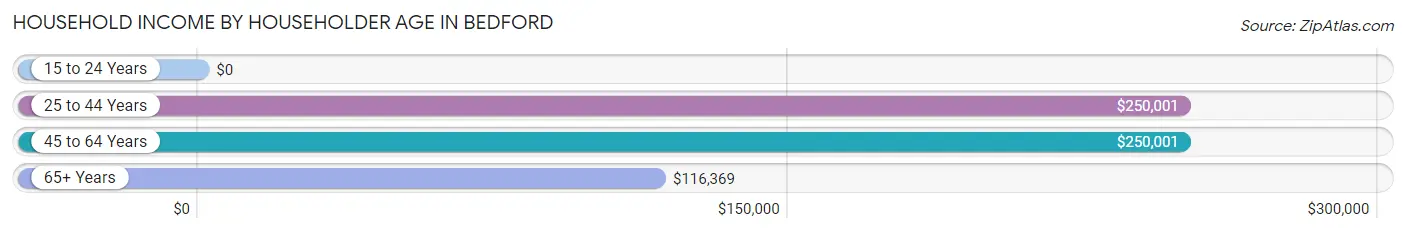
| Income Bracket | # Households | Median Income |
| 15 to 24 Years | 0 (0.0%) | $0 |
| 25 to 44 Years | 148 (21.4%) | $250,001 |
| 45 to 64 Years | 341 (49.3%) | $250,001 |
| 65+ Years | 203 (29.3%) | $116,369 |
| Total | 692 (100.0%) | $250,001 |
Poverty in Bedford
Income Below Poverty by Sex and Age in Bedford
With 6.1% poverty level for males and 12.3% for females among the residents of Bedford, under 5 year old males and 75 year old and over females are the most vulnerable to poverty, with 23 males (20.3%) and 38 females (31.4%) in their respective age groups living below the poverty level.
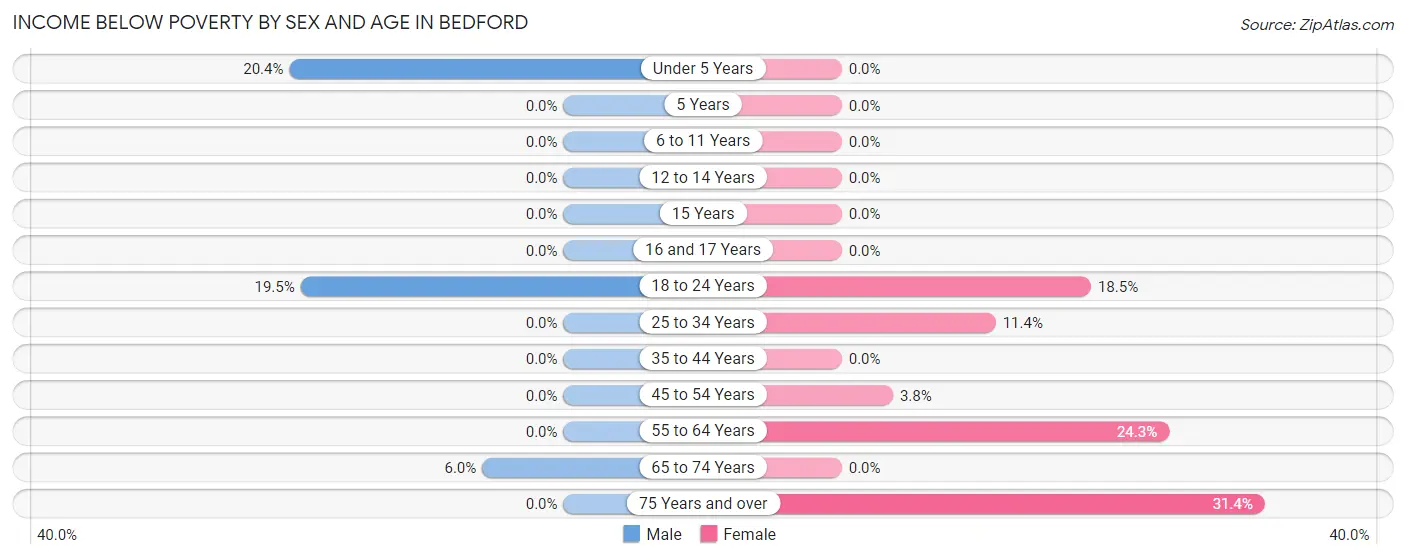
| Age Bracket | Male | Female |
| Under 5 Years | 23 (20.3%) | 0 (0.0%) |
| 5 Years | 0 (0.0%) | 0 (0.0%) |
| 6 to 11 Years | 0 (0.0%) | 0 (0.0%) |
| 12 to 14 Years | 0 (0.0%) | 0 (0.0%) |
| 15 Years | 0 (0.0%) | 0 (0.0%) |
| 16 and 17 Years | 0 (0.0%) | 0 (0.0%) |
| 18 to 24 Years | 24 (19.5%) | 37 (18.5%) |
| 25 to 34 Years | 0 (0.0%) | 12 (11.4%) |
| 35 to 44 Years | 0 (0.0%) | 0 (0.0%) |
| 45 to 54 Years | 0 (0.0%) | 6 (3.8%) |
| 55 to 64 Years | 0 (0.0%) | 51 (24.3%) |
| 65 to 74 Years | 7 (6.0%) | 0 (0.0%) |
| 75 Years and over | 0 (0.0%) | 38 (31.4%) |
| Total | 54 (6.1%) | 144 (12.3%) |
Income Above Poverty by Sex and Age in Bedford
According to the poverty statistics in Bedford, males aged 5 years and females aged under 5 years are the age groups that are most secure financially, with 100.0% of males and 100.0% of females in these age groups living above the poverty line.
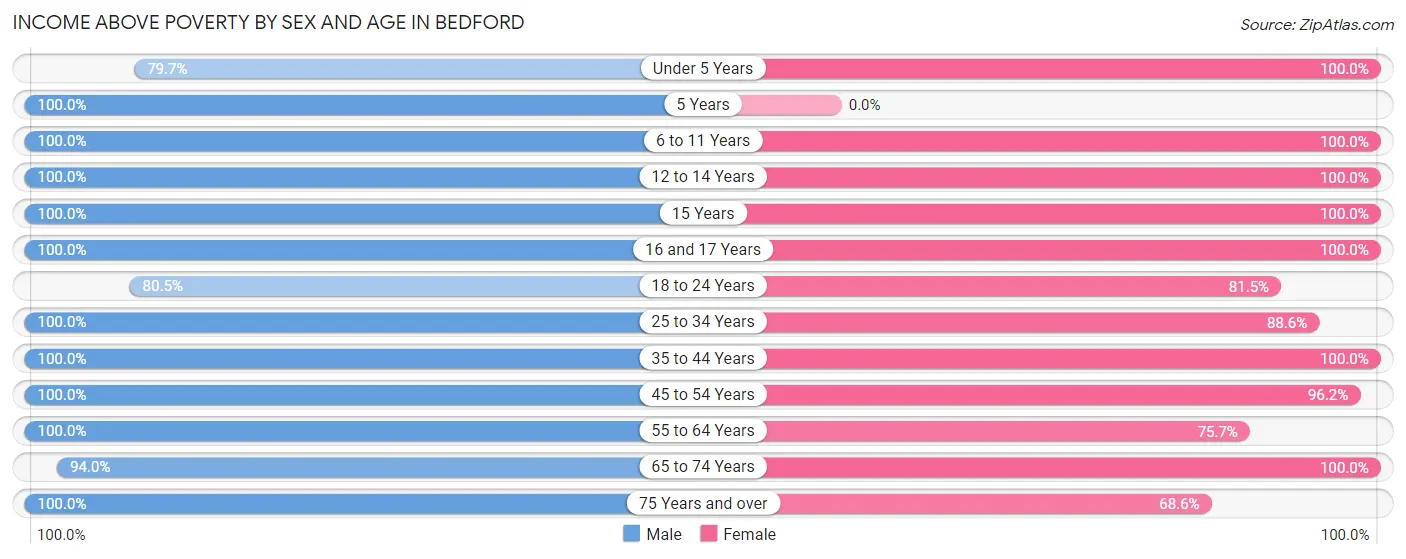
| Age Bracket | Male | Female |
| Under 5 Years | 90 (79.6%) | 67 (100.0%) |
| 5 Years | 10 (100.0%) | 0 (0.0%) |
| 6 to 11 Years | 37 (100.0%) | 43 (100.0%) |
| 12 to 14 Years | 13 (100.0%) | 23 (100.0%) |
| 15 Years | 23 (100.0%) | 26 (100.0%) |
| 16 and 17 Years | 11 (100.0%) | 8 (100.0%) |
| 18 to 24 Years | 99 (80.5%) | 163 (81.5%) |
| 25 to 34 Years | 53 (100.0%) | 93 (88.6%) |
| 35 to 44 Years | 108 (100.0%) | 97 (100.0%) |
| 45 to 54 Years | 68 (100.0%) | 152 (96.2%) |
| 55 to 64 Years | 158 (100.0%) | 159 (75.7%) |
| 65 to 74 Years | 109 (94.0%) | 113 (100.0%) |
| 75 Years and over | 48 (100.0%) | 83 (68.6%) |
| Total | 827 (93.9%) | 1,027 (87.7%) |
Income Below Poverty Among Married-Couple Families in Bedford
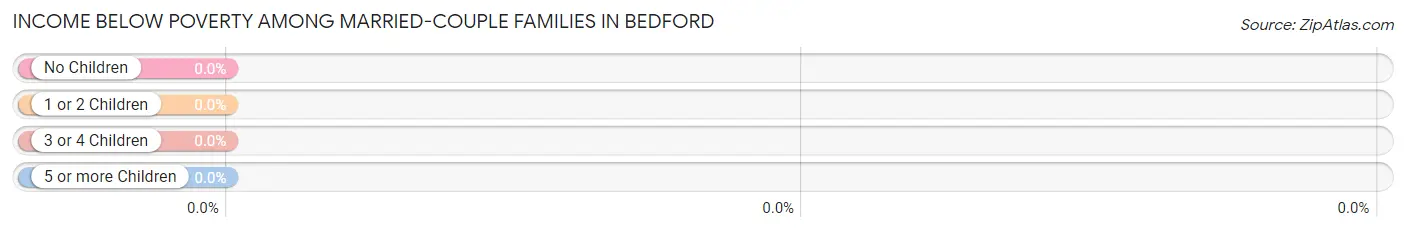
| Children | Above Poverty | Below Poverty |
| No Children | 250 (100.0%) | 0 (0.0%) |
| 1 or 2 Children | 166 (100.0%) | 0 (0.0%) |
| 3 or 4 Children | 18 (100.0%) | 0 (0.0%) |
| 5 or more Children | 0 (0.0%) | 0 (0.0%) |
| Total | 434 (100.0%) | 0 (0.0%) |
Income Below Poverty Among Single-Parent Households in Bedford
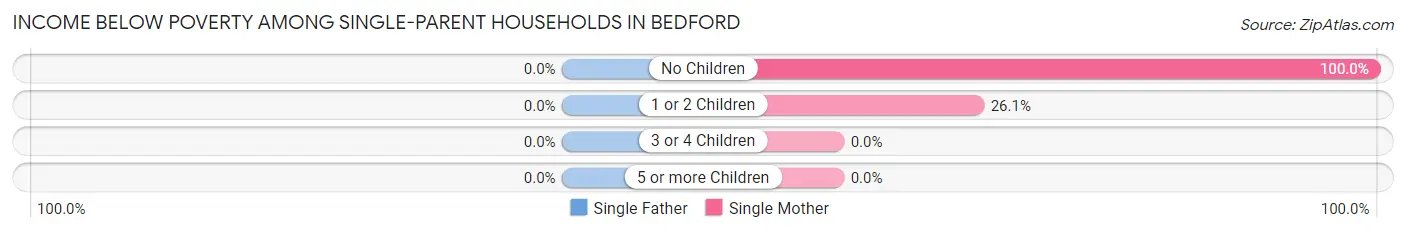
| Children | Single Father | Single Mother |
| No Children | 0 (0.0%) | 37 (100.0%) |
| 1 or 2 Children | 0 (0.0%) | 12 (26.1%) |
| 3 or 4 Children | 0 (0.0%) | 0 (0.0%) |
| 5 or more Children | 0 (0.0%) | 0 (0.0%) |
| Total | 0 (0.0%) | 49 (59.0%) |
Income Below Poverty Among Married-Couple vs Single-Parent Households in Bedford
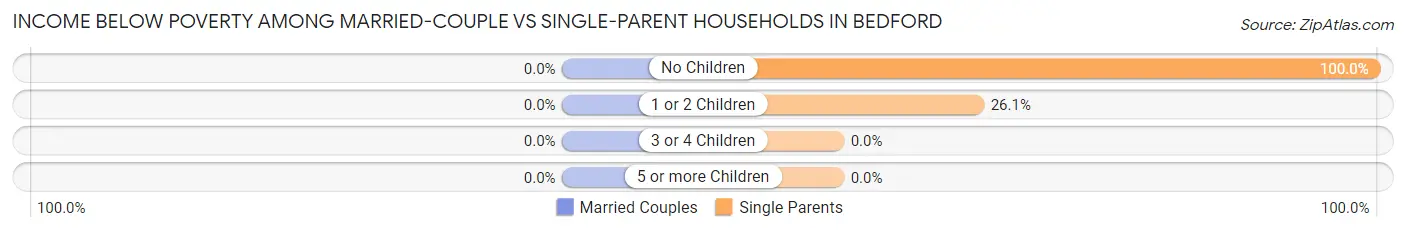
| Children | Married-Couple Families | Single-Parent Households |
| No Children | 0 (0.0%) | 37 (100.0%) |
| 1 or 2 Children | 0 (0.0%) | 12 (26.1%) |
| 3 or 4 Children | 0 (0.0%) | 0 (0.0%) |
| 5 or more Children | 0 (0.0%) | 0 (0.0%) |
| Total | 0 (0.0%) | 49 (59.0%) |
Race in Bedford
The most populous races in Bedford are White / Caucasian (1,856 | 90.4%), Two or more Races (140 | 6.8%), and Hispanic or Latino (103 | 5.0%).
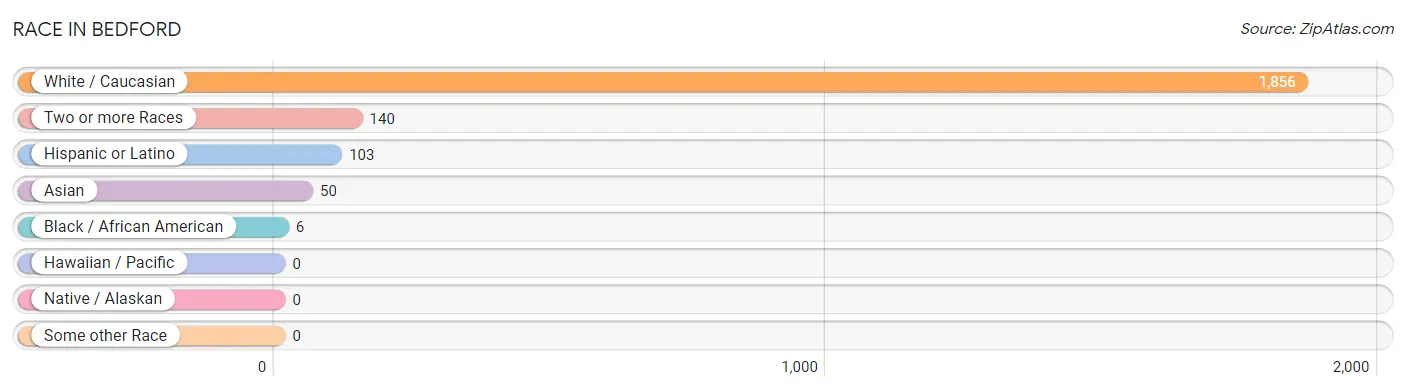
| Race | # Population | % Population |
| Asian | 50 | 2.4% |
| Black / African American | 6 | 0.3% |
| Hawaiian / Pacific | 0 | 0.0% |
| Hispanic or Latino | 103 | 5.0% |
| Native / Alaskan | 0 | 0.0% |
| White / Caucasian | 1,856 | 90.4% |
| Two or more Races | 140 | 6.8% |
| Some other Race | 0 | 0.0% |
| Total | 2,052 | 100.0% |
Ancestry in Bedford
The most populous ancestries reported in Bedford are Irish (378 | 18.4%), Italian (297 | 14.5%), English (279 | 13.6%), European (192 | 9.4%), and Polish (152 | 7.4%), together accounting for 63.3% of all Bedford residents.
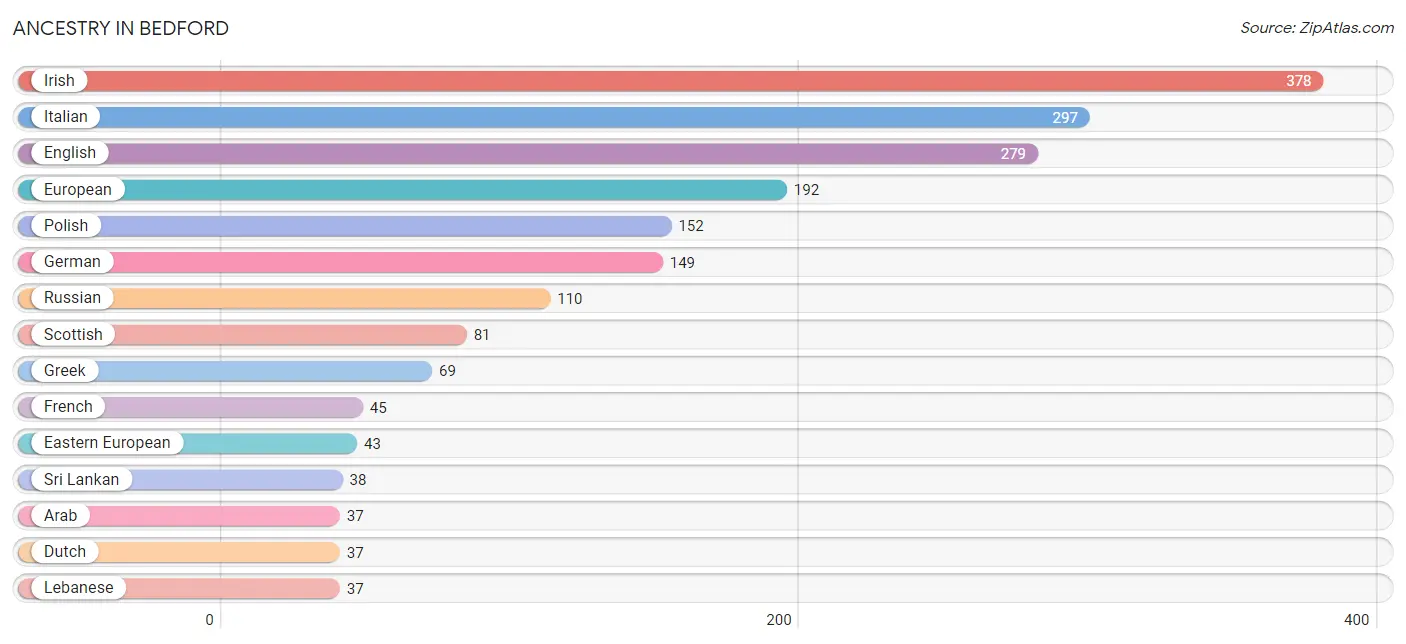
| Ancestry | # Population | % Population |
| American | 24 | 1.2% |
| Arab | 37 | 1.8% |
| Armenian | 9 | 0.4% |
| British | 9 | 0.4% |
| Cuban | 12 | 0.6% |
| Danish | 25 | 1.2% |
| Dominican | 32 | 1.6% |
| Dutch | 37 | 1.8% |
| Eastern European | 43 | 2.1% |
| English | 279 | 13.6% |
| European | 192 | 9.4% |
| French | 45 | 2.2% |
| French Canadian | 26 | 1.3% |
| German | 149 | 7.3% |
| Greek | 69 | 3.4% |
| Hungarian | 8 | 0.4% |
| Indian (Asian) | 35 | 1.7% |
| Irish | 378 | 18.4% |
| Italian | 297 | 14.5% |
| Lebanese | 37 | 1.8% |
| Maltese | 8 | 0.4% |
| Polish | 152 | 7.4% |
| Puerto Rican | 31 | 1.5% |
| Russian | 110 | 5.4% |
| Scandinavian | 25 | 1.2% |
| Scottish | 81 | 4.0% |
| South American | 28 | 1.4% |
| Sri Lankan | 38 | 1.8% |
| Thai | 31 | 1.5% | View All 29 Rows |
Immigrants in Bedford
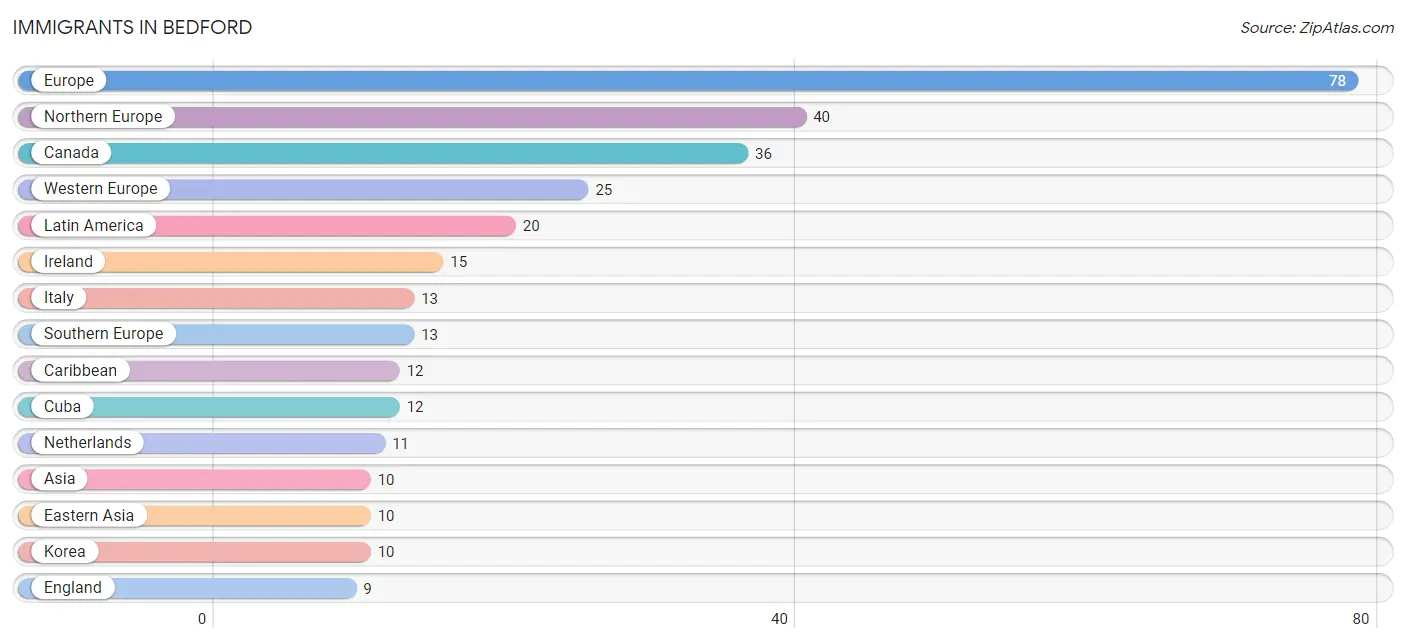
The most numerous immigrant groups reported in Bedford came from Europe (78 | 3.8%), Northern Europe (40 | 1.9%), Canada (36 | 1.8%), Western Europe (25 | 1.2%), and Latin America (20 | 1.0%), together accounting for 9.7% of all Bedford residents.
| Immigration Origin | # Population | % Population |
| Argentina | 8 | 0.4% |
| Asia | 10 | 0.5% |
| Canada | 36 | 1.8% |
| Caribbean | 12 | 0.6% |
| Cuba | 12 | 0.6% |
| Eastern Asia | 10 | 0.5% |
| England | 9 | 0.4% |
| Europe | 78 | 3.8% |
| France | 7 | 0.3% |
| Germany | 7 | 0.3% |
| Ireland | 15 | 0.7% |
| Italy | 13 | 0.6% |
| Korea | 10 | 0.5% |
| Latin America | 20 | 1.0% |
| Netherlands | 11 | 0.5% |
| Northern Europe | 40 | 1.9% |
| South America | 8 | 0.4% |
| Southern Europe | 13 | 0.6% |
| Western Europe | 25 | 1.2% | View All 19 Rows |
Sex and Age in Bedford
Sex and Age in Bedford
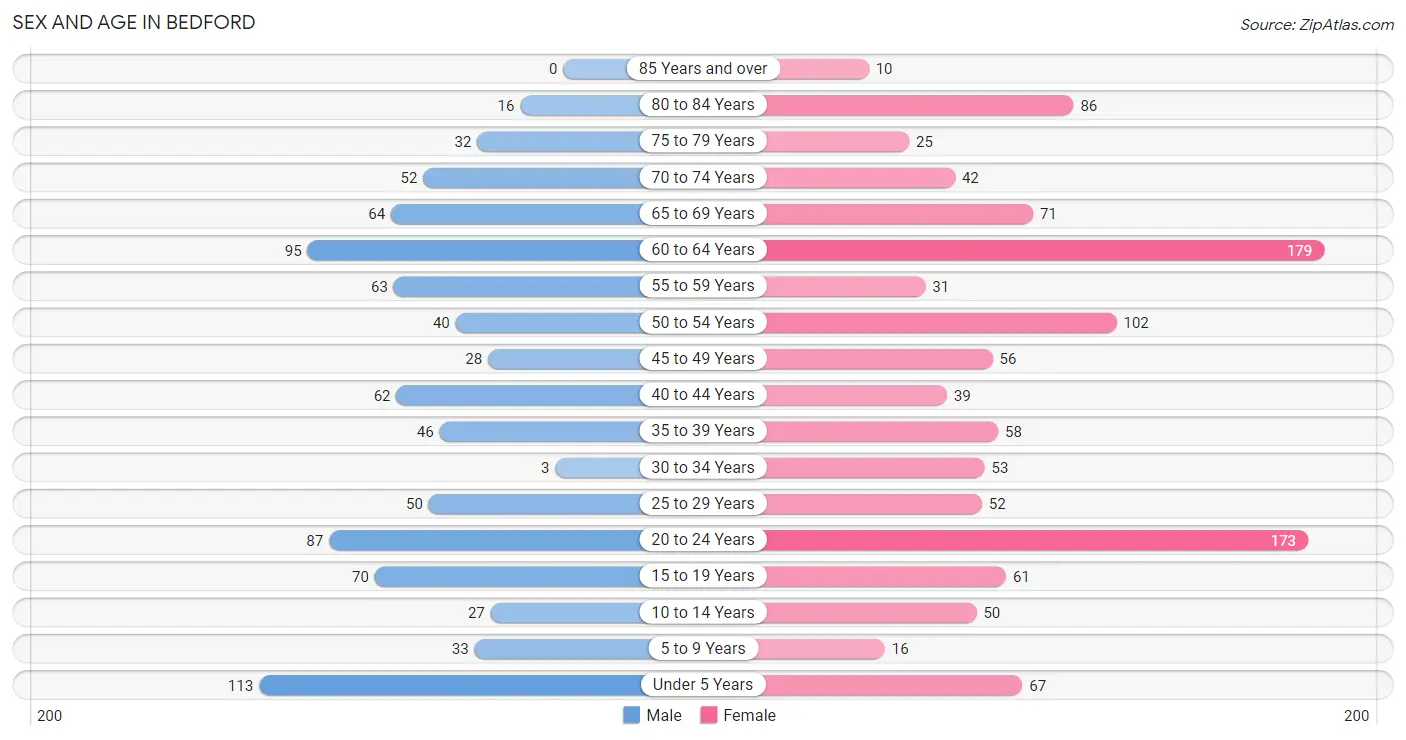
The most populous age groups in Bedford are Under 5 Years (113 | 12.8%) for men and 60 to 64 Years (179 | 15.3%) for women.
| Age Bracket | Male | Female |
| Under 5 Years | 113 (12.8%) | 67 (5.7%) |
| 5 to 9 Years | 33 (3.7%) | 16 (1.4%) |
| 10 to 14 Years | 27 (3.1%) | 50 (4.3%) |
| 15 to 19 Years | 70 (8.0%) | 61 (5.2%) |
| 20 to 24 Years | 87 (9.9%) | 173 (14.8%) |
| 25 to 29 Years | 50 (5.7%) | 52 (4.4%) |
| 30 to 34 Years | 3 (0.3%) | 53 (4.5%) |
| 35 to 39 Years | 46 (5.2%) | 58 (5.0%) |
| 40 to 44 Years | 62 (7.0%) | 39 (3.3%) |
| 45 to 49 Years | 28 (3.2%) | 56 (4.8%) |
| 50 to 54 Years | 40 (4.5%) | 102 (8.7%) |
| 55 to 59 Years | 63 (7.1%) | 31 (2.6%) |
| 60 to 64 Years | 95 (10.8%) | 179 (15.3%) |
| 65 to 69 Years | 64 (7.3%) | 71 (6.1%) |
| 70 to 74 Years | 52 (5.9%) | 42 (3.6%) |
| 75 to 79 Years | 32 (3.6%) | 25 (2.1%) |
| 80 to 84 Years | 16 (1.8%) | 86 (7.3%) |
| 85 Years and over | 0 (0.0%) | 10 (0.9%) |
| Total | 881 (100.0%) | 1,171 (100.0%) |
Families and Households in Bedford
Median Family Size in Bedford
| Family Type | # Families | Family Size |
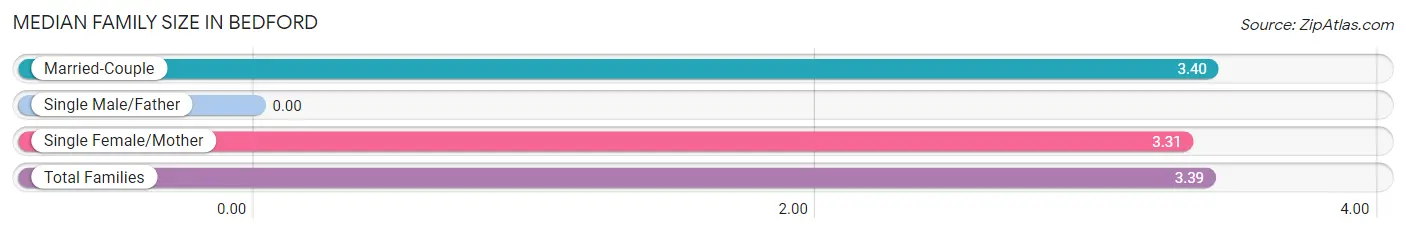
| Married-Couple | 434 (84.0%) | 3.40 |
| Single Male/Father | 0 (0.0%) | - |
| Single Female/Mother | 83 (16.1%) | 3.31 |
| Total Families | 517 (100.0%) | 3.39 |
Median Household Size in Bedford
| Household Type | # Households | Household Size |
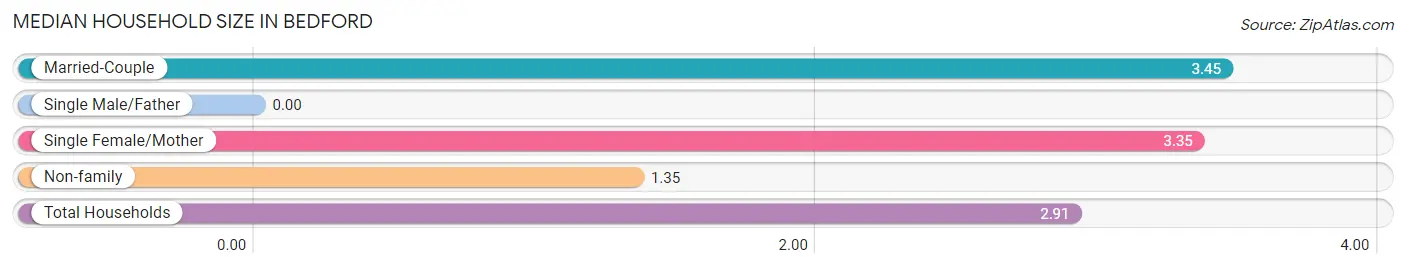
| Married-Couple | 434 (62.7%) | 3.45 |
| Single Male/Father | 0 (0.0%) | - |
| Single Female/Mother | 83 (12.0%) | 3.35 |
| Non-family | 175 (25.3%) | 1.35 |
| Total Households | 692 (100.0%) | 2.91 |
Household Size by Marriage Status in Bedford
Out of a total of 692 households in Bedford, 517 (74.7%) are family households, while 175 (25.3%) are nonfamily households. The most numerous type of family households are 4-person households, comprising 229, and the most common type of nonfamily households are 1-person households, comprising 107.
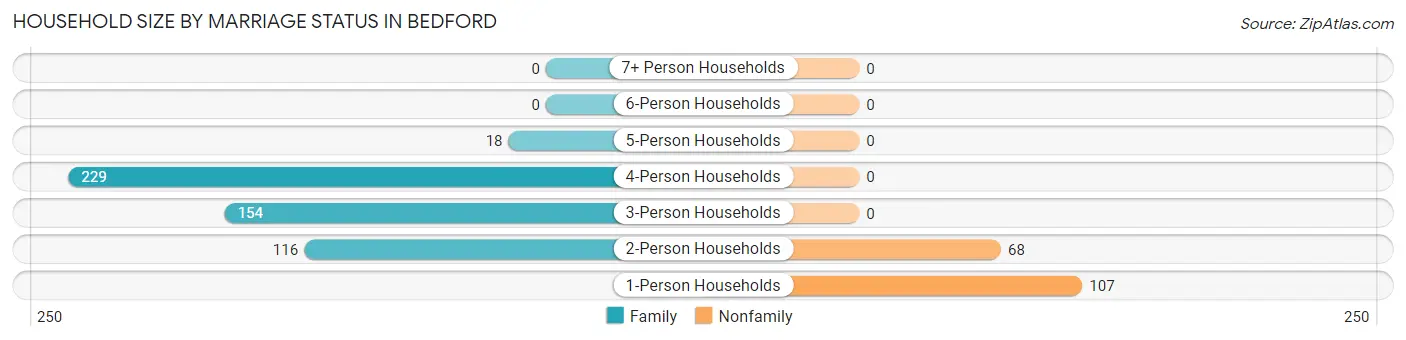
| Household Size | Family Households | Nonfamily Households |
| 1-Person Households | - | 107 (15.5%) |
| 2-Person Households | 116 (16.8%) | 68 (9.8%) |
| 3-Person Households | 154 (22.3%) | 0 (0.0%) |
| 4-Person Households | 229 (33.1%) | 0 (0.0%) |
| 5-Person Households | 18 (2.6%) | 0 (0.0%) |
| 6-Person Households | 0 (0.0%) | 0 (0.0%) |
| 7+ Person Households | 0 (0.0%) | 0 (0.0%) |
| Total | 517 (74.7%) | 175 (25.3%) |
Female Fertility in Bedford
Fertility by Age in Bedford
Average fertility rate in Bedford is 108.0 births per 1,000 women. Women in the age bracket of 35 to 50 years have the highest fertility rate with 268.0 births per 1,000 women. Women in the age bracket of 35 to 50 years acount for 77.4% of all women with births.
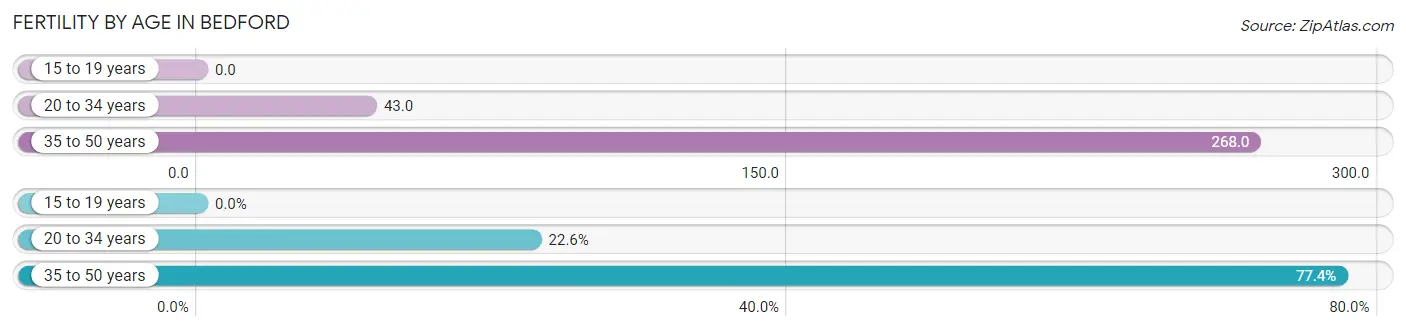
| Age Bracket | Women with Births | Births / 1,000 Women |
| 15 to 19 years | 0 (0.0%) | 0.0 |
| 20 to 34 years | 12 (22.6%) | 43.0 |
| 35 to 50 years | 41 (77.4%) | 268.0 |
| Total | 53 (100.0%) | 108.0 |
Fertility by Age by Marriage Status in Bedford
77.4% of women with births (53) in Bedford are married. The highest percentage of unmarried women with births falls into 20 to 34 years age bracket with 100.0% of them unmarried at the time of birth, while the lowest percentage of unmarried women with births belong to 35 to 50 years age bracket with 0.0% of them unmarried.
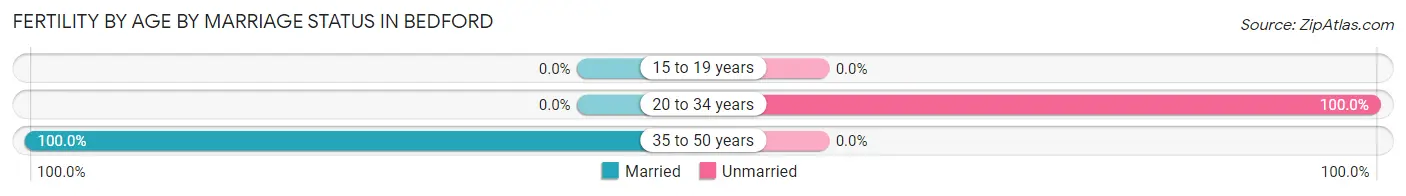
| Age Bracket | Married | Unmarried |
| 15 to 19 years | 0 (0.0%) | 0 (0.0%) |
| 20 to 34 years | 0 (0.0%) | 12 (100.0%) |
| 35 to 50 years | 41 (100.0%) | 0 (0.0%) |
| Total | 41 (77.4%) | 12 (22.6%) |
Fertility by Education in Bedford
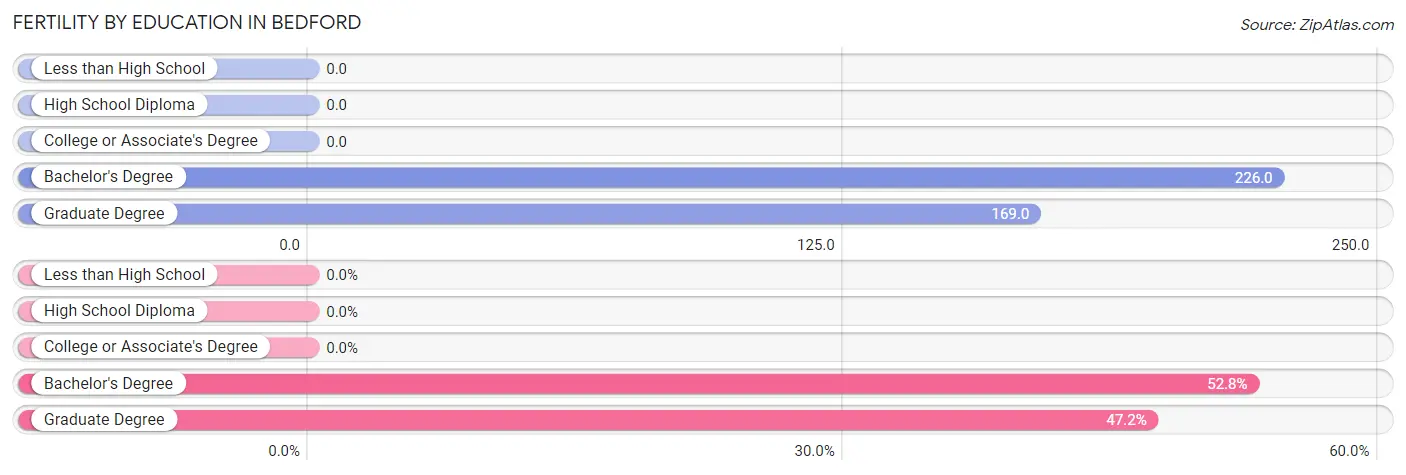
| Educational Attainment | Women with Births | Births / 1,000 Women |
| Less than High School | 0 (0.0%) | 0.0 |
| High School Diploma | 0 (0.0%) | 0.0 |
| College or Associate's Degree | 0 (0.0%) | 0.0 |
| Bachelor's Degree | 28 (52.8%) | 226.0 |
| Graduate Degree | 25 (47.2%) | 169.0 |
| Total | 53 (100.0%) | 108.0 |
Fertility by Education by Marriage Status in Bedford
22.6% of women with births in Bedford are unmarried. Women with the educational attainment of bachelor's degree are most likely to be married with 100.0% of them married at childbirth, while women with the educational attainment of graduate degree are least likely to be married with 48.0% of them unmarried at childbirth.
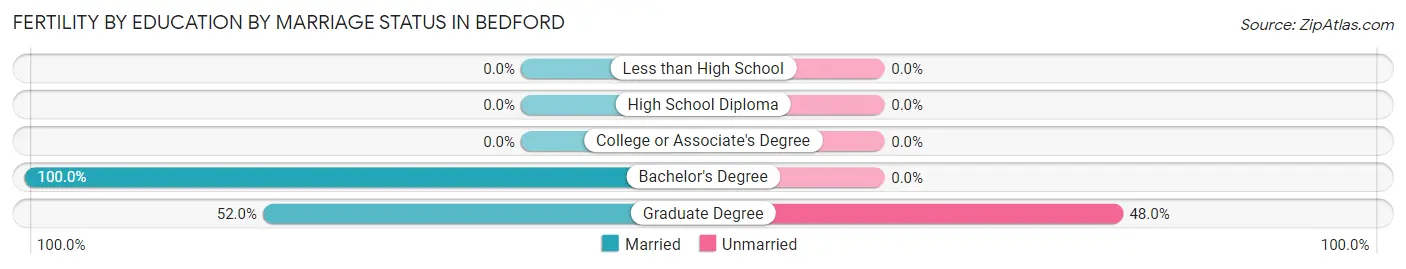
| Educational Attainment | Married | Unmarried |
| Less than High School | 0 (0.0%) | 0 (0.0%) |
| High School Diploma | 0 (0.0%) | 0 (0.0%) |
| College or Associate's Degree | 0 (0.0%) | 0 (0.0%) |
| Bachelor's Degree | 28 (100.0%) | 0 (0.0%) |
| Graduate Degree | 13 (52.0%) | 12 (48.0%) |
| Total | 41 (77.4%) | 12 (22.6%) |
Employment Characteristics in Bedford
Employment by Class of Employer in Bedford
Among the 964 employed individuals in Bedford, private company employees (449 | 46.6%), not-for-profit organizations (174 | 18.0%), and self-employed (incorporated) (112 | 11.6%) make up the most common classes of employment.
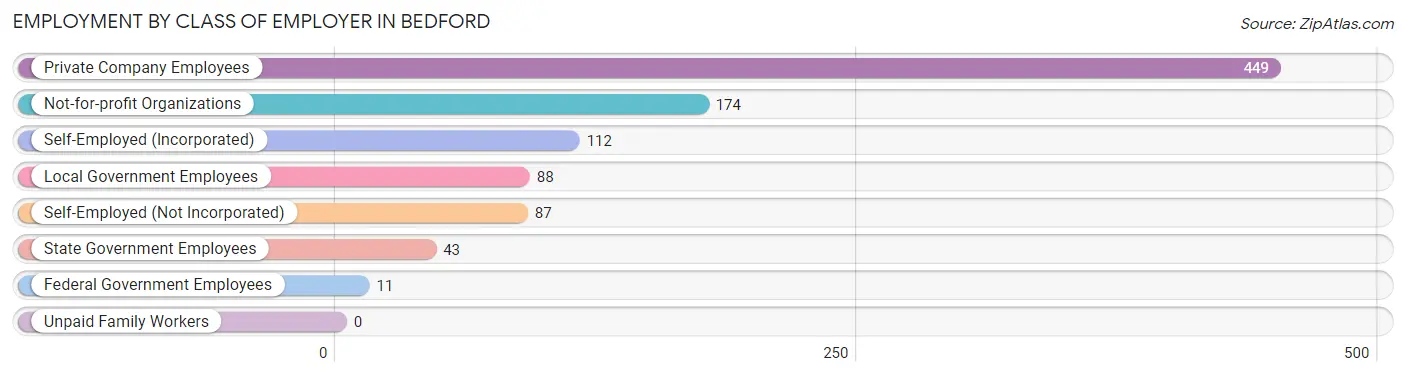
| Employer Class | # Employees | % Employees |
| Private Company Employees | 449 | 46.6% |
| Self-Employed (Incorporated) | 112 | 11.6% |
| Self-Employed (Not Incorporated) | 87 | 9.0% |
| Not-for-profit Organizations | 174 | 18.0% |
| Local Government Employees | 88 | 9.1% |
| State Government Employees | 43 | 4.5% |
| Federal Government Employees | 11 | 1.1% |
| Unpaid Family Workers | 0 | 0.0% |
| Total | 964 | 100.0% |
Employment Status by Age in Bedford
According to the labor force statistics for Bedford, out of the total population over 16 years of age (1,697), 59.3% or 1,006 individuals are in the labor force, with 3.4% or 34 of them unemployed. The age group with the highest labor force participation rate is 25 to 29 years, with 100.0% or 102 individuals in the labor force. Within the labor force, the 20 to 24 years age range has the highest percentage of unemployed individuals, with 16.9% or 24 of them being unemployed.
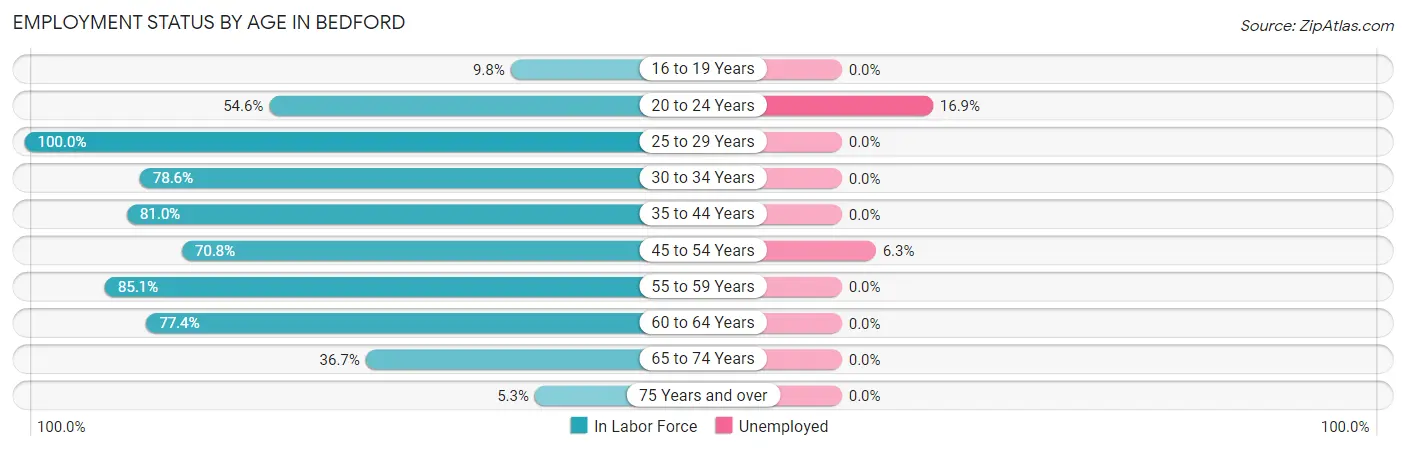
| Age Bracket | In Labor Force | Unemployed |
| 16 to 19 Years | 8 (9.8%) | 0 (0.0%) |
| 20 to 24 Years | 142 (54.6%) | 24 (16.9%) |
| 25 to 29 Years | 102 (100.0%) | 0 (0.0%) |
| 30 to 34 Years | 44 (78.6%) | 0 (0.0%) |
| 35 to 44 Years | 166 (81.0%) | 0 (0.0%) |
| 45 to 54 Years | 160 (70.8%) | 10 (6.3%) |
| 55 to 59 Years | 80 (85.1%) | 0 (0.0%) |
| 60 to 64 Years | 212 (77.4%) | 0 (0.0%) |
| 65 to 74 Years | 84 (36.7%) | 0 (0.0%) |
| 75 Years and over | 9 (5.3%) | 0 (0.0%) |
| Total | 1,006 (59.3%) | 34 (3.4%) |
Employment Status by Educational Attainment in Bedford
According to labor force statistics for Bedford, 79.8% of individuals (764) out of the total population between 25 and 64 years of age (957) are in the labor force, with 1.3% or 10 of them being unemployed. The group with the highest labor force participation rate are those with the educational attainment of college / associate degree, with 100.0% or 59 individuals in the labor force. Within the labor force, individuals with bachelor's degree or higher education have the highest percentage of unemployment, with 1.5% or 10 of them being unemployed.

| Educational Attainment | In Labor Force | Unemployed |
| Less than High School | 0 (0.0%) | 0 (0.0%) |
| High School Diploma | 28 (50.9%) | 0 (0.0%) |
| College / Associate Degree | 59 (100.0%) | 0 (0.0%) |
| Bachelor's Degree or higher | 677 (80.3%) | 13 (1.5%) |
| Total | 764 (79.8%) | 12 (1.3%) |
Employment Occupations by Sex in Bedford
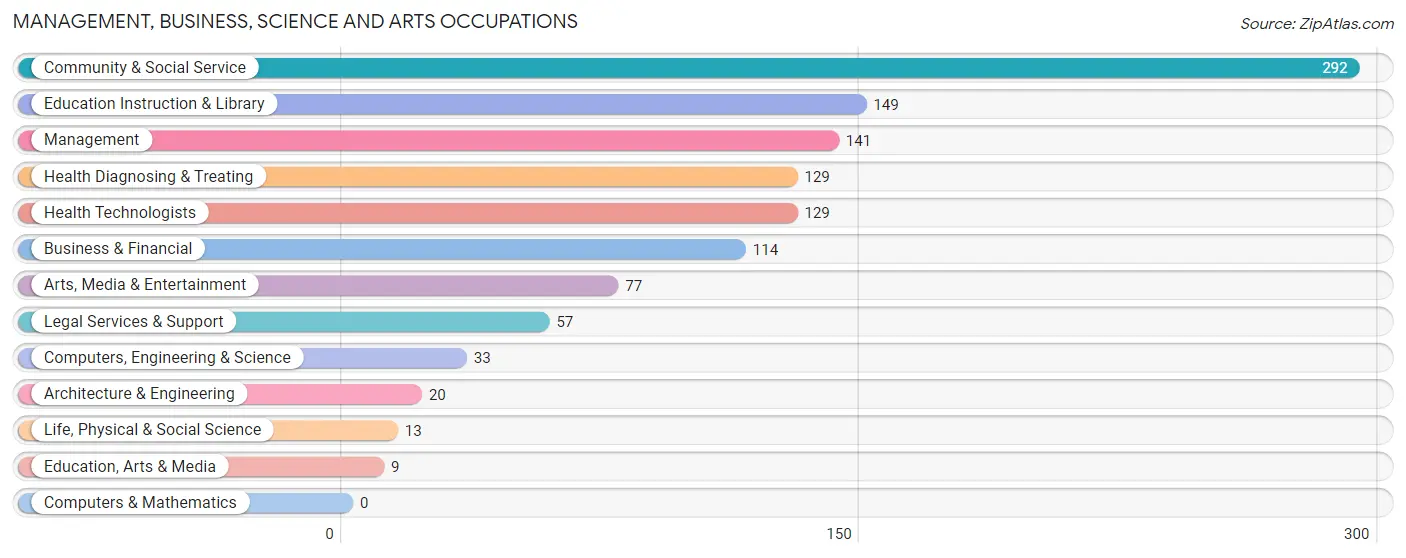
Management, Business, Science and Arts Occupations
The most common Management, Business, Science and Arts occupations in Bedford are Community & Social Service (292 | 30.0%), Education Instruction & Library (149 | 15.3%), Management (141 | 14.5%), Health Diagnosing & Treating (129 | 13.3%), and Health Technologists (129 | 13.3%).
Management, Business, Science and Arts Occupations by Sex
Within the Management, Business, Science and Arts occupations in Bedford, the most male-oriented occupations are Education, Arts & Media (100.0%), Management (76.6%), and Health Diagnosing & Treating (68.2%), while the most female-oriented occupations are Life, Physical & Social Science (100.0%), Education Instruction & Library (88.6%), and Arts, Media & Entertainment (72.7%).
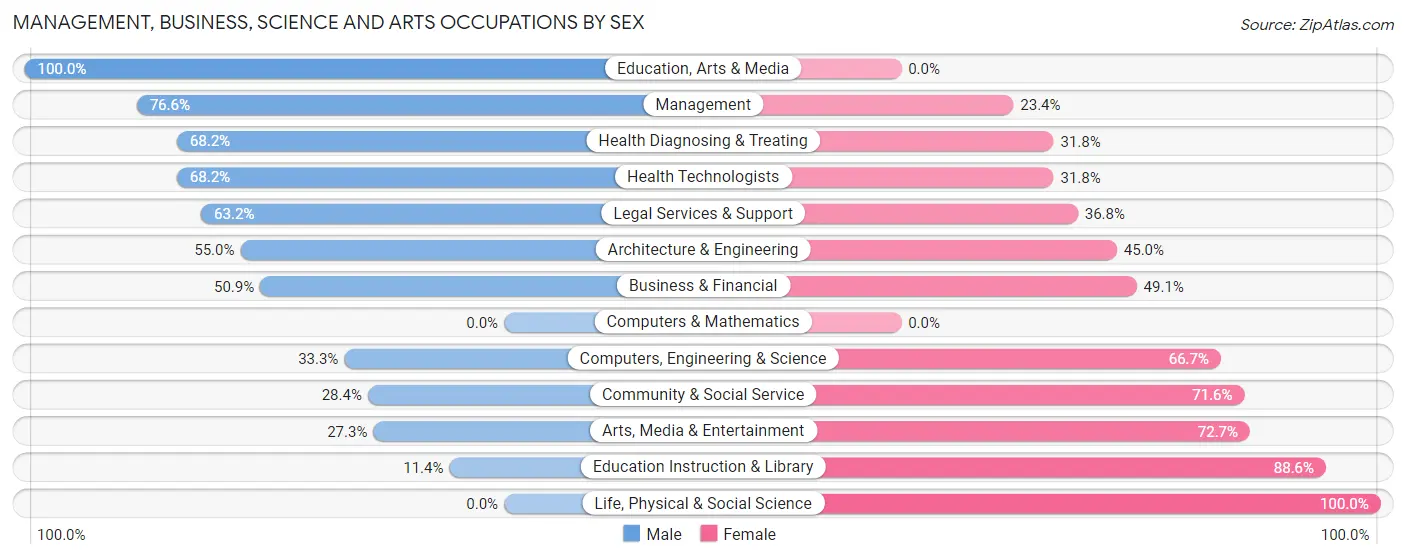
| Occupation | Male | Female |
| Management | 108 (76.6%) | 33 (23.4%) |
| Business & Financial | 58 (50.9%) | 56 (49.1%) |
| Computers, Engineering & Science | 11 (33.3%) | 22 (66.7%) |
| Computers & Mathematics | 0 (0.0%) | 0 (0.0%) |
| Architecture & Engineering | 11 (55.0%) | 9 (45.0%) |
| Life, Physical & Social Science | 0 (0.0%) | 13 (100.0%) |
| Community & Social Service | 83 (28.4%) | 209 (71.6%) |
| Education, Arts & Media | 9 (100.0%) | 0 (0.0%) |
| Legal Services & Support | 36 (63.2%) | 21 (36.8%) |
| Education Instruction & Library | 17 (11.4%) | 132 (88.6%) |
| Arts, Media & Entertainment | 21 (27.3%) | 56 (72.7%) |
| Health Diagnosing & Treating | 88 (68.2%) | 41 (31.8%) |
| Health Technologists | 88 (68.2%) | 41 (31.8%) |
| Total (Category) | 348 (49.1%) | 361 (50.9%) |
| Total (Overall) | 448 (46.0%) | 525 (54.0%) |
Services Occupations
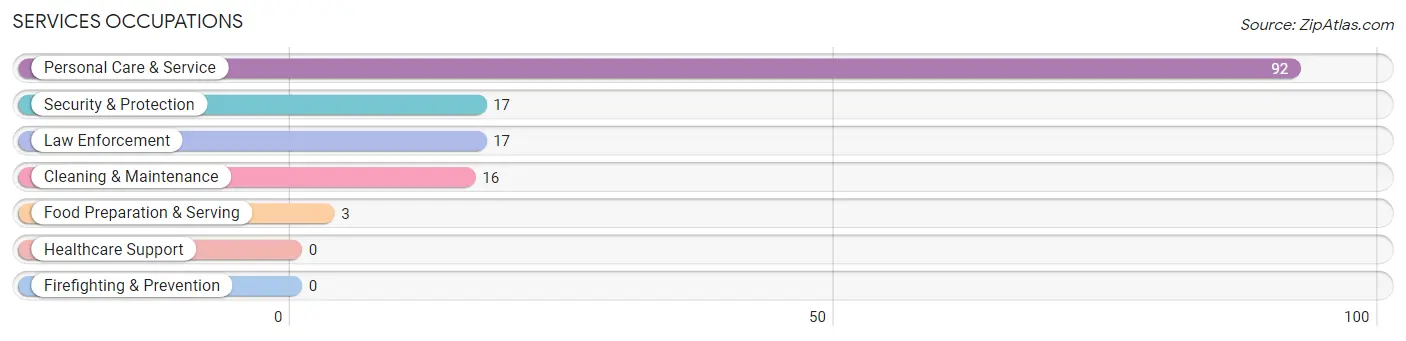
The most common Services occupations in Bedford are Personal Care & Service (92 | 9.5%), Security & Protection (17 | 1.8%), Law Enforcement (17 | 1.8%), Cleaning & Maintenance (16 | 1.6%), and Food Preparation & Serving (3 | 0.3%).
Services Occupations by Sex
Within the Services occupations in Bedford, the most male-oriented occupations are Food Preparation & Serving (100.0%), Cleaning & Maintenance (100.0%), and Personal Care & Service (12.0%), while the most female-oriented occupations are Security & Protection (100.0%), Law Enforcement (100.0%), and Personal Care & Service (88.0%).
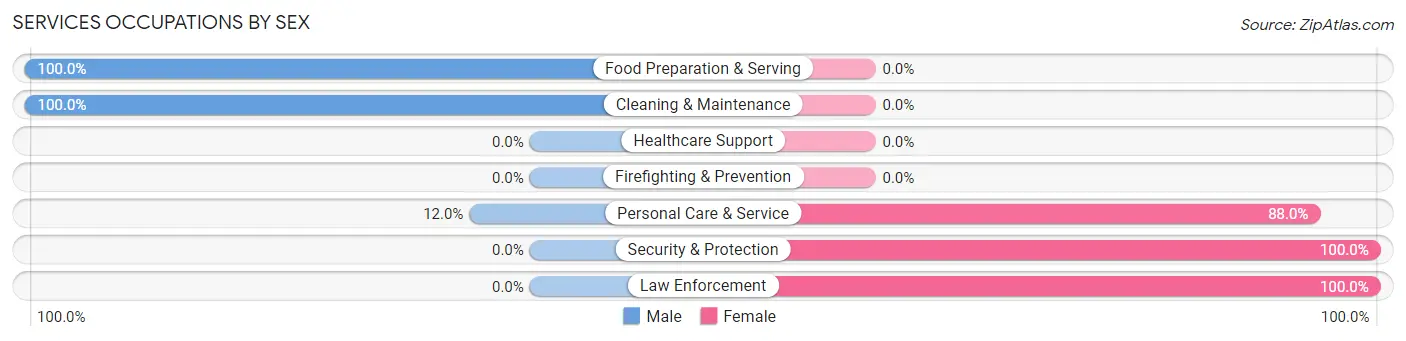
| Occupation | Male | Female |
| Healthcare Support | 0 (0.0%) | 0 (0.0%) |
| Security & Protection | 0 (0.0%) | 17 (100.0%) |
| Firefighting & Prevention | 0 (0.0%) | 0 (0.0%) |
| Law Enforcement | 0 (0.0%) | 17 (100.0%) |
| Food Preparation & Serving | 3 (100.0%) | 0 (0.0%) |
| Cleaning & Maintenance | 16 (100.0%) | 0 (0.0%) |
| Personal Care & Service | 11 (12.0%) | 81 (88.0%) |
| Total (Category) | 30 (23.4%) | 98 (76.6%) |
| Total (Overall) | 448 (46.0%) | 525 (54.0%) |
Sales and Office Occupations
The most common Sales and Office occupations in Bedford are Sales & Related (75 | 7.7%), and Office & Administration (40 | 4.1%).

Sales and Office Occupations by Sex

| Occupation | Male | Female |
| Sales & Related | 49 (65.3%) | 26 (34.7%) |
| Office & Administration | 0 (0.0%) | 40 (100.0%) |
| Total (Category) | 49 (42.6%) | 66 (57.4%) |
| Total (Overall) | 448 (46.0%) | 525 (54.0%) |
Natural Resources, Construction and Maintenance Occupations
The most common Natural Resources, Construction and Maintenance occupations in Bedford are , and Construction & Extraction (9 | 0.9%).

Natural Resources, Construction and Maintenance Occupations by Sex

| Occupation | Male | Female |
| Farming, Fishing & Forestry | 0 (0.0%) | 0 (0.0%) |
| Construction & Extraction | 9 (100.0%) | 0 (0.0%) |
| Installation, Maintenance & Repair | 0 (0.0%) | 0 (0.0%) |
| Total (Category) | 9 (100.0%) | 0 (0.0%) |
| Total (Overall) | 448 (46.0%) | 525 (54.0%) |
Production, Transportation and Moving Occupations
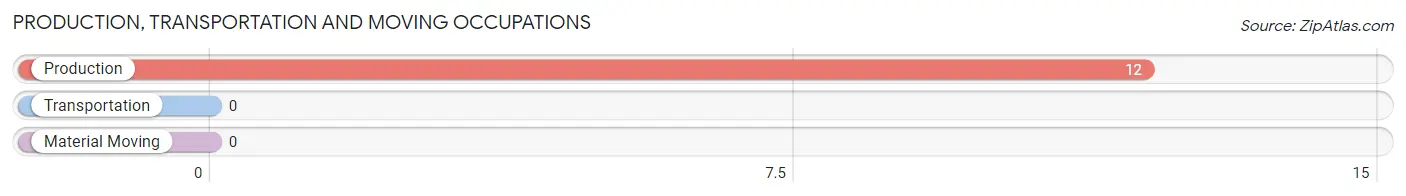
The most common Production, Transportation and Moving occupations in Bedford are , and Production (12 | 1.2%).
Production, Transportation and Moving Occupations by Sex
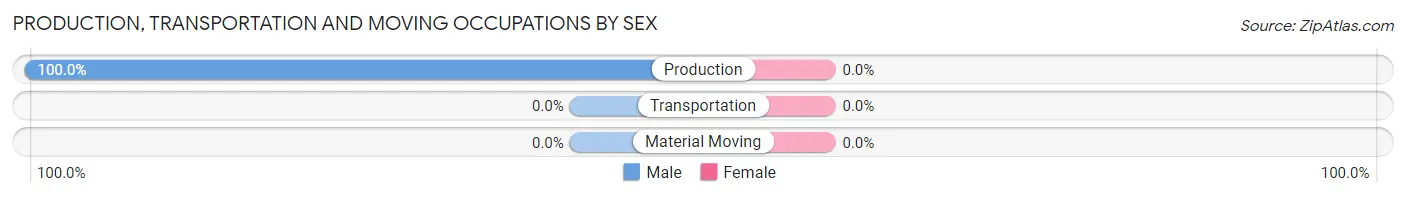
| Occupation | Male | Female |
| Production | 12 (100.0%) | 0 (0.0%) |
| Transportation | 0 (0.0%) | 0 (0.0%) |
| Material Moving | 0 (0.0%) | 0 (0.0%) |
| Total (Category) | 12 (100.0%) | 0 (0.0%) |
| Total (Overall) | 448 (46.0%) | 525 (54.0%) |
Employment Industries by Sex in Bedford
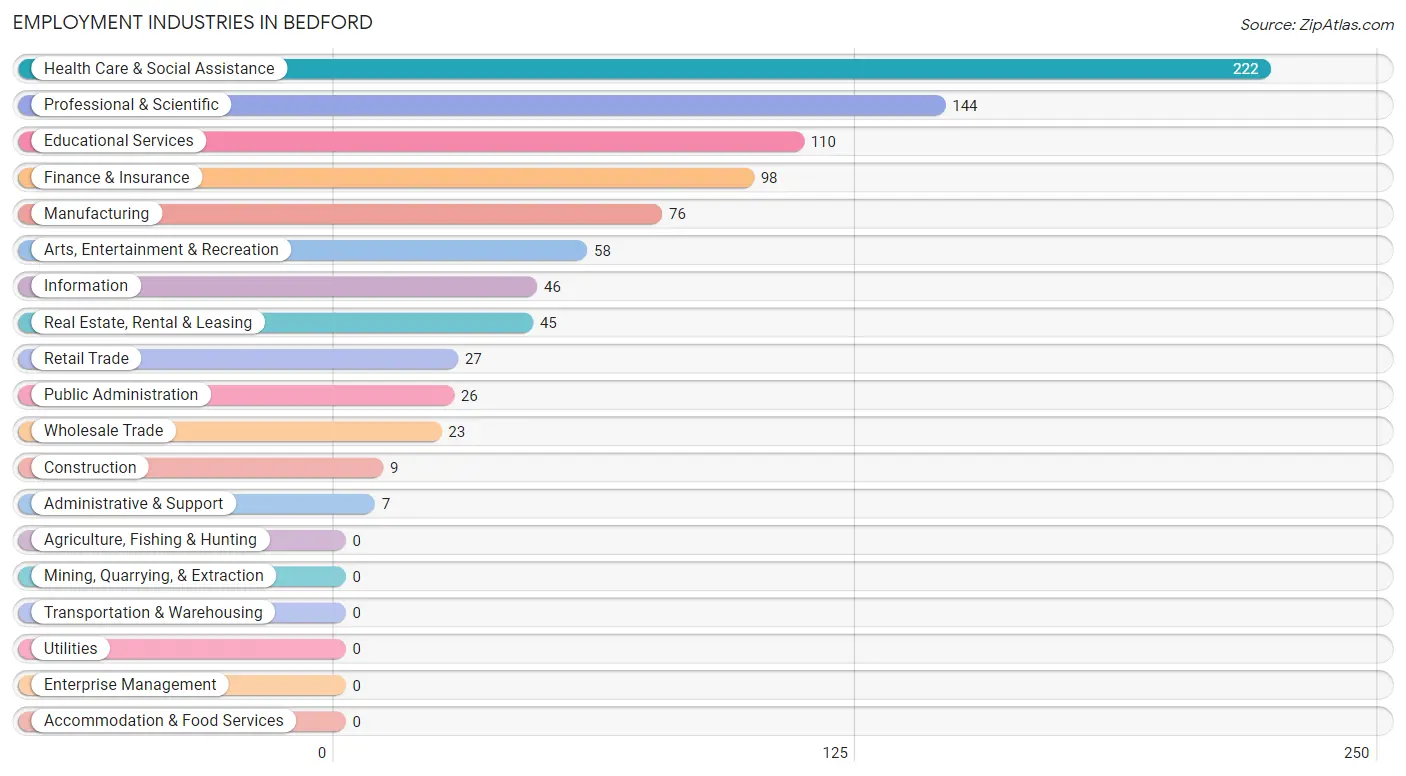
Employment Industries in Bedford
The major employment industries in Bedford include Health Care & Social Assistance (222 | 22.8%), Professional & Scientific (144 | 14.8%), Educational Services (110 | 11.3%), Finance & Insurance (98 | 10.1%), and Manufacturing (76 | 7.8%).
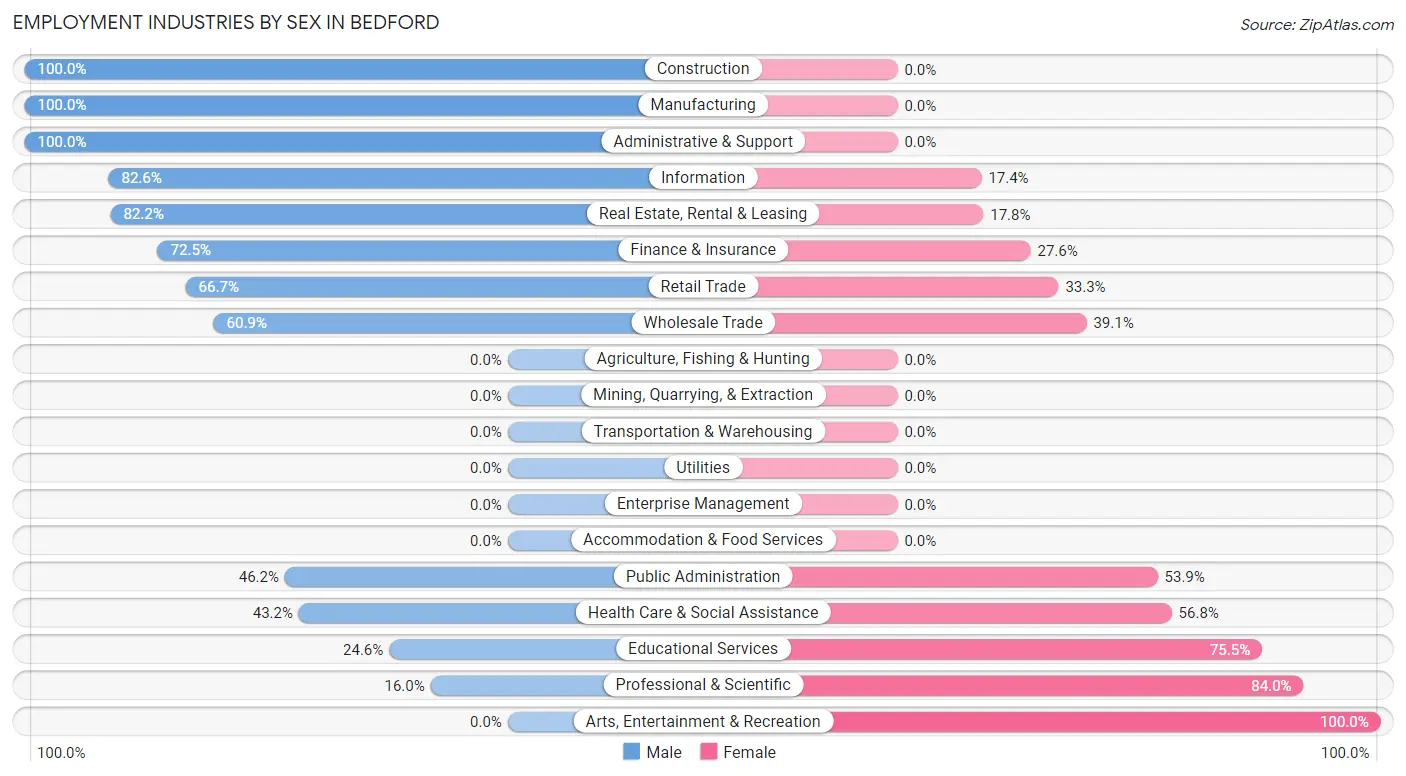
Employment Industries by Sex in Bedford
The Bedford industries that see more men than women are Construction (100.0%), Manufacturing (100.0%), and Administrative & Support (100.0%), whereas the industries that tend to have a higher number of women are Arts, Entertainment & Recreation (100.0%), Professional & Scientific (84.0%), and Educational Services (75.4%).
| Industry | Male | Female |
| Agriculture, Fishing & Hunting | 0 (0.0%) | 0 (0.0%) |
| Mining, Quarrying, & Extraction | 0 (0.0%) | 0 (0.0%) |
| Construction | 9 (100.0%) | 0 (0.0%) |
| Manufacturing | 76 (100.0%) | 0 (0.0%) |
| Wholesale Trade | 14 (60.9%) | 9 (39.1%) |
| Retail Trade | 18 (66.7%) | 9 (33.3%) |
| Transportation & Warehousing | 0 (0.0%) | 0 (0.0%) |
| Utilities | 0 (0.0%) | 0 (0.0%) |
| Information | 38 (82.6%) | 8 (17.4%) |
| Finance & Insurance | 71 (72.5%) | 27 (27.6%) |
| Real Estate, Rental & Leasing | 37 (82.2%) | 8 (17.8%) |
| Professional & Scientific | 23 (16.0%) | 121 (84.0%) |
| Enterprise Management | 0 (0.0%) | 0 (0.0%) |
| Administrative & Support | 7 (100.0%) | 0 (0.0%) |
| Educational Services | 27 (24.5%) | 83 (75.4%) |
| Health Care & Social Assistance | 96 (43.2%) | 126 (56.8%) |
| Arts, Entertainment & Recreation | 0 (0.0%) | 58 (100.0%) |
| Accommodation & Food Services | 0 (0.0%) | 0 (0.0%) |
| Public Administration | 12 (46.2%) | 14 (53.8%) |
| Total | 448 (46.0%) | 525 (54.0%) |
Education in Bedford
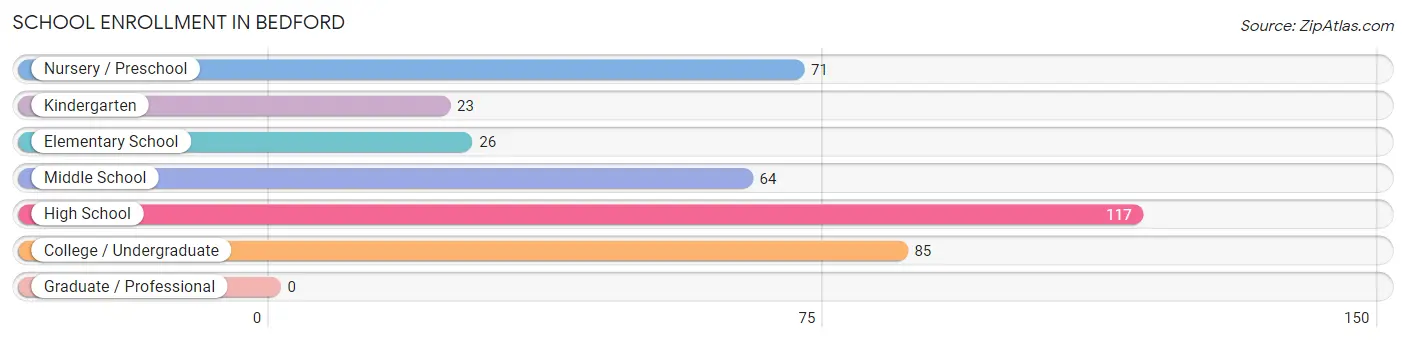
School Enrollment in Bedford
The most common levels of schooling among the 386 students in Bedford are high school (117 | 30.3%), college / undergraduate (85 | 22.0%), and nursery / preschool (71 | 18.4%).
| School Level | # Students | % Students |
| Nursery / Preschool | 71 | 18.4% |
| Kindergarten | 23 | 6.0% |
| Elementary School | 26 | 6.7% |
| Middle School | 64 | 16.6% |
| High School | 117 | 30.3% |
| College / Undergraduate | 85 | 22.0% |
| Graduate / Professional | 0 | 0.0% |
| Total | 386 | 100.0% |
School Enrollment by Age by Funding Source in Bedford
Out of a total of 386 students who are enrolled in schools in Bedford, 197 (51.0%) attend a private institution, while the remaining 189 (49.0%) are enrolled in public schools. The age group of 3 to 4 year olds has the highest likelihood of being enrolled in private schools, with 71 (100.0% in the age bracket) enrolled. Conversely, the age group of 10 to 14 year olds has the lowest likelihood of being enrolled in a private school, with 58 (75.3% in the age bracket) attending a public institution.
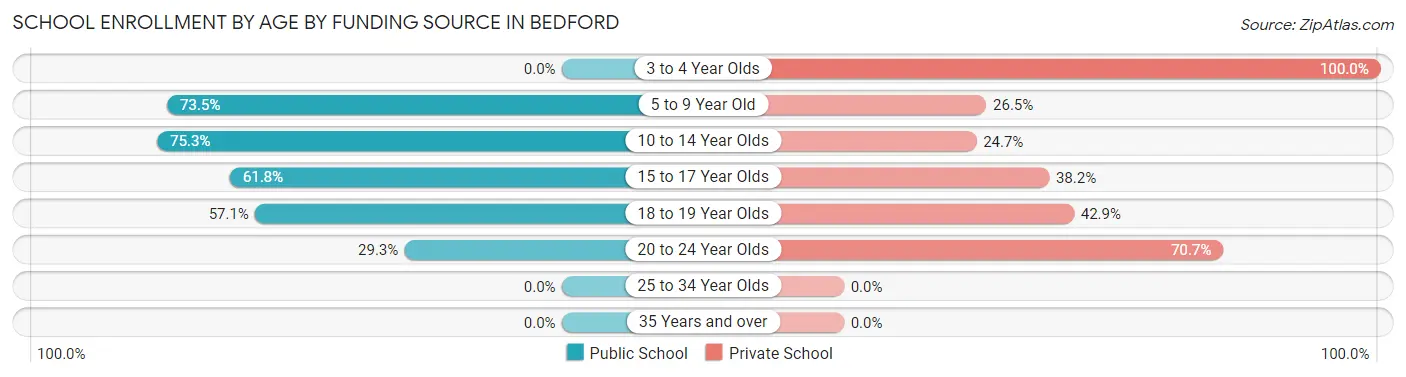
| Age Bracket | Public School | Private School |
| 3 to 4 Year Olds | 0 (0.0%) | 71 (100.0%) |
| 5 to 9 Year Old | 36 (73.5%) | 13 (26.5%) |
| 10 to 14 Year Olds | 58 (75.3%) | 19 (24.7%) |
| 15 to 17 Year Olds | 42 (61.8%) | 26 (38.2%) |
| 18 to 19 Year Olds | 36 (57.1%) | 27 (42.9%) |
| 20 to 24 Year Olds | 17 (29.3%) | 41 (70.7%) |
| 25 to 34 Year Olds | 0 (0.0%) | 0 (0.0%) |
| 35 Years and over | 0 (0.0%) | 0 (0.0%) |
| Total | 189 (49.0%) | 197 (51.0%) |
Educational Attainment by Field of Study in Bedford
Business (269 | 23.1%), social sciences (211 | 18.1%), communications (134 | 11.5%), literature & languages (99 | 8.5%), and psychology (93 | 8.0%) are the most common fields of study among 1,163 individuals in Bedford who have obtained a bachelor's degree or higher.
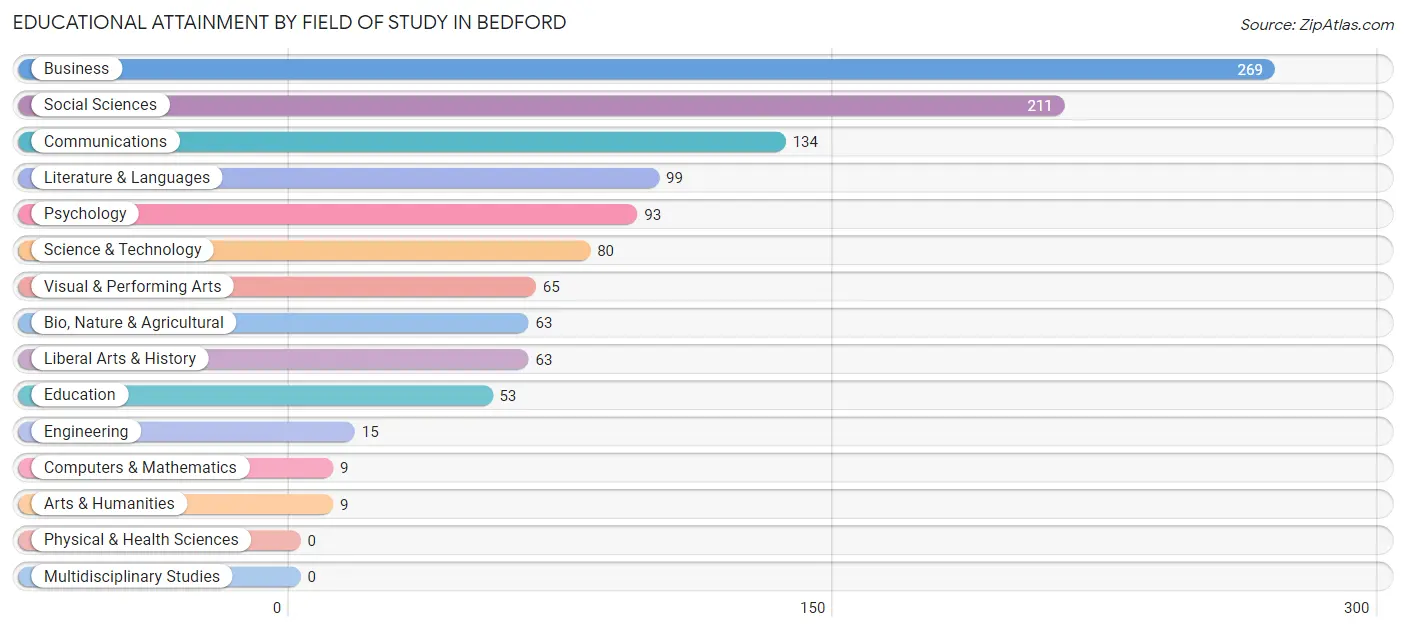
| Field of Study | # Graduates | % Graduates |
| Computers & Mathematics | 9 | 0.8% |
| Bio, Nature & Agricultural | 63 | 5.4% |
| Physical & Health Sciences | 0 | 0.0% |
| Psychology | 93 | 8.0% |
| Social Sciences | 211 | 18.1% |
| Engineering | 15 | 1.3% |
| Multidisciplinary Studies | 0 | 0.0% |
| Science & Technology | 80 | 6.9% |
| Business | 269 | 23.1% |
| Education | 53 | 4.6% |
| Literature & Languages | 99 | 8.5% |
| Liberal Arts & History | 63 | 5.4% |
| Visual & Performing Arts | 65 | 5.6% |
| Communications | 134 | 11.5% |
| Arts & Humanities | 9 | 0.8% |
| Total | 1,163 | 100.0% |
Transportation & Commute in Bedford
Vehicle Availability by Sex in Bedford
The most prevalent vehicle ownership categories in Bedford are males with 2 vehicles (253, accounting for 56.5%) and females with 2 vehicles (268, making up 49.0%).
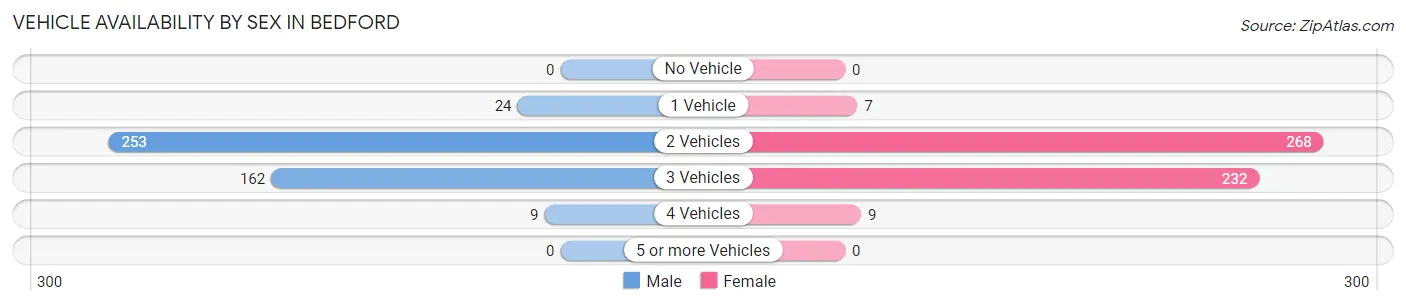
| Vehicles Available | Male | Female |
| No Vehicle | 0 (0.0%) | 0 (0.0%) |
| 1 Vehicle | 24 (5.4%) | 7 (1.4%) |
| 2 Vehicles | 253 (56.5%) | 268 (51.9%) |
| 3 Vehicles | 162 (36.2%) | 232 (45.0%) |
| 4 Vehicles | 9 (2.0%) | 9 (1.7%) |
| 5 or more Vehicles | 0 (0.0%) | 0 (0.0%) |
| Total | 448 (100.0%) | 516 (100.0%) |
Commute Time in Bedford
The most frequently occuring commute durations in Bedford are 10 to 14 minutes (115 commuters, 17.4%), 90 or more minutes (91 commuters, 13.8%), and 45 to 59 minutes (85 commuters, 12.9%).
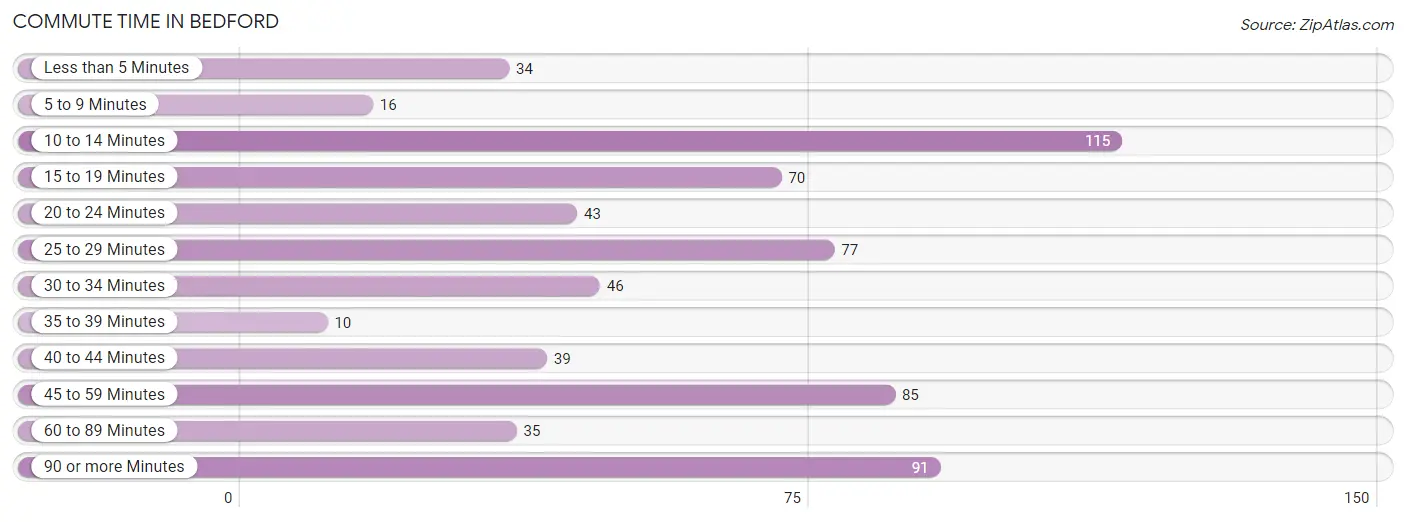
| Commute Time | # Commuters | % Commuters |
| Less than 5 Minutes | 34 | 5.1% |
| 5 to 9 Minutes | 16 | 2.4% |
| 10 to 14 Minutes | 115 | 17.4% |
| 15 to 19 Minutes | 70 | 10.6% |
| 20 to 24 Minutes | 43 | 6.5% |
| 25 to 29 Minutes | 77 | 11.7% |
| 30 to 34 Minutes | 46 | 7.0% |
| 35 to 39 Minutes | 10 | 1.5% |
| 40 to 44 Minutes | 39 | 5.9% |
| 45 to 59 Minutes | 85 | 12.9% |
| 60 to 89 Minutes | 35 | 5.3% |
| 90 or more Minutes | 91 | 13.8% |
Commute Time by Sex in Bedford
The most common commute times in Bedford are 90 or more minutes (82 commuters, 23.0%) for males and 10 to 14 minutes (84 commuters, 27.6%) for females.
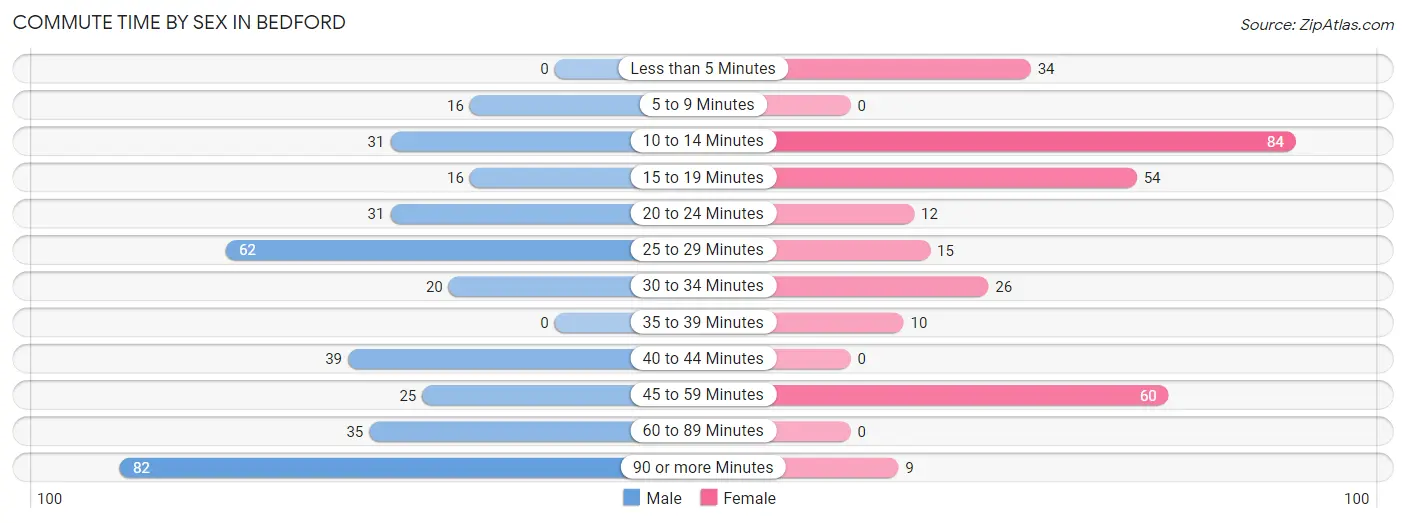
| Commute Time | Male | Female |
| Less than 5 Minutes | 0 (0.0%) | 34 (11.2%) |
| 5 to 9 Minutes | 16 (4.5%) | 0 (0.0%) |
| 10 to 14 Minutes | 31 (8.7%) | 84 (27.6%) |
| 15 to 19 Minutes | 16 (4.5%) | 54 (17.8%) |
| 20 to 24 Minutes | 31 (8.7%) | 12 (4.0%) |
| 25 to 29 Minutes | 62 (17.4%) | 15 (4.9%) |
| 30 to 34 Minutes | 20 (5.6%) | 26 (8.6%) |
| 35 to 39 Minutes | 0 (0.0%) | 10 (3.3%) |
| 40 to 44 Minutes | 39 (10.9%) | 0 (0.0%) |
| 45 to 59 Minutes | 25 (7.0%) | 60 (19.7%) |
| 60 to 89 Minutes | 35 (9.8%) | 0 (0.0%) |
| 90 or more Minutes | 82 (23.0%) | 9 (3.0%) |
Time of Departure to Work by Sex in Bedford
The most frequent times of departure to work in Bedford are 6:30 AM to 6:59 AM (96, 26.9%) for males and 9:00 AM to 9:59 AM (59, 19.4%) for females.
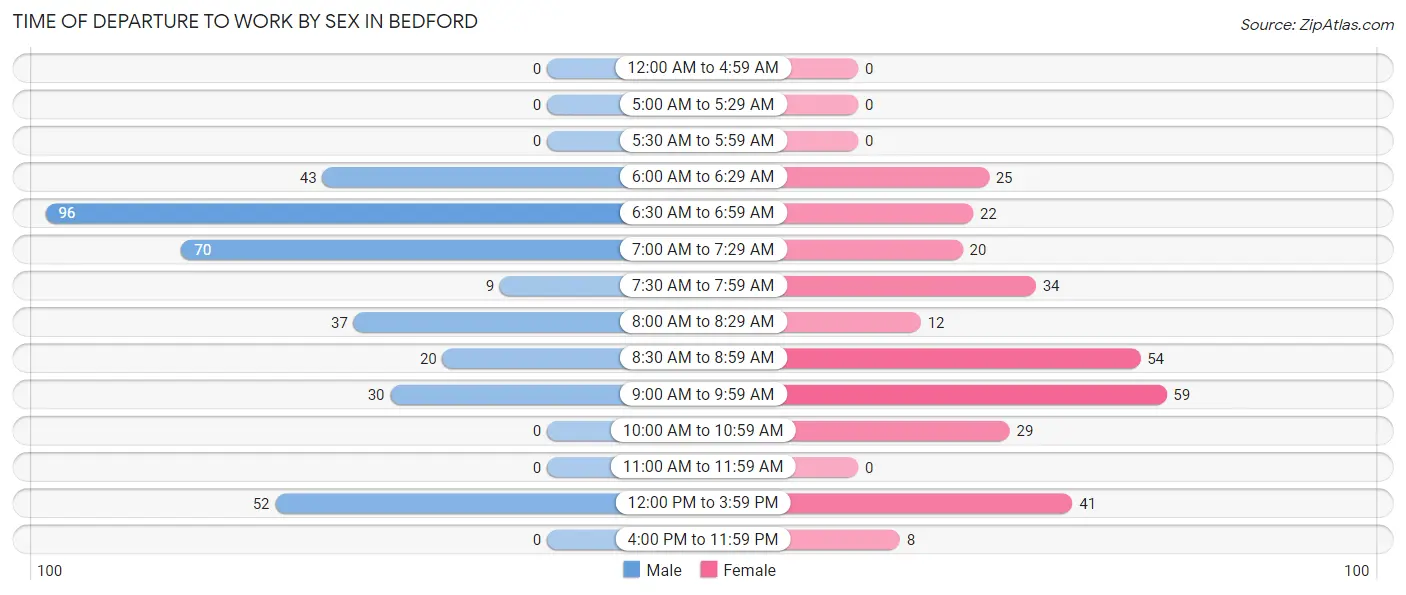
| Time of Departure | Male | Female |
| 12:00 AM to 4:59 AM | 0 (0.0%) | 0 (0.0%) |
| 5:00 AM to 5:29 AM | 0 (0.0%) | 0 (0.0%) |
| 5:30 AM to 5:59 AM | 0 (0.0%) | 0 (0.0%) |
| 6:00 AM to 6:29 AM | 43 (12.0%) | 25 (8.2%) |
| 6:30 AM to 6:59 AM | 96 (26.9%) | 22 (7.2%) |
| 7:00 AM to 7:29 AM | 70 (19.6%) | 20 (6.6%) |
| 7:30 AM to 7:59 AM | 9 (2.5%) | 34 (11.2%) |
| 8:00 AM to 8:29 AM | 37 (10.4%) | 12 (4.0%) |
| 8:30 AM to 8:59 AM | 20 (5.6%) | 54 (17.8%) |
| 9:00 AM to 9:59 AM | 30 (8.4%) | 59 (19.4%) |
| 10:00 AM to 10:59 AM | 0 (0.0%) | 29 (9.5%) |
| 11:00 AM to 11:59 AM | 0 (0.0%) | 0 (0.0%) |
| 12:00 PM to 3:59 PM | 52 (14.6%) | 41 (13.5%) |
| 4:00 PM to 11:59 PM | 0 (0.0%) | 8 (2.6%) |
| Total | 357 (100.0%) | 304 (100.0%) |
Housing Occupancy in Bedford
Occupancy by Ownership in Bedford
Of the total 692 dwellings in Bedford, owner-occupied units account for 675 (97.5%), while renter-occupied units make up 17 (2.5%).
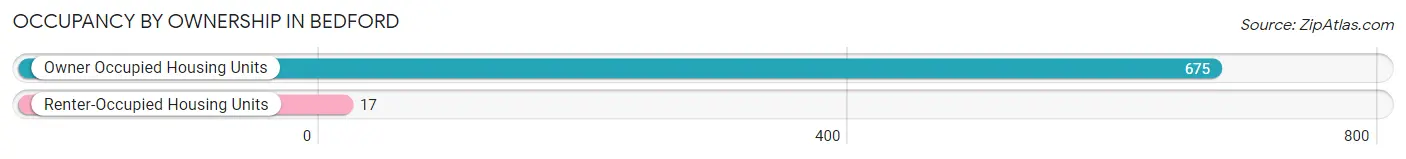
| Occupancy | # Housing Units | % Housing Units |
| Owner Occupied Housing Units | 675 | 97.5% |
| Renter-Occupied Housing Units | 17 | 2.5% |
| Total Occupied Housing Units | 692 | 100.0% |
Occupancy by Household Size in Bedford
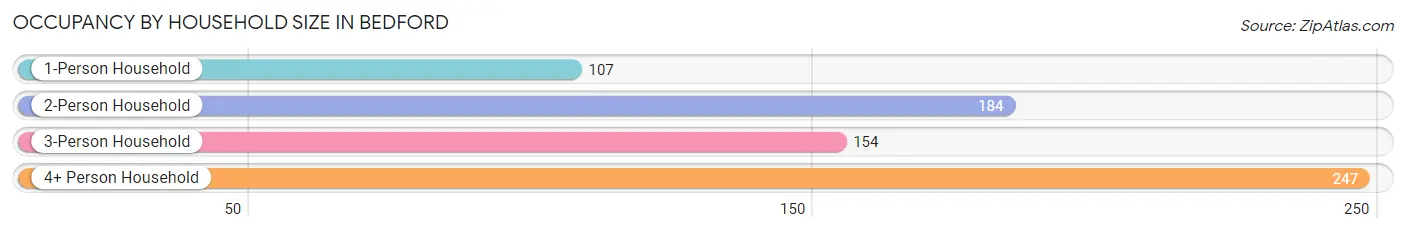
| Household Size | # Housing Units | % Housing Units |
| 1-Person Household | 107 | 15.5% |
| 2-Person Household | 184 | 26.6% |
| 3-Person Household | 154 | 22.3% |
| 4+ Person Household | 247 | 35.7% |
| Total Housing Units | 692 | 100.0% |
Occupancy by Ownership by Household Size in Bedford
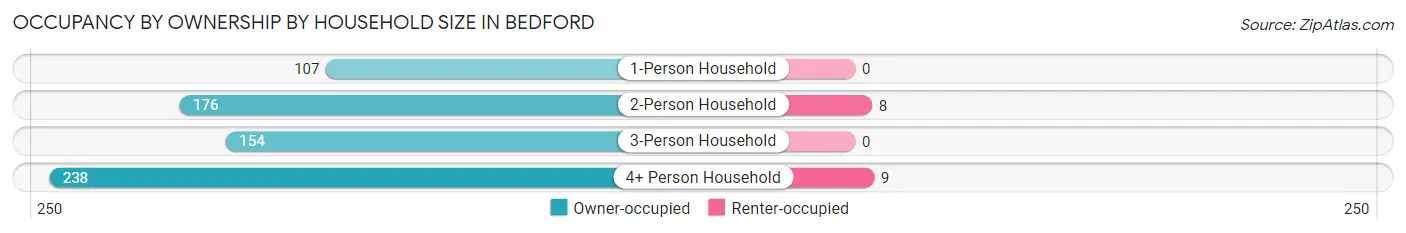
| Household Size | Owner-occupied | Renter-occupied |
| 1-Person Household | 107 (100.0%) | 0 (0.0%) |
| 2-Person Household | 176 (95.7%) | 8 (4.3%) |
| 3-Person Household | 154 (100.0%) | 0 (0.0%) |
| 4+ Person Household | 238 (96.4%) | 9 (3.6%) |
| Total Housing Units | 675 (97.5%) | 17 (2.5%) |
Occupancy by Educational Attainment in Bedford
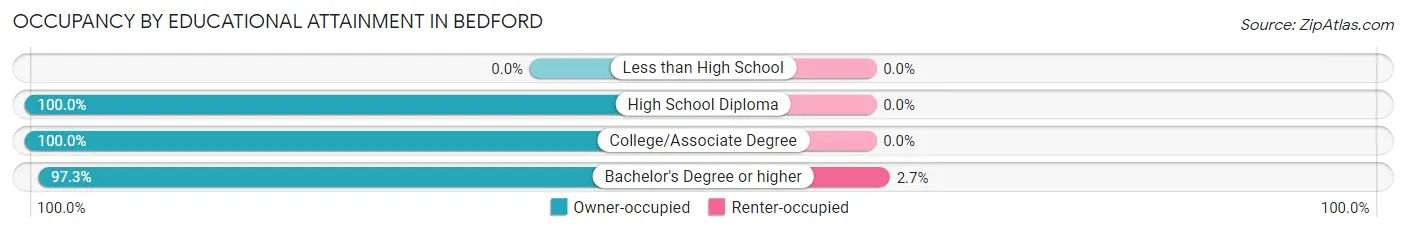
| Household Size | Owner-occupied | Renter-occupied |
| Less than High School | 0 (0.0%) | 0 (0.0%) |
| High School Diploma | 20 (100.0%) | 0 (0.0%) |
| College/Associate Degree | 38 (100.0%) | 0 (0.0%) |
| Bachelor's Degree or higher | 617 (97.3%) | 17 (2.7%) |
Occupancy by Age of Householder in Bedford
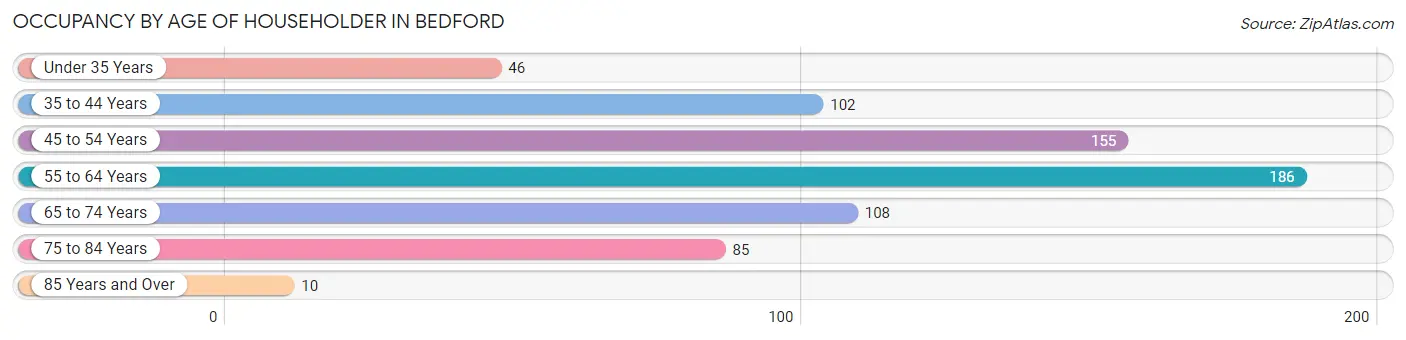
| Age Bracket | # Households | % Households |
| Under 35 Years | 46 | 6.7% |
| 35 to 44 Years | 102 | 14.7% |
| 45 to 54 Years | 155 | 22.4% |
| 55 to 64 Years | 186 | 26.9% |
| 65 to 74 Years | 108 | 15.6% |
| 75 to 84 Years | 85 | 12.3% |
| 85 Years and Over | 10 | 1.5% |
| Total | 692 | 100.0% |
Housing Finances in Bedford
Median Income by Occupancy in Bedford
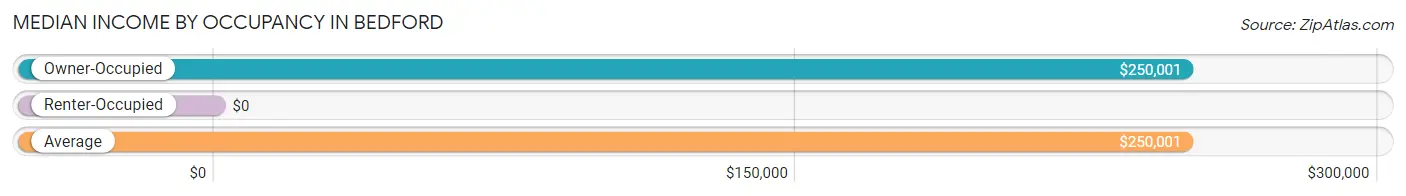
| Occupancy Type | # Households | Median Income |
| Owner-Occupied | 675 (97.5%) | $250,001 |
| Renter-Occupied | 17 (2.5%) | $0 |
| Average | 692 (100.0%) | $250,001 |
Occupancy by Householder Income Bracket in Bedford
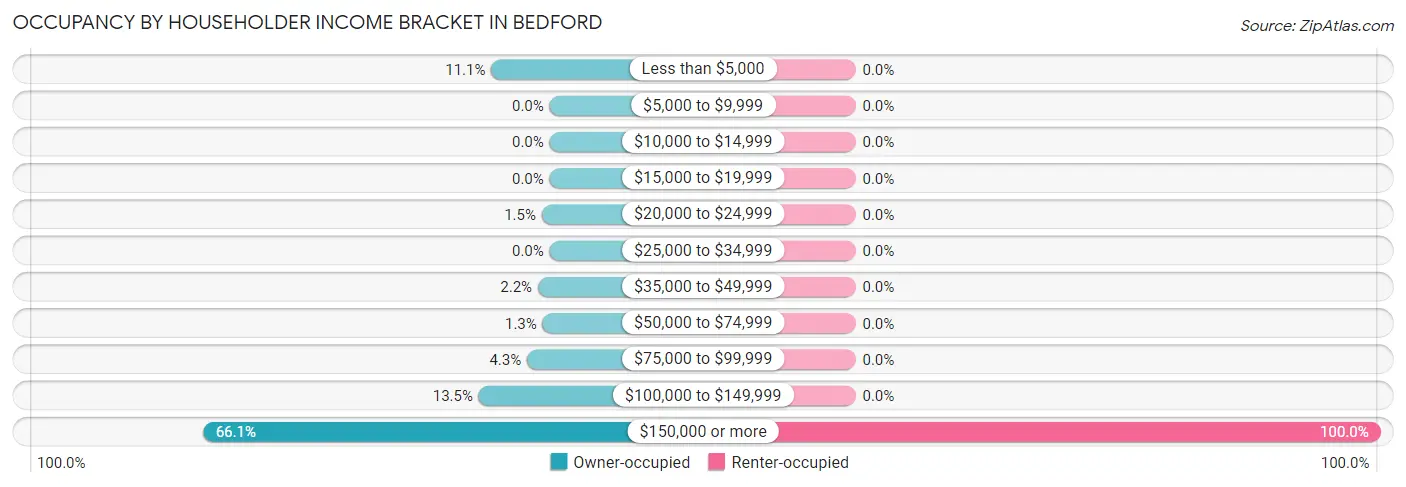
| Income Bracket | Owner-occupied | Renter-occupied |
| Less than $5,000 | 75 (11.1%) | 0 (0.0%) |
| $5,000 to $9,999 | 0 (0.0%) | 0 (0.0%) |
| $10,000 to $14,999 | 0 (0.0%) | 0 (0.0%) |
| $15,000 to $19,999 | 0 (0.0%) | 0 (0.0%) |
| $20,000 to $24,999 | 10 (1.5%) | 0 (0.0%) |
| $25,000 to $34,999 | 0 (0.0%) | 0 (0.0%) |
| $35,000 to $49,999 | 15 (2.2%) | 0 (0.0%) |
| $50,000 to $74,999 | 9 (1.3%) | 0 (0.0%) |
| $75,000 to $99,999 | 29 (4.3%) | 0 (0.0%) |
| $100,000 to $149,999 | 91 (13.5%) | 0 (0.0%) |
| $150,000 or more | 446 (66.1%) | 17 (100.0%) |
| Total | 675 (100.0%) | 17 (100.0%) |
Monthly Housing Cost Tiers in Bedford
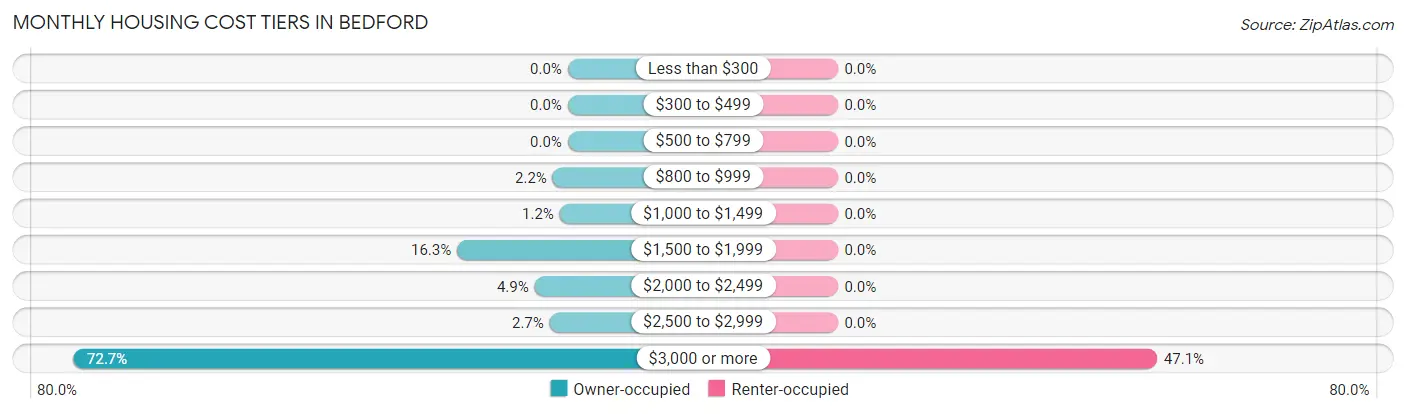
| Monthly Cost | Owner-occupied | Renter-occupied |
| Less than $300 | 0 (0.0%) | 0 (0.0%) |
| $300 to $499 | 0 (0.0%) | 0 (0.0%) |
| $500 to $799 | 0 (0.0%) | 0 (0.0%) |
| $800 to $999 | 15 (2.2%) | 0 (0.0%) |
| $1,000 to $1,499 | 8 (1.2%) | 0 (0.0%) |
| $1,500 to $1,999 | 110 (16.3%) | 0 (0.0%) |
| $2,000 to $2,499 | 33 (4.9%) | 0 (0.0%) |
| $2,500 to $2,999 | 18 (2.7%) | 0 (0.0%) |
| $3,000 or more | 491 (72.7%) | 8 (47.1%) |
| Total | 675 (100.0%) | 17 (100.0%) |
Physical Housing Characteristics in Bedford
Housing Structures in Bedford
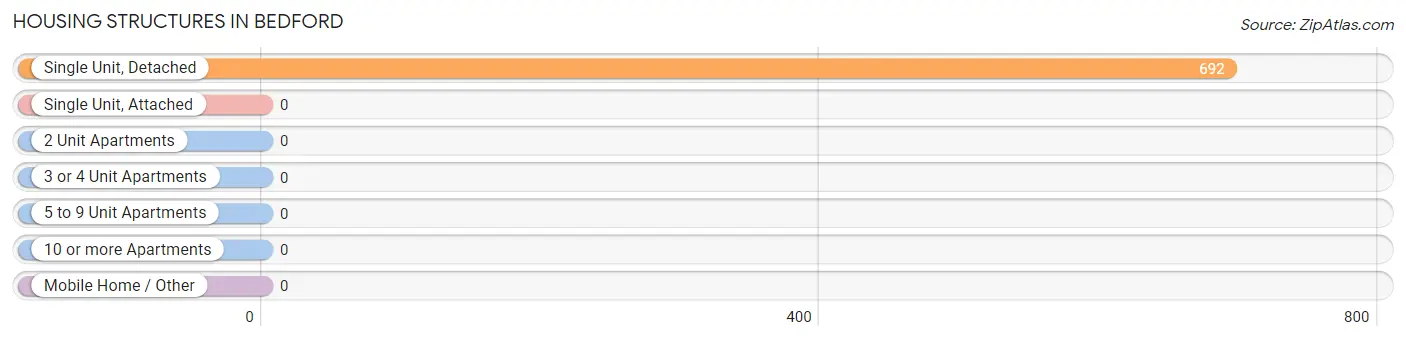
| Structure Type | # Housing Units | % Housing Units |
| Single Unit, Detached | 692 | 100.0% |
| Single Unit, Attached | 0 | 0.0% |
| 2 Unit Apartments | 0 | 0.0% |
| 3 or 4 Unit Apartments | 0 | 0.0% |
| 5 to 9 Unit Apartments | 0 | 0.0% |
| 10 or more Apartments | 0 | 0.0% |
| Mobile Home / Other | 0 | 0.0% |
| Total | 692 | 100.0% |
Housing Structures by Occupancy in Bedford
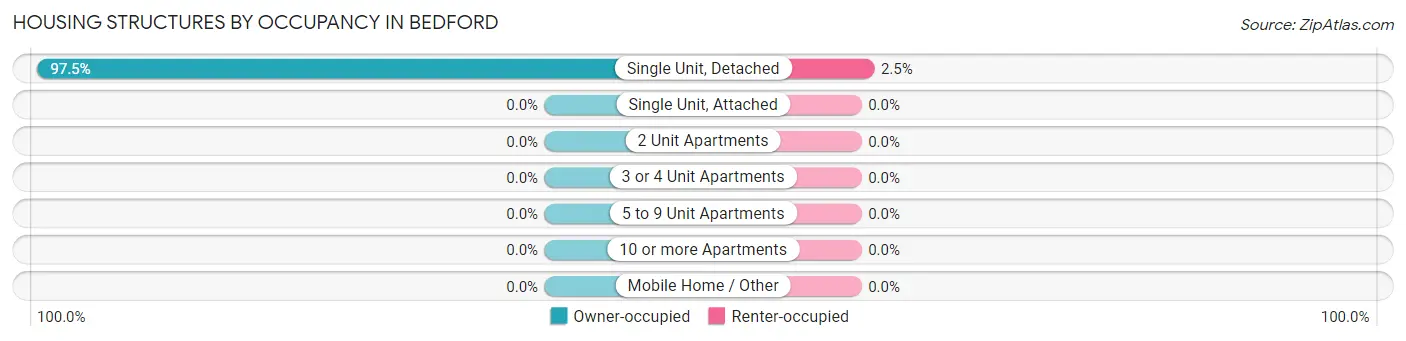
| Structure Type | Owner-occupied | Renter-occupied |
| Single Unit, Detached | 675 (97.5%) | 17 (2.5%) |
| Single Unit, Attached | 0 (0.0%) | 0 (0.0%) |
| 2 Unit Apartments | 0 (0.0%) | 0 (0.0%) |
| 3 or 4 Unit Apartments | 0 (0.0%) | 0 (0.0%) |
| 5 to 9 Unit Apartments | 0 (0.0%) | 0 (0.0%) |
| 10 or more Apartments | 0 (0.0%) | 0 (0.0%) |
| Mobile Home / Other | 0 (0.0%) | 0 (0.0%) |
| Total | 675 (97.5%) | 17 (2.5%) |
Housing Structures by Number of Rooms in Bedford
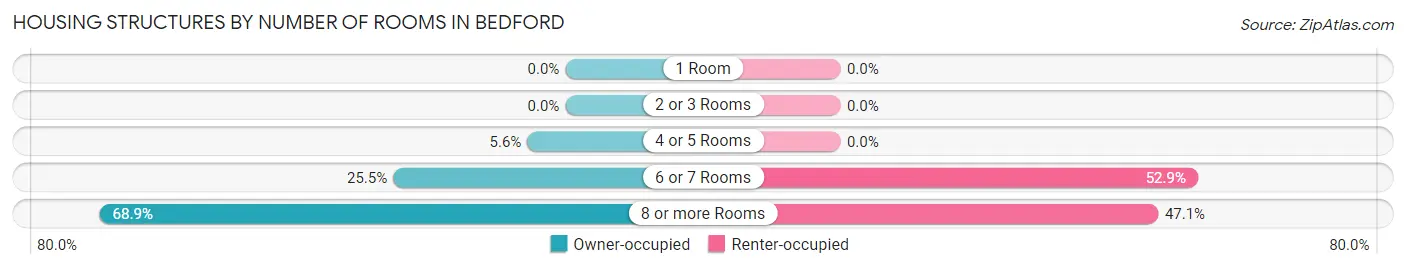
| Number of Rooms | Owner-occupied | Renter-occupied |
| 1 Room | 0 (0.0%) | 0 (0.0%) |
| 2 or 3 Rooms | 0 (0.0%) | 0 (0.0%) |
| 4 or 5 Rooms | 38 (5.6%) | 0 (0.0%) |
| 6 or 7 Rooms | 172 (25.5%) | 9 (52.9%) |
| 8 or more Rooms | 465 (68.9%) | 8 (47.1%) |
| Total | 675 (100.0%) | 17 (100.0%) |
Housing Structure by Heating Type in Bedford
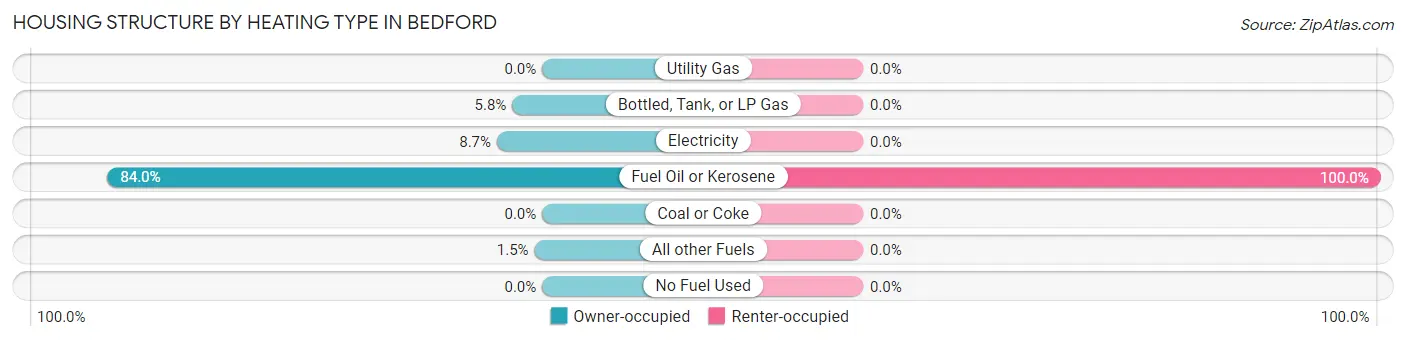
| Heating Type | Owner-occupied | Renter-occupied |
| Utility Gas | 0 (0.0%) | 0 (0.0%) |
| Bottled, Tank, or LP Gas | 39 (5.8%) | 0 (0.0%) |
| Electricity | 59 (8.7%) | 0 (0.0%) |
| Fuel Oil or Kerosene | 567 (84.0%) | 17 (100.0%) |
| Coal or Coke | 0 (0.0%) | 0 (0.0%) |
| All other Fuels | 10 (1.5%) | 0 (0.0%) |
| No Fuel Used | 0 (0.0%) | 0 (0.0%) |
| Total | 675 (100.0%) | 17 (100.0%) |
Household Vehicle Usage in Bedford
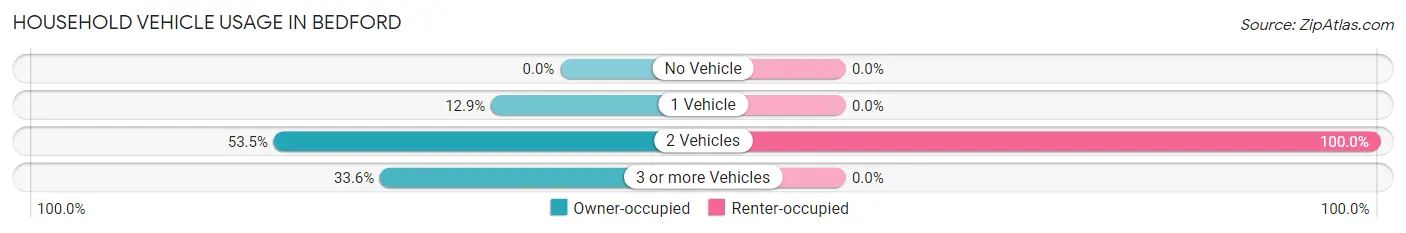
| Vehicles per Household | Owner-occupied | Renter-occupied |
| No Vehicle | 0 (0.0%) | 0 (0.0%) |
| 1 Vehicle | 87 (12.9%) | 0 (0.0%) |
| 2 Vehicles | 361 (53.5%) | 17 (100.0%) |
| 3 or more Vehicles | 227 (33.6%) | 0 (0.0%) |
| Total | 675 (100.0%) | 17 (100.0%) |
Real Estate & Mortgages in Bedford
Real Estate and Mortgage Overview in Bedford
| Characteristic | Without Mortgage | With Mortgage |
| Housing Units | 193 | 482 |
| Median Property Value | $890,400 | $1,060,400 |
| Median Household Income | $128,594 | $361 |
| Monthly Housing Costs | $1,501 | $473 |
| Real Estate Taxes | $10,001 | $0 |
Property Value by Mortgage Status in Bedford
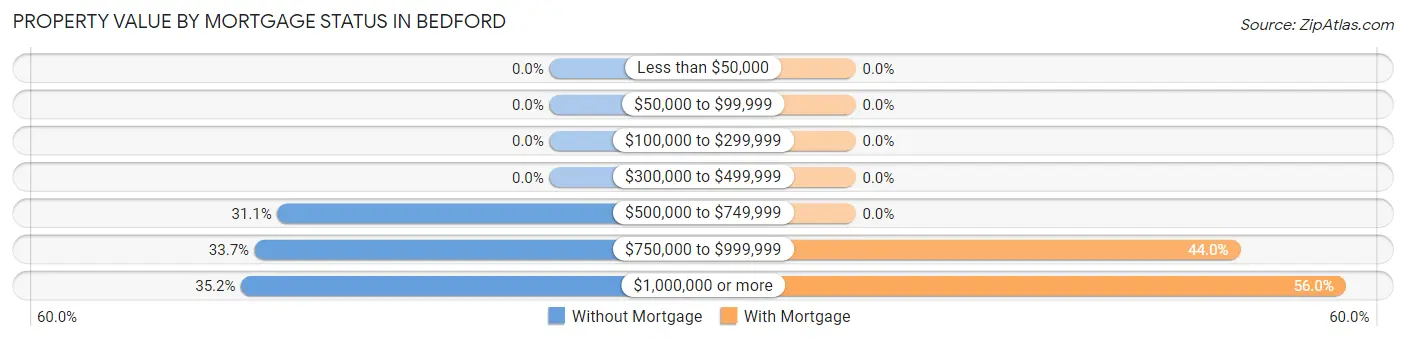
| Property Value | Without Mortgage | With Mortgage |
| Less than $50,000 | 0 (0.0%) | 0 (0.0%) |
| $50,000 to $99,999 | 0 (0.0%) | 0 (0.0%) |
| $100,000 to $299,999 | 0 (0.0%) | 0 (0.0%) |
| $300,000 to $499,999 | 0 (0.0%) | 0 (0.0%) |
| $500,000 to $749,999 | 60 (31.1%) | 0 (0.0%) |
| $750,000 to $999,999 | 65 (33.7%) | 212 (44.0%) |
| $1,000,000 or more | 68 (35.2%) | 270 (56.0%) |
| Total | 193 (100.0%) | 482 (100.0%) |
Household Income by Mortgage Status in Bedford
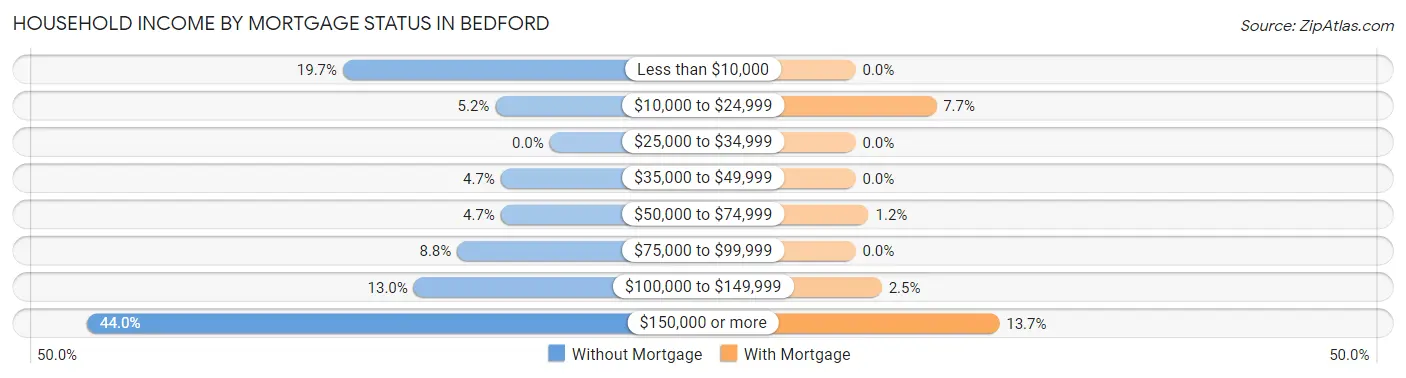
| Household Income | Without Mortgage | With Mortgage |
| Less than $10,000 | 38 (19.7%) | 0 (0.0%) |
| $10,000 to $24,999 | 10 (5.2%) | 37 (7.7%) |
| $25,000 to $34,999 | 0 (0.0%) | 0 (0.0%) |
| $35,000 to $49,999 | 9 (4.7%) | 0 (0.0%) |
| $50,000 to $74,999 | 9 (4.7%) | 6 (1.2%) |
| $75,000 to $99,999 | 17 (8.8%) | 0 (0.0%) |
| $100,000 to $149,999 | 25 (13.0%) | 12 (2.5%) |
| $150,000 or more | 85 (44.0%) | 66 (13.7%) |
| Total | 193 (100.0%) | 482 (100.0%) |
Property Value to Household Income Ratio in Bedford
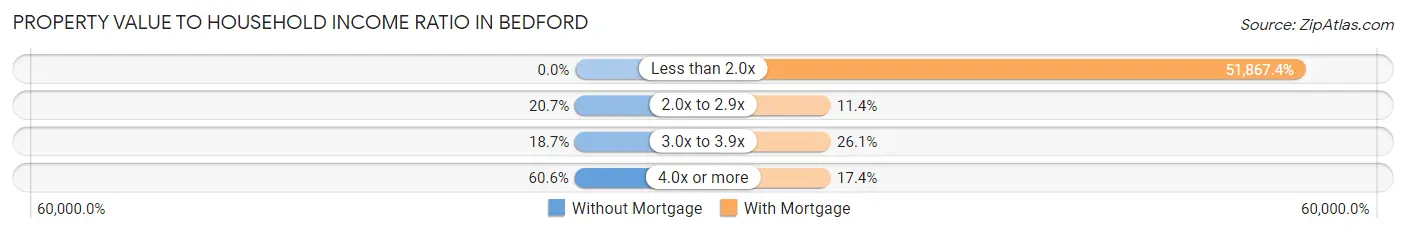
| Value-to-Income Ratio | Without Mortgage | With Mortgage |
| Less than 2.0x | 0 (0.0%) | 250,001 (51,867.4%) |
| 2.0x to 2.9x | 40 (20.7%) | 55 (11.4%) |
| 3.0x to 3.9x | 36 (18.6%) | 126 (26.1%) |
| 4.0x or more | 117 (60.6%) | 84 (17.4%) |
| Total | 193 (100.0%) | 482 (100.0%) |
Real Estate Taxes by Mortgage Status in Bedford

| Property Taxes | Without Mortgage | With Mortgage |
| Less than $800 | 0 (0.0%) | 0 (0.0%) |
| $800 to $1,499 | 0 (0.0%) | 0 (0.0%) |
| $800 to $1,499 | 193 (100.0%) | 0 (0.0%) |
| Total | 193 (100.0%) | 482 (100.0%) |
Health & Disability in Bedford
Health Insurance Coverage by Age in Bedford
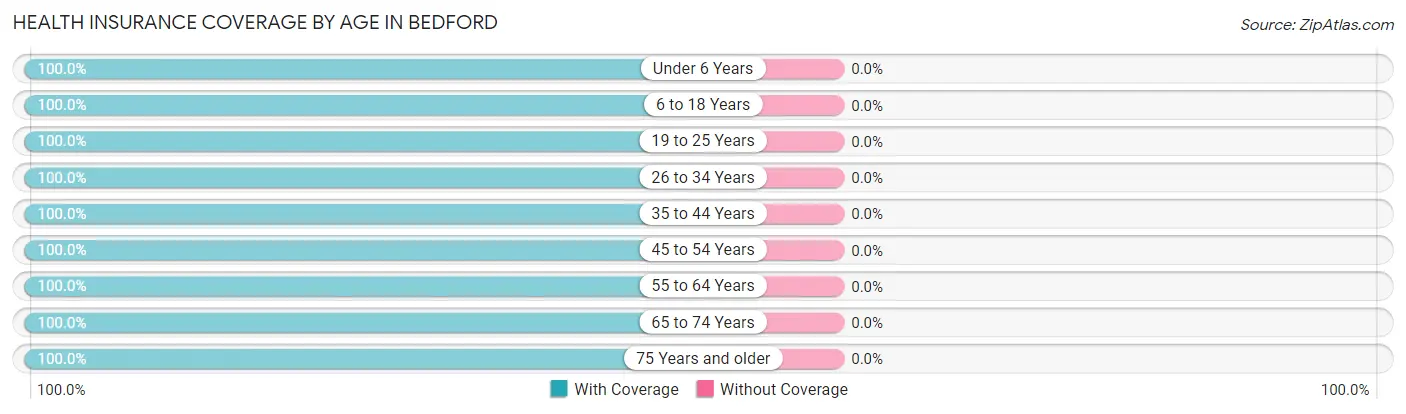
| Age Bracket | With Coverage | Without Coverage |
| Under 6 Years | 190 (100.0%) | 0 (0.0%) |
| 6 to 18 Years | 220 (100.0%) | 0 (0.0%) |
| 19 to 25 Years | 303 (100.0%) | 0 (0.0%) |
| 26 to 34 Years | 142 (100.0%) | 0 (0.0%) |
| 35 to 44 Years | 205 (100.0%) | 0 (0.0%) |
| 45 to 54 Years | 226 (100.0%) | 0 (0.0%) |
| 55 to 64 Years | 368 (100.0%) | 0 (0.0%) |
| 65 to 74 Years | 229 (100.0%) | 0 (0.0%) |
| 75 Years and older | 169 (100.0%) | 0 (0.0%) |
| Total | 2,052 (100.0%) | 0 (0.0%) |
Health Insurance Coverage by Citizenship Status in Bedford

| Citizenship Status | With Coverage | Without Coverage |
| Native Born | 190 (100.0%) | 0 (0.0%) |
| Foreign Born, Citizen | 220 (100.0%) | 0 (0.0%) |
| Foreign Born, not a Citizen | 303 (100.0%) | 0 (0.0%) |
Health Insurance Coverage by Household Income in Bedford

| Household Income | With Coverage | Without Coverage |
| Under $25,000 | 126 (100.0%) | 0 (0.0%) |
| $25,000 to $49,999 | 22 (100.0%) | 0 (0.0%) |
| $50,000 to $74,999 | 9 (100.0%) | 0 (0.0%) |
| $75,000 to $99,999 | 73 (100.0%) | 0 (0.0%) |
| $100,000 and over | 1,781 (100.0%) | 0 (0.0%) |
Public vs Private Health Insurance Coverage by Age in Bedford
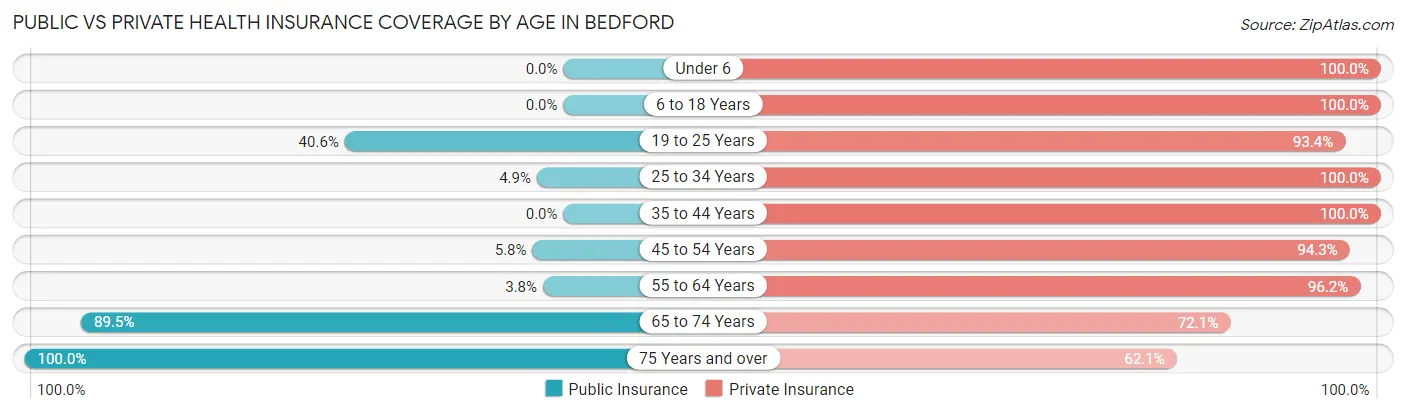
| Age Bracket | Public Insurance | Private Insurance |
| Under 6 | 0 (0.0%) | 190 (100.0%) |
| 6 to 18 Years | 0 (0.0%) | 220 (100.0%) |
| 19 to 25 Years | 123 (40.6%) | 283 (93.4%) |
| 25 to 34 Years | 7 (4.9%) | 142 (100.0%) |
| 35 to 44 Years | 0 (0.0%) | 205 (100.0%) |
| 45 to 54 Years | 13 (5.8%) | 213 (94.3%) |
| 55 to 64 Years | 14 (3.8%) | 354 (96.2%) |
| 65 to 74 Years | 205 (89.5%) | 165 (72.1%) |
| 75 Years and over | 169 (100.0%) | 105 (62.1%) |
| Total | 531 (25.9%) | 1,877 (91.5%) |
Disability Status by Sex by Age in Bedford
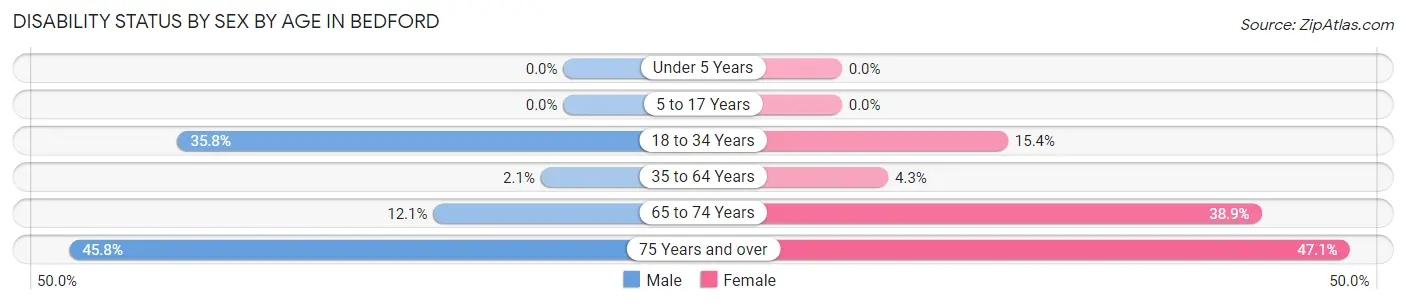
| Age Bracket | Male | Female |
| Under 5 Years | 0 (0.0%) | 0 (0.0%) |
| 5 to 17 Years | 0 (0.0%) | 0 (0.0%) |
| 18 to 34 Years | 63 (35.8%) | 47 (15.4%) |
| 35 to 64 Years | 7 (2.1%) | 20 (4.3%) |
| 65 to 74 Years | 14 (12.1%) | 44 (38.9%) |
| 75 Years and over | 22 (45.8%) | 57 (47.1%) |
Disability Class by Sex by Age in Bedford
Disability Class: Hearing Difficulty
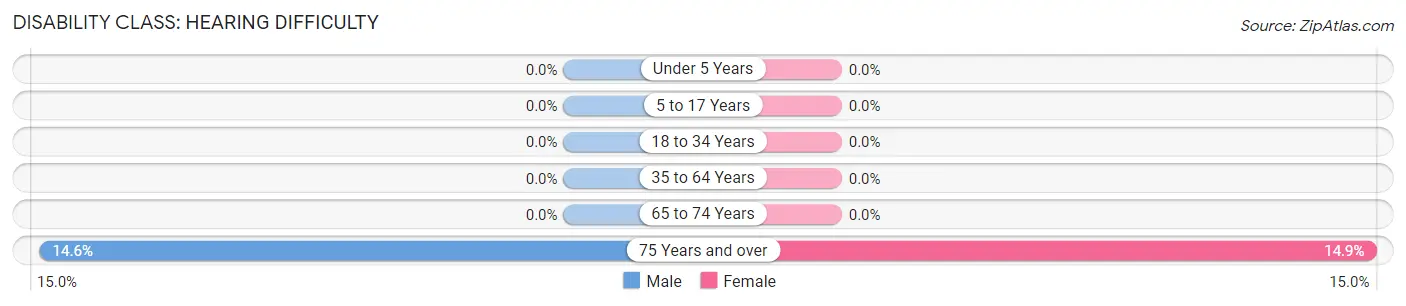
| Age Bracket | Male | Female |
| Under 5 Years | 0 (0.0%) | 0 (0.0%) |
| 5 to 17 Years | 0 (0.0%) | 0 (0.0%) |
| 18 to 34 Years | 0 (0.0%) | 0 (0.0%) |
| 35 to 64 Years | 0 (0.0%) | 0 (0.0%) |
| 65 to 74 Years | 0 (0.0%) | 0 (0.0%) |
| 75 Years and over | 7 (14.6%) | 18 (14.9%) |
Disability Class: Vision Difficulty
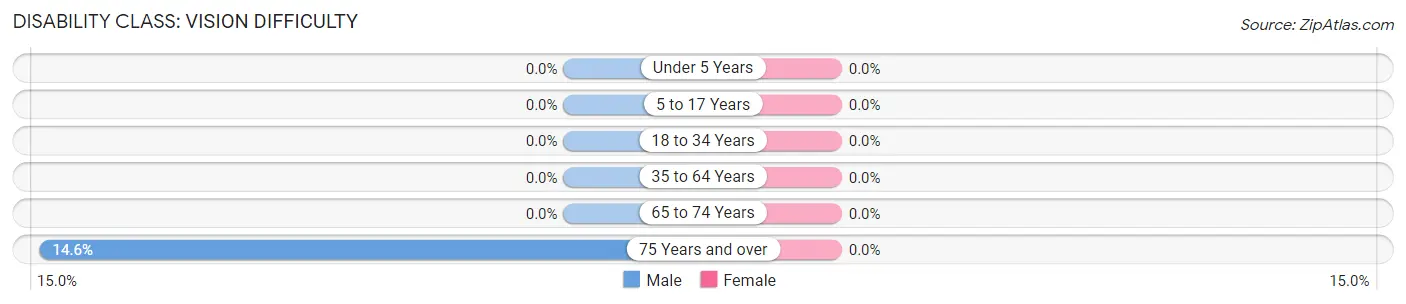
| Age Bracket | Male | Female |
| Under 5 Years | 0 (0.0%) | 0 (0.0%) |
| 5 to 17 Years | 0 (0.0%) | 0 (0.0%) |
| 18 to 34 Years | 0 (0.0%) | 0 (0.0%) |
| 35 to 64 Years | 0 (0.0%) | 0 (0.0%) |
| 65 to 74 Years | 0 (0.0%) | 0 (0.0%) |
| 75 Years and over | 7 (14.6%) | 0 (0.0%) |
Disability Class: Cognitive Difficulty
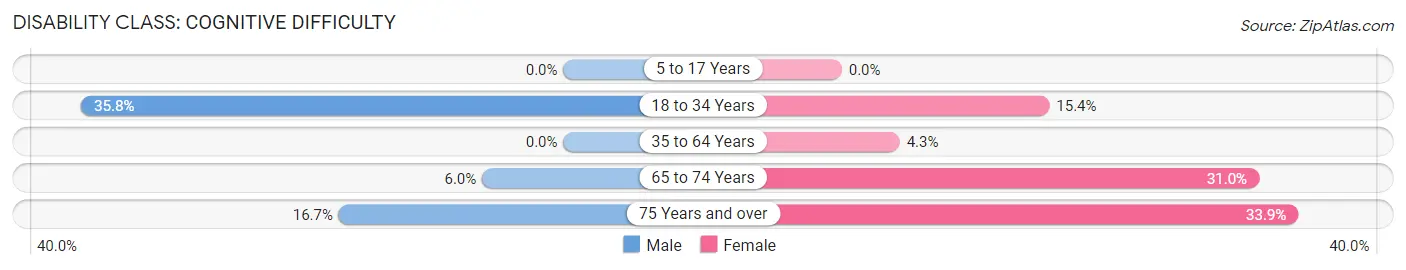
| Age Bracket | Male | Female |
| 5 to 17 Years | 0 (0.0%) | 0 (0.0%) |
| 18 to 34 Years | 63 (35.8%) | 47 (15.4%) |
| 35 to 64 Years | 0 (0.0%) | 20 (4.3%) |
| 65 to 74 Years | 7 (6.0%) | 35 (31.0%) |
| 75 Years and over | 8 (16.7%) | 41 (33.9%) |
Disability Class: Ambulatory Difficulty
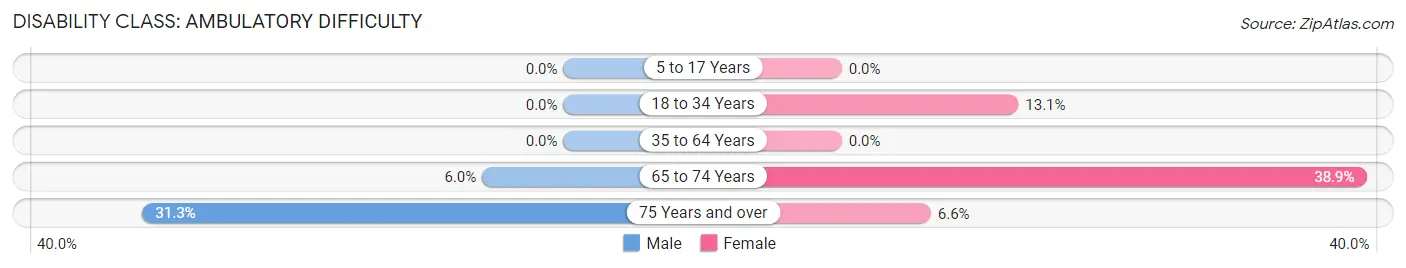
| Age Bracket | Male | Female |
| 5 to 17 Years | 0 (0.0%) | 0 (0.0%) |
| 18 to 34 Years | 0 (0.0%) | 40 (13.1%) |
| 35 to 64 Years | 0 (0.0%) | 0 (0.0%) |
| 65 to 74 Years | 7 (6.0%) | 44 (38.9%) |
| 75 Years and over | 15 (31.2%) | 8 (6.6%) |
Disability Class: Self-Care Difficulty
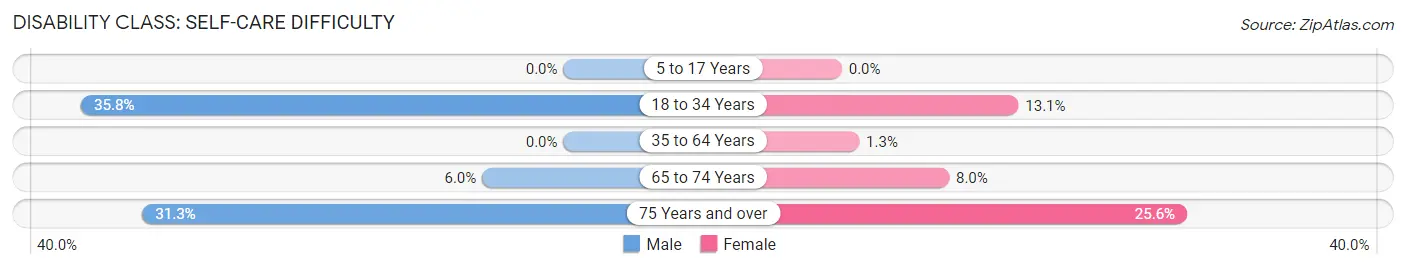
| Age Bracket | Male | Female |
| 5 to 17 Years | 0 (0.0%) | 0 (0.0%) |
| 18 to 34 Years | 63 (35.8%) | 40 (13.1%) |
| 35 to 64 Years | 0 (0.0%) | 6 (1.3%) |
| 65 to 74 Years | 7 (6.0%) | 9 (8.0%) |
| 75 Years and over | 15 (31.2%) | 31 (25.6%) |
Technology Access in Bedford
Computing Device Access in Bedford
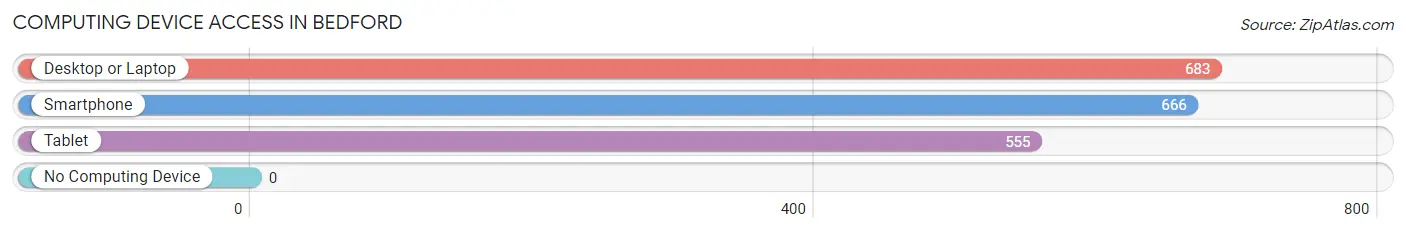
| Device Type | # Households | % Households |
| Desktop or Laptop | 683 | 98.7% |
| Smartphone | 666 | 96.2% |
| Tablet | 555 | 80.2% |
| No Computing Device | 0 | 0.0% |
| Total | 692 | 100.0% |
Internet Access in Bedford
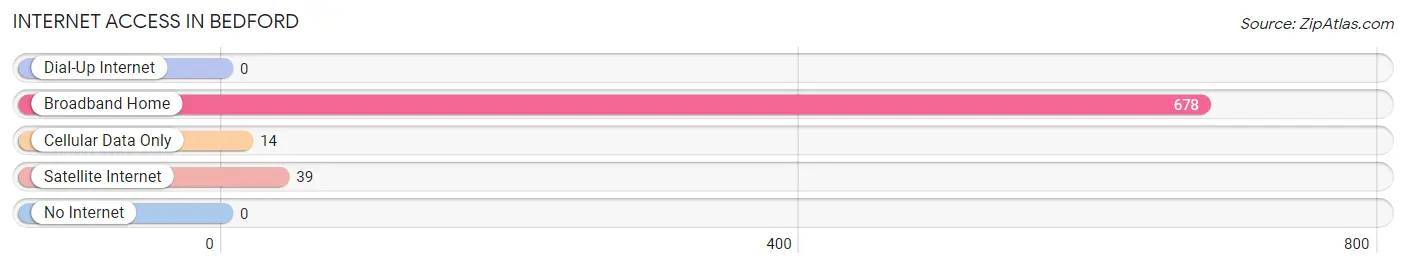
| Internet Type | # Households | % Households |
| Dial-Up Internet | 0 | 0.0% |
| Broadband Home | 678 | 98.0% |
| Cellular Data Only | 14 | 2.0% |
| Satellite Internet | 39 | 5.6% |
| No Internet | 0 | 0.0% |
| Total | 692 | 100.0% |
Bedford Summary
Bedford is a town located in Westchester County, New York, United States. It is the northernmost town in the county and is bordered by the towns of Pound Ridge, New Castle, North Castle, Lewisboro, and Mount Kisco. The population was 17,335 at the 2010 census.
History
The area that is now Bedford was purchased from Chief Katonah of the Ramapough Mountain Indians in 1680. The town of Bedford was created in 1680 when a group of settlers purchased the land from Chief Katonah. The town was named after the Duke of Bedford, who was a prominent figure in England at the time.
The town was originally part of the town of North Castle, but was separated in 1779. The town was further divided in 1788 when the town of Pound Ridge was created.
Geography
Bedford is located in the northern part of Westchester County, and is bordered by the towns of Pound Ridge, New Castle, North Castle, Lewisboro, and Mount Kisco. The town is located in the Hudson Valley region of New York, and is approximately 40 miles north of New York City.
The town has a total area of 39.2 square miles, of which 38.9 square miles is land and 0.3 square miles is water. The town is mostly hilly and wooded, with several small streams and ponds. The highest point in the town is the summit of Cat Rocks, which is 1,220 feet above sea level.
Economy
The economy of Bedford is largely based on the service industry, with many residents commuting to New York City for work. The town is also home to several corporate headquarters, including PepsiCo, IBM, and Morgan Stanley.
The town is also home to several small businesses, including restaurants, retail stores, and professional services. The town is also home to several wineries, including the Bedford Post Inn, which is owned by actor Richard Gere.
Demographics
As of the 2010 census, there were 17,335 people, 6,541 households, and 4,717 families residing in the town. The population density was 442.3 people per square mile. The racial makeup of the town was 87.3% White, 4.2% African American, 0.2% Native American, 5.3% Asian, 0.1% Pacific Islander, 0.7% from other races, and 2.2% from two or more races. Hispanic or Latino of any race were 4.3% of the population.
The median income for a household in the town was $125,000, and the median income for a family was $150,000. The per capita income for the town was $60,000. About 2.7% of families and 4.2% of the population were below the poverty line, including 4.3% of those under age 18 and 4.2% of those age 65 or over.
Common Questions
What is Per Capita Income in Bedford?
Per Capita income in Bedford is $107,283.
What is the Median Family Income in Bedford?
Median Family Income in Bedford is $250,001.
What is the Median Household income in Bedford?
Median Household Income in Bedford is $250,001.
What is Inequality or Gini Index in Bedford?
Inequality or Gini Index in Bedford is 0.44.
What is the Total Population of Bedford?
Total Population of Bedford is 2,052.
What is the Total Male Population of Bedford?
Total Male Population of Bedford is 881.
What is the Total Female Population of Bedford?
Total Female Population of Bedford is 1,171.
What is the Ratio of Males per 100 Females in Bedford?
There are 75.23 Males per 100 Females in Bedford.
What is the Ratio of Females per 100 Males in Bedford?
There are 132.92 Females per 100 Males in Bedford.
What is the Median Population Age in Bedford?
Median Population Age in Bedford is 43.5 Years.
What is the Average Family Size in Bedford
Average Family Size in Bedford is 3.4 People.
What is the Average Household Size in Bedford
Average Household Size in Bedford is 2.9 People.
How Large is the Labor Force in Bedford?
There are 1,006 People in the Labor Forcein in Bedford.
What is the Percentage of People in the Labor Force in Bedford?
59.3% of People are in the Labor Force in Bedford.
What is the Unemployment Rate in Bedford?
Unemployment Rate in Bedford is 3.4%.