Riverview, DE Map & Demographics
Riverview Map
Riverview Overview
$39,745
PER CAPITA INCOME
$88,611
AVG FAMILY INCOME
$87,708
AVG HOUSEHOLD INCOME
7.3%
WAGE / INCOME GAP [ % ]
92.7¢/ $1
WAGE / INCOME GAP [ $ ]
0.33
INEQUALITY / GINI INDEX
2,270
TOTAL POPULATION
1,115
MALE POPULATION
1,155
FEMALE POPULATION
96.54
MALES / 100 FEMALES
103.59
FEMALES / 100 MALES
54.1
MEDIAN AGE
2.3
AVG FAMILY SIZE
2.3
AVG HOUSEHOLD SIZE
1,054
LABOR FORCE [ PEOPLE ]
50.3%
PERCENT IN LABOR FORCE
1.8%
UNEMPLOYMENT RATE
Income in Riverview
Income Overview in Riverview
Per Capita Income in Riverview is $39,745, while median incomes of families and households are $88,611 and $87,708 respectively.
| Characteristic | Number | Measure |
| Per Capita Income | 2,270 | $39,745 |
| Median Family Income | 922 | $88,611 |
| Mean Family Income | 922 | $92,147 |
| Median Household Income | 991 | $87,708 |
| Mean Household Income | 991 | $91,456 |
| Income Deficit | 922 | $0 |
| Wage / Income Gap (%) | 2,270 | 7.33% |
| Wage / Income Gap ($) | 2,270 | 92.67¢ per $1 |
| Gini / Inequality Index | 2,270 | 0.33 |
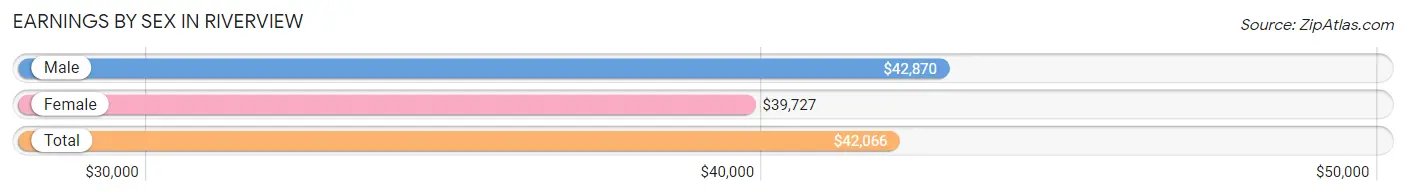
Earnings by Sex in Riverview
Average Earnings in Riverview are $42,066, $42,870 for men and $39,727 for women, a difference of 7.3%.
| Sex | Number | Average Earnings |
| Male | 672 (53.9%) | $42,870 |
| Female | 574 (46.1%) | $39,727 |
| Total | 1,246 (100.0%) | $42,066 |
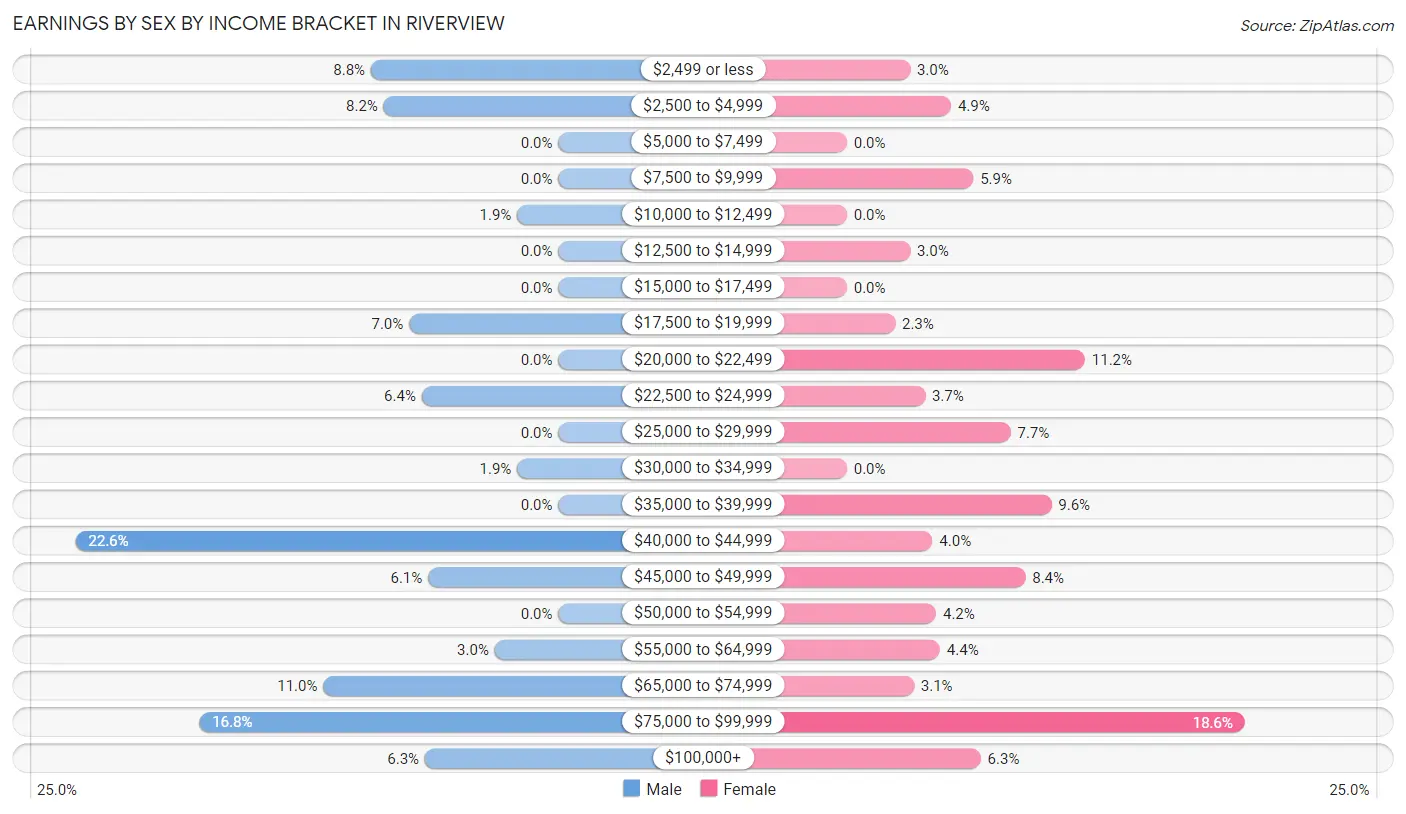
Earnings by Sex by Income Bracket in Riverview
The most common earnings brackets in Riverview are $40,000 to $44,999 for men (152 | 22.6%) and $75,000 to $99,999 for women (107 | 18.6%).
| Income | Male | Female |
| $2,499 or less | 59 (8.8%) | 17 (3.0%) |
| $2,500 to $4,999 | 55 (8.2%) | 28 (4.9%) |
| $5,000 to $7,499 | 0 (0.0%) | 0 (0.0%) |
| $7,500 to $9,999 | 0 (0.0%) | 34 (5.9%) |
| $10,000 to $12,499 | 13 (1.9%) | 0 (0.0%) |
| $12,500 to $14,999 | 0 (0.0%) | 17 (3.0%) |
| $15,000 to $17,499 | 0 (0.0%) | 0 (0.0%) |
| $17,500 to $19,999 | 47 (7.0%) | 13 (2.3%) |
| $20,000 to $22,499 | 0 (0.0%) | 64 (11.2%) |
| $22,500 to $24,999 | 43 (6.4%) | 21 (3.7%) |
| $25,000 to $29,999 | 0 (0.0%) | 44 (7.7%) |
| $30,000 to $34,999 | 13 (1.9%) | 0 (0.0%) |
| $35,000 to $39,999 | 0 (0.0%) | 55 (9.6%) |
| $40,000 to $44,999 | 152 (22.6%) | 23 (4.0%) |
| $45,000 to $49,999 | 41 (6.1%) | 48 (8.4%) |
| $50,000 to $54,999 | 0 (0.0%) | 24 (4.2%) |
| $55,000 to $64,999 | 20 (3.0%) | 25 (4.4%) |
| $65,000 to $74,999 | 74 (11.0%) | 18 (3.1%) |
| $75,000 to $99,999 | 113 (16.8%) | 107 (18.6%) |
| $100,000+ | 42 (6.2%) | 36 (6.3%) |
| Total | 672 (100.0%) | 574 (100.0%) |
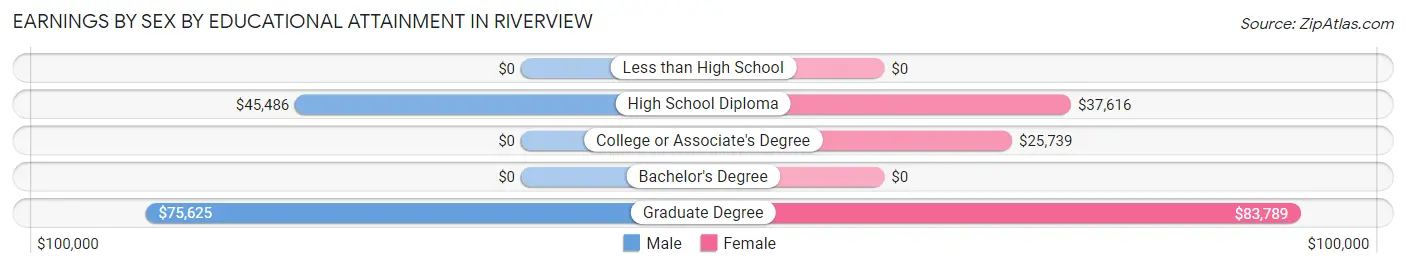
Earnings by Sex by Educational Attainment in Riverview
Average earnings in Riverview are $44,769 for men and $41,793 for women, a difference of 6.7%. Men with an educational attainment of graduate degree enjoy the highest average annual earnings of $75,625, while those with high school diploma education earn the least with $45,486. Women with an educational attainment of graduate degree earn the most with the average annual earnings of $83,789, while those with college or associate's degree education have the smallest earnings of $25,739.
| Educational Attainment | Male Income | Female Income |
| Less than High School | - | - |
| High School Diploma | $45,486 | $37,616 |
| College or Associate's Degree | - | - |
| Bachelor's Degree | - | - |
| Graduate Degree | $75,625 | $83,789 |
| Total | $44,769 | $41,793 |
Family Income in Riverview
Family Income Brackets in Riverview
According to the Riverview family income data, there are 304 families falling into the $100,000 to $149,999 income range, which is the most common income bracket and makes up 33.0% of all families.
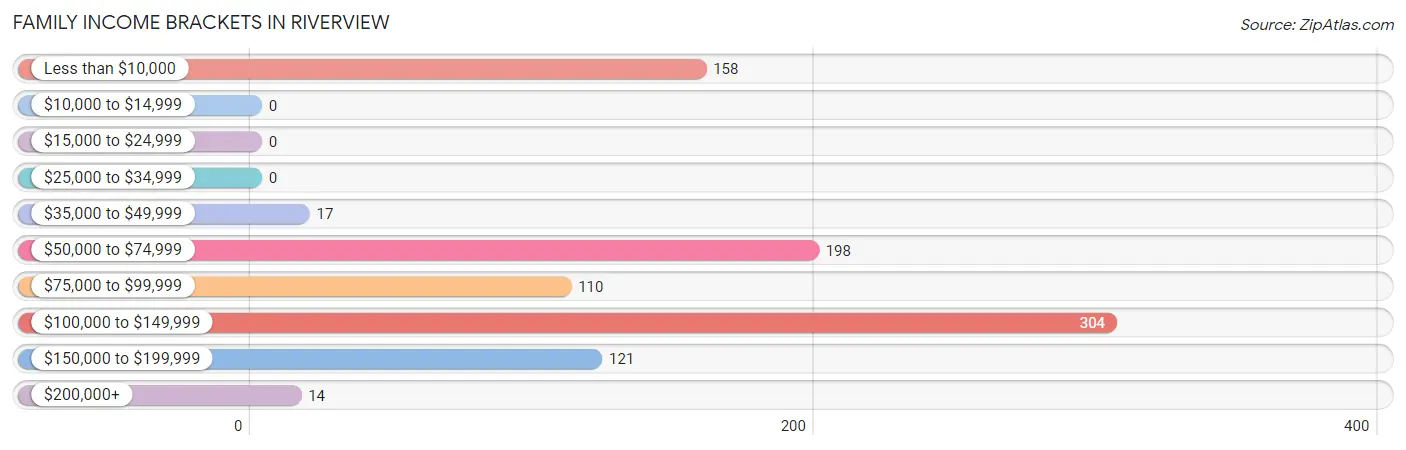
| Income Bracket | # Families | % Families |
| Less than $10,000 | 158 | 17.1% |
| $10,000 to $14,999 | 0 | 0.0% |
| $15,000 to $24,999 | 0 | 0.0% |
| $25,000 to $34,999 | 0 | 0.0% |
| $35,000 to $49,999 | 17 | 1.8% |
| $50,000 to $74,999 | 198 | 21.5% |
| $75,000 to $99,999 | 110 | 11.9% |
| $100,000 to $149,999 | 304 | 33.0% |
| $150,000 to $199,999 | 121 | 13.1% |
| $200,000+ | 14 | 1.5% |
Family Income by Famaliy Size in Riverview
3-person families (157 | 17.0%) account for the highest median family income in Riverview with $122,662 per family, while 3-person families (157 | 17.0%) have the highest median income of $40,887 per family member.
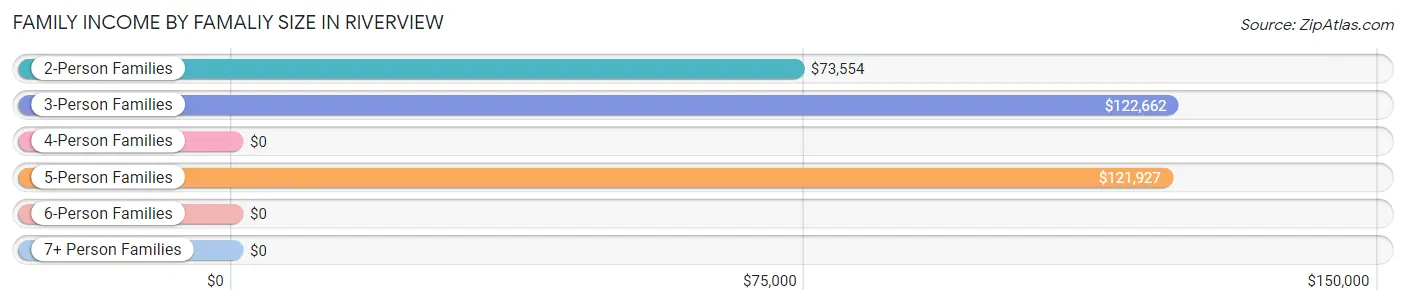
| Income Bracket | # Families | Median Income |
| 2-Person Families | 681 (73.9%) | $73,554 |
| 3-Person Families | 157 (17.0%) | $122,662 |
| 4-Person Families | 6 (0.6%) | $0 |
| 5-Person Families | 63 (6.8%) | $121,927 |
| 6-Person Families | 15 (1.6%) | $0 |
| 7+ Person Families | 0 (0.0%) | $0 |
| Total | 922 (100.0%) | $88,611 |
Family Income by Number of Earners in Riverview
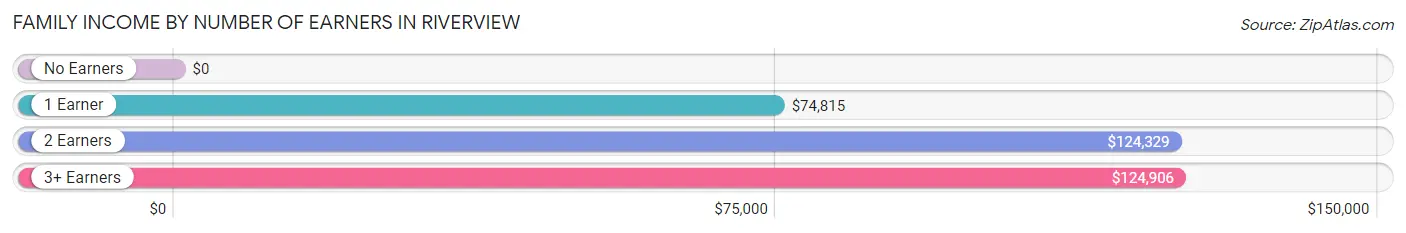
| Number of Earners | # Families | Median Income |
| No Earners | 303 (32.9%) | $0 |
| 1 Earner | 198 (21.5%) | $74,815 |
| 2 Earners | 344 (37.3%) | $124,329 |
| 3+ Earners | 77 (8.4%) | $124,906 |
| Total | 922 (100.0%) | $88,611 |
Household Income in Riverview
Household Income Brackets in Riverview
With 316 households falling in the category, the $100,000 to $149,999 income range is the most frequent in Riverview, accounting for 31.9% of all households.
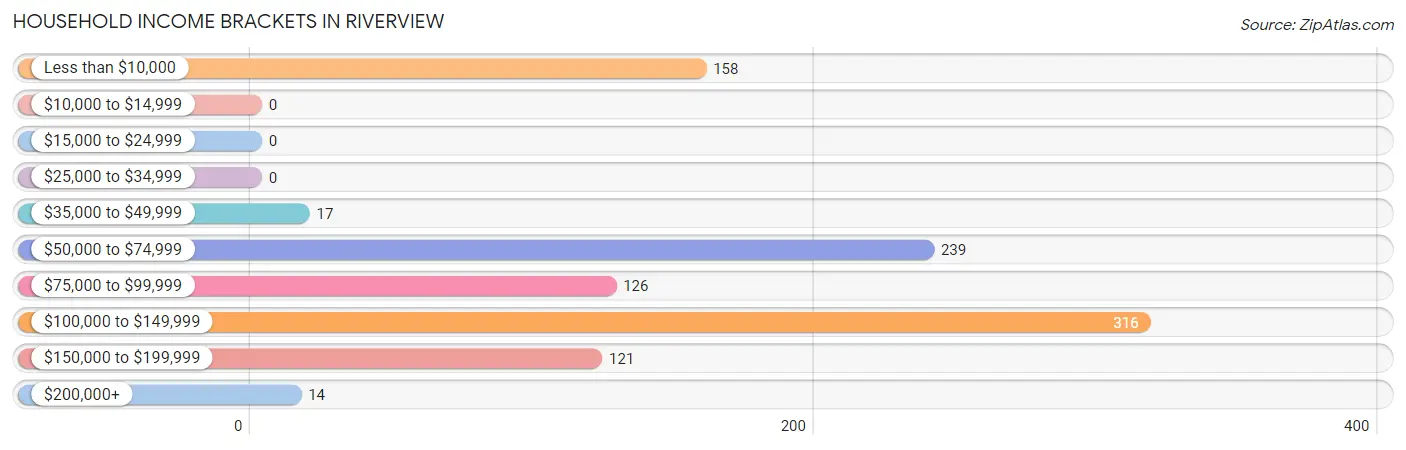
| Income Bracket | # Households | % Households |
| Less than $10,000 | 158 | 15.9% |
| $10,000 to $14,999 | 0 | 0.0% |
| $15,000 to $24,999 | 0 | 0.0% |
| $25,000 to $34,999 | 0 | 0.0% |
| $35,000 to $49,999 | 17 | 1.7% |
| $50,000 to $74,999 | 239 | 24.1% |
| $75,000 to $99,999 | 126 | 12.7% |
| $100,000 to $149,999 | 316 | 31.9% |
| $150,000 to $199,999 | 121 | 12.2% |
| $200,000+ | 14 | 1.4% |
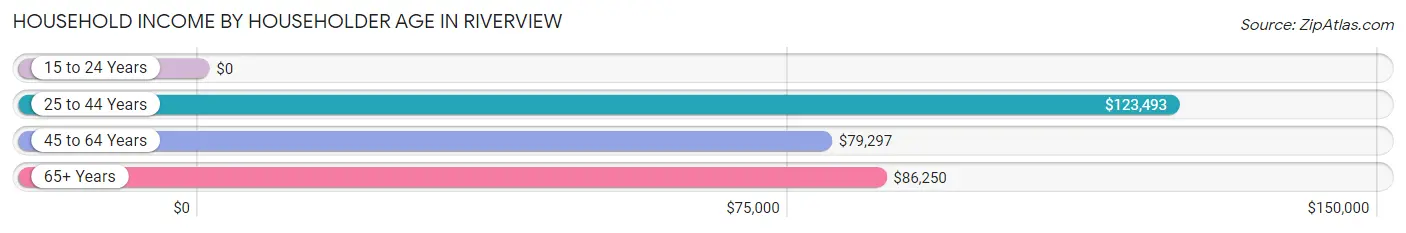
Household Income by Householder Age in Riverview
The median household income in Riverview is $87,708, with the highest median household income of $123,493 found in the 25 to 44 years age bracket for the primary householder. A total of 126 households (12.7%) fall into this category. Meanwhile, the 15 to 24 years age bracket for the primary householder has the lowest median household income of $0, with 18 households (1.8%) in this group.
| Income Bracket | # Households | Median Income |
| 15 to 24 Years | 18 (1.8%) | $0 |
| 25 to 44 Years | 126 (12.7%) | $123,493 |
| 45 to 64 Years | 523 (52.8%) | $79,297 |
| 65+ Years | 324 (32.7%) | $86,250 |
| Total | 991 (100.0%) | $87,708 |
Poverty in Riverview
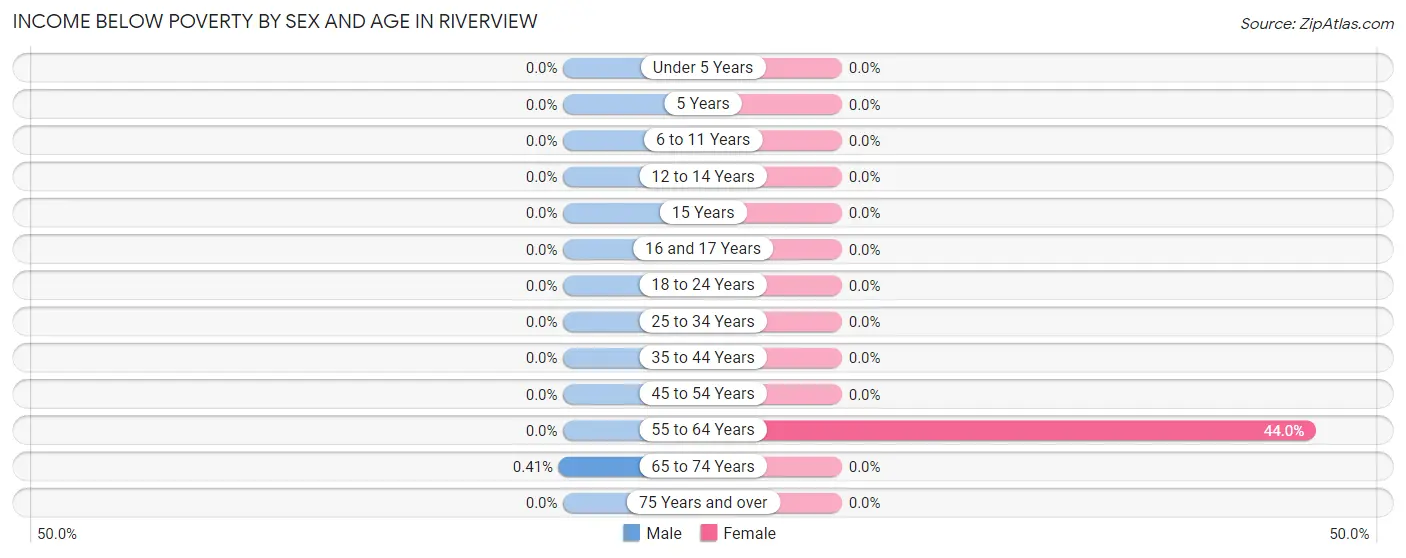
Income Below Poverty by Sex and Age in Riverview
With 0.1% poverty level for males and 13.7% for females among the residents of Riverview, 65 to 74 year old males and 55 to 64 year old females are the most vulnerable to poverty, with 1 males (0.4%) and 158 females (44.0%) in their respective age groups living below the poverty level.
| Age Bracket | Male | Female |
| Under 5 Years | 0 (0.0%) | 0 (0.0%) |
| 5 Years | 0 (0.0%) | 0 (0.0%) |
| 6 to 11 Years | 0 (0.0%) | 0 (0.0%) |
| 12 to 14 Years | 0 (0.0%) | 0 (0.0%) |
| 15 Years | 0 (0.0%) | 0 (0.0%) |
| 16 and 17 Years | 0 (0.0%) | 0 (0.0%) |
| 18 to 24 Years | 0 (0.0%) | 0 (0.0%) |
| 25 to 34 Years | 0 (0.0%) | 0 (0.0%) |
| 35 to 44 Years | 0 (0.0%) | 0 (0.0%) |
| 45 to 54 Years | 0 (0.0%) | 0 (0.0%) |
| 55 to 64 Years | 0 (0.0%) | 158 (44.0%) |
| 65 to 74 Years | 1 (0.4%) | 0 (0.0%) |
| 75 Years and over | 0 (0.0%) | 0 (0.0%) |
| Total | 1 (0.1%) | 158 (13.7%) |
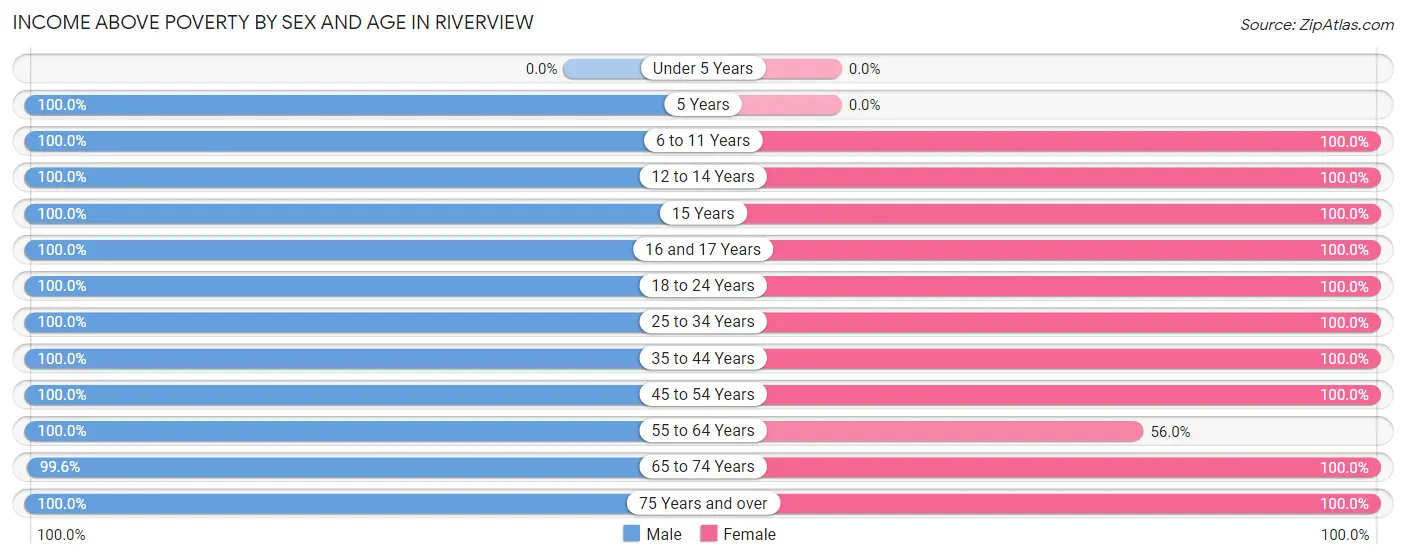
Income Above Poverty by Sex and Age in Riverview
According to the poverty statistics in Riverview, males aged 5 years and females aged 6 to 11 years are the age groups that are most secure financially, with 100.0% of males and 100.0% of females in these age groups living above the poverty line.
| Age Bracket | Male | Female |
| Under 5 Years | 0 (0.0%) | 0 (0.0%) |
| 5 Years | 18 (100.0%) | 0 (0.0%) |
| 6 to 11 Years | 23 (100.0%) | 1 (100.0%) |
| 12 to 14 Years | 30 (100.0%) | 29 (100.0%) |
| 15 Years | 28 (100.0%) | 45 (100.0%) |
| 16 and 17 Years | 42 (100.0%) | 42 (100.0%) |
| 18 to 24 Years | 58 (100.0%) | 40 (100.0%) |
| 25 to 34 Years | 98 (100.0%) | 28 (100.0%) |
| 35 to 44 Years | 124 (100.0%) | 120 (100.0%) |
| 45 to 54 Years | 201 (100.0%) | 264 (100.0%) |
| 55 to 64 Years | 206 (100.0%) | 201 (56.0%) |
| 65 to 74 Years | 242 (99.6%) | 186 (100.0%) |
| 75 Years and over | 44 (100.0%) | 41 (100.0%) |
| Total | 1,114 (99.9%) | 997 (86.3%) |
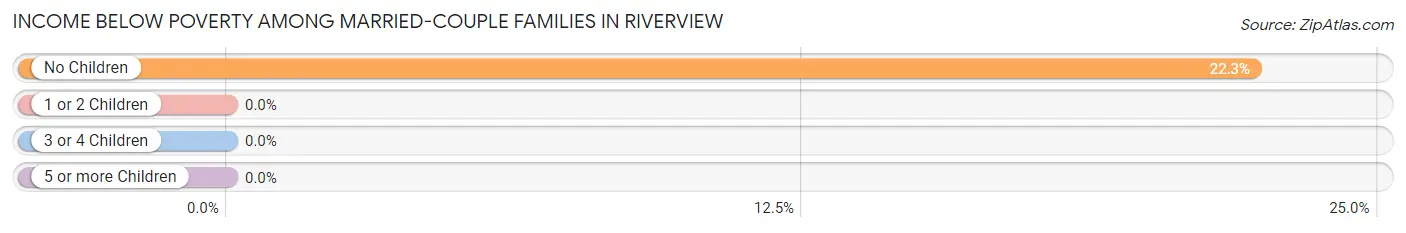
Income Below Poverty Among Married-Couple Families in Riverview
The poverty statistics for married-couple families in Riverview show that 19.0% or 158 of the total 831 families live below the poverty line. Families with no children have the highest poverty rate of 22.3%, comprising of 158 families. On the other hand, families with 1 or 2 children have the lowest poverty rate of 0.0%, which includes 0 families.
| Children | Above Poverty | Below Poverty |
| No Children | 551 (77.7%) | 158 (22.3%) |
| 1 or 2 Children | 75 (100.0%) | 0 (0.0%) |
| 3 or 4 Children | 47 (100.0%) | 0 (0.0%) |
| 5 or more Children | 0 (0.0%) | 0 (0.0%) |
| Total | 673 (81.0%) | 158 (19.0%) |
Income Below Poverty Among Single-Parent Households in Riverview
| Children | Single Father | Single Mother |
| No Children | 0 (0.0%) | 0 (0.0%) |
| 1 or 2 Children | 0 (0.0%) | 0 (0.0%) |
| 3 or 4 Children | 0 (0.0%) | 0 (0.0%) |
| 5 or more Children | 0 (0.0%) | 0 (0.0%) |
| Total | 0 (0.0%) | 0 (0.0%) |
Income Below Poverty Among Married-Couple vs Single-Parent Households in Riverview
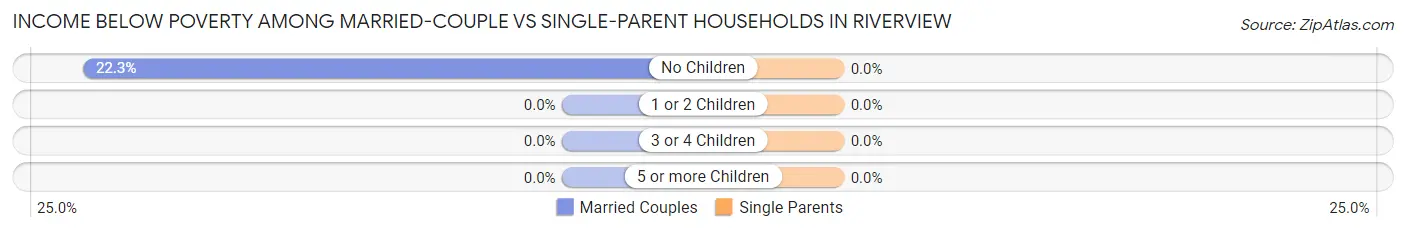
| Children | Married-Couple Families | Single-Parent Households |
| No Children | 158 (22.3%) | 0 (0.0%) |
| 1 or 2 Children | 0 (0.0%) | 0 (0.0%) |
| 3 or 4 Children | 0 (0.0%) | 0 (0.0%) |
| 5 or more Children | 0 (0.0%) | 0 (0.0%) |
| Total | 158 (19.0%) | 0 (0.0%) |
Race in Riverview
The most populous races in Riverview are White / Caucasian (1,975 | 87.0%), Hispanic or Latino (115 | 5.1%), and Some other Race (115 | 5.1%).
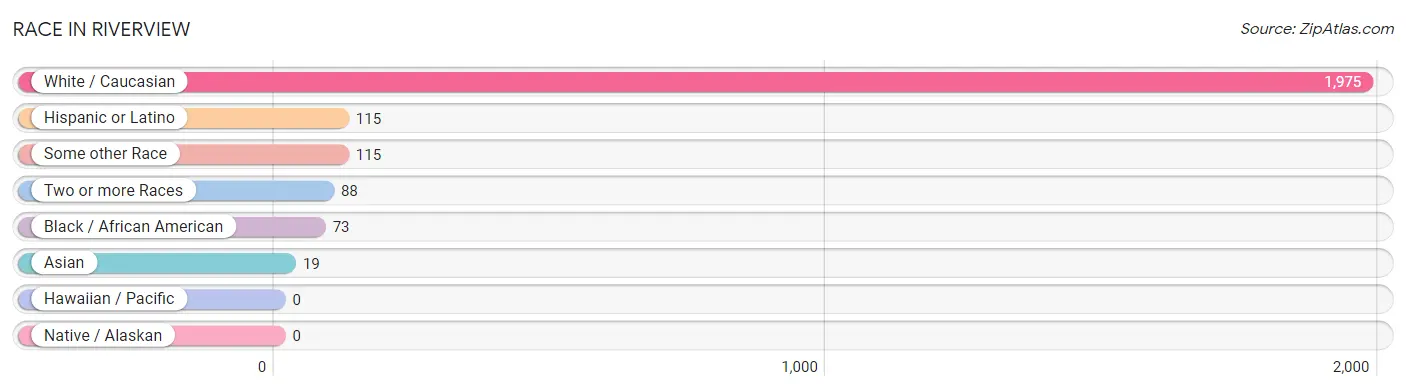
| Race | # Population | % Population |
| Asian | 19 | 0.8% |
| Black / African American | 73 | 3.2% |
| Hawaiian / Pacific | 0 | 0.0% |
| Hispanic or Latino | 115 | 5.1% |
| Native / Alaskan | 0 | 0.0% |
| White / Caucasian | 1,975 | 87.0% |
| Two or more Races | 88 | 3.9% |
| Some other Race | 115 | 5.1% |
| Total | 2,270 | 100.0% |
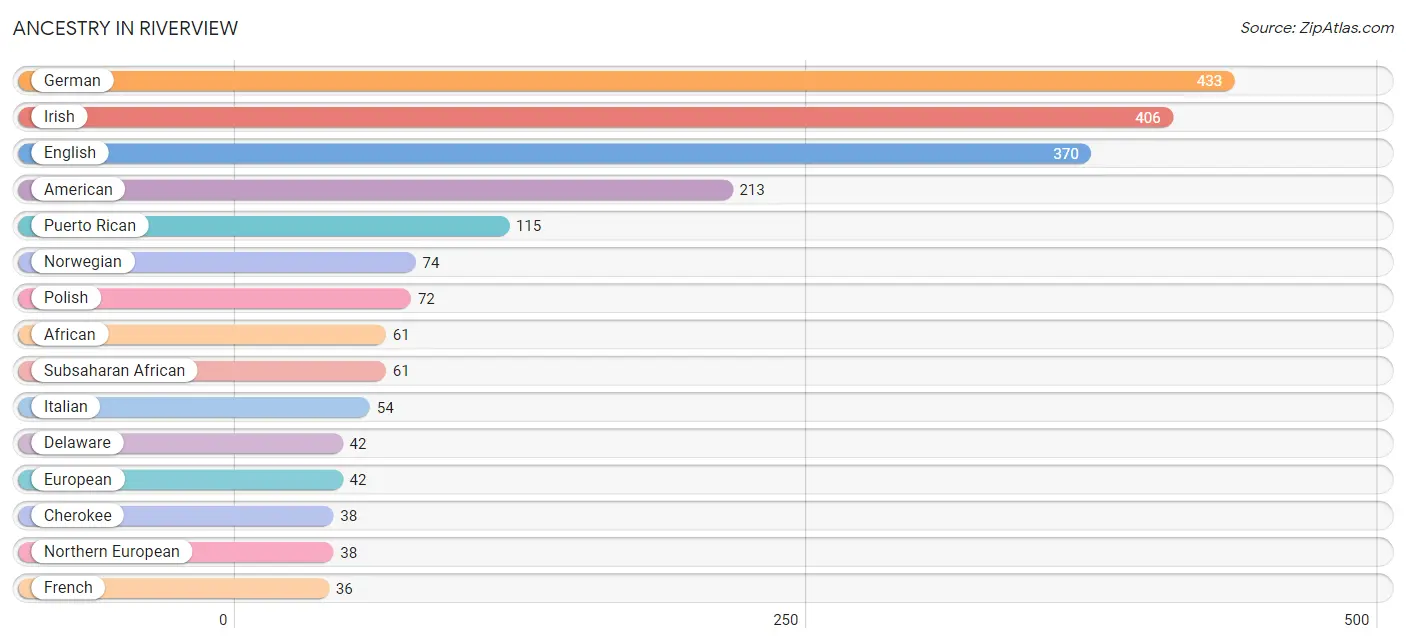
Ancestry in Riverview
The most populous ancestries reported in Riverview are German (433 | 19.1%), Irish (406 | 17.9%), English (370 | 16.3%), American (213 | 9.4%), and Puerto Rican (115 | 5.1%), together accounting for 67.7% of all Riverview residents.
| Ancestry | # Population | % Population |
| African | 61 | 2.7% |
| American | 213 | 9.4% |
| Austrian | 31 | 1.4% |
| Bhutanese | 26 | 1.1% |
| British | 23 | 1.0% |
| Cherokee | 38 | 1.7% |
| Delaware | 42 | 1.8% |
| Eastern European | 22 | 1.0% |
| English | 370 | 16.3% |
| European | 42 | 1.8% |
| French | 36 | 1.6% |
| French Canadian | 9 | 0.4% |
| German | 433 | 19.1% |
| Irish | 406 | 17.9% |
| Italian | 54 | 2.4% |
| Korean | 19 | 0.8% |
| Lithuanian | 9 | 0.4% |
| Northern European | 38 | 1.7% |
| Norwegian | 74 | 3.3% |
| Pennsylvania German | 9 | 0.4% |
| Polish | 72 | 3.2% |
| Puerto Rican | 115 | 5.1% |
| Scandinavian | 17 | 0.7% |
| Scotch-Irish | 31 | 1.4% |
| Scottish | 14 | 0.6% |
| Slovak | 15 | 0.7% |
| Subsaharan African | 61 | 2.7% |
| Swedish | 9 | 0.4% | View All 28 Rows |
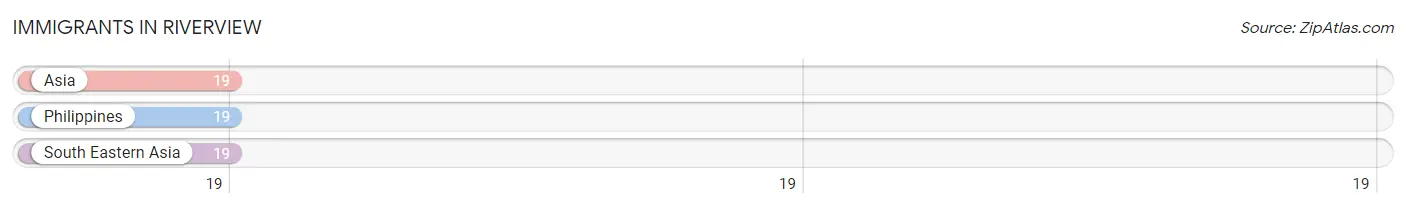
Immigrants in Riverview
The most numerous immigrant groups reported in Riverview came from Asia (19 | 0.8%), Philippines (19 | 0.8%), and South Eastern Asia (19 | 0.8%), together accounting for 2.5% of all Riverview residents.
| Immigration Origin | # Population | % Population |
| Asia | 19 | 0.8% |
| Philippines | 19 | 0.8% |
| South Eastern Asia | 19 | 0.8% | View All 3 Rows |
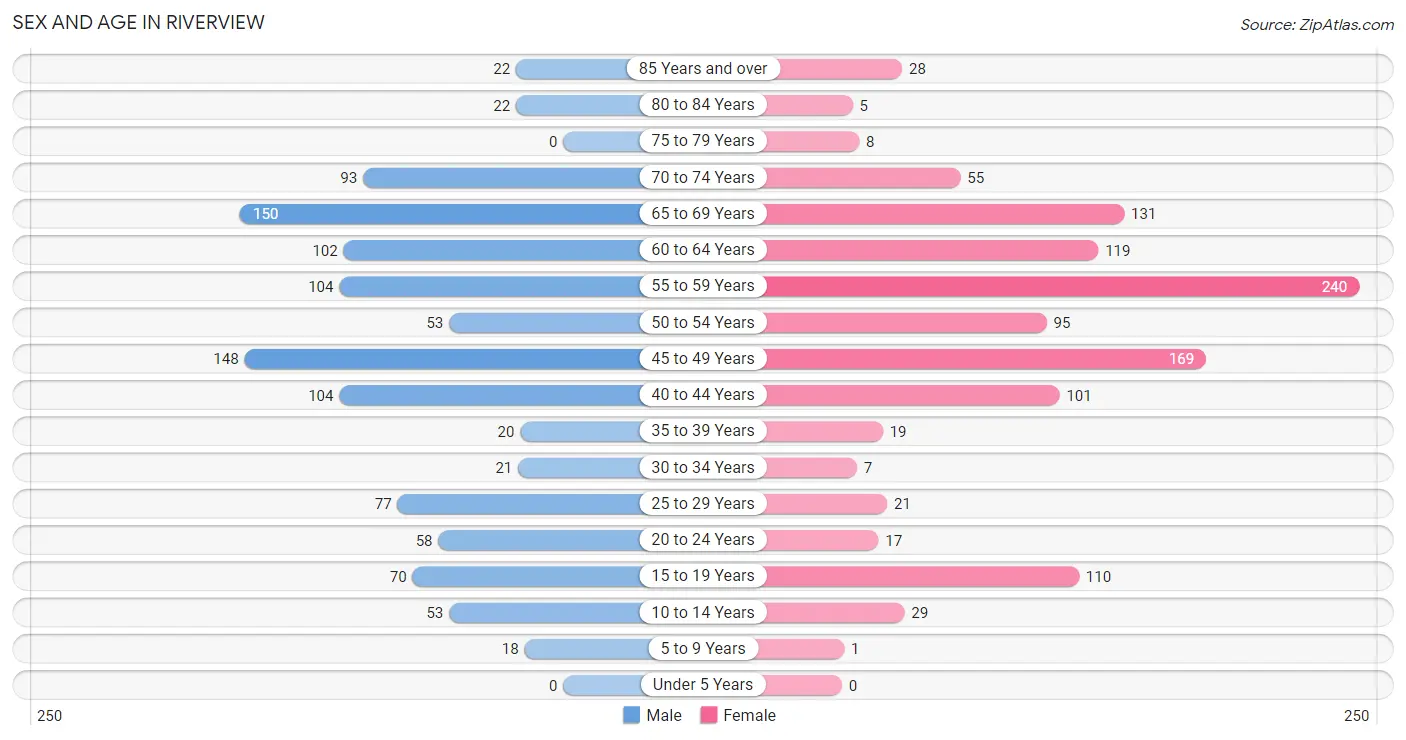
Sex and Age in Riverview
Sex and Age in Riverview
The most populous age groups in Riverview are 65 to 69 Years (150 | 13.5%) for men and 55 to 59 Years (240 | 20.8%) for women.
| Age Bracket | Male | Female |
| Under 5 Years | 0 (0.0%) | 0 (0.0%) |
| 5 to 9 Years | 18 (1.6%) | 1 (0.1%) |
| 10 to 14 Years | 53 (4.8%) | 29 (2.5%) |
| 15 to 19 Years | 70 (6.3%) | 110 (9.5%) |
| 20 to 24 Years | 58 (5.2%) | 17 (1.5%) |
| 25 to 29 Years | 77 (6.9%) | 21 (1.8%) |
| 30 to 34 Years | 21 (1.9%) | 7 (0.6%) |
| 35 to 39 Years | 20 (1.8%) | 19 (1.7%) |
| 40 to 44 Years | 104 (9.3%) | 101 (8.7%) |
| 45 to 49 Years | 148 (13.3%) | 169 (14.6%) |
| 50 to 54 Years | 53 (4.8%) | 95 (8.2%) |
| 55 to 59 Years | 104 (9.3%) | 240 (20.8%) |
| 60 to 64 Years | 102 (9.1%) | 119 (10.3%) |
| 65 to 69 Years | 150 (13.5%) | 131 (11.3%) |
| 70 to 74 Years | 93 (8.3%) | 55 (4.8%) |
| 75 to 79 Years | 0 (0.0%) | 8 (0.7%) |
| 80 to 84 Years | 22 (2.0%) | 5 (0.4%) |
| 85 Years and over | 22 (2.0%) | 28 (2.4%) |
| Total | 1,115 (100.0%) | 1,155 (100.0%) |
Families and Households in Riverview
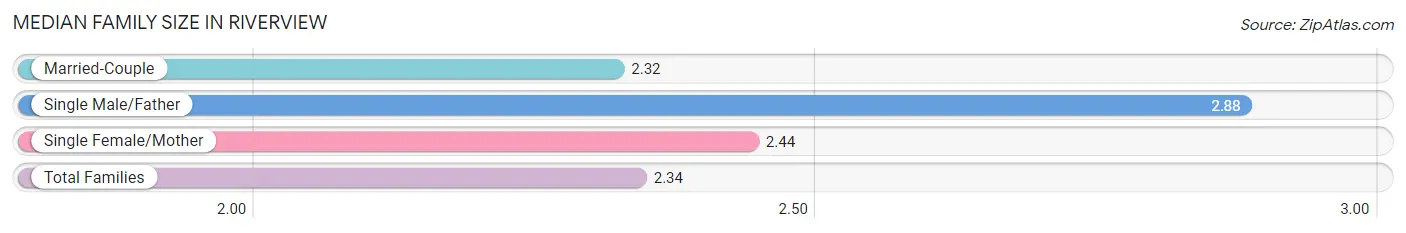
Median Family Size in Riverview
The median family size in Riverview is 2.34 persons per family, with single male/father families (34 | 3.7%) accounting for the largest median family size of 2.88 persons per family. On the other hand, married-couple families (831 | 90.1%) represent the smallest median family size with 2.32 persons per family.
| Family Type | # Families | Family Size |
| Married-Couple | 831 (90.1%) | 2.32 |
| Single Male/Father | 34 (3.7%) | 2.88 |
| Single Female/Mother | 57 (6.2%) | 2.44 |
| Total Families | 922 (100.0%) | 2.34 |
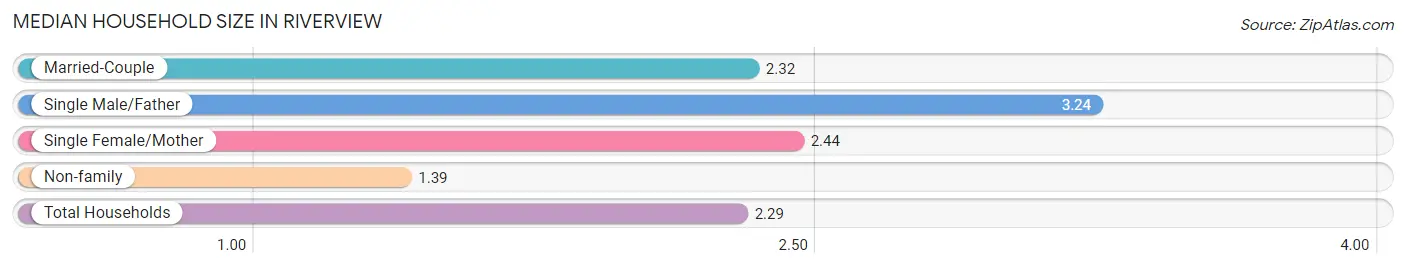
Median Household Size in Riverview
The median household size in Riverview is 2.29 persons per household, with single male/father households (34 | 3.4%) accounting for the largest median household size of 3.24 persons per household. non-family households (69 | 7.0%) represent the smallest median household size with 1.39 persons per household.
| Household Type | # Households | Household Size |
| Married-Couple | 831 (83.9%) | 2.32 |
| Single Male/Father | 34 (3.4%) | 3.24 |
| Single Female/Mother | 57 (5.8%) | 2.44 |
| Non-family | 69 (7.0%) | 1.39 |
| Total Households | 991 (100.0%) | 2.29 |
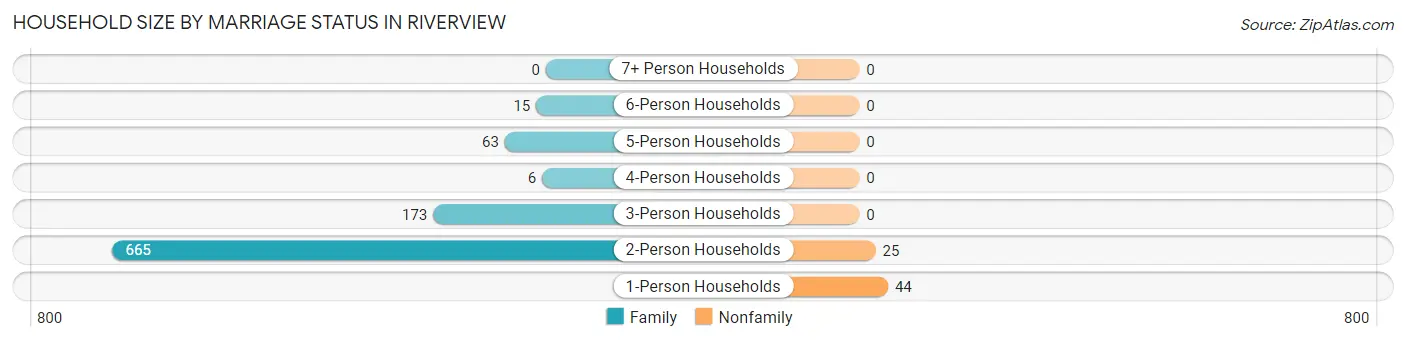
Household Size by Marriage Status in Riverview
Out of a total of 991 households in Riverview, 922 (93.0%) are family households, while 69 (7.0%) are nonfamily households. The most numerous type of family households are 2-person households, comprising 665, and the most common type of nonfamily households are 1-person households, comprising 44.
| Household Size | Family Households | Nonfamily Households |
| 1-Person Households | - | 44 (4.4%) |
| 2-Person Households | 665 (67.1%) | 25 (2.5%) |
| 3-Person Households | 173 (17.5%) | 0 (0.0%) |
| 4-Person Households | 6 (0.6%) | 0 (0.0%) |
| 5-Person Households | 63 (6.4%) | 0 (0.0%) |
| 6-Person Households | 15 (1.5%) | 0 (0.0%) |
| 7+ Person Households | 0 (0.0%) | 0 (0.0%) |
| Total | 922 (93.0%) | 69 (7.0%) |
Female Fertility in Riverview
Fertility by Age in Riverview
| Age Bracket | Women with Births | Births / 1,000 Women |
| 15 to 19 years | 0 (0.0%) | 0.0 |
| 20 to 34 years | 0 (0.0%) | 0.0 |
| 35 to 50 years | 0 (0.0%) | 0.0 |
| Total | 0 (0.0%) | 0.0 |
Fertility by Age by Marriage Status in Riverview
| Age Bracket | Married | Unmarried |
| 15 to 19 years | 0 (0.0%) | 0 (0.0%) |
| 20 to 34 years | 0 (0.0%) | 0 (0.0%) |
| 35 to 50 years | 0 (0.0%) | 0 (0.0%) |
| Total | 0 (0.0%) | 0 (0.0%) |
Fertility by Education in Riverview
| Educational Attainment | Women with Births | Births / 1,000 Women |
| Less than High School | 0 (0.0%) | 0.0 |
| High School Diploma | 0 (0.0%) | 0.0 |
| College or Associate's Degree | 0 (0.0%) | 0.0 |
| Bachelor's Degree | 0 (0.0%) | 0.0 |
| Graduate Degree | 0 (0.0%) | 0.0 |
| Total | 0 (0.0%) | 0.0 |
Fertility by Education by Marriage Status in Riverview
| Educational Attainment | Married | Unmarried |
| Less than High School | 0 (0.0%) | 0 (0.0%) |
| High School Diploma | 0 (0.0%) | 0 (0.0%) |
| College or Associate's Degree | 0 (0.0%) | 0 (0.0%) |
| Bachelor's Degree | 0 (0.0%) | 0 (0.0%) |
| Graduate Degree | 0 (0.0%) | 0 (0.0%) |
| Total | 0 (0.0%) | 0 (0.0%) |
Employment Characteristics in Riverview
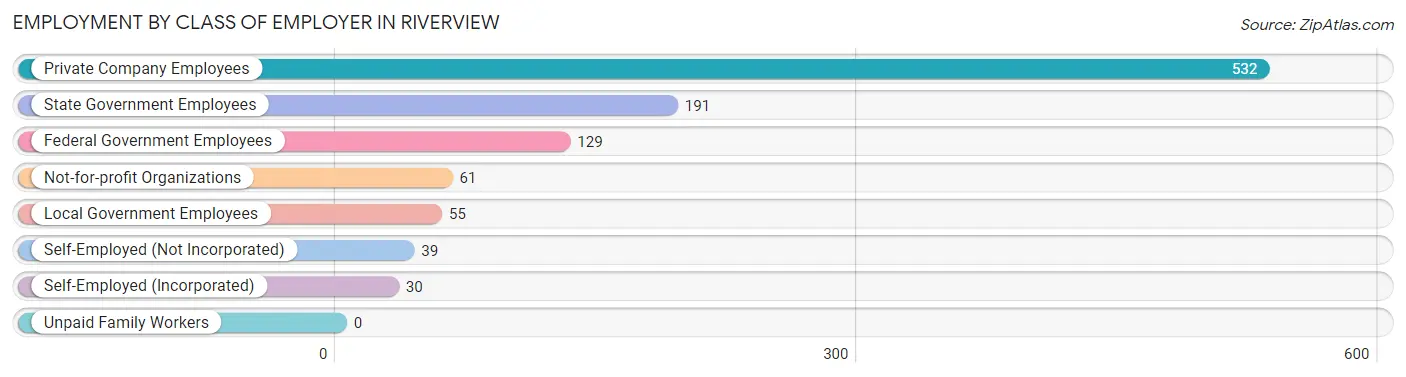
Employment by Class of Employer in Riverview
Among the 1,037 employed individuals in Riverview, private company employees (532 | 51.3%), state government employees (191 | 18.4%), and federal government employees (129 | 12.4%) make up the most common classes of employment.
| Employer Class | # Employees | % Employees |
| Private Company Employees | 532 | 51.3% |
| Self-Employed (Incorporated) | 30 | 2.9% |
| Self-Employed (Not Incorporated) | 39 | 3.8% |
| Not-for-profit Organizations | 61 | 5.9% |
| Local Government Employees | 55 | 5.3% |
| State Government Employees | 191 | 18.4% |
| Federal Government Employees | 129 | 12.4% |
| Unpaid Family Workers | 0 | 0.0% |
| Total | 1,037 | 100.0% |
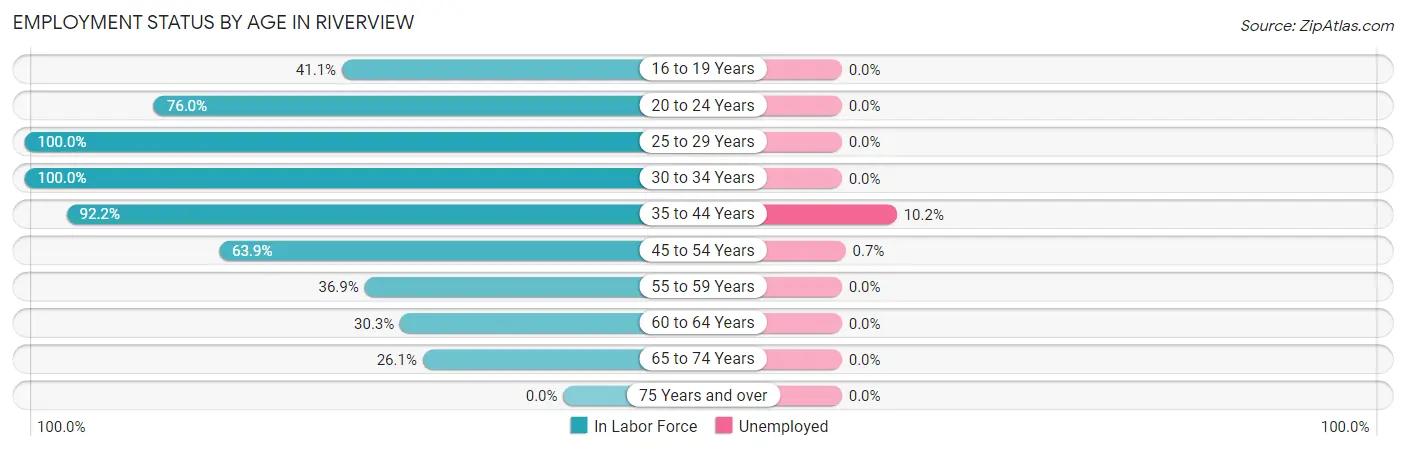
Employment Status by Age in Riverview
According to the labor force statistics for Riverview, out of the total population over 16 years of age (2,096), 50.3% or 1,054 individuals are in the labor force, with 1.8% or 19 of them unemployed. The age group with the highest labor force participation rate is 25 to 29 years, with 100.0% or 98 individuals in the labor force. Within the labor force, the 35 to 44 years age range has the highest percentage of unemployed individuals, with 10.2% or 23 of them being unemployed.
| Age Bracket | In Labor Force | Unemployed |
| 16 to 19 Years | 44 (41.1%) | 0 (0.0%) |
| 20 to 24 Years | 57 (76.0%) | 0 (0.0%) |
| 25 to 29 Years | 98 (100.0%) | 0 (0.0%) |
| 30 to 34 Years | 28 (100.0%) | 0 (0.0%) |
| 35 to 44 Years | 225 (92.2%) | 23 (10.2%) |
| 45 to 54 Years | 297 (63.9%) | 2 (0.7%) |
| 55 to 59 Years | 127 (36.9%) | 0 (0.0%) |
| 60 to 64 Years | 67 (30.3%) | 0 (0.0%) |
| 65 to 74 Years | 112 (26.1%) | 0 (0.0%) |
| 75 Years and over | 0 (0.0%) | 0 (0.0%) |
| Total | 1,054 (50.3%) | 19 (1.8%) |
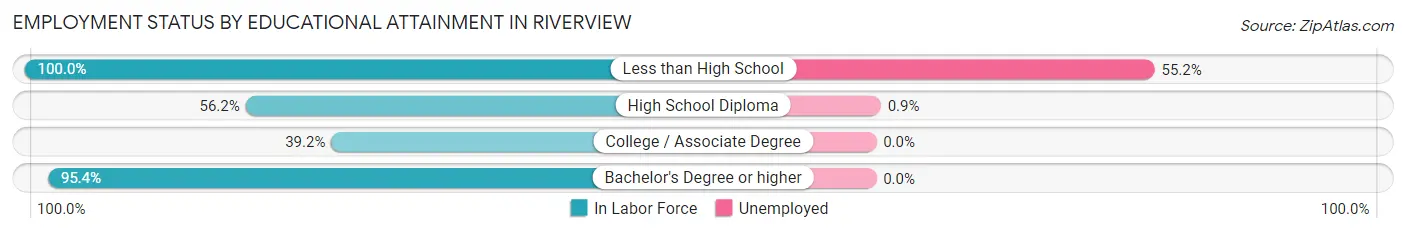
Employment Status by Educational Attainment in Riverview
According to labor force statistics for Riverview, 60.1% of individuals (841) out of the total population between 25 and 64 years of age (1,400) are in the labor force, with 2.3% or 19 of them being unemployed. The group with the highest labor force participation rate are those with the educational attainment of less than high school, with 100.0% or 29 individuals in the labor force. Within the labor force, individuals with less than high school education have the highest percentage of unemployment, with 55.2% or 16 of them being unemployed.
| Educational Attainment | In Labor Force | Unemployed |
| Less than High School | 29 (100.0%) | 16 (55.2%) |
| High School Diploma | 217 (56.2%) | 3 (0.9%) |
| College / Associate Degree | 240 (39.2%) | 0 (0.0%) |
| Bachelor's Degree or higher | 356 (95.4%) | 0 (0.0%) |
| Total | 841 (60.1%) | 32 (2.3%) |
Employment Occupations by Sex in Riverview
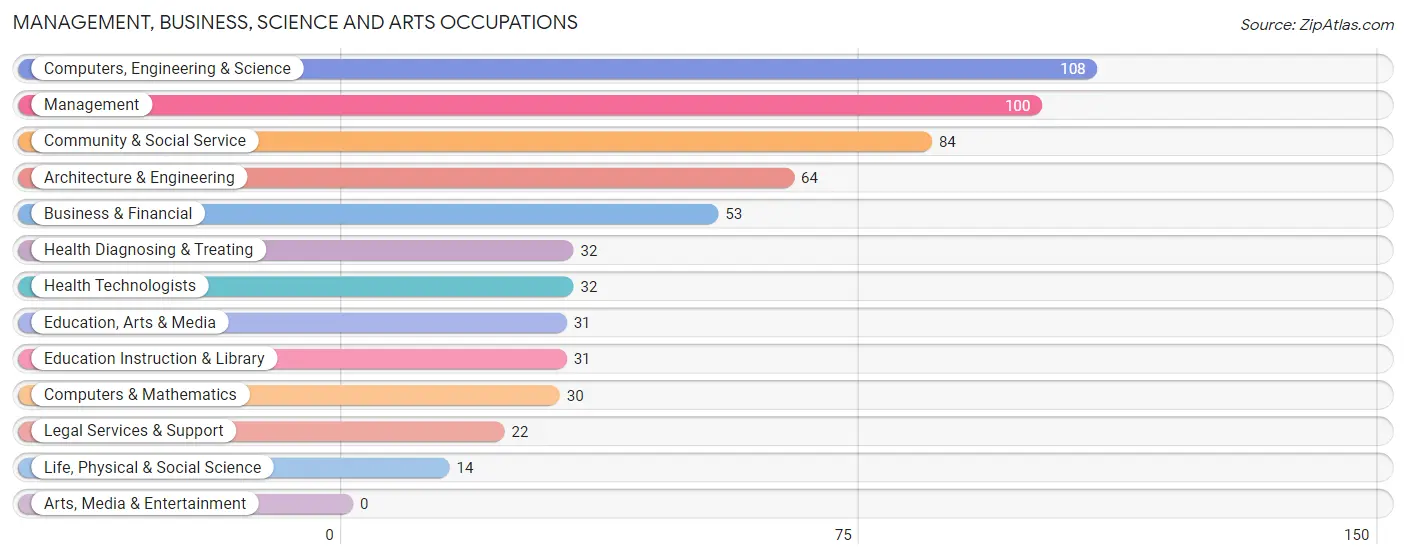
Management, Business, Science and Arts Occupations
The most common Management, Business, Science and Arts occupations in Riverview are Computers, Engineering & Science (108 | 11.2%), Management (100 | 10.3%), Community & Social Service (84 | 8.7%), Architecture & Engineering (64 | 6.6%), and Business & Financial (53 | 5.5%).
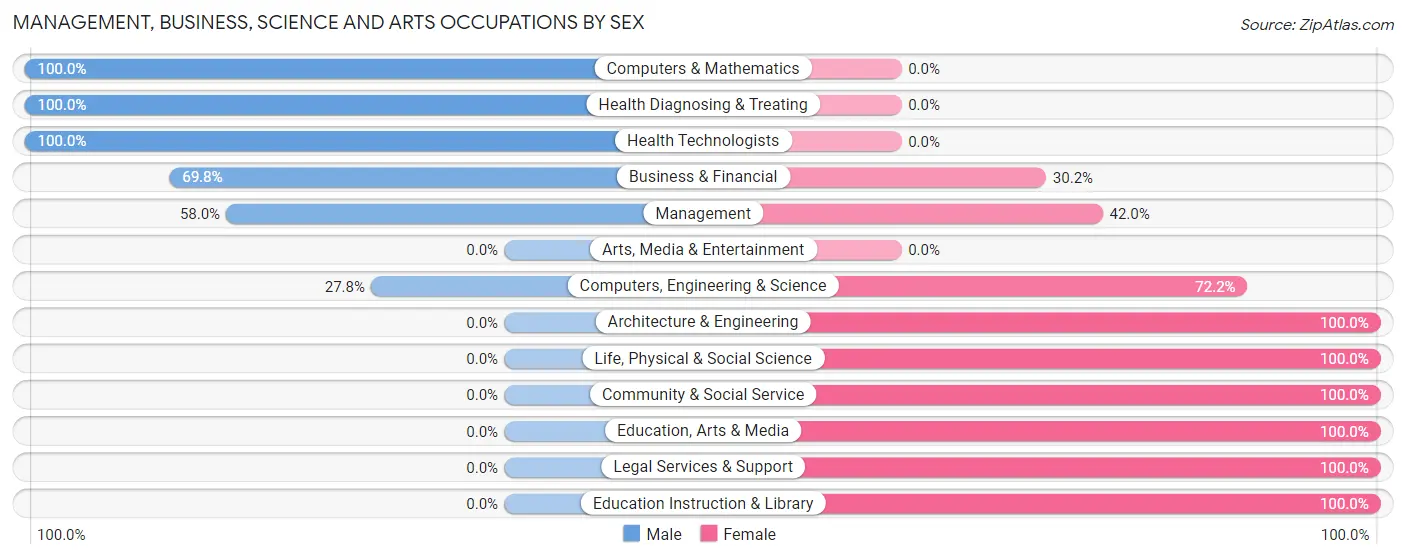
Management, Business, Science and Arts Occupations by Sex
Within the Management, Business, Science and Arts occupations in Riverview, the most male-oriented occupations are Computers & Mathematics (100.0%), Health Diagnosing & Treating (100.0%), and Health Technologists (100.0%), while the most female-oriented occupations are Architecture & Engineering (100.0%), Life, Physical & Social Science (100.0%), and Community & Social Service (100.0%).
| Occupation | Male | Female |
| Management | 58 (58.0%) | 42 (42.0%) |
| Business & Financial | 37 (69.8%) | 16 (30.2%) |
| Computers, Engineering & Science | 30 (27.8%) | 78 (72.2%) |
| Computers & Mathematics | 30 (100.0%) | 0 (0.0%) |
| Architecture & Engineering | 0 (0.0%) | 64 (100.0%) |
| Life, Physical & Social Science | 0 (0.0%) | 14 (100.0%) |
| Community & Social Service | 0 (0.0%) | 84 (100.0%) |
| Education, Arts & Media | 0 (0.0%) | 31 (100.0%) |
| Legal Services & Support | 0 (0.0%) | 22 (100.0%) |
| Education Instruction & Library | 0 (0.0%) | 31 (100.0%) |
| Arts, Media & Entertainment | 0 (0.0%) | 0 (0.0%) |
| Health Diagnosing & Treating | 32 (100.0%) | 0 (0.0%) |
| Health Technologists | 32 (100.0%) | 0 (0.0%) |
| Total (Category) | 157 (41.6%) | 220 (58.4%) |
| Total (Overall) | 495 (51.1%) | 474 (48.9%) |
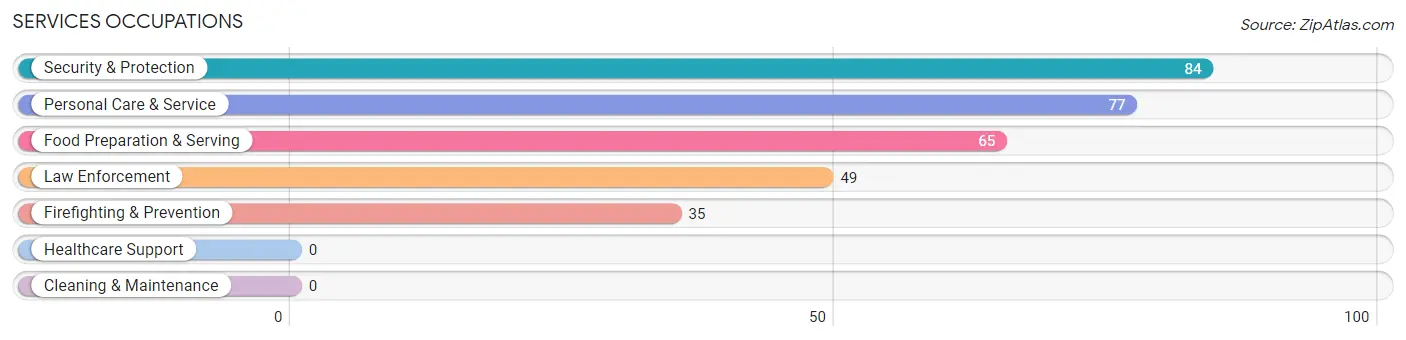
Services Occupations
The most common Services occupations in Riverview are Security & Protection (84 | 8.7%), Personal Care & Service (77 | 8.0%), Food Preparation & Serving (65 | 6.7%), Law Enforcement (49 | 5.1%), and Firefighting & Prevention (35 | 3.6%).
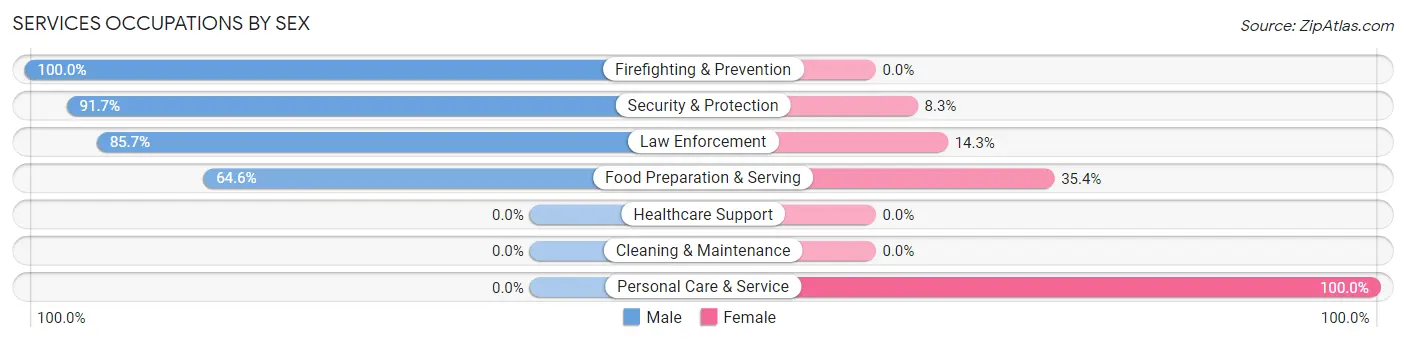
Services Occupations by Sex
Within the Services occupations in Riverview, the most male-oriented occupations are Firefighting & Prevention (100.0%), Security & Protection (91.7%), and Law Enforcement (85.7%), while the most female-oriented occupations are Personal Care & Service (100.0%), Food Preparation & Serving (35.4%), and Law Enforcement (14.3%).
| Occupation | Male | Female |
| Healthcare Support | 0 (0.0%) | 0 (0.0%) |
| Security & Protection | 77 (91.7%) | 7 (8.3%) |
| Firefighting & Prevention | 35 (100.0%) | 0 (0.0%) |
| Law Enforcement | 42 (85.7%) | 7 (14.3%) |
| Food Preparation & Serving | 42 (64.6%) | 23 (35.4%) |
| Cleaning & Maintenance | 0 (0.0%) | 0 (0.0%) |
| Personal Care & Service | 0 (0.0%) | 77 (100.0%) |
| Total (Category) | 119 (52.6%) | 107 (47.3%) |
| Total (Overall) | 495 (51.1%) | 474 (48.9%) |
Sales and Office Occupations
The most common Sales and Office occupations in Riverview are Office & Administration (160 | 16.5%), and Sales & Related (48 | 5.0%).

Sales and Office Occupations by Sex

| Occupation | Male | Female |
| Sales & Related | 48 (100.0%) | 0 (0.0%) |
| Office & Administration | 30 (18.8%) | 130 (81.2%) |
| Total (Category) | 78 (37.5%) | 130 (62.5%) |
| Total (Overall) | 495 (51.1%) | 474 (48.9%) |
Natural Resources, Construction and Maintenance Occupations
The most common Natural Resources, Construction and Maintenance occupations in Riverview are Construction & Extraction (86 | 8.9%), and Installation, Maintenance & Repair (27 | 2.8%).
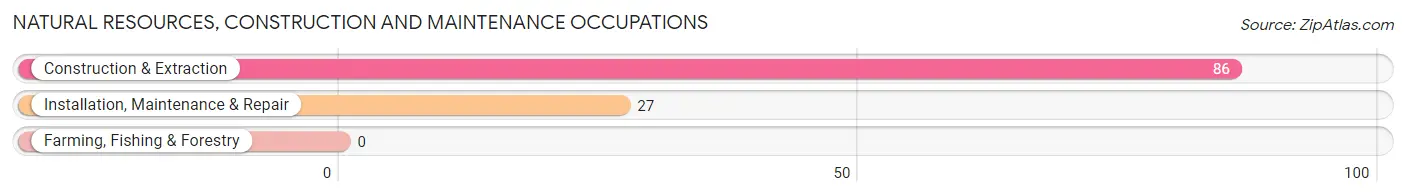
Natural Resources, Construction and Maintenance Occupations by Sex

| Occupation | Male | Female |
| Farming, Fishing & Forestry | 0 (0.0%) | 0 (0.0%) |
| Construction & Extraction | 86 (100.0%) | 0 (0.0%) |
| Installation, Maintenance & Repair | 27 (100.0%) | 0 (0.0%) |
| Total (Category) | 113 (100.0%) | 0 (0.0%) |
| Total (Overall) | 495 (51.1%) | 474 (48.9%) |
Production, Transportation and Moving Occupations
The most common Production, Transportation and Moving occupations in Riverview are Transportation (26 | 2.7%), and Material Moving (19 | 2.0%).
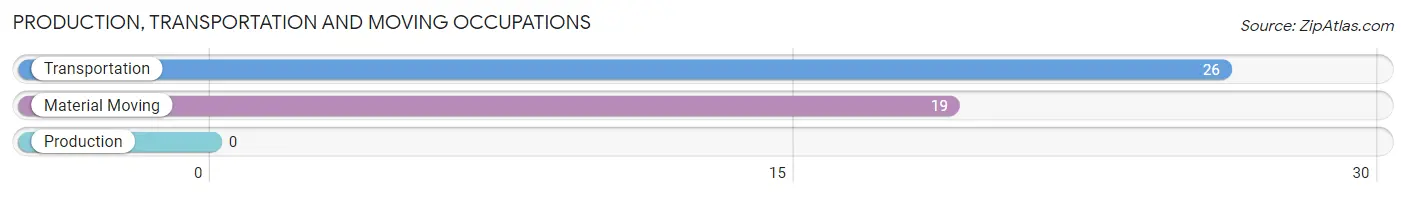
Production, Transportation and Moving Occupations by Sex
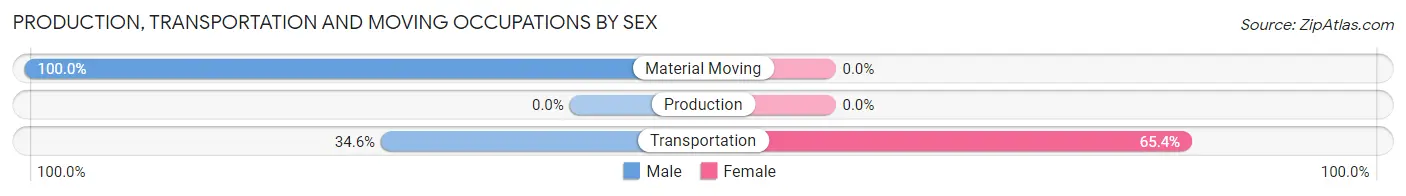
| Occupation | Male | Female |
| Production | 0 (0.0%) | 0 (0.0%) |
| Transportation | 9 (34.6%) | 17 (65.4%) |
| Material Moving | 19 (100.0%) | 0 (0.0%) |
| Total (Category) | 28 (62.2%) | 17 (37.8%) |
| Total (Overall) | 495 (51.1%) | 474 (48.9%) |
Employment Industries by Sex in Riverview
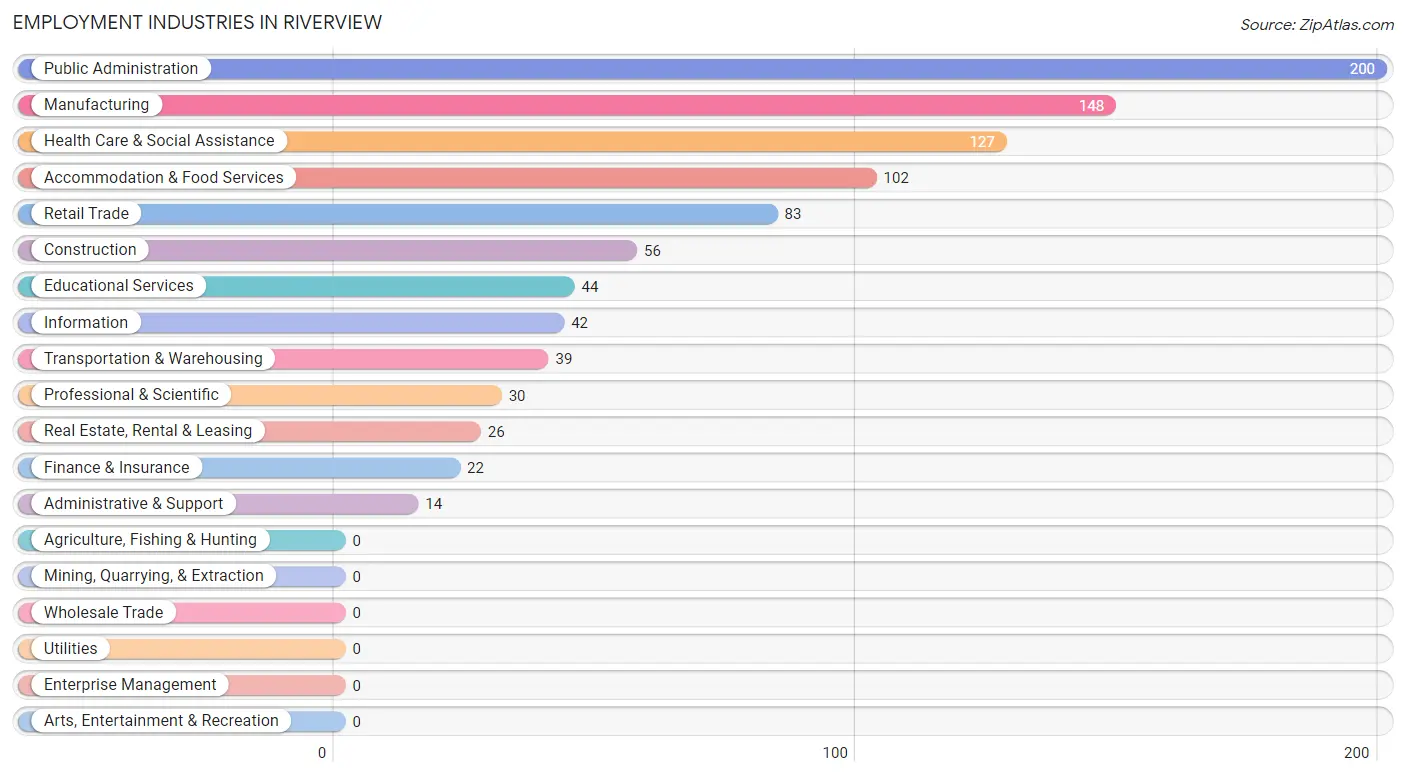
Employment Industries in Riverview
The major employment industries in Riverview include Public Administration (200 | 20.6%), Manufacturing (148 | 15.3%), Health Care & Social Assistance (127 | 13.1%), Accommodation & Food Services (102 | 10.5%), and Retail Trade (83 | 8.6%).
Employment Industries by Sex in Riverview
The Riverview industries that see more men than women are Construction (100.0%), Retail Trade (100.0%), and Transportation & Warehousing (100.0%), whereas the industries that tend to have a higher number of women are Real Estate, Rental & Leasing (100.0%), Educational Services (100.0%), and Finance & Insurance (95.5%).
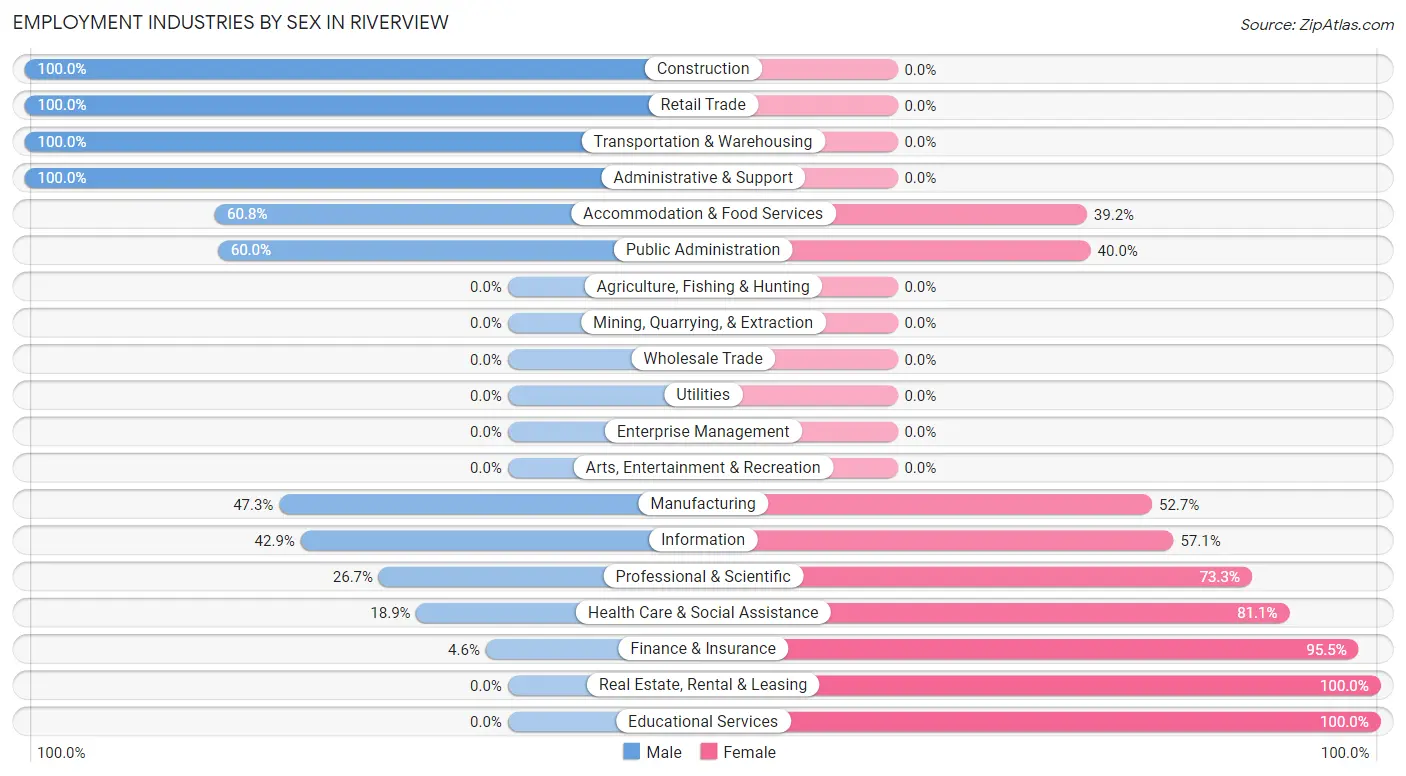
| Industry | Male | Female |
| Agriculture, Fishing & Hunting | 0 (0.0%) | 0 (0.0%) |
| Mining, Quarrying, & Extraction | 0 (0.0%) | 0 (0.0%) |
| Construction | 56 (100.0%) | 0 (0.0%) |
| Manufacturing | 70 (47.3%) | 78 (52.7%) |
| Wholesale Trade | 0 (0.0%) | 0 (0.0%) |
| Retail Trade | 83 (100.0%) | 0 (0.0%) |
| Transportation & Warehousing | 39 (100.0%) | 0 (0.0%) |
| Utilities | 0 (0.0%) | 0 (0.0%) |
| Information | 18 (42.9%) | 24 (57.1%) |
| Finance & Insurance | 1 (4.5%) | 21 (95.5%) |
| Real Estate, Rental & Leasing | 0 (0.0%) | 26 (100.0%) |
| Professional & Scientific | 8 (26.7%) | 22 (73.3%) |
| Enterprise Management | 0 (0.0%) | 0 (0.0%) |
| Administrative & Support | 14 (100.0%) | 0 (0.0%) |
| Educational Services | 0 (0.0%) | 44 (100.0%) |
| Health Care & Social Assistance | 24 (18.9%) | 103 (81.1%) |
| Arts, Entertainment & Recreation | 0 (0.0%) | 0 (0.0%) |
| Accommodation & Food Services | 62 (60.8%) | 40 (39.2%) |
| Public Administration | 120 (60.0%) | 80 (40.0%) |
| Total | 495 (51.1%) | 474 (48.9%) |
Education in Riverview
School Enrollment in Riverview
The most common levels of schooling among the 330 students in Riverview are high school (174 | 52.7%), college / undergraduate (90 | 27.3%), and middle school (42 | 12.7%).
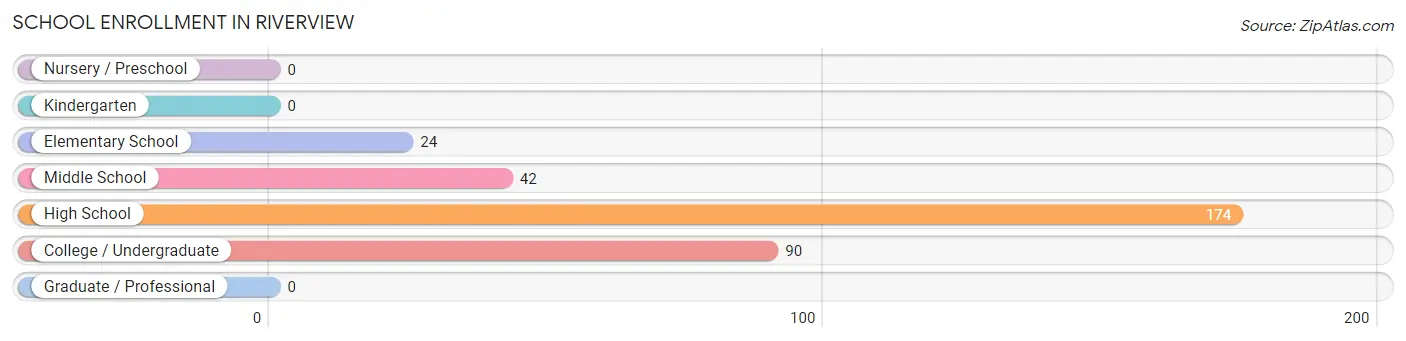
| School Level | # Students | % Students |
| Nursery / Preschool | 0 | 0.0% |
| Kindergarten | 0 | 0.0% |
| Elementary School | 24 | 7.3% |
| Middle School | 42 | 12.7% |
| High School | 174 | 52.7% |
| College / Undergraduate | 90 | 27.3% |
| Graduate / Professional | 0 | 0.0% |
| Total | 330 | 100.0% |
School Enrollment by Age by Funding Source in Riverview
Out of a total of 330 students who are enrolled in schools in Riverview, 27 (8.2%) attend a private institution, while the remaining 303 (91.8%) are enrolled in public schools. The age group of 18 to 19 year olds has the highest likelihood of being enrolled in private schools, with 23 (100.0% in the age bracket) enrolled. Conversely, the age group of 5 to 9 year old has the lowest likelihood of being enrolled in a private school, with 1 (100.0% in the age bracket) attending a public institution.
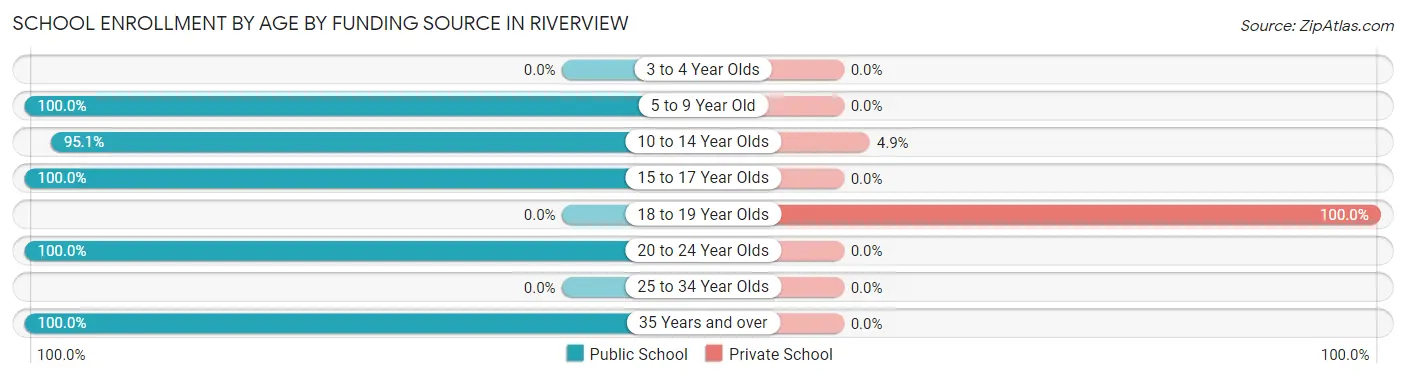
| Age Bracket | Public School | Private School |
| 3 to 4 Year Olds | 0 (0.0%) | 0 (0.0%) |
| 5 to 9 Year Old | 1 (100.0%) | 0 (0.0%) |
| 10 to 14 Year Olds | 78 (95.1%) | 4 (4.9%) |
| 15 to 17 Year Olds | 157 (100.0%) | 0 (0.0%) |
| 18 to 19 Year Olds | 0 (0.0%) | 23 (100.0%) |
| 20 to 24 Year Olds | 45 (100.0%) | 0 (0.0%) |
| 25 to 34 Year Olds | 0 (0.0%) | 0 (0.0%) |
| 35 Years and over | 22 (100.0%) | 0 (0.0%) |
| Total | 303 (91.8%) | 27 (8.2%) |
Educational Attainment by Field of Study in Riverview
Business (152 | 28.5%), science & technology (100 | 18.7%), liberal arts & history (70 | 13.1%), literature & languages (40 | 7.5%), and psychology (36 | 6.7%) are the most common fields of study among 534 individuals in Riverview who have obtained a bachelor's degree or higher.
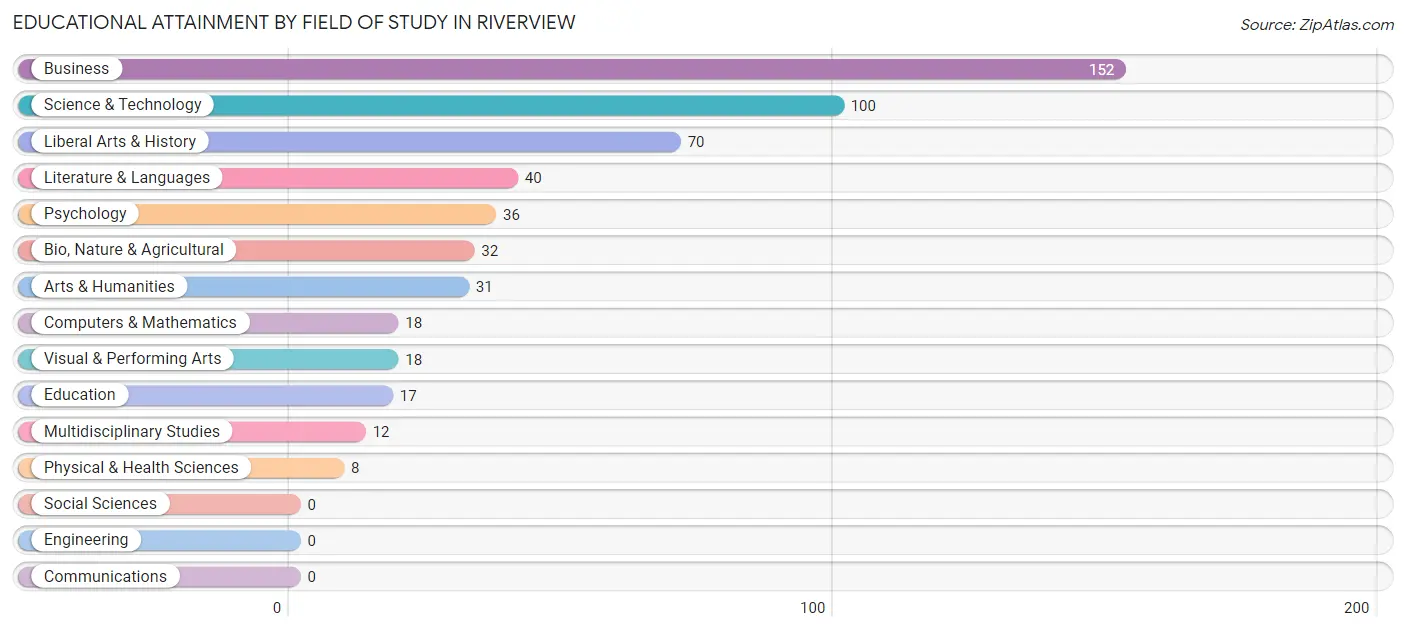
| Field of Study | # Graduates | % Graduates |
| Computers & Mathematics | 18 | 3.4% |
| Bio, Nature & Agricultural | 32 | 6.0% |
| Physical & Health Sciences | 8 | 1.5% |
| Psychology | 36 | 6.7% |
| Social Sciences | 0 | 0.0% |
| Engineering | 0 | 0.0% |
| Multidisciplinary Studies | 12 | 2.2% |
| Science & Technology | 100 | 18.7% |
| Business | 152 | 28.5% |
| Education | 17 | 3.2% |
| Literature & Languages | 40 | 7.5% |
| Liberal Arts & History | 70 | 13.1% |
| Visual & Performing Arts | 18 | 3.4% |
| Communications | 0 | 0.0% |
| Arts & Humanities | 31 | 5.8% |
| Total | 534 | 100.0% |
Transportation & Commute in Riverview
Vehicle Availability by Sex in Riverview
The most prevalent vehicle ownership categories in Riverview are males with 3 vehicles (306, accounting for 54.3%) and females with 3 vehicles (153, making up 64.6%).
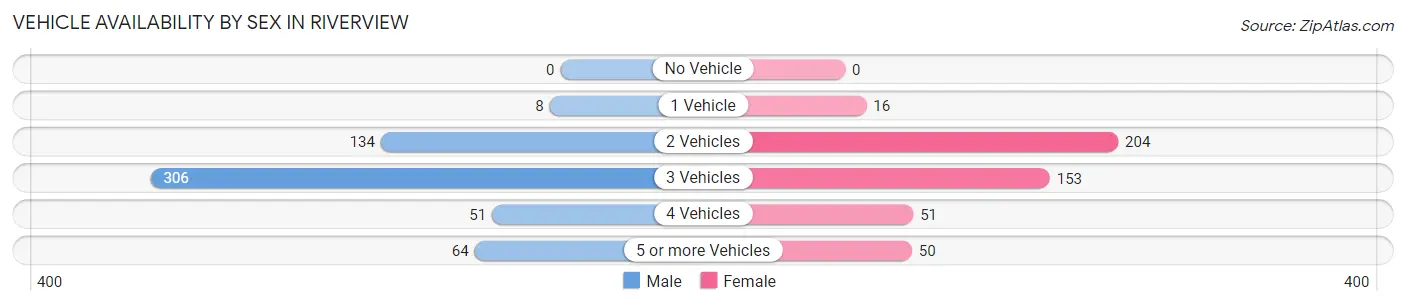
| Vehicles Available | Male | Female |
| No Vehicle | 0 (0.0%) | 0 (0.0%) |
| 1 Vehicle | 8 (1.4%) | 16 (3.4%) |
| 2 Vehicles | 134 (23.8%) | 204 (43.0%) |
| 3 Vehicles | 306 (54.3%) | 153 (32.3%) |
| 4 Vehicles | 51 (9.1%) | 51 (10.8%) |
| 5 or more Vehicles | 64 (11.4%) | 50 (10.5%) |
| Total | 563 (100.0%) | 474 (100.0%) |
Commute Time in Riverview
The most frequently occuring commute durations in Riverview are 20 to 24 minutes (235 commuters, 26.8%), 30 to 34 minutes (180 commuters, 20.5%), and 25 to 29 minutes (147 commuters, 16.8%).
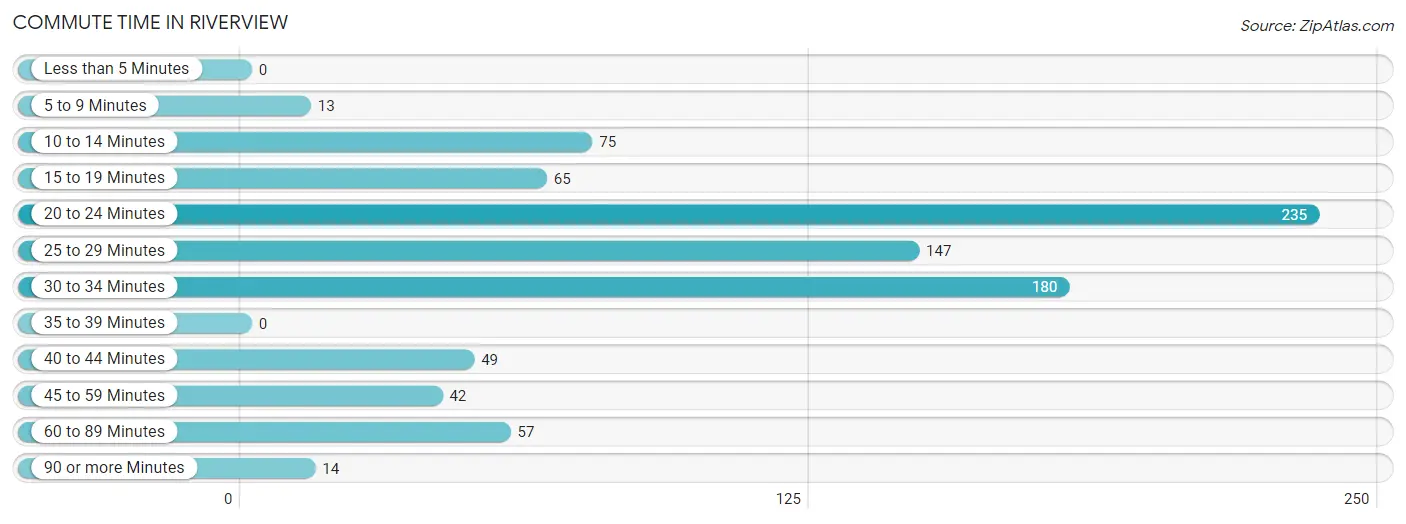
| Commute Time | # Commuters | % Commuters |
| Less than 5 Minutes | 0 | 0.0% |
| 5 to 9 Minutes | 13 | 1.5% |
| 10 to 14 Minutes | 75 | 8.6% |
| 15 to 19 Minutes | 65 | 7.4% |
| 20 to 24 Minutes | 235 | 26.8% |
| 25 to 29 Minutes | 147 | 16.8% |
| 30 to 34 Minutes | 180 | 20.5% |
| 35 to 39 Minutes | 0 | 0.0% |
| 40 to 44 Minutes | 49 | 5.6% |
| 45 to 59 Minutes | 42 | 4.8% |
| 60 to 89 Minutes | 57 | 6.5% |
| 90 or more Minutes | 14 | 1.6% |
Commute Time by Sex in Riverview
The most common commute times in Riverview are 30 to 34 minutes (134 commuters, 26.0%) for males and 20 to 24 minutes (133 commuters, 36.8%) for females.
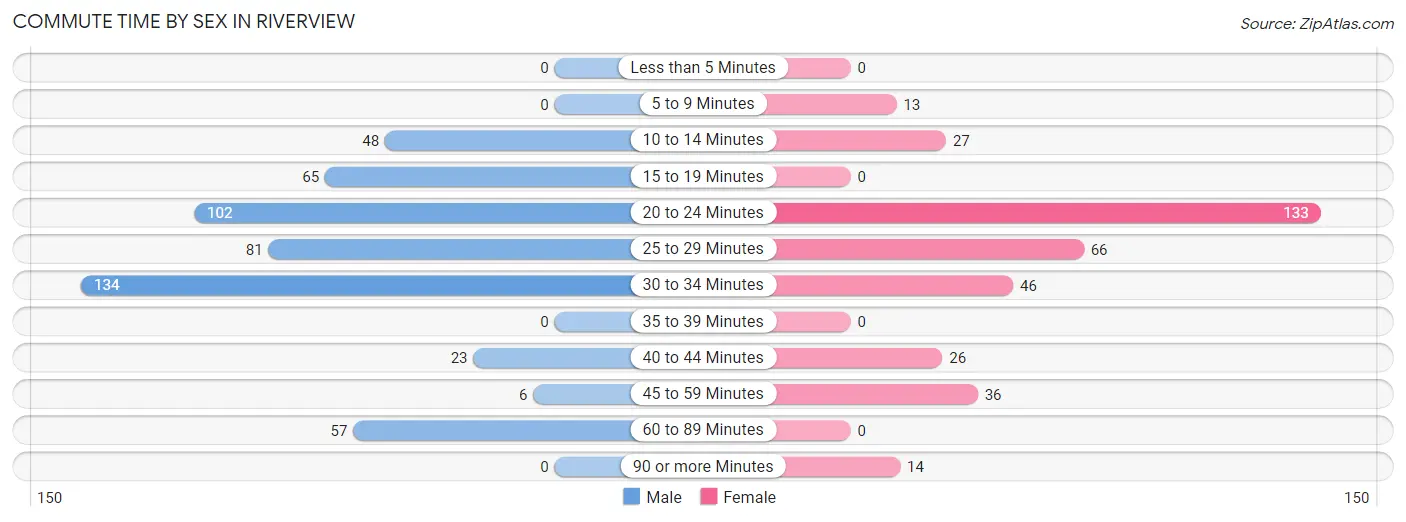
| Commute Time | Male | Female |
| Less than 5 Minutes | 0 (0.0%) | 0 (0.0%) |
| 5 to 9 Minutes | 0 (0.0%) | 13 (3.6%) |
| 10 to 14 Minutes | 48 (9.3%) | 27 (7.5%) |
| 15 to 19 Minutes | 65 (12.6%) | 0 (0.0%) |
| 20 to 24 Minutes | 102 (19.8%) | 133 (36.8%) |
| 25 to 29 Minutes | 81 (15.7%) | 66 (18.3%) |
| 30 to 34 Minutes | 134 (26.0%) | 46 (12.7%) |
| 35 to 39 Minutes | 0 (0.0%) | 0 (0.0%) |
| 40 to 44 Minutes | 23 (4.5%) | 26 (7.2%) |
| 45 to 59 Minutes | 6 (1.2%) | 36 (10.0%) |
| 60 to 89 Minutes | 57 (11.1%) | 0 (0.0%) |
| 90 or more Minutes | 0 (0.0%) | 14 (3.9%) |
Time of Departure to Work by Sex in Riverview
The most frequent times of departure to work in Riverview are 7:00 AM to 7:29 AM (173, 33.5%) for males and 7:00 AM to 7:29 AM (171, 47.4%) for females.
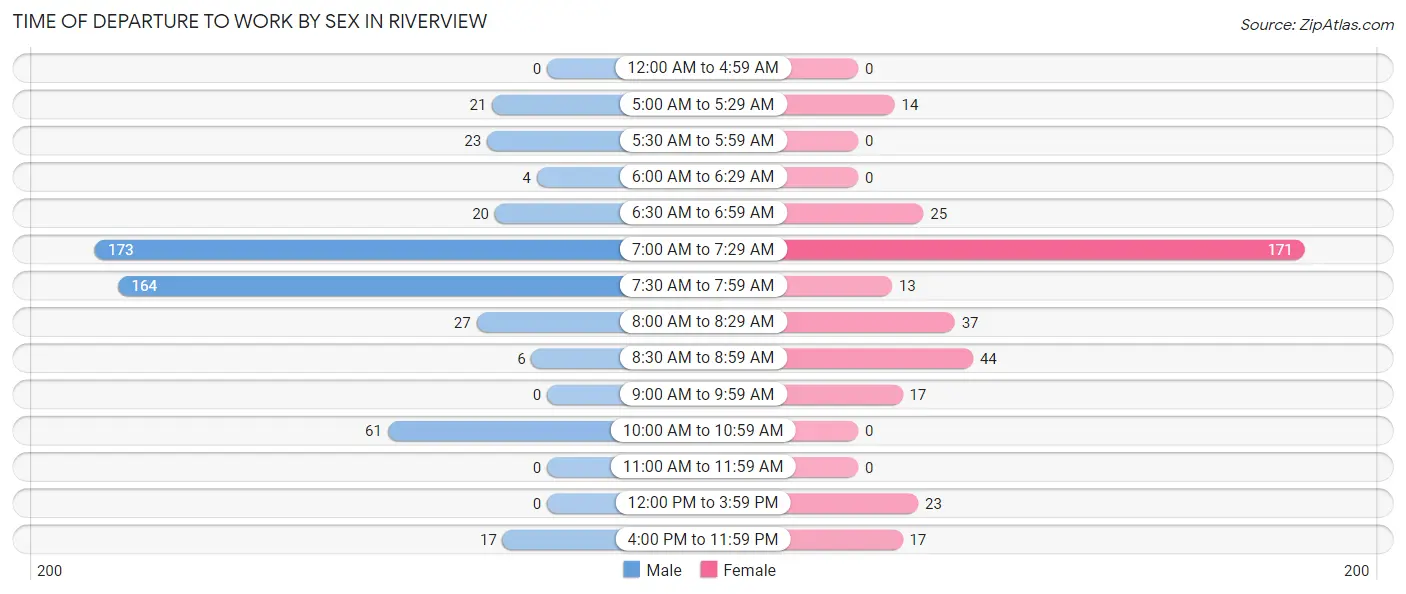
| Time of Departure | Male | Female |
| 12:00 AM to 4:59 AM | 0 (0.0%) | 0 (0.0%) |
| 5:00 AM to 5:29 AM | 21 (4.1%) | 14 (3.9%) |
| 5:30 AM to 5:59 AM | 23 (4.5%) | 0 (0.0%) |
| 6:00 AM to 6:29 AM | 4 (0.8%) | 0 (0.0%) |
| 6:30 AM to 6:59 AM | 20 (3.9%) | 25 (6.9%) |
| 7:00 AM to 7:29 AM | 173 (33.5%) | 171 (47.4%) |
| 7:30 AM to 7:59 AM | 164 (31.8%) | 13 (3.6%) |
| 8:00 AM to 8:29 AM | 27 (5.2%) | 37 (10.2%) |
| 8:30 AM to 8:59 AM | 6 (1.2%) | 44 (12.2%) |
| 9:00 AM to 9:59 AM | 0 (0.0%) | 17 (4.7%) |
| 10:00 AM to 10:59 AM | 61 (11.8%) | 0 (0.0%) |
| 11:00 AM to 11:59 AM | 0 (0.0%) | 0 (0.0%) |
| 12:00 PM to 3:59 PM | 0 (0.0%) | 23 (6.4%) |
| 4:00 PM to 11:59 PM | 17 (3.3%) | 17 (4.7%) |
| Total | 516 (100.0%) | 361 (100.0%) |
Housing Occupancy in Riverview
Occupancy by Ownership in Riverview
Of the total 991 dwellings in Riverview, owner-occupied units account for 974 (98.3%), while renter-occupied units make up 17 (1.7%).
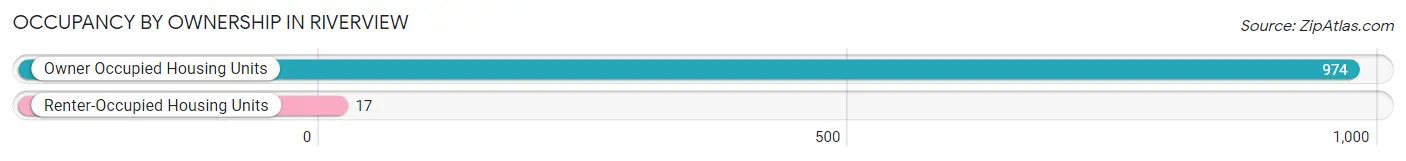
| Occupancy | # Housing Units | % Housing Units |
| Owner Occupied Housing Units | 974 | 98.3% |
| Renter-Occupied Housing Units | 17 | 1.7% |
| Total Occupied Housing Units | 991 | 100.0% |
Occupancy by Household Size in Riverview
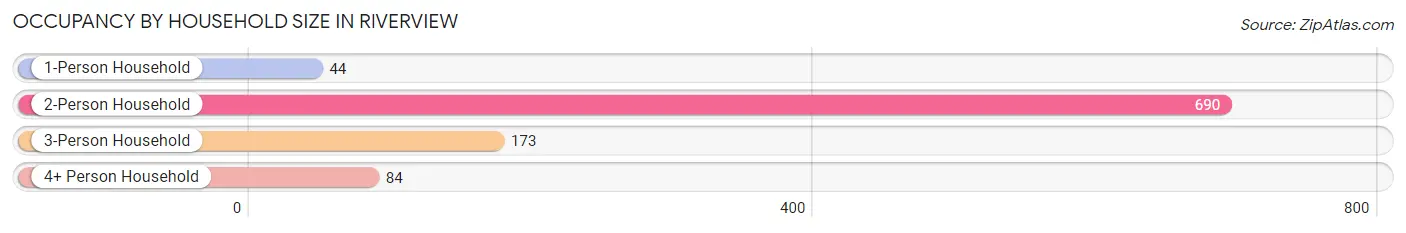
| Household Size | # Housing Units | % Housing Units |
| 1-Person Household | 44 | 4.4% |
| 2-Person Household | 690 | 69.6% |
| 3-Person Household | 173 | 17.5% |
| 4+ Person Household | 84 | 8.5% |
| Total Housing Units | 991 | 100.0% |
Occupancy by Ownership by Household Size in Riverview
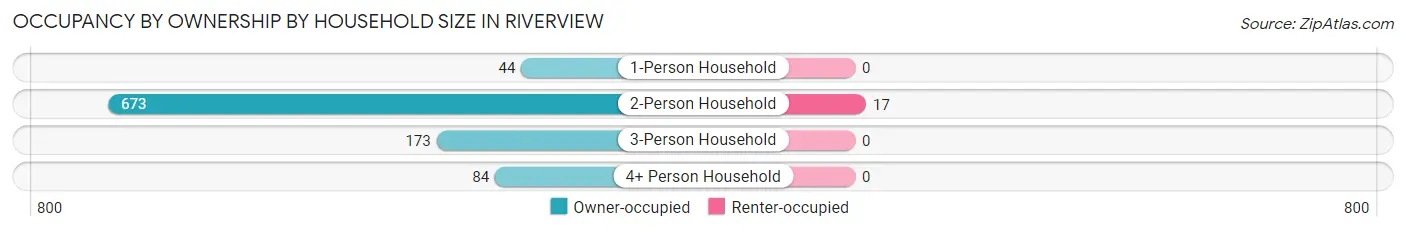
| Household Size | Owner-occupied | Renter-occupied |
| 1-Person Household | 44 (100.0%) | 0 (0.0%) |
| 2-Person Household | 673 (97.5%) | 17 (2.5%) |
| 3-Person Household | 173 (100.0%) | 0 (0.0%) |
| 4+ Person Household | 84 (100.0%) | 0 (0.0%) |
| Total Housing Units | 974 (98.3%) | 17 (1.7%) |
Occupancy by Educational Attainment in Riverview
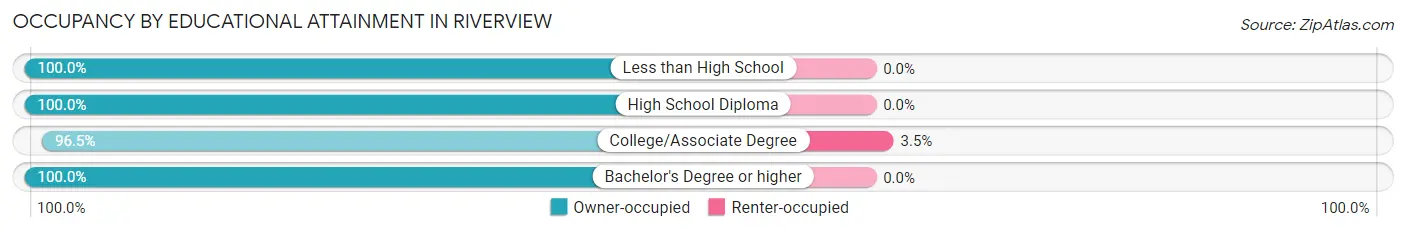
| Household Size | Owner-occupied | Renter-occupied |
| Less than High School | 13 (100.0%) | 0 (0.0%) |
| High School Diploma | 204 (100.0%) | 0 (0.0%) |
| College/Associate Degree | 474 (96.5%) | 17 (3.5%) |
| Bachelor's Degree or higher | 283 (100.0%) | 0 (0.0%) |
Occupancy by Age of Householder in Riverview
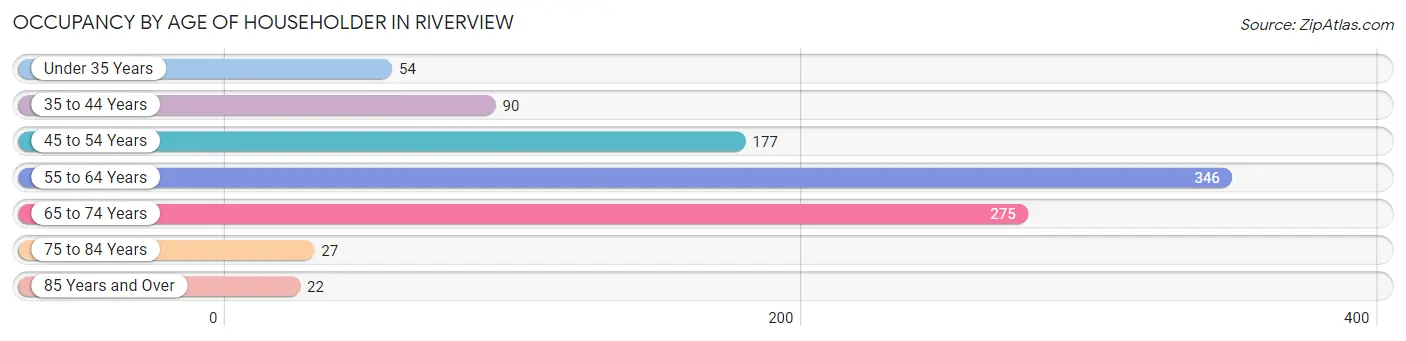
| Age Bracket | # Households | % Households |
| Under 35 Years | 54 | 5.4% |
| 35 to 44 Years | 90 | 9.1% |
| 45 to 54 Years | 177 | 17.9% |
| 55 to 64 Years | 346 | 34.9% |
| 65 to 74 Years | 275 | 27.8% |
| 75 to 84 Years | 27 | 2.7% |
| 85 Years and Over | 22 | 2.2% |
| Total | 991 | 100.0% |
Housing Finances in Riverview
Median Income by Occupancy in Riverview
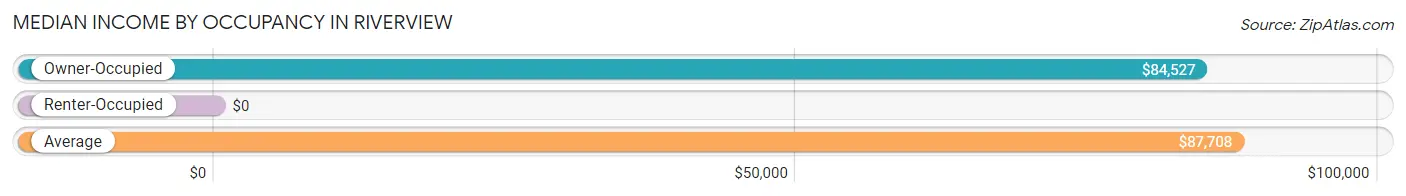
| Occupancy Type | # Households | Median Income |
| Owner-Occupied | 974 (98.3%) | $84,527 |
| Renter-Occupied | 17 (1.7%) | $0 |
| Average | 991 (100.0%) | $87,708 |
Occupancy by Householder Income Bracket in Riverview
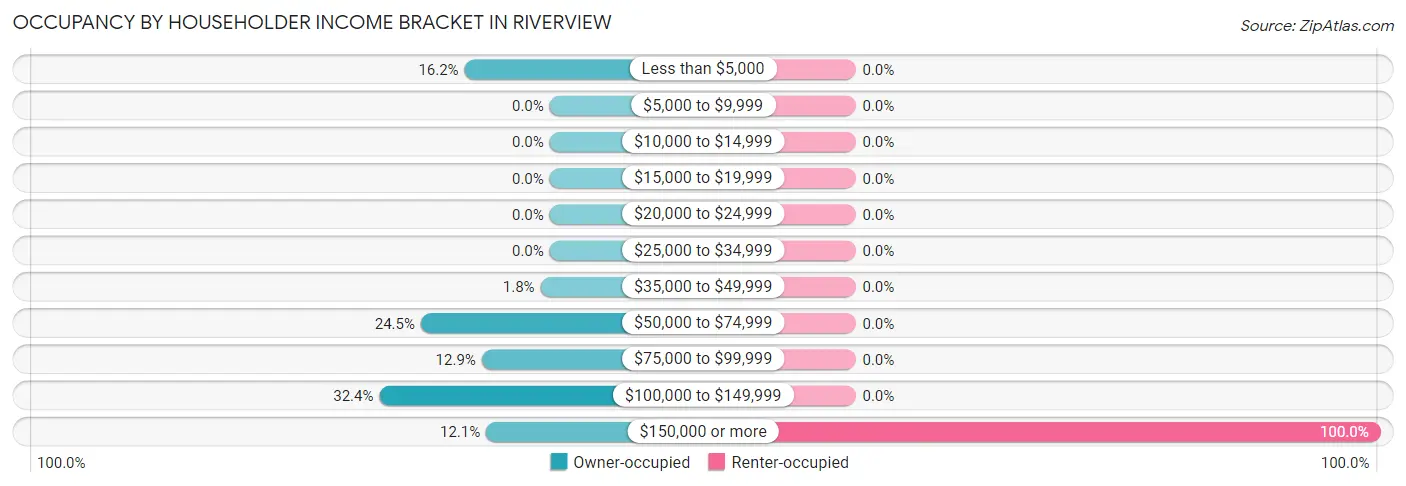
| Income Bracket | Owner-occupied | Renter-occupied |
| Less than $5,000 | 158 (16.2%) | 0 (0.0%) |
| $5,000 to $9,999 | 0 (0.0%) | 0 (0.0%) |
| $10,000 to $14,999 | 0 (0.0%) | 0 (0.0%) |
| $15,000 to $19,999 | 0 (0.0%) | 0 (0.0%) |
| $20,000 to $24,999 | 0 (0.0%) | 0 (0.0%) |
| $25,000 to $34,999 | 0 (0.0%) | 0 (0.0%) |
| $35,000 to $49,999 | 17 (1.8%) | 0 (0.0%) |
| $50,000 to $74,999 | 239 (24.5%) | 0 (0.0%) |
| $75,000 to $99,999 | 126 (12.9%) | 0 (0.0%) |
| $100,000 to $149,999 | 316 (32.4%) | 0 (0.0%) |
| $150,000 or more | 118 (12.1%) | 17 (100.0%) |
| Total | 974 (100.0%) | 17 (100.0%) |
Monthly Housing Cost Tiers in Riverview
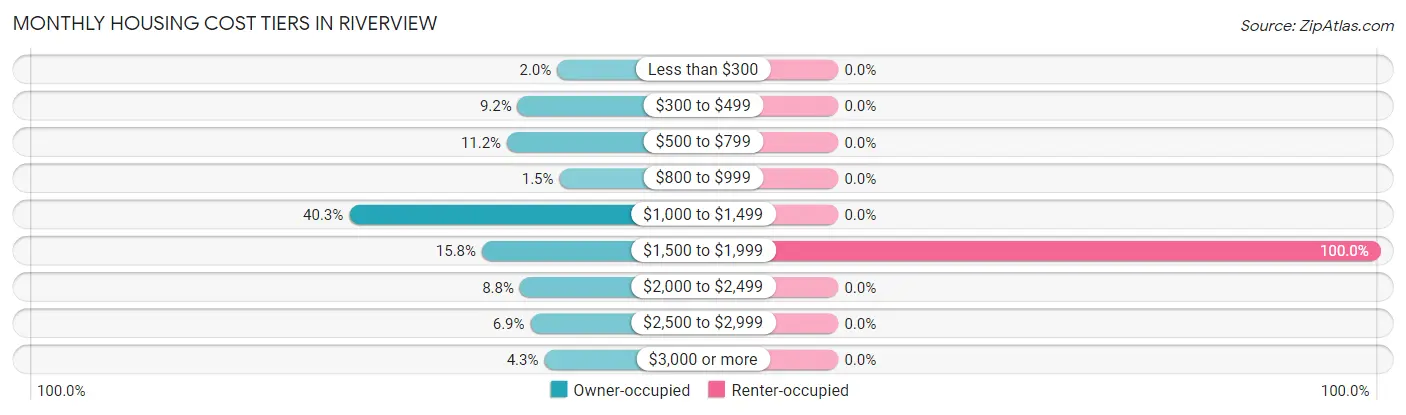
| Monthly Cost | Owner-occupied | Renter-occupied |
| Less than $300 | 19 (1.9%) | 0 (0.0%) |
| $300 to $499 | 90 (9.2%) | 0 (0.0%) |
| $500 to $799 | 109 (11.2%) | 0 (0.0%) |
| $800 to $999 | 15 (1.5%) | 0 (0.0%) |
| $1,000 to $1,499 | 392 (40.3%) | 0 (0.0%) |
| $1,500 to $1,999 | 154 (15.8%) | 17 (100.0%) |
| $2,000 to $2,499 | 86 (8.8%) | 0 (0.0%) |
| $2,500 to $2,999 | 67 (6.9%) | 0 (0.0%) |
| $3,000 or more | 42 (4.3%) | 0 (0.0%) |
| Total | 974 (100.0%) | 17 (100.0%) |
Physical Housing Characteristics in Riverview
Housing Structures in Riverview
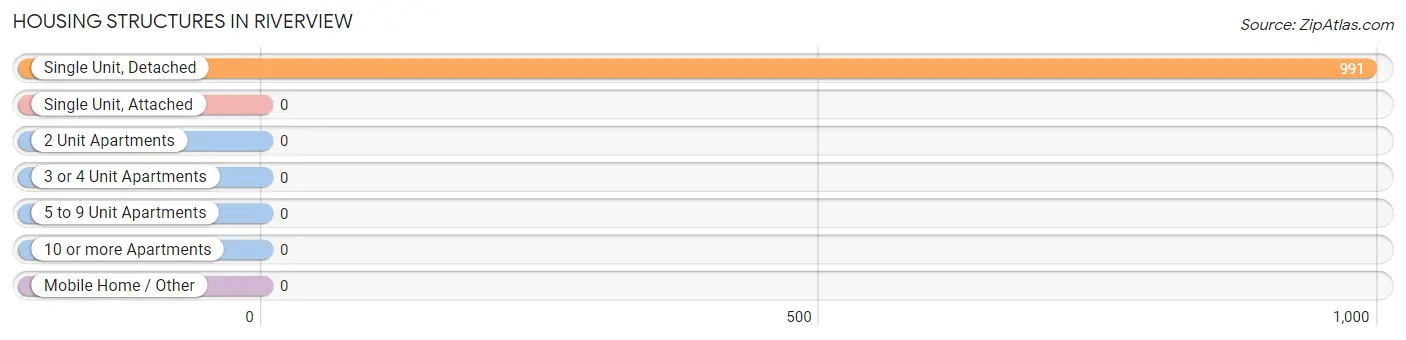
| Structure Type | # Housing Units | % Housing Units |
| Single Unit, Detached | 991 | 100.0% |
| Single Unit, Attached | 0 | 0.0% |
| 2 Unit Apartments | 0 | 0.0% |
| 3 or 4 Unit Apartments | 0 | 0.0% |
| 5 to 9 Unit Apartments | 0 | 0.0% |
| 10 or more Apartments | 0 | 0.0% |
| Mobile Home / Other | 0 | 0.0% |
| Total | 991 | 100.0% |
Housing Structures by Occupancy in Riverview
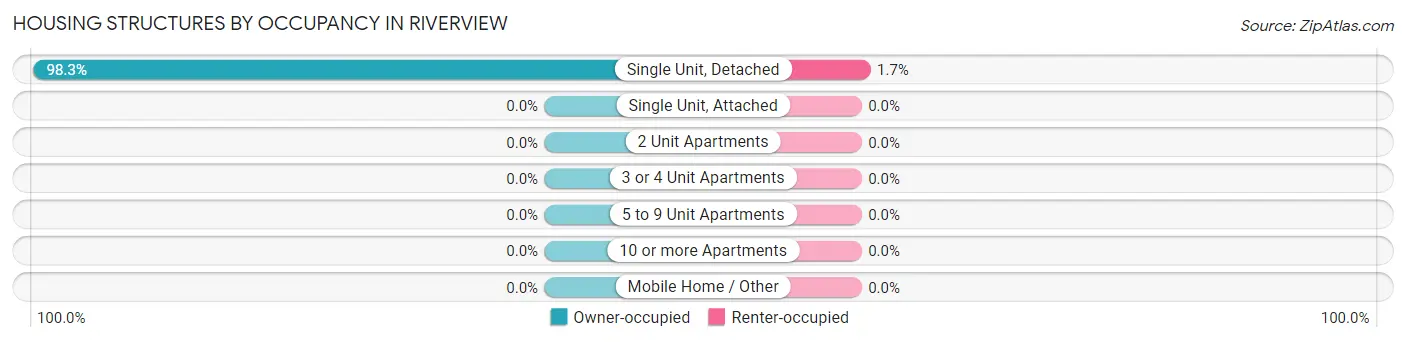
| Structure Type | Owner-occupied | Renter-occupied |
| Single Unit, Detached | 974 (98.3%) | 17 (1.7%) |
| Single Unit, Attached | 0 (0.0%) | 0 (0.0%) |
| 2 Unit Apartments | 0 (0.0%) | 0 (0.0%) |
| 3 or 4 Unit Apartments | 0 (0.0%) | 0 (0.0%) |
| 5 to 9 Unit Apartments | 0 (0.0%) | 0 (0.0%) |
| 10 or more Apartments | 0 (0.0%) | 0 (0.0%) |
| Mobile Home / Other | 0 (0.0%) | 0 (0.0%) |
| Total | 974 (98.3%) | 17 (1.7%) |
Housing Structures by Number of Rooms in Riverview
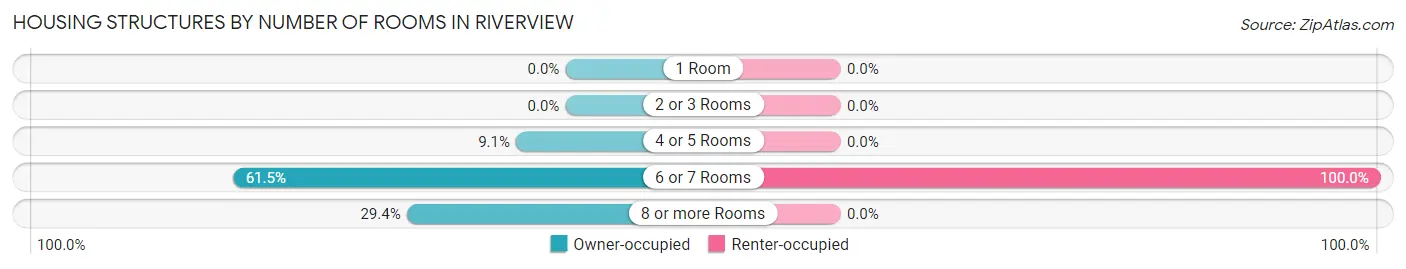
| Number of Rooms | Owner-occupied | Renter-occupied |
| 1 Room | 0 (0.0%) | 0 (0.0%) |
| 2 or 3 Rooms | 0 (0.0%) | 0 (0.0%) |
| 4 or 5 Rooms | 89 (9.1%) | 0 (0.0%) |
| 6 or 7 Rooms | 599 (61.5%) | 17 (100.0%) |
| 8 or more Rooms | 286 (29.4%) | 0 (0.0%) |
| Total | 974 (100.0%) | 17 (100.0%) |
Housing Structure by Heating Type in Riverview
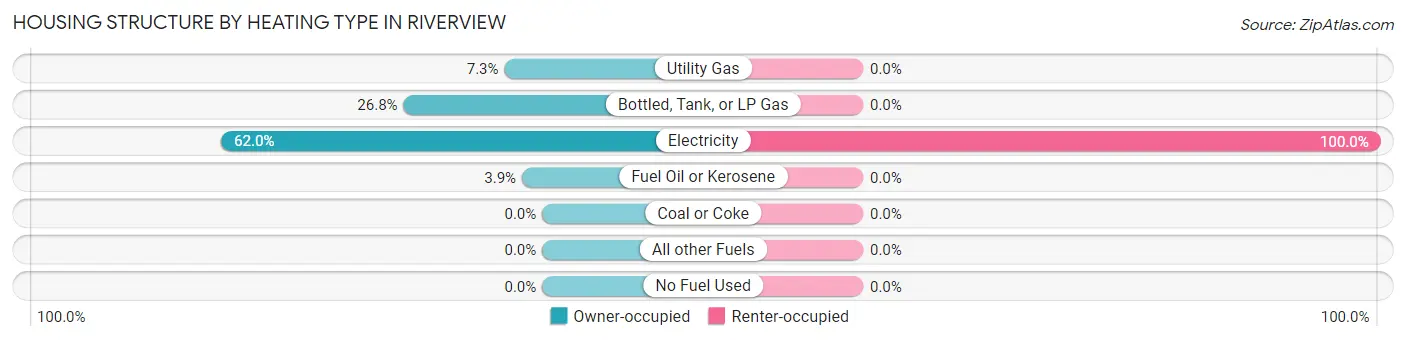
| Heating Type | Owner-occupied | Renter-occupied |
| Utility Gas | 71 (7.3%) | 0 (0.0%) |
| Bottled, Tank, or LP Gas | 261 (26.8%) | 0 (0.0%) |
| Electricity | 604 (62.0%) | 17 (100.0%) |
| Fuel Oil or Kerosene | 38 (3.9%) | 0 (0.0%) |
| Coal or Coke | 0 (0.0%) | 0 (0.0%) |
| All other Fuels | 0 (0.0%) | 0 (0.0%) |
| No Fuel Used | 0 (0.0%) | 0 (0.0%) |
| Total | 974 (100.0%) | 17 (100.0%) |
Household Vehicle Usage in Riverview
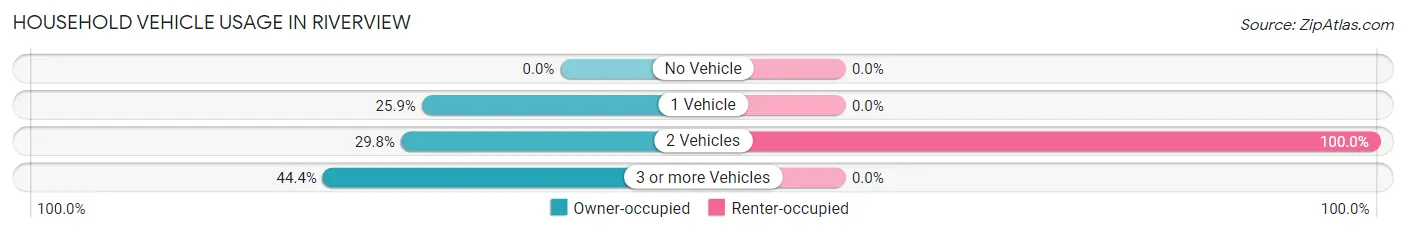
| Vehicles per Household | Owner-occupied | Renter-occupied |
| No Vehicle | 0 (0.0%) | 0 (0.0%) |
| 1 Vehicle | 252 (25.9%) | 0 (0.0%) |
| 2 Vehicles | 290 (29.8%) | 17 (100.0%) |
| 3 or more Vehicles | 432 (44.4%) | 0 (0.0%) |
| Total | 974 (100.0%) | 17 (100.0%) |
Real Estate & Mortgages in Riverview
Real Estate and Mortgage Overview in Riverview
| Characteristic | Without Mortgage | With Mortgage |
| Housing Units | 206 | 768 |
| Median Property Value | $275,500 | $247,200 |
| Median Household Income | $74,167 | $118 |
| Monthly Housing Costs | $500 | $42 |
| Real Estate Taxes | $1,242 | $204 |
Property Value by Mortgage Status in Riverview
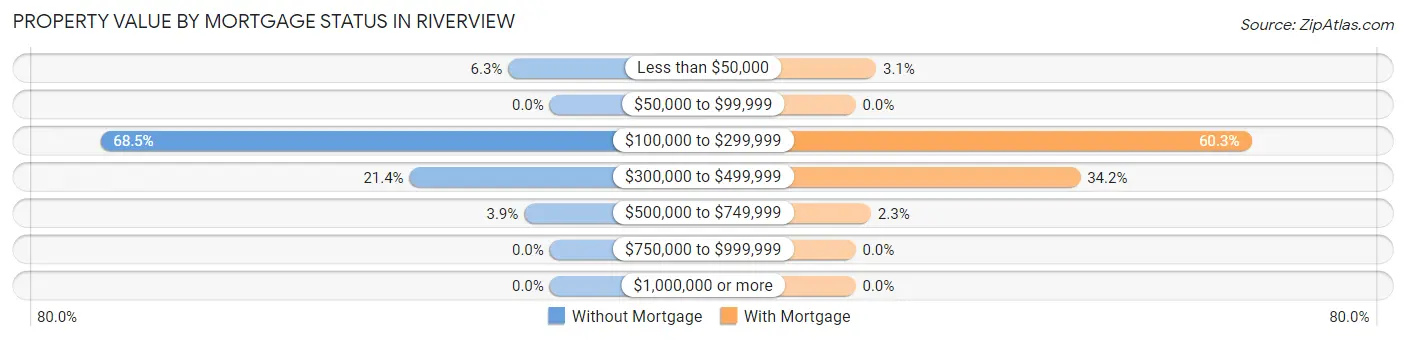
| Property Value | Without Mortgage | With Mortgage |
| Less than $50,000 | 13 (6.3%) | 24 (3.1%) |
| $50,000 to $99,999 | 0 (0.0%) | 0 (0.0%) |
| $100,000 to $299,999 | 141 (68.4%) | 463 (60.3%) |
| $300,000 to $499,999 | 44 (21.4%) | 263 (34.2%) |
| $500,000 to $749,999 | 8 (3.9%) | 18 (2.3%) |
| $750,000 to $999,999 | 0 (0.0%) | 0 (0.0%) |
| $1,000,000 or more | 0 (0.0%) | 0 (0.0%) |
| Total | 206 (100.0%) | 768 (100.0%) |
Household Income by Mortgage Status in Riverview
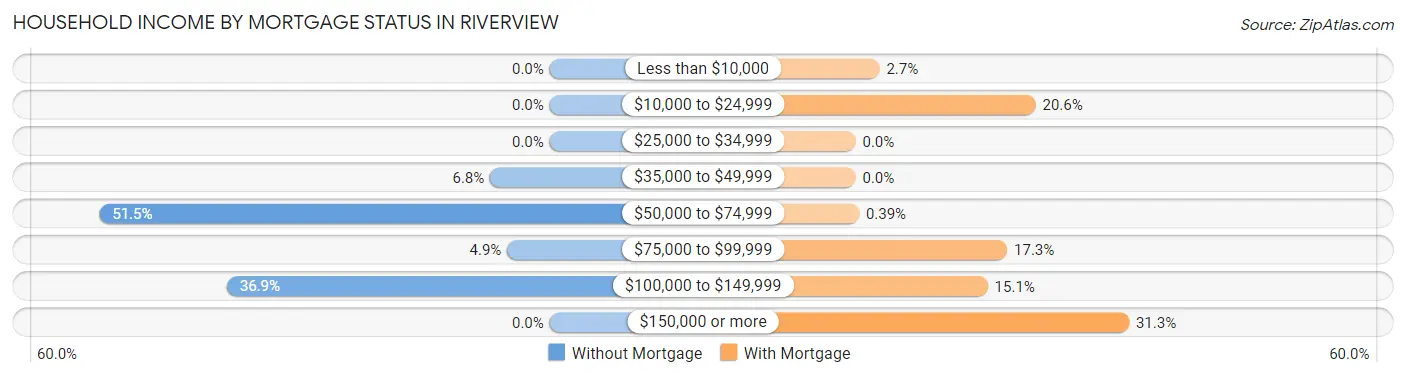
| Household Income | Without Mortgage | With Mortgage |
| Less than $10,000 | 0 (0.0%) | 21 (2.7%) |
| $10,000 to $24,999 | 0 (0.0%) | 158 (20.6%) |
| $25,000 to $34,999 | 0 (0.0%) | 0 (0.0%) |
| $35,000 to $49,999 | 14 (6.8%) | 0 (0.0%) |
| $50,000 to $74,999 | 106 (51.5%) | 3 (0.4%) |
| $75,000 to $99,999 | 10 (4.9%) | 133 (17.3%) |
| $100,000 to $149,999 | 76 (36.9%) | 116 (15.1%) |
| $150,000 or more | 0 (0.0%) | 240 (31.2%) |
| Total | 206 (100.0%) | 768 (100.0%) |
Property Value to Household Income Ratio in Riverview
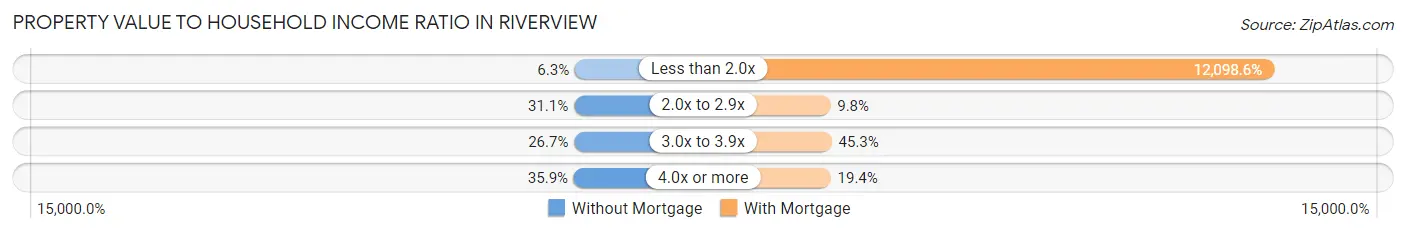
| Value-to-Income Ratio | Without Mortgage | With Mortgage |
| Less than 2.0x | 13 (6.3%) | 92,917 (12,098.6%) |
| 2.0x to 2.9x | 64 (31.1%) | 75 (9.8%) |
| 3.0x to 3.9x | 55 (26.7%) | 348 (45.3%) |
| 4.0x or more | 74 (35.9%) | 149 (19.4%) |
| Total | 206 (100.0%) | 768 (100.0%) |
Real Estate Taxes by Mortgage Status in Riverview
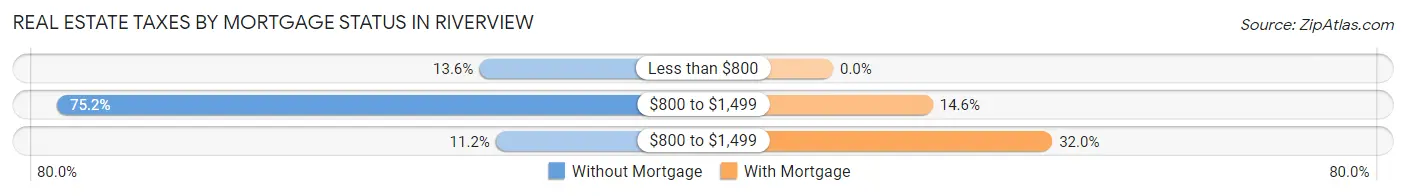
| Property Taxes | Without Mortgage | With Mortgage |
| Less than $800 | 28 (13.6%) | 0 (0.0%) |
| $800 to $1,499 | 155 (75.2%) | 112 (14.6%) |
| $800 to $1,499 | 23 (11.2%) | 246 (32.0%) |
| Total | 206 (100.0%) | 768 (100.0%) |
Health & Disability in Riverview
Health Insurance Coverage by Age in Riverview
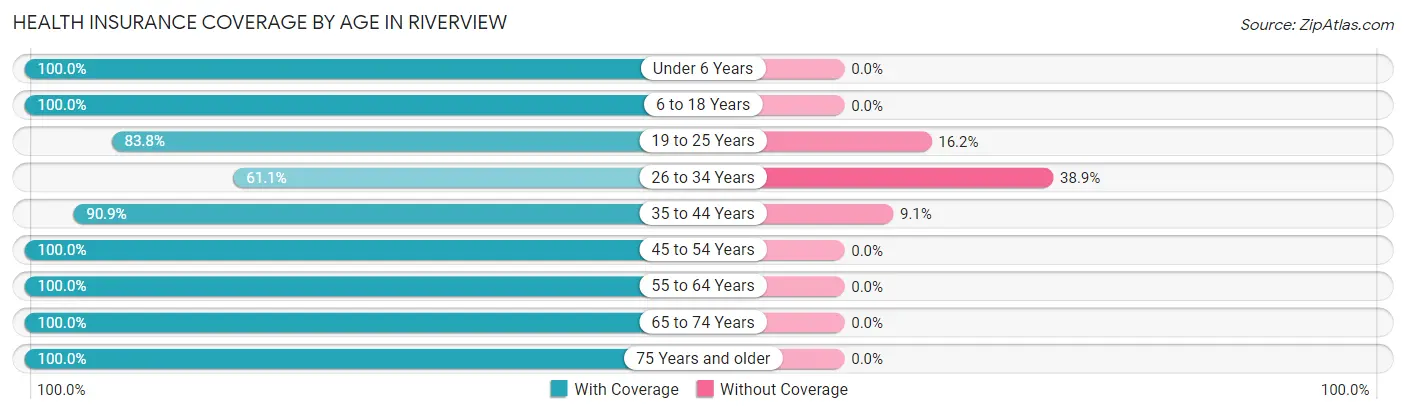
| Age Bracket | With Coverage | Without Coverage |
| Under 6 Years | 18 (100.0%) | 0 (0.0%) |
| 6 to 18 Years | 240 (100.0%) | 0 (0.0%) |
| 19 to 25 Years | 93 (83.8%) | 18 (16.2%) |
| 26 to 34 Years | 69 (61.1%) | 44 (38.9%) |
| 35 to 44 Years | 160 (90.9%) | 16 (9.1%) |
| 45 to 54 Years | 465 (100.0%) | 0 (0.0%) |
| 55 to 64 Years | 565 (100.0%) | 0 (0.0%) |
| 65 to 74 Years | 429 (100.0%) | 0 (0.0%) |
| 75 Years and older | 85 (100.0%) | 0 (0.0%) |
| Total | 2,124 (96.5%) | 78 (3.5%) |
Health Insurance Coverage by Citizenship Status in Riverview
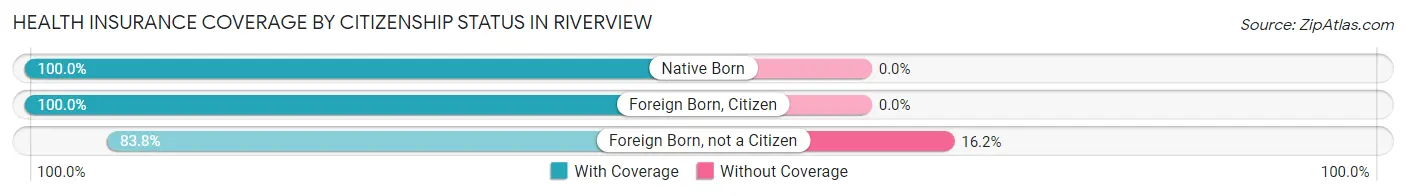
| Citizenship Status | With Coverage | Without Coverage |
| Native Born | 18 (100.0%) | 0 (0.0%) |
| Foreign Born, Citizen | 240 (100.0%) | 0 (0.0%) |
| Foreign Born, not a Citizen | 93 (83.8%) | 18 (16.2%) |
Health Insurance Coverage by Household Income in Riverview
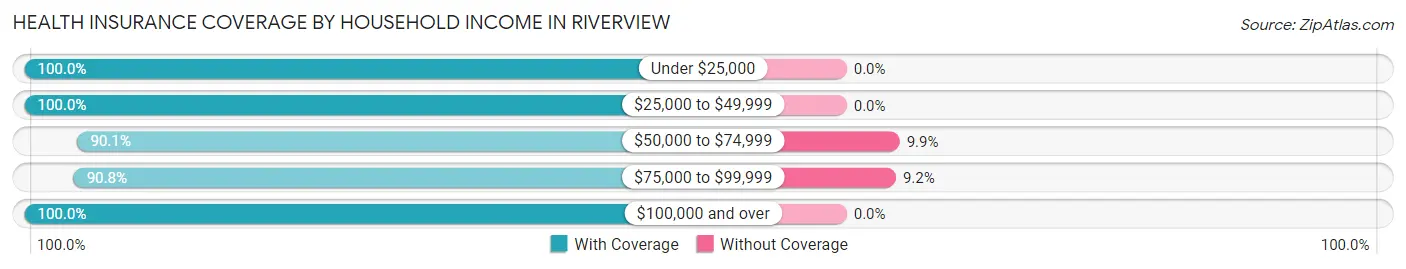
| Household Income | With Coverage | Without Coverage |
| Under $25,000 | 159 (100.0%) | 0 (0.0%) |
| $25,000 to $49,999 | 38 (100.0%) | 0 (0.0%) |
| $50,000 to $74,999 | 400 (90.1%) | 44 (9.9%) |
| $75,000 to $99,999 | 335 (90.8%) | 34 (9.2%) |
| $100,000 and over | 1,192 (100.0%) | 0 (0.0%) |
Public vs Private Health Insurance Coverage by Age in Riverview
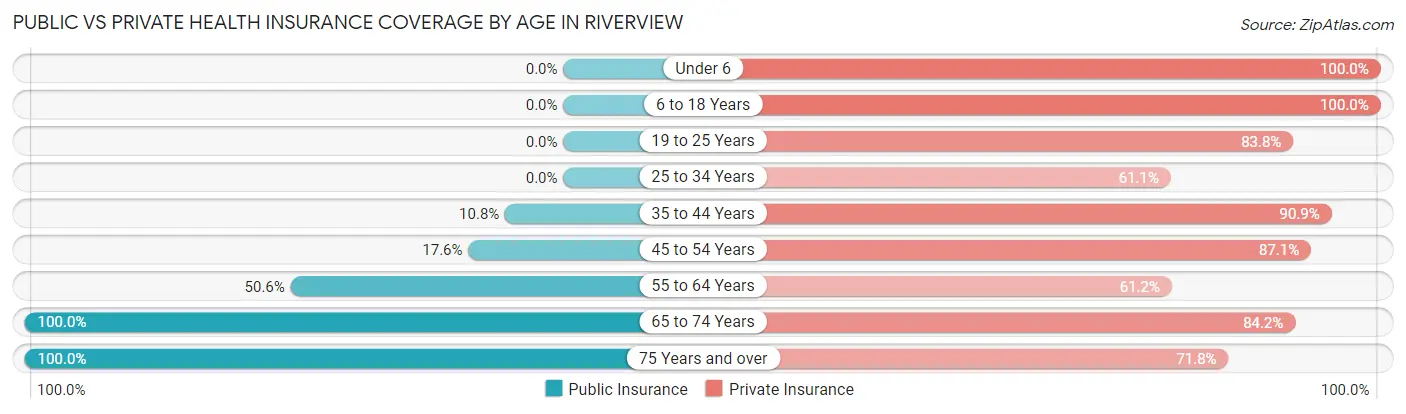
| Age Bracket | Public Insurance | Private Insurance |
| Under 6 | 0 (0.0%) | 18 (100.0%) |
| 6 to 18 Years | 0 (0.0%) | 240 (100.0%) |
| 19 to 25 Years | 0 (0.0%) | 93 (83.8%) |
| 25 to 34 Years | 0 (0.0%) | 69 (61.1%) |
| 35 to 44 Years | 19 (10.8%) | 160 (90.9%) |
| 45 to 54 Years | 82 (17.6%) | 405 (87.1%) |
| 55 to 64 Years | 286 (50.6%) | 346 (61.2%) |
| 65 to 74 Years | 429 (100.0%) | 361 (84.2%) |
| 75 Years and over | 85 (100.0%) | 61 (71.8%) |
| Total | 901 (40.9%) | 1,753 (79.6%) |
Disability Status by Sex by Age in Riverview
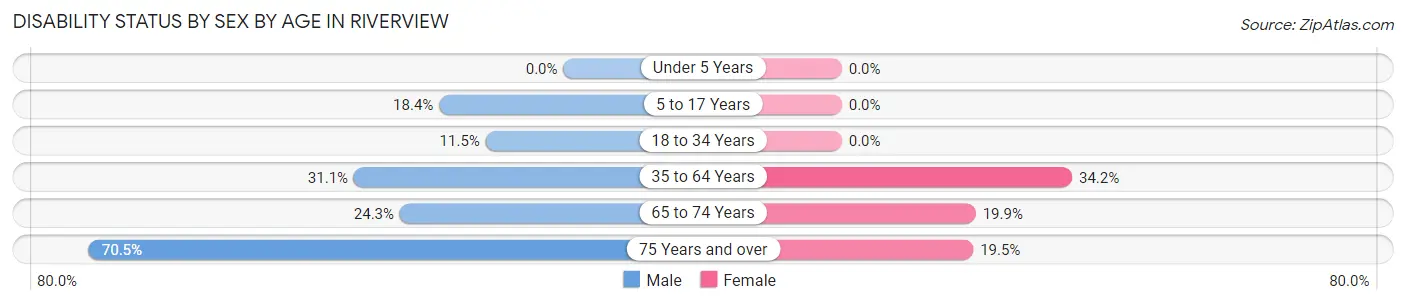
| Age Bracket | Male | Female |
| Under 5 Years | 0 (0.0%) | 0 (0.0%) |
| 5 to 17 Years | 26 (18.4%) | 0 (0.0%) |
| 18 to 34 Years | 18 (11.5%) | 0 (0.0%) |
| 35 to 64 Years | 144 (31.1%) | 254 (34.2%) |
| 65 to 74 Years | 59 (24.3%) | 37 (19.9%) |
| 75 Years and over | 31 (70.5%) | 8 (19.5%) |
Disability Class by Sex by Age in Riverview
Disability Class: Hearing Difficulty
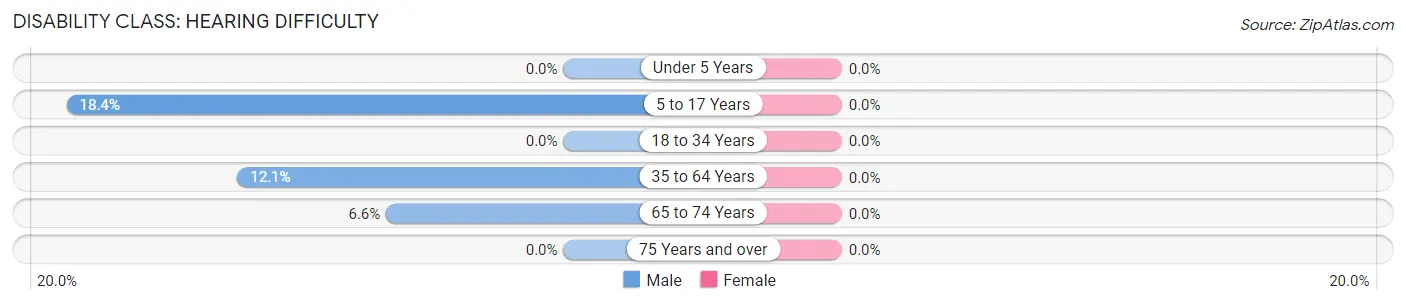
| Age Bracket | Male | Female |
| Under 5 Years | 0 (0.0%) | 0 (0.0%) |
| 5 to 17 Years | 26 (18.4%) | 0 (0.0%) |
| 18 to 34 Years | 0 (0.0%) | 0 (0.0%) |
| 35 to 64 Years | 56 (12.1%) | 0 (0.0%) |
| 65 to 74 Years | 16 (6.6%) | 0 (0.0%) |
| 75 Years and over | 0 (0.0%) | 0 (0.0%) |
Disability Class: Vision Difficulty
| Age Bracket | Male | Female |
| Under 5 Years | 0 (0.0%) | 0 (0.0%) |
| 5 to 17 Years | 0 (0.0%) | 0 (0.0%) |
| 18 to 34 Years | 0 (0.0%) | 0 (0.0%) |
| 35 to 64 Years | 0 (0.0%) | 0 (0.0%) |
| 65 to 74 Years | 0 (0.0%) | 0 (0.0%) |
| 75 Years and over | 0 (0.0%) | 0 (0.0%) |
Disability Class: Cognitive Difficulty
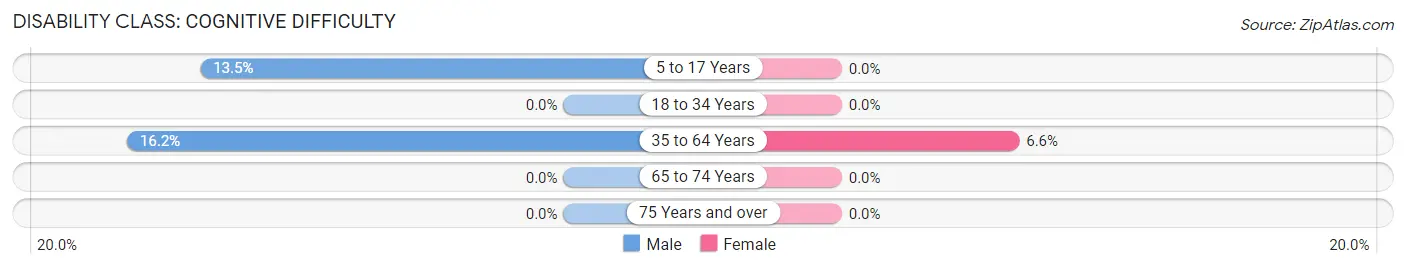
| Age Bracket | Male | Female |
| 5 to 17 Years | 19 (13.5%) | 0 (0.0%) |
| 18 to 34 Years | 0 (0.0%) | 0 (0.0%) |
| 35 to 64 Years | 75 (16.2%) | 49 (6.6%) |
| 65 to 74 Years | 0 (0.0%) | 0 (0.0%) |
| 75 Years and over | 0 (0.0%) | 0 (0.0%) |
Disability Class: Ambulatory Difficulty
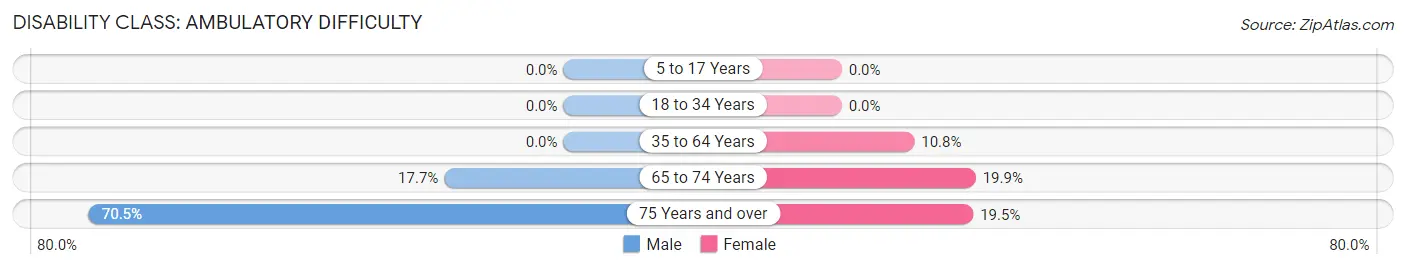
| Age Bracket | Male | Female |
| 5 to 17 Years | 0 (0.0%) | 0 (0.0%) |
| 18 to 34 Years | 0 (0.0%) | 0 (0.0%) |
| 35 to 64 Years | 0 (0.0%) | 80 (10.8%) |
| 65 to 74 Years | 43 (17.7%) | 37 (19.9%) |
| 75 Years and over | 31 (70.5%) | 8 (19.5%) |
Disability Class: Self-Care Difficulty
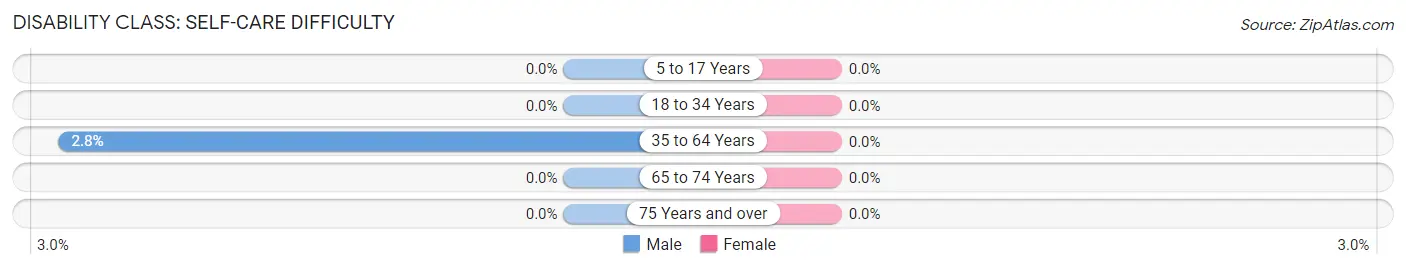
| Age Bracket | Male | Female |
| 5 to 17 Years | 0 (0.0%) | 0 (0.0%) |
| 18 to 34 Years | 0 (0.0%) | 0 (0.0%) |
| 35 to 64 Years | 13 (2.8%) | 0 (0.0%) |
| 65 to 74 Years | 0 (0.0%) | 0 (0.0%) |
| 75 Years and over | 0 (0.0%) | 0 (0.0%) |
Technology Access in Riverview
Computing Device Access in Riverview
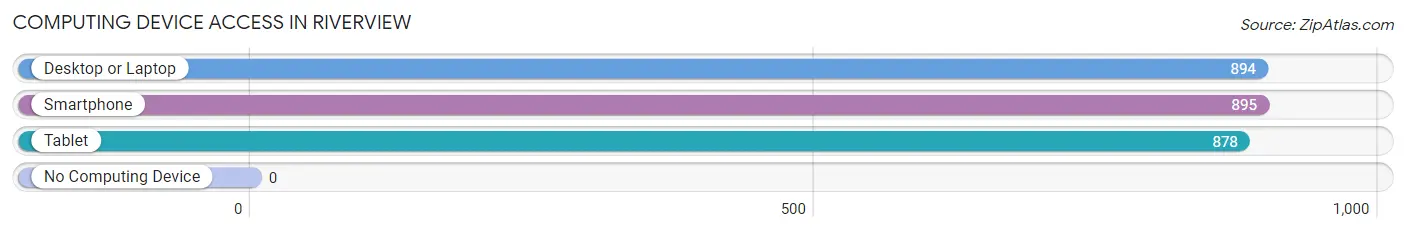
| Device Type | # Households | % Households |
| Desktop or Laptop | 894 | 90.2% |
| Smartphone | 895 | 90.3% |
| Tablet | 878 | 88.6% |
| No Computing Device | 0 | 0.0% |
| Total | 991 | 100.0% |
Internet Access in Riverview
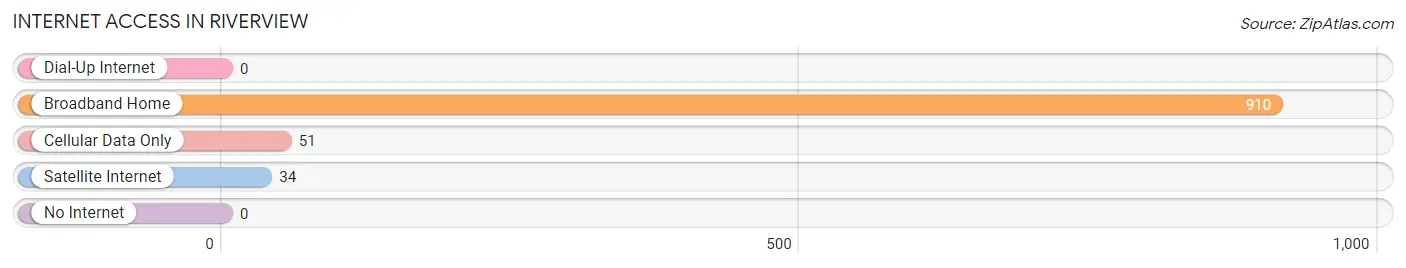
| Internet Type | # Households | % Households |
| Dial-Up Internet | 0 | 0.0% |
| Broadband Home | 910 | 91.8% |
| Cellular Data Only | 51 | 5.1% |
| Satellite Internet | 34 | 3.4% |
| No Internet | 0 | 0.0% |
| Total | 991 | 100.0% |
Riverview Summary
Riverview, Delaware is a small town located in New Castle County, Delaware. It is situated on the banks of the Christina River, just south of Wilmington. The town has a population of approximately 1,500 people and is part of the Greater Wilmington Metropolitan Area.
History
The area that is now Riverview was first settled in the late 1600s by Dutch and Swedish settlers. The town was originally known as “Christina” after the Christina River, which runs through the town. In the late 1700s, the town was renamed “Riverview” due to its location on the river.
In the early 1800s, Riverview was a small farming community. The town was home to a number of small businesses, including a grist mill, a saw mill, and a blacksmith shop. The town also had a post office, a school, and a church.
In the late 1800s, Riverview began to grow and develop. The town was home to a number of factories, including a paper mill, a brickyard, and a canning factory. The town also had a number of stores, including a general store, a drug store, and a hardware store.
In the early 1900s, Riverview continued to grow and develop. The town was home to a number of businesses, including a bank, a movie theater, and a hotel. The town also had a number of churches, including a Methodist church, a Baptist church, and a Catholic church.
Geography
Riverview is located in New Castle County, Delaware. The town is situated on the banks of the Christina River, just south of Wilmington. The town is bordered by the towns of Wilmington, Newark, and Bear.
The town has a total area of 0.7 square miles, all of which is land. The town is located at an elevation of approximately 30 feet above sea level.
Economy
The economy of Riverview is largely based on the service industry. The town is home to a number of small businesses, including restaurants, retail stores, and professional services. The town also has a number of manufacturing businesses, including a paper mill, a brickyard, and a canning factory.
Demographics
As of the 2010 census, the population of Riverview was 1,500. The racial makeup of the town was 94.7% White, 2.7% African American, 0.7% Asian, 0.3% Native American, and 1.6% from other races. The median household income was $45,000, and the median family income was $50,000.
The town is served by the Christina School District. The town is home to a number of churches, including a Methodist church, a Baptist church, and a Catholic church.
Conclusion
Riverview, Delaware is a small town located in New Castle County, Delaware. It is situated on the banks of the Christina River, just south of Wilmington. The town has a population of approximately 1,500 people and is part of the Greater Wilmington Metropolitan Area. The economy of Riverview is largely based on the service industry, and the town is home to a number of small businesses, including restaurants, retail stores, and professional services. The town is served by the Christina School District, and is home to a number of churches, including a Methodist church, a Baptist church, and a Catholic church.
Common Questions
What is Per Capita Income in Riverview?
Per Capita income in Riverview is $39,745.
What is the Median Family Income in Riverview?
Median Family Income in Riverview is $88,611.
What is the Median Household income in Riverview?
Median Household Income in Riverview is $87,708.
What is Income or Wage Gap in Riverview?
Income or Wage Gap in Riverview is 7.3%.
Women in Riverview earn 92.7 cents for every dollar earned by a man.
What is Inequality or Gini Index in Riverview?
Inequality or Gini Index in Riverview is 0.33.
What is the Total Population of Riverview?
Total Population of Riverview is 2,270.
What is the Total Male Population of Riverview?
Total Male Population of Riverview is 1,115.
What is the Total Female Population of Riverview?
Total Female Population of Riverview is 1,155.
What is the Ratio of Males per 100 Females in Riverview?
There are 96.54 Males per 100 Females in Riverview.
What is the Ratio of Females per 100 Males in Riverview?
There are 103.59 Females per 100 Males in Riverview.
What is the Median Population Age in Riverview?
Median Population Age in Riverview is 54.1 Years.
What is the Average Family Size in Riverview
Average Family Size in Riverview is 2.3 People.
What is the Average Household Size in Riverview
Average Household Size in Riverview is 2.3 People.
How Large is the Labor Force in Riverview?
There are 1,054 People in the Labor Forcein in Riverview.
What is the Percentage of People in the Labor Force in Riverview?
50.3% of People are in the Labor Force in Riverview.
What is the Unemployment Rate in Riverview?
Unemployment Rate in Riverview is 1.8%.