Marquette Heights, IL Map & Demographics
Marquette Heights Map
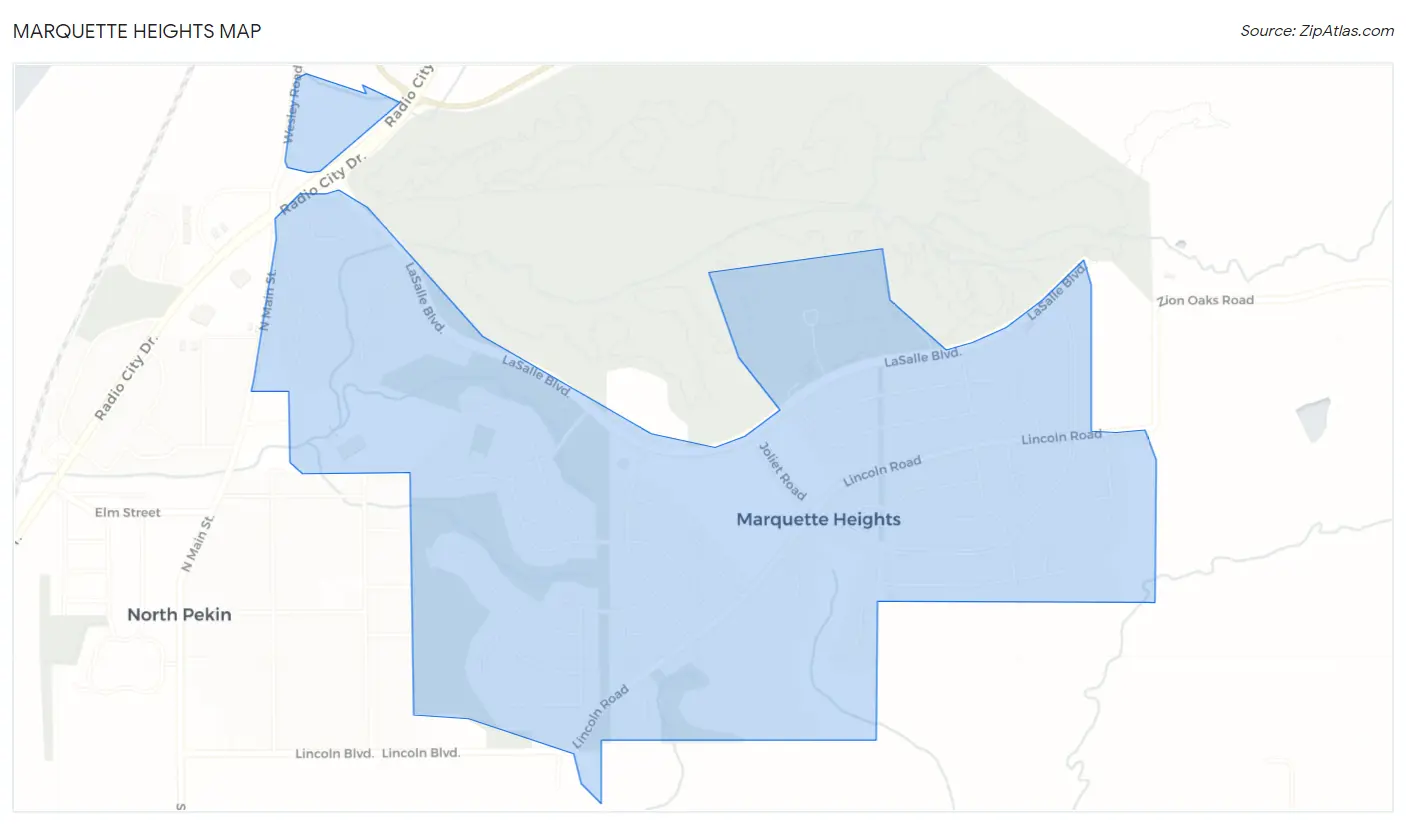
Marquette Heights Overview
$35,674
PER CAPITA INCOME
$87,067
AVG FAMILY INCOME
$65,202
AVG HOUSEHOLD INCOME
30.7%
WAGE / INCOME GAP [ % ]
69.3¢/ $1
WAGE / INCOME GAP [ $ ]
0.34
INEQUALITY / GINI INDEX
2,672
TOTAL POPULATION
1,341
MALE POPULATION
1,331
FEMALE POPULATION
100.75
MALES / 100 FEMALES
99.25
FEMALES / 100 MALES
40.8
MEDIAN AGE
2.9
AVG FAMILY SIZE
2.3
AVG HOUSEHOLD SIZE
1,445
LABOR FORCE [ PEOPLE ]
65.2%
PERCENT IN LABOR FORCE
4.8%
UNEMPLOYMENT RATE
Marquette Heights Area Codes
Income in Marquette Heights
Income Overview in Marquette Heights
Per Capita Income in Marquette Heights is $35,674, while median incomes of families and households are $87,067 and $65,202 respectively.
| Characteristic | Number | Measure |
| Per Capita Income | 2,672 | $35,674 |
| Median Family Income | 720 | $87,067 |
| Mean Family Income | 720 | $96,198 |
| Median Household Income | 1,159 | $65,202 |
| Mean Household Income | 1,159 | $80,609 |
| Income Deficit | 720 | $0 |
| Wage / Income Gap (%) | 2,672 | 30.69% |
| Wage / Income Gap ($) | 2,672 | 69.31¢ per $1 |
| Gini / Inequality Index | 2,672 | 0.34 |
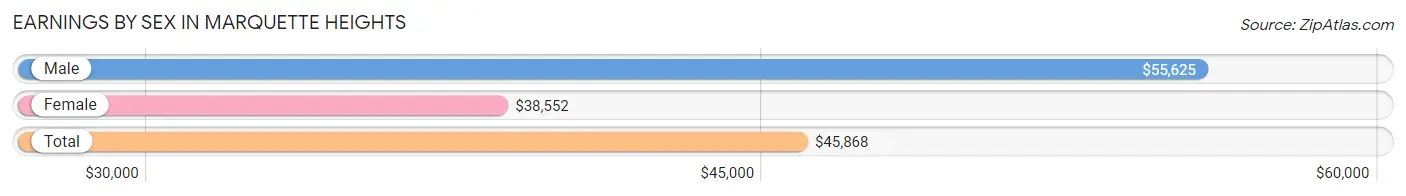
Earnings by Sex in Marquette Heights
Average Earnings in Marquette Heights are $45,868, $55,625 for men and $38,552 for women, a difference of 30.7%.
| Sex | Number | Average Earnings |
| Male | 719 (49.7%) | $55,625 |
| Female | 727 (50.3%) | $38,552 |
| Total | 1,446 (100.0%) | $45,868 |
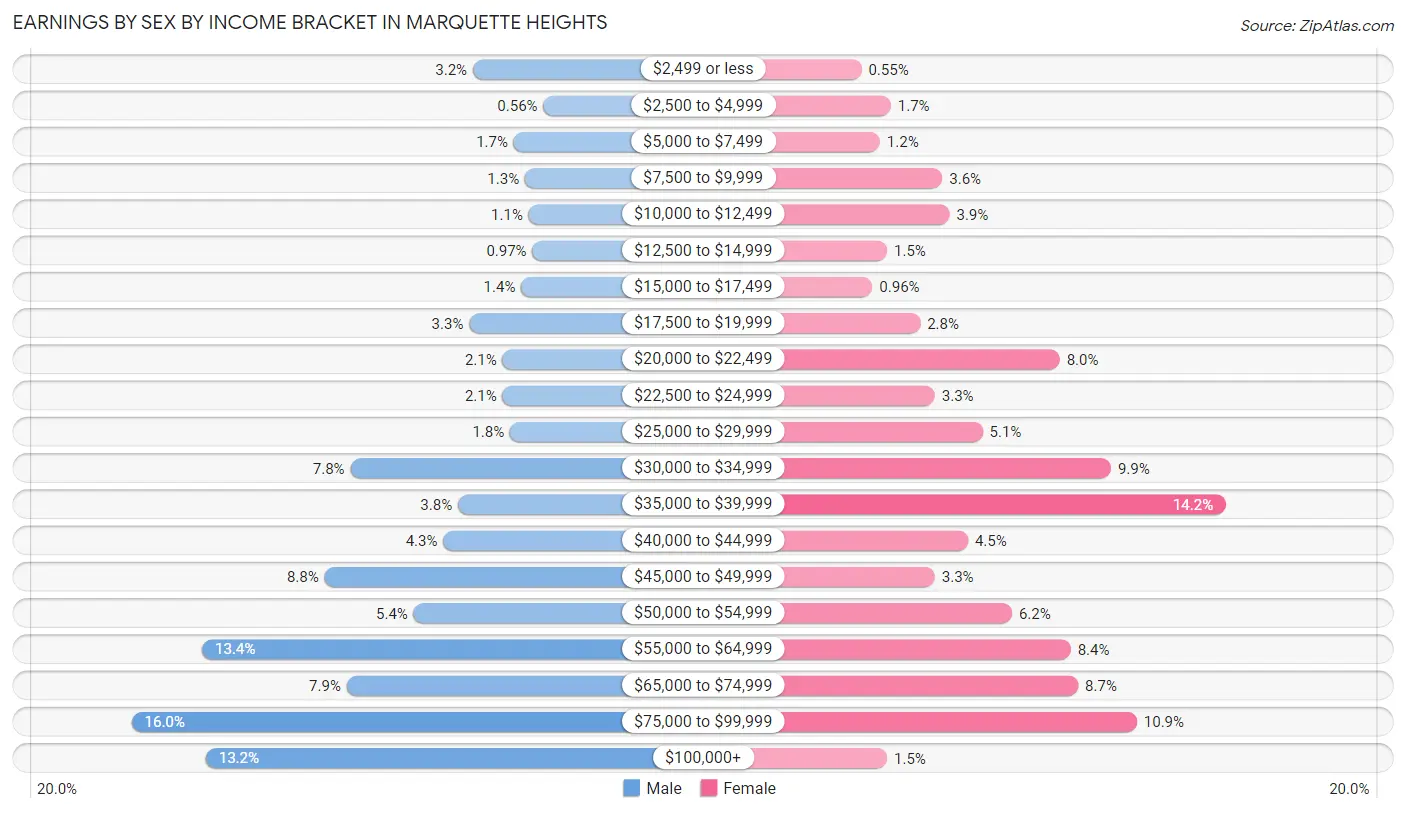
Earnings by Sex by Income Bracket in Marquette Heights
The most common earnings brackets in Marquette Heights are $75,000 to $99,999 for men (115 | 16.0%) and $35,000 to $39,999 for women (103 | 14.2%).
| Income | Male | Female |
| $2,499 or less | 23 (3.2%) | 4 (0.5%) |
| $2,500 to $4,999 | 4 (0.6%) | 12 (1.7%) |
| $5,000 to $7,499 | 12 (1.7%) | 9 (1.2%) |
| $7,500 to $9,999 | 9 (1.3%) | 26 (3.6%) |
| $10,000 to $12,499 | 8 (1.1%) | 28 (3.8%) |
| $12,500 to $14,999 | 7 (1.0%) | 11 (1.5%) |
| $15,000 to $17,499 | 10 (1.4%) | 7 (1.0%) |
| $17,500 to $19,999 | 24 (3.3%) | 20 (2.8%) |
| $20,000 to $22,499 | 15 (2.1%) | 58 (8.0%) |
| $22,500 to $24,999 | 15 (2.1%) | 24 (3.3%) |
| $25,000 to $29,999 | 13 (1.8%) | 37 (5.1%) |
| $30,000 to $34,999 | 56 (7.8%) | 72 (9.9%) |
| $35,000 to $39,999 | 27 (3.8%) | 103 (14.2%) |
| $40,000 to $44,999 | 31 (4.3%) | 33 (4.5%) |
| $45,000 to $49,999 | 63 (8.8%) | 24 (3.3%) |
| $50,000 to $54,999 | 39 (5.4%) | 45 (6.2%) |
| $55,000 to $64,999 | 96 (13.4%) | 61 (8.4%) |
| $65,000 to $74,999 | 57 (7.9%) | 63 (8.7%) |
| $75,000 to $99,999 | 115 (16.0%) | 79 (10.9%) |
| $100,000+ | 95 (13.2%) | 11 (1.5%) |
| Total | 719 (100.0%) | 727 (100.0%) |
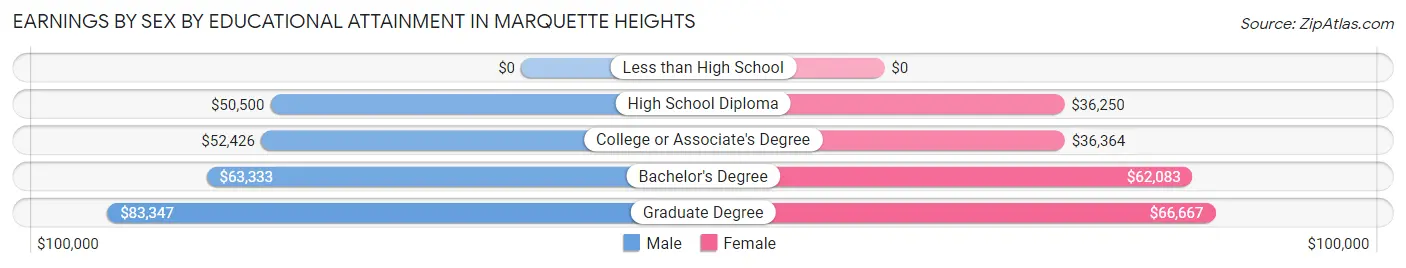
Earnings by Sex by Educational Attainment in Marquette Heights
Average earnings in Marquette Heights are $60,438 for men and $39,756 for women, a difference of 34.2%. Men with an educational attainment of graduate degree enjoy the highest average annual earnings of $83,347, while those with high school diploma education earn the least with $50,500. Women with an educational attainment of graduate degree earn the most with the average annual earnings of $66,667, while those with high school diploma education have the smallest earnings of $36,250.
| Educational Attainment | Male Income | Female Income |
| Less than High School | - | - |
| High School Diploma | $50,500 | $36,250 |
| College or Associate's Degree | $52,426 | $36,364 |
| Bachelor's Degree | $63,333 | $62,083 |
| Graduate Degree | $83,347 | $66,667 |
| Total | $60,438 | $39,756 |
Family Income in Marquette Heights
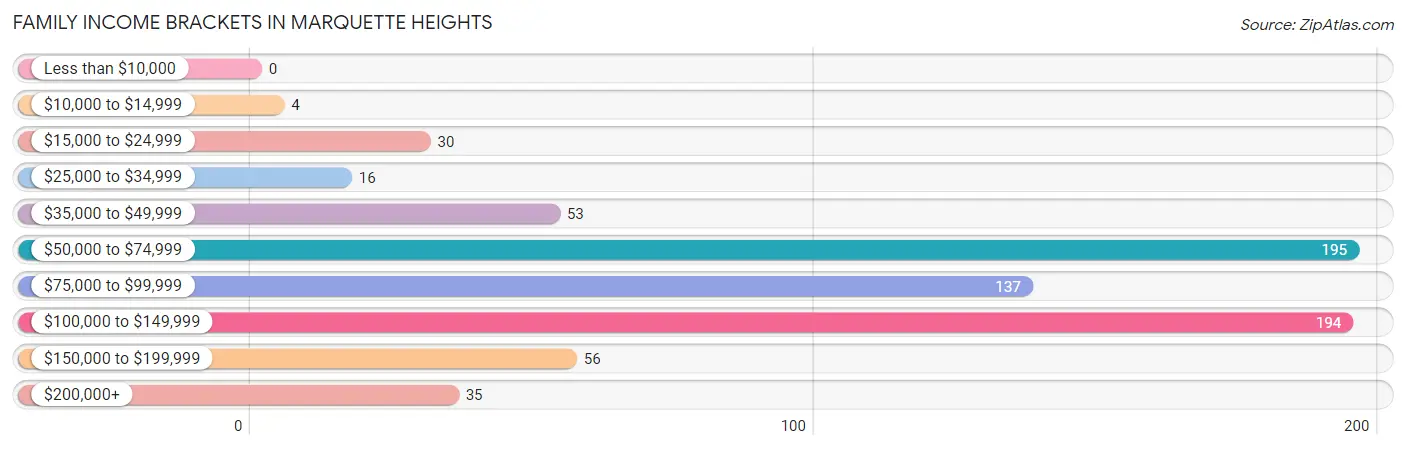
Family Income Brackets in Marquette Heights
According to the Marquette Heights family income data, there are 195 families falling into the $50,000 to $74,999 income range, which is the most common income bracket and makes up 27.1% of all families.
| Income Bracket | # Families | % Families |
| Less than $10,000 | 0 | 0.0% |
| $10,000 to $14,999 | 4 | 0.6% |
| $15,000 to $24,999 | 30 | 4.2% |
| $25,000 to $34,999 | 16 | 2.2% |
| $35,000 to $49,999 | 53 | 7.4% |
| $50,000 to $74,999 | 195 | 27.1% |
| $75,000 to $99,999 | 137 | 19.0% |
| $100,000 to $149,999 | 194 | 26.9% |
| $150,000 to $199,999 | 56 | 7.8% |
| $200,000+ | 35 | 4.9% |
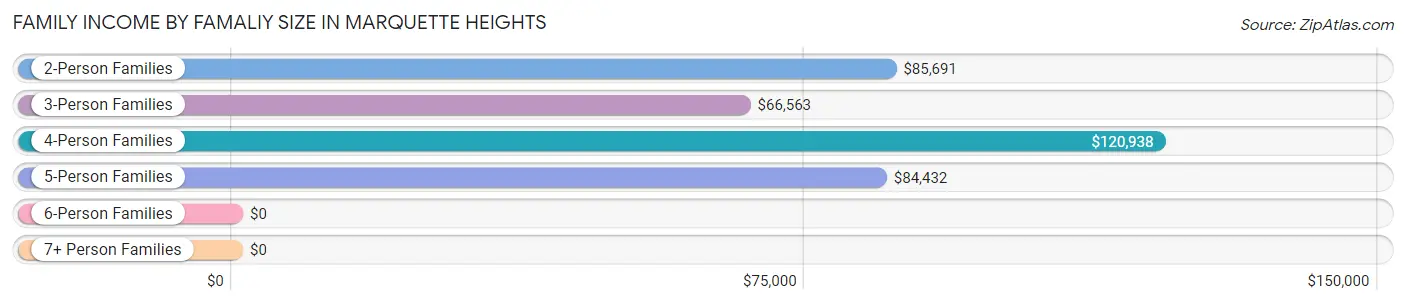
Family Income by Famaliy Size in Marquette Heights
4-person families (125 | 17.4%) account for the highest median family income in Marquette Heights with $120,938 per family, while 2-person families (392 | 54.4%) have the highest median income of $42,846 per family member.
| Income Bracket | # Families | Median Income |
| 2-Person Families | 392 (54.4%) | $85,691 |
| 3-Person Families | 161 (22.4%) | $66,563 |
| 4-Person Families | 125 (17.4%) | $120,938 |
| 5-Person Families | 35 (4.9%) | $84,432 |
| 6-Person Families | 7 (1.0%) | $0 |
| 7+ Person Families | 0 (0.0%) | $0 |
| Total | 720 (100.0%) | $87,067 |
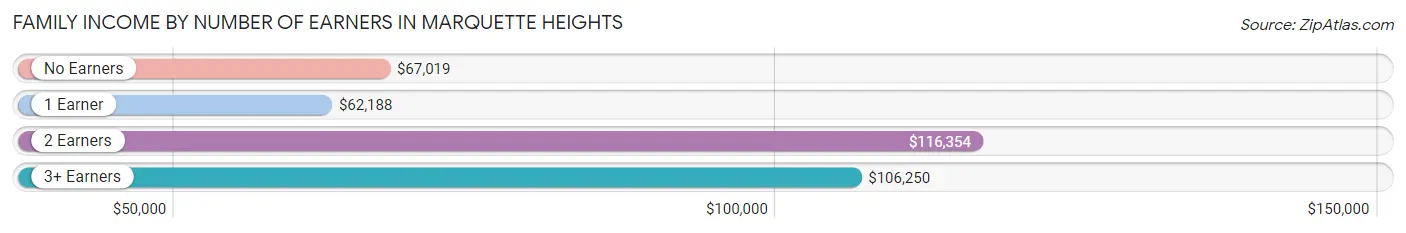
Family Income by Number of Earners in Marquette Heights
The median family income in Marquette Heights is $87,067, with families comprising 2 earners (305) having the highest median family income of $116,354, while families with 1 earner (238) have the lowest median family income of $62,188, accounting for 42.4% and 33.1% of families, respectively.
| Number of Earners | # Families | Median Income |
| No Earners | 123 (17.1%) | $67,019 |
| 1 Earner | 238 (33.1%) | $62,188 |
| 2 Earners | 305 (42.4%) | $116,354 |
| 3+ Earners | 54 (7.5%) | $106,250 |
| Total | 720 (100.0%) | $87,067 |
Household Income in Marquette Heights
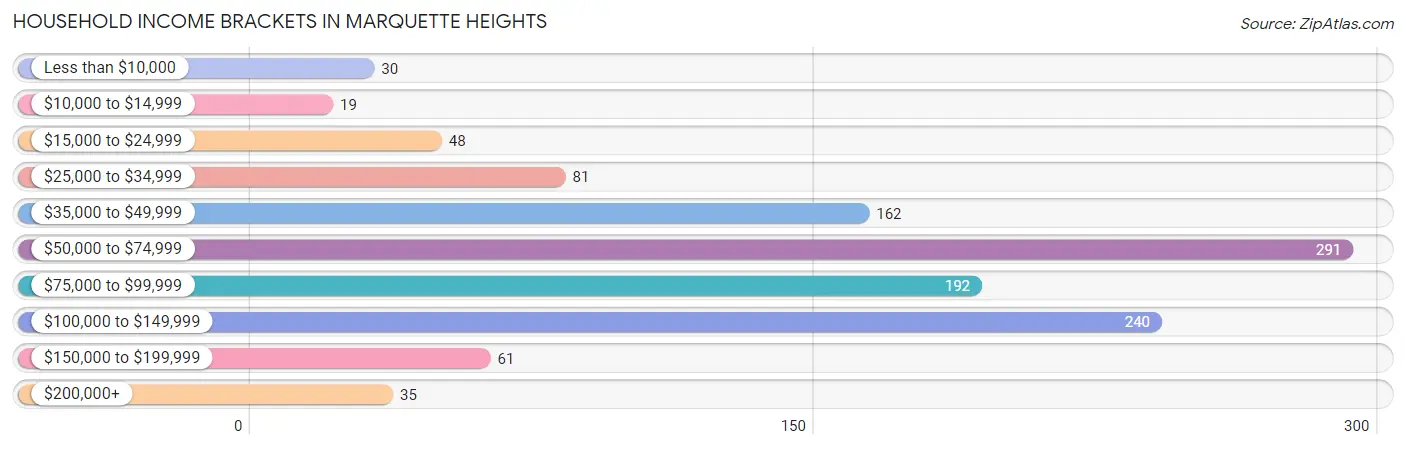
Household Income Brackets in Marquette Heights
With 291 households falling in the category, the $50,000 to $74,999 income range is the most frequent in Marquette Heights, accounting for 25.1% of all households. In contrast, only 19 households (1.6%) fall into the $10,000 to $14,999 income bracket, making it the least populous group.
| Income Bracket | # Households | % Households |
| Less than $10,000 | 30 | 2.6% |
| $10,000 to $14,999 | 19 | 1.6% |
| $15,000 to $24,999 | 48 | 4.1% |
| $25,000 to $34,999 | 81 | 7.0% |
| $35,000 to $49,999 | 162 | 14.0% |
| $50,000 to $74,999 | 291 | 25.1% |
| $75,000 to $99,999 | 192 | 16.6% |
| $100,000 to $149,999 | 240 | 20.7% |
| $150,000 to $199,999 | 61 | 5.3% |
| $200,000+ | 35 | 3.0% |
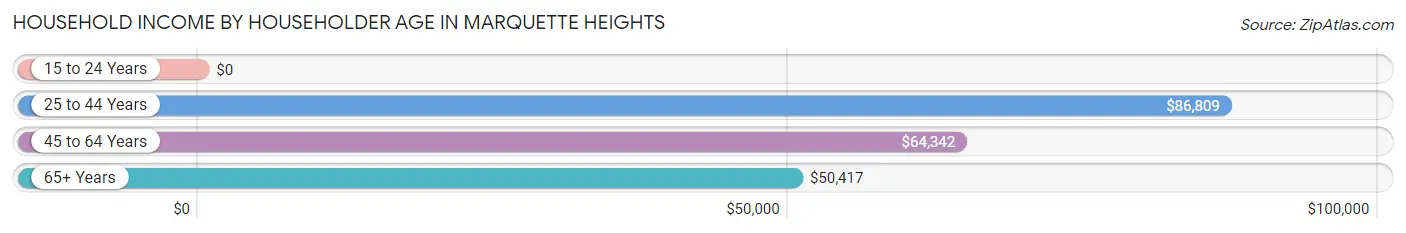
Household Income by Householder Age in Marquette Heights
The median household income in Marquette Heights is $65,202, with the highest median household income of $86,809 found in the 25 to 44 years age bracket for the primary householder. A total of 428 households (36.9%) fall into this category. Meanwhile, the 15 to 24 years age bracket for the primary householder has the lowest median household income of $0, with 24 households (2.1%) in this group.
| Income Bracket | # Households | Median Income |
| 15 to 24 Years | 24 (2.1%) | $0 |
| 25 to 44 Years | 428 (36.9%) | $86,809 |
| 45 to 64 Years | 442 (38.1%) | $64,342 |
| 65+ Years | 265 (22.9%) | $50,417 |
| Total | 1,159 (100.0%) | $65,202 |
Poverty in Marquette Heights
Income Below Poverty by Sex and Age in Marquette Heights
With 6.0% poverty level for males and 8.1% for females among the residents of Marquette Heights, 12 to 14 year old males and 15 year old females are the most vulnerable to poverty, with 8 males (28.6%) and 16 females (80.0%) in their respective age groups living below the poverty level.
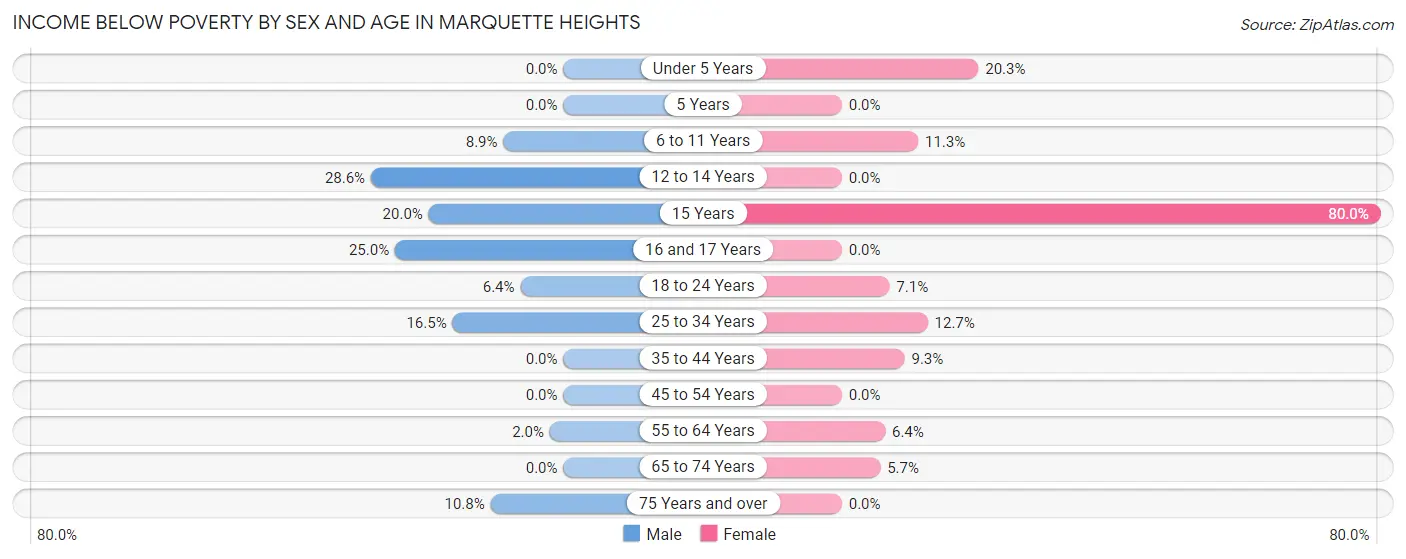
| Age Bracket | Male | Female |
| Under 5 Years | 0 (0.0%) | 15 (20.3%) |
| 5 Years | 0 (0.0%) | 0 (0.0%) |
| 6 to 11 Years | 9 (8.9%) | 6 (11.3%) |
| 12 to 14 Years | 8 (28.6%) | 0 (0.0%) |
| 15 Years | 7 (20.0%) | 16 (80.0%) |
| 16 and 17 Years | 16 (25.0%) | 0 (0.0%) |
| 18 to 24 Years | 6 (6.4%) | 7 (7.1%) |
| 25 to 34 Years | 26 (16.5%) | 20 (12.7%) |
| 35 to 44 Years | 0 (0.0%) | 22 (9.3%) |
| 45 to 54 Years | 0 (0.0%) | 0 (0.0%) |
| 55 to 64 Years | 4 (2.0%) | 14 (6.4%) |
| 65 to 74 Years | 0 (0.0%) | 8 (5.7%) |
| 75 Years and over | 4 (10.8%) | 0 (0.0%) |
| Total | 80 (6.0%) | 108 (8.1%) |
Income Above Poverty by Sex and Age in Marquette Heights
According to the poverty statistics in Marquette Heights, males aged under 5 years and females aged 5 years are the age groups that are most secure financially, with 100.0% of males and 100.0% of females in these age groups living above the poverty line.
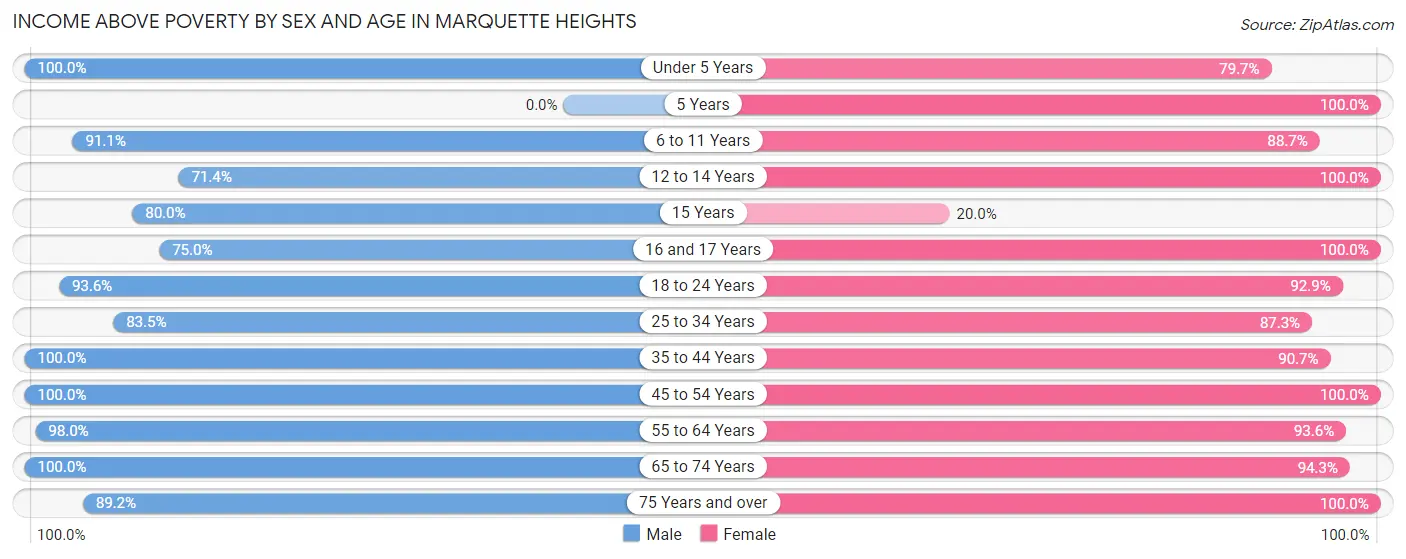
| Age Bracket | Male | Female |
| Under 5 Years | 60 (100.0%) | 59 (79.7%) |
| 5 Years | 0 (0.0%) | 21 (100.0%) |
| 6 to 11 Years | 92 (91.1%) | 47 (88.7%) |
| 12 to 14 Years | 20 (71.4%) | 56 (100.0%) |
| 15 Years | 28 (80.0%) | 4 (20.0%) |
| 16 and 17 Years | 48 (75.0%) | 13 (100.0%) |
| 18 to 24 Years | 88 (93.6%) | 92 (92.9%) |
| 25 to 34 Years | 132 (83.5%) | 137 (87.3%) |
| 35 to 44 Years | 219 (100.0%) | 214 (90.7%) |
| 45 to 54 Years | 168 (100.0%) | 186 (100.0%) |
| 55 to 64 Years | 195 (98.0%) | 204 (93.6%) |
| 65 to 74 Years | 174 (100.0%) | 132 (94.3%) |
| 75 Years and over | 33 (89.2%) | 54 (100.0%) |
| Total | 1,257 (94.0%) | 1,219 (91.9%) |
Income Below Poverty Among Married-Couple Families in Marquette Heights
The poverty statistics for married-couple families in Marquette Heights show that 0.7% or 4 of the total 585 families live below the poverty line. Families with no children have the highest poverty rate of 1.0%, comprising of 4 families. On the other hand, families with 1 or 2 children have the lowest poverty rate of 0.0%, which includes 0 families.
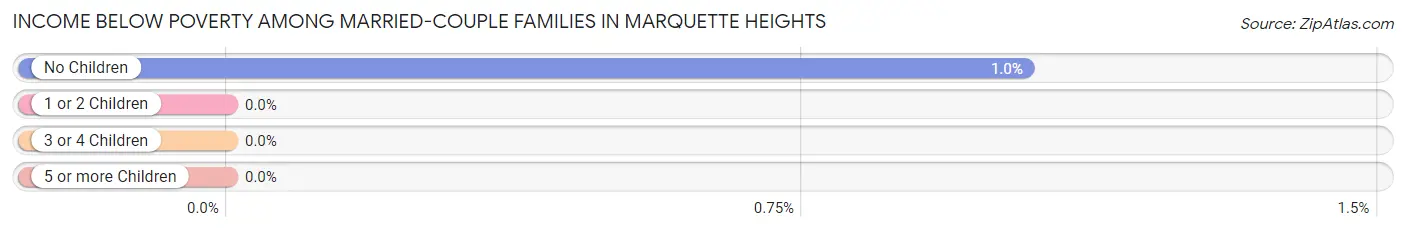
| Children | Above Poverty | Below Poverty |
| No Children | 379 (99.0%) | 4 (1.0%) |
| 1 or 2 Children | 177 (100.0%) | 0 (0.0%) |
| 3 or 4 Children | 25 (100.0%) | 0 (0.0%) |
| 5 or more Children | 0 (0.0%) | 0 (0.0%) |
| Total | 581 (99.3%) | 4 (0.7%) |
Income Below Poverty Among Single-Parent Households in Marquette Heights
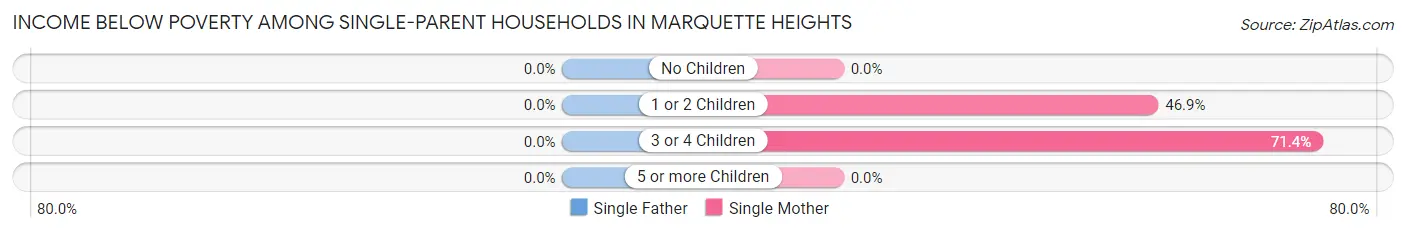
| Children | Single Father | Single Mother |
| No Children | 0 (0.0%) | 0 (0.0%) |
| 1 or 2 Children | 0 (0.0%) | 15 (46.9%) |
| 3 or 4 Children | 0 (0.0%) | 15 (71.4%) |
| 5 or more Children | 0 (0.0%) | 0 (0.0%) |
| Total | 0 (0.0%) | 30 (56.6%) |
Income Below Poverty Among Married-Couple vs Single-Parent Households in Marquette Heights
The poverty data for Marquette Heights shows that 4 of the married-couple family households (0.7%) and 30 of the single-parent households (22.2%) are living below the poverty level. Within the married-couple family households, those with no children have the highest poverty rate, with 4 households (1.0%) falling below the poverty line. Among the single-parent households, those with 3 or 4 children have the highest poverty rate, with 15 household (71.4%) living below poverty.
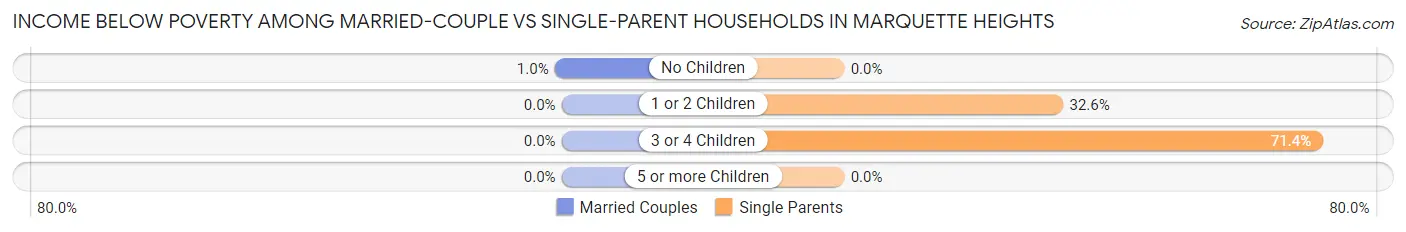
| Children | Married-Couple Families | Single-Parent Households |
| No Children | 4 (1.0%) | 0 (0.0%) |
| 1 or 2 Children | 0 (0.0%) | 15 (32.6%) |
| 3 or 4 Children | 0 (0.0%) | 15 (71.4%) |
| 5 or more Children | 0 (0.0%) | 0 (0.0%) |
| Total | 4 (0.7%) | 30 (22.2%) |
Race in Marquette Heights
The most populous races in Marquette Heights are White / Caucasian (2,506 | 93.8%), Hispanic or Latino (139 | 5.2%), and Two or more Races (138 | 5.2%).
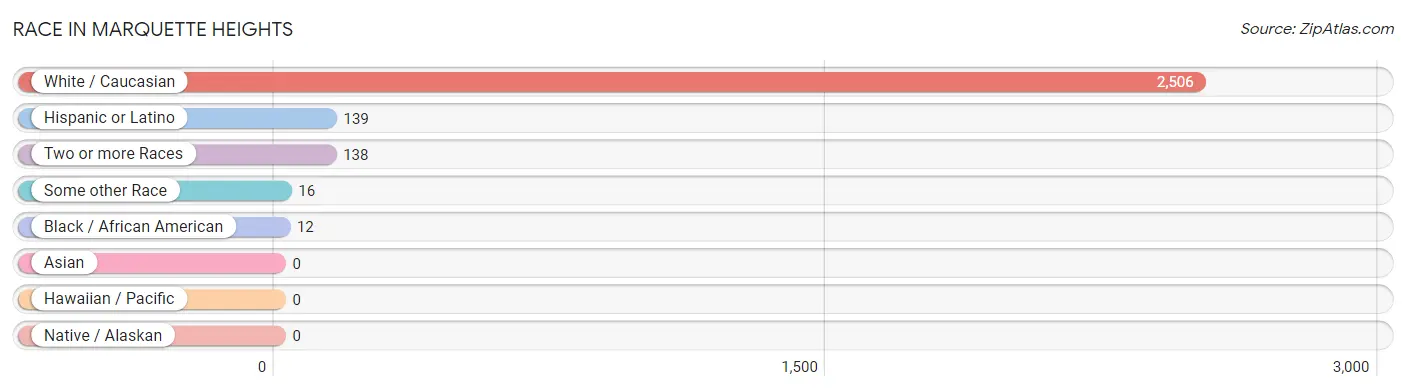
| Race | # Population | % Population |
| Asian | 0 | 0.0% |
| Black / African American | 12 | 0.4% |
| Hawaiian / Pacific | 0 | 0.0% |
| Hispanic or Latino | 139 | 5.2% |
| Native / Alaskan | 0 | 0.0% |
| White / Caucasian | 2,506 | 93.8% |
| Two or more Races | 138 | 5.2% |
| Some other Race | 16 | 0.6% |
| Total | 2,672 | 100.0% |
Ancestry in Marquette Heights
The most populous ancestries reported in Marquette Heights are German (577 | 21.6%), Irish (308 | 11.5%), English (291 | 10.9%), American (216 | 8.1%), and Dutch (139 | 5.2%), together accounting for 57.3% of all Marquette Heights residents.
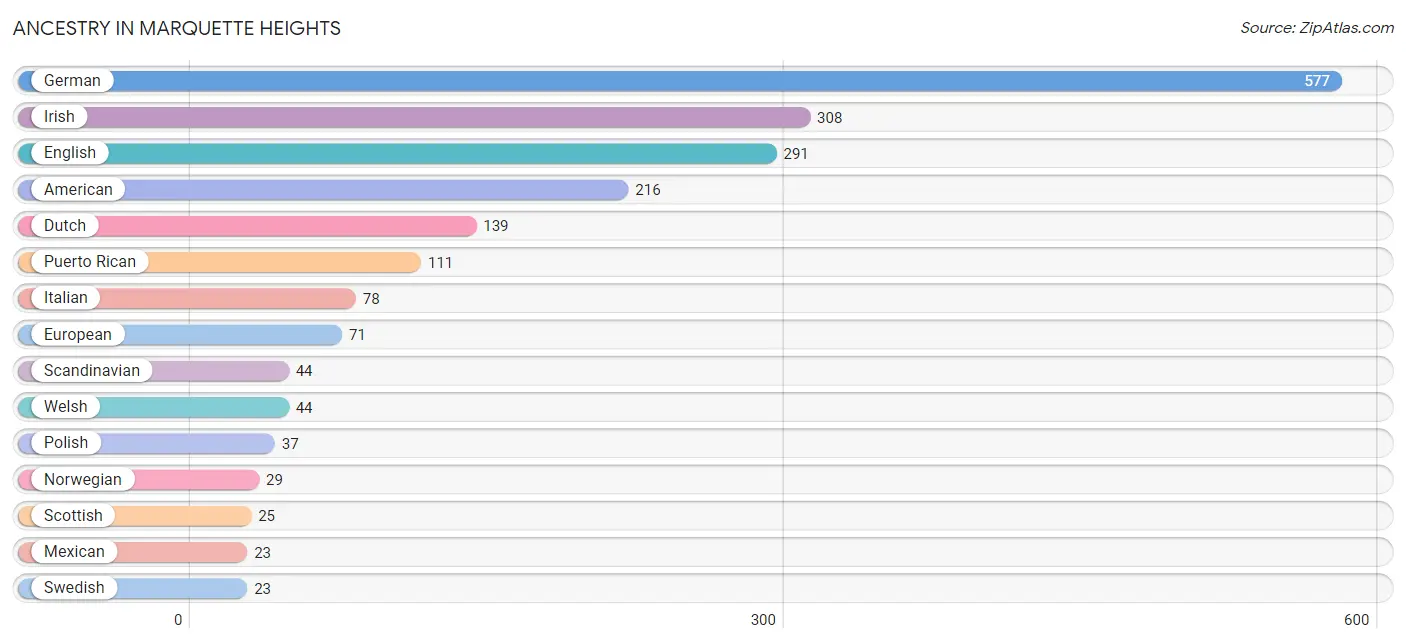
| Ancestry | # Population | % Population |
| African | 3 | 0.1% |
| American | 216 | 8.1% |
| Arab | 15 | 0.6% |
| Austrian | 16 | 0.6% |
| Belgian | 12 | 0.4% |
| British | 4 | 0.2% |
| Chippewa | 5 | 0.2% |
| Colombian | 5 | 0.2% |
| Danish | 6 | 0.2% |
| Dutch | 139 | 5.2% |
| Eastern European | 15 | 0.6% |
| English | 291 | 10.9% |
| European | 71 | 2.7% |
| French | 9 | 0.3% |
| French Canadian | 12 | 0.4% |
| German | 577 | 21.6% |
| Greek | 9 | 0.3% |
| Irish | 308 | 11.5% |
| Italian | 78 | 2.9% |
| Lebanese | 9 | 0.3% |
| Mexican | 23 | 0.9% |
| Northern European | 14 | 0.5% |
| Norwegian | 29 | 1.1% |
| Polish | 37 | 1.4% |
| Portuguese | 4 | 0.2% |
| Puerto Rican | 111 | 4.2% |
| Scandinavian | 44 | 1.7% |
| Scotch-Irish | 15 | 0.6% |
| Scottish | 25 | 0.9% |
| Serbian | 5 | 0.2% |
| South American | 5 | 0.2% |
| Subsaharan African | 3 | 0.1% |
| Swedish | 23 | 0.9% |
| Syrian | 6 | 0.2% |
| Welsh | 44 | 1.7% | View All 35 Rows |
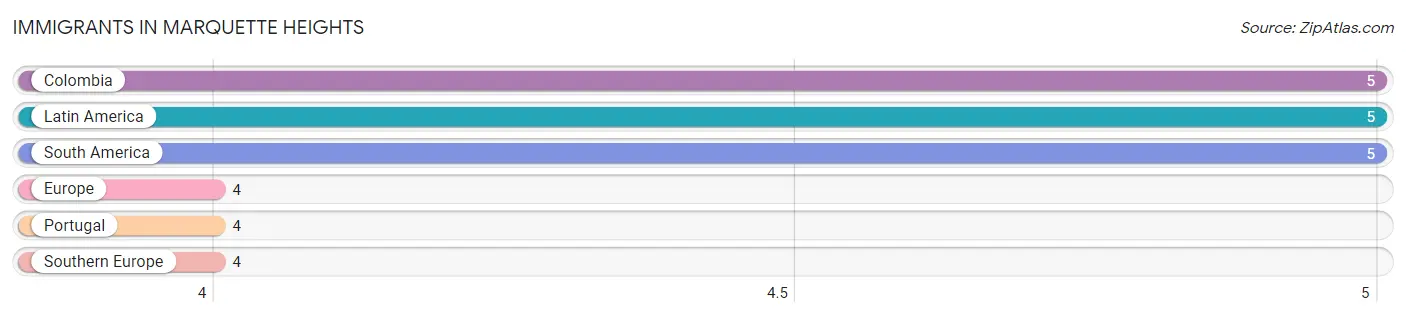
Immigrants in Marquette Heights
The most numerous immigrant groups reported in Marquette Heights came from Colombia (5 | 0.2%), Latin America (5 | 0.2%), South America (5 | 0.2%), Europe (4 | 0.2%), and Portugal (4 | 0.2%), together accounting for 0.9% of all Marquette Heights residents.
| Immigration Origin | # Population | % Population |
| Colombia | 5 | 0.2% |
| Europe | 4 | 0.2% |
| Latin America | 5 | 0.2% |
| Portugal | 4 | 0.2% |
| South America | 5 | 0.2% |
| Southern Europe | 4 | 0.2% | View All 6 Rows |
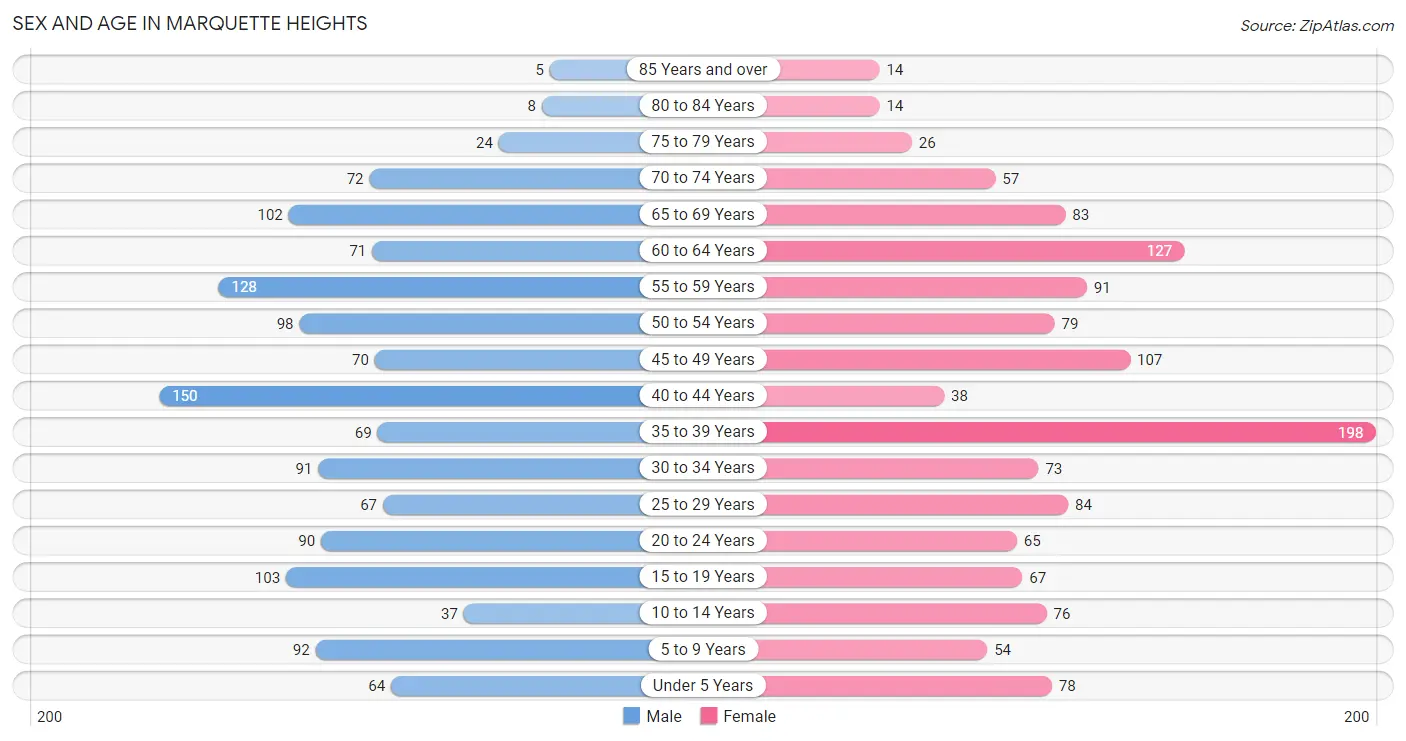
Sex and Age in Marquette Heights
Sex and Age in Marquette Heights
The most populous age groups in Marquette Heights are 40 to 44 Years (150 | 11.2%) for men and 35 to 39 Years (198 | 14.9%) for women.
| Age Bracket | Male | Female |
| Under 5 Years | 64 (4.8%) | 78 (5.9%) |
| 5 to 9 Years | 92 (6.9%) | 54 (4.1%) |
| 10 to 14 Years | 37 (2.8%) | 76 (5.7%) |
| 15 to 19 Years | 103 (7.7%) | 67 (5.0%) |
| 20 to 24 Years | 90 (6.7%) | 65 (4.9%) |
| 25 to 29 Years | 67 (5.0%) | 84 (6.3%) |
| 30 to 34 Years | 91 (6.8%) | 73 (5.5%) |
| 35 to 39 Years | 69 (5.1%) | 198 (14.9%) |
| 40 to 44 Years | 150 (11.2%) | 38 (2.9%) |
| 45 to 49 Years | 70 (5.2%) | 107 (8.0%) |
| 50 to 54 Years | 98 (7.3%) | 79 (5.9%) |
| 55 to 59 Years | 128 (9.6%) | 91 (6.8%) |
| 60 to 64 Years | 71 (5.3%) | 127 (9.5%) |
| 65 to 69 Years | 102 (7.6%) | 83 (6.2%) |
| 70 to 74 Years | 72 (5.4%) | 57 (4.3%) |
| 75 to 79 Years | 24 (1.8%) | 26 (1.9%) |
| 80 to 84 Years | 8 (0.6%) | 14 (1.1%) |
| 85 Years and over | 5 (0.4%) | 14 (1.1%) |
| Total | 1,341 (100.0%) | 1,331 (100.0%) |
Families and Households in Marquette Heights
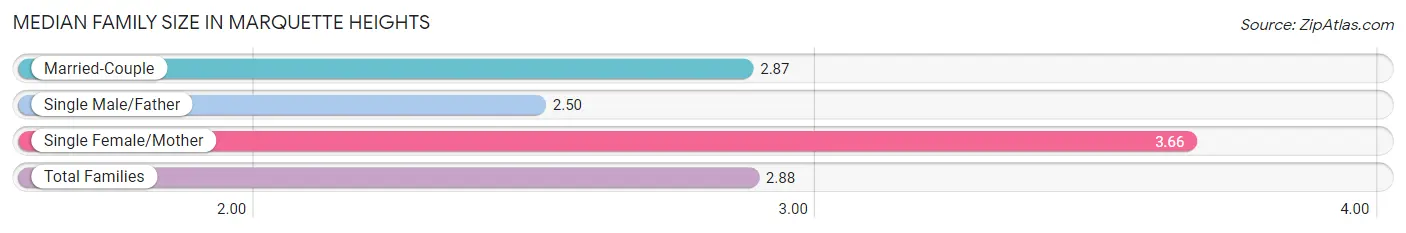
Median Family Size in Marquette Heights
The median family size in Marquette Heights is 2.88 persons per family, with single female/mother families (53 | 7.4%) accounting for the largest median family size of 3.66 persons per family. On the other hand, single male/father families (82 | 11.4%) represent the smallest median family size with 2.50 persons per family.
| Family Type | # Families | Family Size |
| Married-Couple | 585 (81.2%) | 2.87 |
| Single Male/Father | 82 (11.4%) | 2.50 |
| Single Female/Mother | 53 (7.4%) | 3.66 |
| Total Families | 720 (100.0%) | 2.88 |
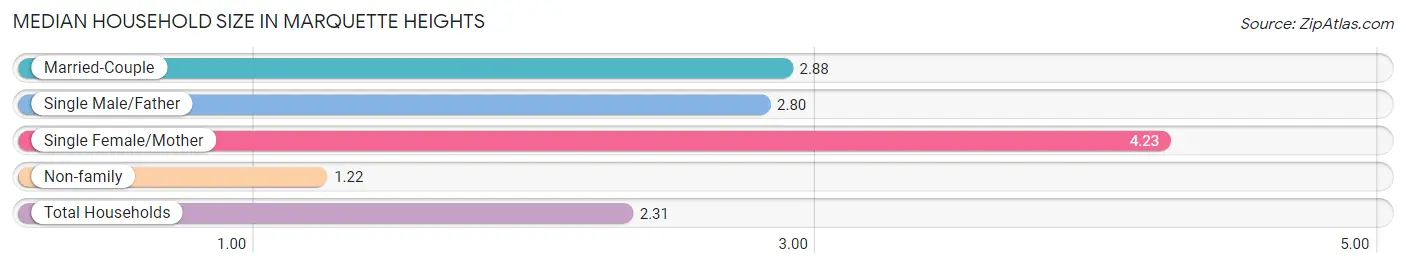
Median Household Size in Marquette Heights
The median household size in Marquette Heights is 2.31 persons per household, with single female/mother households (53 | 4.6%) accounting for the largest median household size of 4.23 persons per household. non-family households (439 | 37.9%) represent the smallest median household size with 1.22 persons per household.
| Household Type | # Households | Household Size |
| Married-Couple | 585 (50.5%) | 2.88 |
| Single Male/Father | 82 (7.1%) | 2.80 |
| Single Female/Mother | 53 (4.6%) | 4.23 |
| Non-family | 439 (37.9%) | 1.22 |
| Total Households | 1,159 (100.0%) | 2.31 |
Household Size by Marriage Status in Marquette Heights
Out of a total of 1,159 households in Marquette Heights, 720 (62.1%) are family households, while 439 (37.9%) are nonfamily households. The most numerous type of family households are 2-person households, comprising 377, and the most common type of nonfamily households are 1-person households, comprising 361.
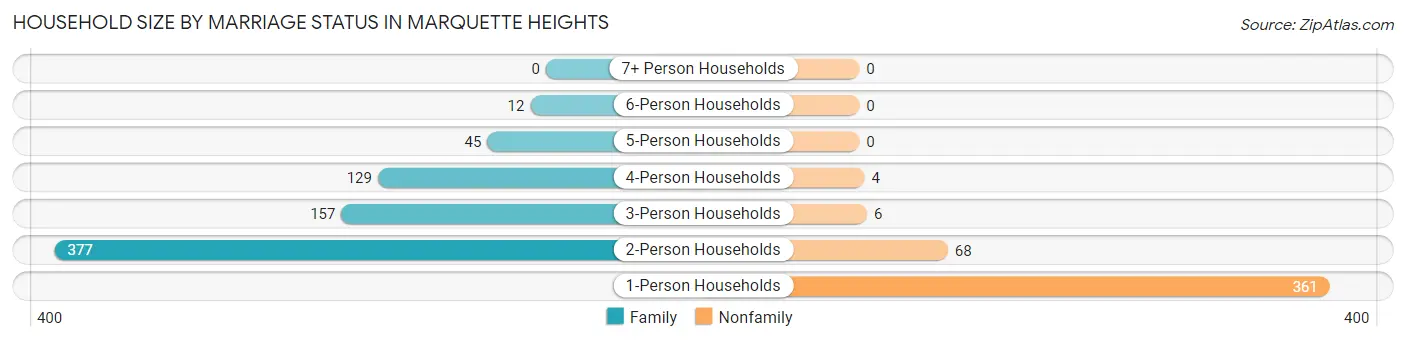
| Household Size | Family Households | Nonfamily Households |
| 1-Person Households | - | 361 (31.1%) |
| 2-Person Households | 377 (32.5%) | 68 (5.9%) |
| 3-Person Households | 157 (13.6%) | 6 (0.5%) |
| 4-Person Households | 129 (11.1%) | 4 (0.4%) |
| 5-Person Households | 45 (3.9%) | 0 (0.0%) |
| 6-Person Households | 12 (1.0%) | 0 (0.0%) |
| 7+ Person Households | 0 (0.0%) | 0 (0.0%) |
| Total | 720 (62.1%) | 439 (37.9%) |
Female Fertility in Marquette Heights
Fertility by Age in Marquette Heights
Average fertility rate in Marquette Heights is 15.0 births per 1,000 women. Women in the age bracket of 20 to 34 years have the highest fertility rate with 45.0 births per 1,000 women. Women in the age bracket of 20 to 34 years acount for 100.0% of all women with births.
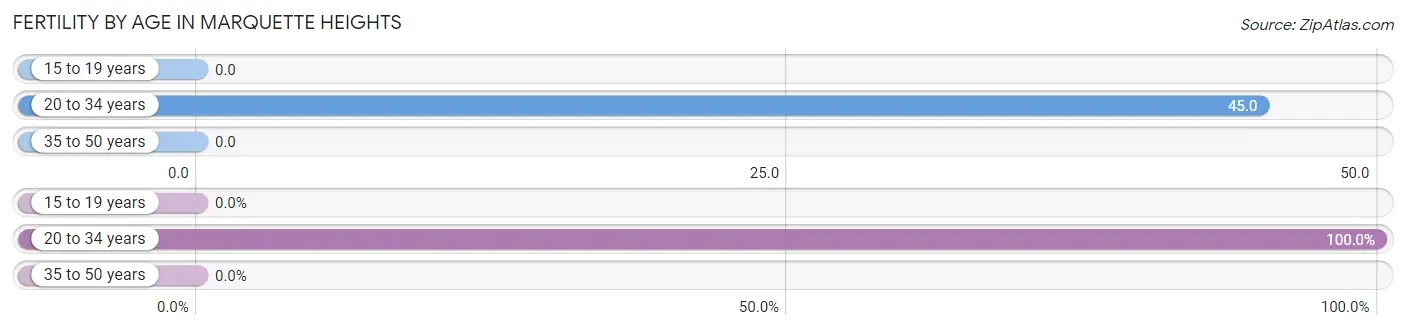
| Age Bracket | Women with Births | Births / 1,000 Women |
| 15 to 19 years | 0 (0.0%) | 0.0 |
| 20 to 34 years | 10 (100.0%) | 45.0 |
| 35 to 50 years | 0 (0.0%) | 0.0 |
| Total | 10 (100.0%) | 15.0 |
Fertility by Age by Marriage Status in Marquette Heights
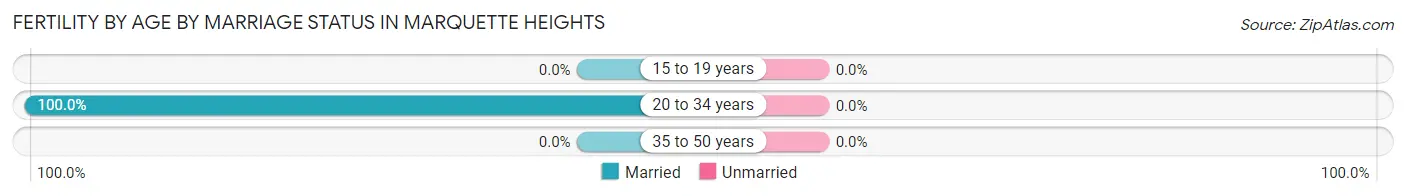
| Age Bracket | Married | Unmarried |
| 15 to 19 years | 0 (0.0%) | 0 (0.0%) |
| 20 to 34 years | 10 (100.0%) | 0 (0.0%) |
| 35 to 50 years | 0 (0.0%) | 0 (0.0%) |
| Total | 10 (100.0%) | 0 (0.0%) |
Fertility by Education in Marquette Heights
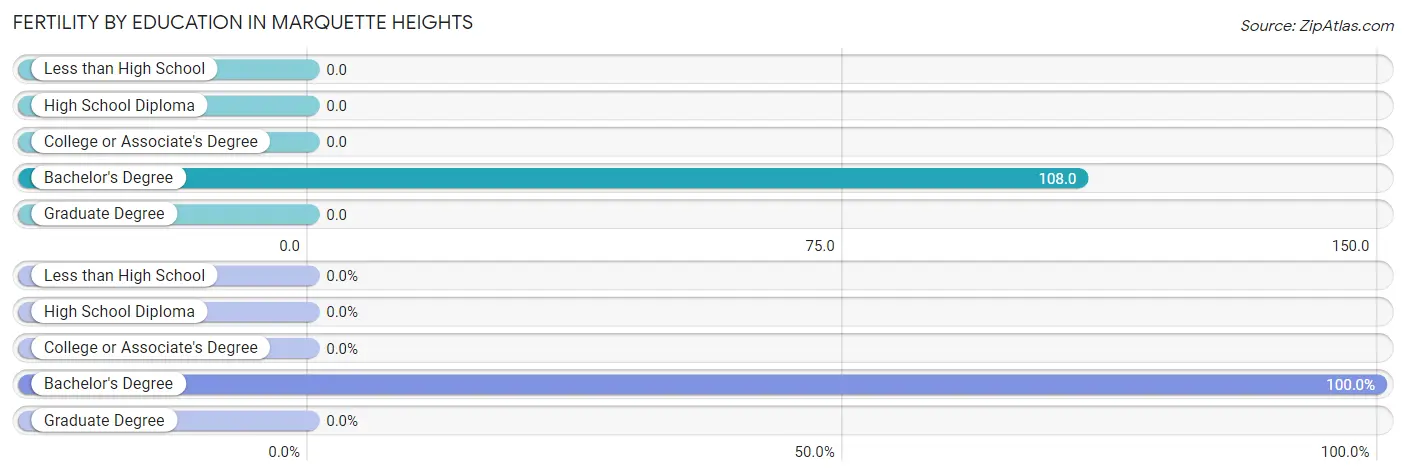
| Educational Attainment | Women with Births | Births / 1,000 Women |
| Less than High School | 0 (0.0%) | 0.0 |
| High School Diploma | 0 (0.0%) | 0.0 |
| College or Associate's Degree | 0 (0.0%) | 0.0 |
| Bachelor's Degree | 10 (100.0%) | 108.0 |
| Graduate Degree | 0 (0.0%) | 0.0 |
| Total | 10 (100.0%) | 15.0 |
Fertility by Education by Marriage Status in Marquette Heights
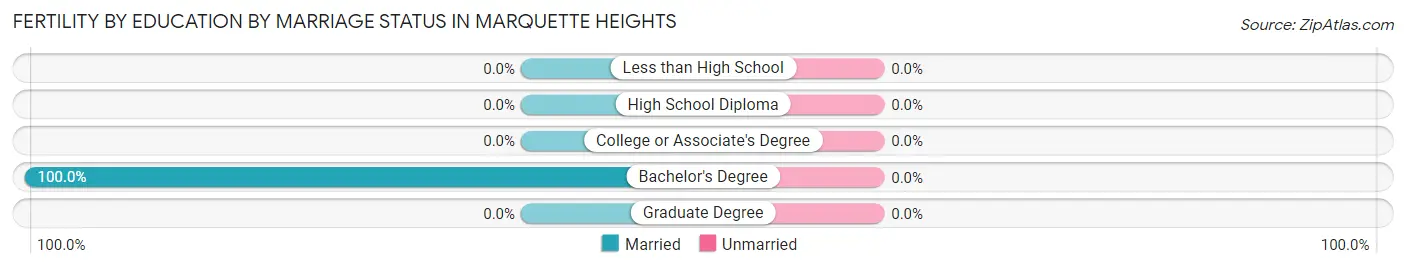
| Educational Attainment | Married | Unmarried |
| Less than High School | 0 (0.0%) | 0 (0.0%) |
| High School Diploma | 0 (0.0%) | 0 (0.0%) |
| College or Associate's Degree | 0 (0.0%) | 0 (0.0%) |
| Bachelor's Degree | 10 (100.0%) | 0 (0.0%) |
| Graduate Degree | 0 (0.0%) | 0 (0.0%) |
| Total | 10 (100.0%) | 0 (0.0%) |
Employment Characteristics in Marquette Heights
Employment by Class of Employer in Marquette Heights
Among the 1,337 employed individuals in Marquette Heights, private company employees (936 | 70.0%), local government employees (181 | 13.5%), and state government employees (90 | 6.7%) make up the most common classes of employment.
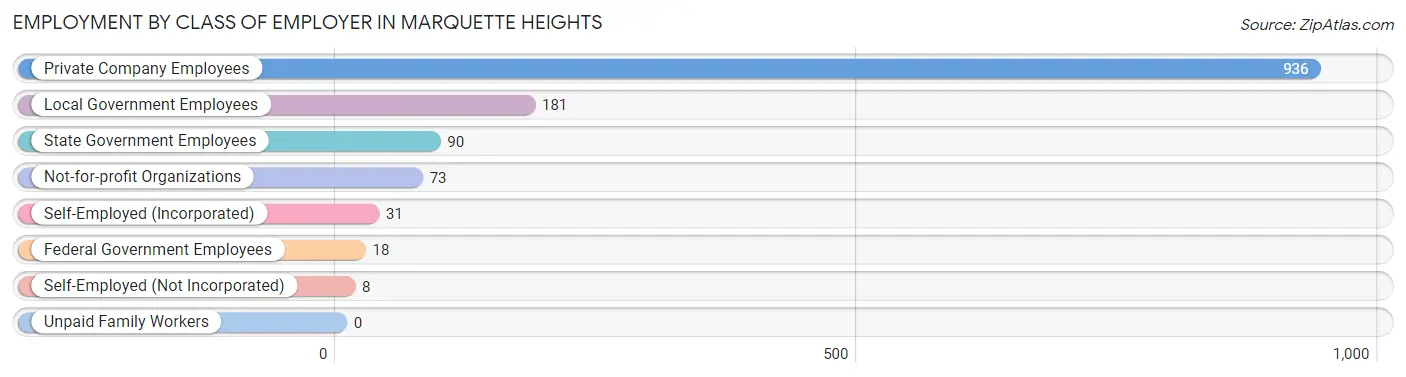
| Employer Class | # Employees | % Employees |
| Private Company Employees | 936 | 70.0% |
| Self-Employed (Incorporated) | 31 | 2.3% |
| Self-Employed (Not Incorporated) | 8 | 0.6% |
| Not-for-profit Organizations | 73 | 5.5% |
| Local Government Employees | 181 | 13.5% |
| State Government Employees | 90 | 6.7% |
| Federal Government Employees | 18 | 1.3% |
| Unpaid Family Workers | 0 | 0.0% |
| Total | 1,337 | 100.0% |
Employment Status by Age in Marquette Heights
According to the labor force statistics for Marquette Heights, out of the total population over 16 years of age (2,216), 65.2% or 1,445 individuals are in the labor force, with 4.8% or 69 of them unemployed. The age group with the highest labor force participation rate is 35 to 44 years, with 92.7% or 422 individuals in the labor force. Within the labor force, the 16 to 19 years age range has the highest percentage of unemployed individuals, with 12.5% or 6 of them being unemployed.
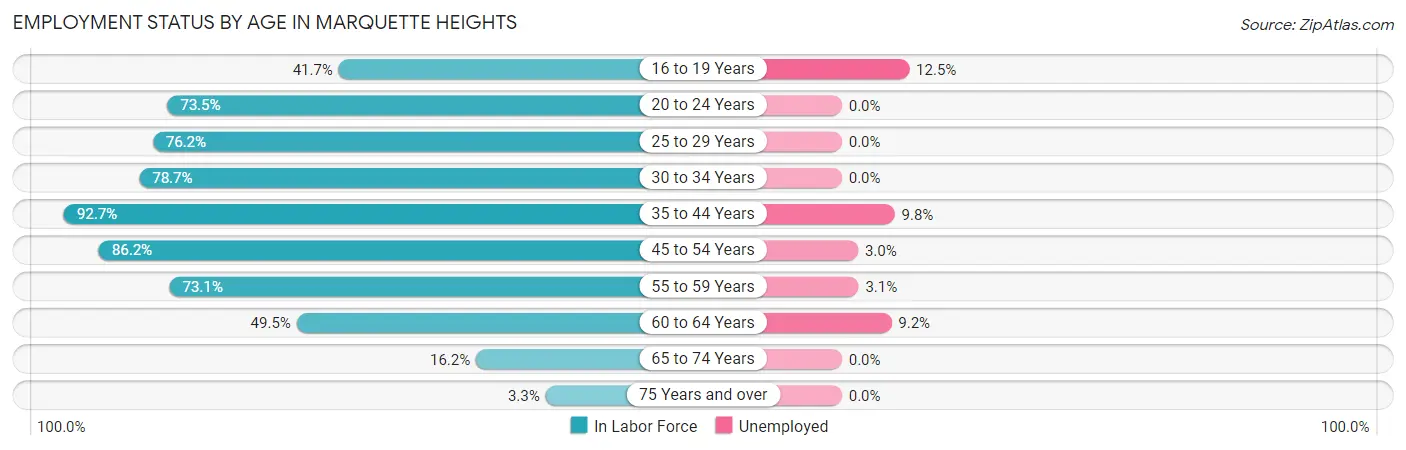
| Age Bracket | In Labor Force | Unemployed |
| 16 to 19 Years | 48 (41.7%) | 6 (12.5%) |
| 20 to 24 Years | 114 (73.5%) | 0 (0.0%) |
| 25 to 29 Years | 115 (76.2%) | 0 (0.0%) |
| 30 to 34 Years | 129 (78.7%) | 0 (0.0%) |
| 35 to 44 Years | 422 (92.7%) | 41 (9.8%) |
| 45 to 54 Years | 305 (86.2%) | 9 (3.0%) |
| 55 to 59 Years | 160 (73.1%) | 5 (3.1%) |
| 60 to 64 Years | 98 (49.5%) | 9 (9.2%) |
| 65 to 74 Years | 51 (16.2%) | 0 (0.0%) |
| 75 Years and over | 3 (3.3%) | 0 (0.0%) |
| Total | 1,445 (65.2%) | 69 (4.8%) |
Employment Status by Educational Attainment in Marquette Heights
According to labor force statistics for Marquette Heights, 79.8% of individuals (1,230) out of the total population between 25 and 64 years of age (1,541) are in the labor force, with 5.2% or 64 of them being unemployed. The group with the highest labor force participation rate are those with the educational attainment of bachelor's degree or higher, with 91.4% or 361 individuals in the labor force. Within the labor force, individuals with high school diploma education have the highest percentage of unemployment, with 11.2% or 38 of them being unemployed.
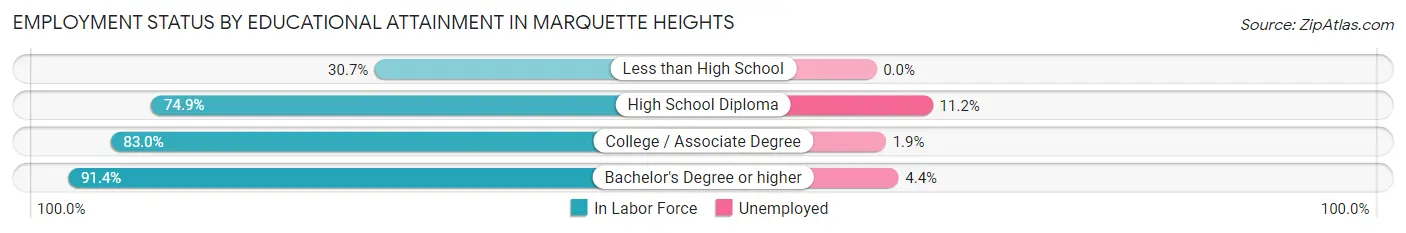
| Educational Attainment | In Labor Force | Unemployed |
| Less than High School | 27 (30.7%) | 0 (0.0%) |
| High School Diploma | 343 (74.9%) | 51 (11.2%) |
| College / Associate Degree | 498 (83.0%) | 11 (1.9%) |
| Bachelor's Degree or higher | 361 (91.4%) | 17 (4.4%) |
| Total | 1,230 (79.8%) | 80 (5.2%) |
Employment Occupations by Sex in Marquette Heights
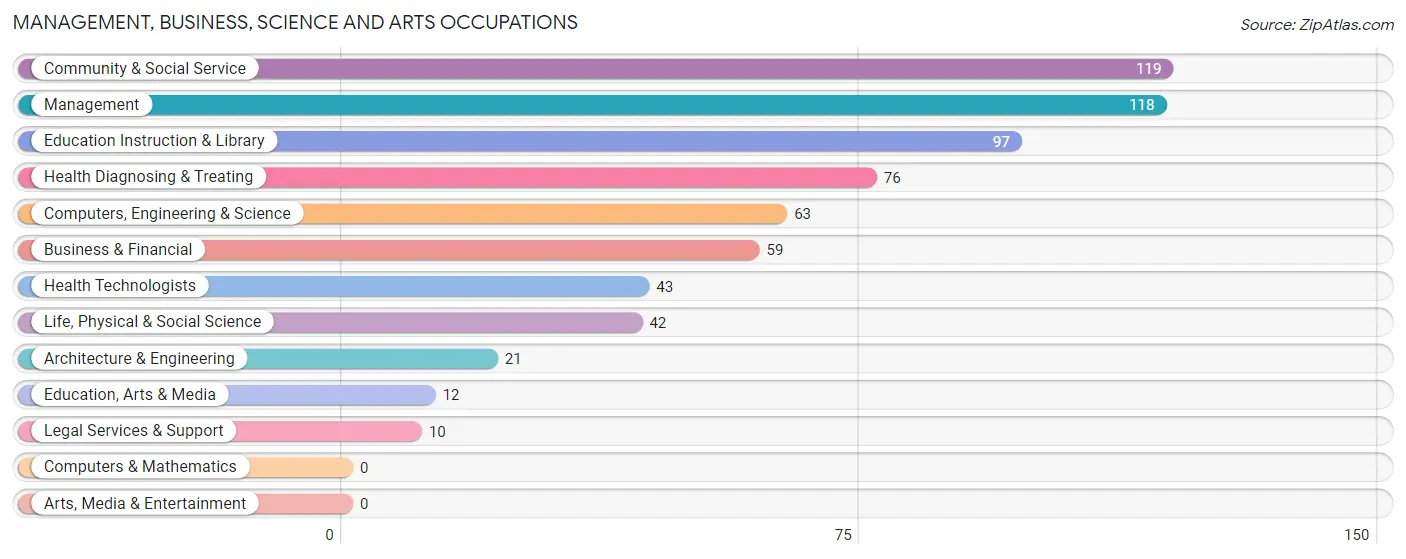
Management, Business, Science and Arts Occupations
The most common Management, Business, Science and Arts occupations in Marquette Heights are Community & Social Service (119 | 8.8%), Management (118 | 8.7%), Education Instruction & Library (97 | 7.1%), Health Diagnosing & Treating (76 | 5.6%), and Computers, Engineering & Science (63 | 4.6%).
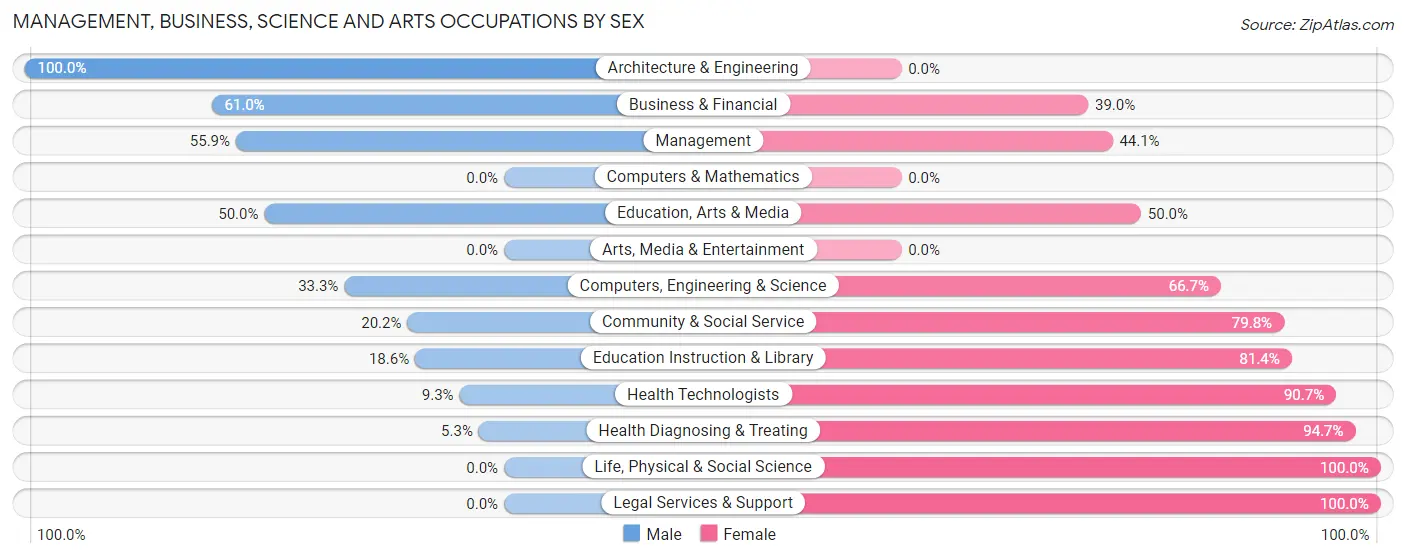
Management, Business, Science and Arts Occupations by Sex
Within the Management, Business, Science and Arts occupations in Marquette Heights, the most male-oriented occupations are Architecture & Engineering (100.0%), Business & Financial (61.0%), and Management (55.9%), while the most female-oriented occupations are Life, Physical & Social Science (100.0%), Legal Services & Support (100.0%), and Health Diagnosing & Treating (94.7%).
| Occupation | Male | Female |
| Management | 66 (55.9%) | 52 (44.1%) |
| Business & Financial | 36 (61.0%) | 23 (39.0%) |
| Computers, Engineering & Science | 21 (33.3%) | 42 (66.7%) |
| Computers & Mathematics | 0 (0.0%) | 0 (0.0%) |
| Architecture & Engineering | 21 (100.0%) | 0 (0.0%) |
| Life, Physical & Social Science | 0 (0.0%) | 42 (100.0%) |
| Community & Social Service | 24 (20.2%) | 95 (79.8%) |
| Education, Arts & Media | 6 (50.0%) | 6 (50.0%) |
| Legal Services & Support | 0 (0.0%) | 10 (100.0%) |
| Education Instruction & Library | 18 (18.6%) | 79 (81.4%) |
| Arts, Media & Entertainment | 0 (0.0%) | 0 (0.0%) |
| Health Diagnosing & Treating | 4 (5.3%) | 72 (94.7%) |
| Health Technologists | 4 (9.3%) | 39 (90.7%) |
| Total (Category) | 151 (34.7%) | 284 (65.3%) |
| Total (Overall) | 665 (49.0%) | 693 (51.0%) |
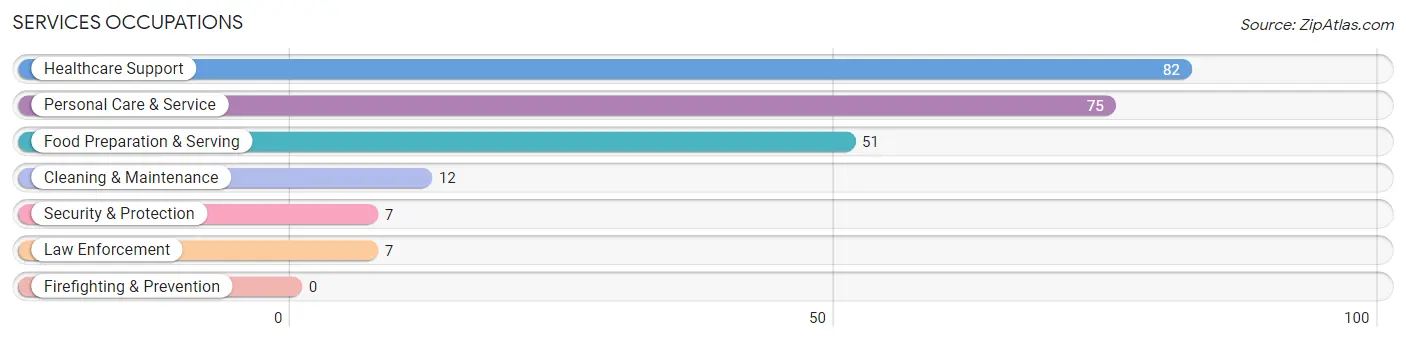
Services Occupations
The most common Services occupations in Marquette Heights are Healthcare Support (82 | 6.0%), Personal Care & Service (75 | 5.5%), Food Preparation & Serving (51 | 3.8%), Cleaning & Maintenance (12 | 0.9%), and Security & Protection (7 | 0.5%).
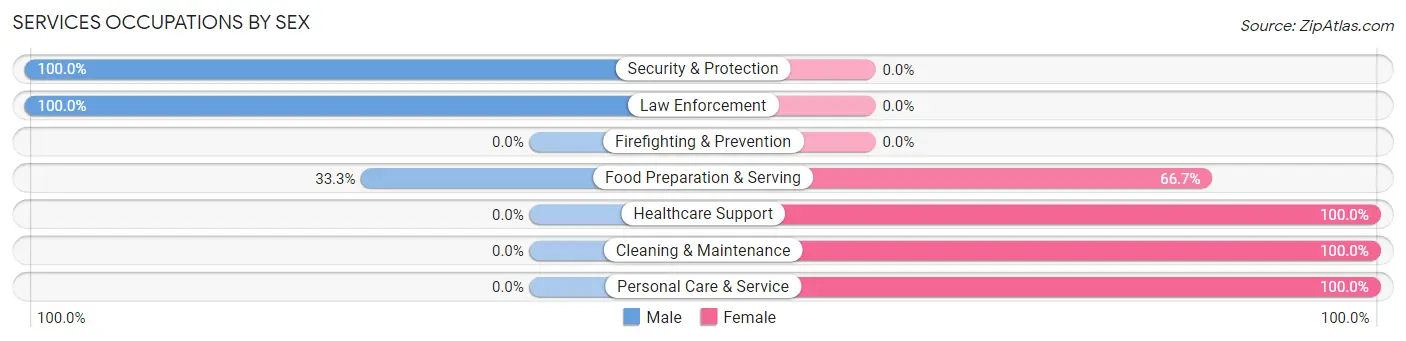
Services Occupations by Sex
Within the Services occupations in Marquette Heights, the most male-oriented occupations are Security & Protection (100.0%), Law Enforcement (100.0%), and Food Preparation & Serving (33.3%), while the most female-oriented occupations are Healthcare Support (100.0%), Cleaning & Maintenance (100.0%), and Personal Care & Service (100.0%).
| Occupation | Male | Female |
| Healthcare Support | 0 (0.0%) | 82 (100.0%) |
| Security & Protection | 7 (100.0%) | 0 (0.0%) |
| Firefighting & Prevention | 0 (0.0%) | 0 (0.0%) |
| Law Enforcement | 7 (100.0%) | 0 (0.0%) |
| Food Preparation & Serving | 17 (33.3%) | 34 (66.7%) |
| Cleaning & Maintenance | 0 (0.0%) | 12 (100.0%) |
| Personal Care & Service | 0 (0.0%) | 75 (100.0%) |
| Total (Category) | 24 (10.6%) | 203 (89.4%) |
| Total (Overall) | 665 (49.0%) | 693 (51.0%) |
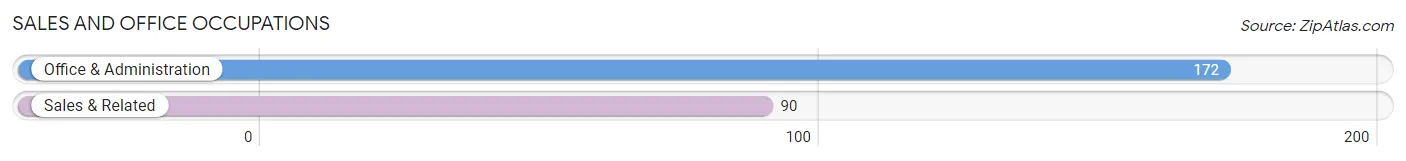
Sales and Office Occupations
The most common Sales and Office occupations in Marquette Heights are Office & Administration (172 | 12.7%), and Sales & Related (90 | 6.6%).
Sales and Office Occupations by Sex
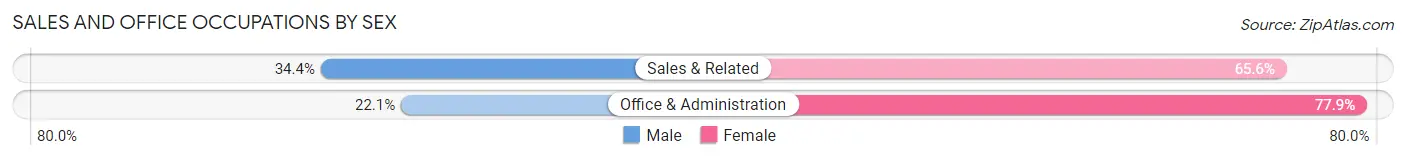
| Occupation | Male | Female |
| Sales & Related | 31 (34.4%) | 59 (65.6%) |
| Office & Administration | 38 (22.1%) | 134 (77.9%) |
| Total (Category) | 69 (26.3%) | 193 (73.7%) |
| Total (Overall) | 665 (49.0%) | 693 (51.0%) |
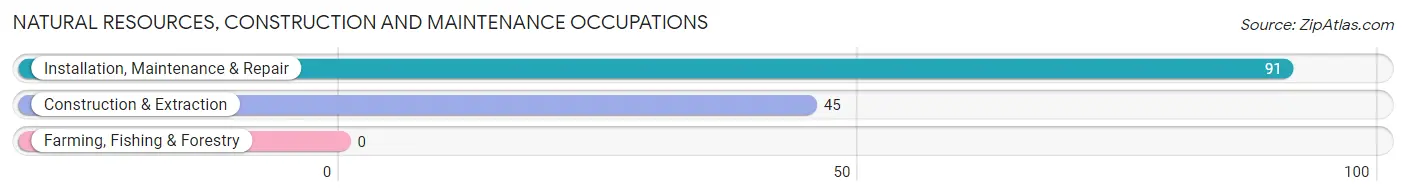
Natural Resources, Construction and Maintenance Occupations
The most common Natural Resources, Construction and Maintenance occupations in Marquette Heights are Installation, Maintenance & Repair (91 | 6.7%), and Construction & Extraction (45 | 3.3%).
Natural Resources, Construction and Maintenance Occupations by Sex
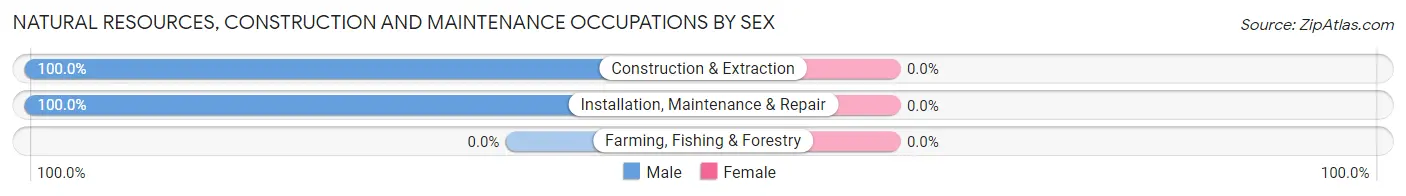
| Occupation | Male | Female |
| Farming, Fishing & Forestry | 0 (0.0%) | 0 (0.0%) |
| Construction & Extraction | 45 (100.0%) | 0 (0.0%) |
| Installation, Maintenance & Repair | 91 (100.0%) | 0 (0.0%) |
| Total (Category) | 136 (100.0%) | 0 (0.0%) |
| Total (Overall) | 665 (49.0%) | 693 (51.0%) |
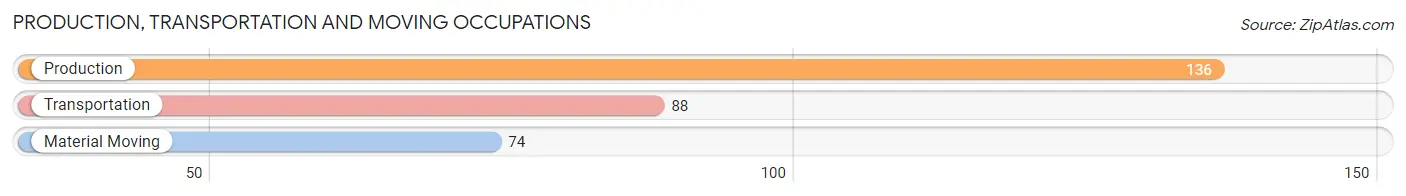
Production, Transportation and Moving Occupations
The most common Production, Transportation and Moving occupations in Marquette Heights are Production (136 | 10.0%), Transportation (88 | 6.5%), and Material Moving (74 | 5.4%).
Production, Transportation and Moving Occupations by Sex
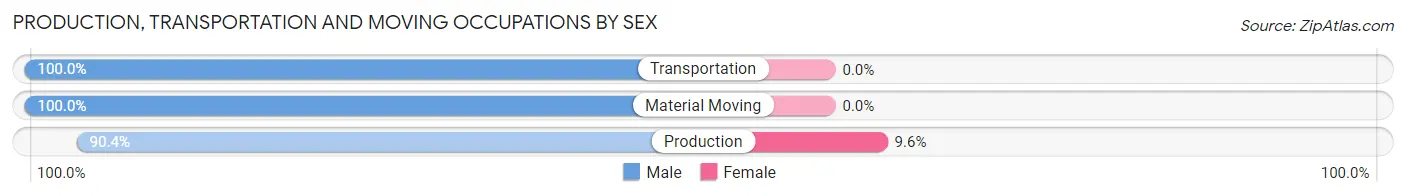
| Occupation | Male | Female |
| Production | 123 (90.4%) | 13 (9.6%) |
| Transportation | 88 (100.0%) | 0 (0.0%) |
| Material Moving | 74 (100.0%) | 0 (0.0%) |
| Total (Category) | 285 (95.6%) | 13 (4.4%) |
| Total (Overall) | 665 (49.0%) | 693 (51.0%) |
Employment Industries by Sex in Marquette Heights
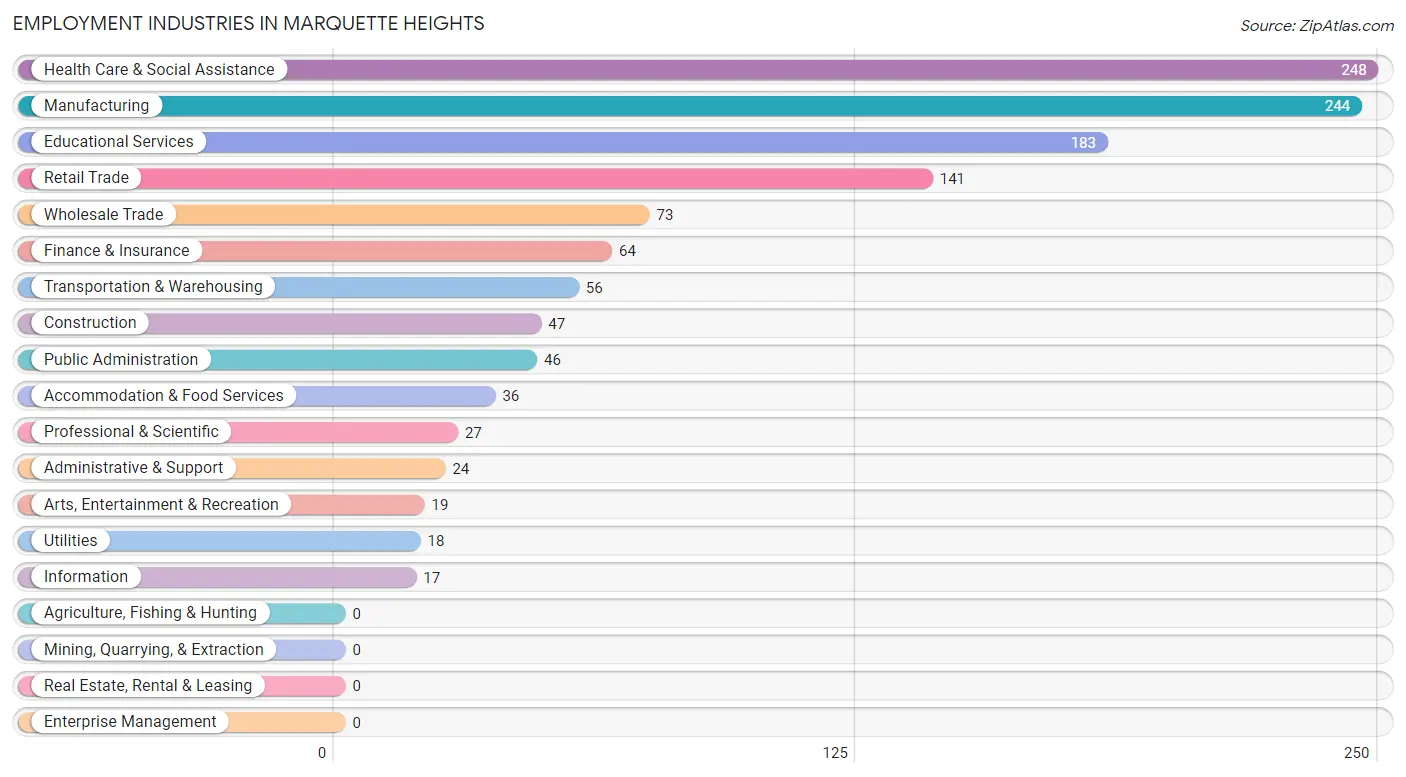
Employment Industries in Marquette Heights
The major employment industries in Marquette Heights include Health Care & Social Assistance (248 | 18.3%), Manufacturing (244 | 18.0%), Educational Services (183 | 13.5%), Retail Trade (141 | 10.4%), and Wholesale Trade (73 | 5.4%).
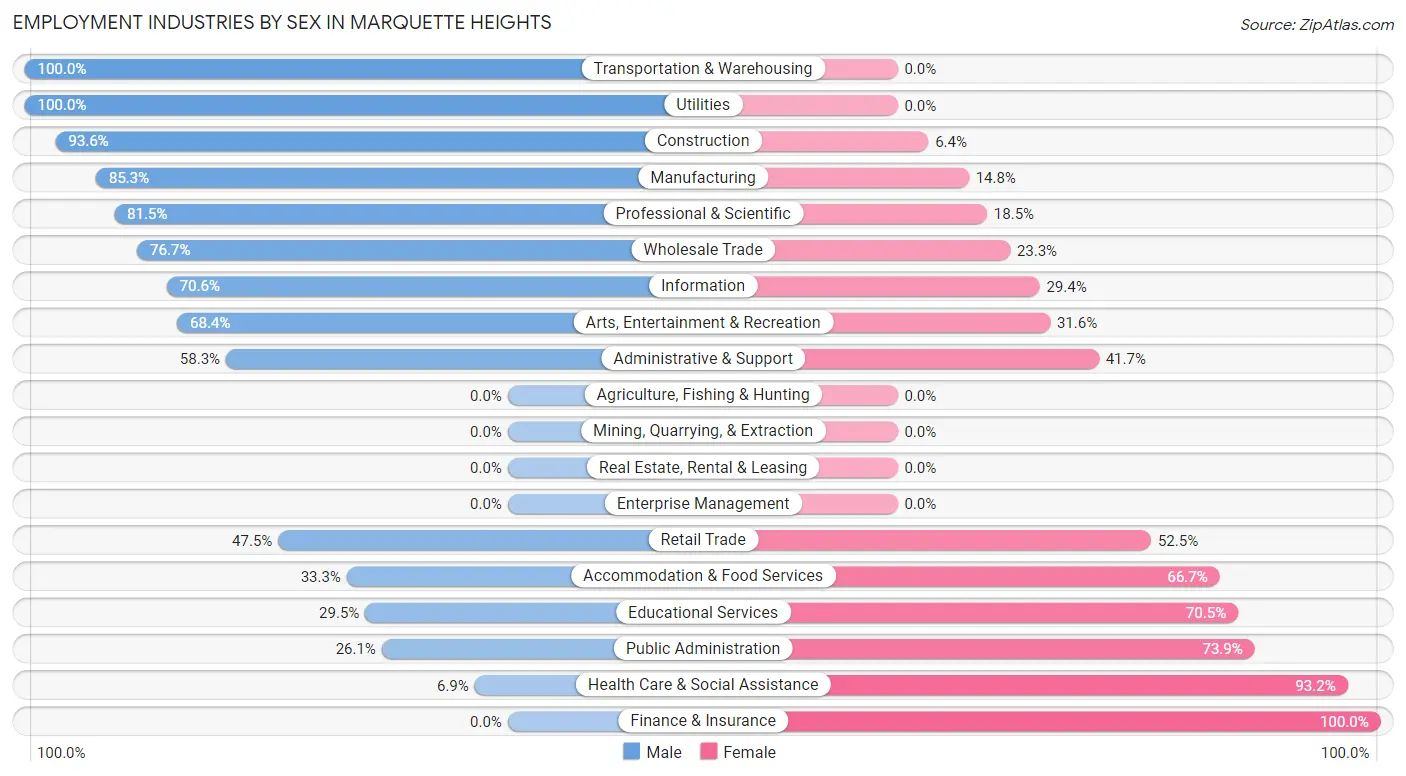
Employment Industries by Sex in Marquette Heights
The Marquette Heights industries that see more men than women are Transportation & Warehousing (100.0%), Utilities (100.0%), and Construction (93.6%), whereas the industries that tend to have a higher number of women are Finance & Insurance (100.0%), Health Care & Social Assistance (93.1%), and Public Administration (73.9%).
| Industry | Male | Female |
| Agriculture, Fishing & Hunting | 0 (0.0%) | 0 (0.0%) |
| Mining, Quarrying, & Extraction | 0 (0.0%) | 0 (0.0%) |
| Construction | 44 (93.6%) | 3 (6.4%) |
| Manufacturing | 208 (85.3%) | 36 (14.7%) |
| Wholesale Trade | 56 (76.7%) | 17 (23.3%) |
| Retail Trade | 67 (47.5%) | 74 (52.5%) |
| Transportation & Warehousing | 56 (100.0%) | 0 (0.0%) |
| Utilities | 18 (100.0%) | 0 (0.0%) |
| Information | 12 (70.6%) | 5 (29.4%) |
| Finance & Insurance | 0 (0.0%) | 64 (100.0%) |
| Real Estate, Rental & Leasing | 0 (0.0%) | 0 (0.0%) |
| Professional & Scientific | 22 (81.5%) | 5 (18.5%) |
| Enterprise Management | 0 (0.0%) | 0 (0.0%) |
| Administrative & Support | 14 (58.3%) | 10 (41.7%) |
| Educational Services | 54 (29.5%) | 129 (70.5%) |
| Health Care & Social Assistance | 17 (6.9%) | 231 (93.1%) |
| Arts, Entertainment & Recreation | 13 (68.4%) | 6 (31.6%) |
| Accommodation & Food Services | 12 (33.3%) | 24 (66.7%) |
| Public Administration | 12 (26.1%) | 34 (73.9%) |
| Total | 665 (49.0%) | 693 (51.0%) |
Education in Marquette Heights
School Enrollment in Marquette Heights
The most common levels of schooling among the 529 students in Marquette Heights are high school (152 | 28.7%), elementary school (114 | 21.5%), and college / undergraduate (101 | 19.1%).
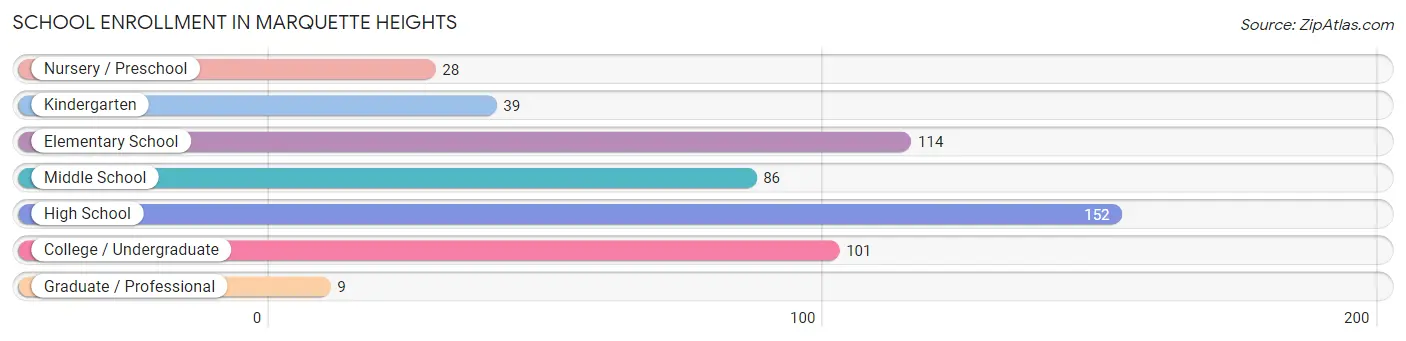
| School Level | # Students | % Students |
| Nursery / Preschool | 28 | 5.3% |
| Kindergarten | 39 | 7.4% |
| Elementary School | 114 | 21.5% |
| Middle School | 86 | 16.3% |
| High School | 152 | 28.7% |
| College / Undergraduate | 101 | 19.1% |
| Graduate / Professional | 9 | 1.7% |
| Total | 529 | 100.0% |
School Enrollment by Age by Funding Source in Marquette Heights
Out of a total of 529 students who are enrolled in schools in Marquette Heights, 52 (9.8%) attend a private institution, while the remaining 477 (90.2%) are enrolled in public schools. The age group of 35 years and over has the highest likelihood of being enrolled in private schools, with 12 (75.0% in the age bracket) enrolled. Conversely, the age group of 10 to 14 year olds has the lowest likelihood of being enrolled in a private school, with 107 (100.0% in the age bracket) attending a public institution.
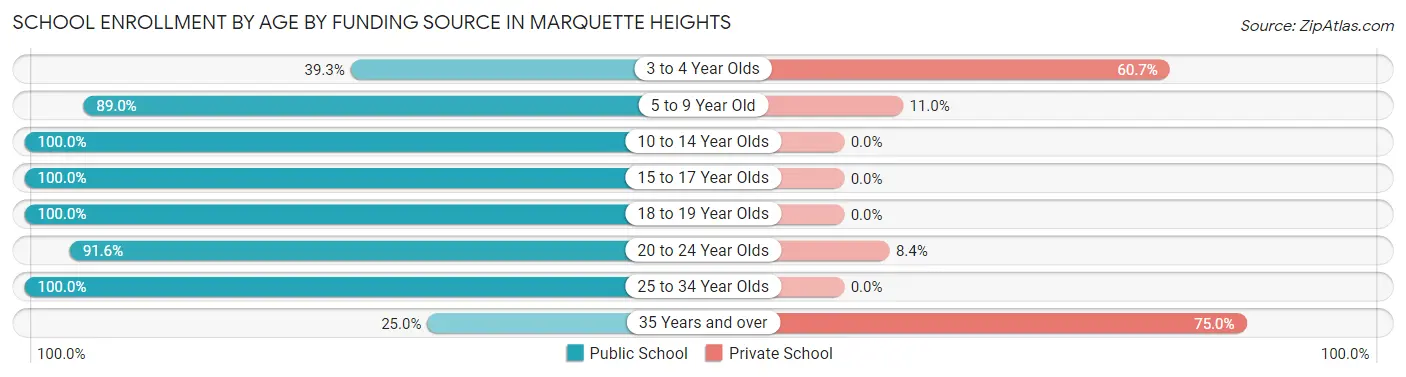
| Age Bracket | Public School | Private School |
| 3 to 4 Year Olds | 11 (39.3%) | 17 (60.7%) |
| 5 to 9 Year Old | 130 (89.0%) | 16 (11.0%) |
| 10 to 14 Year Olds | 107 (100.0%) | 0 (0.0%) |
| 15 to 17 Year Olds | 132 (100.0%) | 0 (0.0%) |
| 18 to 19 Year Olds | 6 (100.0%) | 0 (0.0%) |
| 20 to 24 Year Olds | 76 (91.6%) | 7 (8.4%) |
| 25 to 34 Year Olds | 11 (100.0%) | 0 (0.0%) |
| 35 Years and over | 4 (25.0%) | 12 (75.0%) |
| Total | 477 (90.2%) | 52 (9.8%) |
Educational Attainment by Field of Study in Marquette Heights
Education (111 | 24.7%), bio, nature & agricultural (85 | 18.9%), business (80 | 17.8%), visual & performing arts (50 | 11.1%), and science & technology (45 | 10.0%) are the most common fields of study among 449 individuals in Marquette Heights who have obtained a bachelor's degree or higher.
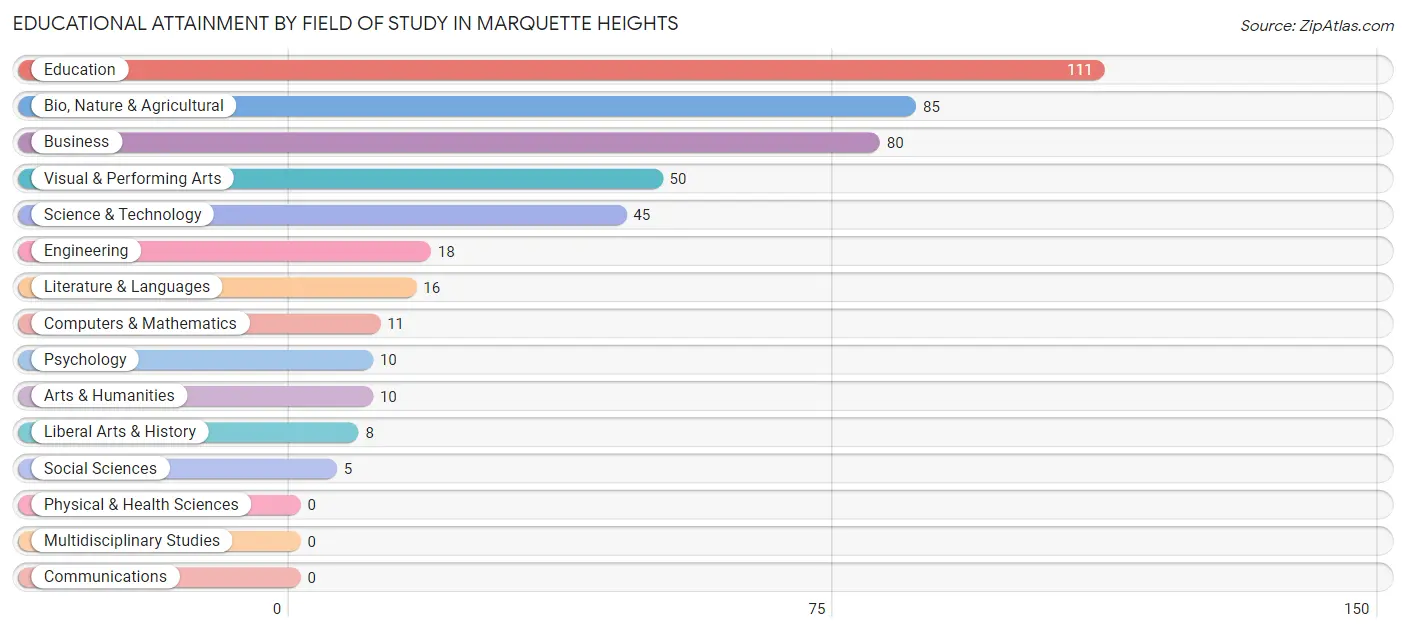
| Field of Study | # Graduates | % Graduates |
| Computers & Mathematics | 11 | 2.5% |
| Bio, Nature & Agricultural | 85 | 18.9% |
| Physical & Health Sciences | 0 | 0.0% |
| Psychology | 10 | 2.2% |
| Social Sciences | 5 | 1.1% |
| Engineering | 18 | 4.0% |
| Multidisciplinary Studies | 0 | 0.0% |
| Science & Technology | 45 | 10.0% |
| Business | 80 | 17.8% |
| Education | 111 | 24.7% |
| Literature & Languages | 16 | 3.6% |
| Liberal Arts & History | 8 | 1.8% |
| Visual & Performing Arts | 50 | 11.1% |
| Communications | 0 | 0.0% |
| Arts & Humanities | 10 | 2.2% |
| Total | 449 | 100.0% |
Transportation & Commute in Marquette Heights
Vehicle Availability by Sex in Marquette Heights
The most prevalent vehicle ownership categories in Marquette Heights are males with 2 vehicles (306, accounting for 46.3%) and females with 2 vehicles (314, making up 45.3%).
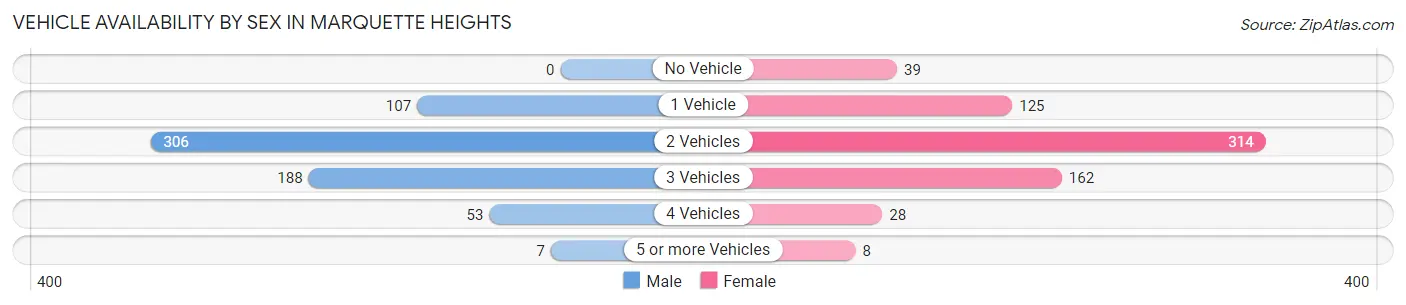
| Vehicles Available | Male | Female |
| No Vehicle | 0 (0.0%) | 39 (5.8%) |
| 1 Vehicle | 107 (16.2%) | 125 (18.5%) |
| 2 Vehicles | 306 (46.3%) | 314 (46.5%) |
| 3 Vehicles | 188 (28.4%) | 162 (24.0%) |
| 4 Vehicles | 53 (8.0%) | 28 (4.1%) |
| 5 or more Vehicles | 7 (1.1%) | 8 (1.2%) |
| Total | 661 (100.0%) | 676 (100.0%) |
Commute Time in Marquette Heights
The most frequently occuring commute durations in Marquette Heights are 20 to 24 minutes (444 commuters, 35.6%), 10 to 14 minutes (275 commuters, 22.1%), and 15 to 19 minutes (270 commuters, 21.6%).
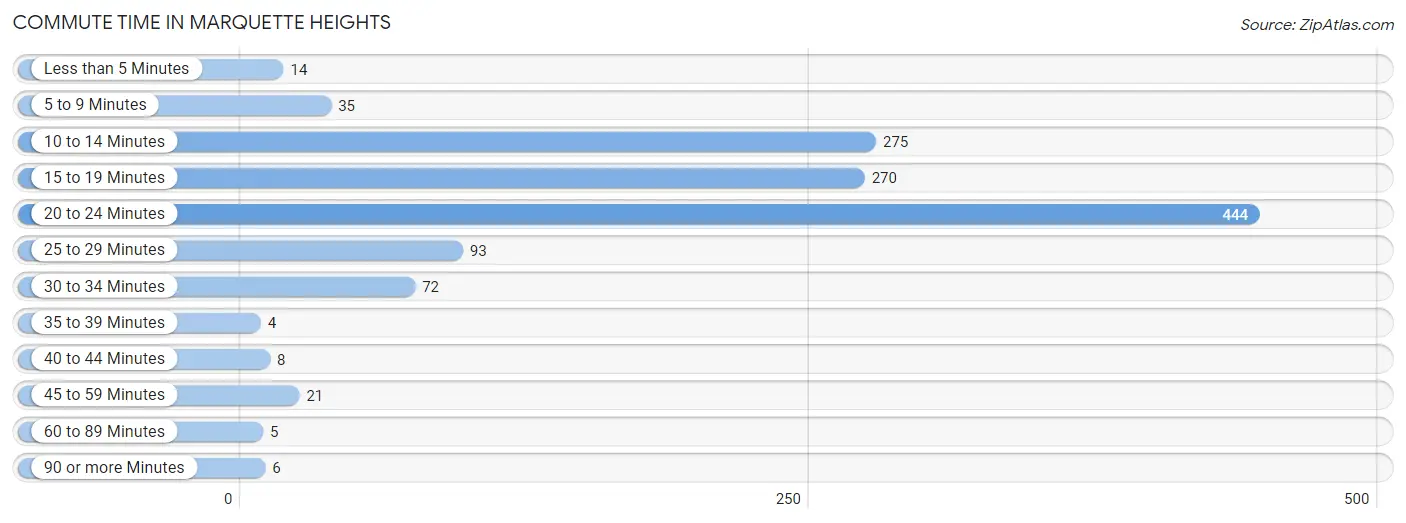
| Commute Time | # Commuters | % Commuters |
| Less than 5 Minutes | 14 | 1.1% |
| 5 to 9 Minutes | 35 | 2.8% |
| 10 to 14 Minutes | 275 | 22.1% |
| 15 to 19 Minutes | 270 | 21.6% |
| 20 to 24 Minutes | 444 | 35.6% |
| 25 to 29 Minutes | 93 | 7.5% |
| 30 to 34 Minutes | 72 | 5.8% |
| 35 to 39 Minutes | 4 | 0.3% |
| 40 to 44 Minutes | 8 | 0.6% |
| 45 to 59 Minutes | 21 | 1.7% |
| 60 to 89 Minutes | 5 | 0.4% |
| 90 or more Minutes | 6 | 0.5% |
Commute Time by Sex in Marquette Heights
The most common commute times in Marquette Heights are 15 to 19 minutes (190 commuters, 29.7%) for males and 20 to 24 minutes (297 commuters, 48.8%) for females.
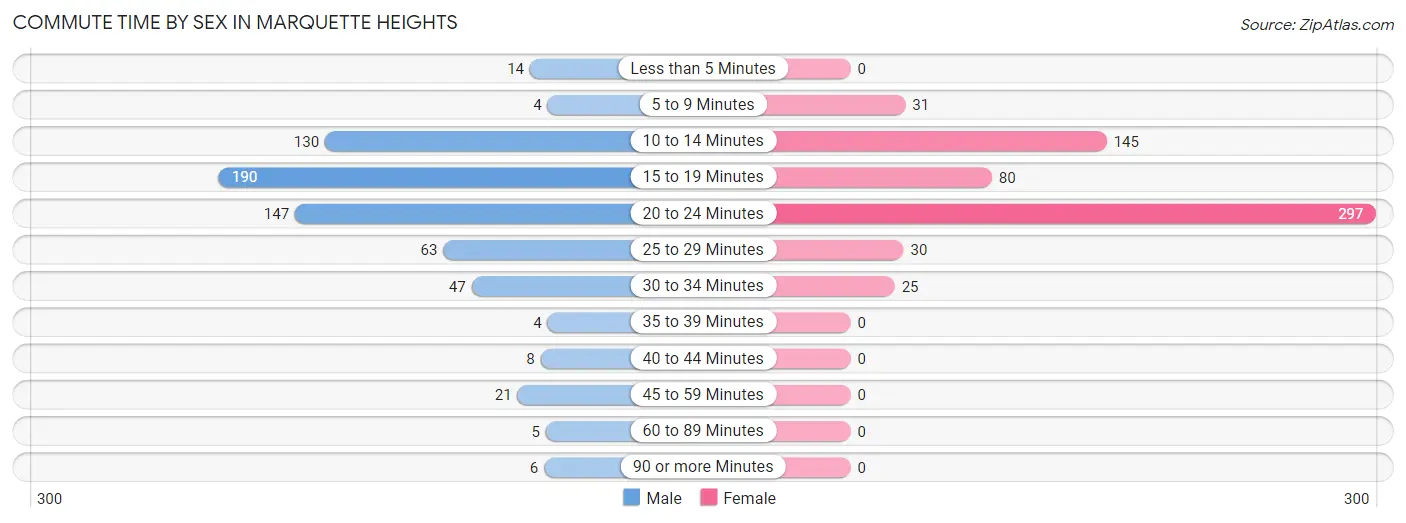
| Commute Time | Male | Female |
| Less than 5 Minutes | 14 (2.2%) | 0 (0.0%) |
| 5 to 9 Minutes | 4 (0.6%) | 31 (5.1%) |
| 10 to 14 Minutes | 130 (20.3%) | 145 (23.8%) |
| 15 to 19 Minutes | 190 (29.7%) | 80 (13.2%) |
| 20 to 24 Minutes | 147 (23.0%) | 297 (48.8%) |
| 25 to 29 Minutes | 63 (9.9%) | 30 (4.9%) |
| 30 to 34 Minutes | 47 (7.4%) | 25 (4.1%) |
| 35 to 39 Minutes | 4 (0.6%) | 0 (0.0%) |
| 40 to 44 Minutes | 8 (1.3%) | 0 (0.0%) |
| 45 to 59 Minutes | 21 (3.3%) | 0 (0.0%) |
| 60 to 89 Minutes | 5 (0.8%) | 0 (0.0%) |
| 90 or more Minutes | 6 (0.9%) | 0 (0.0%) |
Time of Departure to Work by Sex in Marquette Heights
The most frequent times of departure to work in Marquette Heights are 6:30 AM to 6:59 AM (144, 22.5%) for males and 7:30 AM to 7:59 AM (178, 29.3%) for females.
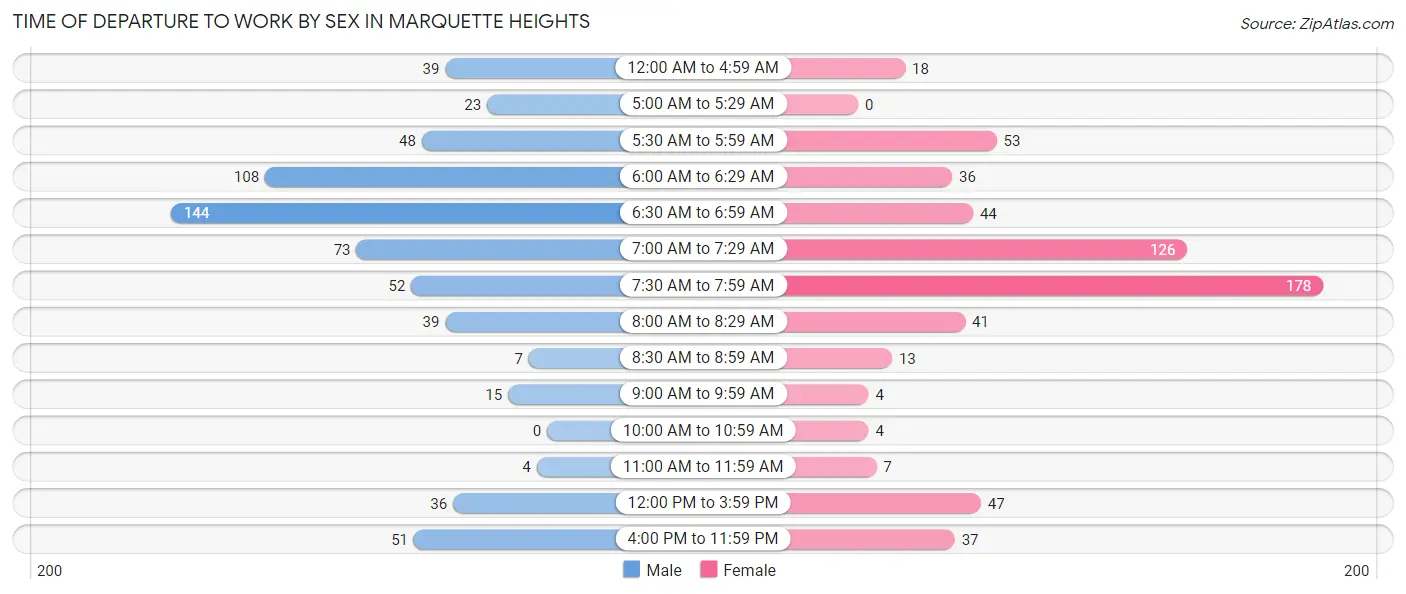
| Time of Departure | Male | Female |
| 12:00 AM to 4:59 AM | 39 (6.1%) | 18 (3.0%) |
| 5:00 AM to 5:29 AM | 23 (3.6%) | 0 (0.0%) |
| 5:30 AM to 5:59 AM | 48 (7.5%) | 53 (8.7%) |
| 6:00 AM to 6:29 AM | 108 (16.9%) | 36 (5.9%) |
| 6:30 AM to 6:59 AM | 144 (22.5%) | 44 (7.2%) |
| 7:00 AM to 7:29 AM | 73 (11.4%) | 126 (20.7%) |
| 7:30 AM to 7:59 AM | 52 (8.1%) | 178 (29.3%) |
| 8:00 AM to 8:29 AM | 39 (6.1%) | 41 (6.7%) |
| 8:30 AM to 8:59 AM | 7 (1.1%) | 13 (2.1%) |
| 9:00 AM to 9:59 AM | 15 (2.4%) | 4 (0.7%) |
| 10:00 AM to 10:59 AM | 0 (0.0%) | 4 (0.7%) |
| 11:00 AM to 11:59 AM | 4 (0.6%) | 7 (1.1%) |
| 12:00 PM to 3:59 PM | 36 (5.6%) | 47 (7.7%) |
| 4:00 PM to 11:59 PM | 51 (8.0%) | 37 (6.1%) |
| Total | 639 (100.0%) | 608 (100.0%) |
Housing Occupancy in Marquette Heights
Occupancy by Ownership in Marquette Heights
Of the total 1,159 dwellings in Marquette Heights, owner-occupied units account for 1,048 (90.4%), while renter-occupied units make up 111 (9.6%).
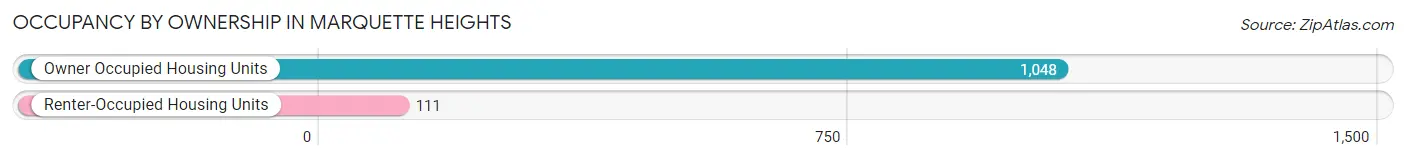
| Occupancy | # Housing Units | % Housing Units |
| Owner Occupied Housing Units | 1,048 | 90.4% |
| Renter-Occupied Housing Units | 111 | 9.6% |
| Total Occupied Housing Units | 1,159 | 100.0% |
Occupancy by Household Size in Marquette Heights
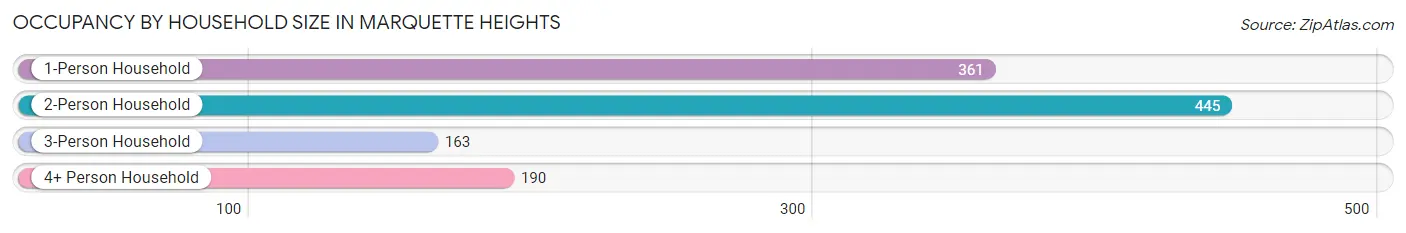
| Household Size | # Housing Units | % Housing Units |
| 1-Person Household | 361 | 31.1% |
| 2-Person Household | 445 | 38.4% |
| 3-Person Household | 163 | 14.1% |
| 4+ Person Household | 190 | 16.4% |
| Total Housing Units | 1,159 | 100.0% |
Occupancy by Ownership by Household Size in Marquette Heights
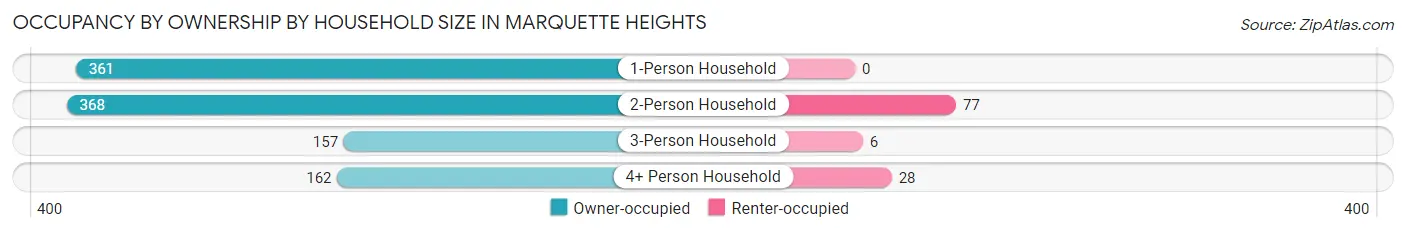
| Household Size | Owner-occupied | Renter-occupied |
| 1-Person Household | 361 (100.0%) | 0 (0.0%) |
| 2-Person Household | 368 (82.7%) | 77 (17.3%) |
| 3-Person Household | 157 (96.3%) | 6 (3.7%) |
| 4+ Person Household | 162 (85.3%) | 28 (14.7%) |
| Total Housing Units | 1,048 (90.4%) | 111 (9.6%) |
Occupancy by Educational Attainment in Marquette Heights
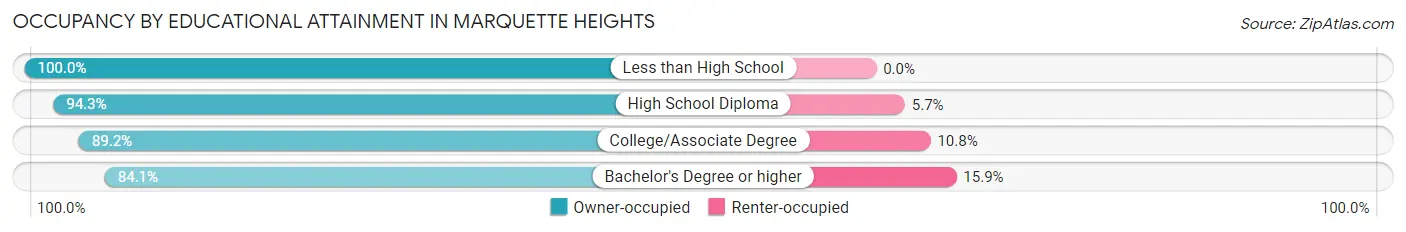
| Household Size | Owner-occupied | Renter-occupied |
| Less than High School | 64 (100.0%) | 0 (0.0%) |
| High School Diploma | 381 (94.3%) | 23 (5.7%) |
| College/Associate Degree | 381 (89.2%) | 46 (10.8%) |
| Bachelor's Degree or higher | 222 (84.1%) | 42 (15.9%) |
Occupancy by Age of Householder in Marquette Heights
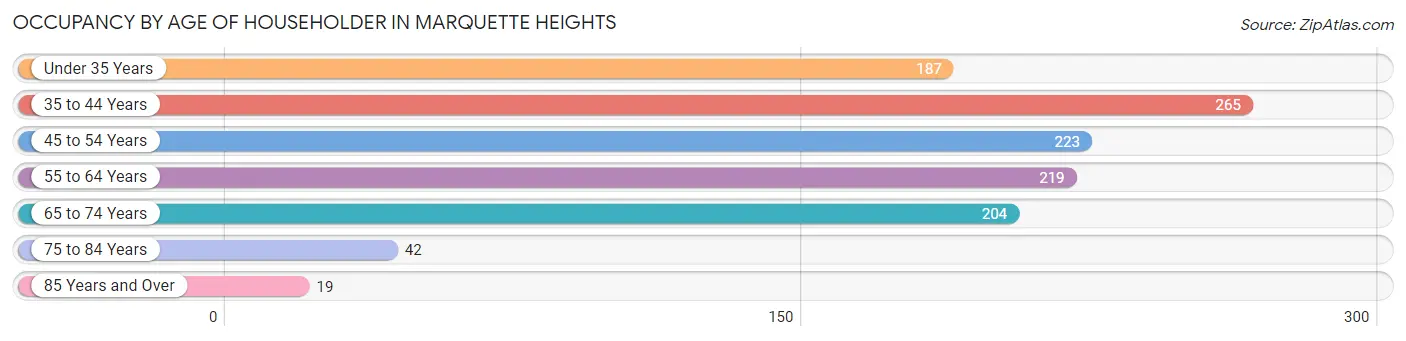
| Age Bracket | # Households | % Households |
| Under 35 Years | 187 | 16.1% |
| 35 to 44 Years | 265 | 22.9% |
| 45 to 54 Years | 223 | 19.2% |
| 55 to 64 Years | 219 | 18.9% |
| 65 to 74 Years | 204 | 17.6% |
| 75 to 84 Years | 42 | 3.6% |
| 85 Years and Over | 19 | 1.6% |
| Total | 1,159 | 100.0% |
Housing Finances in Marquette Heights
Median Income by Occupancy in Marquette Heights
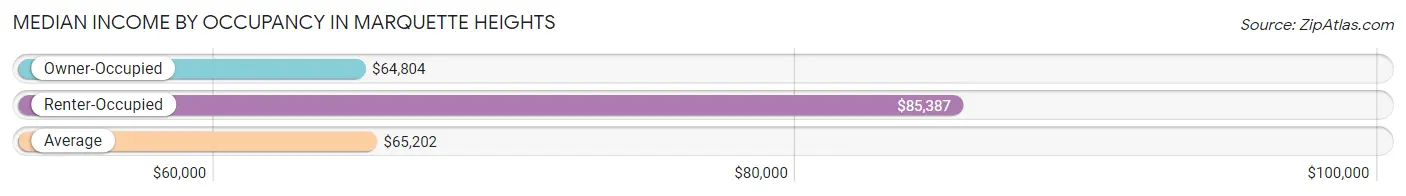
| Occupancy Type | # Households | Median Income |
| Owner-Occupied | 1,048 (90.4%) | $64,804 |
| Renter-Occupied | 111 (9.6%) | $85,387 |
| Average | 1,159 (100.0%) | $65,202 |
Occupancy by Householder Income Bracket in Marquette Heights
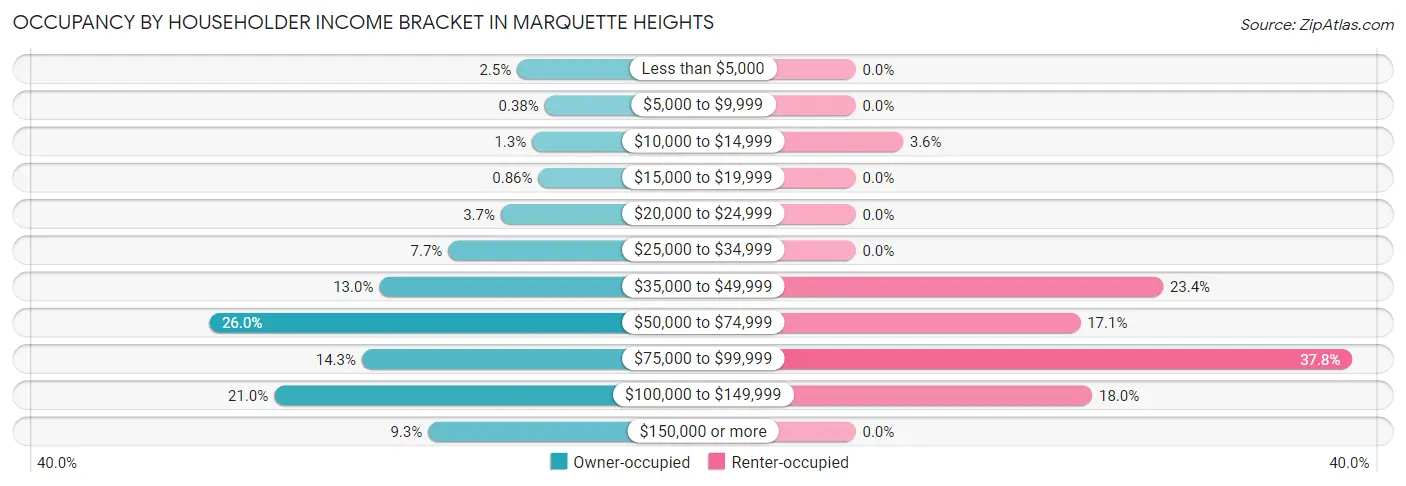
| Income Bracket | Owner-occupied | Renter-occupied |
| Less than $5,000 | 26 (2.5%) | 0 (0.0%) |
| $5,000 to $9,999 | 4 (0.4%) | 0 (0.0%) |
| $10,000 to $14,999 | 14 (1.3%) | 4 (3.6%) |
| $15,000 to $19,999 | 9 (0.9%) | 0 (0.0%) |
| $20,000 to $24,999 | 39 (3.7%) | 0 (0.0%) |
| $25,000 to $34,999 | 81 (7.7%) | 0 (0.0%) |
| $35,000 to $49,999 | 136 (13.0%) | 26 (23.4%) |
| $50,000 to $74,999 | 272 (26.0%) | 19 (17.1%) |
| $75,000 to $99,999 | 150 (14.3%) | 42 (37.8%) |
| $100,000 to $149,999 | 220 (21.0%) | 20 (18.0%) |
| $150,000 or more | 97 (9.3%) | 0 (0.0%) |
| Total | 1,048 (100.0%) | 111 (100.0%) |
Monthly Housing Cost Tiers in Marquette Heights
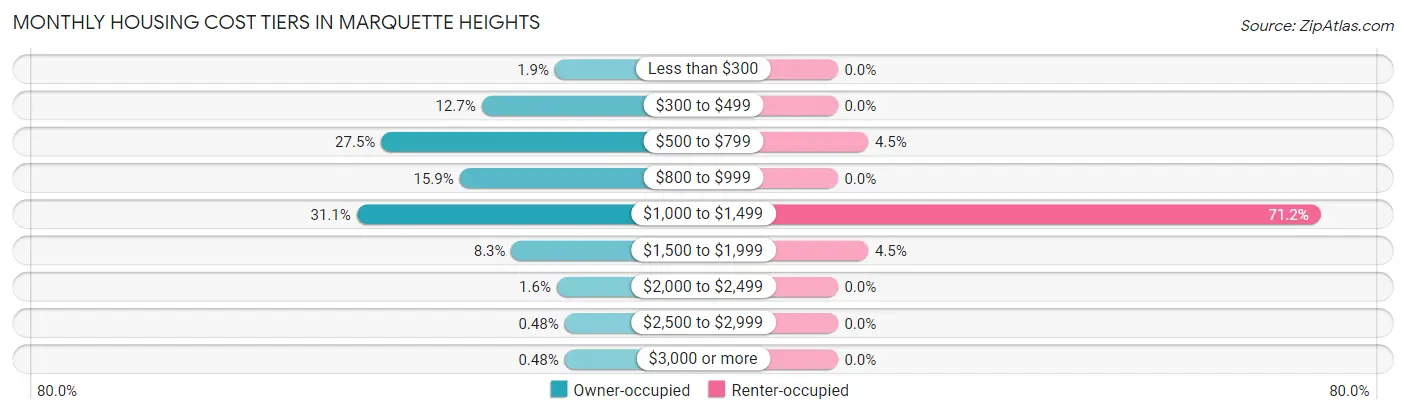
| Monthly Cost | Owner-occupied | Renter-occupied |
| Less than $300 | 20 (1.9%) | 0 (0.0%) |
| $300 to $499 | 133 (12.7%) | 0 (0.0%) |
| $500 to $799 | 288 (27.5%) | 5 (4.5%) |
| $800 to $999 | 167 (15.9%) | 0 (0.0%) |
| $1,000 to $1,499 | 326 (31.1%) | 79 (71.2%) |
| $1,500 to $1,999 | 87 (8.3%) | 5 (4.5%) |
| $2,000 to $2,499 | 17 (1.6%) | 0 (0.0%) |
| $2,500 to $2,999 | 5 (0.5%) | 0 (0.0%) |
| $3,000 or more | 5 (0.5%) | 0 (0.0%) |
| Total | 1,048 (100.0%) | 111 (100.0%) |
Physical Housing Characteristics in Marquette Heights
Housing Structures in Marquette Heights
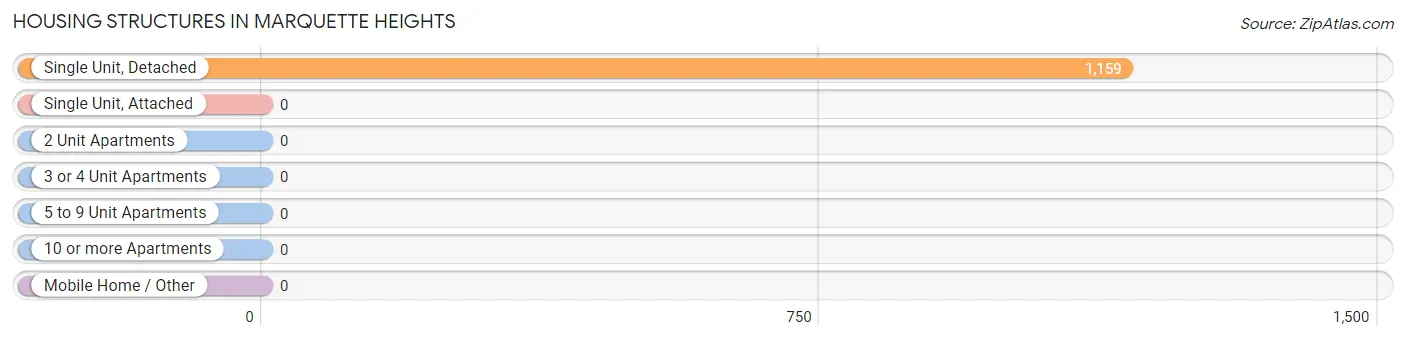
| Structure Type | # Housing Units | % Housing Units |
| Single Unit, Detached | 1,159 | 100.0% |
| Single Unit, Attached | 0 | 0.0% |
| 2 Unit Apartments | 0 | 0.0% |
| 3 or 4 Unit Apartments | 0 | 0.0% |
| 5 to 9 Unit Apartments | 0 | 0.0% |
| 10 or more Apartments | 0 | 0.0% |
| Mobile Home / Other | 0 | 0.0% |
| Total | 1,159 | 100.0% |
Housing Structures by Occupancy in Marquette Heights
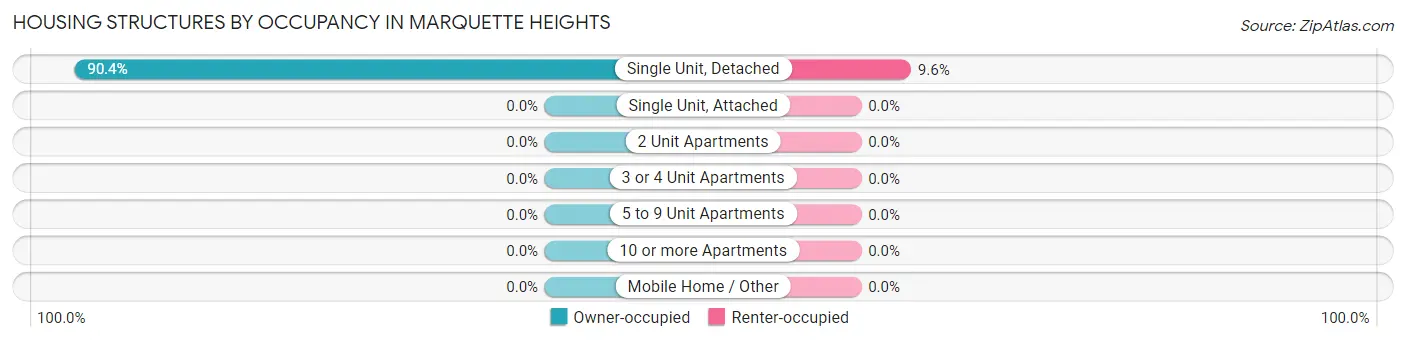
| Structure Type | Owner-occupied | Renter-occupied |
| Single Unit, Detached | 1,048 (90.4%) | 111 (9.6%) |
| Single Unit, Attached | 0 (0.0%) | 0 (0.0%) |
| 2 Unit Apartments | 0 (0.0%) | 0 (0.0%) |
| 3 or 4 Unit Apartments | 0 (0.0%) | 0 (0.0%) |
| 5 to 9 Unit Apartments | 0 (0.0%) | 0 (0.0%) |
| 10 or more Apartments | 0 (0.0%) | 0 (0.0%) |
| Mobile Home / Other | 0 (0.0%) | 0 (0.0%) |
| Total | 1,048 (90.4%) | 111 (9.6%) |
Housing Structures by Number of Rooms in Marquette Heights
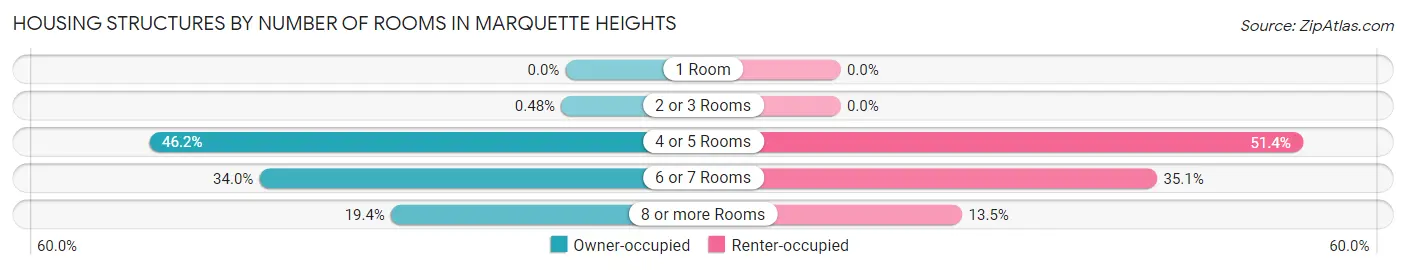
| Number of Rooms | Owner-occupied | Renter-occupied |
| 1 Room | 0 (0.0%) | 0 (0.0%) |
| 2 or 3 Rooms | 5 (0.5%) | 0 (0.0%) |
| 4 or 5 Rooms | 484 (46.2%) | 57 (51.3%) |
| 6 or 7 Rooms | 356 (34.0%) | 39 (35.1%) |
| 8 or more Rooms | 203 (19.4%) | 15 (13.5%) |
| Total | 1,048 (100.0%) | 111 (100.0%) |
Housing Structure by Heating Type in Marquette Heights
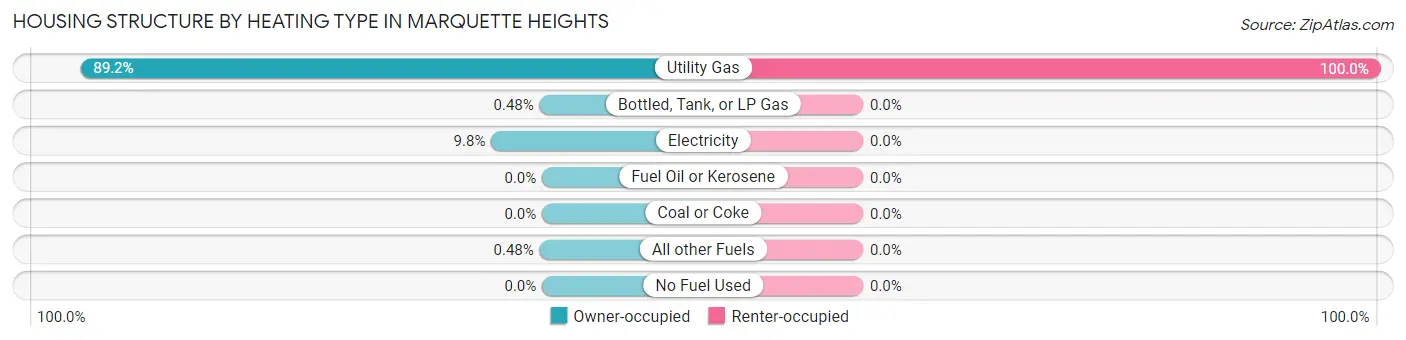
| Heating Type | Owner-occupied | Renter-occupied |
| Utility Gas | 935 (89.2%) | 111 (100.0%) |
| Bottled, Tank, or LP Gas | 5 (0.5%) | 0 (0.0%) |
| Electricity | 103 (9.8%) | 0 (0.0%) |
| Fuel Oil or Kerosene | 0 (0.0%) | 0 (0.0%) |
| Coal or Coke | 0 (0.0%) | 0 (0.0%) |
| All other Fuels | 5 (0.5%) | 0 (0.0%) |
| No Fuel Used | 0 (0.0%) | 0 (0.0%) |
| Total | 1,048 (100.0%) | 111 (100.0%) |
Household Vehicle Usage in Marquette Heights
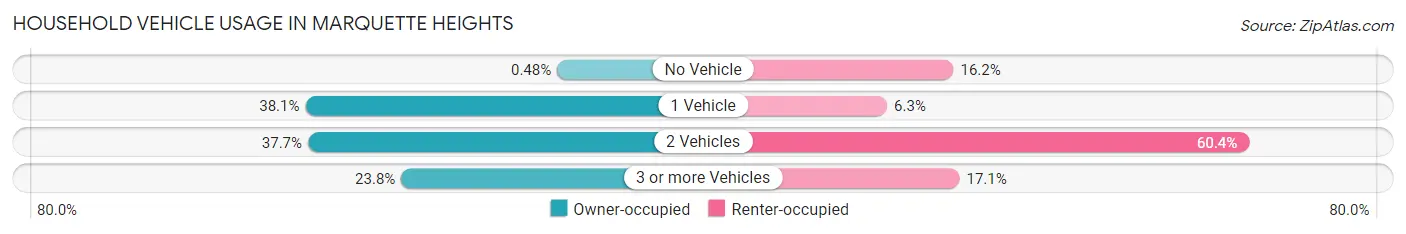
| Vehicles per Household | Owner-occupied | Renter-occupied |
| No Vehicle | 5 (0.5%) | 18 (16.2%) |
| 1 Vehicle | 399 (38.1%) | 7 (6.3%) |
| 2 Vehicles | 395 (37.7%) | 67 (60.4%) |
| 3 or more Vehicles | 249 (23.8%) | 19 (17.1%) |
| Total | 1,048 (100.0%) | 111 (100.0%) |
Real Estate & Mortgages in Marquette Heights
Real Estate and Mortgage Overview in Marquette Heights
| Characteristic | Without Mortgage | With Mortgage |
| Housing Units | 285 | 763 |
| Median Property Value | $123,400 | $116,100 |
| Median Household Income | $58,674 | $70 |
| Monthly Housing Costs | $526 | $5 |
| Real Estate Taxes | $2,258 | $5 |
Property Value by Mortgage Status in Marquette Heights
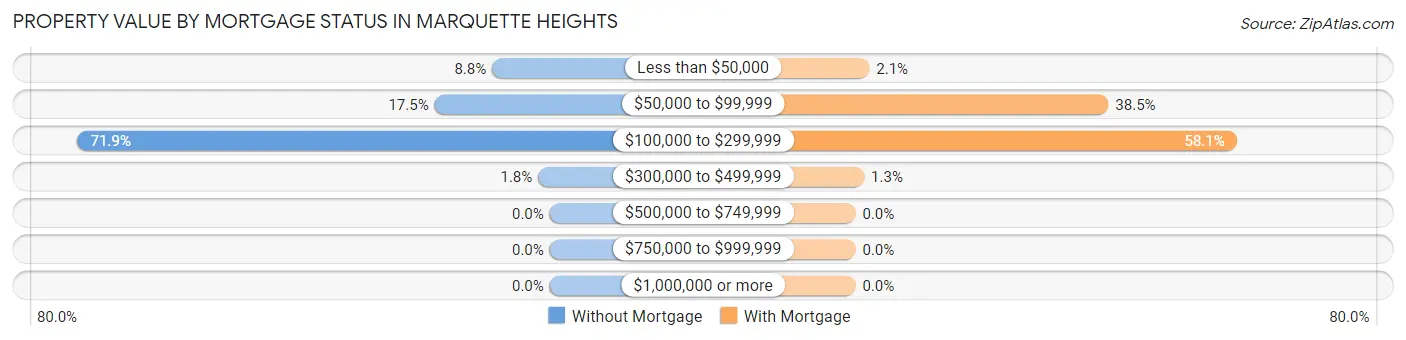
| Property Value | Without Mortgage | With Mortgage |
| Less than $50,000 | 25 (8.8%) | 16 (2.1%) |
| $50,000 to $99,999 | 50 (17.5%) | 294 (38.5%) |
| $100,000 to $299,999 | 205 (71.9%) | 443 (58.1%) |
| $300,000 to $499,999 | 5 (1.8%) | 10 (1.3%) |
| $500,000 to $749,999 | 0 (0.0%) | 0 (0.0%) |
| $750,000 to $999,999 | 0 (0.0%) | 0 (0.0%) |
| $1,000,000 or more | 0 (0.0%) | 0 (0.0%) |
| Total | 285 (100.0%) | 763 (100.0%) |
Household Income by Mortgage Status in Marquette Heights
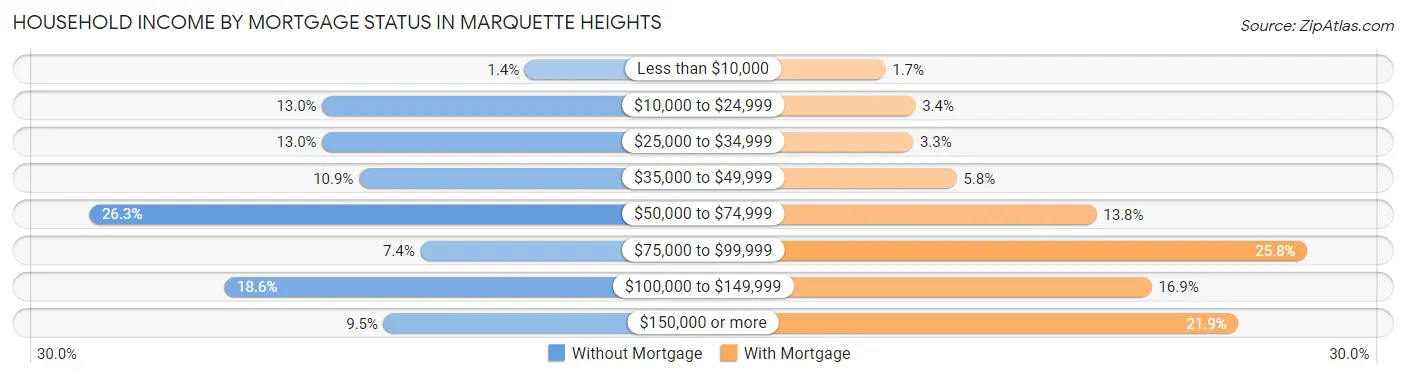
| Household Income | Without Mortgage | With Mortgage |
| Less than $10,000 | 4 (1.4%) | 13 (1.7%) |
| $10,000 to $24,999 | 37 (13.0%) | 26 (3.4%) |
| $25,000 to $34,999 | 37 (13.0%) | 25 (3.3%) |
| $35,000 to $49,999 | 31 (10.9%) | 44 (5.8%) |
| $50,000 to $74,999 | 75 (26.3%) | 105 (13.8%) |
| $75,000 to $99,999 | 21 (7.4%) | 197 (25.8%) |
| $100,000 to $149,999 | 53 (18.6%) | 129 (16.9%) |
| $150,000 or more | 27 (9.5%) | 167 (21.9%) |
| Total | 285 (100.0%) | 763 (100.0%) |
Property Value to Household Income Ratio in Marquette Heights
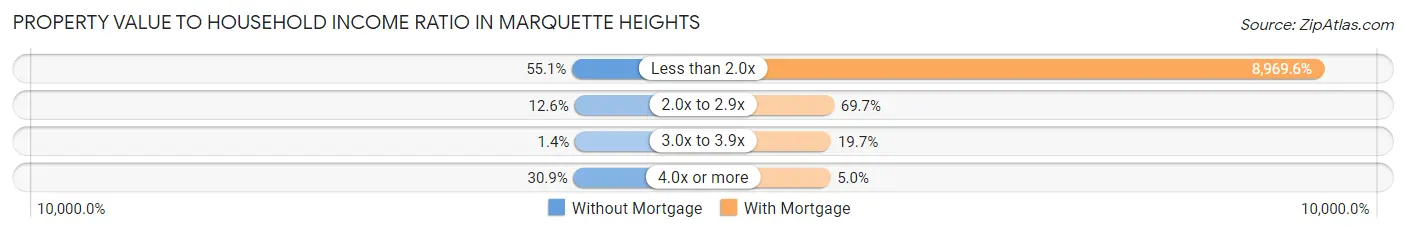
| Value-to-Income Ratio | Without Mortgage | With Mortgage |
| Less than 2.0x | 157 (55.1%) | 68,438 (8,969.6%) |
| 2.0x to 2.9x | 36 (12.6%) | 532 (69.7%) |
| 3.0x to 3.9x | 4 (1.4%) | 150 (19.7%) |
| 4.0x or more | 88 (30.9%) | 38 (5.0%) |
| Total | 285 (100.0%) | 763 (100.0%) |
Real Estate Taxes by Mortgage Status in Marquette Heights
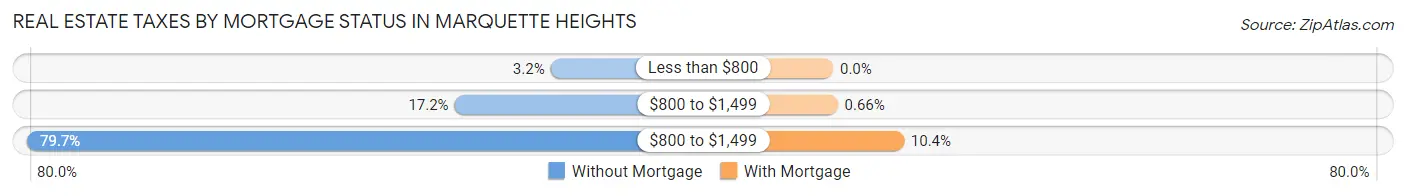
| Property Taxes | Without Mortgage | With Mortgage |
| Less than $800 | 9 (3.2%) | 0 (0.0%) |
| $800 to $1,499 | 49 (17.2%) | 5 (0.7%) |
| $800 to $1,499 | 227 (79.6%) | 79 (10.3%) |
| Total | 285 (100.0%) | 763 (100.0%) |
Health & Disability in Marquette Heights
Health Insurance Coverage by Age in Marquette Heights
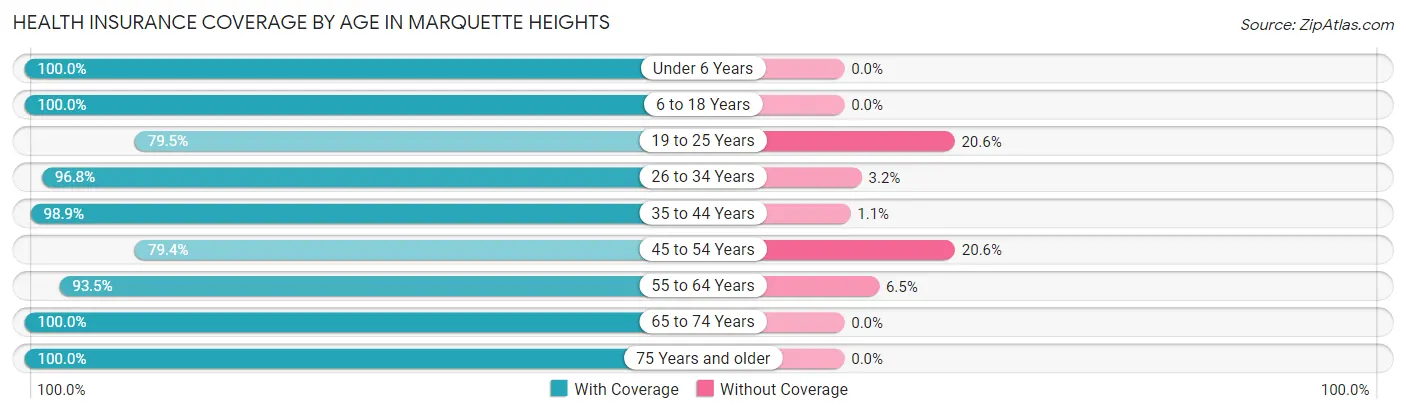
| Age Bracket | With Coverage | Without Coverage |
| Under 6 Years | 163 (100.0%) | 0 (0.0%) |
| 6 to 18 Years | 376 (100.0%) | 0 (0.0%) |
| 19 to 25 Years | 174 (79.4%) | 45 (20.5%) |
| 26 to 34 Years | 270 (96.8%) | 9 (3.2%) |
| 35 to 44 Years | 436 (98.9%) | 5 (1.1%) |
| 45 to 54 Years | 281 (79.4%) | 73 (20.6%) |
| 55 to 64 Years | 390 (93.5%) | 27 (6.5%) |
| 65 to 74 Years | 314 (100.0%) | 0 (0.0%) |
| 75 Years and older | 91 (100.0%) | 0 (0.0%) |
| Total | 2,495 (94.0%) | 159 (6.0%) |
Health Insurance Coverage by Citizenship Status in Marquette Heights
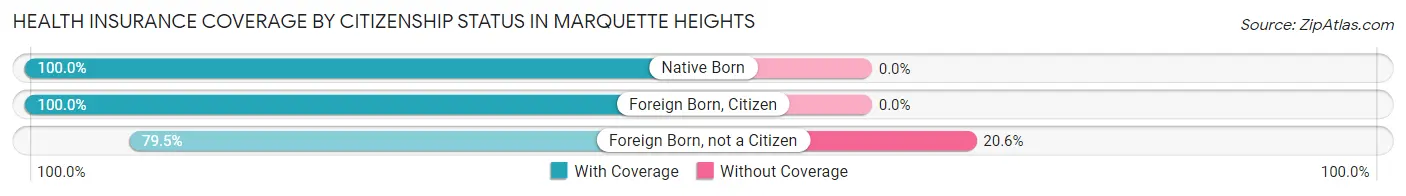
| Citizenship Status | With Coverage | Without Coverage |
| Native Born | 163 (100.0%) | 0 (0.0%) |
| Foreign Born, Citizen | 376 (100.0%) | 0 (0.0%) |
| Foreign Born, not a Citizen | 174 (79.4%) | 45 (20.5%) |
Health Insurance Coverage by Household Income in Marquette Heights
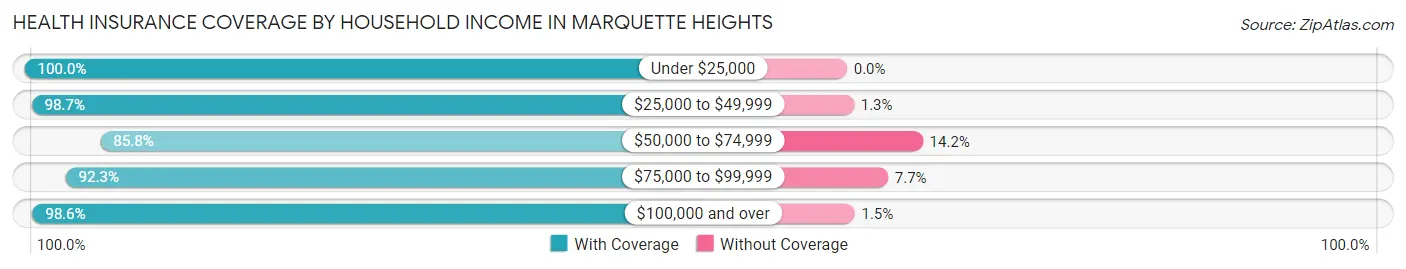
| Household Income | With Coverage | Without Coverage |
| Under $25,000 | 100 (100.0%) | 0 (0.0%) |
| $25,000 to $49,999 | 376 (98.7%) | 5 (1.3%) |
| $50,000 to $74,999 | 622 (85.8%) | 103 (14.2%) |
| $75,000 to $99,999 | 444 (92.3%) | 37 (7.7%) |
| $100,000 and over | 953 (98.6%) | 14 (1.5%) |
Public vs Private Health Insurance Coverage by Age in Marquette Heights
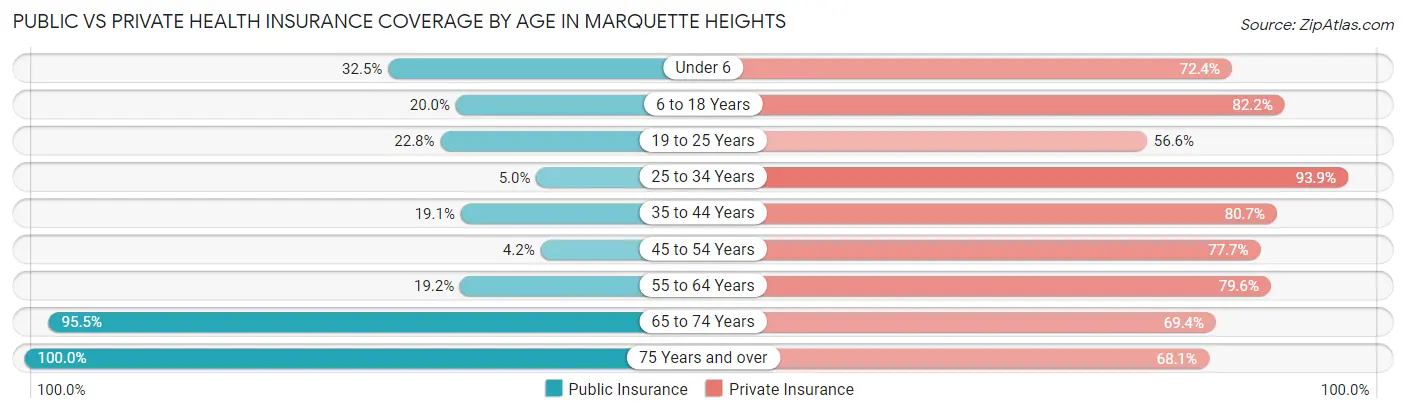
| Age Bracket | Public Insurance | Private Insurance |
| Under 6 | 53 (32.5%) | 118 (72.4%) |
| 6 to 18 Years | 75 (20.0%) | 309 (82.2%) |
| 19 to 25 Years | 50 (22.8%) | 124 (56.6%) |
| 25 to 34 Years | 14 (5.0%) | 262 (93.9%) |
| 35 to 44 Years | 84 (19.1%) | 356 (80.7%) |
| 45 to 54 Years | 15 (4.2%) | 275 (77.7%) |
| 55 to 64 Years | 80 (19.2%) | 332 (79.6%) |
| 65 to 74 Years | 300 (95.5%) | 218 (69.4%) |
| 75 Years and over | 91 (100.0%) | 62 (68.1%) |
| Total | 762 (28.7%) | 2,056 (77.5%) |
Disability Status by Sex by Age in Marquette Heights
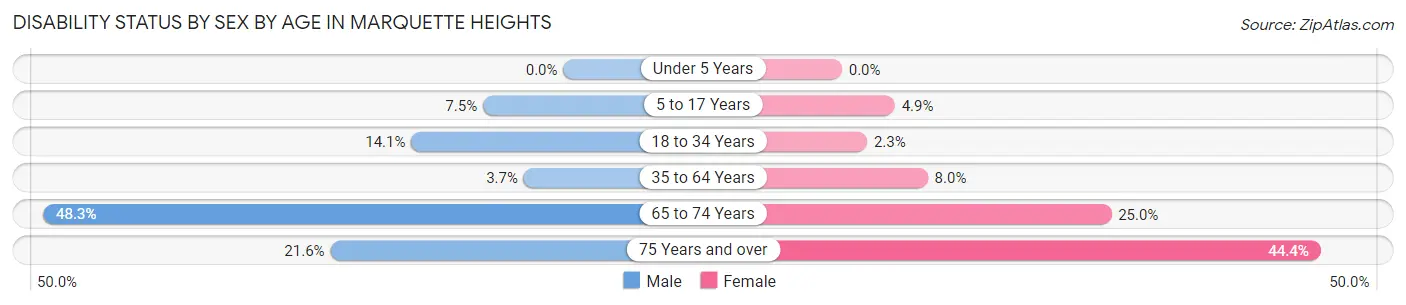
| Age Bracket | Male | Female |
| Under 5 Years | 0 (0.0%) | 0 (0.0%) |
| 5 to 17 Years | 17 (7.5%) | 8 (4.9%) |
| 18 to 34 Years | 35 (14.1%) | 6 (2.3%) |
| 35 to 64 Years | 21 (3.7%) | 51 (8.0%) |
| 65 to 74 Years | 84 (48.3%) | 35 (25.0%) |
| 75 Years and over | 8 (21.6%) | 24 (44.4%) |
Disability Class by Sex by Age in Marquette Heights
Disability Class: Hearing Difficulty
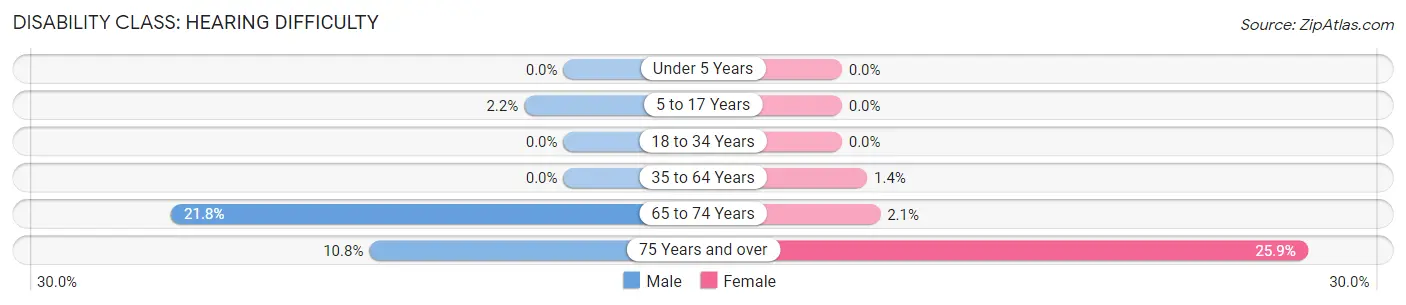
| Age Bracket | Male | Female |
| Under 5 Years | 0 (0.0%) | 0 (0.0%) |
| 5 to 17 Years | 5 (2.2%) | 0 (0.0%) |
| 18 to 34 Years | 0 (0.0%) | 0 (0.0%) |
| 35 to 64 Years | 0 (0.0%) | 9 (1.4%) |
| 65 to 74 Years | 38 (21.8%) | 3 (2.1%) |
| 75 Years and over | 4 (10.8%) | 14 (25.9%) |
Disability Class: Vision Difficulty
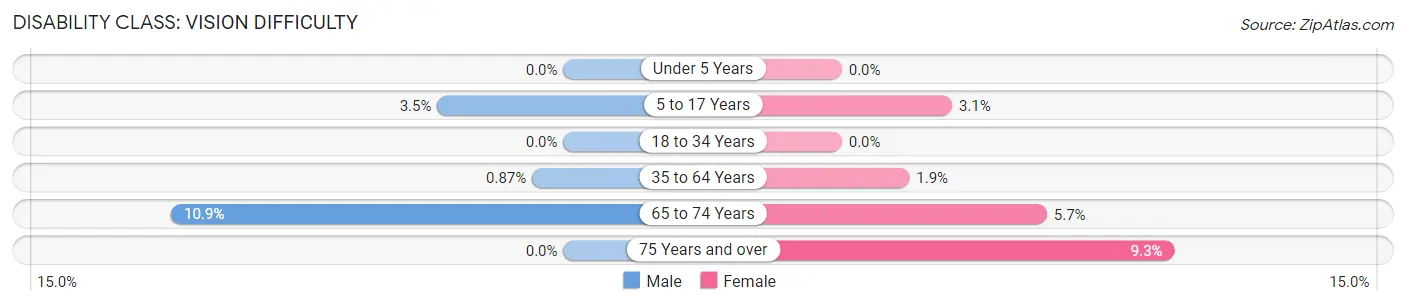
| Age Bracket | Male | Female |
| Under 5 Years | 0 (0.0%) | 0 (0.0%) |
| 5 to 17 Years | 8 (3.5%) | 5 (3.1%) |
| 18 to 34 Years | 0 (0.0%) | 0 (0.0%) |
| 35 to 64 Years | 5 (0.9%) | 12 (1.9%) |
| 65 to 74 Years | 19 (10.9%) | 8 (5.7%) |
| 75 Years and over | 0 (0.0%) | 5 (9.3%) |
Disability Class: Cognitive Difficulty
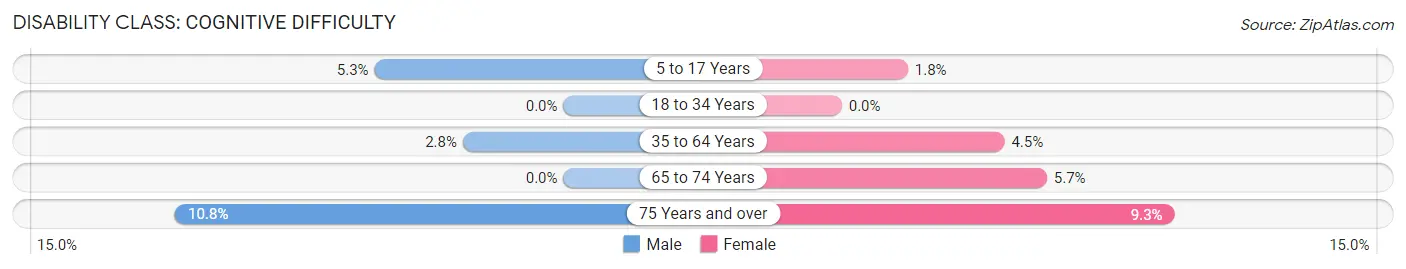
| Age Bracket | Male | Female |
| 5 to 17 Years | 12 (5.3%) | 3 (1.8%) |
| 18 to 34 Years | 0 (0.0%) | 0 (0.0%) |
| 35 to 64 Years | 16 (2.8%) | 29 (4.5%) |
| 65 to 74 Years | 0 (0.0%) | 8 (5.7%) |
| 75 Years and over | 4 (10.8%) | 5 (9.3%) |
Disability Class: Ambulatory Difficulty
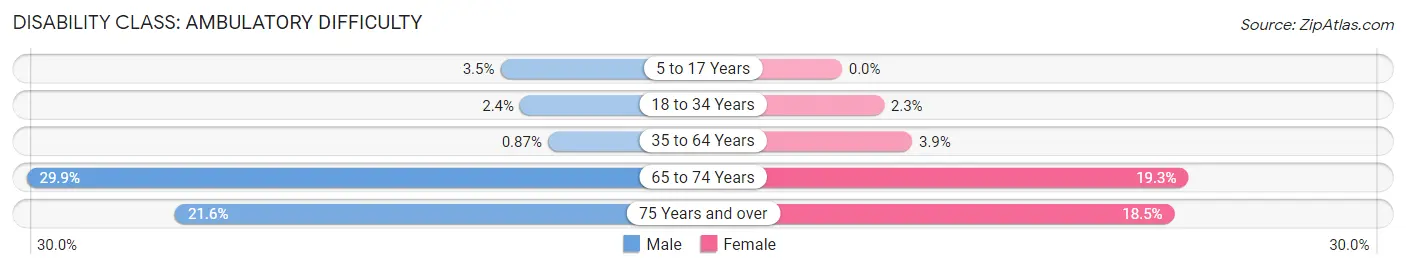
| Age Bracket | Male | Female |
| 5 to 17 Years | 8 (3.5%) | 0 (0.0%) |
| 18 to 34 Years | 6 (2.4%) | 6 (2.3%) |
| 35 to 64 Years | 5 (0.9%) | 25 (3.9%) |
| 65 to 74 Years | 52 (29.9%) | 27 (19.3%) |
| 75 Years and over | 8 (21.6%) | 10 (18.5%) |
Disability Class: Self-Care Difficulty
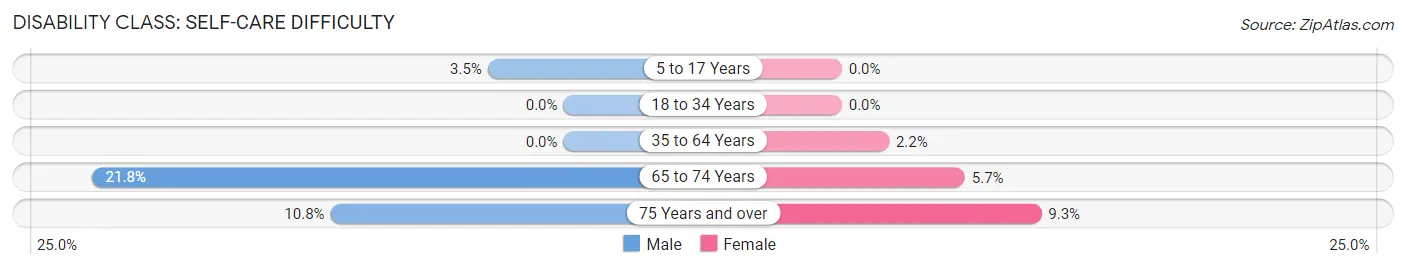
| Age Bracket | Male | Female |
| 5 to 17 Years | 8 (3.5%) | 0 (0.0%) |
| 18 to 34 Years | 0 (0.0%) | 0 (0.0%) |
| 35 to 64 Years | 0 (0.0%) | 14 (2.2%) |
| 65 to 74 Years | 38 (21.8%) | 8 (5.7%) |
| 75 Years and over | 4 (10.8%) | 5 (9.3%) |
Technology Access in Marquette Heights
Computing Device Access in Marquette Heights
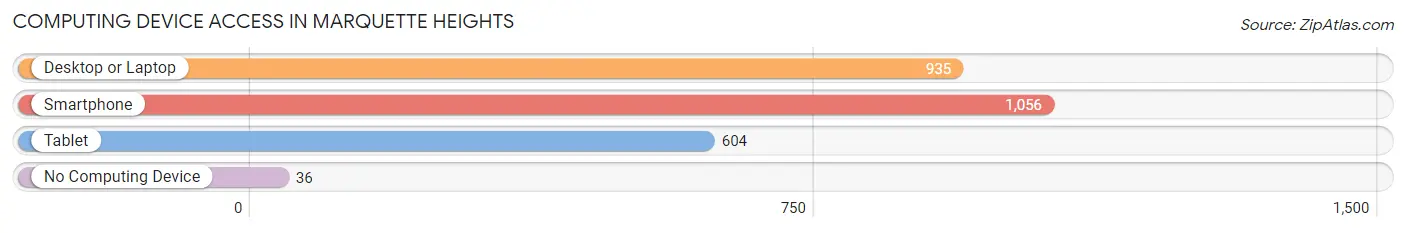
| Device Type | # Households | % Households |
| Desktop or Laptop | 935 | 80.7% |
| Smartphone | 1,056 | 91.1% |
| Tablet | 604 | 52.1% |
| No Computing Device | 36 | 3.1% |
| Total | 1,159 | 100.0% |
Internet Access in Marquette Heights
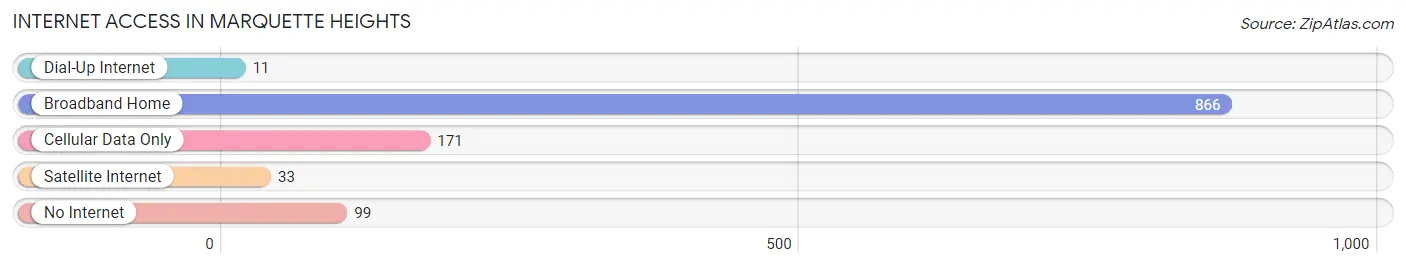
| Internet Type | # Households | % Households |
| Dial-Up Internet | 11 | 0.9% |
| Broadband Home | 866 | 74.7% |
| Cellular Data Only | 171 | 14.7% |
| Satellite Internet | 33 | 2.9% |
| No Internet | 99 | 8.5% |
| Total | 1,159 | 100.0% |
Marquette Heights Summary
Marquette Heights is a small village located in Tazewell County, Illinois. It is situated on the banks of the Illinois River, approximately 10 miles south of Peoria. The village has a population of approximately 2,000 people and covers an area of 1.2 square miles.
History
Marquette Heights was founded in 1836 by a group of French-Canadian settlers. The village was named after Father Jacques Marquette, a French explorer who explored the area in the late 1600s. The village was originally a farming community, but in the late 1800s, the area began to develop into a manufacturing center. The first industry to be established in the village was a brickyard, which was followed by a sawmill and a flour mill.
In the early 1900s, the village began to experience a period of growth and development. The population increased from just over 500 in 1910 to nearly 1,500 by 1930. During this time, the village was home to several businesses, including a furniture factory, a canning factory, and a creamery.
Geography
Marquette Heights is located in the central part of Tazewell County, Illinois. The village is situated on the banks of the Illinois River, approximately 10 miles south of Peoria. The village is surrounded by rolling hills and farmland. The climate in the area is generally mild, with temperatures ranging from the low 30s in the winter to the mid-80s in the summer.
Economy
Marquette Heights is a small village with a limited economy. The village is home to several small businesses, including a grocery store, a hardware store, and a few restaurants. The village also has a few manufacturing companies, including a furniture factory and a canning factory.
Demographics
As of the 2010 census, the population of Marquette Heights was 2,000. The racial makeup of the village was 97.2% White, 0.7% African American, 0.3% Native American, 0.2% Asian, and 1.6% from other races. The median household income in the village was $41,250, and the median family income was $50,000. The per capita income in the village was $20,000.
Conclusion
Marquette Heights is a small village located in Tazewell County, Illinois. The village was founded in 1836 by a group of French-Canadian settlers and was named after Father Jacques Marquette. The village has a population of approximately 2,000 people and covers an area of 1.2 square miles. The village is home to several small businesses, including a grocery store, a hardware store, and a few restaurants. The racial makeup of the village is 97.2% White, 0.7% African American, 0.3% Native American, 0.2% Asian, and 1.6% from other races. The median household income in the village was $41,250, and the median family income was $50,000.
Common Questions
What is Per Capita Income in Marquette Heights?
Per Capita income in Marquette Heights is $35,674.
What is the Median Family Income in Marquette Heights?
Median Family Income in Marquette Heights is $87,067.
What is the Median Household income in Marquette Heights?
Median Household Income in Marquette Heights is $65,202.
What is Income or Wage Gap in Marquette Heights?
Income or Wage Gap in Marquette Heights is 30.7%.
Women in Marquette Heights earn 69.3 cents for every dollar earned by a man.
What is Inequality or Gini Index in Marquette Heights?
Inequality or Gini Index in Marquette Heights is 0.34.
What is the Total Population of Marquette Heights?
Total Population of Marquette Heights is 2,672.
What is the Total Male Population of Marquette Heights?
Total Male Population of Marquette Heights is 1,341.
What is the Total Female Population of Marquette Heights?
Total Female Population of Marquette Heights is 1,331.
What is the Ratio of Males per 100 Females in Marquette Heights?
There are 100.75 Males per 100 Females in Marquette Heights.
What is the Ratio of Females per 100 Males in Marquette Heights?
There are 99.25 Females per 100 Males in Marquette Heights.
What is the Median Population Age in Marquette Heights?
Median Population Age in Marquette Heights is 40.8 Years.
What is the Average Family Size in Marquette Heights
Average Family Size in Marquette Heights is 2.9 People.
What is the Average Household Size in Marquette Heights
Average Household Size in Marquette Heights is 2.3 People.
How Large is the Labor Force in Marquette Heights?
There are 1,445 People in the Labor Forcein in Marquette Heights.
What is the Percentage of People in the Labor Force in Marquette Heights?
65.2% of People are in the Labor Force in Marquette Heights.
What is the Unemployment Rate in Marquette Heights?
Unemployment Rate in Marquette Heights is 4.8%.